sourcebook of criminal justice statistics in the...
TRANSCRIPT

Sourcebook of Criminal Justice Statistics in the Commonwealth
1
Sourcebook of Criminal Justice Statistics
in the Commonwealth
2010
Prepared by the Kentucky Statistical Analysis Center

Sourcebook of Criminal Justice Statistics in the Commonwealth
2
Foreword
Dear Policymaker: It is with great pride that the Kentucky Justice and Public Safety Cabinet releases the 2010 edition of the Sourcebook of Criminal Justice Statistics in the Commonwealth. As the second largest agency in state government, the Justice and Public Safety Cabinet continuously works to improve public safety and the quality of life for the citizens of Kentucky. By providing comprehensive information from all components of the criminal justice system, the Sourcebook continues to encourage data-driven decision making to aid effective criminal justice policy development in the 21st century. This report reflects a unique partnership among criminal justice agencies whose collaborative efforts permit the presentation of a broad overview of the system. As the data infrastructure in Kentucky’s criminal justice system continues to improve, we believe the Sourcebook will become an even more effective tool for meeting critical planning needs and addressing statewide criminal justice policy issues. In addition to valuable information on crime, arrest, prosecution, correction, and juvenile justice system trends, the ninth edition of the Sourcebook highlights selected crime categories that are currently of interest in the criminal justice system today. These special topics include drug related offenses with a particular focus on methamphetamine and prescription drugs, driving under the influence (DUI) offenses, sex offenses, and domestic violence. Shared information across agencies presented here allows for a greater understanding of how these crimes are affecting the state. The following report is organized in a manner that follows traditional movement across the system, from arrest to prosecution to corrections, and should thus be viewed as a systemic integration of data-sharing and analyses. I encourage you to use this report as a convenient and accessible resource for criminal justice data. Please contact the Cabinet if you have any questions or need further information. It is my goal, and that of the Cabinet, for the 2010 Sourcebook to serve as a vital resource for policymakers, state officials, and the citizens of Kentucky. On behalf of the Kentucky Justice and Public Safety Cabinet, I would like to express appreciation to the criminal justice agency personnel and faculty who contributed time and energy to enable the publication of the 2010 edition of the Sourcebook of Criminal Justice Statistics in the Commonwealth. J. Michael Brown, Secretary Kentucky Justice and Public Safety Cabinet

Sourcebook of Criminal Justice Statistics in the Commonwealth
3
Acknowledgements
Publication of the 2010 edition of the Sourcebook of Criminal Justice Statistics in the Commonwealth was made possible through the commitment and participation of criminal justice and other governmental agency representatives. The Justice and Public Safety Cabinet would like to express its sincere gratitude and appreciation to the following organizations and agency representatives who contributed to this important data collection project. Administrative Office of the Courts
• Tammy Collins, Data Analyst II Records/Research and Statistics Department of Court Services
• Erin Mosley, Statistician Records/Research and Statistics Department of Court Services
• Kelly Stephens, Records/Research and Statistics Department of Court Services
• Patrick Yewell, Executive Officer Department of Family and Juvenile Services
Attorney General’s Office
• Tonjua Casey, Internal Policy Analyst Department of Criminal Investigations
Cabinet for Health and Family Services
• David Gutierrez, Family Violence Prevention Branch Manager Division of Protection and Permanency Department of Community Based Services
• Dave Hopkins, Health Services System Manager Kentucky All Schedule Prescription Electronic Reporting
• Phyllis Millspaugh, Program
Administrator Clinical Consultation Branch Department of Community Based Services
• Bobbie Walters, Internal Policy Analyst III
Division of Protection and Permanency Department of Community Based Services
• Jennifer Withrow, Program Administrator
Family Violence Prevention Branch Department of Community Based Services
Division of Protection and Permanency
Crime Victim’s Compensation Board
• Lindsay Crawford, Policy Advisor Crime Victim’s Compensation Board

Sourcebook of Criminal Justice Statistics in the Commonwealth
4
Department of Corrections
• Melissa Chandler, Internal Policy
Analyst, IV Division of Parole and Victim Services
• Cedric Coleman, Programmer Analyst III Department of Corrections
• Ruth Edwards, Internal Policy Analyst Adult Institutions/Office of Research and Grants
• Kristin Smith, Program Administrator Office of Victim Services
Department of Juvenile Justice
• Chad Burkhead, Information Systems Supervisor Information Systems Branch
Department of Public Advocacy
• Scott Richard, CIO / Information Systems Manager Law Operations
• Michael Rodgers, Division Director Law Operations
Kentucky Domestic Violence Association
• LeTaurus Jefferson, I.T. Coordinator Kentucky Domestic Violence Association
Kentucky Justice and Public Safety Cabinet
• Tanya Dickinson, Branch Manager Grants Management Branch
Kentucky State Police
• Sgt. Bruce Button Criminal Identification and Records Branch
• Brandon Cobb, Uniform Crime Reporting Section Criminal Identification and Records Branch
Office of the State Medical Examiner
• Mandy Combest, Staff Assistant
Medical Examiner’s Office

Sourcebook of Criminal Justice Statistics in the Commonwealth
5
Table of Contents
Foreword………………………………………………………………………………………………………………………………………………….…2 Acknowledgements……………………………………………………………………………………………………………………….……………3 Table of Contents…………..…………………………………………………………………………………………………………………….……5 List of Tables and Figures…………………………………………………………………………………………………………………….…….6 Limitations of Current Data and Information Systems……………………………………………………………………………..11 I- Kentucky’s Demographic Profile………………………………………………………………………………………………………….…13 II- Victim Services………………………………………………………………………………………………………………………………………33 III- Reported Crime Trends………………………………………………………………………………………………………………………..38 IV- Arrest Trends……………………………………………………………………………………………………………………………………….43 V- Pretrial Release Trends…………………………………………………………………………………………………………………………71 VI- Court Disposition and Sentencing Trends…………………………………………………………………………………………….78 VII- Trial Court Caseload Trends……………………………………………………………………………………………………………….93 VIII- Appellate Court Caseload Trends…………………………………………………………………………………………………….158 IX- Commitment and Release Trends………………………………………………………………………………………………………160 X- Juvenile Justice System Trends………………………………………………………………………………………………………….181 XI- Selected Crime Categories and Crime Indicators………………………………………………………………………………213 XII- Key Criminal Justice Cost Information……………………………………………………………………………………………..298 Appendix A- Description of Existing Criminal Justice Information Systems……………………………………………310 Appendix B- Part I and Part II Offenses……………………………………………………………………………………………………312 Appendix C- Kentucky Administrative Office of the Courts Data Limitations……………………………………….314
The information presented in this Sourcebook is compiled and edited by Marjorie L. Stanek, Research Coordinator, Kentucky Statistical Analysis Center, Kentucky Justice and Public Safety
Cabinet.

Sourcebook of Criminal Justice Statistics in the Commonwealth
6
List of Tables and Figures
Section I: Kentucky’s Demographic Profile Table 1.1: Population of Kentucky and Surrounding States, 2007-2010………………………………………………….15 Figure 1.a: Kentucky Projected Population by Age, 2000-2050……………………………………………………………….16 Table 1.2: Poverty Rate by State, 2010…………………………………………………………………………………………………….17 Table 1.3: Percent Change in State Poverty Rates, 2007-2010……………………………………………………………….19 Figure 1.b: Poverty in Kentucky, 2000-2010…………………………………………………………………………………………….21 Table 1.4: Number and Percentage of Kentucky Children in Poverty in the Past 12 Months by Race/Ethnicity……………………………………………………………………………………………………………………………………………22 Table 1.5: Poverty and Median Income Estimates by County, 2010…………………………………………………………23 Section II: Victim Services Table 2.1: Number of Searches for Offenders through V.I.N.E., 2010…………………………………………………….29 Table 2.2: Number of Calls Processed through V.I.N.E., 2010…………………………………………………………………30 Table 2.3: Number of New V.I.N.E. Registrations, 2007-2010………………………………………………………………….30 Table 2.4: Crime Victim’s Compensation Board Awards by Expense Type, FY 2007-2010………………………32 Table 2.5: Data from the Kentucky Cabinet for Health and Family Services, FY 2007-2010………………….34 Table 2.6: Activities of the Office of Victim’s Advocacy during CY 2010………………………………………………..35 Table 2.7: Activities of the Department of Criminal Investigations- Cyber Crimes Branch during CY 2010……………………………………………………………………………………………………………………………………………………………35 Table 2.8: Activities of the Department of Criminal Investigations- Drug Investigations Branch during CY 2010……………………………………………………………………………………………………………………………………………………………35 Table 2.9: Activities of the Department of Criminal Investigations- Public Integrity/Special Investigations Branch during CY 2010……………………………………………………………………………………………………….35 Table 2.10: Activities of the Medicaid Fraud and Abuse Control Division during CY 2010………………………36 Table 2.11: Complaints and Settlements of the Medicaid Fraud and Abuse Control Division during CY 2010……………………………………………………………………………………………………………………………………………………………36 Table 2.12: Activities of the Child Enforcement Commission during CY 2010…………………………………………37 Table 2.13: Activities of the Office of Consumer Protection during CY 2010………………………………………….37 Section III: Reported Crime Trends Figure 3.a: Part One Offense Rate per 100,000 Population, United States and Kentucky, 2000-2010….39 Table 3.1: Part One Offense Rate per 100,000 Population, United States and Kentucky, 2000-2010……39 Table 3.2: Part One Offenses per 100,000 Population, 2007-2010………………………………………………………….40 Table 3.3: Part One Offense Rate per 1,000 Population for Cities with over 10,000 Residents, 2010…..41 Table 3.4: Part One Offense Related Arrests per 100,000 Population, 2007-2010………………………………….42 Section IV: Arrest Trends Table 4.1: Adult (18 and Older) Part One Offense Arrests per 100,000 Adult Population, 2007-2010……44 Table 4.2: Rate of Part One Offense Arrests by Race, 2010…………………………………………………………………….45 Table 4.3: Rate of Part Two Offense Arrests by Race, 2010…………………………………………………………………….47 Table 4.4: Rate of Part One Offense Arrests by Sex, 2010……………………………………………………………………….50 Table 4.5: Rate of Part Two Offense Arrests by Sex, 2010………………………………………………………………………51 Table 4.6: Rate of Part One Offense Arrests by Age, 2010………………………………………………………………………53 Table 4.7: Rate of Part Two Offense Arrests by Age, 2010………………………………………………………………………54 Table 4.8: Rate of Adult Part One Offense Arrests per 1,000 Population by County, 2010…………………….56 Table 4.9: Rate of Property Offense Arrests per 1,000 Population by County, 2010………………………………60 Table 4.10: Rate of Adult Violent Offense Arrests per 1,000 Population by County, 2010…………………….64 Table 4.11: Part One Offense Arrest Rate per 100,000 Population- Kentucky and Surrounding States, 2007-2010……………………………………………………………………………………………………………………………………………………68

Sourcebook of Criminal Justice Statistics in the Commonwealth
7
Table 4.12: Violent Offense Arrest Rate per 100,000 Population- Kentucky and Surrounding States, 2007-2010…………………………………………………………………………………………………………………………………………………69 Table 4.13: Property Offense Arrest Rate per 100,000 Population-Kentucky and Surrounding States, 2007-2010………………………………………………………………………………………………………………………………………………….70 Section V: Bail Release Trends Table 5.1: Bail Type and Release Cases Processed by the Administrative Office of the Courts, Pretrial Services, 2009-2010……………………………………………………………………………………………………………………………………72 Table 5.2: Release Outcome by Level of Risk, 2009-2010……………………………………………………………………….73 Table 5.3: Gender of Individuals Screened by Pretrial Services, 2010…………………………………………………….73 Table 5.4: Release Outcome by Level of Risk, 2009-2010……………………………………………………………………….74 Table 5.5: Ethnicity of Individuals Screened by Pretrial Services, 2010………………………………………………….74 Table 5.6: Special Populations among Individuals Screened by Pretrial Services, 2010………………………….74 Table 5.7: Race of Individuals Screened by Pretrial Services, 2010…………………………………………………………75 Table 5.8: Age of Individuals Screened by Pretrial Services, 2010………………………………………………………….75 Table 5.9: Public Safety Rate by Classification Level, 2010…………………………………………………………………….75 Table 5.10: Highest Level of Education Completed by Individuals Screened by Pretrial Services, 2010……………………………………………………………………………………………………………………………………………………………76 Table 5.11: Appearance Level by Classification Level, 2010……………………………………………………………………76 Table 5.12: Pretrial Release, January 1-December 31, 2010…………………………………………………………………..77 Table 5.13: Monitored Conditional Release, 2010…………………………………………………………………………………….77 Section VI: Court Disposition and Sentencing Trends Table 6.1: Circuit Court- Specified Offenses by Disposition Type, 2006-2010…………………………………………79 Table 6.2: District Court- Specified Offenses by Disposition Type, 2006-2010……………………………………….82 Table 6.3: Family Court- Specified Offenses by Disposition Type, 2006-2010…………………………………………85 Table 6.4: Sentencing Imposed by Circuit Courts for Part One Offenses, 2006-2010………………………………87 Table 6.5: Sentencing Imposed by District Courts for Part One Offenses, 2006-2010…………………………….90 Table 6.6: District Court Closed Pre-Payable Cases, 2006-2010………………………………………………………………92 Section VII: Trial Court Caseload Trends Figure 7.a: Kentucky Judicial Districts………………………………………………………………………………………………………94 Table 7.1: Kentucky Court Districts by County……….……………………………………………………………………………….95 Table 7.2: Kentucky Court Circuits by County….………………………………………………………………………………………97 Table 7.3: Kentucky Court Districts………………………………………………………………………………………………………….99 Table 7.4: Kentucky Court Circuits………………………………………………………………………………………………………….101 Table 7.5: Criminal Cases Disposed in Circuit Court by Circuit, 2006-2010……………………………………………103 Table 7.6: Criminal Cases Disposed in Circuit Court by County, 2006-2010………………………………………….105 Table 7.7: Felony Cases Disposed in District Court by County, 2006-2010…………………………………………….109 Table 7.8: Misdemeanor Cases Disposed in District Court by County, 2006-2010………………………………….113 Table 7.9: Juvenile Cases Disposed in District Court by County, 2006-2010………………………………………….117 Table 7.10: Domestic Violence Cases Disposed in District Court by County, 2006-2010……………………….121 Table 7.11: Closed Felony District Court Cases, 2006-2010……………………………………………………………………125 Table 7.12: Closed Misdemeanor District Court Cases, 2006-2010…………………………………………………………127 Table 7.13: Closed Juvenile District Court Cases, 2006-2010…………………………………………………………………129 Table 7.14: Closed Domestic Violence District Court Cases, 2006-2010………………………………………………..131 Table 7.15: Closed Domestic and Family Cases in Circuit Family Court by County, 2006-2010…………….133 Table 7.16: Closed Juvenile Cases in Circuit Family Court by County, 2006-2010…………………………………135 Table 7.17: Closed Domestic Violence Cases in Circuit Family Court by County, 2006-2010……………….137 Table 7.18: Family Court Caseload by County, 2006-2010…………………………………………………………………….139 Table 7.19: Court Obligations Collected During Drug Court Participation, CY 2010……………………………..144 Table 7.20: Caseload Statistics- Department of Public Advocacy Appeals Division, CY 2010……………….145 Table 7.21: Department of Public Advocacy- Circuit Court Cases by County, 2010………………………………146 Table 7.22: Department of Public Advocacy- District Court Cases by County, 2010…………………………….150

Sourcebook of Criminal Justice Statistics in the Commonwealth
8
Table 7.23: Department of Public Advocacy- Caseload by County, 2010………………………………………………154 Table 7.24: Department of Public Advocacy- Juvenile Cases by County, 2010………………………………………156 Section VIII: Appellate Court Caseload Trends Table 8.1: Supreme Court Case Loads, CY 2006-2010……………………………………………………………………………159 Table 8.2: Court of Appeals Cases, CY 2006-2010………………………………………………………………………………….159 Section IX: Commitment and Release Trends Table 9.1: Kentucky Department of Corrections Institutional Information……………………………………………161 Table 9.2: Average Daily Population by DOC Institution, 2006-2010……………………………………………………..162 Table 9.3: Kentucky Department of Corrections Inmate Population by Type of Supervision, 2006-2010………………………………………………………………………………………………………………………………………………………….163 Table 9.4: Department of Corrections Substance Abuse Program Expenditures, Admissions, and Completions, 2006-2010………………………………………………………………………………………………………………………….163 Table 9.5: Prison Admissions by Type, 2006-2010………………………………………………………………………………….164 Table 9.6: Prison Population by Classification Status as of December 31, 2010…………………………………..165 Table 9.7: Recidivism Rates 1999-2009…………………………………………………………………………………………………..165 Table 9.8: Kentucky Prison Population by Sex, 2006-2010…………………………………………………………………….165 Table 9.9: Kentucky Prison Population by Race/Ethnicity, 2006-2010………………………………………………….166 Table 9.10: Kentucky Prison Population by Age, 2010…………………………………………………………………………..166 Table 9.11: Department of Corrections Medical Expenditures, 2006-2010……………………………………………167 Table 9.12: New Prescription Drug and Methamphetamine Related Commitments, 2006-2010…………..167 Table 9.13: Per Diem Cost to Incarcerate by Institution, 2006-2010…………………………………………………….168 Table 9.14: Per Annum Cost to Incarcerate by Institution, 2006-2010………………………………………………….170 Table 9.15: Per Diem Cost to Incarcerate by Institution Type, 2006-2010…………………………………………….172 Table 9.16: Per Annum Cost to Incarcerate by Institution Type, 2006-2010…………………………………………173 Table 9.17: DOC PREA Statistics- Number of Claims Substantiated by Type of Incident, 2005-2010……174 Table 9.18: Number of New Commitments by Part One Offense, 2005-2010…………………………………………174 Table 9.19: Average Length of Sentence by Part One Offense in Years, 2005-2010………………………………175 Table 9.20: Murder: Commitments and Releases, 2005-2010…………………………………………………………………175 Table 9.21: Rape: Commitments and Releases, 2005-2010……………………………………………………………………175 Table 9.22: Robbery: Commitments and Releases, 2005-2010………………………………………………………………176 Table 9.23: Aggravated Assault: Commitments and Releases, 2005-2010…………………………………………….176 Table 9.24: Burglary: Commitments and Releases, 2005-2010………………………………………………………………176 Table 9.25: Larceny/Theft: Commitments and Releases, 2005-2010…………………………………………………...177 Table 9.26: Auto Theft: Commitments and Releases, 2005-2010………………………………………………………….177 Table 9.27: Arson: Commitments and Releases, 2005-2010………………………………………………………………….177 Table 9.28a: Kentucky Parole Board Outcomes, January 1-December 31, 2010……………………………………178 Table 9.28b: Other Kentucky Parole Board Outcomes, January 1- December 31, 2010……………………….179 Table 9.29: Other Parole Board Outcomes, 2010……………………………………………………………………………………180 Table 9.30: Number of Paroled Individuals Ordered to Have No Contact with Victims or Family as a Condition of Release, 2010………………………………………………………………………………………………………………………180 Section X: Juvenile Justice System Trends Table 10.1: Specified Juvenile (Age 0-17) Offenses, CY 2006-2010………………………………………………………182 Table 10.2: Total Specified Juvenile (Age 0-17) Offenses, CY 2006-2010…………………………………………….183 Table 10.3: Total Number of Youth Served by the Kentucky Department of Juvenile Justice, 2006-2010…………………………………………………………………………………………………………………………………………………………183 Table 10.4: Part One and Part Two Juvenile Offenses by Age, 2010…………………………………………………….184 Table 10.5: Number of Juveniles Committed and Probated to D.J.J., 2010………………………………………..185 Table 10.6: Youth Placed in D.J.J. Community Supervision by Gender, 2010………………………………………185 Table 10.7: Youth Placed in D.J.J. Out of Community Supervision by Gender, 2010……………………………185 Table 10.8: Youth by D.J.J. Placement Type, 2010……………………………………………………………………………….186 Table 10.9: Youth Placed in D.J.J. Community Supervision by Ethnicity, 2010…………………………………….186

Sourcebook of Criminal Justice Statistics in the Commonwealth
9
Table 10.10: Youth Placed in D.J.J. Out of Community Supervision by Ethnicity, 2010………….……………186 Table 10.11: Youth Placed in D.J.J. Community Supervision by Race, 2010…………………………………………187 Table 10.12: Youth Placed in D.J.J. Out of Community Supervision by Race, 2010………………………………187 Table 10.13: Number of Unduplicated Juveniles Committed and Probated by Offense Type, 2010…….188 Table 10.14: Number of Duplicated Juveniles Committed and Probated by Offense Type, 2010…………188 Table 10.15: D.J.J. Recidivism Rate by Gender, 2010……………………………………………………………………………189 Table 10.16: D.J.J. Recidivism Rate by Ethnicity, 2010…………………………………………………………………………189 Table 10.17: D.J.J. Recidivism Rate by Race, 2010……………………………………………………………………………….190 Table 10.18: Juveniles Released by D.J.J. Before Age 18 by Gender, 2010………………………………………….191 Table 10.19: Juveniles Released by D.J.J. Before Age 18 by Ethnicity, 2010……………………………………….191 Table 10.20: Juveniles Released by D.J.J. Before Age 18 by Race, 2010………………………………………………192 Table 10.21: Juvenile Complaints with DUI Offenses, 2006-2010………………………………………………………….193 Table 10.22: Juvenile Complaints with Prescription Drug Offenses, 2006-2010……………………………………193 Table 10.23: Juvenile Complaints with Methamphetamine Offenses, 2006-2010………………………………….193 Table 10.24: Juvenile Complaints with Sex Abuse Offenses, 2006-2010……………………………………………….194 Table 10.25: Rate of Status Offenders by County, 2010…………………………………………………………………………195 Table 10.26: Dispositions for Arson Offenses Referred to Court Designated Workers, 2006-2010……….200 Table 10.27: Dispositions for Assault Offenses Referred to Court Designated Workers, 2006-2010…….201 Table 10.28: Dispositions for Auto Theft Offenses Referred to Court Designated Workers, 2006-2010.....................................................................................................................202 Table 10.29: Dispositions for Burglary Offenses Referred to Court Designated Workers, 2006-2010………………………………………………………………………………………………………………………………………………………….203 Table 10.30: Dispositions for Murder/Homicide Offenses Referred to Court Designated Workers, 2006-2010…………………………………………………………………………………………………………………………………………………………204 Table 10.31: Dispositions for Rape Offenses Referred to Court Designated Workers, 2006-2010…………………………………………………………………………………………………………………………………………………………205 Table 10.32: Dispositions for Robbery Offenses Referred to Court Designated Workers, 2006-2010…………………………………………………………………………………………………………………………………………………………206 Table 10.33: Dispositions for Sexual Abuse Offenses Referred to Court Designated Workers, 2006-2010…………………………………………………………………………………………………………………………………………………………207 Table 10.34: Dispositions for Sodomy Offenses Referred to Court Designated Workers, 2006-2010……208 Table 10.35: Dispositions for Theft Offenses Referred to Court Designated Workers, 2006-2010……….209 Table 10.36: Court Designated Workers- Number of Charges, Complaints, and Juveniles by Type of Offense, 2006-2010…………………………………………………………………………………………………………………………………210 Table 10.37: Court Designated Workers- Complaints Filed by Cases Closed Reason, 2006-2010………….211 Section XI: Selected Crime Categories and Crime Indicators Drug Related Offenses Table 11.1: Drug Arrests by Type of Substance, 2006-2010……………………………………………………………………215 Figure 11.a: Drug Arrests by Type of Substance, 2006-2010………………………………………………………………….215 Table 11.2: Drugs Most Frequently Detected in the Blood of Overdose Victims, 2007-2010………………..216 Table 11.3: Summary of Total Overdoses Autopsied by Kentucky Medical Examiner Offices, 2007-2010……………………………………………………………………………………………………………………………………………………….…217 Figure 11.b: Map of Per Capita Drug Law Arrests by County, 2010……………………………………………………….218 Methamphetamine Related Offenses Figure 11.c: Clandestine Methamphetamine Labs Confiscated in Kentucky, 2001-2010……………………….220 Table 11.4: 2010 Methamphetamine Arrests by Age………………………………………………………………………………221 Table 11.5: 2010 Methamphetamine Arrests by Sex……………………………………………………………………………….225 Table 11.6: 2010 Methamphetamine Arrests by Race…………………………………………………………………………….229 Table 11.7: Disposition of Methamphetamine Offenses within Circuit Court, 2006-2010…………………….233

Sourcebook of Criminal Justice Statistics in the Commonwealth
10
Table 11.8: Disposition of Methamphetamine Offenses within District Court, 2006-2010……………………234 Table 11.9: Disposition of Methamphetamine Offenses within Juvenile Court, 2006-2010…………………235 Table 11.10: Methamphetamine Related Commitments and Releases, 2005-2010……………………………..236 Table 11.11: Average Length of Sentence in Years: Methamphetamine and Prescription Drugs, 2005-2010…………………………………………………………………………………………………………………………………………………………236 Table 11.12: New Prescription Drug and Methamphetamine Related Commitments……………………………237 Table 11.13: Juvenile Complaints with Methamphetamine Offenses, 2006-2010…………………………………237 Table 11.14: Juvenile Complaints with Prescription Drug Offenses, 2006-2010…………………………………..237 Prescription Drug Related Offenses Table 11.15: Disposition of Prescription Drug Offenses within Circuit Court, 2006-2010………………………239 Table 11.16: Disposition of Prescription Drug Offenses within District Court, 2006-2010…………………….240 Table 11.17: Disposition of Prescription Drug Offenses within Juvenile Court, 2006-2010……………………241 Table 11.18: All 2010 Controlled Substance Prescriptions Dispensed by County……………………………………242 Table 11.19: 2010 Hydrocodone Prescriptions Dispensed by County…………………………………………………….246 Table 11.20: 2010 Oxycodone Prescriptions Dispensed by County…………………………………………………………250 Table 11.21: 2010 Methadone Prescriptions Dispensed by County…………………………………………………………254 Table 11.22: 2010 Tramadol Prescriptions Dispensed by County……………………………………………………………258 Table 11.23: 2010 Buprenorphrine Prescriptions Dispensed by County…………………………………………………262 Table 11.24: 2010 Alprazolam Prescriptions Dispensed by County…………………………………………………………266 Table 11.25: 2010 Diazepam Prescriptions Dispensed by County……………………………………………………………270 Driving Under the Influence (DUI) Offenses Table 11.26: Number of DUI Arrests and Arrest Rate per 1,000 Population by County, 2007-2010………275 Table 11.27: Circuit Court DUI Charges by Disposition Statewide, 2006-2010………………………………………279 Table 11.28: District Court DUI Charges by Disposition Statewide, 2006-2010………………………………………280 Table 11.29: Juvenile Court DUI Charges by Disposition Statewide, 2006-2010……………………………………281 Sex Offenses Table 11.30: Circuit Court- Sex Offenses by Disposition Type, 2006-2010……………………………………………283 Table 11.31: District Court- Sex Offenses by Disposition Type, 2006-2010…………………………………………..285 Table 11.32: Family Court- Sex Offenses by Disposition Type, 2006-2010…………………………………………….287 Table 11.33: Number of Reported Incidents of Forcible Rape, 2006-2010…………………………………………….287 Table 11.34: Forcible Rape Arrest Rate per 100,000 Population, Kentucky and Surrounding States, 2007-2010………………………………………………………………………………………………………………………………………………………….288 Table 11.35: Average Length of Sentence in Years: Sex Offenses, 2005-2010………………………………………289 Table 11.36: Sex Offenses Commitments and Releases, 2005-2010………………………………………………………289 Domestic Violence Offenses Table 11.37: Domestic Violence Offenses by Outcome and Court Type, 2006-2010……………………………291 Table 11.38: Closed Domestic Violence District Court Cases, 2006-2010…………………………………………….292 Table 11.39: Domestic Violence Cases Disposed in District Court by County, 2006-2010……………………294 Section XII: Key Criminal Justice Cost Information Table 12.1: 2010 Executive Budget for Kentucky Justice and Public Safety Cabinet……………………………299 Table 12.2a: Grant Awards by County, FY 2010……………………………………………………………………………………..300 Table 12.2b: Grant Awards by County, FY 2010………………………………………………………………………………………305

Sourcebook of Criminal Justice Statistics in the Commonwealth
11
Limitations of Current Data and Information Systems
As you review the information contained in the Sourcebook, it is important to keep in mind that data have been drawn from a number of state level criminal justice data collection systems in an attempt to provide a snapshot of crime trends in the Commonwealth. A detailed description of the existing systems can be found in Appendix A. Until these systems are fully integrated into a statewide Unified Criminal Justice Information System, there will remain limitations in the data available for analysis. These and other limitations are delineated below. • As a result of the variation across agencies, it is currently not possible to publish a fully
integrated criminal justice system report or to perform systemic trend analyses. This report is intended to provide individual snapshots of the key components of the justice system (law enforcement, courts, corrections, prosecution, and defense), and to draw general conclusions regarding system trends where possible.
• Data collection systems of criminal justice agencies were established independently for in-house
data management purposes and not for planning or policy evaluation. • There are currently no standardized formats for defining data elements or counting criminal
justice events. Agencies vary according to what is being counted (e.g., charges, cases, or individuals).
• While efforts are ongoing to unify the codes used to define each offense presented in the
Sourcebook, differences still exist among agencies. For example, the Kentucky Administrative Office of the Courts define robbery offenses using a different set of offense codes than the Kentucky Department of Corrections. Therefore, readers are cautioned not to compare data directly across agencies. This report is expected to improve over time as reporting practices become more consistent. A list of the offense codes used to derive each table or figure can be provided upon request.
• Starting in 2005, in an attempt to further unify the data, all data were requested to be reported
on a calendar year basis, with the exception of fiscal data. This particular change in the reporting parameters will affect the user’s ability to compare data across previous editions of the Sourcebook.
• Each year, adaptations are made to the Sourcebook in an effort to improve the quality of the
information provided. The methods of reporting and the process of compiling this annual report are constantly evolving with the end goal to put forth the most accurate data available. As such, the user’s ability to compare data published in the 2010 edition of the Sourcebook with previously published editions will be affected.
• Calculations, such as percent change, rate per population, etc. were prepared by the Kentucky
Statistical Analysis Center, not the agency providing the original data unless otherwise noted. • Several agencies have provided updated data for years prior to 2010. As a result, the data in the
2010 Sourcebook may be different from that which is found in earlier editions of the Sourcebook. Where possible, the updated data has been included in order to provide the most accurate data available. Data updates may occur because of changes in the information systems, changes to the

Sourcebook of Criminal Justice Statistics in the Commonwealth
12
criminal code, and/or retroactive data updates. If such a change has occurred, where possible, the data has been recalculated for all years presented in the table or figure.
• Kentucky currently uses the FBI’s Summary Uniform Crime Reporting Program (UCR) to collect
data. The UCR is a nationwide, cooperative statistical effort of more than 18,000 city, county, college and university, state, tribal and federal agencies voluntarily reporting data on crimes. These agencies represent 97.4% of the nation’s total population. The UCR includes information on Part I offenses which include the violent crimes of murder and non-negligent manslaughter, forcible rape, robbery, aggravated assault and the property crimes of burglary, larceny-theft, auto theft, and arson.
• In an effort to improve the quality of the Kentucky State Police’s annual Crime in Kentucky
reports, several adaptations were made in 1998 to data reporting that have continued through 2010. These changes are in accordance with UCR guidelines and will affect the user’s ability to compare data published in the 1998 through 2010 reports with previously published data.
• The following disclaimer has been issued by the Kentucky Administrative Office of the Courts and
applies to all data within the Sourcebook that is attributed to that agency: “Information received from COURTNET is subject to change(s), reprogramming, modification(s) of format and availability at the direction of the Administrative Office of the Courts (AOC), and may not at any particular moment reflect the true status of court cases due to ordinary limitation(s), delay(s) or error(s) in the system’s operation. The AOC disclaims any warranties as to the validity of the information obtained from COURTNET. The recipient is solely responsible for verifying information received from COURTNET through the cross-referencing of official court records. The AOC shall not be liable to the recipient, or to any third party using the system or information obtained therefrom, for any damages whatsoever arising out of the use of COURTNET.” Detailed limitations pertaining to Administrative Office of the Courts data is provided in Appendix D.
• The U.S. Census Bureau collects population and demographic data on a ten year cycle. In the
years between the decennial census, population estimates are created based on continuously collected data. As a result information which makes use of U.S. Census Bureau data for the intervening years utilizes the estimated population numbers and is noted as such.

Sourcebook of Criminal Justice Statistics in the Commonwealth
13
Section I: Kentucky’s Demographic Profile Having a firm grasp on the demographic trends and realities facing Kentucky provides a basis for crafting effective policies, especially when changes represent a potentially significant impact on the day-to-day operations of the criminal justice system. The first section of the 2010 Edition of the Sourcebook of Criminal Justice Statistics in the Commonwealth provides necessary background information for the reader regarding the demographic profile of Kentucky. Information provided within this section stems from the United States Census Bureau’s 2010 Census, the Small Area Population Estimates Division, and the American Community Survey (ACS), which provides population, demographic, and housing unit estimates for communities throughout the nation. ACS data, which is collected every year, provides up to date information about the population at the local community level and serves as a critical element of the decennial census program. About three million housing units from across the nation participate in the ACS annually, and provide critical demographic information about the population including age, race, ethnicity, income, veteran status, housing location and cost, and other economic and social indicators which help to provide an understanding of the population’s characteristics. Likewise, since ACS data is collected annually, this mechanism allows conclusions and estimates to be provided for geographic locations with populations of less than 20,000 individuals. The findings from the U.S. Census 2010 ACS are provided below:
Kentucky’s total population was nearly 4.34 million- About 2.2 million (50.8%) were females, and the median age was 38.1 years. About 23.5% of the population was under age 18, and about 13.3% were over age 65.
For people reporting only one race about 88.8%, or more than 3.8 million were white, 7.8%, or
337,520 were African American, 1.2%, or 51,431 were Asian/Pacific Islander, and less than 0.25%, or 10,120, were American Indian/Alaska Native. More than 55,550 (1.3%) reported their race as “Other” and more than 75,200 identified two or more races (about 1.7%).
There were over 1.927 million households in Kentucky, with an average size of 2.45 people per
house.
More than 4.178 million Kentucky residents (96.3%) were born in the United States, and of these, over 3.05 million (70.4%) were native born Kentuckians. Approximately 92,500 (2.1%) of Kentucky’s 4.34 million residents are not Naturalized U.S. Citizens.
Among those people who were at least 5 years of age, approximately 4.07 million, nearly 3.87
million, or (95.2%) spoke only English within their homes. Of those 195,027 who spoke a language other than English, 51.8% or 100,988 spoke Spanish.
Of those more than 2.9 million Kentucky residents aged 25 or more, almost 82% of these have
at least a high school diploma and approximately 20.5% have a Bachelor’s Degree or higher.
Of the more than 3.43 million Kentucky residents aged 16 years or older, 2.07 million (60.3%) were in the workplace. The leading industries in Kentucky are Educational and Health Care Services and Social Assistance (24.5%), Manufacturing (13.2%), and Retail Trade (12.3%).
The most common occupations among Kentucky workers were Management, Business, Science,
and Arts Occupations (32.3%), Sales and Office Occupations (24.4%), Service Occupations (16.8%), and Production, Transportation, and Material Moving Occupations (16.2%). 78.6% of

Sourcebook of Criminal Justice Statistics in the Commonwealth
14
the Kentucky workforce is employed for private wages, 15.5% are Government Workers, and 5.8% are Self-Employed. The remaining 0.1% are Unpaid Family Workers.
Within the past 12 months, 14.5% of all Kentucky Families have had incomes which were below
the Federal Poverty Level. 22.8% of those families with children under age 18 met this guideline, as did 25.6% of those with children under age 5. 38.1% of families with a Single Female Head of Household had incomes below the Federal Poverty Level, as have 11.2% of individuals 65 years or older. In households made up of unrelated individuals 15 years or age or older, 32.3% have had incomes below Federal Poverty Guidelines during this time frame.
Kentucky had almost 1.93 million housing units, and 87.3% were occupied. 68.6% of the more
than 1.68 million occupied units were owner-occupied, with the remaining 528,056 (31.4%) being occupied by renters. The mean number of residents in owner occupied units was 2.56 persons, and in rental units this number was 2.40 persons. More than 7.5% of those occupied units did not have access to private automobiles as a means of transportation, 0.7% lacked complete plumbing facilities, 0.9% lacked complete kitchen facilities, and 3.1% lack any type of telephone services.
Source: U.S. Census Bureau, American Community Survey 2010 Estimates

Sourcebook of Criminal Justice Statistics in the Commonwealth
15
Table 1.1: Population of Kentucky and Surrounding States, 2007-2010
State
U.S. Census Population Estimate CY 2007
U.S. Census Population Estimate CY 2008
U.S. Census Population Estimate CY 2009
U.S. Census Population CY 2010
Percent Change CY 2007-2010
Percent Change CY 2009-2010
Kentucky 4,241,474 4,269,245 4,314,113 4,339,367 2.30% 0.59%
Illinois 12,852,548 12,901,563 12,910,409 12,830,632 -0.18% -0.62%
Indiana 6,345,289 6,376,792 6,423,113 6,483,802 2.18% 0.94%
Missouri 5,878,415 5,911,605 5,987,580 5,988,927 1.87% 0.02%
Ohio 11,466,917 11,485,910 11,542,645 11,536,504 0.60% -0.05%
Tennessee 6,156,719 6,214,888 6,296,254 6,346,105 3.07% 0.79%
Virginia 7,712,091 7,769,089 7,882,590 8,001,024 3.74% 1.50%
West Virginia 1,812,035 1,814,468 1,819,777 1,852,994 2.26% 1.83%
UNITED STATES TOTAL POPULATION 301,621,157 304,059,724 307,006,550 308,745,538 2.36% 0.57%
Source: United States Census Bureau

Sourcebook of Criminal Justice Statistics in the Commonwealth
16
Median Age
All Persons
80-84
75-79
70-74
65-69
60-64
55-59
50-54
45-49
40-44
35-39
30-34
25-29
20-24
15-19
10-14
05-09
00-04
85+
Figure 1a: Kentucky Projected Population by Age, 2000-2050
0
2,000,000
4,000,000
6,000,000
8,000,000
10,000,000
12,000,000
2015 2020 2025 2030 2035 2040 2045 2050
Census 2000
Census 2010
PROJECTIONS
YEAR
PRO
JECT
ED P
OPU
LATI
ON
Source: United States Census Bureau and Kentucky State Data Center

Sourcebook of Criminal Justice Statistics in the Commonwealth
17
Table 1.2: Poverty Rate by State, 2010
2010 U.S. Census
Poverty Rate Rank State
1 New Hampshire 6.6
2 Connecticut 8.3
3 Wyoming 9.6
4 Wisconsin 9.9
5 Utah 10.0
6 Nebraska 10.2
7 Iowa 10.3
8 Minnesota 10.5
9 Massachusetts 10.6
10 New Jersey 10.7
11 Virginia 10.7
12 Maryland 10.8
13 Vermont 10.8
14 Washington 11.5
15 Delaware 12.1
16 Hawaii 12.1
17 Colorado 12.2
18 North Dakota 12.2
19 Pennsylvania 12.2
20 Alaska 12.4
21 Maine 12.5
22 South Dakota 13.2
23 Rhode Island 13.6
24 Idaho 14.0
25 Montana 14.0

Sourcebook of Criminal Justice Statistics in the Commonwealth
18
Table 1.2: Poverty Rate by State, 2010, continued
2010 U.S. Census Poverty
Rate Rank State
26 Illinois 14.1
27 Oregon 14.2
28 Kansas 14.3
29 Missouri 14.8
30 Ohio 15.3
31 Arkansas 15.5
32 Michigan 15.5
33 Florida 16.0
34 New York 16.0
35 California 16.3
36 Indiana 16.3
37 Oklahoma 16.3
38 Nevada 16.4
39 Tennessee 16.7
40 West Virginia 16.9
41 South Carolina 17.0
42 Alabama 17.3
43 North Carolina 17.4
44 Kentucky 17.7
45 Texas 18.4
46 Arizona 18.6
47 New Mexico 18.6
48 Georgia 18.7
49 District of Columbia 19.9
50 Louisiana 21.6
51 Mississippi 22.7
Source: U.S. Census Bureau

Sourcebook of Criminal Justice Statistics in the Commonwealth
19
Table 1.3: Percent Change in State Poverty Rates, 2007-2010
State
2007 U.S. Census
Estimated Poverty
Rate
2008 U.S. Census
Estimated Poverty Rate
2009 U.S. Census
Estimated Poverty
Rate
2010 U.S. Census Poverty
Rate
Percent Change 2007-
2010
Percent Change 2009-
2010
Alabama 14.5% 14.3% 16.6% 17.3% 19.31% 4.21%
Alaska 7.6% 8.2% 11.7% 12.4% 63.15% 5.98%
Arizona 14.3% 18.0% 21.2% 18.6% 30.06% -12.27%
Arkansas 13.8% 15.3% 18.9% 15.5% 12.31% -17.99%
California 12.7% 14.6% 15.3% 16.3% 28.34% 6.53%
Colorado 9.8% 11.0% 12.3% 12.2% 24.48% 0.82%
Connecticut 8.9% 8.1% 8.4% 8.3% -6.75% 1.20%
Delaware 9.3% 16.5% 12.3% 12.1% 30.10% -1.63%
District of Columbia 18.0% 9.6% 17.9% 19.9% 10.55% 11.17%
Florida 12.5% 13.1% 14.6% 16.0% 28.00% 9.58%
Georgia 13.6% 15.5% 18.4% 18.7% 37.50% 1.63%
Hawaii 7.5% 9.9% 12.5% 12.1% 61.33% 3.20%
Idaho 9.9% 12.2% 13.7% 14.0% 41.41% 2.18%
Illinois 10.0% 12.3% 13.2% 14.1% 41.00% 6.81%
Indiana 11.8% 14.3% 16.1% 16.3% 38.13% 1.24%
Iowa 8.9% 9.5% 10.7% 10.3% 15.73% 3.74%
Kansas 11.7% 12.7% 13.7% 14.3% 22.22% 4.37%
Kentucky 15.5% 17.1% 17.0% 17.7% 14.19% 4.11%
Louisiana 16.1% 18.2% 14.3% 21.6% 34.16% 51.04%
Maine 10.9% 12.0% 11.4% 12.5% 14.67% 9.64%
Maryland 8.8% 8.7% 9.6% 10.8% 22.72% 12.50%
Massachusetts 11.2% 11.3% 10.8% 10.6% -5.36% -1.86%
Michigan 10.8% 13.0% 14.0% 15.5% 43.51% 10.71%

Sourcebook of Criminal Justice Statistics in the Commonwealth
20
Table 1.3: Percent Change in State Poverty Rates, 2007-2010, Continued
State
2007 U.S. Census
Estimated Poverty
Rate
2008 U.S. Census
Estimated Poverty Rate
2009 U.S. Census
Estimated Poverty
Rate
2010 U.S. Census Poverty
Rate
Percent Change 2007-
2010
Percent Change 2009-
2010
Minnesota 9.3% 9.9% 11.1% 10.5% 12.90% -5.41%
Mississippi 22.6% 18.1% 23.1% 22.7% 0.44% -1.74%
Missouri 12.8% 13.3% 15.5% 14.8% 15.62% -4.52%
Montana 13.0% 12.9% 13.5% 14.0% 7.69% 3.70%
Nebraska 9.9% 10.6% 9.9% 10.2% 3.03% 3.03%
Nevada 9.7% 10.8% 13.0% 16.4% 69.07% 26.15%
New Hampshire 5.8% 7.0% 7.8% 6.6% 13.79% -15.39%
New Jersey 8.7% 9.2% 9.3% 10.7% 22.98% 15.05%
New Mexico 14.0% 19.3% 19.3% 18.6% 32.85% -3.63%
New York 14.5% 14.2% 15.8% 16.0% 10.34% 1.26%
North Carolina 15.5% 13.9% 16.9% 17.4% 12.25% 2.95%
North Dakota 9.3% 11.8% 10.9% 12.2% 31.18% 11.92%
Ohio 12.8% 13.7% 13.3% 15.3% 19.53% 15.03%
Oklahoma 13.4% 13.6% 12.9% 16.3% 21.64% 26.35%
Oregon 12.8% 10.6% 13.4% 14.2% 10.93% 5.97%
Pennsylvania 10.4% 11.0% 11.1% 12.2% 17.30% 9.90%
Rhode Island 9.5% 12.7% 13.0% 13.6% 43.15% 4.61%
South Carolina 14.1% 14.0% 13.7% 17.0% 20.56% 24.08%
South Dakota 9.4% 13.1% 14.1% 13.2% 40.42% -6.39%
Tennessee 14.8% 15.0% 16.5% 16.7% 12.83% 1.21%
Texas 16.5% 15.9% 17.3% 18.4% 11.51% 6.35%
Utah 9.6% 7.6% 9.7% 10.0% 4.16% 3.09%
Vermont 9.9% 9.0% 9.4% 10.8% 9.09% 14.89%
Virginia 8.6% 10.3% 10.7% 10.7% 24.41% 0.00%
Washington 10.2% 10.4% 11.7% 11.5% 12.74% -1.71%
West Virginia 14.8% 14.5% 15.8% 16.9% 14.18% 6.96%
Wisconsin 11.0% 9.8% 10.8% 9.9% -10.00% -8.34%
Wyoming 10.9% 10.1% 9.2% 9.6% -11.93% 4.34%
Source: United States Census Bureau

Sourcebook of Criminal Justice Statistics in the Commonwealth
21
Figure 1b: Poverty in Kentucky, 2000-2010
0.
2.
4.
6.
8.
10.
12.
14.
16.
18.00%
20.00%
Pove
rty
Rate
00%
00%
00%
00%
00%
00%
00%
00%
00%
2000 2001 2002 2003 2004 2005 2006 2007 2008 2009 2010
Year
Poverty Rate
Source: United States Census Bureau

Sourcebook of Criminal Justice Statistics in the Commonwealth
22
Table 1.4: Number and Percentage of Kentucky Children in Poverty in the Past 12 Months by Race/Ethnicity
Below Poverty in 2009 Below Poverty in 2010 Change in Poverty (2010 less 2009)
Race/Ethnicity Number
Margin of Error
(±)² Percent
Margin of Error
(±)² Number
Margin of Error
(±)² Percent Margin of Error(±)² Number
Margin of Error
(±)² Percent
Margin of Error
(±)²
TOTAL 255,416 11,895 25.6 1.2 262,760 11,202 26.3 1.1 7,344 16,317 0.7 1.6
White 195,694 10,462 23.1 1.2 196,156 9,406 23.3 1.1 502 5,199 0.2 1.7
Black 38,027 4,359 44.1 4.2 42,992 4,175 47.3 4.2 4,965 2,230 3.2 6
Two or More Races 14,454 2,637 37.7 5.1 15,621 2,992 39.7 6.1 1,871 2,174 2.3 6.9
Hispanic 17,620 3,269 38.7 6.4 19,020 2,678 39.2 5.1 1,400 2,569 0.6 8.2
Source: United States Census Bureau, American Community Survey, 2010

Sourcebook of Criminal Justice Statistics in the Commonwealth
23
Table 1.5: Poverty and Median Income Estimates by County, 2010
Name
Poverty Estimate All
Ages
Poverty Estimate Under
Age 18 Poverty Percent
Under Age 18
Median Household
Income
Income Rank- Highest to Lowest
United States 46,215,956 15,749,129 21.6% $50,046 N/A
Kentucky 796,208 261,696 26.1% $40,089 N/A
Adair County 4,189 1,417 35.4% $30,177 95
Allen County 4,402 1,493 31.0% $35,617 67
Anderson County 2,722 984 18.4% $52,660 6
Ballard County 1,171 407 22.5% $41,776 32
Barren County 7,987 2,867 28.9% $38,000 54
Bath County 3,191 1,068 38.1% $32,091 83
Bell County 8,373 2,568 41.9% $26,911 111
Boone County 10,895 3,812 11.5% $64,005 2
Bourbon County 3,338 1,171 24.7% $39,219 46
Boyd County 9,019 2,917 28.4% $38,029 53
Boyle County 4,337 1,382 23.2% $39,241 45
Bracken County 1,389 518 24.7% $42,056 28
Breathitt County 3,844 1,193 38.7% $28,045 108 Breckinridge County 4,068 1,401 29.6% $35,428 68
Bullitt County 7,771 2,810 15.3% $51,409 8
Butler County 2,428 825 29.3% $35,162 69
Caldwell County 2,402 802 28.7% $36,255 63
Calloway County 5,895 1,486 22.5% $39,038 48
Campbell County 11,424 3,476 17.2% $47,341 10
Carlisle County 722 278 24.6% $38,182 52
Carroll County 2,339 971 36.8% $42,192 26
Carter County 6,240 2,183 34.4% $34,303 74
Casey County 4,292 1,498 40.8% $26,612 113
Christian County 13,565 6,000 29.0% $36,542 61
Clark County 6,099 2,145 26.2% $45,016 15
Clay County 7,378 2,223 48.9% $24,081 119
Clinton County 2,564 885 37.5% $27,133 110
Source: U.S. Census Bureau, Small Area Estimates Division

Sourcebook of Criminal Justice Statistics in the Commonwealth
24
Table 1.5: Poverty and Median Income Estimates by County, 2010, Continued
Name Poverty Estimate
All Ages Poverty Estimate
Under Age 18 Poverty Percent
Under Age 18
Median Household
Income
Income Rank- Highest to Lowest
Crittenden County 1,817 659 31.9% $33,966 76 Cumberland County 1,770 589 39.5% $27,382 109
Daviess County 15,215 5,650 24.6% $41,878 31
Edmonson County 2,264 785 30.1% $34,849 71
Elliott County 2,032 569 36.0% $29,335 101
Estill County 4,159 1,377 42.2% $29,486 98
Fayette County 56,821 14,741 23.9% $45,820 14
Fleming County 2,704 1,055 30.8% $33,141 79
Floyd County 11,603 3,801 43.5% $28,589 103
Franklin County 7,592 2,403 23.0% $46,323 13
Fulton County 1,724 558 41.5% $30,662 90
Gallatin County 1,426 564 25.3% $42,761 22
Garrard County 2,841 990 25.8% $40,834 39
Grant County 4,417 1,745 26.1% $42,690 23
Graves County 7,190 2,523 28.6% $34,811 72
Grayson County 5,175 1,907 31.8% $32,970 81
Green County 2,397 806 32.4% $31,423 87
Greenup County 6,296 1,942 23.8% $40,752 41
Hancock County 1,209 437 20.1% $46,729 11
Hardin County 15,202 6,120 22.6% $44,203 17
Harlan County 9,679 2,581 39.2% $28,503 105
Harrison County 3,077 1,096 24.4% $42,124 27
Hart County 4,527 1,658 37.0% $31,733 85
Henderson County 7,480 2,372 22.4% $41,309 35
Henry County 2,605 939 25.3% $40,806 40
Hickman County 870 310 30.7% $39,087 47
Hopkins County 8,821 3,121 29.5% $39,738 43
Jackson County 4,026 1,237 40.1% $26,462 114
Jefferson County 125,861 41,016 24.4% $42,535 24
Jessamine County 7,549 2,905 23.6% $43,503 20
Source: U.S. Census Bureau, Small Area Estimates Division

Sourcebook of Criminal Justice Statistics in the Commonwealth
25
Table 1.5: Poverty and Median Income Estimates by County, 2010
Name Poverty Estimate
All Ages Poverty Estimate
Under Age 18 Poverty Percent
Under Age 18
Median Household
Income
Income Rank- Highest to Lowest
Johnson County 5,351 1,695 32.8% $34,260 75
Kenton County 20,906 7,118 18.3% $51,049 9
Knott County 4,146 1,187 34.3% $30,693 89
Knox County 10,564 3,480 45.3% $25,965 116
Larue County 2,634 969 29.7% $37,863 55
Laurel County 13,949 4,663 33.3% $34,712 73
Lawrence County 3,141 1,072 29.9% $33,313 78
Lee County 2,549 778 52.2% $24,908 117
Leslie County 3,222 848 35.8% $30,597 92
Letcher County 5,638 1,735 32.6% $33,410 77
Lewis County 3,878 1,272 39.5% $29,453 100
Lincoln County 5,683 2,024 33.9% $32,864 85
Livingston County 1,380 445 23.4% $38,608 50
Logan County 4,747 1,775 27.5% $37,316 58
Lyon County 1,069 258 20.8% $39,588 44
Madison County 16,558 4,401 25.1% $41,945 30
Magoffin County 3,869 1,293 41.2% $28,943 102
Marion County 3,416 1,248 25.9% $36,816 59
Marshall County 3,545 1,183 18.5% $43,825 18
Martin County 4,108 1,145 42.2% $29,575 97
Mason County 3,705 1,414 33.9% $36,795 60 McCracken County 10,350 3,654 25.6% $41,585 33
McCreary County 5,986 1,964 49.3% $24,691 118
McLean County 1,541 524 24.1% $38,580 51
Meade County 4,055 1,641 21.5% $46,671 12
Menifee County 1,755 607 43.2% $28,061 107
Mercer County 3,244 1,128 22.9% $41,985 29
Metcalfe County 2,133 852 36.1% $28,538 104
Monroe County 2,639 972 39.1% $28,074 106 Montgomery County 5,004 1,667 26.6% $37,678 56
Source: U.S. Census Bureau, Small Area Estimates Division

Sourcebook of Criminal Justice Statistics in the Commonwealth
26
Table 1.5: Poverty and Median Income Estimates by County, 2010
Name Poverty Estimate
All Ages Poverty Estimate
Under Age 18 Poverty Percent
Under Age 18
Median Household
Income
Income Rank- Highest to Lowest
Morgan County 3,788 1,064 38.8% $30,502 93 Muhlenberg County 6,262 1,986 30.0% $37,614 57
Nelson County 6,886 2,388 21.5% $43,330 21
Nicholas County 1,307 492 29.2% $36,306 62
Ohio County 4,771 1,704 29.5% $35,975 65
Oldham County 4,294 1,405 8.5% $75,724 1
Owen County 1,802 653 25.1% $40,413 42
Owsley County 1,866 565 54.4% $22,335 120
Pendleton County 2,210 830 23.0% $43,517 19
Perry County 8,052 2,301 37.9% $31,604 86
Pike County 17,404 5,143 36.8% $30,302 94
Powell County 3,112 1,204 40.1% $32,041 84
Pulaski County 13,331 4,109 29.4% $33,026 80
Robertson County 500 162 33.3% $32,844 82 Rockcastle County 3,984 1,358 35.1% $30,900 88
Rowan County 5,900 1,423 32.3% $35,145 70
Russell County 4,811 1,420 37.4% $29,478 99
Scott County 5,190 1,986 15.9% $56,791 4
Shelby County 4,952 1,822 17.7% $51,845 7
Simpson County 2,758 1,057 25.2% $40,905 38
Spencer County 1,522 547 12.6% $62,579 3
Taylor County 5,356 1,883 35.0% $35,962 66
Todd County 2,877 1,171 35.1% $36,173 64
Trigg County 2,143 799 25.1% $42,387 25
Trimble County 1,306 435 20.2% $44,533 16
Union County 2,875 903 27.0% $41,209 36
Warren County 22,168 6,464 25.5% $41,001 37 Washington County 1,906 671 24.9% $38,618 49
Wayne County 5,770 1,863 40.7% $26,683 112
Webster County 1,989 674 21.6% $41,516 34
Whitley County 8,910 3,151 37.6% $29,813 96
Wolfe County 2,289 820 47.8% $25,968 115
Woodford County 2,760 994 16.9% $55,962 5
Source: U.S. Census Bureau, Small Area Estimates Division

Sourcebook of Criminal Justice Statistics in the Commonwealth
27
Section II: Victim Services
Kentucky has established many successful programs to provide services and aid to victims of crime, an important element of the criminal justice system. Data selected for this section was provided by V.I.N.E., the Crime Victims Compensation Board, the Cabinet for Health and Family Services, the Office of the Attorney General, Kentucky Association of Sexual Assault Programs, and Kentucky Domestic Violence Association.

Sourcebook of Criminal Justice Statistics in the Commonwealth
28
V.I.N.E.
The Office of Victim Services is the arm of the Kentucky Department of Corrections that provides victims with an automatic notification system to alert them about a change in the custody status of their offender. The system is known as Victim Information and Notification Everyday (V.I.N.E.). The nation’s first automated victim notification system was created in Jefferson County, Kentucky, in December, 1994. Like many progressive acts, a tragedy was the impetus for the establishment of the V.I.N.E. system. In 1993, Mary Byron was murdered by her estranged boyfriend after he was released from the Jefferson County Jail. Byron was not notified of his release. Byron’s parents, Pat and John Byron, led a crusade to ensure that their daughter’s death would not be in vain. As a result of their efforts, software engineers developed the V.I.N.E. system and implemented it at the Jefferson County Jail. In 1996, Kentucky again led the way, becoming the first state in the nation to provide victim notification on a statewide basis. Today more than 2,100 communities have implemented the V.I.N.E. system. More than two-thirds of the states have established statewide notification through V.I.N.E. The federal government also offers a victim notification service and funds supportive grants (e.g. Statewide Automated Victim Information and Notification (SAVIN)). Nationally, V.I.N.E. generates approximately 700,000 notification calls each month. The V.I.N.E. system receives booking and release data from all county jails and Kentucky Department of Corrections institutions. Victims can obtain information about an offender’s location, custody status, sentence expiration date, and scheduled parole hearing date. The victim can also register to be notified of changes in an offender’s custody status. Information can be obtained by calling a toll free number, by calling the Office of Victim Services, via e-mail, or via the Internet through VINELink. The service is available 24 hours a day. Whenever possible, the system provides notification of an offender’s release 72 hours prior to the release. In order to ensure that victims receive notification in a timely manner, V.I.N.E. will call the registered telephone number every 30 minutes during a 24 hour time period of until the call is acknowledged by the registered person. The following information was obtained from the Kentucky Department of Corrections’ Office of Victim Services:
Of the 1,413,600 searches for offenders through the V.I.N.E. program in 2010, 5.8% were conducted via VINEwatch, 32.4% were conducted via telephone, and 61.8% were conducted via VINELink.
In 2010, V.I.N.E. reported a total of 380,417 victim information and registration calls into the call center and
682,982 notification calls issued by the call center.
There were 45,073 new V.I.N.E. registrations in 2010, down from 45,447 in 2009, and up from 32,070 in 2008.

Sourcebook of Criminal Justice Statistics in the Commonwealth
29
Table 2.1: Number of Searches for Offenders through V.I.N.E., 2010
Number of Searches
Month Phone V.I.N.E. Watch V.I.N.E. Link Total
January 42,954 7,645 76,241 126,840
February 34,268 6,524 67,096 107,888
March 40,563 8,283 74,466 123,312
April 40,419 7,235 70,966 118,620
May 39,501 6,565 73,888 119,954
June 40,190 7,293 75,804 123,287
July 40,134 6,970 70,103 117,207
August 39,257 6,997 71,039 117,293
September 35,225 6,288 73,999 115,512
October 35,882 5,990 72,639 114,511
November 35,767 5,986 74,503 116,256
December 33,786 6,176 72,958 112,920
TOTAL 457,946 81,952 873,702 1,413,600
Source: Department of Corrections, Office of Victim Services

Sourcebook of Criminal Justice Statistics in the Commonwealth
30
Table 2.2: Number of Calls Processed through V.I.N.E., 2010
Month
Victim Information and Registration Calls into Call
Center
Notification Calls Issued by
Call Center Total
January 35,540 52,492 88,032
February 28,943 48,436 77,379
March 34,408 54,316 88,724
April 34,184 67,415 101,599
May 33,545 60,212 93,757
June 33,755 61,572 95,327
July 32,855 58,238 91,093
August 32,241 47,054 79,295
September 29,290 49,822 79,112
October 29,320 61,618 90,938
November 28,997 51,781 80,778
December 27,339 70,026 97,365
TOTAL 380,417 682,982 1,063,399
Source: Department of Corrections, Office of Victim Services
Table 2.3: Number of New V.I.N.E. Registrations, 2007-2010
Month 2007 2008 2009 2010
January 2,311 2,809 3,080 3,905
February 2,019 2,672 2,902 3,273
March 2,221 2,523 3,902 3,804
April 2,213 2,584 5,223 3,863
May 2,694 2,606 3,994 3,758
June 2,368 2,585 3,932 3,892
July 2,467 2,779 3,978 3,425
August 2,601 2,881 4,049 3,705
September 2,247 2,718 3,645 3,756
October 2,854 2,934 3,577 3,790
November 2,476 2,300 3,735 4,451
December 2,394 2,679 3,430 3,451
TOTAL 28,865 32,070 45,447 45,073
Source: Department of Corrections, Office of Victim Services

Sourcebook of Criminal Justice Statistics in the Commonwealth
31
Crime Victim’s Compensation Board
The Crime Victims Compensation Board, assisting more than 1,000 victims of violent crime per year, was enacted in 1974 and established by the Kentucky General Assembly in 1976, the 14th state to do so. The office opened in 1978 with the purpose of compensating victims for whom violent crime has resulted in financial hardship due to physical or psychological injury or death. In situations where there is no other source of payment, the board determines claimant eligibility and award amounts for qualifying expenses incurred as a result of violent crime, including medical, funeral, mental health counseling, dental, and corrective lens expenses resulting from the crime, as well as lost wages or loss of support for someone dependent on the victim. When qualifying claimants are awarded, payments are made directly to service providers or can be reimbursements to the claimant. State law caps the awards at $25,000 for each claim. The CVCB also administers a program which pays for sexual assault forensic/medical exams (SAEs) for both adults and children. These claims are applied for and paid directly to the service providers. CVCB Funds are provided through federal grants, offender-paid court fees, donations, and a $200,000 General Fund allotment for SAE’s. The governor-appointed, five-member board operates under Kentucky Revised Statutes (KRS) 346 and 216B, and Kentucky Administrative Regulations (KAR) Title 107. Each board member’s term is four years. The Board, which must include a victim, is intended to include representation from throughout the state. The following information was received from the Crime Victim’s Compensation Board:
The CVCB granted awards on 1,213 claims in fiscal year 2010, resulting in almost $1.9 million being distributed
to victims of violent crime. 251 claims were for compensation, and 1,013 were for sexual assault forensic/medical exams.

Sourcebook of Criminal Justice Statistics in the Commonwealth
32
Table 2.4: Crime Victim's Compensation Board Awards by Expense Type, FY 2007-2010
FY 2007 FY 2008 FY 2009 FY 2010
Type of Expense Amount Awarded
Total Claims Paid
Amount Awarded
Total Claims Paid
Amount Awarded
Total Claims Paid
Amount Awarded
Total Claims Paid
Attorney Fees $400 $5,592.50 $2,437.50 $0
Mental Health $30,363.44 $21.732.21 $6,375.23 $19,641.52
Economic Support (Lost Wages/Loss of Support) $161,196.78 $120,281.70 $73,284.32 $65,437.45
Funeral/Burial Expenses $317,147.52 $221,360.68 $48,784.44 $174,273.41
Medical/Dental Expenses $1,125,465.05 $1,234,432.17 $922,051.85 $1,182,995.81
Sexual Assault Exams $504,749.34 $538,999.38 $389,102.20 $445,061.42
1,213 TOTAL $2,139,322.13 1,350 $2,142,398.64 1,329 $1,442,035.54 978 $1,887,409.61
Source: Kentucky Crime Victim's Compensation Board

Sourcebook of Criminal Justice Statistics in the Commonwealth
33
Other Victim Services
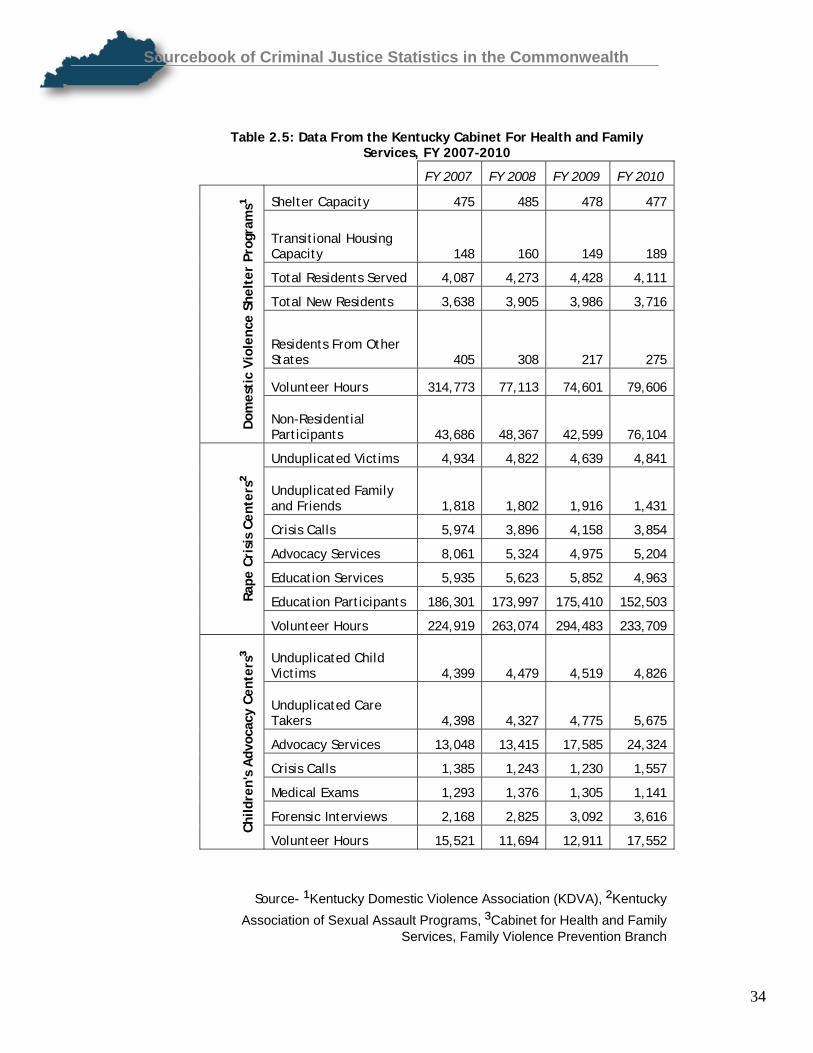
The Kentucky Cabinet for Health and Family Services (CHFS) oversees several programs that provide services to victims of crimes including rape crisis centers, domestic violence services, and children’s advocacy centers. The information provided here details the types of services provided through these programs and the number of victims served by each. The Office of the Attorney General also provides services and advocates for victims throughout the Commonwealth.
In FY 2010, Kentucky’s Rape Crisis Centers provided services to 4,841 victims, 1,431 friends and family members, and 4,963 sessions of education services for 152,503 participants. Rape Crisis Centers reported 233,709 hours of volunteer services, a decrease of 20.6% from FY2009 figures. Likewise, crisis calls decreased 7.4% from 4,158 in FY 2009 to 3,856 in FY 2010.
Domestic Violence Shelters throughout the state served 4,111 residential program participants and 76,104 non-
residential clients in FY 2010. Domestic Violence Service Providers reported 79,606 volunteer hours during FY 2010, an increase of over 6.7% from 2009.
Children’s Advocacy Centers served 4,826 child victims in FY 2010, an increase of 6.8% from the 4,519 victims
served the previous year. 1,557 crisis calls were received, and CAC staff was present during 3,616 forensic interviews and 1,141 medical exams.
In 2010, the Kentucky Office of the Attorney General’s Office of Victim’s Advocacy provided resource or
referral assistance to 6,778 people, an almost 495% increase from FY 2009. The Office also provided Notification of Appeals to 1,547 victims, down from 1,743 last year.
The Office of the Attorney General’s Medicaid Fraud and Abuse Control Division addressed 1,647 complaints
and collected over $17 million from settlements in FY 2010, stemming from fraudulently billed Medicaid claims and other abuses of the Medicaid system.
The Office of the Attorney General’s Department of Criminal Investigations (DCI) reported the following for FY
2010:
o DCI’s Cyber Crimes Branch opened 65 cases, closed 52 cases, and obtained 37 Search Warrants. o DCI’s Drug Investigations Branch opened 94 cases and closed 54 cases. o DCI’s Public Integrity/Special Investigations Branch opened 58 cases and closed 26 cases. The Branch
obtained 6 arrests, and addressed 1,212 constituent complaints.
Sourcebook of Criminal Justice Statistics in the Commonwealth
34
Table 2.5: Data From the Kentucky Cabinet For Health and Family Services, FY 2007-2010
FY 2007 FY 2008 FY 2009 FY 2010
Shelter Capacity 475 485 478 477
Transitional Housing Capacity 148 160 149 189
Total Residents Served 4,087 4,273 4,428 4,111
Total New Residents 3,638 3,905 3,986 3,716
Residents From Other States 405 308 217 275
Volunteer Hours 314,773 77,113 74,601 79,606
Dom
esti
c Vi
olen
ce S
helt
er P
rogr
ams¹
Non-Residential Participants 43,686 48,367 42,599 76,104
Unduplicated Victims 4,934 4,822 4,639 4,841
Unduplicated Family and Friends 1,818 1,802 1,916 1,431
Crisis Calls 5,974 3,896 4,158 3,854
Advocacy Services 8,061 5,324 4,975 5,204
Education Services 5,935 5,623 5,852 4,963
Education Participants 186,301 173,997 175,410 152,503 Rape
Cri
sis
Cent
ers²
Volunteer Hours 224,919 263,074 294,483 233,709
Unduplicated Child Victims 4,399 4,479 4,519 4,826
Unduplicated Care Takers 4,398 4,327 4,775 5,675
Advocacy Services 13,048 13,415 17,585 24,324
Crisis Calls 1,385 1,243 1,230 1,557
Medical Exams 1,293 1,376 1,305 1,141
Forensic Interviews 2,168 2,825 3,092 3,616
Child
ren'
s A
dvoc
acy
Cent
ers³
Volunteer Hours 15,521 11,694 12,911 17,552
Source- ¹Kentucky Domestic Violence Association (KDVA), ²Kentucky Association of Sexual Assault Programs, ³Cabinet for Health and Family
Services, Family Violence Prevention Branch

Sourcebook of Criminal Justice Statistics in the Commonwealth
35
Table 2.6: Table 2.7: Activities of the Department of
Criminal Investigations- Cyber Crimes Branch During CY 2010
Activities of the Office of Victim's Advocacy During CY 2010
Cases Opened 65 Resource and/or Referral Assistance Cases Closed 52 6,778*
Computer Forensics 64 Notification of Appeals to Crime Victims 1,547
Hard Drives Examined 180
Removable Devices Examined 1,741
* During 2010, staff at the Office of the Attorney General’s Office of Victim’s Advocacy received a
new mechanism for maintaining service statistics. The increase between 2009 and 2010 numbers is likely an artifact of better tracking
instead of an actual increase in referrals.
Audio Forensics 9
Video Forensics 3 Assistance to Other
Agencies 32 Source: Kentucky Office of the Attorney General
Search Warrants Obtained 37
Child Pornography Images Seized 141,467
Child Pornography Videos Seized 3,989
Source: Kentucky Office of the Attorney General
Table 2.8: Activities of the Department of Criminal
Investigations- Drug Investigations Branch During CY 2010
Cases Opened 94
Table 2.9: Activities of the Department of Criminal Investigations- Public Integrity/Special
Investigations Branch During CY 2010
58 Cases Opened
Cases Closed 54 Cases Closed 26
Indictments 8 Arrests 6
Arrests 9 Indictments 21
KASPER Reports Requested 160
Search Warrants Obtained 2
Search Warrants 11 KASPER Reports Requested 6
Source: Kentucky Office of the Attorney General Constituents Complaints 1,212
Source: Kentucky Office of the Attorney General

Sourcebook of Criminal Justice Statistics in the Commonwealth
36
Table 2.10: Activities of the Medicaid
Fraud and Abuse Control Division During CY 2010
Fraud 21
Patient Abuse 23 Table 2.11: Complaints and Settlements of the Medicaid Fraud and Abuse Control Division During
CY 2010 Patient Funds/Exploitation 0
Global Requests 15
Other 2 Case
s O
pene
d
Total
Fraud
61
Fraud 20
Patient Abuse 17
Patient Funds/Exploitation 0
Global Requests 15
Other 3 Case
s Cl
osed
Total 55
Fraud 72
Patient Abuse 73
Patient Funds/Exploitation 1
Global Requests 29 Other 2 Ca
ses
Pend
ing
Total 177
Fraud 5
Patient Abuse 21
Patient Funds/Exploitation 0
Global Requests 0
Other 0
Num
ber
of
Indi
ctm
ents
Total 26
Fraud 3
Patient Abuse 16 Patient Funds/Exploitation 0
Global Requests 0
Other 0
Num
ber
of
Conv
icti
ons
Total 19
Source: Kentucky Office of the Attorney General
112
Patient Abuse 1,416
Patient Funds 83
Recipient 2
Other Offenses 34
Num
ber
of C
ompl
aint
s R
ecei
ved
Total 1,647
Global Settlements 10
Civil/Administrative Settlements 9
Num
ber
of
Sett
lem
ents
Total 19
Criminal Cases $74,045.00
Civil Cases $24,379,611.57
Amou
nt
Rec
over
ed-
Ord
ered
Total $24,453,656.57
Criminal Cases $34,315.79
Civil Cases $17,090,654.10
Amou
nt
Coll
ecte
d
Total $17,124,969.89
Source: Kentucky Office of the Attorney
General

Sourcebook of Criminal Justice Statistics in the Commonwealth
37
Table 2.13: Activities of the Office of Consumer Protection During CY 2010
Table 2.12: Activities of the Child Enforcement Commission During CY 2010
Number of Consumer Complaints Received 5,611
Amount Recovered $4,682,378.63
Civil Penalties $34,250.00
Restitution $4,411,657.06
Investigative Costs $183,432.00
General Fund $53,039.57
Source: Kentucky Office of the Attorney General
Number of Briefs Filed 651
Number of Issues Addressed 1,987
Off
ice
of C
rim
inal
App
eals
Number of Oral Arguments 48
Number of Hearing Requests 353
Adm
inis
trat
ive
Hea
ring
s D
ivis
ion
Number of Mediation Requests 7
Source: Kentucky Office of the Attorney General

Sourcebook of Criminal Justice Statistics in the Commonwealth
38
Section III: Reported Crime Trends
Part One offense data, as reported by the Kentucky State Police and the Federal Bureau of Investigations Uniform Crime Reporting Program, are provided in the following section. Although law enforcement agencies collect and maintain data on both arrests and offenses reported to the police, researchers generally agree that reported offenses provide a better measure of crime since these reports usually occur closer in time to the actual incidents. While arrests also provide a measure of law enforcement activity, arrests may not be made in all cases and arrests may also reflect specialized enforcement efforts rather than an actual increase in the incidence of crime. In reviewing data on the crime trends, it is important to note the type of data being presented along with the inherent limitations of that data.
• In 2010, the FBI’s Part One Offense rate per 100,000 was 2,794 in Kentucky, as compared to 3,346 in the United States.
• Between 2009 and 2010, the Kentucky State Police calculated that the Part One Offense rate rose 0.67% in
Kentucky.
• Between 2009 and 2010, the offense rate rose for larceny-theft, murder, robbery, burglary, and auto theft. During that same time the offense rate declined for rape, aggravated assault, and arson.
• Between 2007 and 2010, the most significant increase in the Part One offense rate was for rape offenses, which
rose 9.81% during this period.
• Between 2007 and 2010, the most significant decrease in the Part One offense rate was for auto theft, which fell 26.61% during those 4 years.
• Of cities with a population greater than 10,000 people, Newport, Somerset, Ashland, Covington, and Richmond
had the highest rates of Part One offenses. Madisonville, Fort Thomas, Independence, Shelbyville, and Jeffersontown had the lowest Part One offense rates.

Sourcebook of Criminal Justice Statistics in the Commonwealth
39
Figure 3.a: Part One Offense Rate per 100,000 Population, United States and Kentucky, 2000-2010
0
500
1,000
1,500
2,000
2,500
3,000
3,500
4,000
4,500
2000 2001 2002 2003 2004 2005 2006 2007 2008 2009 2010
Year
Part
One
Offen
se R
ate
KentuckyUnited States
Source: Federal Bureau of Investigation and Kentucky State Police
Table 3.1: Part One Offense Rate per 100,000 Population, United States and Kentucky, 2000-2010
Year Kentucky United States 2000 2,948 4,125 2001 2,966 4,163 2002 2,890 4,125 2003 2,777 4,067 2004 2,741 3,977 2005 2,766 3,901 2006 2,795 3,838 2007 2,773 3,749 2008 2,858 3,669 2009 2,777 3,466 2010 2,794 3,346
Source: Federal Bureau of Investigation and Kentucky State Police

Sourcebook of Criminal Justice Statistics in the Commonwealth
40
Table 3.2: Part One Offenses per 100,000 Population, 2007-2010
CY 2007 CY 2008 CY 2009 CY 2010
Percent Change 2009-2010
Percent Change 2007-2010
Kentucky Population 4,241,474 4,269,245 4,314,113 4,339,367 0.59% 2.31%
Number 117,607 122,009 119,785 121,289 1.26% 3.13% Total Part
One Offenses Rate 2,772.79 2,857.86 2,776.58 2,795.09 0.67% 0.80%
Number 201 205 177 180 1.69% -10.45%
Murder Rate 4.74 4.80 4.10 4.15 1.22% -12.45%
Number 1,375 1,451 1,567 1,545 -1.40% 12.36%
Rape Rate 32.42 33.99 36.32 35.60 -1.99% 9.81%
Number 3,943 3,786 3,529 3,732 5.75% -5.35%
Robbery Rate 92.96 88.68 81.80 86.00 5.13% -7.49%
Number 6,618 6,749 6,382 5,691 -10.83% -14.01% Aggravated
Assault Rate 156.03 158.08 147.93 131.15 -11.34% -15.95%
Number 26,748 27,473 28,055 29,170 3.97% 9.05%
Burglary Rate 630.63 643.51 650.31 672.22 3.37% 6.59%
Number 69,805 74,379 73,295 74,185 1.21% 6.27% Larceny-
Theft Rate 1,645.77 1,742.21 1,698.96 1,709.58 0.63% 3.88%
Number 8,091 7,177 6,019 6,075 0.93% -24.92%
Auto Theft Rate 190.76 168.11 139.52 140.00 0.34% -26.61%
Number 826 789 761 711 -6.57% -13.92%
Arson Rate 19.47 18.48 17.64 16.38 -7.14% -15.87%
Source: Kentucky State Police, Crime in Kentucky, and United States Census Bureau

Sourcebook of Criminal Justice Statistics in the Commonwealth
41
Table 3.3: Part One Offense Rate per 1,000 Population for Cities with Over 10,000 Residents, 2010
Jurisdiction
U.S. Census 2010
Population
Number of Part One Offense Arrests
Part One Offense Arrest
Rate per 1,000
Number of Part One Violent Offense Arrests
Part One Violent Offense
Arrest Rate per 1,000
Number of Part One Property
Offense Arrests
Part One Property
Offense Arrest Rate per 1,000
Ashland 21,684 1,546 71.30 34 1.57 1,512 69.73 Bardstown 11,700 395 33.76 19 1.62 376 32.14 Berea 13,561 517 38.12 14 1.03 503 37.09 Bowling Green 58,067 2,825 48.65 122 2.10 2,703 46.55 Covington 40,640 2,644 65.06 140 3.44 2,504 61.61 Danville 16,218 711 43.84 37 2.28 674 41.56 Elizabethtown 28,531 1,045 36.63 31 1.09 1,014 35.54 Erlanger 18,082 745 41.20 28 1.55 717 39.65 Florence 29,951 1,547 51.65 29 0.97 1,518 50.68 Fort Thomas 16,325 245 15.01 6 0.37 239 14.64 Frankfort 25,527 1,030 40.35 34 1.33 996 39.02 Georgetown 29,098 1,134 38.97 108 3.71 1,026 35.26 Glasgow 14,028 376 26.80 20 1.43 356 25.38 Henderson 28,757 1,068 37.14 15 0.52 1,053 36.62 Hopkinsville 31,577 1,353 42.85 104 3.29 1,249 39.55 Independence 24,757 340 13.73 14 0.57 326 13.17 Jeffersontown 26,595 608 22.86 18 0.68 590 22.18
Lawrenceburg 10,505 Not Collected Not
Collected Not
Collected Not
Collected Not Collected Not Collected Lexington-Fayette 295,803 12,789 43.23 1,131 3.82 11,658 39.41
Louisville/Jefferson County Metro 597,337 33,512 56.10 2,128 3.56 31,384 52.54
Lyndon 11,002 Not Collected Not
Collected Not
Collected Not
Collected Not Collected Not Collected Madisonville 19,591 53 2.71 4 0.20 49 2.50 Mayfield 10,024 323 32.22 43 4.29 280 27.93 Murray 17,741 691 38.95 15 0.85 676 38.10 Newport 15,273 1,205 78.90 25 1.64 1,180 77.26 Nicholasville 28,015 1,277 45.58 38 1.36 1,239 44.23 Owensboro 57,265 2,311 40.36 102 1.78 2,209 38.58 Paducah 25,024 1,282 51.23 56 2.24 1,226 48.99 Radcliff 21,688 885 40.81 154 7.10 731 33.71 Richmond 31,364 2,117 67.50 74 2.36 2,043 65.14 Shelbyville 14,045 341 24.28 25 1.78 316 22.50 Shivley 15,264 836 54.77 34 2.23 802 52.54 Somerset 11,196 812 72.53 23 2.05 789 70.47 St. Matthews 17,472 795 45.50 22 1.26 773 44.24 Winchester 18,368 965 52.54 60 3.27 905 49.27 Sources: Kentucky State Police and U.S. Census Bureau

Sourcebook of Criminal Justice Statistics in the Commonwealth
42
Table 3.4: Part One Offense Related Arrests per 100,000 Population, 2007-2010
CY 2007 CY 2008 CY 2009 CY 2010
Percent Change 2009-2010
Percent Change 2007-2010
Kentucky Population 4,241,474 4,269,245 4,314,113 4,339,367 0.59% 2.31%
Number 34,924 37,207 38,626 35,269 -8.69% 0.99% Total Part One
Offenses Rate 823.39 871.51 895.34 812.77 -9.22% -1.29%
Number 316 343 331 352 6.34% 11.39%
Murder Rate 7.45 8.03 7.67 8.11 5.74% 8.86%
Number 834 636 488 596 22.13% -28.54%
Rape Rate 19.66 14.90 11.31 13.73 21.40% -30.16%
Number 1,533 1,848 1,777 1,695 -4.61% 10.57%
Robbery Rate 36.14 43.29 41.19 39.06 -5.17% 8.08%
Number 3,495 4,130 4,282 3,812 -10.98% 9.07% Aggravated Assault Rate 82.40 96.74 99.26 87.85 -11.50% 6.61%
Number 5,053 5,984 6,169 5,865 -4.93% 16.07%
Burglary Rate 119.13 140.17 143.00 135.16 -5.48% 13.46%
Number 17,412 23,046 24,349 21,737 -10.73% 24.84% Larceny-Theft Rate 410.52 539.81 564.40 500.93 -11.25% 22.02%
Number 1,018 955 948 1,003 5.80% -1.47%
Auto Theft Rate 24.00 22.37 21.97 23.11 5.19% -3.71%
Number 212 265 282 209 -25.89% -1.42%
Arson Rate 5.00 6.21 6.54 4.82 -26.30% -3.60% Source: Kentucky State Police and United States Census Bureau

Sourcebook of Criminal Justice Statistics in the Commonwealth
43
Section IV: Arrest Trends
This section presents information on arrest trends in the Commonwealth as reported by the Kentucky State Police. It is important to note that KSP calculates arrest data based on the counts associated with an arrest. For example, if an individual is arrested for burglary and there are three counts, KSP will indicate three arrests for that one incident.
• The adult arrest rate for all Part One offenses increased 36.46% between 2009 and 2010, and 15.27% during the four year period from 2007-2010.
• Between 2009 and 2010, the adult arrest rate for murder, larceny-theft, motor vehicle theft, rape, robbery,
and burglary increased while the arrest rate for aggravated assault and arson decreased.
• In 2010, 78.9% of arrestees were white, 20.8% were African-American, less than 0.2% were Asian/Pacific Islander, and less than 0.1% were American Indian.
• In 2010, 34.7% of arrestees were women. The offense with the largest percentage of women arrested was
larceny-theft (61.6%).

Sourcebook of Criminal Justice Statistics in the Commonwealth
44
Table 4.1: Adult (18 and older) Part One Offense Arrests per 100,000 Adult Population, 2007-2010 CY 2007 CY 2008 CY 2009 CY 2010
Number of Arrests
Arrest Rate per 100,000¹
Number of Arrests
Arrest Rate per 100,000²
Number of Arrests
Arrest Rate per 100,000³
Number of Arrests
Arrest Rate per 100,0004
Percent Change in Rate 2009-
2010
Percent Change in
Rate 2007-2010
Murder 316 9.76 318 9.75 318 9.64 352 10.62 10.17% 8.81% Rape 834 25.76 601 18.43 458 13.88 596 17.97 29.47% -30.24% Robbery 1,533 47.35 1,615 49.52 1,556 47.15 1,695 51.12 8.42% 7.96% Aggravated Assault 3,495 107.95 3,738 114.62 3,880 117.58 3,812 114.96 -2.22% 6.49% Burglary 5,053 156.08 5,060 155.16 5,411 163.98 5,865 176.87 7.86% 13.32% Larceny-Theft 17,412 537.82 19,948 611.68 21,203 642.56 21,737 655.52 2.02% 21.88% Motor Vehicle Theft 1,018 31.44 793 24.32 795 24.09 1,003 30.25 25.57% -3.78% Arson 212 6.55 171 5.24 241 7.30 209 6.30 -13.70% -3.82%
15.27% TOTAL 29,873 922.72 32,244 988.72 33,862 1,026.19 35,269 1,063.60 36.46% Source: Kentucky State Police and U.S. Census Bureau
³ Calculated Using U.S. Census Estimated Adult Population of 3,299,790 4 Calculated Using U.S. Census 2010 Adult Population of 3,315,996
² Calculated Using U.S. Census Estimated Adult Population of 3,261,181 ¹ Calculated Using U.S. Census Estimated Adult Population of 3,237,501

Sourcebook of Criminal Justice Statistics in the Commonwealth
45
Table 4.2: Rate of Part One Offense Arrests by Race, 2010
Offenses
KY Population-White U.S. Census 2010
White Arrests
Rate per 1,000 Whites
KY Population-African American U.S. Census 2010
African American Arrests
Rate per 1,000 African Americans
Murder 3,809,537 292 0.08 337,520 60 0.18
Forcible Rape 3,809,537 476 0.12 337,520 119 0.35
Robbery 3,809,537 917 0.24 337,520 777 2.30 Aggravated Assault 3,809,537 2,698 0.71 337,520 1,098 3.25
Burglary 3,809,537 4,683 1.23 337,520 1,174 3.48
Larceny-Theft (Except Motor Vehicle Theft) 3,809,537 17,753 4.66 337,520 3,916 11.60 Motor Vehicle Theft 3,809,537 828 0.22 337,520 173 0.51
Arson 3,809,537 177 0.05 337,520 31 0.09
PART
ON
E O
FFEN
SES
TOTAL PART ONE ARRESTS 3,809,537 27,824 7.30 337,520 7,348 21.77
* Includes Other/Identified by Two or More Races
Source: Kentucky State Police and United States Census Bureau

Sourcebook of Criminal Justice Statistics in the Commonwealth
46
Table 4.2: Rate of Part One Offense Arrests by Race, 2010, Continued
Offenses
KY Population-American Indian/Alaska Native U.S. Census 2010
American Indian/Alaska Native Arrests
Rate per 1,000 American Indian/Alaska Native
KY Population-Asian/ Pacific Islander U.S. Census 2010
Asian/ Pacific Islander Arrests
Rate per 1,000 Asian/ Pacific Islander
KY Population-Other/ Unknown U.S. Census 2010*
Other/ Unknown Arrests
Rate per 1,000 Other/ Unknown
Murder 10,120 0 0.00 51,431 0 0.00 130,759 0 0.00
Forcible Rape 10,120 0 0.00 51,431 1 0.02 130,759 0 0.00
Robbery 10,120 0 0.00 51,431 1 0.02 130,759 0 0.00 Aggravated Assault 10,120 5 0.49 51,431 11 0.21 130,759 0 0.00
Burglary 10,120 3 0.30 51,431 5 0.10 130,759 0 0.00
Larceny-Theft (Except Motor Vehicle Theft) 10,120 8 0.79 51,431 60 1.17 130,759 0 0.00 Motor Vehicle Theft 10,120 2 0.20 51,431 0 0.00 130,759 0 0.00
Arson 10,120 1 0.10 51,431 0 0.00 130,759 0 0.00
PART
ON
E O
FFEN
SES
TOTAL PART ONE ARRESTS 10,120 19 1.88 51,431 78 1.52 130,759 0 0.00
* Includes Other/Identified by Two or More Races
Source: Kentucky State Police and United States Census Bureau

Sourcebook of Criminal Justice Statistics in the Commonwealth
47
Table 4.3: Rate of Part Two Offense Arrests by Race, 2010
Offenses
KY Population-White U.S. Census 2010
White Arrests
Rate per 1,000 Whites
KY Population-African American U.S. Census 2010
African American Arrests
Rate per 1,000 African Americans
Manslaughter by Negligence 3,809,537 32 0.01 337,520 7 0.02
Other Assaults 3,809,537 20,111 5.28 337,520 4,937 14.63 Forgery and Counterfeiting 3,809,537 5,557 1.46 337,520 1,014 3.00
Fraud 3,809,537 16,926 4.44 337,520 2,250 6.67 Embezzlement 3,809,537 530 0.14 337,520 86 0.25
Stolen Property Offenses 3,809,537 3,833 1.01 337,520 819 2.43
Vandalism 3,809,537 3,871 1.02 337,520 860 2.55 Weapons Offenses 3,809,537 1,840 0.48 337,520 899 2.66
Prostitution and Commercial Vice 3,809,537 278 0.07 337,520 113 0.33
Sex Offenses 3,809,537 2,495 0.65 337,520 263 0.78 Narcotic Drug Offenses 3,809,537 50,349 13.22 337,520 10,924 32.37
Gambling 3,809,537 129 0.03 337,520 5 0.01 Offenses Against Family 3,809,537 7,146 1.88 337,520 1,635 4.84 Driving Under the Influence 3,809,537 27,026 7.09 337,520 2,751 8.15 Liquor Law Offenses 3,809,537 6,187 1.62 337,520 611 1.81
Drunkenness 3,809,537 25,810 6.78 337,520 4,212 12.48 Disorderly Conduct 3,809,537 10,432 2.74 337,520 2,971 8.80 All Other Offenses (Except Traffic) 3,809,537 84,824 22.27 337,520 13,825 40.96 Curfew and Loitering Law Offenses 3,809,537 8 0.00 337,520 1 0.00
Runaways 3,809,537 123 0.03 337,520 51 0.15
PART
TW
O O
FFEN
SES
TOTAL PART TWO ARRESTS 3,809,537 267,507 70.22 337,520 48,234 142.91
* Includes Other/Identified by Two or More Races Source: Kentucky State Police and United States Census Bureau

Sourcebook of Criminal Justice Statistics in the Commonwealth
48
Table 4.3: Rate of Part Two Offense Arrests by Race, 2010, Continued
Offenses
KY Population-American Indian/Alaska Native U.S. Census 2010
American Indian/Alaska Native Arrests
Rate per 1,000 American Indian/Alaska Native
KY Population-Asian/Pacific Islander U.S. Census 2010
Asian/Pacific Islander Arrests
Rate per 1,000 Asian/Pacific Islander
KY Population-Other/Unknown U.S. Census 2010*
Other/Unknown Arrests
Rate per 1,000 Other/Unknown
Manslaughter by Negligence 10,120 0 0.00 51,431 0 0.00 130,759 0 0.00 Other Assaults 10,120 19 1.88 51,431 64 1.24 130,759 0 0.00
Forgery and Counterfeiting 10,120 2 0.20 51,431 18 0.35 130,759 0 0.00
Fraud 10,120 9 0.89 51,431 42 0.82 130,759 0 0.00
Embezzlement 10,120 0 0.00 51,431 3 0.06 130,759 3 0.02 Stolen Property Offenses 10,120 2 0.20 51,431 10 0.19 130,759 0 0.00
Vandalism 10,120 3 0.30 51,431 8 0.16 130,759 0 0.00 Weapons Offenses 10,120 3 0.30 51,431 10 0.19 130,759 0 0.00 Prostitution and Commercial Vice 10,120 0 0.00 51,431 3 0.06 130,759 3 0.02
Sex Offenses 10,120 2 0.20 51,431 3 0.06 130,759 0 0.00
Narcotic Drug Offenses 10,120 29 2.87 51,431 111 2.16 130,759 0 0.00 Gambling 10,120 0 0.00 51,431 2 0.04 130,759 0 0.00
PART
TW
O O
FFEN
SES
Offenses Against Family 10,120 6 0.59 51,431 14 0.27 130,759 20 0.15
* Includes Other/Identified by Two or More Races
Source: Kentucky State Police and United States Census Bureau

Sourcebook of Criminal Justice Statistics in the Commonwealth
49
Table 4.3: Rate of Part Two Offense Arrests by Race, 2010, Continued
Offenses
KY Population-American Indian/Alaska Native U.S. Census 2010
American Indian/Alaska Native Arrests
Rate per 1,000 American Indian/Alaska Native
KY Population-Asian/Pacific Islander U.S. Census 2010
Asian/Pacific Islander Arrests
Rate per 1,000 Asian/Pacific Islander
KY Population-Other/Unknown U.S. Census 2010*
Other/Unknown Arrests
Rate per 1,000 Other/Unknown
Driving Under the Influence 10,120 18 1.78 51,431 122 2.37 130,759 0 0.00
Liquor Law Offenses 10,120 4 0.40 51,431 15 0.29 130,759 20 0.15
Drunkenness 10,120 28 2.77 51,431 68 1.32 130,759 95 0.73
Disorderly Conduct 10,120 5 0.49 51,431 31 0.60 130,759 0 0.00 All Other Offenses (Except Traffic) 10,120 53 5.24 51,431 118 2.29 130,759 0 0.00 Curfew and Loitering Law Offenses 10,120 0 0.00 51,431 0 0.00 130,759 0 0.00
Runaways 10,120 0 0.00 51,431 0 0.00 130,759 0 0.00
PART
TW
O O
FFEN
SES
TOTAL PART TWO ARRESTS 10,120 183 18.08 51,431 642 12.48 130,759 141 1.08
* Includes Other/Identified by Two or More Races Source: Kentucky State Police and United States Census Bureau

Sourcebook of Criminal Justice Statistics in the Commonwealth
50
Table 4.4: Rate of Part One Offense Arrests by Sex, 2010
Offenses
KY Population-
Females U.S. Census 2010
Female Arrests
Rate per 1,000
Females
KY Population-Males U.S.
Census 2010 Male Arrests Rate per
1,000 Males Offenders of Unknown Sex
Kentucky Total
Population
Total Number of
Arrests
Rate Per 1,000
Kentucky Residents
Murder 2,204,415 52 0.02 2,134,952 300 0.14 0 4,339,367 352 0.08
Forcible Rape 2,204,415 27 0.01 2,134,952 569 0.27 0 4,339,367 596 0.14
Robbery 2,204,415 244 0.11 2,134,952 1,450 0.68 1 4,339,367 1,694 0.39 Aggravated Assault 2,204,415 811 0.37 2,134,952 3,000 1.41 1 4,339,367 3,811 0.88
Burglary 2,204,415 819 0.37 2,134,952 5,040 2.36 6 4,339,367 5,859 1.35
Larceny-Theft (Except Motor Vehicle Theft) 2,204,415 10,077 4.57 2,134,952 11,649 5.46 11 4,339,367 21,726 5.01 Motor Vehicle Theft 2,204,415 166 0.08 2,134,952 835 0.39 2 4,339,367 1,001 0.23
Arson 2,204,415 33 0.01 2,134,952 176 0.08 0 4,339,367 209 0.05 TOTAL PART ONE ARRESTS 2,204,415 12,229 5.55 2,134,952 23,019 10.78 21 4,339,367 35,248 8.12
* Includes Other/Identified by Two or More Races
Source: Kentucky State Police and United States Census Bureau
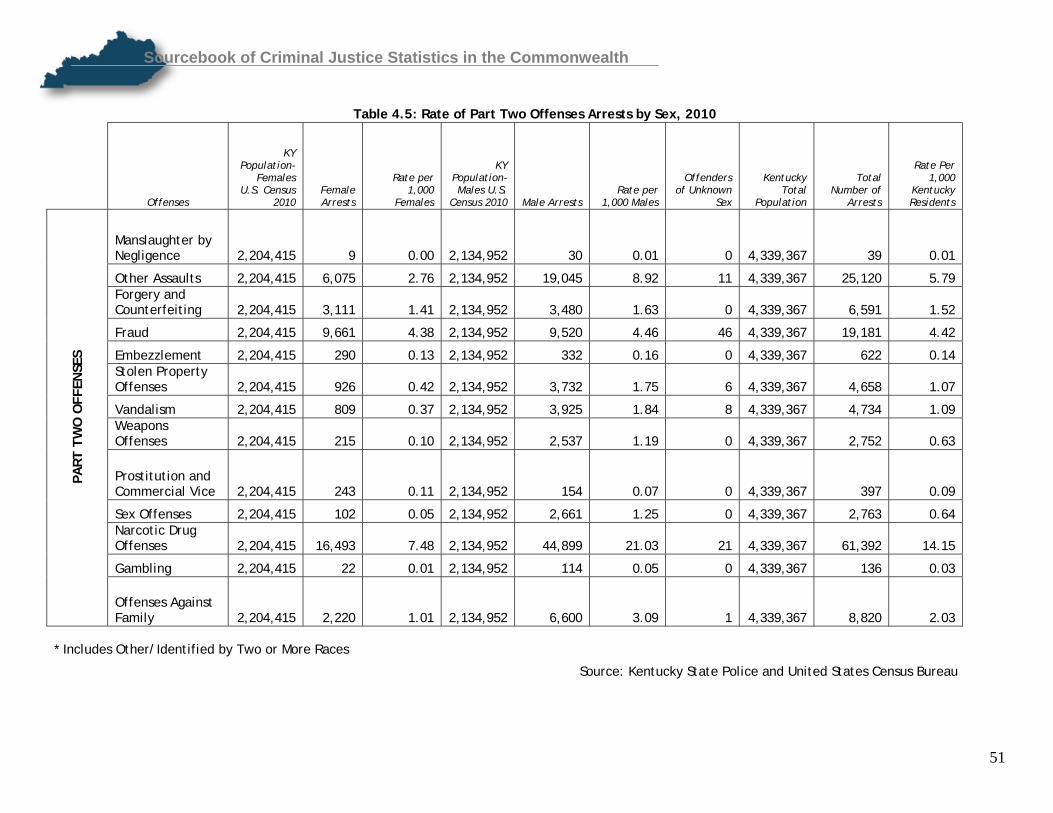
Sourcebook of Criminal Justice Statistics in the Commonwealth
51
Table 4.5: Rate of Part Two Offenses Arrests by Sex, 2010
Offenses
KY Population-
Females U.S. Census
2010 Female Arrests
Rate per 1,000
Females
KY Population-Males U.S.
Census 2010 Male Arrests Rate per
1,000 Males
Offenders of Unknown
Sex
Kentucky Total
Population
Total Number of
Arrests
Rate Per 1,000
Kentucky Residents
Manslaughter by Negligence 2,204,415 9 0.00 2,134,952 30 0.01 0 4,339,367 39 0.01
Other Assaults 2,204,415 6,075 2.76 2,134,952 19,045 8.92 11 4,339,367 25,120 5.79 Forgery and Counterfeiting 2,204,415 3,111 1.41 2,134,952 3,480 1.63 0 4,339,367 6,591 1.52
Fraud 2,204,415 9,661 4.38 2,134,952 9,520 4.46 46 4,339,367 19,181 4.42
Embezzlement 2,204,415 290 0.13 2,134,952 332 0.16 0 4,339,367 622 0.14 Stolen Property Offenses 2,204,415 926 0.42 2,134,952 3,732 1.75 6 4,339,367 4,658 1.07
Vandalism 2,204,415 809 0.37 2,134,952 3,925 1.84 8 4,339,367 4,734 1.09 Weapons Offenses 2,204,415 215 0.10 2,134,952 2,537 1.19 0 4,339,367 2,752 0.63
Prostitution and Commercial Vice 2,204,415 243 0.11 2,134,952 154 0.07 0 4,339,367 397 0.09
Sex Offenses 2,204,415 102 0.05 2,134,952 2,661 1.25 0 4,339,367 2,763 0.64 Narcotic Drug Offenses 2,204,415 16,493 7.48 2,134,952 44,899 21.03 21 4,339,367 61,392 14.15
Gambling 2,204,415 22 0.01 2,134,952 114 0.05 0 4,339,367 136 0.03
PART
TW
O O
FFEN
SES
Offenses Against Family 2,204,415 2,220 1.01 2,134,952 6,600 3.09 1 4,339,367 8,820 2.03
* Includes Other/Identified by Two or More Races
Source: Kentucky State Police and United States Census Bureau

Sourcebook of Criminal Justice Statistics in the Commonwealth
52
Table 4.5: Rate of Part Two Offense Arrests by Sex, 2010, Continued
Offenses
KY Population-
Females U.S. Census 2010
Female Arrests
Rate per 1,000
Females
KY Population-Males U.S.
Census 2010 Male
Arrests Rate per
1,000 Males
Offenders of Unknown
Sex
Kentucky Total
Population
Total Number of
Arrests
Rate Per 1,000
Kentucky Residents
Driving Under the Influence 2,204,415 6,782 3.08 2,134,952 23,131 10.83 4 4,339,367 29,913 6.89 Liquor Law Offenses 2,204,415 1,368 0.62 2,134,952 5,467 2.56 2 4,339,367 6,835 1.58
Drunkenness 2,204,415 6,118 2.78 2,134,952 24,082 11.28 13 4,339,367 30,200 6.96 Disorderly Conduct 2,204,415 3,813 1.73 2,134,952 9,623 4.51 3 4,339,367 13,436 3.10 All Other Offenses (Except Traffic) 2,204,415 25,951 11.77 2,134,952 72,814 34.11 55 4,339,367 98,765 22.76 Curfew and Loitering Law Offenses 2,204,415 3 0.00 2,134,952 6 0.00 0 4,339,367 9 0.00
Runaways 2,204,415 89 0.04 2,134,952 85 0.04 0 4,339,367 174 0.04
PART
TW
O O
FFEN
SES
TOTAL PART TWO ARRESTS 2,204,415 84,300 38.24 2,134,952 232,237 108.78 170 4,339,367 316,537 72.95
* Includes Other/Identified by Two or More Races
Source: Kentucky State Police and United States Census Bureau

Sourcebook of Criminal Justice Statistics in the Commonwealth
53
Table 4.6: Rate of Part One Offense Arrests by Age, 2010
PART I CRIME ARRESTS 18-23 24-29 30-34 35-39 40-44 45-49 50-54 55-59 60-64
65 & OVER UNK
TOTAL ADULT
Murder 70 70 40 46 23 35 19 12 21 8 0 344
Forcible Rape 118 124 79 63 41 87 19 9 19 5 0 564
Robbery 661 306 167 115 89 70 32 18 4 4 1 1,467
Aggravated Assault 823 769 567 369 330 259 180 79 44 43 0 3,463
Burglary 2,013 1,135 709 477 356 288 139 67 12 14 0 5,210 Larceny-Theft (Except Motor Vehicle Theft) 5,825 4,067 2,845 2,055 1,497 1,339 815 545 175 228 0 19,391 Motor Vehicle Theft 274 189 124 88 72 71 29 15 4 2 0 868
Arson 52 22 24 20 14 20 4 2 2 3 0 163
PART
ON
E O
FFEN
SES
TOTAL PART ONE ARRESTS 9,836 6,682 4,555 3,233 2,422 2,169 1,237 747 281 307 1 31,470
Source: Kentucky State Police

Sourcebook of Criminal Justice Statistics in the Commonwealth
54
Table 4.7: Rate of Part Two Offense Arrests by Age, 2010
PART II CRIME ARRESTS 18-23 24-29 30-34 35-39 40-44 45-49 50-54 55-59 60-64
65 & OVER UNK
TOTAL ADULT
Manslaughter by Negligence 11 8 6 4 4 4 0 2 0 0 0 39
Other Assaults 4,871 4,617 3,581 2,837 2,497 1,993 1,250 672 357 327 49 23,051
Forgery and Counterfeiting 1,516 1,858 1,034 698 534 482 296 72 20 40 7 6,557 Fraud 2,069 3,760 3,409 3,029 2,320 2,026 1,019 547 368 555 54 19,156 Embezzlement 46 77 81 126 133 54 53 22 6 15 2 615
Stolen Property Offenses 1,467 997 636 419 325 242 138 78 25 35 5 4,367
Vandalism 1,452 852 547 357 337 208 131 58 35 33 0 4,010
Weapons Offenses 670 566 359 288 264 183 139 97 32 51 0 2,649
Prostitution and Commercial Vice 58 69 70 48 52 42 33 11 6 7 0 396
Sex Offenses 502 279 338 266 286 238 143 147 211 121 0 2,531
Narcotic Drug Offenses 15,210 12,842 9,613 6,989 5,265 4,478 2,845 1,351 440 282 41 59,356
Gambling 7 5 33 31 5 7 9 20 6 11 0 134
PART
TW
O O
FFEN
SES
Offenses Against Family 1,731 1,891 1,622 1,315 957 657 338 199 61 33 0 8,804

Sourcebook of Criminal Justice Statistics in the Commonwealth
55
Table 4.7: Rate of Part Two Offense Arrests by Age, 2010, Continued
PART II CRIME ARRESTS 18-23 24-29 30-34 35-39 40-44 45-49 50-54 55-59 60-64
65 & OVER UNK
TOTAL ADULT
Driving Under the Influence 5,240 5,849 4,403 3,568 3,236 3,096 2,238 1,113 587 428 0 29,758 Liquor Law Offenses 2,348 913 673 655 564 570 421 226 108 72 0 6,550
Drunkenness 5,718 5,353 4,003 3,335 3,211 3,543 2,524 1,269 453 284 0 29,693
Disorderly Conduct 3,064 2,611 1,681 1,249 1,124 1,013 654 389 183 194 65 12,227
All Other Offenses (Except Traffic) 17,134 24,065 17,800 13,076 9,554 7,258 4,197 2,022 905 768 0 96,779 Curfew and Loitering Law Offenses 2 0 0 2 0 1 0 1 0 0 0 6 Runaways 22 0 0 0 0 0 0 0 0 0 0 22
PART
TW
O O
FFEN
SES
TOTAL PART TWO ARRESTS 63,138 66,612 49,889 38,292 30,668 26,095 16,428 8,296 3,803 3,256 223 306,700
TOTAL CRIME ARRESTS 72,974 73,294 54,444 41,525 33,090 28,264 17,665 9,043 4,084 3,563 224 338,170
Source: Kentucky State Police

Sourcebook of Criminal Justice Statistics in the Commonwealth
56
Table 4.8: Rate of Adult Part One Offense Arrests per 1,000 Population by County, 2010
County
2010 Census Population
Adult Part One Offense Arrests Population/1,000
Rate of Part One Offense Arrests/1,000
Adair County 18,656 14 18.66 0.75 Allen County 19,956 79 19.96 3.96 Anderson County 21,421 94 21.42 4.39 Ballard County 8,249 121 8.25 14.67 Barren County 42,173 302 42.17 7.16 Bath County 11,591 66 11.59 5.69 Bell County 28,691 347 28.69 12.09 Boone County 118,811 882 118.81 7.42 Bourbon County 19,985 134 19.99 6.71 Boyd County 49,542 649 49.54 13.10 Boyle County 28,432 261 28.43 9.18 Bracken County 8,488 25 8.49 2.95 Breathitt County 13,878 50 13.88 3.60 Breckinridge County 20,059 47 20.06 2.34 Bullitt County 74,319 279 74.32 3.75 Butler County 12,690 63 12.69 4.96 Caldwell County 12,984 135 12.98 10.40 Calloway County 37,191 243 37.19 6.53 Campbell County 90,336 491 90.34 5.44 Carlisle County 5,104 17 5.10 3.33 Carroll County 10,811 32 10.81 2.96 Carter County 27,720 133 27.72 4.80 Casey County 15,955 138 15.96 8.65 Christian County 73,955 640 73.96 8.65 Clark County 35,613 384 35.61 10.78 Clay County 21,730 105 21.73 4.83 Clinton County 10,272 4 10.27 0.39 Crittenden County 9,315 53 9.32 5.69 Cumberland County 6,856 29 6.86 4.23 Daviess County 96,656 801 96.66 8.29

Sourcebook of Criminal Justice Statistics in the Commonwealth
57
Table 4.8: Rate of Adult Part One Offense Arrests per 1,000 Population by County, 2010, Continued
County
2010 Census Population
Adult Part One Offense Arrests Population/1,000
Rate of Part One Offense Arrests/1,000
Edmonson County 12,161 51 12.16 4.19 Elliott County 7,852 16 7.85 2.04 Estill County 14,672 45 14.67 3.07 Fayette County 295,803 1,110 295.80 3.75 Fleming County 14,348 56 14.35 3.90 Floyd County 39,451 259 39.45 6.57 Franklin County 49,285 424 49.29 8.60 Fulton County 6,813 102 6.81 14.97 Gallatin County 8,589 27 8.59 3.14 Garrard County 16,912 63 16.91 3.73 Grant County 24,662 137 24.66 5.56 Graves County 37,121 297 37.12 8.00 Grayson County 25,746 105 25.75 4.08 Green County 11,258 24 11.26 2.13 Greenup County 36,910 70 36.91 1.90 Hancock County 8,565 17 8.57 1.98 Hardin County 105,543 624 105.54 5.91 Harlan County 29,278 262 29.28 8.95 Harrison County 18,846 146 18.85 7.75 Hart County 18,199 116 18.20 6.37 Henderson County 46,250 414 46.25 8.95 Henry County 15,416 47 15.42 3.05 Hickman County 4,902 13 4.90 2.65 Hopkins County 46,920 383 46.92 8.16 Jackson County 13,494 52 13.49 3.85 Jefferson County 741,096 8,440 741.10 11.39 Jessamine County 48,586 312 48.59 6.42 Johnson County 23,356 233 23.36 9.98 Kenton County 159,720 342 159.72 2.14 Knott County 16,346 160 16.35 9.79

Sourcebook of Criminal Justice Statistics in the Commonwealth
58
Table 4.8: Rate of Adult Part One Offense Arrests per 1,000 Population by County, 2010, Continued
County
2010 Census Population
Adult Part One Offense Arrests Population/1,000
Rate of Part One Offense Arrests/1,000
Knox County 31,883 169 31.88 5.30 Larue County 14,193 135 14.19 9.51 Laurel County 58,849 440 58.85 7.48 Lawrence County 15,860 71 15.86 4.48 Lee County 7,887 54 7.89 6.85 Leslie County 11,310 7 11.31 0.62 Letcher County 24,519 158 24.52 6.44 Lewis County 13,870 31 13.87 2.24 Lincoln County 24,742 166 24.74 6.71 Livingston County 9,519 36 9.52 3.78 Logan County 26,835 241 26.84 8.98 Lyon County 8,314 47 8.31 5.65 Madison County 82,916 714 82.92 8.61 Magoffin County 13,333 21 13.33 1.58 Marion County 19,820 147 19.82 7.42 Marshall County 31,448 203 31.45 6.46 Martin County 12,929 60 12.93 4.64 Mason County 17,490 165 17.49 9.43 McCracken County 65,565 603 65.57 9.20 McCreary County 18,306 122 18.31 6.66 McLean County 9,531 22 9.53 2.31 Meade County 28,602 147 28.60 5.14 Menifee County 6,306 12 6.31 1.90 Mercer County 21,331 62 21.33 2.91 Metcalfe County 10,099 30 10.10 2.97 Monroe County 10,963 56 10.96 5.11 Montgomery County 26,499 242 26.50 9.13 Morgan County 13,923 50 13.92 3.59 Muhlenberg County 31,499 151 31.50 4.79 Nelson County 43,437 380 43.44 8.75

Sourcebook of Criminal Justice Statistics in the Commonwealth
59
Table 4.8: Rate of Adult Part One Offense Arrests per 1,000 Population by County, 2010, Continued
County
2010 Census Population
Adult Part One Offense Arrests Population/1,000
Rate of Part One Offense Arrests/1,000
Nicholas County 7,135 45 7.14 6.31 Ohio County 23,842 351 23.84 14.72 Oldham County 60,316 189 60.32 3.13 Owen County 10,841 22 10.84 2.03 Owsley County 4,755 69 4.76 14.51 Pendleton County 14,877 67 14.88 4.50 Perry County 28,712 330 28.71 11.49 Pike County 65,024 575 65.02 8.84 Powell County 12,613 92 12.61 7.29 Pulaski County 63,063 572 63.06 9.07 Robertson County 2,282 2 2.28 0.88 Rockcastle County 17,056 188 17.06 11.02 Rowan County 23,333 220 23.33 9.43 Russell County 17,565 61 17.57 3.47 Scott County 47,173 93 47.17 1.97 Shelby County 42,074 280 42.07 6.65 Simpson County 17,327 76 17.33 4.39 Spencer County 17,061 60 17.06 3.52 Taylor County 24,512 239 24.51 9.75 Todd County 12,460 60 12.46 4.82 Trigg County 14,339 99 14.34 6.90 Trimble County 8,809 30 8.81 3.41 Union County 15,007 136 15.01 9.06 Warren County 113,792 809 113.79 7.11 Washington County 11,717 38 11.72 3.24 Wayne County 20,813 210 20.81 10.09 Webster County 13,621 80 13.62 5.87 Whitley County 35,637 144 35.64 4.04 Wolfe County 7,355 24 7.36 3.26 Woodford County 24,939 87 24.94 3.49
STATEWIDE TOTAL 4,339,367 30,955 4,339.37 7.13
Source: Kentucky State Police and U.S. Census Bureau

Sourcebook of Criminal Justice Statistics in the Commonwealth
60
Table 4.9: Rate of Property Offense Arrests per 1,000 Population by County, 2010
County 2010 Census Population
Property Offense Arrests Population/1,000
Rate of Property Offense Arrests/1,000
Adair County 18,656 20 18.66 1.07 Allen County 19,956 119 19.96 5.96 Anderson County 21,421 272 21.42 12.70 Ballard County 8,249 276 8.25 33.46 Barren County 42,173 710 42.17 16.84 Bath County 11,591 202 11.59 17.43 Bell County 28,691 556 28.69 19.38 Boone County 118,811 1,439 118.81 12.11 Bourbon County 19,985 355 19.99 17.76 Boyd County 49,542 1,157 49.54 23.35 Boyle County 28,432 464 28.43 16.32 Bracken County 8,488 103 8.49 12.13 Breathitt County 13,878 76 13.88 5.48 Breckinridge County 20,059 209 20.06 10.42 Bullitt County 74,319 612 74.32 8.23 Butler County 12,690 111 12.69 8.75 Caldwell County 12,984 392 12.98 30.19 Calloway County 37,191 888 37.19 23.88 Campbell County 90,336 769 90.34 8.51 Carlisle County 5,104 53 5.10 10.38 Carroll County 10,811 69 10.81 6.38 Carter County 27,720 155 27.72 5.59 Casey County 15,955 325 15.96 20.37 Christian County 73,955 1,363 73.96 18.43 Clark County 35,613 727 35.61 20.41 Clay County 21,730 146 21.73 6.72 Clinton County 10,272 6 10.27 0.58 Crittenden County 9,315 307 9.32 32.96 Cumberland County 6,856 102 6.86 14.88 Daviess County 96,656 2,334 96.66 24.15
includes: Robbery, Burglary, Larceny, Auto Theft, Arson, Forgery and Counterfeiting, Fraud/Embezzlement, Stolen Property Offenses, and Vandalism.

Sourcebook of Criminal Justice Statistics in the Commonwealth
61
Table 4.9: Rate of Property Offense Arrests per 1,000 Population by County, 2010, Continued
County
2010 Census Population
Property Offense Arrests Population/1,000
Rate of Property Offense Arrests/1,000
Edmonson County 12,161 47 12.16 3.86 Elliott County 7,852 27 7.85 3.44 Estill County 14,672 75 14.67 5.11 Fayette County 295,803 1,452 295.80 4.91 Fleming County 14,348 117 14.35 8.15 Floyd County 39,451 313 39.45 7.93 Franklin County 49,285 960 49.29 19.48 Fulton County 6,813 243 6.81 35.67 Gallatin County 8,589 57 8.59 6.64 Garrard County 16,912 227 16.91 13.42 Grant County 24,662 243 24.66 9.85 Graves County 37,121 843 37.12 22.71 Grayson County 25,746 604 25.75 23.46 Green County 11,258 47 11.26 4.17 Greenup County 36,910 100 36.91 2.71 Hancock County 8,565 22 8.57 2.57 Hardin County 105,543 2,140 105.54 20.28 Harlan County 29,278 441 29.28 15.06 Harrison County 18,846 397 18.85 21.07 Hart County 18,199 509 18.20 27.97 Henderson County 46,250 1,450 46.25 31.35 Henry County 15,416 129 15.42 8.37 Hickman County 4,902 12 4.90 2.45 Hopkins County 46,920 1,268 46.92 27.02 Jackson County 13,494 44 13.49 3.26 Jefferson County 741,096 10,810 741.10 14.59 Jessamine County 48,586 582 48.59 11.98 Johnson County 23,356 284 23.36 12.16 Kenton County 159,720 1,582 159.72 9.90 Knott County 16,346 261 16.35 15.97
includes: Robbery, Burglary, Larceny, Auto Theft, Arson, Forgery and Counterfeiting, Fraud/Embezzlement, Stolen Property Offenses, and Vandalism.

Sourcebook of Criminal Justice Statistics in the Commonwealth
62
Table 4.9: Rate of Property Offense Arrests per 1,000 Population by County,
2010, Continued
County
2010 Census Population
Property Offense Arrests Population/1,000
Rate of Property Offense Arrests/1,000
Knox County 31,883 243 31.88 7.62 Larue County 14,193 363 14.19 25.58 Laurel County 58,849 945 58.85 16.06 Lawrence County 15,860 103 15.86 6.49 Lee County 7,887 79 7.89 10.02 Leslie County 11,310 11 11.31 0.97 Letcher County 24,519 328 24.52 13.38 Lewis County 13,870 46 13.87 3.32 Lincoln County 24,742 356 24.74 14.39 Livingston County 9,519 156 9.52 16.39 Logan County 26,835 622 26.84 23.18 Lyon County 8,314 63 8.31 7.58 Madison County 82,916 1,466 82.92 17.68 Magoffin County 13,333 24 13.33 1.80 Marion County 19,820 464 19.82 23.41 Marshall County 31,448 559 31.45 17.78 Martin County 12,929 70 12.93 5.41 Mason County 17,490 320 17.49 18.30 McCracken County 65,565 1,921 65.57 29.30 McCreary County 18,306 258 18.31 14.09 McLean County 9,531 262 9.53 27.49 Meade County 28,602 611 28.60 21.36 Menifee County 6,306 13 6.31 2.06 Mercer County 21,331 110 21.33 5.16 Metcalfe County 10,099 236 10.10 23.37 Monroe County 10,963 69 10.96 6.29 Montgomery County 26,499 818 26.50 30.87 Morgan County 13,923 71 13.92 5.10 Muhlenberg County 31,499 322 31.50 10.22 Nelson County 43,437 786 43.44 18.10
includes: Robbery, Burglary, Larceny, Auto Theft, Arson, Forgery and Counterfeiting, Fraud/Embezzlement, Stolen Property Offenses, and Vandalism.
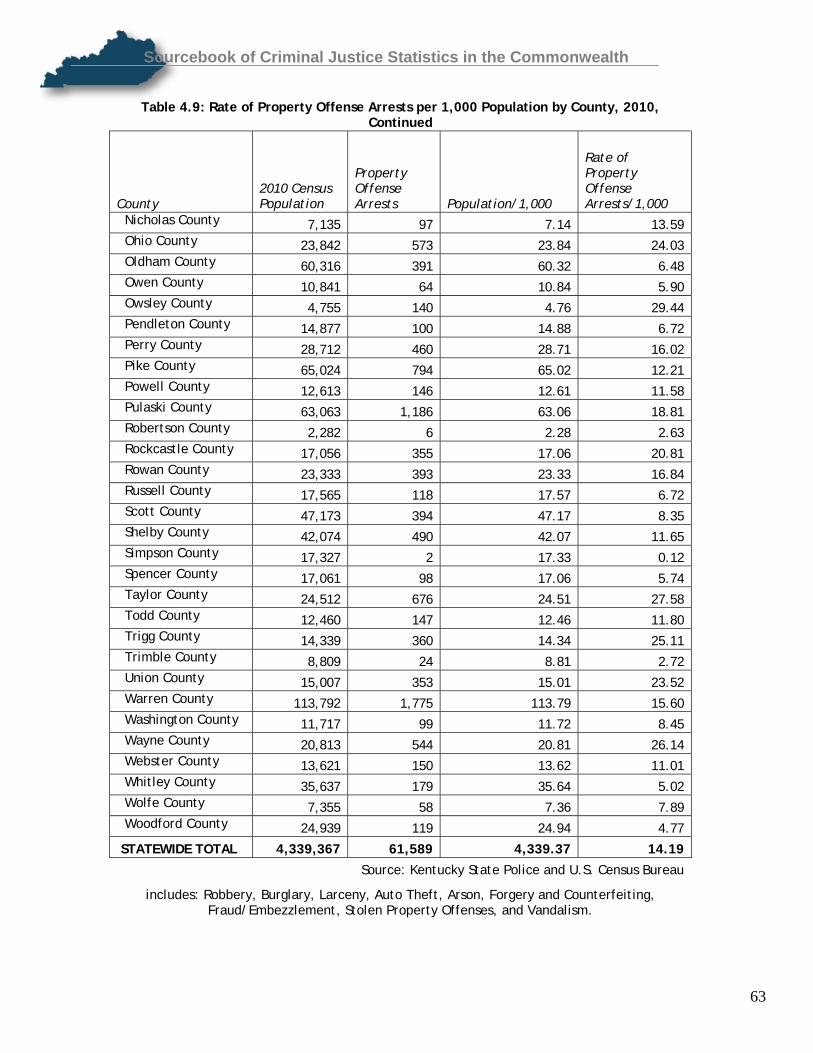
Sourcebook of Criminal Justice Statistics in the Commonwealth
63
Table 4.9: Rate of Property Offense Arrests per 1,000 Population by County, 2010,
Continued
County 2010 Census Population
Property Offense Arrests Population/1,000
Rate of Property Offense Arrests/1,000
Nicholas County 7,135 97 7.14 13.59 Ohio County 23,842 573 23.84 24.03 Oldham County 60,316 391 60.32 6.48 Owen County 10,841 64 10.84 5.90 Owsley County 4,755 140 4.76 29.44 Pendleton County 14,877 100 14.88 6.72 Perry County 28,712 460 28.71 16.02 Pike County 65,024 794 65.02 12.21 Powell County 12,613 146 12.61 11.58 Pulaski County 63,063 1,186 63.06 18.81 Robertson County 2,282 6 2.28 2.63 Rockcastle County 17,056 355 17.06 20.81 Rowan County 23,333 393 23.33 16.84 Russell County 17,565 118 17.57 6.72 Scott County 47,173 394 47.17 8.35 Shelby County 42,074 490 42.07 11.65 Simpson County 17,327 2 17.33 0.12 Spencer County 17,061 98 17.06 5.74 Taylor County 24,512 676 24.51 27.58 Todd County 12,460 147 12.46 11.80 Trigg County 14,339 360 14.34 25.11 Trimble County 8,809 24 8.81 2.72 Union County 15,007 353 15.01 23.52 Warren County 113,792 1,775 113.79 15.60 Washington County 11,717 99 11.72 8.45 Wayne County 20,813 544 20.81 26.14 Webster County 13,621 150 13.62 11.01 Whitley County 35,637 179 35.64 5.02 Wolfe County 7,355 58 7.36 7.89 Woodford County 24,939 119 24.94 4.77
STATEWIDE TOTAL 4,339,367 61,589 4,339.37 14.19
Source: Kentucky State Police and U.S. Census Bureau
includes: Robbery, Burglary, Larceny, Auto Theft, Arson, Forgery and Counterfeiting, Fraud/Embezzlement, Stolen Property Offenses, and Vandalism.

Sourcebook of Criminal Justice Statistics in the Commonwealth
64
Table 4.10: Rate of Adult Violent Offense Arrests per 1,000 Population by County, 2010
County 2010 Census Population
Adult Violent Offense Arrests Population/1,000
Rate of Violent Offense Arrests/1,000
Adair County 18,656 20 18.66 1.07 Allen County 19,956 187 19.96 9.37 Anderson County 21,421 123 21.42 5.74 Ballard County 8,249 48 8.25 5.82 Barren County 42,173 577 42.17 13.68 Bath County 11,591 65 11.59 5.61 Bell County 28,691 269 28.69 9.38 Boone County 118,811 437 118.81 3.68 Bourbon County 19,985 134 19.99 6.71 Boyd County 49,542 222 49.54 4.48 Boyle County 28,432 165 28.43 5.80 Bracken County 8,488 35 8.49 4.12 Breathitt County 13,878 45 13.88 3.24 Breckinridge County 20,059 82 20.06 4.09 Bullitt County 74,319 500 74.32 6.73 Butler County 12,690 102 12.69 8.04 Caldwell County 12,984 149 12.98 11.48 Calloway County 37,191 201 37.19 5.40 Campbell County 90,336 349 90.34 3.86 Carlisle County 5,104 28 5.10 5.49 Carroll County 10,811 61 10.81 5.64 Carter County 27,720 97 27.72 3.50 Casey County 15,955 110 15.96 6.89 Christian County 73,955 783 73.96 10.59 Clark County 35,613 216 35.61 6.07 Clay County 21,730 90 21.73 4.14 Clinton County 10,272 7 10.27 0.68 Crittenden County 9,315 75 9.32 8.05 Cumberland County 6,856 45 6.86 6.56 Daviess County 96,656 667 96.66 6.90

Sourcebook of Criminal Justice Statistics in the Commonwealth
65
Table 4.10: Rate of Adult Violent Offense Arrests per 1,000 Population by County, 2010, Continued
County 2010 Census Population
Adult Violent Offense Arrests Population/1,000
Rate of Violent Offense Arrests/1,000
Edmonson County 12,161 84 12.16 6.91
Elliott County 7,852 15 7.85 1.91
Estill County 14,672 61 14.67 4.16
Fayette County 295,803 588 295.80 1.99
Fleming County 14,348 53 14.35 3.69
Floyd County 39,451 260 39.45 6.59
Franklin County 49,285 390 49.29 7.91
Fulton County 6,813 197 6.81 28.92
Gallatin County 8,589 70 8.59 8.15
Garrard County 16,912 104 16.91 6.15
Grant County 24,662 118 24.66 4.78
Graves County 37,121 450 37.12 12.12
Grayson County 25,746 205 25.75 7.96
Green County 11,258 52 11.26 4.62
Greenup County 36,910 108 36.91 2.93
Hancock County 8,565 46 8.57 5.37
Hardin County 105,543 597 105.54 5.66
Harlan County 29,278 384 29.28 13.12
Harrison County 18,846 145 18.85 7.69
Hart County 18,199 139 18.20 7.64
Henderson County 46,250 541 46.25 11.70
Henry County 15,416 97 15.42 6.29
Hickman County 4,902 25 4.90 5.10
Hopkins County 46,920 434 46.92 9.25
Jackson County 13,494 73 13.49 5.41
Jefferson County 741,096 5,406 741.10 7.29
Jessamine County 48,586 327 48.59 6.73
Johnson County 23,356 254 23.36 10.88
Kenton County 159,720 798 159.72 5.00
Knott County 16,346 202 16.35 12.36

Sourcebook of Criminal Justice Statistics in the Commonwealth
66
Table 4.10: Rate of Adult Violent Offense Arrests per 1,000 Population by County, 2010, Continued
County 2010 Census Population
Adult Violent Offense Arrests Population/1,000
Rate of Violent Offense Arrests/1,000
Knox County 31,883 72 31.88 2.26
Larue County 14,193 138 14.19 9.72
Laurel County 58,849 263 58.85 4.47
Lawrence County 15,860 75 15.86 4.73
Lee County 7,887 42 7.89 5.33
Leslie County 11,310 19 11.31 1.68
Letcher County 24,519 209 24.52 8.52
Lewis County 13,870 42 13.87 3.03
Lincoln County 24,742 198 24.74 8.00
Livingston County 9,519 70 9.52 7.35
Logan County 26,835 263 26.84 9.80
Lyon County 8,314 32 8.31 3.85
Madison County 82,916 612 82.92 7.38
Magoffin County 13,333 27 13.33 2.03
Marion County 19,820 213 19.82 10.75
Marshall County 31,448 186 31.45 5.91
Martin County 12,929 101 12.93 7.81
Mason County 17,490 148 17.49 8.46
McCracken County 65,565 546 65.57 8.33
McCreary County 18,306 162 18.31 8.85
McLean County 9,531 38 9.53 3.99
Meade County 28,602 117 28.60 4.09
Menifee County 6,306 41 6.31 6.50
Mercer County 21,331 102 21.33 4.78
Metcalfe County 10,099 65 10.10 6.44
Monroe County 10,963 63 10.96 5.75
Montgomery County 26,499 130 26.50 4.91
Morgan County 13,923 63 13.92 4.52
Muhlenberg County 31,499 309 31.50 9.81
Nelson County 43,437 351 43.44 8.08

Sourcebook of Criminal Justice Statistics in the Commonwealth
67
Table 4.10: Rate of Adult Violent Offense Arrests per 1,000 Population by County, 2010, Continued
County 2010 Census Population
Adult Violent Offense Arrests Population/1,000
Rate of Violent Offense Arrests/1,000
Nicholas County 7,135 58 7.14 8.13 Ohio County 23,842 303 23.84 12.71 Oldham County 60,316 212 60.32 3.51 Owen County 10,841 47 10.84 4.34 Owsley County 4,755 59 4.76 12.41 Pendleton County 14,877 88 14.88 5.92 Perry County 28,712 182 28.71 6.34 Pike County 65,024 381 65.02 5.86 Powell County 12,613 40 12.61 3.17 Pulaski County 63,063 194 63.06 3.08 Robertson County 2,282 10 2.28 4.38 Rockcastle County 17,056 193 17.06 11.32 Rowan County 23,333 139 23.33 5.96 Russell County 17,565 60 17.57 3.42 Scott County 47,173 113 47.17 2.40 Shelby County 42,074 253 42.07 6.01 Simpson County 17,327 98 17.33 5.66 Spencer County 17,061 59 17.06 3.46 Taylor County 24,512 194 24.51 7.91 Todd County 12,460 71 12.46 5.70 Trigg County 14,339 120 14.34 8.37 Trimble County 8,809 72 8.81 8.17 Union County 15,007 164 15.01 10.93 Warren County 113,792 905 113.79 7.95 Washington County 11,717 71 11.72 6.06 Wayne County 20,813 256 20.81 12.30 Webster County 13,621 101 13.62 7.42 Whitley County 35,637 105 35.64 2.95 Wolfe County 7,355 32 7.36 4.35 Woodford County 24,939 72 24.94 2.89
STATEWIDE TOTAL 4,339,367 27,461 4,339.37 6.33
Source: Kentucky State Police and U.S. Census Bureau

Sourcebook of Criminal Justice Statistics in the Commonwealth
68
Table 4.11: Part One Offense Arrest Rate Per 100,000 Population-Kentucky and Surrounding States, 2007-2010
State
Part One Offense Arrest Rate per 100,000- CY 2007
Part One Offense Arrest Rate per 100,000- CY 2008
Part One Offense Arrest Rate per 100,000- CY 2009
Part One Offense Arrest Rate per 100,000- CY 2010*
Percent Change CY 2007-2010
Percent Change CY 2009-2010
Kentucky 2,772.8 2,857.9 2,776.6 2,793.9 0.76% 0.62%
Illinois 3,469.0 3,458.0 3,234.1 3,116.2 -10.18% -3.65%
Indiana 3,730.2 3,669.6 3,449.4 3,356.8 -10.02% -2.68%
Missouri 4,243.3 4,168.1 3,877.1 3,801.5 -10.42% -1.90%
Ohio 3,798.4 3,759.9 3,603.0 3,560.4 -6.27% -1.20%
Tennessee 4,841.9 4,765.0 4,421.8 4,271.2 -11.79% -3.40%
Virginia 2,736.1 2,774.0 2,655.6 2,540.7 -7.15% -4.33%
West Virginia 2,800.2 2,842.4 2,823.2 2,554.3 -8.79% -9.52%
UNITED STATES TOTAL PART ONE ARRESTS 3,730.4 3,667.0 3,465.5 3,345.5 -10.32% -3.46%
Source: Federal Bureau of Investigation
* FBI used 2010 estimated population of 3,042,574

Sourcebook of Criminal Justice Statistics in the Commonwealth
69
Table 4.12: Violent Offense Arrest Rate Per 100,000 Population-Kentucky and Surrounding States, 2007-2010
State
Violent Offense Arrest Rate per 100,000- CY 2007
Violent Offense Arrest Rate per 100,000- CY 2008
Violent Offense Arrest Rate per 100,000- CY 2009
Violent Offense Arrest Rate per 100,000- CY 2010*
Percent Change CY 2007-2010
Percent Change CY 2009-2010
Kentucky 286.2 285.6 270.2 242.6 -15.24% -10.21%
Illinois 533.2 525.4 497.2 435.2 -18.38% -12.47%
Indiana 333.6 333.8 333.2 314.5 -5.73% -5.61%
Missouri 504.9 504.4 491.8 455.0 -9.89% -7.48%
Ohio 343.2 348.2 332.1 315.2 -8.16% -5.09%
Tennessee 753.3 722.4 667.7 613.3 -18.59% -8.15%
Virginia 269.7 255.9 226.8 213.6 -20.81% -5.82%
West Virginia 275.2 273.8 296.5 314.6 14.31% 6.10%
UNITED STATES TOTAL PART ONE ARRESTS 466.9 454.5 424.4 403.6 -13.56% -4.90%
Source: Federal Bureau of Investigation
* FBI used 2010 estimated population of 3,042,574

Sourcebook of Criminal Justice Statistics in the Commonwealth
70
Source: Federal Bureau of Investigation
Table 4.13: Property Offense Arrest Rate Per 100,000 Population-Kentucky and Surrounding States, 2007-2010
State
Property Offense Arrest Rate per 100,000- CY 2007
Property Offense Arrest Rate per 100,000- CY 2008
Property Offense Arrest Rate per 100,000- CY 2009
Property Offense Arrest Rate per 100,000- CY 2010*
Percent Change CY 2007-2010
Percent Change CY 2009-2010
Kentucky 2,486.6 2,572.3 2,506.4 2,551.3 2.60% 1.79%
Illinois 2,935.8 2,932.6 2,736.9 2,681.0 -8.68% -2.04%
Indiana 3,396.6 3,335.8 3,116.2 3,042.4 -10.43% -2.37%
Missouri 3,138.4 3,663.7 3,385.3 3,346.4 6.62% -1.15%
Ohio 3,455.2 3,411.7 3,270.9 3,245.2 -6.08% -0.79%
Tennessee 4,088.6 4,042.6 3,754.1 3,657.9 -10.54% -2.56%
Virginia 2,466.4 2,518.1 2,428.8 2,327.2 -5.65% -4.18%
West Virginia 2,525.0 2,568.6 2,526.7 2,239.6 -11.31% -11.36%
UNITED STATES TOTAL PART ONE ARRESTS 3,212.5 3,036.1 2,941.9 -9.86% -3.10% 3,263.5
* FBI used 2010 estimated population of 3,042,574

Sourcebook of Criminal Justice Statistics in the Commonwealth
71
Section V: Pretrial Release Trends
Section V presents data on the types of pretrial release used in the Commonwealth, as provided by the Kentucky Administrative Office of the Courts’ (AOC), Department of Pretrial Services. The information reported in this section was obtained from the Pretrial Release Information Management (PRIM) System. Appendix D provides detailed information on the limitations of the data included in this section.
• In 2010, AOC’s Pretrial Services processed 198,933 individuals. 146,301 (73.5%) of the individuals were males, and 51,898 (26.1%) were females. The remaining 734 individuals (<1%) involved persons of unknown or unreported gender.
• In 2010, there were 170,593 cases in which the judge set a financial bail amount. In these cases,
88,041(51.6%), defendants were able to obtain pretrial release and in the remaining 82,552 (48.4%) defendants were still in custody or unable to obtain pretrial release.
• There were 86,079 cases in which the judge allowed release on recognizance or set another type of non-
financial bail such as a surety or unsecured bond. In these cases, 84,949 (98.7%) were able to obtain pretrial release.
• AOC’s Pretrial Services conducts a thorough investigation and utilizes a risk assessment on all defendants
interviewed. In 2010, 89,070 defendants were assessed as low-risk, 75,170 assessed as moderate risk, and 14,025 assessed as high-risk. The release rate for low-risk defendants was 77%, 59% for moderate risk, and 48% for high-risk.

Sourcebook of Criminal Justice Statistics in the Commonwealth
72
Table 5.1: Bail Type and Release for Cases Processed by the Administrative Office of the Courts, Pretrial Services, 2009-2010
TOTAL CASES OBTAINED PRE-TRIAL RELEASE CASES DISPOSED STILL IN CUSTODY Bail Type
2009 2010 2009 2010 2009 2010 2009 2010
FINANCIAL RELEASE 165,506 170,593 97,845 88,041 66,963 82,363 698 189
10% 32,722 34,716 27,665 29,302 5,091 5,406 16 8
Partially Secured 1,246 1,222 1,039 970 204 252 3 0
Cash Bond 129,756 133,003 67,616 56,294 61,465 76,528 675 181
Property 1,723 1,652 1,516 1,475 203 177 4 0
NON-FINANCIAL RELEASE 83,825 86,079 82,796 84,949 1,017 1,126 12 4
Recognizance 40,812 44,625 40,712 44,461 100 163 0 1
Surety 25,424 24,467 24,600 23,643 812 822 12 2
Unsecured 17,589 16,987 17,484 16,845 105 141 0 1
TECHNICALITY RELEASE 522 776 521 769 1 7 0 0
60 Day Rule 459 730 458 723 1 7 0 0
No Probable Cause 63 46 63 46 0 0 0 0
No Bail Set 8,447 9,508 143 0 8,235 9,492 69 16
Unknown 9,211 0 123 0 9,087 0 1 0
Source: Administrative Office of the Court, Pretrial Services

Sourcebook of Criminal Justice Statistics in the Commonwealth
73
Table 5.2: Release Outcome by Level of Risk, 2009-2010
Total Cases Obtained Release Percent Release Appearance
Rate
Public Safety Rate Level of Risk
2009 2010 2009 2010 2009 2010 2010 2010
Low 91,982 89,070 72,870 68,305 79% 77% 93% 93%
Moderate 75,045 75,170 46,616 44,487 62% 59% 87% 87%
High 17,674 14,025 8,623 6,703 49% 48% 81% 80%
Ineligible 33,550 39,973 24,215 26,688 72% 67% 90% 94%
Not Verified 49,259 48,637 29,103 27,576 59% 57% 88% 91%
Incomplete 1 81 1 0 100% 0% 100% 100%
Source: Administrative Office of the Court, Pretrial Services
Table 5.3: Gender of Individuals Screened by Pretrial Services, 2010
Male 146,301 73.5%
Female 51,898 26.1%
Unknown 734 <1%
TOTAL NUMBER OF INDIVIDUALS SCREENED BY PRETRIAL SERVICES
198,933
Source: Administrative Office of the Court, Pretrial Services

Sourcebook of Criminal Justice Statistics in the Commonwealth
74
Table 5.4: Release Outcome by Level of Risk, 2009-2010
Total Cases Obtained Release
Percent Release
Appearance Rate
Public Safety Rate
Type of Charge
2010 2010 2010 2010 2010
Drug 20,065 15,128 75% 90% 87%
Sex 1,690 1,186 70% 96% 89%
Domestic Violence 16,879 11,542 68% 94% 90% Violent Felony Class A or B 3,973 2,474 62% 95% 86%
Violent Crime 14,873 10,378 70% 92% (Non A/B Felony) 89%
Other 209,476 133,051 64% 89% 91%
Source: Administrative Office of the Court, Pretrial Services
Table 5.6: Special Populations Among Individuals Screened by Pretrial Services,
2010 Table 5.5: Ethnicity of Individuals Screened by Pretrial Services, 2010
Hispanic 6,970 3.5%
Veterans 6,472 3.3%
Non-Hispanic 168,021 84.5% Individuals on Probation 18.9% 37,615
Unknown 23,942 12.0% Individuals with Substance Abuse and/or Mental Health Issues
TOTAL NUMBER OF INDIVIDUALS SCREENED BY PRETRIAL SERVICES 198,933
94,724 47.6%
Total Number of Individuals Screened by Pretrial Services
Source: Administrative Office of the Court, Pretrial Services
198,933 Source: Administrative Office of the Court, Pretrial Services

Sourcebook of Criminal Justice Statistics in the Commonwealth
75
Table 5.7: Race of Individuals Screened by Pretrial Services, 2010
Table 5.8: Age of Individuals
Screened by Pretrial Services, 2010 African-American 37,024 18.6%
White 155,946 78.4% <1% Under 18 8
Asian/Pacific Islander 311 <1%
18-20 6,952 3.5%
21-29 70,534 35.5%
American Indian/Alaska Native 103 <1%
30-39 59,653 30.0%
40-49 37,455 18.8%
Other 3,214 1.6%
Unknown 2,332 1.2%
TOTAL NUMBER OF INDIVIDUALS SCREENED BY PRETRIAL SERVICES 198,933
Source: Administrative Office of the Court, Pretrial Services
50-59 18,927 9.5%
60-69 4,146 2.1%
70 or older 820 <1%
TOTAL NUMBER OF INDIVIDUALS SCREENED BY PRETRIAL SERVICES 198,933
Source: Administrative Office of the Court, Pretrial Services
Table 5.9: Public Safety Rate by Classification Level, 2010
Individuals Not Charged with a New Crime while on Pretrial Release (Public Safety Rate) 90% Public Safety Rate for Individuals Classified as Low Risk 93% Public Safety Rate for Individuals Classified as Moderate Risk 87% Public Safety Rate for Individuals Classified as High Risk 80%
Source: Administrative Office of the Court, Pretrial Services

Sourcebook of Criminal Justice Statistics in the Commonwealth
76
Table 5.11: Appearance Rate by
Classification Level, 2010
Individuals Appearing at Subsequent Court Proceedings Upon Obtaining Pretrial Release (Appearance Rate) 89%
Appearance Rate for Individuals Classified as Low Risk 93%
Table 5.10: Highest Level of Education Completed by Individuals Screened by
Pretrial Services, 2010
Less than High School Diploma 58,958
Appearance Rate for Individuals Classified as Moderate Risk 87%
Appearance Rate for Individuals Classified as High Risk 81%
29.6%
General Equivalency Diploma (GED) 23,615 11.9%
High School Graduate 50,854 25.6% Formal Vocational Training 1,934
Source: Administrative Office of the Court, Pretrial Services <1%
Some College 29,802 15.0%
Associate's Degree 3,184 1.6%
Bachelor's Degree 4,014 2.0%
Post Graduate 1,397 <1%
Unknown 25,175 12.7%
TOTAL NUMBER OF INDIVIDUALS SCREENED BY PRETRIAL SERVICES 198,933
Source: Administrative Office of the Court, Pretrial Services

Sourcebook of Criminal Justice Statistics in the Commonwealth
77
Table 5.12: Pretrial Release
January 1-December 31, 2010 Number of Cases 266,956
Number of Defendants 198,933
Average Length of Pretrial Release 103 days Percentage of Individuals Still in Custody and Awaiting Trial as of 6/2012 <1%
Table 5.13: Monitored Conditional Release, 2010
Individuals Referred to Monitored Conditional Release Program Charged with a Misdemeanor or
Less 74% 7,185
Average Length of Monitored Conditional Release Term Defense Screened for Mental Health
or Substance Abuse Issue 57%
111 Days
Active Monitored Conditional Release Caseload on 12-31-10
Case was Disposed within 48 hours of Arrest 71%
2,370
Monitored Conditional Release Compliance Rate 87%
Percentage of Monitored Conditional Release Participants Classified as Low Risk
Investigation Rate 83%
49%
Monitored Conditional Release Follow-Up Including Office Visits, Call-In, Curfew, and Drug Screens Obtained Pretrial Release
173,759 (65%) 116,077
Source: Administrative Office of the Court, Pretrial Services
Percentage of Individuals Unable to Make Bail/Held in Jail Until Disposition of Case 35%
Non-Financial Releases including Release on Recognizance, Unsecured Bond, and Surety 49%
Individuals Obtaining Release Classified as Low Risk 77%
Individuals Obtaining Release Classified as Moderate Risk 59%
Individuals Obtaining Release Classified as High Risk 48%
Source: Administrative Office of the Court, Pretrial Services

Sourcebook of Criminal Justice Statistics in the Commonwealth
78
Section VI: Court Disposition and Sentencing Trends
Section VI presents information from the Kentucky Administrative Office of the Courts on case dispositions and sentencing trends for Part One Offenses. Appendix D provides detailed information on the limitations of the data included in this section.
• In 2010, the Part One offense with the highest total number of convictions in Circuit and District Courts was larceny-theft (with 4,292 cases in Circuit Court and 29,860 cases in District Court).
• In Circuit Court, each year from 2006 to 2010, prison was the most common sentence for all Part One offense
charges. In 2010, 62.6% of charges resulted in a charge of prison, 23.3% in state probation, 11.4% in jail, and 1.6% in other sentences.
• In District Court, each year from 2006 to 2010, jail was the most common sentence for all Part One offense
charges. In 2010, 91.8% of charges resulted in a sentence of jail, 4.0% in local probation, and 4.2% in other sentences.

Sourcebook of Criminal Justice Statistics in the Commonwealth
79
Table 6.1: Circuit Court- Specified Offenses by Disposition Type, 2006-2010
CY 2006 CY 2007 CY 2008 CY 2009 CY 2010
Charges Cases Charges Cases Charges Cases Charges Cases Charges Cases
Acquitted/Dismissed/Not Guilty 115 94 117 95 117 93 126 101 96 83 Amended Dispositions 182 149 183 162 161 153 164 144 173 155 Conviction 178 142 145 127 133 115 164 137 148 129 Diversion/Deferred 0 0 1 1 3 3 1 1 0 0 Other Dispositions 17 9 17 11 10 10 9 6 5 3
Temporary Dispositions 2 2 6 4 5 5 3 3 8 5 Crim
inal
Hom
icid
e
TOTAL 494 344 469 340 429 331 467 328 430 324
Acquitted/Dismissed/Not Guilty 256 141 294 147 486 158 370 146 257 143 Amended Dispositions 195 128 152 121 237 170 167 135 180 141 Conviction 99 60 184 107 220 134 243 122 258 145 Diversion/Deferred 0 0 0 0 0 0 2 1 2 1 Other Dispositions 4 4 11 10 15 13 5 3 8 4
Temporary Dispositions 3 3 17 16 4 3 6 6 14 9
Forc
ible
Rap
e
TOTAL 557 316 658 372 962 432 793 376 719 392
Acquitted/Dismissed/Not Guilty 372 251 247 199 563 241 309 248 247 202
Added Offense Dispositions 0 0 4 3 3 3 3 3 1 1 Amended Dispositions 662 512 659 537 756 627 656 543 744 559 Conviction 1,103 652 1,136 668 1,053 686 895 637 1,006 659 Diversion/Deferred 9 9 9 8 21 18 25 18 28 23 Other Dispositions 9 5 7 7 10 8 2 2 5 5
Temporary Dispositions 2 2 15 10 16 15 21 20 11 10
Robb
ery
TOTAL 2,157 1,065 2,077 1,065 2,422 1,185 1,911 1,101 2,042 1,081
Source: Administrative Office of the Courts

Sourcebook of Criminal Justice Statistics in the Commonwealth
80
Table 6.1: Circuit Court- Specified Offenses by Disposition Type, 2006-2010, Continued CY 2006 CY 2007 CY 2008 CY 2009 CY 2010
Charges Cases Charges Cases Charges Cases Charges Cases Charges Cases Acquitted/Dismissed/Not Guilty 573 459 510 408 499 404 509 396 486 398 Added Offense Dispositions 1 1 5 3 4 2 2 2 2 2 Amended Dispositions 784 679 776 673 874 792 845 746 810 718 Conviction 1,148 880 1,082 864 1,098 935 1,091 899 1,014 826 Diversion/Deferred 66 54 59 52 78 63 106 89 125 94 Other Dispositions 26 16 21 12 14 14 14 11 11 11
Temporary Dispositions 11 10 21 18 25 22 32 22 16 16
Agg
rava
ted
Ass
ault
TOTAL 2,609 1,730 2,474 1,693 2,592 1,836 2,599 1,753 2,464 1,654 Acquitted/Dismissed/Not Guilty 783 602 815 647 874 688 926 699 832 687 Added Offense Dispositions 1 1 16 11 12 10 2 2 2 1 Amended Dispositions 868 776 910 804 1,094 978 1,119 978 1,254 1,111 Conviction 2,422 1,651 2,585 1,788 2,651 1,940 2,873 1,983 3,404 2,243 Diversion/Deferred 74 59 150 119 158 138 267 199 292 251 Other Dispositions 15 14 40 18 22 15 7 6 10 8
Temporary Dispositions 23 21 26 25 30 30 31 26 43 32 Burg
lary
(Br
eaki
ng o
r En
teri
ng)
TOTAL 4,186 2,598 4,542 2,832 4,841 3,091 5,225 3,181 5,837 3,474 Acquitted/Dismissed/Not Guilty 2,150 1,015 2,124 1,085 2,086 2,595 1,338 2,146 1,113 Added Offense Dispositions 6 2 25 13 9 6 6 5 2 2 Amended Dispositions 518 415 666 534 676 546 759 572 676 510 Conviction 5,200 2,842 5,442 3,074 5,938 3,356 5,261 3,152 4,434 2,601 Diversion/Deferred 293 195 431 251 650 404 675 447 722 470 Other Dispositions 100 56 224 74 160 57 76 32 74 51
Temporary Dispositions 90 62 124 75 127 65 187 125 188 110
Larc
eny-
Thef
t (E
xcep
t M
otor
Ve
hicl
e Th
eft)
TOTAL 8,357 4,090 9,036 4,500 9,646 4,974 9,559 5,041 8,242 4,292
Source: Administrative Office of the Courts

Sourcebook of Criminal Justice Statistics in the Commonwealth
81
Table 6.1: Circuit Court- Specified Offenses by Disposition Type, 2006-2010, Continued
CY 2006 CY 2007 CY 2008 CY 2009 CY 2010 Charges Cases Charges Cases Charges Cases Charges Cases Charges Cases
Acquitted/Dismissed/Not Guilty 143 81 72 64 97 70 85 75 85 73
Amended Dispositions 35 33 51 47 29 29 50 43 34 34
Conviction 235 216 334 291 305 260 308 266 281 207
Diversion/Deferred 7 7 21 18 168 23 20 17 20 16
Other Dispositions 12 7 5 5 14 14 2 2 2 2
Temporary Dispositions 4 3 2 2 5 5 4 3 1 1
Mot
or V
ehic
le T
heft
TOTAL 436 329 485 402 618 378 469 380 423 303
Acquitted/Dismissed/Not Guilty 144 86 58 45 74 64 46 40 60 48
Added Offense Dispositions 0 0 2 2 1 1 0 0 1 1
Amended Dispositions 67 62 55 49 65 63 70 67 102 83
Conviction 112 101 78 73 100 92 88 79 120 96
Diversion/Deferred 8 5 8 5 10 10 9 9 16 15
Other Dispositions 1 1 0 0 0 0 1 1 0 0
Temporary Dispositions 0 0 1 1 0 0 1 1 1 1
Ars
on
TOTAL 332 194 202 138 250 175 215 142 300 175
Source: Administrative Office of the Courts

Sourcebook of Criminal Justice Statistics in the Commonwealth
82
Table 6.2: District Court- Specified Offenses by Disposition Type, 2006-2010 CY 2006 CY 2007 CY 2008 CY 2009 CY 2010
Charges Cases Charges Cases Charges Cases Charges Cases Charges Cases Acquitted/Dismissed/Not Guilty 76 62 80 70 57 54 38 32 24 21 Amended Dispositions 33 32 27 25 44 41 23 23 41 37 Conviction 0 0 2 1 4 4 0 0 0 0 Other Dispositions 300 255 284 230 259 231 278 240 248 219
Temporary Dispositions 0 0 0 0 0 0 0 0 1 1 Unknown 0 0 1 1 0 0 1 1 4 4 Cr
imin
al H
omic
ide
TOTAL 409 339 394 318 364 319 340 285 318 270 Acquitted/Dismissed/Not Guilty 131 123 162 120 113 97 123 112 129 93 Amended Dispositions 61 60 52 51 59 55 56 52 68 54 Conviction 2 2 7 7 5 3 5 3 4 4 Diversion/Deferred 0 0 1 1 0 0 0 0 0 0 Other Dispositions 205 173 3,692 221 352 226 254 218 303 209
Temporary Dispositions 1 1 1 1 1 1 2 2 0 0 Unknown 8 7 6 6 4 4 6 5 7 7
Forc
ible
Rap
e
TOTAL 408 357 3,921 389 534 372 446 380 511 356 Acquitted/Dismissed/Not Guilty 488 450 421 394 440 425 365 348 386 330 Amended Dispositions 521 507 561 532 580 561 620 605 564 555 Conviction 120 114 112 111 118 116 97 97 101 94 Diversion/Deferred 2 2 0 0 0 0 0 0 0 0 Other Dispositions 1,144 965 1,154 976 1,053 918 1,081 882 1,131 941
Temporary Dispositions 5 5 9 9 4 4 10 9 3 3 Unknown 35 35 39 36 66 60 52 44 51 47
Robb
ery
TOTAL 2,315 1,917 2,296 1,895 2,261 1,945 2,225 1,851 2,236 1,807
Source: Administrative Office of the Courts

Sourcebook of Criminal Justice Statistics in the Commonwealth
83
Table 6.2: District Court- Specified Offenses by Disposition Type, 2006-2010 CY 2006 CY 2007 CY 2008 CY 2009 CY 2010
Charges Cases Charges Cases Charges Cases Charges Cases Charges Cases Acquitted/Dismissed/Not Guilty 1,610 1,489 1,531 1,402 1,517 1,376 1,327 1,231 1,239 1,125 Amended Dispositions 1,639 1,540 1,753 1,646 1,703 1,608 1,800 1,712 1,649 1,548 Conviction 233 223 214 205 243 229 237 229 180 176 Diversion/Deferred 3 3 10 8 4 3 4 4 4 4 Other Dispositions 1,625 1,402 1,596 1,383 1,694 1,475 1,558 1,360 1,474 1,298
Temporary Dispositions 19 18 16 13 13 11 15 13 14 13 Unknown 164 156 153 138 136 130 134 118 125 116 A
ggra
vate
d A
ssau
lt
TOTAL 5,293 4,613 5,273 4,592 5,310 4,603 5,075 4,389 4,685 4,037 Acquitted/Dismissed/Not Guilty 1,934 1,689 2,154 1,725 1,850 1,671 1,898 1,477 1,531 1,364 Amended Dispositions 1,896 1,769 1,868 1,770 1,914 1,839 1,989 1,887 1,943 1,850 Conviction 632 574 736 660 693 618 731 577 556 495 Diversion/Deferred 12 12 14 10 15 15 4 3 8 8 Other Dispositions 2,750 2,337 3,140 2,437 3,072 2,523 3,093 2,520 3,359 2,805
Temporary Dispositions 17 17 13 12 17 17 23 21 20 16 Unknown 265 228 154 138 245 198 196 169 182 159 Bu
rgla
ry (
Brea
king
or
Ente
ring
)
TOTAL 7,506 6,092 8,079 6,139 7,806 6,313 7,934 6,093 7,599 6,106 Acquitted/Dismissed/Not Guilty 27,852 18,556 26,126 17,717 24,585 17,307 20,053 14,350 11,995 9,242 Added Offense Dispositions 1 1 3 3 12 7 9 9 1 1 Amended Dispositions 3,931 3,528 4,450 3,803 4,476 4,070 4,003 3,614 2,945 2,740 Conviction 47,649 25,256 47,728 25,802 43,837 25,490 33,562 22,219 18,884 16,159 Diversion/Deferred 219 156 290 189 404 284 395 331 367 309 Other Dispositions 7,668 4,142 6,907 4,072 6,580 4,289 5,524 3,510 3,762 2,781
Temporary Dispositions 1,488 942 1,447 863 1,501 1,001 1,453 920 872 642 Unknown 553 479 490 447 556 491 475 408 379 337
Larc
eny-
Thef
t (E
xcep
t M
otor
)
TOTAL 89,361 49,250 87,441 48,886 81,951 48,734 65,474 41,322 39,205 29,860
Source: Administrative Office of the Courts

Sourcebook of Criminal Justice Statistics in the Commonwealth
84
Table 6.2: District Court- Specified Offenses by Disposition Type, 2006-2010
CY 2006 CY 2007 CY 2008 CY 2009 CY 2010
Charges Cases Charges Cases Charges Cases Charges Cases Charges Cases
Acquitted/Dismissed/Not Guilty 860 813 787 733 661 648 590 563 488 481
Added Offense Dispositions 0 0 0 0 0 0 0 0 1 1
Amended Dispositions 289 283 307 301 249 238 252 240 287 273
Conviction 700 684 740 725 502 489 538 523 478 472
Diversion/Deferred 7 7 3 3 3 3 1 1 10 10
Other Dispositions 383 346 488 379 399 359 348 317 386 329
Temporary Dispositions 15 14 12 12 13 13 44 15 15 15
Unknown 89 78 63 62 82 74 52 49 41 38
Mot
or V
ehic
le T
heft
TOTAL 2,343 2,050 2,400 1,993 1,909 1,678 1,825 1,547 1,706 1,453
Acquitted/Dismissed/Not Guilty 107 94 92 81 92 79 35 85 52 49
Amended Dispositions 98 90 97 92 91 84 86 83 73 71
Conviction 63 59 69 63 46 45 25 25 38 38
Diversion/Deferred 0 0 1 1 3 3 0 0 2 2
Other Dispositions 161 96 131 120 87 78 122 110 116 104
Temporary Dispositions 0 0 0 0 1 1 0 0 1 1
Unknown 32 31 29 23 17 17 22 20 9 9
Ars
on
TOTAL 461 319 419 319 337 257 350 284 291 236
Source: Administrative Office of the Courts

Sourcebook of Criminal Justice Statistics in the Commonwealth
85
Table 6.3: Family Court- Specified Offenses by Disposition Type, 2006-2010 CY 2006 CY 2007 CY 2008 CY 2009 CY 2010
Charges Cases Charges Cases Charges Cases Charges Cases Charges Cases Acquitted/Dismissed/Not Guilty 0 0 0 0 0 0 0 0 1 1 Other Dispositions 0 0 1 1 0 0 1 1 0 0
Forc
ible
Ra
pe
TOTAL 0 0 1 1 0 0 1 1 1 1 Acquitted/Dismissed/Not Guilty 0 0 0 0 0 0 1 1 0 0
Amended Dispositions 0 0 1 1 2 2 0 0 5 5 Conviction 2 2 0 0 1 1 0 0 0 0 Other Dispositions 0 0 0 0 0 0 0 0 2 2 Unknown 0 0 0 0 0 0 0 0 4 4
Robb
ery
TOTAL 2 2 1 1 3 3 1 1 11 9 Acquitted/Dismissed/Not Guilty 2 2 2 2 4 4 4 4 5 5
Amended Dispositions 3 2 4 4 2 1 3 3 4 4 Conviction 0 0 0 0 0 0 1 1 0 0 Diversion/Deferred 0 0 0 0 0 0 0 0 1 1 Other Dispositions 0 0 1 1 1 1 0 0 4 3 Unknown 0 0 1 1 0 0 0 0 0 0 A
ggra
vate
d A
ssau
lt
TOTAL 5 4 8 8 7 6 8 8 14 12 Acquitted/Dismissed/Not Guilty 1 1 3 3 1 1 5 5 7 6
Amended Dispositions 1 1 3 3 2 2 1 1 7 7 Conviction 0 0 6 6 6 4 2 2 10 10 Diversion/Deferred 0 0 0 0 1 1 0 0 1 1 Other Dispositions 0 0 0 0 3 2 2 2 0 0 Unknown 2 2 4 3 5 2 0 0 2 2
Burg
lary
(Br
eaki
ng o
r En
teri
ng)
TOTAL 7 7 16 12 18 11 10 10 27 21
Source: Administrative Office of the Courts

Sourcebook of Criminal Justice Statistics in the Commonwealth
86
Table 6.3: Family Court- Specified Offenses by Disposition Type, 2006-2010, Continued
CY 2006 CY 2007 CY 2008 CY 2009 CY 2010
Charges Cases Charges Cases Charges Cases Charges Cases Charges Cases
Acquitted/Dismissed/Not Guilty 1 1 4 4 8 7 7 7 8 7
Amended Dispositions 2 2 6 6 5 5 11 5 2 2
Conviction 5 5 15 15 8 7 20 11 14 13
Other Dispositions 0 0 1 1 3 2 5 5 2 2
Unknown 1 1 1 1 6 3 6 6 1 1
Larc
eny-
Thef
t (E
xcep
t M
otor
Veh
icle
The
ft)
TOTAL 9 8 27 24 30 23 49 30 27 24
Acquitted/Dismissed/Not Guilty 0 0 0 0 0 0 2 2 0 0
Amended Dispositions 1 1 1 1 1 1 1 1 1 1
Conviction 0 0 2 2 3 3 5 3 1 1
Unknown 0 0 1 1 0 0 0 0 0 0
Mot
or V
ehic
le T
heft
TOTAL 1 1 4 3 4 3 8 5 2 1
Acquitted/Dismissed/Not Guilty 0 0 0 0 2 2 0 0 0 0
Amended Dispositions 0 0 1 1 0 0 3 3 0 0
Other Dispositions 0 0 0 0 1 1 0 0 0 0
Unknown 0 0 0 0 1 1 1 1 0 0
Ars
on
TOTAL 0 0 1 1 4 4 4 4 0 0
Source: Administrative Office of the Courts

Sourcebook of Criminal Justice Statistics in the Commonwealth
87
Table 6.4: Sentencing Imposed by Circuit Courts for Part One Offenses, 2006-2010
Offense Sentence CY
2006 CY
2007 CY
2008 CY
2009 CY
2010
Prison 152 128 117 139 121
Jail 3 0 0 0 0
Local Probation 0 0 0 0 0
State Probation 4 3 2 3 6
Life 32 29 29 18 36
Death Penalty 7 0 0 0 5
25 Years No Parole 11 9 5 4 3
Alcohol and Drug Education 0 0 0 0 0
Crim
inal
Hom
icid
e
Other 5 0 2 0 1
Prison 93 169 196 233 219
Jail 3 5 6 4 9
Local Probation 0 0 0 0 1
State Probation 12 13 17 19 22
Life 3 9 3 2 11
Death Penalty 0 0 0 0 0
25 Years No Parole 1 0 0 1 0
Alcohol and Drug Education 0 0 0 0 0
Forc
ible
Rap
e
Other 1 3 16 4 5
Prison 1,071 1,030 910 836 944
Jail 22 20 27 33 34
Local Probation 2 1 2 0 1
State Probation 180 199 168 202 192
Life 1 1 1 0 3
Death Penalty 0 0 0 0 0
25 Years No Parole 0 1 0 0 0
Alcohol and Drug Education 0 0
Robb
ery
0 0 0
Other 7 1 5 2 2
Source: Administrative Office of the Courts

Sourcebook of Criminal Justice Statistics in the Commonwealth
88
Table 6.4: Sentencing Imposed by Circuit Courts for Part One Offenses, 2006-2010, Continued
Offense Sentence CY
2006 CY 2007 CY 2008 CY 2009 CY 2010
Prison 1,050 996 1,026 983 927
Jail 85 61 55 68 56
Local Probation 0 3 7 4 2
State Probation 402 297 290 341 303
Life 1 0 1 1 0
Death Penalty 0 0 0 0 0
25 Years No Parole 0 0 0 0 0
Alcohol and Drug Education 1 2 2 7 1
Agg
rava
ted
Ass
ault
Other 5 10 24 7 22
Prison 2,292 2,456 2,453 2,648 3,168
Jail 125 136 126 114 142
Local Probation 7 3 5 6 15
State Probation 798 800 788 747 928
Life 0 1 1 0 2
Death Penalty 0 0 0 0 0
25 Years No Parole 0 1 0 0 0
Alcohol and Drug Education 5 2 1 4 2
Burg
lary
Other 25 23 38 30 29
Prison 3,722 3,714 4,144 3,587 3,002
Jail 1,442 1,696 1,649 1,409 1,238
Local Probation 5 25 25 19 33
State Probation 2,190 2,362 2,520 1,666 1,666
Life 0 0 0 0 0
Death Penalty 0 0 0 0 0
25 Years No Parole 0 0 0 0 0
Alcohol and Drug Education 5 1 0 5 9
Larc
eny/
Thef
t
Other 68 38 238 78 38
Source: Administrative Office of the Courts

Sourcebook of Criminal Justice Statistics in the Commonwealth
89
Table 6.4: Sentencing Imposed by Circuit Courts for Part One Offenses, 2006-2010, Continued
Offense Sentence CY
2006 CY 2007 CY 2008 CY 2009 CY 2010
Prison 158 233 221 222 172
Jail 76 97 74 73 100
Local Probation 1 1 3 1 5
State Probation 71 82 85 76 71
Life 0 0 0 0 0
Death Penalty 0 0 0 0 0
25 Years No Parole 0 0 0 0 0
Alcohol and Drug Education 0 0 0 0 1
Mot
or V
ehic
le T
heft
Other 2 3 7 5 7
Prison 107 77 96 81 111
Jail 7 3 5 5 3
Local Probation 0 0 0 0 1
State Probation 37 27 29 29 39
Life 0 0 4 0 0
Death Penalty 0 0 0 0 0
25 Years No Parole 0 0 0 0 0
Alcohol and Drug Education 11 5
Ars
on
3 16 13
Other 115 80 332 128 115
Source: Administrative Office of the Courts

Sourcebook of Criminal Justice Statistics in the Commonwealth
90
Table 6.5: Sentencing Imposed by District Courts for Part One Offenses, 2006-2010
Offense Sentence CY
2006 CY 2007 CY 2008 CY 2009 CY 2010
Prison 0 0 0 0 0
Jail 0 1 0 0 0
Local Probation 0 0 0 0 0
State Probation 0 1 0 0 0
Life 0 0 0 0 0
Death Penalty 0 0 0 0 0
25 Years No Parole 0 0 0 0 0
Alcohol and Drug Education 0 0 0 0 0
Crim
inal
Hom
icid
e
Other 0 0 0 0 0
Prison 0 0 0 0 0
Jail 0 1 1 0 1
Local Probation 0 0 0 0 0
State Probation 0 0 0 0 0
Life 0 0 0 0 0
Death Penalty 0 0 0 0 0
25 Years No Parole 0 0 0 0 0
Alcohol and Drug Education 0 0 0 0 0
Forc
ible
Rap
e
Other 0 0 1 0 0
Prison 0 0 0 0 0
Jail 37 35 29 24 22
Local Probation 1 1 0 1 0
State Probation 1 1 2 0 1
Life 0 0 0 0 0
Death Penalty 0 0 0 0 0
25 Years No Parole 0 0 0 0 0
Alcohol and Drug Education 0 0
Robb
ery
0 1 0
Other 2 0 1 0 0
Source: Administrative Office of the Courts

Sourcebook of Criminal Justice Statistics in the Commonwealth
91
Table 6.5: Sentencing Imposed by District Courts for Part One Offenses,
2006-2010, Continued
Offense Sentence CY
2006 CY 2007 CY 2008 CY 2009 CY 2010
Prison 0 0 0 0 0
Jail 32 64 91 56 62
Local Probation 2 0 3 1 2
State Probation 0 6 2 4 4
Life 0 0 0 0 0
Death Penalty 0 0 0 0 0
25 Years No Parole 0 0 0 0 0
Alcohol and Drug Education 1 0 0 0 0
Agg
rava
ted
Ass
ault
Other 4 9 4 4 3
Prison 0 0 0 1 0
Jail 159 244 200 237 225
Local Probation 4 5 8 9 6
State Probation 2 3 3 1 4
Life 0 0 0 0 0
Death Penalty 0 0 0 0 0
25 Years No Parole 0 0 0 0 0
Alcohol and Drug Education 0 1 0 0 0
Burg
lary
Other 4 9 4 4 3
Prison 2 13 1 0 0
Jail 34,622 33,518 32,010 25,376 14,868
Local Probation 1,493 1,098 1,688 1,333 659
State Probation 78 40 84 50 34
Life 0 0 1 0 0
Death Penalty 0 0 0 0 0
25 Years No Parole 0 0 0 0 1
Alcohol and Drug Education 6 11 14 18 9
Larc
eny/
Thef
t
Other 2,230 2,289 1,845 1,707 644
Source: Administrative Office of the Courts

Sourcebook of Criminal Justice Statistics in the Commonwealth
92
Table 6.5: Sentencing Imposed by District Courts for Part One Offenses,
2006-2010, Continued
Offense Sentence CY
2006 CY 2007 CY 2008 CY 2009 CY 2010
Prison 0 0 0 0 0
Jail 408 422 317 322 305
Local Probation 10 13 9 4 6
State Probation 4 2 0 4 1
Life 0 0 0 0 0
Death Penalty 0 0 0 0 0
25 Years No Parole 0 0 0 0 0
Alcohol and Drug Education 1 2 0 2 1
Mot
or V
ehic
le T
heft
Other 14 18 6 8 8
Prison 0 0 0 0 0
Jail 16 11 16 8 9
Local Probation 1 1 0 0 0
State Probation 1 2 0 2 1
Life 0 0 0 0 0
Death Penalty 0 0 0 0 0
25 Years No Parole 0 0 0 0 0
Alcohol and Drug Education 0 0
Ars
on
0 0 0
Other 0 0 0 0 0
Source: Administrative Office of the Courts
Table 6.6: District Court Closed Pre-Payable Cases, 2006-2010
CY 2006 CY 2007 CY 2008 CY 2009 CY 2010
Felony 0 5 4 0 0
Misdemeanor 7,386 7,803 7,193 5,494 4,708
Juvenile 1 0 1 1 0
Traffic 153,777 173,707 169,943 162,504 138,393 TOTAL-ALL CASES 161,164 181,515 177,141 167,999 143,101
Source: Administrative Office of the Courts

Sourcebook of Criminal Justice Statistics in the Commonwealth
93
Section VII: Trial Court Caseload Trends
Section VII presents Circuit and District Court case data from the Kentucky Administrative Office of the Courts and data from the Department of Public Advocacy.
• Statewide, the number of criminal cases disposed in Circuit and District Courts decreased in every category between 2009 and 2010.
• The number of criminal cases disposed in Circuit Court varies greatly by Circuit. In 2010, the number of
criminal cases disposed ranged from a high of 4,330 in the Thirtieth Judicial District (Jefferson County) to a low of 101 in the Thirty-Sixth Judicial District (Knott and Magoffin Counties).
• The number of felony cases disposed in District Court ranged from a high of 14,112 in the Thirtieth District
Court (Jefferson County) to a low of 92 in the Sixtieth District Court (Cumberland and Monroe Counties) in 2010.
• In 2010, the Department of Public Advocacy handled 104,994 cases for 69,910 clients. Of these, 25% were
felony cases, 27% were for misdemeanor offenses, and 14% were cases involving juveniles.

Sourcebook of Criminal Justice Statistics in the Commonwealth
94
Figure 7.a: Kentucky Judicial Districts
Source: Administrative Office of the Courts

Sourcebook of Criminal Justice Statistics in the Commonwealth
95
Table 7.1: Kentucky Court Districts by County, Continued
County Judicial District Table 7.1: Kentucky Court Districts by
County Edmondson Thirty-Eight
Elliott Thirty-Seven County Judicial District Estill Twenty-Three Adair Twenty-Nine Fayette Twenty-Two Allen Forty-Nine Fleming Nineteen Anderson Fifty-Three Floyd Thirty-One Ballard Fifty-Nine Franklin Forty-Eight Barren Forty-Three Fulton One Bath Twenty-One Gallatin Fifty-Four Bell Forty-Four Garrard Thirteen Boone Fifty-Four Grant Fifteen Bourbon Fourteen Graves Fifty-Two Boyd Thirty-Two Grayson Forty-Six Boyle Fifty Green Eleven Bracken Nineteen Greenup Twenty Breathitt Thirty-Nine Hancock Thirty-Eight Breckenridge Forty-Six Hardin Nine Bullitt Fifty-Five Harlan Twenty-Six Butler Thirty-Eight Harrison Eighteen Caldwell Fifty-Six Hart Ten
Calloway Forty-Two Henderson Fifty-One
Campbell Seventeen Henry Twelve
Carlisle Fifty-Nine Hickman One
Carroll Fifteen Hopkins Four
Carter Thirty-Seven Jackson Forty-One
Casey Twenty-Nine Jefferson Thirty
Christian Three Jessamine Thirteen
Clark Twenty-Five Johnson Twenty-Four
Clay Forty-One Kenton Sixteen
Clinton Forty Knott Thirty-Six
Crittenden Five Knox Twenty-Seven
Cumberland Sixty Larue Ten
Daviess Six Laurel Twenty-Seven
Lawrence Twenty-Four
Lee Twenty-Three
Leslie Forty-One

Sourcebook of Criminal Justice Statistics in the Commonwealth
96
Table 7.1: Kentucky Court Districts by County, Continued
County Judicial District Table 7.1: Kentucky Court Districts by
County, Continued Letcher Forty-Seven
Lewis Twenty County Judicial District Lincoln Thirteen Perry Thirty-Three Livingston Fifty-Six Pike Thirty-Five Logan Seven Powell Thirty-Nine Lyon Fifty-Six Pulaski Twenty-Eight Madison Twenty-Five Robertson Eighteen Magoffin Thirty-Six Rockcastle Twenty-Eight Marion Eleven Rowan Twenty-One Marshall Fifty-Eight Russell Forty Martin Twenty-Four Scott Fourteen Mason Nineteen Shelby Fifty-Three McCracken Two Simpson Forty-Nine McCreary Thirty-Four Spencer Fifty-Three McLean Forty-Five Taylor Eleven Meade Forty-Six Todd Seven Menifee Twenty-One Trigg Fifty-Six Mercer Fifty Trimble Twelve Metcalfe Forty-Three Union Five Monroe Sixty Warren Eight Montgomery Twenty-One Washington Eleven Morgan Thirty-Seven Wayne Forty Muhlenberg Forty-Five Webster Five Nelson Fifty-Seven Whitley Thirty-Four Nicholas Eighteen Wolfe Thirty-Nine Ohio Thirty-Eight Woodford Fourteen Oldham Twelve
Source: Administrative Office of the Courts
Owen Fifteen
Owsley Twenty-Three
Pendleton Eighteen

Sourcebook of Criminal Justice Statistics in the Commonwealth
97
Table 7.2: Kentucky Court Circuits by
County County Judicial Circuit Adair Twenty-Nine
Allen Forty-Nine
Anderson Fifty-Three Table 7.2: Kentucky Court Circuits by
County, Continued Ballard One
County Judicial Circuit Barren Forty-Three
Fleming Nineteen Bath Twenty-One
Bell Forty-Four Floyd Thirty-One
Franklin Forty-Eight Boone Fifty-Four
Fulton One Bourbon Fourteen
Boyd Thirty-Two Gallatin Fifty-Four
Garrard Thirteen Boyle Fifty
Grant Fifteen Bracken Nineteen
Breathitt Thirty-Nine Graves Fifty-Two
Grayson Forty-Six Breckenridge Forty-Six
Green Eleven Bullitt Fifty-Five
Butler Thirty-Eight Greenup Twenty
Hancock Thirty-Eight Caldwell Fifty-Six
Hardin Nine Calloway Forty-Two
Campbell Seventeen Harlan Twenty-Six
Harrison Eighteen Carlisle One
Hart Ten Carroll Fifteen
Carter Thirty-Seven Henderson Fifty-One
Henry Twelve Casey Twenty-Nine
Hickman One Christian Three
Clark Twenty-Five Hopkins Four
Jackson Forty-One Clay Forty-One
Jefferson Thirty Clinton Forty
Crittenden Five Jessamine Thirteen
Johnson Twenty-Four Cumberland Forty
Kenton Sixteen Daviess Six
Edmondson Thirty-Eight Knott Thirty-Six
Knox Twenty-Seven Elliott Thirty-Seven
Larue Ten Estill Twenty-Three
Fayette Twenty-Two Laurel Twenty-Seven
Lawrence Twenty-Four

Sourcebook of Criminal Justice Statistics in the Commonwealth
98
Table 7.2: Kentucky Court Circuits by County, Continued
County Judicial Circuit Lee Twenty-Three
Leslie Forty-One
Letcher Forty-Seven Table 7.2: Kentucky Court Circuits by
County, Continued Lewis Twenty
County Judicial Circuit Lincoln Twenty-Eight
Owsley Twenty-Three Livingston Fifty-Six
Logan Seven Pendleton Eighteen
Perry Thirty-Three Lyon Fifty-Six
Pike Thirty-Five Madison Twenty-Five
Magoffin Thirty-Six Powell Thirty-Nine
Pulaski Twenty-Eight Marion Eleven
Robertson Eighteen Marshall Forty-Two
Martin Twenty-Four Rockcastle Twenty-Eight
Rowan Twenty-One Mason Nineteen
Russell Fifty-Seven McCracken Two
McCreary Thirty-Four Scott Fourteen
Shelby Fifty-Three McLean Forty-Five
Simpson Forty-Nine Meade Forty-Six
Menifee Twenty-One Spencer Fifty-Three
Taylor Eleven Mercer Fifty
Todd Seven Metcalfe Forty-Three
Monroe Forty Trigg Fifty-Six
Trimble Twelve Montgomery Twenty-One
Union Five Morgan Thirty-Seven
Muhlenberg Forty-Five Warren Eight
Washington Eleven Nelson Ten
Wayne Fifty-Seven Nicholas Eighteen
Ohio Thirty-Eight Webster Five
Whitley Thirty-Four Oldham Twelve
Wolfe Thirty-Nine Owen Fifteen
Woodford Fourteen
Source: Administrative Office of the Courts

Sourcebook of Criminal Justice Statistics in the Commonwealth
99
Table 7.3: Kentucky Court Districts
Judicial District Counties
One Fulton, Hickman
Two McCracken
Three Christian
Four Hopkins
Five Crittenden, Union, Webster
Six Daviess
Seven Logan, Todd
Eight Warren
Nine Hardin
Ten Hart, Larue
Eleven Green, Marion, Taylor, Washington
Twelve Henry, Oldham, Trimble
Thirteen Garrard, Jessamine, Lincoln
Fourteen Bourbon, Scott, Woodford
Fifteen Carroll, Grant, Owen
Sixteen Kenton
Seventeen Campbell
Eighteen Harrison, Nicholas, Pendleton, Robertson
Nineteen Bracken, Fleming, Mason
Twenty Greenup, Lewis
Twenty-One Bath, Menifee, Montgomery, Rowan
Twenty-Two Fayette
Twenty-Three Estill, Lee, Owsley
Twenty-Four Johnson, Lawrence, Martin
Twenty-Five Clark, Madison
Twenty-Six Harlan
Twenty-Seven Knox, Laurel
Twenty-Eight Pulaski, Rockcastle
Twenty-Nine Adair, Casey
Thirty Jefferson
Thirty-One Floyd
Thirty-Two Boyd
Thirty-Three Perry
Thirty-Four McCreary, Whitley
Thirty-Five Pike
Thirty-Six Knott, Magoffin
Source: Administrative Office of the Courts

Sourcebook of Criminal Justice Statistics in the Commonwealth
100
Table 7.3: Kentucky Court Districts Judicial District Counties
Thirty-Seven Carter, Elliott, Morgan
Thirty-Eight Butler, Edmondson, Hancock, Ohio
Thirty-Nine Breathitt, Powell, Wolfe
Forty Clinton, Russell, Wayne
Forty-One Clay, Jackson, Leslie
Forty-Two Calloway
Forty-Three Barren, Metcalfe
Forty-Four Bell
Forty-Five McLean, Muhlenberg
Forty-Six Breckenridge, Grayson, Meade
Forty-Seven Letcher
Forty-Eight Franklin
Forty-Nine Allen, Simpson
Fifty Boyle, Mercer
Fifty-One Henderson
Fifty-Two Graves
Fifty-Three Anderson, Shelby, Spencer
Fifty-Four Boone, Gallatin
Fifty-Five Bullitt,
Fifty-Six Caldwell, Livingston, Lyon, Trigg
Fifty-Seven Nelson
Fifty-Eight Marshall
Fifty-Nine Ballard, Carlisle
Sixty Cumberland, Monroe
Source: Administrative Office of the Courts
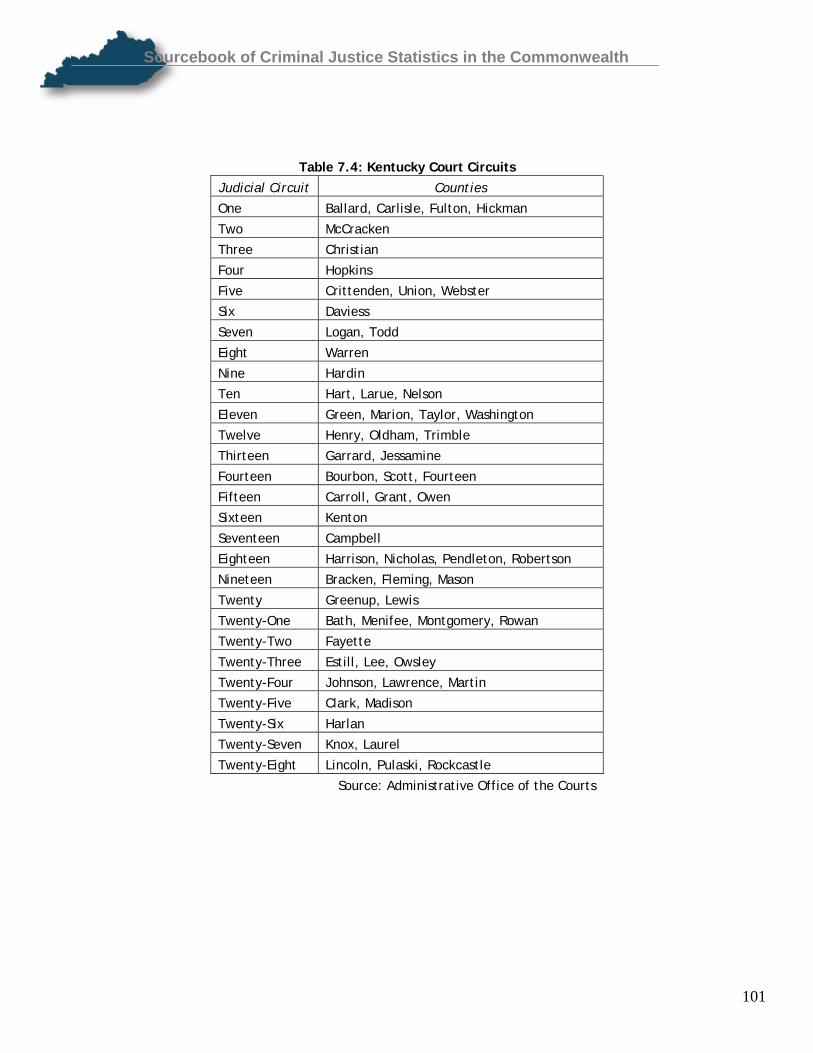
Sourcebook of Criminal Justice Statistics in the Commonwealth
101
Table 7.4: Kentucky Court Circuits Judicial Circuit Counties
One Ballard, Carlisle, Fulton, Hickman
Two McCracken
Three Christian
Four Hopkins
Five Crittenden, Union, Webster
Six Daviess
Seven Logan, Todd
Eight Warren
Nine Hardin
Ten Hart, Larue, Nelson
Eleven Green, Marion, Taylor, Washington
Twelve Henry, Oldham, Trimble
Thirteen Garrard, Jessamine
Fourteen Bourbon, Scott, Fourteen
Fifteen Carroll, Grant, Owen
Sixteen Kenton
Seventeen Campbell
Eighteen Harrison, Nicholas, Pendleton, Robertson
Nineteen Bracken, Fleming, Mason
Twenty Greenup, Lewis
Twenty-One Bath, Menifee, Montgomery, Rowan
Twenty-Two Fayette
Twenty-Three Estill, Lee, Owsley
Twenty-Four Johnson, Lawrence, Martin
Twenty-Five Clark, Madison
Twenty-Six Harlan
Twenty-Seven Knox, Laurel
Twenty-Eight Lincoln, Pulaski, Rockcastle
Source: Administrative Office of the Courts

Sourcebook of Criminal Justice Statistics in the Commonwealth
102
Table 7.4: Kentucky Court Circuits, Continued Judicial Circuit Counties
Twenty-Nine Adair, Casey
Thirty Jefferson
Thirty-One Floyd
Thirty-Two Boyd
Thirty-Three Perry
Thirty-Four McCreary, Whitley
Thirty-Five Pike
Thirty-Six Knott, Magoffin
Thirty-Seven Carter, Elliott, Morgan
Thirty-Eight Butler, Edmondson, Hancock, Ohio
Thirty-Nine Breathitt, Powell, Wolfe
Forty Clinton, Cumberland, Monroe
Forty-One Clay, Jackson, Leslie
Forty-Two Calloway, Marshall
Forty-Three Barren, Metcalfe
Forty-Four Bell
Forty-Five McLean, Muhlenberg
Forty-Six Breckenridge, Grayson, Meade
Forty-Seven Letcher
Forty-Eight Franklin
Forty-Nine Allen, Simpson
Fifty Boyle, Mercer
Fifty-One Henderson
Fifty-Two Graves
Fifty-Three Anderson, Shelby, Spencer
Fifty-Four Boone, Gallatin
Fifty-Five Bullitt
Fifty-Six Caldwell, Livingston, Lyon, Trigg
Fifty-Seven Russell, Wayne
Source: Administrative Office of the Courts
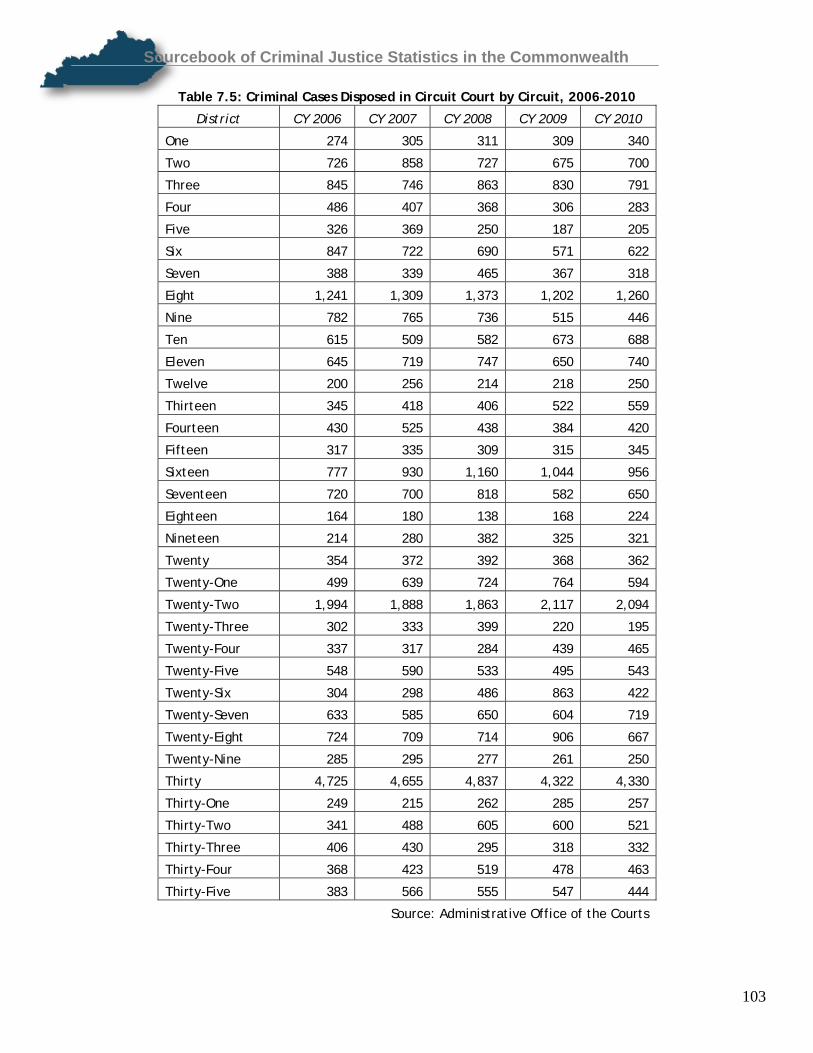
Sourcebook of Criminal Justice Statistics in the Commonwealth
103
Table 7.5: Criminal Cases Disposed in Circuit Court by Circuit, 2006-2010
District CY 2006 CY 2007 CY 2008 CY 2009 CY 2010
One 274 305 311 309 340
Two 726 858 727 675 700
Three 845 746 863 830 791
Four 486 407 368 306 283
Five 326 369 250 187 205
Six 847 722 690 571 622
Seven 388 339 465 367 318
Eight 1,241 1,309 1,373 1,202 1,260
Nine 782 765 736 515 446
Ten 615 509 582 673 688
Eleven 645 719 747 650 740
Twelve 200 256 214 218 250
Thirteen 345 418 406 522 559
Fourteen 430 525 438 384 420
Fifteen 317 335 309 315 345
Sixteen 777 930 1,160 1,044 956
Seventeen 720 700 818 582 650
Eighteen 164 180 138 168 224
Nineteen 214 280 382 325 321
Twenty 354 372 392 368 362
Twenty-One 499 639 724 764 594
Twenty-Two 1,994 1,888 1,863 2,117 2,094
Twenty-Three 302 333 399 220 195
Twenty-Four 337 317 284 439 465
Twenty-Five 548 590 533 495 543
Twenty-Six 304 298 486 863 422
Twenty-Seven 633 585 650 604 719
Twenty-Eight 724 709 714 906 667
Twenty-Nine 285 295 277 261 250
Thirty 4,725 4,655 4,837 4,322 4,330
Thirty-One 249 215 262 285 257
Thirty-Two 341 488 605 600 521
Thirty-Three 406 430 295 318 332
Thirty-Four 368 423 519 478 463
Thirty-Five 383 566 555 547 444
Source: Administrative Office of the Courts

Sourcebook of Criminal Justice Statistics in the Commonwealth
104
Table 7.5: Criminal Cases Disposed in Circuit Court by Circuit, 2006-2010, Continued
District CY 2006 CY 2007 CY 2008 CY 2009 CY 2010
Thirty-Six 174 156 156 145 101
Thirty-Seven 272 287 380 488 351
Thirty-Eight 544 409 419 454 457
Thirty-Nine 417 464 517 597 367
Forty 363 465 437 265 276
Forty-One 497 276 381 325 352
Forty-Two 423 701 466 462 541
Forty-Three 609 486 415 352 492
Forty-Four 289 361 405 361 261
Forty-Five 277 294 330 318 226
Forty-Six 478 478 441 409 407
Forty-Seven 247 305 371 362 253
Forty-Eight 273 352 290 315 286
Forty-Nine 343 283 355 240 265
Fifty 300 294 418 342 279
Fifty-One 355 284 344 282 289
Fifty-Two 383 387 359 338 322
Fifty-Three 466 487 402 413 415
Fifty-Four 865 981 842 837 873
Fifty-Five 323 396 512 504 535
Fifty-Six 322 269 297 318 361
Fifty-Seven 371 327 478 471 264
STATEWIDE TOTAL 31,385 32,217 33,387 32,028 30,749
Source: Administrative Office of the Courts
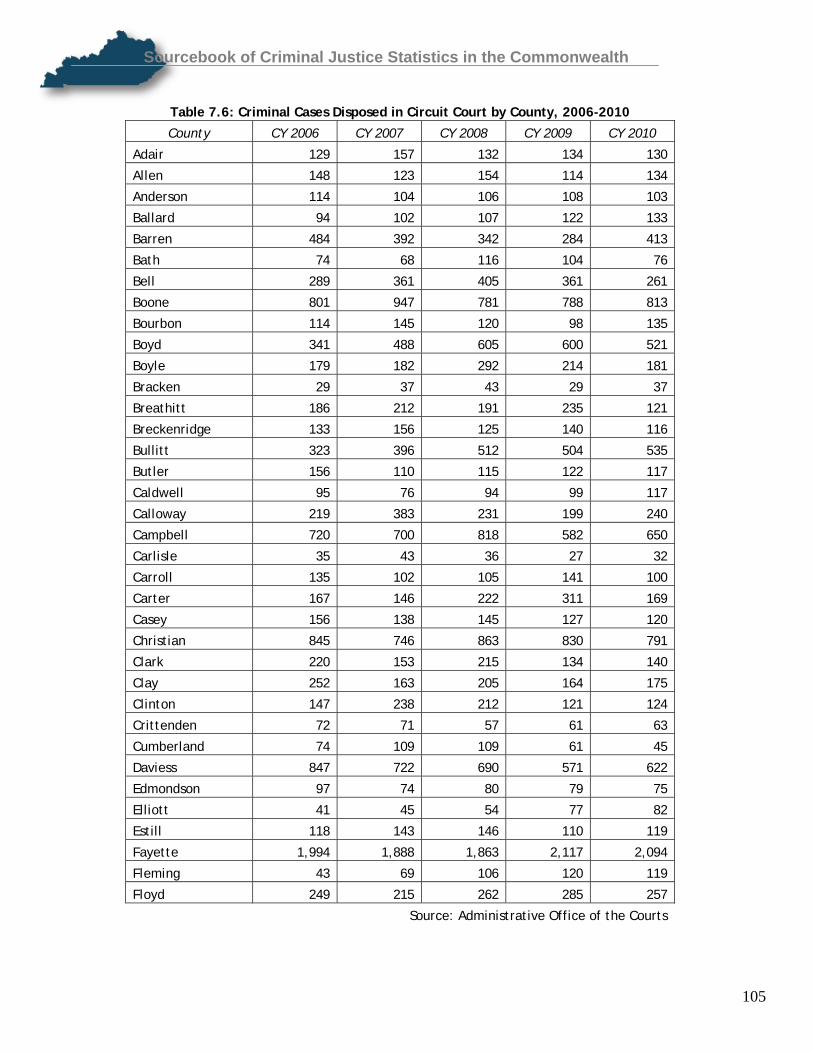
Sourcebook of Criminal Justice Statistics in the Commonwealth
105
Table 7.6: Criminal Cases Disposed in Circuit Court by County, 2006-2010
County CY 2006 CY 2007 CY 2008 CY 2009 CY 2010
Adair 129 157 132 134 130
Allen 148 123 154 114 134
Anderson 114 104 106 108 103
Ballard 94 102 107 122 133
Barren 484 392 342 284 413
Bath 74 68 116 104 76
Bell 289 361 405 361 261
Boone 801 947 781 788 813
Bourbon 114 145 120 98 135
Boyd 341 488 605 600 521
Boyle 179 182 292 214 181
Bracken 29 37 43 29 37
Breathitt 186 212 191 235 121
Breckenridge 133 156 125 140 116
Bullitt 323 396 512 504 535
Butler 156 110 115 122 117
Caldwell 95 76 94 99 117
Calloway 219 383 231 199 240
Campbell 720 700 818 582 650
Carlisle 35 43 36 27 32
Carroll 135 102 105 141 100
Carter 167 146 222 311 169
Casey 156 138 145 127 120
Christian 845 746 863 830 791
Clark 220 153 215 134 140
Clay 252 163 205 164 175
Clinton 147 238 212 121 124
Crittenden 72 71 57 61 63
Cumberland 74 109 109 61 45
Daviess 847 722 690 571 622
Edmondson 97 74 80 79 75
Elliott 41 45 54 77 82
Estill 118 143 146 110 119
Fayette 1,994 1,888 1,863 2,117 2,094
Fleming 43 69 106 120 119
Floyd 249 215 262 285 257
Source: Administrative Office of the Courts

Sourcebook of Criminal Justice Statistics in the Commonwealth
106
Table 7.6: Criminal Cases Disposed in Circuit Court by County, 2006-2010, Continued
County CY 2006 CY 2007 CY 2008 CY 2009 CY 2010
Franklin 273 352 290 315 286
Fulton 105 129 119 117 123
Gallatin 64 34 61 49 60
Garrard 75 90 67 147 119
Grant 126 166 153 94 183
Graves 383 387 359 338 322
Grayson 194 169 167 147 151
Green 88 72 58 79 105
Greenup 265 244 263 238 245
Hancock 68 51 43 36 41
Hardin 782 765 736 515 446
Harlan 304 298 486 863 422
Harrison 66 70 62 70 109
Hart 175 127 148 237 193
Henderson 355 284 344 282 289
Henry 67 100 65 91 61
Hickman 40 31 49 43 52
Hopkins 486 407 368 306 283
Jackson 151 45 112 99 118
Jefferson 4,725 4,655 4,837 4,322 4,330
Jessamine 270 328 339 375 440
Johnson 189 128 132 202 186
Kenton 777 930 1,160 1,044 956
Knott 90 73 76 82 56
Knox 194 230 189 180 223
Larue 63 54 95 100 115
Laurel 439 355 461 424 496
Lawrence 55 84 87 138 145
Lee 61 119 143 68 57
Leslie 94 68 64 62 59
Letcher 247 305 371 362 253
Lewis 89 128 129 130 117
Lincoln 113 146 162 133 103
Source: Administrative Office of the Courts

Sourcebook of Criminal Justice Statistics in the Commonwealth
107
Table 7.6: Criminal Cases Disposed in Circuit Court by County, 2006-2010, Continued
County CY 2006 CY 2007 CY 2008 CY 2009 CY 2010
Livingston 58 66 47 59 63
Logan 274 256 313 247 229
Lyon 79 67 78 75 97
Madison 328 437 318 361 403
Magoffin 84 83 80 63 45
Marion 219 280 301 242 294
Marshall 204 318 235 263 301
Martin 93 105 65 99 134
Mason 142 174 233 176 165
McCracken 726 858 727 675 700
McCreary 178 238 231 195 190
McLean 51 49 45 43 47
Meade 151 153 149 122 140
Menifee 45 75 56 66 60
Mercer 121 112 126 128 98
Metcalfe 125 94 73 68 79
Monroe 142 118 116 83 107
Montgomery 211 304 309 333 270
Morgan 64 96 104 100 100
Muhlenberg 226 245 285 275 179
Nelson 377 328 339 336 380
Nicholas 36 71 32 26 36
Ohio 223 174 181 217 224
Oldham 100 93 109 89 150
Owen 56 67 51 80 62
Owsley 123 71 110 42 19
Source: Administrative Office of the Courts

Sourcebook of Criminal Justice Statistics in the Commonwealth
108
Table 7.6: Criminal Cases Disposed in Circuit Court by County, 2006-2010, Continued
County CY 2006 CY 2007 CY 2008 CY 2009 CY 2010
Pendleton 52 27 37 58 62
Perry 406 430 295 318 332
Pike 383 566 555 547 444
Powell 157 174 257 251 177
Pulaski 459 452 478 631 424
Robertson 10 12 7 14 17
Rockcastle 152 111 74 142 140
Rowan 169 192 243 261 188
Russell 151 113 223 239 97
Scott 230 263 230 205 176
Shelby 304 328 242 231 264
Simpson 195 160 201 126 131
Spencer 48 55 54 74 48
Taylor 254 266 249 251 238
Todd 114 83 152 120 89
Trigg 90 60 78 85 84
Trimble 33 63 40 38 39
Union 127 155 95 64 72
Warren 1,241 1,309 1,373 1,202 1,260
Washington 84 101 139 78 103
Wayne 220 214 255 232 167
Webster 127 143 98 62 70
Whitley 190 185 288 283 273
Wolfe 74 78 69 111 69
Woodford 86 117 88 81 109
STATEWIDE TOTAL 31,385 32,217 33,387 32,028 30,749
Source: Administrative Office of the Courts

Sourcebook of Criminal Justice Statistics in the Commonwealth
109
Table 7.7: Felony Cases Disposed in District Court by County, 2006-2010, Continued
County CY 2006 CY 2007 CY 2008 CY 2009 CY 2010
Adair 197 182 159 120 125
Allen 287 245 212 192 199
Anderson 183 171 194 153 149
Ballard 99 125 100 130 131
Barren 307 323 331 391 409
Bath 63 69 79 91 82
Bell 536 495 634 475 578
Boone 1,713 1,573 1,560 1,396 1,114
Bourbon 429 373 353 313 307
Boyd 664 488 727 712 635
Boyle 366 410 388 365 311
Bracken 60 39 43 31 46
Breathitt 200 183 214 148 104
Breckenridge 163 136 169 143 151
Bullitt 782 843 992 1,044 897
Butler 108 77 124 108 120
Caldwell 166 176 130 146 177
Calloway 433 394 409 346 328
Campbell 1,269 1,146 1,039 957 947
Carlisle 65 54 46 52 46
Carroll 198 205 168 184 153
Carter 319 203 327 288 304
Casey 118 121 99 123 131
Christian 1,268 1,334 1,267 1,125 1,055
Clark 460 604 678 629 604
Clay 538 357 404 362 381
Clinton 93 108 111 102 65
Crittenden 130 116 90 100 90
Cumberland 123 92 73 67 33
Daviess 1,174 921 936 967 884
Source: Administrative Office of the Courts

Sourcebook of Criminal Justice Statistics in the Commonwealth
110
Table 7.7: Felony Cases Disposed in District Court by County, 2006-2010,
Continued
County CY 2006 CY 2007 CY 2008 CY 2009 CY 2010
Edmondson 51 55 50 65 90
Elliott 83 76 124 49 78
Estill 197 167 146 145 143
Fayette 4,411 4,240 4,273 4,261 3,988
Fleming 88 87 119 101 120
Floyd 501 437 525 493 482
Franklin 506 530 459 456 398
Fulton 104 168 154 153 166
Gallatin 161 164 143 132 143
Garrard 166 140 164 160 101
Grant 208 231 177 213 237
Graves 677 659 564 580 550
Grayson 203 186 188 210 238
Green 49 61 53 67 62
Greenup 361 368 412 362 295
Hancock 76 92 74 73 67
Hardin 1,154 1,029 1,083 906 822
Harlan 780 577 1,039 491 383
Harrison 169 201 226 168 208
Hart 190 180 256 192 241
Henderson 648 680 652 544 552
Henry 212 189 173 200 125
Hickman 51 72 70 75 55
Hopkins 787 598 577 626 610
Jackson 189 139 136 169 152
Jefferson 15,804 16,518 16,566 16,092 14,112
Jessamine 487 601 510 510 291
Johnson 244 323 290 321 376
Kenton 2,140 1,885 2,189 1,983 1,838
Knott 163 168 138 124 142
Knox 418 366 423 419 560
Larue 94 119 144 131 160
Laurel 722 759 797 764 795
Source: Administrative Office of the Courts

Sourcebook of Criminal Justice Statistics in the Commonwealth
111
Table 7.7: Felony Cases Disposed in District Court by County, 2006-2010, Continued
County CY 2006 CY 2007 CY 2008 CY 2009 CY 2010
Lawrence 151 214 179 171 170
Lee 156 172 146 137 123
Leslie 215 144 101 215 125
Letcher 436 370 343 312 348
Lewis 114 101 122 114 113
Lincoln 220 199 234 233 214
Livingston 126 82 81 105 89
Logan 261 283 276 223 211
Lyon 105 115 105 120 96
Madison 791 862 813 910 900
Magoffin 249 253 195 187 198
Marion 160 156 166 200 133
Marshall 335 296 285 318 289
Martin 178 143 142 139 106
Mason 238 258 252 237 259
McCracken 1,078 1,186 915 774 784
McCreary 295 343 284 220 235
McLean 77 78 58 70 71
Meade 251 169 188 188 167
Menifee 80 59 78 61 58
Mercer 322 271 261 275 235
Metcalfe 128 126 109 113 98
Monroe 135 131 146 82 59
Montgomery 207 232 289 280 247
Morgan 108 97 130 113 119
Muhlenberg 281 369 462 413 363
Nelson 275 264 338 289 286
Nicholas 73 74 70 67 114
Ohio 209 207 236 232 245
Oldham 403 384 333 385 345
Source: Administrative Office of the Courts

Sourcebook of Criminal Justice Statistics in the Commonwealth
112
Table 7.7: Felony Cases Disposed in District Court by County, 2006-2010, Continued
County CY 2006 CY 2007 CY 2008 CY 2009 CY 2010
Owen 100 111 87 87 87
Owsley 134 119 82 109 139
Pendleton 95 107 118 110 151
Perry 407 336 337 367 322
Pike 901 784 824 845 500
Powell 248 282 297 259 245
Pulaski 536 565 648 670 708
Robertson 13 20 25 14 39
Rockcastle 211 266 246 282 368
Rowan 194 196 231 286 301
Russell 274 238 231 219 164
Scott 467 420 528 489 424
Shelby 399 423 368 353 364
Simpson 310 314 251 243 251
Spencer 129 123 127 131 131
Taylor 207 197 217 192 174
Todd 156 157 157 141 119
Trigg 121 173 181 132 146
Trimble 86 130 101 108 70
Union 251 205 156 163 191
Warren 1,107 883 933 898 939
Washington 49 60 79 56 45
Wayne 269 195 239 285 227
Webster 215 216 172 160 171
Whitley 473 588 600 588 733
Wolfe 62 86 70 67 74
Woodford 202 152 136 153 134
STATEWIDE TOTAL 59,878 58,612 59,728 57,085 53,153
Source: Administrative Office of the Courts

Sourcebook of Criminal Justice Statistics in the Commonwealth
113
Table 7.8: Misdemeanor Cases Disposed in District Court by County, 2006-2010
County CY 2006 CY 2007 CY 2008 CY 2009 CY 2010
Adair 692 603 590 474 469
Allen 651 726 882 693 533
Anderson 727 625 686 551 485
Ballard 206 281 259 266 339
Barren 1,701 1,637 1,631 1,762 1,496
Bath 360 304 399 423 267
Bell 1,401 1,375 1,243 1,134 1,213
Boone 3,589 3,749 3,197 3,099 2,763
Bourbon 884 855 914 1,013 642
Boyd 1,548 1,369 1,927 1,496 1,320
Boyle 1,012 938 882 939 880
Bracken 136 177 205 153 154
Breathitt 598 585 622 455 381
Breckenridge 624 558 590 521 476
Bullitt 1,712 1,813 1,818 1,830 1,704
Butler 229 268 269 220 220
Caldwell 406 420 412 399 437
Calloway 813 1,002 1,023 1,024 883
Campbell 3,723 3,484 3,573 2,905 3,361
Carlisle 93 115 132 104 105
Carroll 656 703 627 643 471
Carter 691 840 642 641 589
Casey 551 573 682 567 546
Christian 2,069 2,220 2,314 2,517 2,287
Clark 1,515 1,609 1,457 1,490 1,455
Clay 1,178 959 824 747 813
Clinton 431 487 519 440 350
Crittenden 422 327 297 362 318
Cumberland 387 393 401 248 220
Daviess 3,772 3,461 2,934 3,011 3,096
Source: Administrative Office of the Courts

Sourcebook of Criminal Justice Statistics in the Commonwealth
114
Table 7.8: Misdemeanor Cases Disposed in District Court by County, 2006-2010, Continued
County CY 2006 CY 2007 CY 2008 CY 2009 CY 2010
Edmondson 235 209 222 191 275
Elliott 179 196 131 135 145
Estill 590 524 425 380 425
Fayette 14,161 13,907 13,906 12,962 13,674
Fleming 252 256 251 249 233
Floyd 1,631 1,563 1,758 1,743 1,750
Franklin 2,166 2,238 1,967 1,832 1,653
Fulton 415 445 490 442 350
Gallatin 558 591 506 443 335
Garrard 403 498 501 510 407
Grant 565 526 500 344 467
Graves 1,305 1,369 1,251 1,169 1,214
Grayson 1,121 1,142 983 782 861
Green 301 304 319 298 314
Greenup 960 868 869 787 860
Hancock 261 225 213 185 145
Hardin 2,823 3,227 2,923 2,750 2,342
Harlan 1,561 1,712 1,450 1,378 1,207
Harrison 791 764 808 708 621
Hart 533 659 622 544 500
Henderson 2,656 2,481 2,477 2,325 2,227
Henry 616 558 655 579 405
Hickman 75 100 106 104 125
Hopkins 1,809 1,696 1,673 1,536 1,470
Jackson 345 413 372 384 345
Jefferson 28,473 32,494 31,418 30,121 29,781
Jessamine 1,321 1,490 1,627 1,730 1,627
Johnson 917 967 841 1,001 1,157
Kenton 6,801 6,933 7,115 6,296 5,829
Knott 788 840 607 588 480
Knox 1,422 1,198 1,119 1,259 1,169
Larue 319 380 324 320 382
Laurel 1,821 1,880 1,885 1,567 1,462
Source: Administrative Office of the Courts

Sourcebook of Criminal Justice Statistics in the Commonwealth
115
Table 7.8: Misdemeanor Cases Disposed in District Court by County, 2006-2010, Continued
County CY 2006 CY 2007 CY 2008 CY 2009 CY 2010
Lawrence 507 590 565 492 542
Lee 284 283 262 319 292
Leslie 413 377 365 366 240
Letcher 843 709 791 704 665
Lewis 412 323 400 294 251
Lincoln 618 692 855 803 691
Livingston 258 270 220 233 263
Logan 756 796 720 691 646
Lyon 455 423 418 324 325
Madison 3,168 3,443 3,135 3,107 2,644
Magoffin 611 466 897 510 477
Marion 829 913 768 683 668
Marshall 778 774 847 817 675
Martin 496 397 360 342 304
Mason 727 715 771 741 649
McCracken 2,637 2,893 2,688 2,539 2,380
McCreary 599 713 680 554 726
McLean 277 295 257 214 224
Meade 652 763 719 587 516
Menifee 242 262 252 263 229
Mercer 781 685 638 548 558
Metcalfe 325 358 284 207 161
Monroe 472 330 340 231 266
Montgomery 1,075 929 925 912 740
Morgan 317 367 333 339 284
Muhlenberg 831 1,150 1,344 1,382 1,252
Nelson 1,669 1,694 1,709 1,454 1,285
Nicholas 228 265 254 220 243
Ohio 560 474 528 521 472
Oldham 1,014 978 969 830 898
Source: Administrative Office of the Courts

Sourcebook of Criminal Justice Statistics in the Commonwealth
116
Table 7.8: Misdemeanor Cases Disposed in District Court by County, 2006-2010, Continued
County CY 2006 CY 2007 CY 2008 CY 2009 CY 2010
Owen 349 277 296 276 225
Owsley 336 373 262 226 184
Pendleton 429 442 499 372 304
Perry 1,129 1,140 1,105 1,125 985
Pike 2,925 2,859 2,727 2,697 2,789
Powell 767 859 648 633 637
Pulaski 1,755 1,954 2,052 2,035 1,893
Robertson 52 67 45 31 46
Rockcastle 640 596 587 570 626
Rowan 1,151 1,144 995 1,152 1,153
Russell 946 931 904 696 579
Scott 1,267 1,245 1,091 1,100 1,033
Shelby 816 981 848 824 884
Simpson 544 642 637 640 513
Spencer 529 508 526 454 380
Taylor 815 989 881 851 603
Todd 278 374 281 259 213
Trigg 313 374 424 466 397
Trimble 206 198 215 142 149
Union 608 513 519 434 480
Warren 4,359 3,686 3,762 3,640 3,696
Washington 276 308 367 315 191
Wayne 805 901 981 955 837
Webster 449 455 358 352 359
Whitley 1,381 1,446 1,469 1,398 1,423
Wolfe 371 401 347 325 260
Woodford 584 567 577 491 486
STATEWIDE TOTAL 157,865 162,666 158,962 149,455 143,401
Source: Administrative Office of the Courts

Sourcebook of Criminal Justice Statistics in the Commonwealth
117
Table 7.9: Juvenile Cases Disposed in District Court by County, 2006-2010
County CY 2006 CY 2007 CY 2008 CY 2009 CY 2010
Adair 224 203 229 274 183
Allen 271 150 51 53 66
Anderson 206 140 65 72 83
Ballard 59 89 79 90 74
Barren 179 177 189 159 130
Bath 107 110 135 126 227
Bell 513 406 487 377 351
Boone 505 547 505 435 380
Bourbon 312 174 129 193 125
Boyd 802 432 550 548 396
Boyle 138 164 84 76 68
Bracken 71 82 86 66 36
Breathitt 376 277 184 47 66
Breckenridge 183 232 247 190 173
Bullitt 1,096 661 352 279 241
Butler 126 45 151 43 51
Caldwell 191 175 150 154 143
Calloway 359 102 150 74 94
Campbell 867 591 574 422 387
Carlisle 55 61 54 46 36
Carroll 182 145 170 154 164
Carter 81 91 78 132 48
Casey 216 188 164 247 183
Christian 538 651 581 466 348
Clark 111 113 102 148 183
Clay 124 40 59 37 34
Clinton 115 90 105 126 92
Crittenden 23 24 17 20 13
Cumberland 71 93 160 53 34
Daviess 1,686 1,625 1,683 1,485 1,495
Source: Administrative Office of the Courts

Sourcebook of Criminal Justice Statistics in the Commonwealth
118
Table 7.9: Juvenile Cases Disposed in District Court by County, 2006-2010, Continued
County CY 2006 CY 2007 CY 2008 CY 2009 CY 2010
Edmondson 125 31 25 20 35
Elliott 12 15 18 10 36
Estill 172 183 187 143 140
Fayette 638 574 695 659 605
Fleming 113 107 148 114 102
Floyd 110 85 51 5 3
Franklin 238 275 215 269 210
Fulton 206 200 190 174 124
Gallatin 93 89 86 97 90
Garrard 159 93 52 56 224
Grant 336 225 272 221 223
Graves 426 383 342 387 372
Grayson 430 406 424 390 302
Green 95 95 105 64 83
Greenup 256 383 105 72 71
Hancock 92 51 40 21 33
Hardin 476 370 430 313 354
Harlan 523 433 411 366 301
Harrison 85 119 110 101 41
Hart 200 157 164 167 130
Henderson 464 455 374 315 356
Henry 50 42 32 30 59
Hickman 58 58 69 72 68
Hopkins 440 223 254 202 176
Jackson 19 27 19 23 34
Jefferson 5,329 6,126 5,217 4,182 3,720
Jessamine 596 262 248 357 243
Johnson 61 68 50 52 54
Kenton 2,440 1,274 845 580 589
Knott 44 65 58 64 33
Knox 280 114 100 71 142
Larue 136 222 193 448 215
Laurel 673 287 168 170 207
Source: Administrative Office of the Courts

Sourcebook of Criminal Justice Statistics in the Commonwealth
119
Table 7.9: Juvenile Cases Disposed in District Court by County, 2006-2010, Continued
County CY 2006 CY 2007 CY 2008 CY 2009 CY 2010
Lawrence 28 46 69 23 60
Lee 135 82 108 16 79
Leslie 133 23 28 39 18
Letcher 489 458 469 414 423
Lewis 110 115 41 59 49
Lincoln 99 114 113 113 141
Livingston 102 127 86 90 55
Logan 275 273 275 258 223
Lyon 59 59 77 65 56
Madison 299 283 254 327 155
Magoffin 36 317 24 31 20
Marion 181 220 182 199 169
Marshall 272 112 73 111 113
Martin 25 37 37 36 25
Mason 204 193 199 185 171
McCracken 344 384 299 206 227
McCreary 517 396 330 289 388
McLean 207 255 152 154 160
Meade 253 265 254 201 182
Menifee 74 61 68 94 70
Mercer 44 71 73 93 97
Metcalfe 85 45 45 45 24
Monroe 119 123 115 81 109
Montgomery 337 311 305 272 261
Morgan 50 40 24 34 39
Muhlenberg 296 369 316 444 261
Nelson 516 461 540 415 411
Nicholas 26 26 21 15 23
Ohio 268 432 93 128 67
Oldham 115 121 147 103 115
Source: Administrative Office of the Courts

Sourcebook of Criminal Justice Statistics in the Commonwealth
120
Table 7.9: Juvenile Cases Disposed in District Court by County, 2006-2010, Continued
County CY 2006 CY 2007 CY 2008 CY 2009 CY 2010
Owen 105 108 76 74 64
Owsley 74 101 87 82 71
Pendleton 63 85 91 84 65
Perry 392 396 407 411 437
Pike 176 136 92 101 98
Powell 299 425 172 82 115
Pulaski 194 165 184 197 211
Robertson 18 23 13 9 8
Rockcastle 28 38 22 26 19
Rowan 167 151 215 233 225
Russell 128 173 60 91 111
Scott 355 239 151 104 99
Shelby 366 252 88 153 248
Simpson 253 204 98 89 71
Spencer 127 87 67 42 36
Taylor 281 301 221 239 275
Todd 74 96 131 81 90
Trigg 136 82 127 94 131
Trimble 23 17 22 27 72
Union 89 61 52 79 50
Warren 380 411 362 352 262
Washington 85 121 113 84 113
Wayne 279 176 176 335 69
Webster 49 39 41 38 39
Whitley 591 454 420 337 348
Wolfe 165 188 117 49 37
Woodford 262 121 74 82 78
STATEWIDE TOTAL 36,019 31,844 27,763 24,922 22,912
Source: Administrative Office of the Courts

Sourcebook of Criminal Justice Statistics in the Commonwealth
121
Table 7.10: Domestic Violence Cases Disposed in District Court by County, 2006-2010
County CY 2006 CY 2007 CY 2008 CY 2009 CY 2010
Adair 95 103 114 98 122
Allen 93 58 44 10 18
Anderson 73 14 8 11 5
Ballard 16 29 22 20 10
Barren 2 1 0 1 13
Bath 93 99 118 94 91
Bell 237 271 223 215 240
Boone 0 2 6 5 6
Bourbon 103 33 0 1 7
Boyd 357 438 405 370 378
Boyle 136 12 3 0 0
Bracken 45 31 47 40 56
Breathitt 143 117 35 2 1
Breckenridge 97 53 99 68 69
Bullitt 306 388 375 444 315
Butler 33 4 1 0 1
Caldwell 75 92 77 97 71
Calloway 87 8 13 11 11
Campbell 56 2 1 3 3
Carlisle 16 15 16 14 18
Carroll 68 68 86 76 62
Carter 34 22 32 7 1
Casey 135 126 132 104 112
Christian 2 4 2 3 13
Clark 39 103 173 191 169
Clay 183 175 99 7 2
Clinton 99 95 94 84 72
Crittenden 2 1 0 3 2
Cumberland 53 62 48 37 43
Daviess 429 437 516 475 447
Source: Administrative Office of the Courts

Sourcebook of Criminal Justice Statistics in the Commonwealth
122
Table 7.10: Domestic Violence Cases Disposed in District Court by County, 2006-2010, Continued
County CY 2006 CY 2007 CY 2008 CY 2009 CY 2010
Edmondson 53 14 24 28 16
Elliott 6 3 5 3 9
Estill 210 173 185 151 151
Fayette 0 10 5 6 2
Fleming 102 92 91 73 87
Floyd 5 0 2 2 0
Franklin 8 8 25 25 13
Fulton 18 41 22 21 27
Gallatin 10 8 2 7 5
Garrard 117 47 60 17 25
Grant 153 158 156 128 140
Graves 112 113 144 114 134
Grayson 104 94 87 111 110
Green 38 55 36 51 49
Greenup 178 25 6 7 11
Hancock 40 21 8 17 9
Hardin 0 20 6 9 8
Harlan 294 299 245 277 242
Harrison 2 0 0 0 0
Hart 72 63 49 85 68
Henderson 10 18 15 10 4
Henry 1 1 2 1 9
Hickman 11 16 13 9 18
Hopkins 271 74 7 1 2
Jackson 0 0 0 0 0
Jefferson 0 0 8 19 16
Jessamine 253 5 0 54 58
Johnson 26 21 9 9 16
Kenton 717 19 27 78 24
Knott 1 0 0 0 0
Knox 350 80 379 100 84
Larue 87 71 58 59 43
Laurel 634 109 67 36 67
Source: Administrative Office of the Courts

Sourcebook of Criminal Justice Statistics in the Commonwealth
123
Table 7.10: Domestic Violence Cases Disposed in District Court by County, 2006-2010, Continued
County CY 2006 CY 2007 CY 2008 CY 2009 CY 2010
Lawrence 8 17 29 32 25
Lee 113 94 89 38 62
Leslie 11 4 3 6 12
Letcher 219 218 221 213 200
Lewis 73 72 83 59 47
Lincoln 5 9 6 8 1
Livingston 38 49 42 68 52
Logan 32 48 43 45 59
Lyon 40 24 23 26 31
Madison 10 5 6 6 12
Magoffin 0 142 3 1 1
Marion 85 88 113 103 90
Marshall 149 49 48 19 13
Martin 20 52 133 87 70
Mason 122 122 161 121 98
McCracken 16 4 3 4 0
McCreary 116 89 85 69 87
McLean 43 25 31 52 36
Meade 116 101 103 117 115
Menifee 84 51 37 50 70
Mercer 9 4 4 9 6
Metcalfe 0 0 0 0 2
Monroe 91 86 66 61 49
Montgomery 265 281 269 275 288
Morgan 10 6 4 5 12
Muhlenberg 135 154 160 188 175
Nelson 212 266 311 317 314
Nicholas 2 1 0 0 1
Ohio 138 80 31 7 5
Oldham 7 3 1 16 8
Source: Administrative Office of the Courts

Sourcebook of Criminal Justice Statistics in the Commonwealth
124
Table 7.10: Domestic Violence Cases Disposed in District Court by County, 2006-2010, Continued
County CY 2006 CY 2007 CY 2008 CY 2009 CY 2010
Owen 28 34 41 62 54
Owsley 80 68 52 50 46
Pendleton 2 1 1 1 0
Perry 216 225 256 266 237
Pike 18 12 24 21 4
Powell 127 157 52 39 50
Pulaski 2 3 5 0 6
Robertson 0 0 0 0 1
Rockcastle 10 7 9 4 3
Rowan 56 77 108 97 116
Russell 69 35 2 0 0
Scott 250 80 1 14 28
Shelby 116 13 1 21 2
Simpson 98 30 2 3 11
Spencer 49 1 0 0 2
Taylor 141 113 136 122 115
Todd 30 40 35 39 26
Trigg 60 67 71 74 44
Trimble 5 9 11 4 4
Union 1 3 1 2 4
Warren 10 26 2 1 4
Washington 38 34 27 22 29
Wayne 101 30 0 4 0
Webster 7 3 8 2 5
Whitley 91 81 91 41 45
Wolfe 71 79 43 3 1
Woodford 109 31 0 3 15
STATEWIDE TOTAL 10,944 7,924 7,619 6,896 6,598
Source: Administrative Office of the Courts

Sourcebook of Criminal Justice Statistics in the Commonwealth
125
Table 7.11: Closed Felony District Court Cases, 2006-2010
District CY 2006 CY 2007 CY 2008 CY 2009 CY 2010
One 155 240 224 228 221
Two 1,078 1,186 915 774 784
Three 1,268 1,334 1,267 1,125 1,055
Four 787 598 577 626 610
Five 596 537 418 423 452
Six 1,174 921 936 967 884
Seven 417 440 433 364 330
Eight 1,107 883 933 898 939
Nine 1,154 1,029 1,083 906 822
Ten 284 299 400 323 401
Eleven 465 474 515 515 414
Twelve 701 703 607 693 540
Thirteen 873 940 908 903 606
Fourteen 1,098 945 1,017 955 865
Fifteen 506 547 432 484 477
Sixteen 2,140 1,885 2,189 1,983 1,838
Seventeen 1,269 1,146 1,039 957 947
Eighteen 350 402 439 359 512
Nineteen 386 384 414 369 425
Twenty 475 469 534 476 408
Twenty-One 544 556 677 718 688
Twenty-Two 4,411 4,240 4,273 4,261 3,988
Twenty-Three 487 458 374 391 405
Twenty-Four 573 680 611 631 652
Twenty-Five 1,251 1,466 1,491 1,539 1,504
Twenty-Six 780 577 1,039 491 383
Twenty-Seven 1,140 1,125 1,220 1,183 1,355
Twenty-Eight 747 831 894 952 1,076
Source: Administrative Office of the Courts

Sourcebook of Criminal Justice Statistics in the Commonwealth
126
Table 7.11: Closed Felony District Court Cases, 2006-2010, Continued
District CY 2006 CY 2007 CY 2008 CY 2009 CY 2010
Twenty-Nine 315 303 258 243 256
Thirty 15,804 16,518 16,566 16,092 14,112
Thirty-One 501 437 525 493 482
Thirty-Two 664 488 727 712 635
Thirty-Three 407 336 337 367 322
Thirty-Four 768 931 884 808 968
Thirty-Five 901 784 824 845 500
Thirty-Six 412 421 333 311 340
Thirty-Seven 510 376 581 450 501
Thirty-Eight 444 431 484 478 522
Thirty-Nine 510 551 581 474 423
Forty 636 541 581 606 456
Forty-One 942 640 641 746 658
Forty-Two 433 394 409 346 328
Forty-Three 435 449 440 504 507
Forty-Four 536 495 634 475 578
Forty-Five 358 447 520 483 434
Forty-Six 617 491 545 541 556
Forty-Seven 436 370 343 312 348
Forty-Eight 506 530 459 456 398
Forty-Nine 597 559 463 435 450
Fifty 688 681 649 640 546
Fifty-One 648 680 652 544 552
Fifty-Two 677 659 564 580 550
Fifty-Three 711 717 689 637 644
Fifty-Four 1,874 1,737 1,703 1,528 1,257
Fifty-Five 782 843 992 1,044 897
Fifty-Six 518 546 497 503 508
Fifty-Seven 275 264 338 289 286
Fifty-Eight 335 296 285 318 289
Fifty-Nine 164 179 146 182 177
Sixty 258 223 219 149 92
STATEWIDE TOTAL 59,878 58,612 59,728 57,085 53,153
Source: Administrative Office of the Courts

Sourcebook of Criminal Justice Statistics in the Commonwealth
127
Table 7.12: Closed Misdemeanor District Court Cases, 2006-2010
District CY 2006 CY 2007 CY 2008 CY 2009 CY 2010
One 490 545 596 546 475
Two 2,637 2,893 2,688 2,539 2,380
Three 2,069 2,220 2,314 2,517 2,287
Four 1,809 1,696 1,673 1,536 1,470
Five 1,479 1,295 1,174 1,148 1,157
Six 3,772 3,461 2,934 3,011 3,096
Seven 1,034 1,170 1,001 950 859
Eight 4,359 3,686 3,762 3,640 3,696
Nine 2,823 3,227 2,923 2,750 2,342
Ten 852 1,039 946 864 882
Eleven 2,221 2,514 2,335 2,147 1,776
Twelve 1,836 1,734 1,839 1,551 1,452
Thirteen 2,342 2,680 2,983 3,043 2,725
Fourteen 2,735 2,667 2,582 2,604 2,161
Fifteen 1,570 1,506 1,423 1,263 1,163
Sixteen 6,801 6,933 7,115 6,296 5,829
Seventeen 3,723 3,484 3,573 2,905 3,361
Eighteen 1,500 1,538 1,606 1,331 1,214
Nineteen 1,115 1,148 1,227 1,143 1,036
Twenty 1,372 1,191 1,269 1,081 1,111
Twenty-One 2,828 2,639 2,571 2,750 2,389
Twenty-Two 14,161 13,907 13,906 12,962 13,674
Twenty-Three 1,210 1,180 949 925 901
Twenty-Four 1,920 1,954 1,766 1,835 2,003
Twenty-Five 4,683 5,052 4,592 4,597 4,099
Twenty-Six 1,561 1,712 1,450 1,378 1,207
Twenty-Seven 3,243 3,078 3,004 2,826 2,631
Twenty-Eight 2,395 2,550 2,639 2,605 2,519
Source: Administrative Office of the Courts

Sourcebook of Criminal Justice Statistics in the Commonwealth
128
Table 7.12: Closed Misdemeanor District Court Cases, 2006-2010, Continued
District CY 2006 CY 2007 CY 2008 CY 2009 CY 2010
Twenty-Nine 1,243 1,176 1,272 1,041 1,015
Thirty 28,473 32,494 31,418 30,121 29,781
Thirty-One 1,631 1,563 1,758 1,743 1,750
Thirty-Two 1,548 1,369 1,927 1,496 1,320
Thirty-Three 1,129 1,140 1,105 1,125 985
Thirty-Four 1,980 2,159 2,149 1,952 2,149
Thirty-Five 2,925 2,859 2,727 2,697 2,789
Thirty-Six 1,399 1,306 1,504 1,098 957
Thirty-Seven 1,187 1,403 1,106 1,115 1,018
Thirty-Eight 1,285 1,176 1,232 1,117 1,112
Thirty-Nine 1,736 1,845 1,617 1,413 1,278
Forty 2,182 2,319 2,404 2,091 1,766
Forty-One 1,936 1,749 1,561 1,497 1,398
Forty-Two 813 1,002 1,023 1,024 883
Forty-Three 2,026 1,995 1,915 1,969 1,657
Forty-Four 1,401 1,375 1,243 1,134 1,213
Forty-Five 1,108 1,445 1,601 1,596 1,476
Forty-Six 2,397 2,463 2,292 1,890 1,853
Forty-Seven 843 709 791 704 665
Forty-Eight 2,166 2,238 1,967 1,832 1,653
Forty-Nine 1,195 1,368 1,519 1,333 1,046
Fifty 1,793 1,623 1,520 1,487 1,438
Fifty-One 2,656 2,481 2,477 2,325 2,227
Fifty-Two 1,305 1,369 1,251 1,169 1,214
Fifty-Three 2,072 2,114 2,060 1,829 1,749
Fifty-Four 4,147 4,340 3,703 3,542 3,098
Fifty-Five 1,712 1,813 1,818 1,830 1,704
Fifty-Six 1,432 1,487 1,474 1,422 1,422
Fifty-Seven 1,669 1,694 1,709 1,454 1,285
Fifty-Eight 778 774 847 817 675
Fifty-Nine 299 396 391 370 444
Sixty 859 723 741 479 486
STATEWIDE TOTAL 157,865 162,666 158,962 149,455 143,401
Source: Administrative Office of the Courts

Sourcebook of Criminal Justice Statistics in the Commonwealth
129
Table 7.13: Closed Juvenile District Court Cases, 2006-2010
District CY 2006 CY 2007 CY 2008 CY 2009 CY 2010
One 264 258 259 246 192
Two 344 384 299 206 227
Three 538 651 581 466 348
Four 440 223 254 202 176
Five 161 124 110 137 102
Six 1,686 1,625 1,683 1,485 1,495
Seven 349 369 406 339 313
Eight 380 411 362 352 262
Nine 476 370 430 313 354
Ten 336 379 357 615 345
Eleven 642 737 621 586 640
Twelve 188 180 201 160 246
Thirteen 854 469 413 526 608
Fourteen 929 534 354 379 302
Fifteen 623 478 518 449 451
Sixteen 2,440 1,274 845 580 589
Seventeen 867 591 574 422 387
Eighteen 192 253 235 209 137
Nineteen 388 382 433 365 309
Twenty 366 498 146 131 120
Twenty-One 685 633 723 725 783
Twenty-Two 638 574 695 659 605
Twenty-Three 381 366 382 241 290
Twenty-Four 114 151 156 111 139
Twenty-Five 410 396 356 475 338
Twenty-Six 523 433 411 366 301
Twenty-Seven 953 401 268 241 349
Twenty-Eight 222 203 206 223 230
Twenty-Nine 440 391 393 521 366
Thirty 5,329 6,126 5,217 4,182 3,720
Source: Administrative Office of the Courts

Sourcebook of Criminal Justice Statistics in the Commonwealth
130
Table 7.13: Closed Juvenile District Court Cases, 2006-2010, Continued
District CY 2006 CY 2007 CY 2008 CY 2009 CY 2010
Thirty-One 110 85 51 5 3
Thirty-Two 802 432 550 548 396
Thirty-Three 392 396 407 411 437
Thirty-Four 1,108 850 750 626 736
Thirty-Five 176 136 92 101 98
Thirty-Six 80 382 82 95 53
Thirty-Seven 143 146 120 176 123
Thirty-Eight 611 559 309 212 186
Thirty-Nine 840 890 473 178 218
Forty 522 439 341 552 272
Forty-One 276 90 106 99 86
Forty-Two 359 102 150 74 94
Forty-Three 264 222 234 204 154
Forty-Four 513 406 487 377 351
Forty-Five 503 624 468 598 421
Forty-Six 866 903 925 781 657
Forty-Seven 489 458 469 414 423
Forty-Eight 238 275 215 269 210
Forty-Nine 524 354 149 142 137
Fifty 182 235 157 169 165
Fifty-One 464 455 374 315 356
Fifty-Two 426 383 342 387 372
Fifty-Three 699 479 220 267 367
Fifty-Four 598 636 591 532 470
Fifty-Five 1,096 661 352 279 241
Fifty-Six 488 443 440 403 385
Fifty-Seven 516 461 540 415 411
Fifty-Eight 272 112 73 111 113
Fifty-Nine 114 150 133 136 110
Sixty 190 216 275 134 143
STATEWIDE TOTAL 36,019 31,844 27,763 24,922 22,912
Source: Administrative Office of the Courts

Sourcebook of Criminal Justice Statistics in the Commonwealth
131
Table 7.14: Closed Domestic Violence District Court Cases, 2006-2010
District CY 2006 CY 2007 CY 2008 CY 2009 CY 2010
One 29 57 35 30 45
Two 16 4 3 4 0
Three 2 4 2 3 13
Four 271 74 7 1 2
Five 10 7 9 7 11
Six 429 437 516 475 447
Seven 62 88 78 84 85
Eight 10 26 2 1 4
Nine 0 20 6 9 8
Ten 159 134 107 144 111
Eleven 302 290 312 298 283
Twelve 13 13 14 21 21
Thirteen 375 61 66 79 84
Fourteen 462 144 1 18 50
Fifteen 249 260 283 266 256
Sixteen 717 19 27 78 24
Seventeen 56 2 1 3 3
Eighteen 6 2 1 1 2
Nineteen 269 245 299 234 241
Twenty 251 97 89 66 58
Twenty-One 498 508 532 516 565
Twenty-Two 0 10 5 6 2
Twenty-Three 403 335 326 239 259
Twenty-Four 54 90 171 128 111
Twenty-Five 49 108 179 197 181
Twenty-Six 294 299 245 277 242
Twenty-Seven 984 189 446 136 151
Twenty-Eight 12 10 14 4 9
Twenty-Nine 230 229 246 202 234
Thirty 0 0 8 19 16
Source: Administrative Office of the Courts

Sourcebook of Criminal Justice Statistics in the Commonwealth
132
Table 7.14: Closed Domestic Violence District Court Cases, 2006-2010, Continued
District CY 2006 CY 2007 CY 2008 CY 2009 CY 2010
Thirty-One 5 0 2 2 0
Thirty-Two 357 438 405 370 378
Thirty-Three 216 225 256 266 237
Thirty-Four 207 170 176 110 132
Thirty-Five 18 12 24 21 4
Thirty-Six 1 142 3 1 1
Thirty-Seven 50 31 41 15 22
Thirty-Eight 264 119 64 52 31
Thirty-Nine 341 353 130 44 52
Forty 269 160 96 88 72
Forty-One 194 179 102 13 14
Forty-Two 87 8 13 11 11
Forty-Three 2 1 0 1 15
Forty-Four 237 271 223 215 240
Forty-Five 178 179 191 240 211
Forty-Six 317 248 289 296 294
Forty-Seven 219 218 221 213 200
Forty-Eight 8 8 25 25 13
Forty-Nine 191 88 46 13 29
Fifty 145 16 7 9 6
Fifty-One 10 18 15 10 4
Fifty-Two 112 113 144 114 134
Fifty-Three 238 28 9 32 9
Fifty-Four 10 10 8 12 11
Fifty-Five 306 388 375 444 315
Fifty-Six 213 232 213 265 198
Fifty-Seven 212 266 311 317 314
Fifty-Eight 149 49 48 19 13
Fifty-Nine 32 44 38 34 28
Sixty 144 148 114 98 92
STATEWIDE TOTAL 10,944 7,924 7,619 6,896 6,598
Source: Administrative Office of the Courts

Sourcebook of Criminal Justice Statistics in the Commonwealth
133
Table 7.15: Closed Domestic and Family Cases in Circuit Family Court by County, 2006-2010
County CY 2006 CY 2007 CY 2008 CY 2009 CY 2010
Allen 21 184 322 313 281
Anderson --- 87 125 149 160
Barren 394 398 339 336 331
Boone 881 792 799 825 830
Bourbon 15 74 194 206 100
Boyle 233 235 225 216 212
Breathitt --- 125 234 213
Bullitt 1 253 470 498 534
Butler 21 92 58 110 82
Calloway 1 112 170 157 188
Campbell 521 456 458 1,248 417
Carter 232 183 183 261 272
Christian 997 1,008 875 957 889
Clark 274 264 427 237 289
Clay 7 9 71 131 180
Crittenden 63 71 73 48 54
Edmondson --- 32 23 36 45
Elliott 47 67 53 48 69
Fayette 1,882 1,861 1,815 1,960 1,816
Floyd 762 690 637 777 491
Franklin 500 513 516 472 382
Gallatin 76 81 88 80 58
Garrard --- 95 125 113 132
Greenup 1 22 127 304 247
Hancock --- 16 26 44 41
Hardin 1,056 1,290 1,518 1,294 1,061
Harrison 109 129 111 108 128
Henderson 349 330 386 253 232
Henry 131 123 119 92 112
Hopkins 135 330 417 354 324
Jackson 126 94 106 76 100
Jefferson 4,402 4,650 4,466 4,145 4,247
Jessamine 1 210 256 310 284
Source: Administrative Office of the Courts

Sourcebook of Criminal Justice Statistics in the Commonwealth
134
Table 7.15: Closed Domestic and Family Cases in Circuit Family Court by County, 2006-2010,
Continued County CY 2006 CY 2007 CY 2008 CY 2009 CY 2010
Johnson 169 201 211 252 238 Kenton 373 897 885 1,332 804 Knott 185 159 181 225 140 Knox 1 86 149 176 121 Laurel 1 233 296 381 335 Lawrence 289 255 196 168 155 Leslie 201 149 125 256 101 Lewis --- --- 15 50 55 Lincoln 57 95 175 120 168 Madison 702 851 761 696 558 Magoffin 102 126 112 165 155 Marshall 35 255 244 194 214 Martin 158 177 213 165 142 McCracken 372 489 472 346 215 Mercer 173 138 123 157 105 Metcalfe 48 60 76 44 57 Morgan 84 71 70 71 61 Nicholas 27 49 57 48 39 Ohio 27 192 269 309 314 Oldham 303 329 321 300 350 Pendleton 81 81 87 74 63 Pike 591 569 646 651 534 Powell 5 6 44 116 84 Pulaski 383 509 930 755 867 Robertson 11 11 9 12 21 Rockcastle 36 64 42 72 161 Russell 11 89 198 215 235 Scott 2 165 376 237 285 Shelby 7 126 203 247 309 Simpson 8 71 112 102 111 Spencer 1 33 68 92 74 Trimble 45 45 66 60 51 Union 82 81 115 96 111 Warren 826 808 777 774 733 Wayne --- 78 236 361 244 Webster 179 145 147 216 162 Wolfe 5 3 59 145 109 Woodford 11 99 208 153 124 STATEWIDE TOTAL 18,829 22,546 24,977 26,225 23,406
Source: Administrative Office of the Courts

Sourcebook of Criminal Justice Statistics in the Commonwealth
135
Table 7.16: Closed Juvenile Cases in Circuit Family Court by County, 2006-2010
County CY 2006 CY 2007 CY 2008 CY 2009 CY 2010
Allen 27 168 199 224 146
Anderson --- 66 115 159 205
Barren 413 366 349 411 418
Boone 481 602 650 614 656
Bourbon 6 93 209 326 177
Boyle 241 299 309 327 251
Breathitt --- 91 171 144
Bullitt 3 623 826 930 872
Butler 53 89 122 86 70
Calloway 42 280 232 313 287
Campbell 1,121 1,013 973 992 772
Carter 215 311 384 250 244
Christian 473 473 499 460 492
Clark 371 326 460 509 565
Clay 514 409 588 321 311
Crittenden 57 84 79 74 90
Edmondson --- 59 105 47 24
Elliott 72 126 152 75 137
Fayette 2,732 2,694 2,597 2,468 2,322
Floyd 400 412 536 474 566
Franklin 341 310 375 289 302
Gallatin 109 153 141 114 109
Garrard 1 124 172 190 185
Greenup --- 151 272 256 214
Hancock --- 41 43 44 50
Hardin 656 625 699 658 561
Harrison 131 148 124 121 88
Henderson 791 718 616 622 816
Henry 148 211 144 142 117
Hopkins 134 310 455 322 431
Jackson 180 122 125 142 131
Jefferson 9,270 7,756 7,093 6,662 5,634
Jessamine 15 499 563 419 429
Source: Administrative Office of the Courts

Sourcebook of Criminal Justice Statistics in the Commonwealth
136
Table 7.16: Closed Juvenile Cases in Circuit Family Court by County, 2006-2010, Continued County CY 2006 CY 2007 CY 2008 CY 2009 CY 2010
Johnson 253 227 287 272 241
Kenton 86 2,188 2,339 2,456 2,827
Knott 247 230 240 200 198
Knox 1 168 306 323 303
Laurel 2 459 560 502 403
Lawrence 87 144 197 211 162
Leslie 194 174 146 172 111
Lewis --- 48 130 102 84
Lincoln 169 224 236 154 256
Madison 652 660 789 893 622
Magoffin 220 297 220 177 179
Marshall 21 244 179 277 285
Martin 237 226 329 305 182
McCracken 669 598 605 565 446
Mercer 223 259 229 224 170
Metcalfe 112 140 140 95 102
Morgan 64 61 50 75 49
Nicholas 65 71 55 62 72
Ohio 11 150 260 258 212
Oldham 226 197 186 173 191
Pendleton 132 119 87 124 106
Pike 611 754 798 764 567
Powell 1 1 156 171 129
Pulaski 355 470 600 452 447
Robertson 5 2 3 11 23
Rockcastle 124 114 111 113 94
Russell 21 58 142 195 423
Scott 5 74 143 164 192
Shelby 5 134 173 232 189
Simpson 19 130 166 171 171
Spencer 10 74 70 67 67
Trimble 93 102 90 139 125
Union 173 167 185 145 172
Warren 1,208 1,112 1,039 946 968
Wayne 2 120 244 207 195
Webster 98 97 96 153 129
Wolfe 1 8 73 73 65
Woodford --- 76 180 171 164
STATEWIDE TOTAL 25,399 30,038 32,136 31,006 29,137

Sourcebook of Criminal Justice Statistics in the Commonwealth
137
Table 7.17: Closed Domestic Violence Cases in Circuit Family Court by County, 2006-2010
County CY 2006 CY 2007 CY 2008 CY 2009 CY 2010
Allen 1 88 96 173 140
Anderson 0 63 90 67 63
Barren 254 207 262 267 252
Boone 316 351 312 349 319
Bourbon 1 89 94 99 95
Boyle 51 166 192 209 241
Breathitt --- --- 69 132 98
Bullitt --- 1 --- 1 145
Butler 1 47 55 79 70
Calloway 31 109 126 118 118
Campbell 445 453 389 486 449
Carter 183 174 197 178 137
Christian 449 479 424 440 405
Clark 163 77 13 2 5
Clay 17 2 57 164 194
Crittenden 66 57 62 58 70
Edmondson --- 25 35 43 29
Elliott 41 44 29 31 29
Fayette 1,475 1,445 1,540 1,471 1,491
Floyd 305 322 310 254 243
Franklin 247 192 193 197 168
Gallatin 62 51 59 82 74
Garrard --- 71 60 86 90
Greenup --- 132 200 154 124
Hancock --- 31 21 35 50
Hardin 715 768 747 754 707
Harrison 93 82 87 91 98
Henderson 216 205 190 168 152
Henry 73 90 68 94 79
Hopkins 12 172 294 265 296
Jackson 95 97 101 100 91
Jefferson 4,971 5,204 5,327 5,384 5,111
Jessamine 1 288 316 282 256
Source: Administrative Office of the Courts

Sourcebook of Criminal Justice Statistics in the Commonwealth
138
Table 7.17: Closed Domestic Violence Cases in Circuit Family Court by County, 2006-2010,
Continued County CY 2006 CY 2007 CY 2008 CY 2009 CY 2010
Johnson 154 169 197 163 101 Kenton 4 904 864 887 933 Knott 84 119 146 157 109 Knox 2 215 152 167 108 Laurel 7 485 422 460 284 Lawrence 146 114 90 91 95 Leslie 63 50 60 67 54 Lewis --- --- 1 5 19 Lincoln 169 153 153 164 153 Madison 364 341 401 336 362 Magoffin 66 131 128 121 121 Marshall --- 103 61 131 159 Martin 147 116 18 30 49 McCracken 316 345 344 401 389 Mercer 137 140 135 121 118 Metcalfe 67 71 53 66 56 Morgan 69 66 93 87 66 Nicholas 24 25 8 18 17 Ohio 87 145 197 152 Oldham 137 131 132 117 139 Pendleton 75 70 80 82 91 Pike 401 382 387 349 333 Powell --- --- 88 108 57 Pulaski 578 638 548 574 568 Robertson 1 3 9 6 5 Rockcastle 115 118 106 97 107 Russell 1 73 190 158 144 Scott --- 162 239 282 205 Shelby --- 135 145 178 165 Simpson 3 67 99 109 93 Spencer 3 41 48 57 51 Trimble 45 57 38 57 55 Union 69 64 95 113 112 Warren 539 525 561 639 570 Wayne 1 60 123 128 146 Webster 71 65 66 51 47 Wolfe --- 32 74 68 Woodford --- 80 103 121 87 STATEWIDE TOTAL 14,142 17,887 18,575 19,282 18,277
Source: Administrative Office of the Courts

Sourcebook of Criminal Justice Statistics in the Commonwealth
139
Table 7.18: Family Court Caseload by County, 2006-2010 County CY 2006 CY 2007 CY 2008 CY 2009 CY 2010
Complaints Juveniles Complaints Juveniles Complaints Juveniles Complaints Juveniles Complaints Juveniles
Adair 112 88 230 168 198 157 195 159 122 100
Allen 86 75 84 65 161 121 148 122 99 85
Anderson 105 84 120 100 151 130 147 122 213 180
Ballard 50 39 67 49 46 42 69 56 50 42
Barren 403 287 418 302 426 328 315 246 294 229
Bath 70 59 58 51 80 65 63 54 47 37
Bell 353 274 291 230 324 257 369 276 294 241
Boone 1,008 779 1,084 819 1,015 819 892 711 795 622
Bourbon 269 193 192 138 211 154 172 124 137 94
Boyd 391 323 336 277 305 264 260 236 271 237
Boyle 167 136 152 128 186 158 177 144 138 118
Bracken 44 42 37 33 41 38 35 31 18 17
Breathitt 182 142 151 139 109 97 64 58 110 92
Breckenridge 75 65 130 119 80 75 108 92 112 88
Bullitt 788 607 707 555 595 470 422 344 438 349
Butler 82 62 70 58 76 56 71 58 79 63
Caldwell 142 106 146 105 127 101 98 88 102 84
Calloway 251 190 198 159 246 187 218 180 199 170
Campbell 1,351 983 1,131 843 1,024 754 808 628 891 647
Carlisle 47 34 34 22 25 20 24 23 16 13
Carroll 111 85 182 122 143 110 110 94 115 101
Carter 182 165 143 121 182 151 127 108 87 79
Casey 160 108 155 119 205 157 138 105 112 84
Christian 1,213 704 1,193 720 1,185 679 902 581 798 461
Clark 325 275 252 177 384 282 499 363 381 267
Clay 72 58 118 104 94 70 65 59 49 44
Source: Administrative Office of the Courts

Sourcebook of Criminal Justice Statistics in the Commonwealth
140
Table 7.18: Family Court Caseload by County, 2006-2010, Continued
County CY 2006 CY 2007 CY 2008 CY 2009 CY 2010
Complaints Juveniles Complaints Juveniles Complaints Juveniles Complaints Juveniles Complaints Juveniles
Clinton 82 65 82 64 79 63 61 49 71 61
Crittenden 69 59 50 44 53 45 39 35 34 28
Cumberland 84 73 69 54 64 50 33 31 35 29
Daviess 1,213 785 1,128 789 1,244 849 1,433 957 1,332 886
Edmondson 44 38 18 13 33 30 37 32 50 45
Elliott 36 32 24 24 25 25 19 18 14 13
Estill 140 106 127 93 69 60 98 66 77 62
Fayette 1,967 1,534 2,236 1,736 2,072 1,573 2,039 1,556 1,784 1,439
Fleming 72 57 70 61 108 92 73 64 44 41
Floyd 256 212 265 210 235 198 279 233 259 222
Franklin 565 356 434 308 414 307 446 299 321 236
Fulton 135 113 90 69 96 76 92 77 72 52
Gallatin 146 106 203 154 124 89 130 94 126 93
Garrard 136 111 124 105 120 106 82 67 113 96
Grant 333 234 269 194 306 262 235 185 250 201
Graves 329 225 303 211 283 217 232 186 262 197
Grayson 225 175 245 192 221 170 247 196 273 215
Green 48 37 47 40 28 23 67 53 52 42
Greenup 211 178 232 193 200 170 151 139 227 185
Hancock 41 36 72 61 50 41 43 36 25 23
Hardin 865 660 770 612 894 669 825 652 711 562
Harlan 478 374 421 358 334 279 326 255 244 208
Harrison 253 179 321 197 169 119 126 104 152 116
Hart 87 70 85 59 133 114 113 97 130 110
Henderson 1,031 583 860 536 810 486 844 496 812 459
Henry 112 88 120 96 87 70 115 89 79 58
Source: Administrative Office of the Courts

Sourcebook of Criminal Justice Statistics in the Commonwealth
141
Table 7.18: Family Court Caseload by County, 2006-2010, Continued
County CY 2006 CY 2007 CY 2008 CY 2009 CY 2010 Complaints Juveniles Complaints Juveniles Complaints Juveniles Complaints Juveniles Complaints Juveniles Hickman 32 24 32 27 28 24 29 23 16 14 Hopkins 519 390 385 283 436 322 341 251 381 248 Jackson 40 31 62 50 44 39 90 82 66 56 Jefferson 7,475 5,255 7,581 5,382 6,395 4,659 5,579 4,202 5,467 4,085 Jessamine 441 322 410 324 457 352 427 334 358 300 Johnson 112 88 142 117 124 96 131 111 123 110 Kenton 1,521 1,121 1,566 1,165 1,416 1,084 1,293 1,005 1,069 853 Knott 86 78 160 135 167 146 193 161 149 129 Knox 329 274 287 239 206 175 206 172 249 204 Larue 104 84 97 77 109 94 117 102 116 90 Laurel 390 331 458 382 354 302 336 280 314 271 Lawrence 66 60 59 50 222 196 171 159 169 146 Lee 30 26 36 32 38 35 50 37 41 37 Leslie 60 41 34 26 63 46 80 67 73 68 Letcher 209 169 279 222 229 174 198 161 217 164 Lewis 95 85 118 93 110 95 97 78 61 53 Lincoln 199 155 209 159 229 191 222 165 309 218 Livingston 47 47 28 24 22 20 33 28 24 20 Logan 156 141 162 135 208 169 159 132 153 130 Lyon 54 46 71 59 71 57 41 36 67 50 Madison 781 526 819 573 828 542 731 539 650 485 Magoffin 81 62 114 83 73 64 69 58 30 27 Marion 82 67 112 86 94 81 96 80 61 49 Marshall 172 138 176 155 194 171 208 173 169 139 Martin 81 69 108 89 117 93 140 125 69 59 Mason 181 127 145 113 125 93 162 131 156 119 McCracken 647 498 630 490 557 463 550 456 503 385 Source: Administrative Office of the Courts

Sourcebook of Criminal Justice Statistics in the Commonwealth
142
Table 7.18: Family Court Caseload by County, 2006-2010, Continued
County CY 2006 CY 2007 CY 2008 CY 2009 CY 2010 Complaints Juveniles Complaints Juveniles Complaints Juveniles Complaints Juveniles Complaints Juveniles McCreary 248 199 309 238 222 171 232 180 212 167
McLean 52 48 61 51 73 60 88 67 86 72
Meade 264 220 212 179 231 186 220 157 177 137
Menifee 32 29 32 28 45 36 54 43 46 40
Mercer 95 83 120 103 143 121 159 131 154 124
Metcalfe 155 98 109 97 152 124 105 88 75 66
Monroe 86 72 74 60 68 55 28 23 80 67
Montgomery 266 215 232 181 215 178 193 163 194 163
Morgan 57 51 82 66 82 76 65 54 67 59
Muhlenberg 168 136 213 171 176 150 256 205 230 186
Nelson 250 211 274 223 302 248 309 229 257 190
Nicholas 82 62 79 61 45 40 63 42 36 34
Ohio 172 140 123 99 137 107 163 120 157 122
Oldham 358 270 423 315 421 288 361 276 333 249
Owen 91 76 100 80 47 44 52 46 55 44
Owsley 33 26 45 36 51 37 37 30 36 31
Pendleton 165 135 188 138 176 119 205 155 188 148
Perry 190 153 216 172 213 183 249 210 182 158
Pike 425 337 411 336 361 302 410 349 383 321
Powell 96 68 103 83 96 72 111 84 111 82
Pulaski 455 354 412 341 468 368 381 317 387 334
Robertson 18 17 27 22 18 16 8 8 9 7
Rockcastle 71 62 61 57 77 67 53 45 71 60
Rowan 127 98 140 113 121 98 121 97 137 108
Russell 108 79 123 103 132 111 121 107 130 104
Scott 473 342 333 235 281 212 272 212 241 192
Source: Administrative Office of the Courts

Sourcebook of Criminal Justice Statistics in the Commonwealth
143
Table 7.18: Family Court Caseload by County, 2006-2010, Continued County CY 2006 CY 2007 CY 2008 CY 2009 CY 2010 Complaints Juveniles Complaints Juveniles Complaints Juveniles Complaints Juveniles Complaints Juveniles Shelby 225 181 338 232 194 162 318 251 345 255
Simpson 133 104 116 94 171 120 139 105 144 111
Spencer 99 78 107 85 103 86 82 75 105 89
Taylor 158 134 248 194 163 136 158 129 120 106
Todd 53 46 82 69 82 66 80 68 61 49
Trigg 116 82 64 50 84 67 63 47 60 50
Trimble 51 39 73 56 61 48 65 53 67 50
Union 165 124 120 103 148 110 136 97 97 79
Warren 746 586 789 650 764 630 912 764 739 619
Washington 45 33 59 45 33 26 29 27 49 42
Wayne 159 129 148 123 146 112 203 147 102 82
Webster 90 74 70 55 82 66 67 54 100 78
Whitley 304 260 402 337 416 321 366 314 410 335
Wolfe 89 79 51 44 95 77 48 38 57 49
Woodford 155 113 152 115 196 152 193 145 152 124
STATEWIDE TOTAL 38,112 26,028 27,356 33,605 28,347 37,945 28,606 35,877 31,218 24,115 Source: Administrative Office of the Courts

Sourcebook of Criminal Justice Statistics in the Commonwealth
144
Table 7.19: Court Obligations Collected During Drug Court Participation, CY 2010
Child Support $485,964.00
Child Support Arrearage $129,728.00
Court Costs $171,471.00
Fines $98,641.00
Jail Fees $65,444.00
Other Expenses/Fees $34,058.00
Probation/Home Incarceration Fees $43,473.00
Public Defender Expenses $8,993.00
Restitution $216,849.00
Sanction Fees $482.00
Treatment/Recovery Fees $33,565.00
Work Release Expenses $982.00
TOTAL $1,289,650.00
Source: Administrative Office of the Courts

Sourcebook of Criminal Justice Statistics in the Commonwealth
145
Table 7.20: Caseload Statistics- Department of Public Advocacy Appeals Division, CY 2010
January February March April May June July August September October November December TOTAL Court of Appeals- New Cases 18 21 21 22 15 13 9 15 12 11 10 18 185 Supreme Court- New Cases 6 10 5 5 10 6 6 6 8 11 3 9 85 Court of Appeals- Cases Assigned 18 21 27 22 15 14 10 15 12 11 11 18 194 Supreme Court- Cases Assigned 6 10 6 5 10 6 6 6 8 11 3 9 86
Other Cases Assigned 0 0 0 1 0 0 0 0 0 0 0 0 1 Supreme Court- Original Briefs 7 10 8 9 8 7 7 10 1 7 9 13 96 Court of Appeals- Original Briefs 16 15 10 12 15 10 22 19 16 10 9 5 159 Other Cases- Original Briefs 0 0 0 0 0 0 0 0 0 0 2 0 2
Cases Closed 10 12 6 7 17 13 23 14 9 17 14 8 150
Trial Contacts 32 46 54 37 44 22 32 33 28 32 36 38 434
Contempt Orders 0 0 0 0 0 0 0 0 0 0 0 0 0
Client Visits 8 12 12 19 15 5 21 9 10 11 2 7 131 Client Phone Calls/Non-Routine Letters 132 223 197 186 205 134 194 203 159 182 209 141 2165
Hearings Held 0 0 0 0 1 1 0 1 0 0 0 0 3
Source: Department of Public Advocacy

Sourcebook of Criminal Justice Statistics in the Commonwealth
146
Table 7.21: Department of Public Advocacy- Circuit Court Cases by County, 2010
County Total Cases Circuit Cases Percent of Circuit
Cases Adair 478 144 30.13%
Allen 339 142 41.89%
Anderson 501 112 22.36%
Ballard 270 78 28.89%
Barren 980 377 38.47%
Bath 534 135 25.28%
Bell 1,703 387 22.72%
Boone 2,514 849 33.77%
Bourbon 766 201 26.24%
Boyd 2,103 689 32.76%
Boyle 662 137 20.69%
Bracken 218 51 23.39%
Breathitt 488 135 27.66%
Breckinridge 437 167 38.22%
Bullitt 2,340 571 24.40%
Butler 321 119 37.07%
Caldwell 298 83 27.85%
Calloway 805 258 32.05%
Campbell 2,153 736 34.18%
Carlisle 84 11 13.10%
Carroll 441 162 36.73%
Carter 1,062 232 21.85%
Casey 393 129 32.82%
Christian 4,349 797 18.33%
Clark 1,457 202 13.86%
Clay 523 122 23.33%
Clinton 279 137 49.10%
Crittenden 329 108 32.83%
Cumberland 136 48 35.29%
Daviess 3,669 756 20.61%
Edmonson 186 91 48.92%
Source: Department of Public Advocacy

Sourcebook of Criminal Justice Statistics in the Commonwealth
147
Table 7.21: Department of Public Advocacy- Circuit Court Cases by County, 2010, Continued
County Total Cases Circuit Cases Percent of Circuit
Cases Elliott 250 70 28.00%
Estill 739 204 27.60%
Fayette 11,483 2,504 21.81%
Fleming 616 159 25.81%
Floyd 1,507 296 19.64%
Franklin 1,338 430 32.14%
Fulton 388 145 37.37%
Gallatin 297 68 22.90%
Garrard 345 101 29.28%
Grant 619 221 35.70%
Graves 1,674 368 21.98%
Grayson 681 224 32.89%
Green 314 97 30.89%
Greenup 652 217 33.28%
Hancock 157 36 22.93%
Hardin 3,422 802 23.44%
Harlan 1,669 612 36.67%
Harrison 685 123 17.96%
Hart 413 174 42.13%
Henderson 1,894 347 18.32%
Henry 480 81 16.88%
Hickman 163 43 26.38%
Hopkins 1,799 418 23.24%
Jackson 375 77 20.53%
Jefferson 33,156 4,539 13.69%
Jessamine 1,467 409 27.88%
Johnson 1,109 209 18.85%
Kenton 4,366 1,112 25.47%
Knott 343 60 17.49%
Knox 882 189 21.43%
Larue 347 98 28.24%
Laurel 1,550 465 30.00%
Source: Department of Public Advocacy

Sourcebook of Criminal Justice Statistics in the Commonwealth
148
Table 7.21: Department of Public Advocacy- Circuit Court Cases by County, 2010, Continued
County Total Cases Circuit Cases Percent of Circuit
Cases Lawrence 357 64 17.93%
Lee 329 95 28.88%
Leslie 245 49 20.00%
Letcher 1,316 276 20.97%
Lewis 266 135 50.75%
Lincoln 534 76 14.23%
Livingston 252 84 33.33%
Logan 653 252 38.59%
Lyon 145 52 35.86%
Madison 3,033 427 14.08%
Magoffin 374 92 24.60%
Marion 552 230 41.67%
Marshall 957 301 31.45%
Martin 509 169 33.20%
Mason 1,287 269 20.90%
McCracken 2,984 995 33.34%
McCreary 521 231 44.34%
McLean 155 40 25.81%
Meade 475 149 31.37%
Menifee 280 96 34.29%
Mercer 485 119 24.54%
Metcalfe 159 44 27.67%
Monroe 239 112 46.86%
Montgomery 1,467 447 30.47%
Morgan 578 105 18.17%
Muhlenberg 734 248 33.79%
Nelson 927 385 41.53%
Nicholas 292 38 13.01%
Ohio 707 298 42.15%
Oldham 754 172 22.81%
Owen 276 117 42.39%
Owsley 276 41 14.86%
Source: Department of Public Advocacy

Sourcebook of Criminal Justice Statistics in the Commonwealth
149
Table 7.21: Department of Public Advocacy- Circuit Court Cases by County, 2010, Continued
County Total Cases Circuit Cases Percent of Circuit
Cases Pendleton 455 58 12.75%
Perry 1,933 434 22.45%
Pike 1,839 366 19.90%
Powell 824 211 25.61%
Pulaski 1,530 562 36.73%
Robertson 68 10 14.71%
Rockcastle 494 140 28.34%
Rowan 1,442 300 20.80%
Russell 417 158 37.89%
Scott 1,020 232 22.75%
Shelby 857 249 29.05%
Simpson 299 148 49.50%
Spencer 191 48 25.13%
Taylor 705 239 33.90%
Todd 284 110 38.73%
Trigg 282 61 21.63%
Trimble 183 42 22.95%
Union 470 107 22.77%
Warren 3,984 1,553 38.98%
Washington 247 144 58.30%
Wayne 736 289 39.27%
Webster 479 127 26.51%
Whitley 1,095 241 22.01%
Wolfe 263 107 40.68%
Woodford 428 136 31.78%
TOTALS 148,641 35,344 23.78%
Source: Department of Public Advocacy

Sourcebook of Criminal Justice Statistics in the Commonwealth
150
Table 7.22: Department of Public Advocacy- District Court Cases by County, 2010
County Total Cases District Cases Percent District
Cases Adair 478 333 69.67%
Allen 339 159 46.90%
Anderson 501 386 77.05%
Ballard 270 191 70.74%
Barren 980 587 59.90%
Bath 534 399 74.72%
Bell 1,703 1,316 77.28%
Boone 2,514 1,665 66.23%
Bourbon 766 558 72.85%
Boyd 2,103 1,411 67.09%
Boyle 662 518 78.25%
Bracken 218 167 76.61%
Breathitt 488 353 72.34%
Breckinridge 437 269 61.56%
Bullitt 2,340 1,758 75.13%
Butler 321 201 62.62%
Caldwell 298 214 71.81%
Calloway 805 547 67.95%
Campbell 2,153 1,258 58.43%
Carlisle 84 71 84.52%
Carroll 441 279 63.27%
Carter 1,062 719 67.70%
Casey 393 264 67.18%
Christian 4,349 3,504 80.57%
Clark 1,457 1,206 82.77%
Clay 523 401 76.67%
Clinton 279 142 50.90%
Crittenden 329 220 66.87%
Cumberland 136 88 64.71%
Daviess 3,669 2,912 79.37%
Edmonson 186 88 47.31%
Elliott 250 177 70.80%
Source: Department of Public Advocacy

Sourcebook of Criminal Justice Statistics in the Commonwealth
151
Table 7.22: Department of Public Advocacy- District Court Cases by County, 2010, Continued
County Total Cases District Cases Percent District
Cases Estill 739 535 72.40%
Fayette 11,483 7,647 66.59%
Fleming 616 457 74.19%
Floyd 1,507 1,193 79.16%
Franklin 1,338 867 64.80%
Fulton 388 240 61.86%
Gallatin 297 229 77.10%
Garrard 345 242 70.14%
Grant 619 398 64.30%
Graves 1,674 1,306 78.02%
Grayson 681 454 66.67%
Green 314 217 69.11%
Greenup 652 428 65.64%
Hancock 157 121 77.07%
Hardin 3,422 2,596 75.86%
Harlan 1,669 1,057 63.33%
Harrison 685 559 81.61%
Hart 413 239 57.87%
Henderson 1,894 1,486 78.46%
Henry 480 397 82.71%
Hickman 163 120 73.62%
Hopkins 1,799 1,363 75.76%
Jackson 375 298 79.47%
Jefferson 33,156 28,617 86.31%
Jessamine 1,467 1,036 70.62%
Johnson 1,109 881 79.44%
Kenton 4,366 2,830 64.82%
Knott 343 282 82.22%
Knox 882 665 75.40%
Larue 347 249 71.76%
Laurel 1,550 1,048 67.61%
Lawrence 357 285 79.83%
Source: Department of Public Advocacy

Sourcebook of Criminal Justice Statistics in the Commonwealth
152
Table 7.22: Department of Public Advocacy- District Court Cases by County, 2010, Continued
County Total Cases District Cases Percent District
Cases Lee 329 234 71.12%
Leslie 245 196 80.00%
Letcher 1,316 1,040 79.03%
Lewis 266 131 49.25%
Lincoln 534 456 85.39%
Livingston 252 168 66.67%
Logan 653 399 61.10%
Lyon 145 93 64.14%
Madison 3,033 2,575 84.90%
Magoffin 374 267 71.39%
Marion 552 322 58.33%
Marshall 957 656 68.55%
Martin 509 312 61.30%
Mason 1,287 1,017 79.02%
McCracken 2,984 1,932 64.75%
McCreary 521 288 55.28%
McLean 155 115 74.19%
Meade 475 326 68.63%
Menifee 280 184 65.71%
Mercer 485 364 75.05%
Metcalfe 159 115 72.33%
Monroe 239 127 53.14%
Montgomery 1,467 1,012 68.98%
Morgan 578 453 78.37%
Muhlenberg 734 486 66.21%
Nelson 927 542 58.47%
Nicholas 292 247 84.59%
Ohio 707 409 57.85%
Oldham 754 575 76.26%
Source: Department of Public Advocacy

Sourcebook of Criminal Justice Statistics in the Commonwealth
153
Table 7.22: Department of Public Advocacy- District Court Cases by County, 2010, Continued
County Total Cases District Cases Percent District
Cases Owen 276 159 57.61%
Owsley 276 235 85.14%
Pendleton 455 393 86.37%
Perry 1,933 1,499 77.55%
Pike 1,839 1,450 78.85%
Powell 824 590 71.60%
Pulaski 1,530 959 62.68%
Robertson 68 58 85.29%
Rockcastle 494 354 71.66%
Rowan 1,442 1,140 79.06%
Russell 417 254 60.91%
Scott 1,020 785 76.96%
Shelby 857 596 69.54%
Simpson 299 149 49.83%
Spencer 191 143 74.87%
Taylor 705 465 65.96%
Todd 284 171 60.21%
Trigg 282 221 78.37%
Trimble 183 138 75.41%
Union 470 356 75.74%
Warren 3,984 2,245 56.35%
Washington 247 103 41.70%
Wayne 736 446 60.60%
Webster 479 342 71.40%
Whitley 1,095 854 77.99%
Wolfe 263 156 59.32%
Woodford 428 289 67.52%
TOTALS 148,641 110,294 74.20%
Source: Department of Public Advocacy

Sourcebook of Criminal Justice Statistics in the Commonwealth
154
Table 7.23: Department of Public Advocacy- Caseload by County, 2010
County Total Percent of Total Cases
Adair 478 0.32%
Allen 339 0.23%
Anderson 501 0.34%
Ballard 270 0.18%
Barren 980 0.66%
Bath 534 0.36%
Bell 1,703 1.15%
Boone 2,514 1.69%
Bourbon 766 0.52%
Boyd 2,103 1.41%
Boyle 662 0.45%
Bracken 218 0.15%
Breathitt 488 0.33%
Breckinridge 437 0.29%
Bullitt 2,340 1.57%
Butler 321 0.22%
Caldwell 298 0.20%
Calloway 805 0.54%
Campbell 2,153 1.45%
Carlisle 84 0.06%
Carroll 441 0.30%
Carter 1,062 0.71%
Casey 393 0.26%
Christian 4,349 2.93%
Clark 1,457 0.98%
Clay 523 0.35%
Clinton 279 0.19%
Crittenden 329 0.22%
Cumberland 136 0.09%
Daviess 3,669 2.47%
Edmonson 186 0.13%
Source: Department of Public Advocacy
Table 7.23: Department of Public Advocacy- Caseload by County, 2010,
Continued
County Total Percent of Total Cases
Elliott 250 0.17%
Estill 739 0.50%
Fayette 11,483 7.73%
Fleming 616 0.41%
Floyd 1,507 1.01%
Franklin 1,338 0.90%
Fulton 388 0.26%
Gallatin 297 0.20%
Garrard 345 0.23%
Grant 619 0.42%
Graves 1,674 1.13%
Grayson 681 0.46%
Green 314 0.21%
Greenup 652 0.44%
Hancock 157 0.11%
Hardin 3,422 2.30%
Harlan 1,669 1.12%
Harrison 685 0.46%
Hart 413 0.28%
Henderson 1,894 1.27%
Henry 480 0.32%
Hickman 163 0.11%
Hopkins 1,799 1.21%
Jackson 375 0.25%
Jefferson 33,156 22.31%
Jessamine 1,467 0.99%
Johnson 1,109 0.75%
Kenton 4,366 2.94%
Knott 343 0.23%
Knox 882 0.59%
Larue 347 0.23%
Laurel 1,550 1.04%
Lawrence
357 0.24%
Source: Department of Public Advocacy

Sourcebook of Criminal Justice Statistics in the Commonwealth
155
Table 7.23: Department of Public
Advocacy- Caseload by County, 2010, Continued
County Total Percent of Total Cases
Lee 329 0.22%
Leslie 245 0.16%
Letcher 1,316 0.89%
Lewis 266 0.18%
Lincoln 534 0.36%
Livingston 252 0.17%
Logan 653 0.44%
Lyon 145 0.10%
Madison 3,033 2.04%
Magoffin 374 0.25%
Marion 552 0.37%
Marshall 957 0.64%
Martin 509 0.34%
Mason 1,287 0.87%
McCracken 2,984 2.01%
McCreary 521 0.35%
McLean 155 0.10%
Meade 475 0.32%
Menifee 280 0.19%
Mercer 485 0.33%
Metcalfe 159 0.11%
Monroe 239 0.16%
Montgomery 1,467 0.99%
Morgan 578 0.39%
Muhlenberg 734 0.49%
Nelson 927 0.62%
Nicholas 292 0.20%
Ohio 707 0.48%
Oldham 754 0.51%
Owen 276 0.19%
Owsley 276 0.19%
Pendleton 455 0.31%
Perry 1,933 1.30%
Source: Department of Public Advocacy
Table 7.23: Department of Public Advocacy- Caseload by County, 2010,
Continued
County Total Percent of Total Cases
Pike 1,839 1.24%
Powell 824 0.55%
Pulaski 1,530 1.03%
Robertson 68 0.05%
Rockcastle 494 0.33%
Rowan 1,442 0.97%
Russell 417 0.28%
Scott 1,020 0.69%
Shelby 857 0.58%
Simpson 299 0.20%
Spencer 191 0.13%
Taylor 705 0.47%
Todd 284 0.19%
Trigg 282 0.19%
Trimble 183 0.12%
Union 470 0.32%
Warren 3,984 2.68%
Washington 247 0.17%
Wayne 736 0.50%
Webster 479 0.32%
Whitley 1,095 0.74%
Wolfe 263 0.18%
Woodford 428 0.29%
TOTALS 148,641 100.00%
Source: Department of Public Advocacy

Sourcebook of Criminal Justice Statistics in the Commonwealth
156
Table 7.24: Department of Public Advocacy- Juvenile Cases by County, 2010
County Total Cases
Family Cases
Percent of Family
Cases
Adair 478 1 0.21%
Allen 339 38 11.21%
Anderson 501 2 0.40%
Ballard 270 1 0.37%
Barren 980 15 1.53%
Bath 534 0 0.00%
Bell 1,703 0 0.00%
Boone 2,514 0 0.00%
Bourbon 766 6 0.78%
Boyd 2,103 1 0.05%
Boyle 662 7 1.06%
Bracken 218 0 0.00%
Breathitt 488 0 0.00%
Breckinridge 437 0 0.00%
Bullitt 2,340 9 0.38%
Butler 321 1 0.31%
Caldwell 298 0 0.00%
Calloway 805 0 0.00%
Campbell 2,153 129 5.99%
Carlisle 84 2 2.38%
Carroll 441 0 0.00%
Carter 1,062 111 10.45%
Casey 393 0 0.00%
Christian 4,349 32 0.74%
Clark 1,457 48 3.29%
Clay 523 0 0.00%
Clinton 279 0 0.00%
Crittenden
Table 7.24: Department of Public Advocacy- Juvenile Cases by County, 2010, Continued
County Total Cases
Family Cases
Percent of Family
Cases Elliott 250 3 1.20%
Estill 739 0 0.00%
Fayette 11,483 640 5.57%
Fleming 616 0 0.00%
Floyd 1,507 18 1.19%
Franklin 1,338 35 2.62%
Fulton 388 3 0.77%
Gallatin 297 0 0.00%
Garrard 345 2 0.58%
Grant 619 0 0.00%
Graves 1,674 0 0.00%
Grayson 681 1 0.15%
Green 314 0 0.00%
Greenup 652 2 0.31%
Hancock 157 0 0.00%
Hardin 3,422 20 0.58%
Harlan 1,669 0 0.00%
Harrison 685 3 0.44%
Hart 413 0 0.00%
Henderson 1,894 61 3.22%
Henry 480 2 0.42%
Hickman 163 0 0.00%
Hopkins 1,799 18 1.00%
Jackson 375 0 0.00%
Jefferson 33,156 0 0.00%
Jessamine 1,467 22 1.50%
Johnson 1,109 18 1.62%
Kenton 4,366 417 9.55%
Knott 343 1 0.29%
Knox
329 1 0.30%
Cumberland 136 0 0.00%
Daviess 882 28 3.17%
Larue 347 0 0.00%
Laurel 1,550 37 2.39%
Lawrence 357 8 2.24%
Source: Department of Public Advocacy
3,669 0 0.00%
Edmonson 186 7 3.76%
Source: Department of Public Advocacy
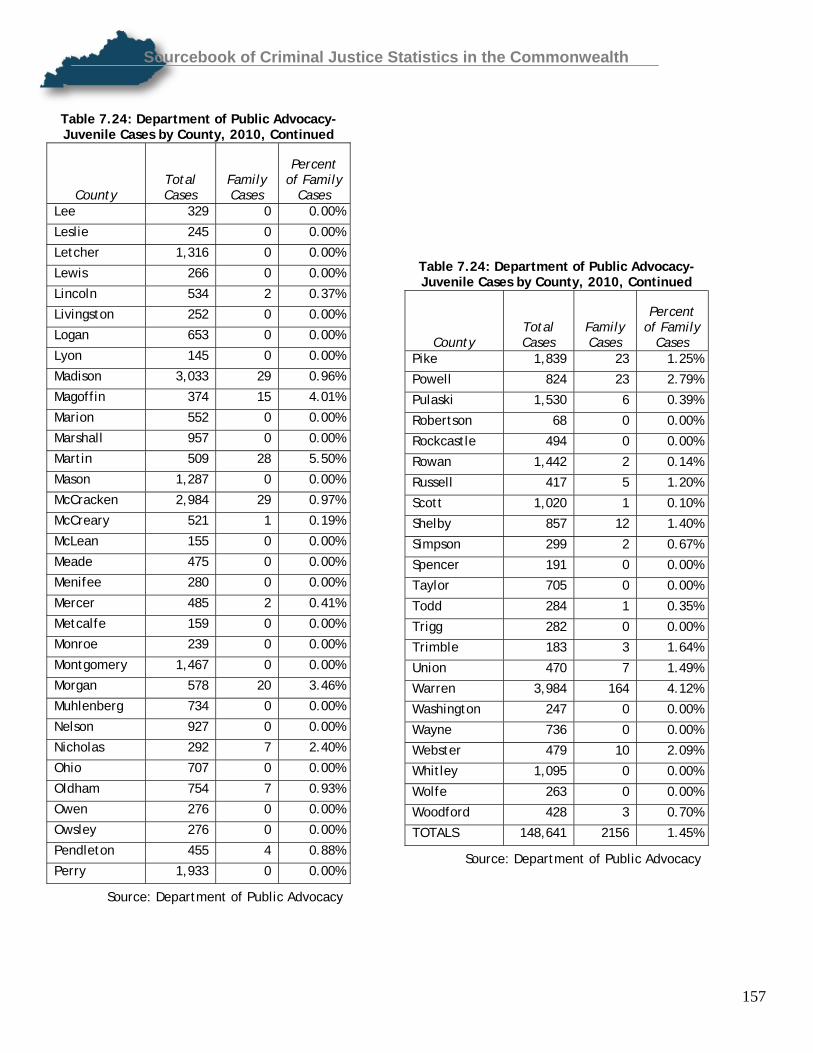
Sourcebook of Criminal Justice Statistics in the Commonwealth
157
Table 7.24: Department of Public Advocacy- Juvenile Cases by County, 2010, Continued
County Total Cases
Family Cases
Percent of Family
Cases Lee 329 0 0.00%
Leslie 245 0 0.00%
Letcher 1,316 0 0.00%
Lewis 266 0 0.00%
Lincoln 534 2 0.37%
Livingston 252 0 0.00%
Logan 653 0 0.00%
Lyon 145 0 0.00%
Madison 3,033 29 0.96%
Magoffin 374 15 4.01%
Marion 552 0 0.00%
Marshall 957 0 0.00%
Martin 509 28 5.50%
Mason 1,287 0 0.00%
McCracken 2,984 29 0.97%
McCreary 521 1 0.19%
McLean 155 0 0.00%
Meade 475 0 0.00%
Menifee 280 0 0.00%
Mercer 485 2 0.41%
Metcalfe 159 0 0.00%
Monroe 239 0 0.00%
Montgomery 1,467 0 0.00%
Morgan 578 20 3.46%
Muhlenberg 734 0 0.00%
Nelson 927 0 0.00%
Nicholas 292 7 2.40%
Ohio 707 0 0.00%
Oldham 754 7 0.93%
Owen 276 0 0.00%
Owsley 276 0 0.00%
Pendleton 455 4 0.88%
Perry 1,933 0 0.00%
Source: Department of Public Advocacy
Table 7.24: Department of Public Advocacy- Juvenile Cases by County, 2010, Continued
County Total Cases
Family Cases
Percent of Family
Cases Pike 1,839 23 1.25%
Powell 824 23 2.79%
Pulaski 1,530 6 0.39%
Robertson 68 0 0.00%
Rockcastle 494 0 0.00%
Rowan 1,442 2 0.14%
Russell 417 5 1.20%
Scott 1,020 1 0.10%
Shelby 857 12 1.40%
Simpson 299 2 0.67%
Spencer 191 0 0.00%
Taylor 705 0 0.00%
Todd 284 1 0.35%
Trigg 282 0 0.00%
Trimble 183 3 1.64%
Union 470 7 1.49%
Warren 3,984 164 4.12%
Washington 247 0 0.00%
Wayne 736 0 0.00%
Webster 479 10 2.09%
Whitley 1,095 0 0.00%
Wolfe 263 0 0.00%
Woodford 428 3 0.70%
TOTALS 148,641 2156 1.45%
Source: Department of Public Advocacy

Sourcebook of Criminal Justice Statistics in the Commonwealth
158
Section VIII: Appellate Court Caseload Trends
This section presents information from Kentucky’s Appellate and Supreme Courts.
• The total number of filings, dispositions, and opinions in the Court of Appeals was lower in 2010 than in the previous five years.
• In 2010, the Court of Appeals published 223 opinions, or 18.4% of the total opinions,
• From 2006-2010, over 50% of the cases filed in the Court of Appeals have consistently been civil appeals.
• A total of 2,329 cases were filed in the Kentucky Supreme Court in 2010. Of these filings, 2,104 were
mandatory review and 87 were discretionary review cases. 2,332 dispositions were provided by the Kentucky Court of Appeals during the same period.

Sourcebook of Criminal Justice Statistics in the Commonwealth
159
Table 8.2: Court of Appeals Cases, CY 2006-2010 Filings CY 2006 CY 2007 CY 2008 CY 2009 CY 2010
Civil Cases 1,483 1,519 1,391 1,437 1,457
Worker's Compensation Cases 141 125 82 119 87
Criminal Cases 797 744 706 643 560 TOTAL MANDATORY REVIEW ACTIONS 2,421 2,221 2,179 2,199 2,104 Discretionary Review Actions 76 59 70 49 87
Original Actions 160 151 175 167 138
TOTAL FILINGS 2,657 2,598 2,424 2,415 2,329
Disposition By Opinion 1,517 1,644 1,572 1,461 1,335
Disposition by Order 1,083 1,038 1,027 919 997
TOTAL DISPOSITIONS 2,600 2,682 2,599 2,380 2,332
Clearance Rate 98.0% 103.0% 107.0% 98.5% 100.1%
Total Opinions 1,354 1,481 1,426 1,301 1,213
Published Opinions 197 299 210 197 223
Percent Published 14.5% 20.1% 14.7% 15.1% 18.3%
Source: Administrative Office of the Courts
Table 8.1: Supreme Court Case Loads, CY 2006-2010 CY 2006 CY 2007 CY 2008 CY 2009 CY 2010
Direct Appeals 378 364 366 300 337
Motion for Injunctive Relief 6 4 4 6 5
Motions for Discretionary Review 549 572 589 511 477
Motions for Transfer 17 20 12 24 13
Other 0 0 0 2 1
TOTAL 950 960 971 843 833
Source: Administrative Office of the Courts

Sourcebook of Criminal Justice Statistics in the Commonwealth
160
Section IX: Commitment and Release Trends
Section IX presents information from the Kentucky Department of Corrections (DOC) on prison admissions, commitments, sentences, and releases for Part I offenses, and from the Parole Board on hearings, paroles, deferrals, and serve-outs.
• In 2010, the average daily inmate population ranged from a low of 200 at the Lee Adjustment Center to a high of 1,933 at the Kentucky State Reformatory.
• The total number of persons under DOC supervision increased from 60,933 to 62,305 in 2010. The inmate
population was down from 21,638 to 20,580 in 2010, and the probation and parole population was up from 39,295 in 2009 to 41,725 in 2010.
• In 2010, 68% of prison admissions were new commitments and 23% were returned parole violators.
• The Kentucky Department of Corrections reported that there were 1,561 graduates of Kentucky Department of
Corrections’ Substance Abuse Programs in 2010.
• In 2010, the average sentence for Part One offenses ranged from a high of 24 years for Murder to a low of 7 years for Burglary and Larceny/Theft. The average sentence for all Part One offenses was 14 years, with an average of 19 years for Part One Violent Offenses and 9 years for Part One Property Offenses.
• The number of new commitments for Rape, Aggravated Assault, Larceny/Theft, and Auto Theft all decreased
between 2009 and 2010. During this same time period, the number of new commitments for Robbery, Burglary, and Arson increased, and those for Murder remained constant.
• The rate of parole in 2010 was 56.3% up from 51% in 2009.

Sourcebook of Criminal Justice Statistics in the Commonwealth
161
Table 9.1: Kentucky Department of Corrections Institutional Information
Facility Name Location Security Level Date Opened Operational Capacity
Public or Private Facility?
Bell County Forestry Camp Bell County Minimum 1962 300 Public Blackburn Correctional Complex Fayette County Minimum 1972 594 Public Eastern Kentucky Correctional Complex Morgan County Medium 1990 1674 Public Frankfort Career Development Center Franklin County Minimum
1976 205 Public
Green River Correctional Complex
Muhlenberg County Medium 1994 947 Public
Kentucky Correctional Institution for Women Shelby County Medium 1938 691 Public Kentucky State Penitentiary Lyon County Maximum 1886 849 Public Kentucky State Reformatory Oldham County Medium 1936 1,952 Public
Lee Adjustment Center Lee County Medium 1990 816 Private Little Sandy Correctional Complex Elliott County Medium 2005 987 Public Luther Luckett Correctional Complex Oldham County Medium 1981 1073 Public Marion Adjustment Center Marion County Medium 1980 826 Private Northpoint Training Center Boyle County Medium 1983 656 Public Otter Creek Correctional Center Floyd County Medium 1998 656 Private Roederer Correctional Complex Oldham County Medium 1976 1002 Public Western Kentucky Correctional Complex Lyon County Medium 1977 670 Public Source: Kentucky Department of Corrections

Sourcebook of Criminal Justice Statistics in the Commonwealth
162
Table 9.2: Average Daily Population by DOC Institution, 2006-2010
Facility Name FY 2010 FY 2009 FY 2008 FY 2007 FY 2006
Bell County Forestry Camp 296 294 290 274 274
Blackburn Correctional Complex 572 554 585 587 588
Eastern Kentucky Correctional Complex 1,707 1,689 1,705 1,704 1,700
Frankfort Career Development Center 202 200 201 201 201
Green River Correctional Complex 968 962 963 964 961
Kentucky Correctional Institution for Women 685 635 675 707 711
Kentucky State Penitentiary 884 859 857 840 841
Kentucky State Reformatory 1,933 1,937 1,954 1,962 1,946
Lee Adjustment Center 200 63 292 388 386
Little Sandy Correctional Complex 1,012 1,084 1,000 976 973
Luther Luckett Correctional Complex 1,083 1,000 1,070 1,026 1,025
Marion Adjustment Center 817 740 795 813 815
Northpoint Training Center 629* 1,236 1,234 1,235 1,235
Otter Creek Correctional Center 404 431 468 455 426
Roederer Correctional Complex 980 969 995 1,007 1,007
Western Kentucky Correctional Complex 534 675 675 672 655
Source: Kentucky Department of Corrections *NTC population is less than that of previous years after a riot on 08/21/2009

Sourcebook of Criminal Justice Statistics in the Commonwealth
163
Table 9.3: Kentucky Department of Corrections Inmate Population by Type of Supervision, 2006-2010
12/29/2010 12/31/2009 12/31/2008 12/31/2007 12/28/2006
Adult Institutions 13,159 13,011 13,390 13,724 13,782
State Inmates in Local Jails 6,742 7,639 7,363 7,946 5,921
State Inmates in Halfway Houses 679 988 949 823 779
State Inmates in Kentucky Correctional Psychiatric Center 0 0 4 2 7
TOTAL INMATES 20,580 21,638 21,706 22,495 20,489
Probation and Others Not on Parole 29,530 29,314 28,342 27,464 25,662
Parolees 12,195 9,981 10,252 11,589 11,023
TOTAL PROBATION AND PAROLE 41,725 39,295 38,594 39,053 36,685
TOTAL POPULATION UNDER D.O.C SUPERVISION 62,305 60,933 60,300 61,548 57,174
Source: Kentucky Department of Corrections
Table 9.4: Department of Corrections Substance Abuse Program Expenditures, Admissions, and Completions, 2006-2010
Expenditures Admissions Completions
2010 $6,931,409.26 3,577 1,561
2009 $4,830,426.88 2,485 1,034
2008 $4,501,823.00 1,632 534
2007 $3,104,500.98 1,371 442
2006 $3,909,600.00 866 320
Source: Kentucky Department of Corrections

Sourcebook of Criminal Justice Statistics in the Commonwealth
164
Table 9.5: Prison Admissions by Type, 2006-2010
CY 2010 CY 2009 CY 2008 CY 2007 CY 2006
New Commitments 10,082 9,934 9,794 9,792 9,824
Out-of-State Commitment 1 1 2 20 3
Probation Revocation 2 16 30 202 2
Returned by Court Order 67 27 80 56 79
Returned from Active Release 28 43 44 25 28
Returned from Escape 113 89 139 114 91
Returned from Home Incarceration 160 194 157 178 223
Returned from Pre-Release Probation 0 0 0 1 1
Returned from Sex Offender Conditional Discharge 59 99 65 89 61
Returned for Violation of Parole Intensive Supervision Program 3 11 9 8 12
Returned for Violation of Parole to Expanded Supervision 0 0 0 0 1
Returned for Parole Violation 3,507 3,219 3,335 4,079 3,355
Revocation of Shock Probation Intensive Supervision Program 0 0 0 0 0
Revocation of Shock Probation 801 872 810 802 772
Revocation of Conditional Release 0 0 0 0 2
TOTAL 14,823 14,505 14,465 15,366 14,454
Source: Kentucky Department of Corrections

Sourcebook of Criminal Justice Statistics in the Commonwealth
165
Table 9.6: Prison Population by
Classification Status as of December 31, 2010
Level One- Community
2,148
Level Two- Minimum Security 1,578
Level Three- Medium Security 7,141
Level Four- Close Supervision 1,601
Level Five- Maximum Security 235
Other 456
TOTAL POPULATION
Table 9.7: Recidivism Rates* 1999-2009 2009 30.7% 2008 29.5% 2007 32.0% 2006 35.0% 2005 34.0% 2004 33.0% 2003 35.4% 2002 31.7% 2001 30.0% 2000 28.9% 1999 31.0%
Source: Kentucky Department of Corrections
13,159
Source: Kentucky Department of Corrections
Table 9.8: Kentucky Prison Population by Sex, 2006-2010
12/31/2010
* Calculated using the Association of State Correctional Administrators formula for recidivism rates: an individual’s return to the custody of the
Department of Corrections within two years of release from a state institution or contract facility
by parole, shock probation or completion of sentence.
Recidivism does not include re-arrests, federal convictions, convictions in other states or
convictions in Kentucky where the person is probated and not incarcerated.
12/31/2009 12/31/2008 12/28/2007 12/28/2006
Male 11,897 11,896 12,319 12,601 12,626
Female 1,262 1,115 1,071 1,123 1,156
TOTAL 13,159 13,011 13,390 13,724 13,782
Source: Kentucky Department of Corrections

Sourcebook of Criminal Justice Statistics in the Commonwealth
166
Table 9.9: Kentucky Prison Population by Race/Ethnicity, 2006-2010 12/31/2010 12/31/2009 12/31/2008 12/28/2007 12/28/2006
White 8,972 8,793 8,863 9,144 9,183
African American 3,876 3,946 4,259 4,358 4,369
Asian 20 Not Collected Not Collected Not Collected Not Collected
American Indian/ Alaska Native 22 180 190 162 176
Native Hawaiian/Pacific Islander 0 Not Collected Not Collected Not Collected Not Collected
Multiracial* 80 Not Collected Not Collected Not Collected Not Collected
Other** 0 92 78 60 54
Hispanic/Latino** 189 Not Collected Not Collected Not Collected Not Collected
Source: Kentucky Department of Corrections * Individual identifies as two or more races ** Combined into "Other" until 2010
Table 9.10: Kentucky Prison Population by Age, 2010
Under 20 62 20-24 1,446 25-29 2,355 30-34 2,395 35-39 1,888 40-44 1,564 45-49 1,378 50-54 967 55-59 536 60-64 302 65-69 159 70-74 68 75-79 29 80-84 9 85 and Over 1
Source: Kentucky Department of Corrections
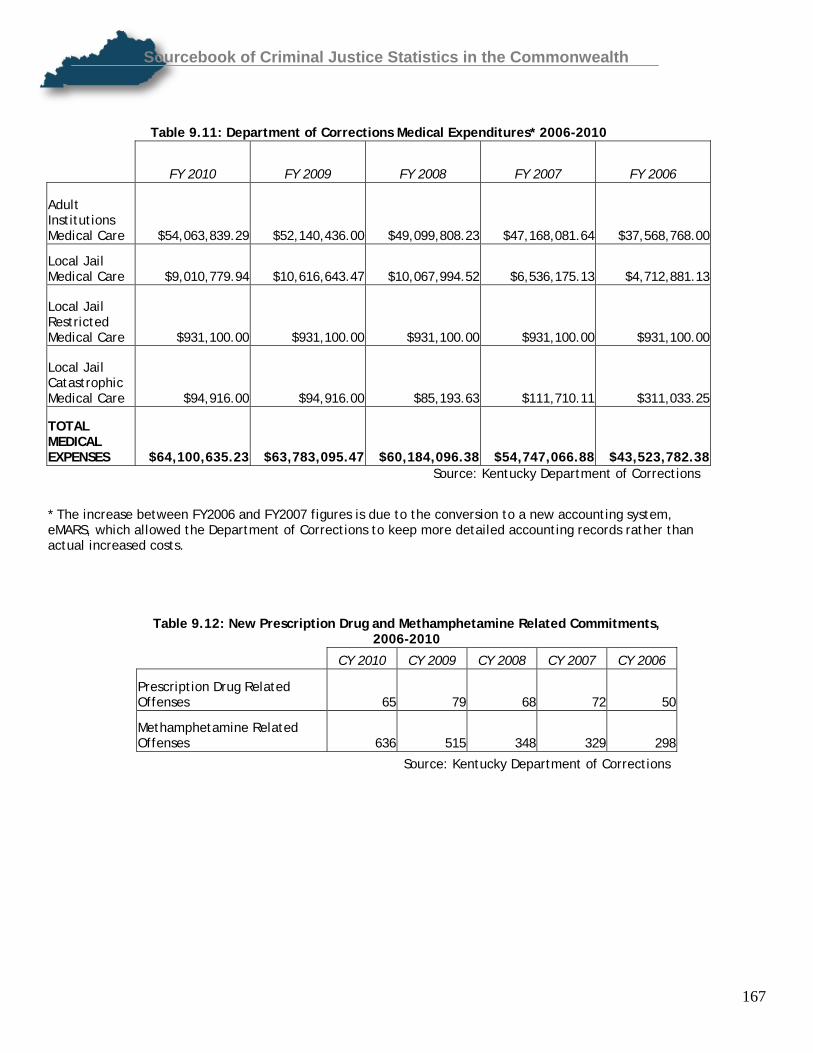
Sourcebook of Criminal Justice Statistics in the Commonwealth
167
Table 9.11: Department of Corrections Medical Expenditures* 2006-2010
FY 2010 FY 2009 FY 2008 FY 2007 FY 2006
Adult Institutions Medical Care $54,063,839.29 $52,140,436.00 $49,099,808.23 $47,168,081.64 $37,568,768.00
Local Jail Medical Care $9,010,779.94 $10,616,643.47 $10,067,994.52 $6,536,175.13 $4,712,881.13
Local Jail Restricted Medical Care $931,100.00 $931,100.00 $931,100.00 $931,100.00 $931,100.00
Local Jail Catastrophic Medical Care $94,916.00 $94,916.00 $85,193.63 $111,710.11 $311,033.25
TOTAL MEDICAL EXPENSES $64,100,635.23 $63,783,095.47 $60,184,096.38 $54,747,066.88 $43,523,782.38
Source: Kentucky Department of Corrections
* The increase between FY2006 and FY2007 figures is due to the conversion to a new accounting system, eMARS, which allowed the Department of Corrections to keep more detailed accounting records rather than actual increased costs.
Table 9.12: New Prescription Drug and Methamphetamine Related Commitments, 2006-2010
CY 2010 CY 2009 CY 2008 CY 2007 CY 2006
Prescription Drug Related Offenses 65 79 68 72 50
Methamphetamine Related Offenses 636 515 348 329 298
Source: Kentucky Department of Corrections

Sourcebook of Criminal Justice Statistics in the Commonwealth
168
Table 9.13: Per Diem Cost to Incarcerate by Institution, 2006-2010
Facility Name FY 2010 FY 2009 FY 2008 FY 2007 FY 2006
Bell County Forestry Camp $37.98 $39.16 $37.88 $37.56 $42.72
Blackburn Correctional Complex $55.46 $58.23 $55.60 $52.40 $48.90
Eastern Kentucky Correctional Complex $44.32 $43.84 $41.26 $39.64 $38.93
Frankfort Career Development Center $46.07 $46.34 $46.71 $43.13 $44.15
Green River Correctional Complex $51.05 $48.87 $47.90 $44.81 $45.67
Kentucky Correctional Institution for Women $73.90 $77.99 $66.39 $64.73 $65.74
Kentucky State Penitentiary $68.68 $68.13 $64.86 $64.42 $66.83
Kentucky State Reformatory $79.46 $71.64 $72.38 $72.82 $69.13
Lee Adjustment Center $45.94 $58.04 $46.24 $40.50 $40.47
Little Sandy Correctional Complex $50.63 $50.63 $45.61 $46.56 $46.48
Luther Luckett Correctional Complex $47.19 $47.52 $46.79 $46.45 $45.70
Marion Adjustment Center $46.03 $40.02 $35.56 $35.30 $32.53
Northpoint Training Center $86.50 $45.74 $42.73 $42.60 $39.35
Source: Kentucky Department of Corrections

Sourcebook of Criminal Justice Statistics in the Commonwealth
169
Table 9.13: Per Diem Cost to Incarcerate by Institution, 2006-2010, Continued
Facility Name FY 2010 FY 2009 FY 2008 FY 2007 FY 2006
Otter Creek Correctional Center $54.82 $53.60 $53.77 $54.59 $51.32
Roederer Correctional Complex $60.03 $56.91 $53.91 $51.01 $49.00
Western Kentucky Correctional Complex $72.05 $56.78 $55.80 $51.72 $55.58
Private Facility Average $48.93 $50.55 $45.19 $43.46 $41.37
Total Institutional Average $57.51 $53.97 $52.14 $50.99 $49.79
Jails $35.94 $36.26 $34.66 $34.06 $32.64
Halfway Houses $33.43 $32.60 $33.36 $30.76 $30.98
Electronic Monitoring $14.33 $12.12 $10.69 $8.65 Not Collected
Probation and Parole Supervision $2.69 $2.63 $2.64 $2.60 $2.96
Source: Kentucky Department of Corrections

Sourcebook of Criminal Justice Statistics in the Commonwealth
170
Table 9.14: Per Annum Cost to Incarcerate by Institution, 2006-2010
Facility Name FY 2010 FY 2009 FY 2008 FY 2007 FY 2006
Bell County Forestry Camp $13,862.84 $14,293.51 $13,825.18 $13,710.94 $15,592.31
Blackburn Correctional Complex $20,242.85 $21,254.03 $20,292.28 $19,124.97 $17,847.30
Eastern Kentucky Correctional Complex $16,176.80 $15,999.88 $15,058.57 $14,469.69 $14,208.88
Frankfort Career Development Center $16,815.00 $16,914.37 $17,049.91 $15,743.54 $16,114.96
Green River Correctional Complex $18,633.25 $17,836.45 $17,482.77 $16,356.96 $16,668.22
Kentucky Correctional Institution for Women $26,973.50 $28,465.00 $24,230.93 $23,628.19 $23,994.59
Kentucky State Penitentiary $25,068.20 $24,867.75 $23,672.32 $23,512.47 $24,392.36
Kentucky State Reformatory $29,002.90 $26,148.79 $26,420.19 $26,578.59 $25,233.01
Lee Adjustment Center $16,768.10 $21,182.99 $16,878.78 $14,781.01 $14,771.53
Little Sandy Correctional Complex $18,479.95 $18,478.78 $16,646.45 $16,994.68 $16,965.94
Luther Luckett Correctional Complex $17,224.35 $17,344.54 $17,078.98 $16,953.73 $16,679.38
Marion Adjustment Center $16,800.95 $14,608.87 $12,979.90 $12,883.41 $11,873.08
Source: Kentucky Department of Corrections

Sourcebook of Criminal Justice Statistics in the Commonwealth
171
Table 9.14: Per Annum Cost to Incarcerate by Institution, 2006-2010, Continued
Facility Name FY 2010 FY 2009 FY 2008 FY 2007 FY 2006
Northpoint Training Center $31,572.50 $16,693.58 $15,595.82 $15,548.71 $14,364.44
Otter Creek Correctional Center $20,009.30 $19,563.28 $19,626.30 $19,926.21 $16,319.22
Roederer Correctional Complex $21,910.95 $20,772.66 $19,678.78 $18,616.86 $17,883.82
Western Kentucky Correctional Complex $26,298.25 $20,724.98 $20,366.96 $18,879.32 $20,287.29
Private Facility Average $17,859.45 $18,451.71 $16,495.00 $15,863.54 $15,100.05
Total Institutional Average $20,991.15 $19,699.05 $19,030.70 $18,613.08 $18,172.76
Jails $13,118.10 $13,234.11 $12,650.71 $12,431.90 $11,913.60
Halfway Houses $12,201.95 $11,899.05 $12,177.54 $11,227.40 $11,307.23
Electronic Monitoring $5,230.45 $4,425.55 $3,902.89 $3,157.25 Did Not Collect
Probation and Parole Supervision $981.85 $961.27 $964.92 $949.00 $1,080.19
Source: Kentucky Department of Corrections

Sourcebook of Criminal Justice Statistics in the Commonwealth
172
Table 9.15: Per Diem Cost to Incarcerate by Institution Type, 2006-2010
FY 2010 FY 2009 FY 2008 FY 2007 FY 2006
Maximum Security $68.68 $68.13 $64.86 $64.42 $66.83
Medium Security- State Institutions Only $58.83 $55.54 $52.53 $51.15 $50.66
Medium Security- State and Private Institutions $59.33 $54.30 $52.07 $50.49 $50.08
Minimum Security-State Institutions Only $46.50 $47.91 $46.73 $44.36 $46.46
Minimum Security- State and Private Institutions $46.38 $45.94 $43.94 $42.10 $40.36
Source: Kentucky Department of Corrections

Sourcebook of Criminal Justice Statistics in the Commonwealth
173
Table 9.16: Per Annum Cost to Incarcerate by Institution Type, 2006-2010
FY 2010 FY 2009 FY 2008 FY 2007 FY 2006
Maximum Security $25,067.03 $24,867.75 $23,672.32 $23,513.30 $24,392.36
Medium Security- State Institutions Only $21,471.32 $20,272.10 $19,173.45 $18,669.75 $18,490.06
Medium Security- State and Private Institutions $21,655.45 $19,819.50 $19,005.55 $18,428.85 $18,280.66
Minimum Security-State Institutions Only $16,972.50 $17,487.15 $17,056.45 $16,191.40 $16,956.47
Minimum Security- State and Private Institutions $16,928.70 $16,768.10 $16,038.10 $15,366.50 $14,731.44
Private Institutions $17,859.45 $18,451.71 $16,495.00 $15,862.90 $15,100.05
Source: Kentucky Department of Corrections

Sourcebook of Criminal Justice Statistics in the Commonwealth
174
Table 9.17: DOC PREA Statistics- Number of Claims Substantiated by Type of Incident, 2005-2010
2005 2006 2007 2008 2009 2010
Non-Consensual Sex Acts (Inmate to Inmate) 0 1 3 5 2 2
Abusive Sexual Contacts (Inmate to Inmate) 4 1 0 1 1 4
Staff Sexual Misconduct (Staff to Inmate) 5 5 9 4 2 4
Staff Sexual Harassment (Staff to Inmate) 0 0 0 1 0 0
Source: Kentucky Department of Corrections PREA-Prison Rape Elimination Act of 2003
Table 9.18: Number of New Commitments by Part I Offense, 2005-2010 Violent Offenses Property Offenses
Year Murder Rape Robbery Aggravated
Assault Burglary Larceny/
Theft Auto Theft Arson
2005
78
63
387 48
1,020 1,293 5
64
2006
67
28
382 40
933 963 11
50
2007
49
45
391 45
632 1,212 28
48
2008
60
44
373 47
635 1,275 27
54
2009
51
43
322 42
1,106 1,228 39
42
2010
55
40
366 29
777 897 31
52
Source: Kentucky Department of Corrections

Sourcebook of Criminal Justice Statistics in the Commonwealth
175
Table 9.19: Average Length of Sentence by Part I Offense in Years, 2005-2010
Violent Offenses Property Offenses
Year Murder Rape Robbery
Aggravated Assault Burglary
Larceny/ Theft
Auto Theft Arson
2005
33
36
16 21
10 8 14
13
2006
27
34
12 21 7
5 11
10
2007
27
28
14 17
13 7 8
11
2008
28
24
14 18
14 8 5
10
2009
26
25
14 8
7 18 6
12
2010
24
21
14 17 7
7 10
12
Source: Kentucky Department of Corrections
Table 9.20: Murder: Commitments and Releases, 2005-2010 2005 2006 2007 2008 2009 2010
New Commitment 78 67 49 60 51 51
Parole 23 36 21 9 21 36
Serve Out 12 14 19 34 32 29 Shock
Probation 0 1 0 0 0 0
Source: Kentucky Department of Corrections
Table 9.21: Rape: Commitments and Releases, 2005-2010 2005 2006 2007 2008 2009 2010
New Commitment 63 28 45 44 43 40
Parole 13 9 10 4 21 9
Serve Out 35 20 23 25 23 24 Shock
Probation 0 0 0 0 0 0
Source: Kentucky Department of Corrections

Sourcebook of Criminal Justice Statistics in the Commonwealth
176
Table 9.22: Robbery: Commitments and Releases, 2005-2010
2005 2006 2007 2008 2009 2010 New
Commitment 387 382 391 373 322 366
Parole 463 440 413 309 410 535
Serve Out 168 169 157 306 184 151 Shock
Probation 40 29 46 29 43 32
Source: Kentucky Department of Corrections
Table 9.23: Aggravated Assault: Commitments and Releases, 2005-2010 2005 2006 2007 2008 2009 2010
New Commitment 48 40 45 47 42 29
Parole 28 20 14 12 15 17
Serve Out 24 16 29 29 23 13 Shock
Probation 1 0 0 0 2 0
Source: Kentucky Department of Corrections
Table 9.24: Burglary: Commitments and Releases, 2005-2010 2005 2006 2007 2008 2009 2010
New Commitment 1,020 933 632 635 662 777
Parole 1,067 1,172 581 533 591 784
Serve Out 549 517 355 510 387 362 Shock
Probation 142 154 108 107 95 129
Source: Kentucky Department of Corrections

Sourcebook of Criminal Justice Statistics in the Commonwealth
177
Table 9.25: Larceny/Theft: Commitments and Releases, 2005-2010 2005 2006 2007 2008 2009 2010
New Commitment 1,175 1,166 1,218 1,254 1,228 897
Parole 1,006 1,105 1,006 977 1,129 1,301
Serve Out 682 598 625 861 736 572 Shock
Probation 191 210 242 215 204 158
Source: Kentucky Department of Corrections
Table 9.26: Auto Theft: Commitments and Releases, 2005-2010 2005 2006 2007 2008 2009 2010
New Commitment 5 11 28 27 39 31
Parole 4 4 6 13 26 26
Serve Out 4 2 3 11 11 18 Shock
Probation 0 2 2 3 4 4
Source: Kentucky Department of Corrections
Table 9.27: Arson: Commitments and Releases, 2005-2010 2005 2006 2007 2008 2009 2010
New Commitment 64 50 48 54 42 52
Parole 44 40 36 40 44 64
Serve Out 35 26 24 42 29 26 Shock
Probation 9 7 7 9 5 6
Source: Kentucky Department of Corrections

Sourcebook of Criminal Justice Statistics in the Commonwealth
178
Source: Kentucky Parole Board
Table 9.28a: Kentucky Parole Board Outcomes, January 1-December 31, 2010
Serve Out Sentence
(Number and Percent)
Outcomes Granted Parole (Number and
Percent)
Deferred (Number and
Percent)
TOTAL (NUMBER
AND PERCENT)
Initial Cases Interviewed 1,816
(66.8%) 843
(31.0%) 60
(2.2%) 2,719
(50.4%)
Deferred Cases Interviewed
1,934 (73.0%)
574 (21.7%)
142 (5.4%)
2,650 (49.1%)
Declined 1
(3.5%) 7
(24.0%) 21
(72.0%) 29
(0.5%)
Face
To
Face
Hea
ring
s
FACE TO FACE HEARINGS TOTAL
3,751 (69.5%)
1,424 (26.4%)
223 (4.1%) 5,398
Initial Cases Reviewed (File Review)
4,005 (65.0%)
1,296 (21.0%)
864 (14.0%)
6,165 (75.6%)
Deferred Cases Reviewed (File Review)
1,302 (65.5%)
358 (18.0%)
329 (16.5%)
1,989 (24.4%)
Declined (File Review) 0
(0%) 0
(0%) 6
(100%) 6
(<0.01%) File
Rev
iew
s
FILE REVIEWS TOTAL 5,307
(65.0%) 1,654
(20.3%) 1,199
8,160 (14.7%)
Adm
inis
trat
ive
Revi
ews
182 Administrative Review
8 (4.4%)
170 (93.4%)
4 (2.2%) (100.0%)
INITIAL CASES TOTAL 5,821
(65.5%) 2,139
(24.1%) 924
(10.4%) 8,884
(64.7%)
DEFERRED CASES TOTAL 3,236
(69.8%) 932
(20.1%) 471 4,639
(10.2%) (33.8%)
DECLINED HEARING TOTAL
1 (2.9%)
7 (20.0%)
27 (77.1%)
35 (0.03%)
TOTA
LS
ALL HEARINGS TOTAL 9,066 (66%)
3,248 (23.7%)
1,426 (10.4%) 13,740

Sourcebook of Criminal Justice Statistics in the Commonwealth
179
Table 9.28b: Other Kentucky Parole Board Outcomes January 1-December 31, 2010
Outcomes Granted Parole (Number and
Percent)
Deferred (Number and
Percent)
Serve Out Sentence
(Number and Percent)
TOTAL (NUMBER
AND PERCENT)
Hearings 502
(17.4%) 1,190
(41.3%) 1,189
(41.3%) 2,881
(87.3%)
Declined Hearings 2
(0.006%) 10
(2.9%) 329
(96.5%) 341
(10.3%) Final Parole Revocations
Administrative Hearings 0 73
(94.8%) 4
(5.2%) 77
(2.3%) REVOCATIONS
TOTAL 0 504
(15.3%) 1,273
(38.6%) 1,522
(46.1%) 3,299
Other Parole Board Hearings
No Action (Number and Percent)
Granted Parole (Number and
Percent)
Deferred (Number and
Percent)
Serve Out Sentence
(Number and Percent)
TOTAL (NUMBER
AND PERCENT)
Back to Board 2
(0.004%) 304
(61.8%) 89
(18.1%) 97
(19.7%) 492
(88.6%)
Medical Hearings 6
(60%) 3
(30%) 1
(10%) 0 10
(1.8%)
Reconsideration 20
(46.5%) 18
(41.9%) 2
(4.7%) 3
(7.0%) 43
(7.7%)
Youthful Offender Hearings 0
2 (25.0%)
6 (75.0%) 0
8 (1.4%)
Courtesy Hearings
2 (100%) 0 0 0
2 (0.004%)
OTHER HEARINGS TOTAL
30 (5.4%)
327 (58.9%)
97 (17.5%)
100 (18.0%) 555
TOTAL PAROLE ELIGIBILITY CASES
30 (0.002%)
9,393 (65.7%)
3,346 (23.4%)
1,526 (10.7%) 14,295
ALL HEARINGS AND REVIEWS TOTAL
30 (0.002%)
9,897 (56.3%)
4,619 (26.3%)
3,048 (17.3%) 17,594
Source: Kentucky Parole Board

Sourcebook of Criminal Justice Statistics in the Commonwealth
180
Table 9.29: Other Parole Board Actions, 2010
Victim Hearings 224
Preliminary Hearings by Staff Administrative Law Judges 1,016 Preliminary Hearings by Contract Administrative Law Judges 179
CSD Motions/Orders 1,103
Interstate Compact Cases 71
TOTAL 2,593
Warrants Issued 3,401
Accepted Waivers for Preliminary Parole Revocation 2,758
Parole Officer Request (Special Reports for Consideration) 160
Requests/Reviews: Reconsiderations 1,007
Void Parole
Table 9.30: Number of Paroled Individuals Ordered to Have No Contact with Victim or Family as a
Condition of Release, 2008-2010
Year of Release Number
2008 174
2009 612
2010 1,478 92 Source: Kentucky Parole Board
TOTAL VICTIM HEARINGS/BOARD ACTIONS 10,011
Open Hearings 371 Program and Treatment
Stipulations Ordered by the Board
Percentage of Parole
Recommended Released after following Therapeutic Community or Substance Abuse Program aftercare recommendations 27% Released after following Department of Corrections Program and aftercare recommendations 2% Must seek substance abuse evaluation while on Parole supervision 54%
Source: Kentucky Parole Board

Sourcebook of Criminal Justice Statistics in the Commonwealth
181
Section X: Juvenile Justice System Trends
This section presents information on offenders served by the juvenile justice system. Data are presented from the Kentucky State Police, the Kentucky Department of Juvenile Justice, and the Kentucky Administrative Office of the Courts’ Court Designated Worker program.
• Between 2006 and 2010, the number of juvenile arrests declined for all Part One offenses: Aggravated Assault; Arson; Burglary; Criminal Homicide; Forcible Rape; Larceny-Theft; Motor Vehicle Theft; Robbery. Overall, the number of juvenile arrests declined 20% over this four year period.
• A total of 4,232 youth were served by the Kentucky Department of Juvenile Justice in 2010, down from 4,594 in
2009. The number of juveniles served by the Department of Juvenile Justice has consistently declined since 2006, with the difference between 2006 and 2010 being 27.9%.
• More youth served by the Kentucky Department of Juvenile Justice were placed under Community Supervision
(3,923) than in any other type of placement. Likewise, 55.9% of the juveniles committed or probated to the Department of Juvenile Justice received a sentence of probation with the remaining 44.1% committed to DJJ facilities.
• The recidivism rate for all Kentucky Department of Juvenile Justice youth (committed and probated) was 5.24%
in 2010.
• In 2010, 31,218 complaints were processed against 23,542 juveniles by the Kentucky Administrative Office of the Courts’ Court Designated Workers program. 10,032 complaints were processed against 8,545 juveniles for Part One offenses during that time.

Sourcebook of Criminal Justice Statistics in the Commonwealth
182
Table 10.1: Specified Juvenile (Age 0-17) Offenses, CY 2006-2010 CY 2006 CY 2007 CY 2008 Offenses Complaints Juveniles Offenses Complaints Juveniles Offenses Complaints Juveniles Aggravated Assault 910 885 825 861 840 778 725 713 665 Arson 165 158 155 117 111 109 112 110 110 Burglary (Breaking or Entering) 1,663 1,542 1,392 1,315 1,204 1,091 1,381 1,299 1,150 Criminal Homicide 32 31 31 20 20 19 31 31 31 Forcible Rape 66 66 63 58 56 54 59 57 57 Larceny-Theft (Except Motor Vehicle Theft) 4,681 4,513 4,169 5,038 4,853 4,493 5,089 4,864 4,512 Motor Vehicle Theft 532 514 471 453 439 418 370 355 325 Robbery 264 381 374 332 358 350 293 285 282 TOTAL 8,430 7,626 6,589 8,220 7,520 6,571 8,052 7,337 6,460
Juveniles
Source: Administrative Office of the Courts, Court Designated Worker’s Program
CY 2009 CY 2010 Offenses Complaints Juveniles Offenses Complaints Aggravated Assault 676 663 629 615 605 579 Arson 102 99 98 120 112 109 Burglary (Breaking or Entering) 1,162 1,095 984 1,051 1,003 890 Criminal Homicide 25 25 25 20 18 18 Forcible Rape 75 71 69 51 49 48 Larceny-Theft (Except Motor Vehicle Theft) 4,872 4,750 4,438 4,066 3,924 3,581 Motor Vehicle Theft 335 330 301 296 294 274
258 295 Robbery 279 269 245 300 6,039 6,519 6,269 7,014 TOTAL 7,526 5,268

Sourcebook of Criminal Justice Statistics in the Commonwealth
183
Table 10.2: Total Specified Juvenile (Age 0-17) Offenses, 2006-2010
Offenses Complaints Juveniles
Aggravated Assault 3,787 3,706 3,476 Arson 616 590 581
Burglary (Breaking or Entering) 6,572 6,143 5,507 Criminal Homicide 128 125 124 Forcible Rape 309 299 291
Larceny-Theft (Except Motor Vehicle Theft) 23,746 22,904 21,193 Motor Vehicle Theft 1,986 1,932 1,789 Robbery 1,603 1,570 1,392
Source: Administrative Office of the Courts, Court Designated Worker’s Program
TOTAL 38,747 37,269 34,353
Table 10.3: Total Number of Youth Served by the Kentucky Department of Juvenile Justice, 2006-2010
CY 2006 CY 2007 CY 2008 CY 2009 CY 2010
Number of Youth Served-Unduplicated 5,868 5,486 5,237 4,594 4,232
Number of Youth Served-Duplicated Not Collected Not Collected 5,388 4,721 4,343
Source: Kentucky Department of Juvenile Justice

Sourcebook of Criminal Justice Statistics in the Commonwealth
184
Table 10.4: Part One and Part Two Juvenile Offenses by Age, 2010
PART I CRIME ARRESTS 10 AND UNDER 11-12 13-14 15 16 17 UNK TOTAL
MURDER 0 0 1 2 3 2 0 8 FORCIBLE RAPE 1 2 5 7 6 11 0 32 ROBBERY 0 8 31 37 76 76 0 228 AGGRAVATED ASSAULT 12 38 79 58 75 86 1 349 BURGLARY 8 46 133 124 184 158 2 655 LARCENY-THEFT (EXCEPT AUTO) 20 125 462 494 532 711 2 2,346 AUTO THEFT 3 5 29 28 39 31 0 135 ARSON 4 3 20 6 6 7 0 46 TOTAL PART I CRIME ARRESTS 48 227 760 756 921 1,082 5 3,799
PART II CRIME ARRESTS 10 AND UNDER 11-12 13-14 15 16 17 UNK TOTAL
MANSLAUGHTER BY NEGLIGENCE 0 0 0 0 0 0 0 0 OTHER ASSAULTS 104 188 426 404 517 438 3 2,080 FORGERY & COUNTERFEITING 0 0 3 3 12 16 0 34 FRAUD 9 5 6 11 26 14 0 71 EMBEZZLEMENT 0 0 1 2 3 1 0 7
STOLEN PROPERTY: BUYING, RECEIVING, POSSESSION 0 5 39 55 84 113 1 297 VANDALISM 10 68 171 123 188 171 1 732 WEAPONS: CARRYING, POSSESSION, ETC. 2 2 22 21 21 35 0 103 PROSTITUTION & COMMERCIALIZED VICE 0 0 0 0 1 0 0 1
SEX OFFENSES (EXCEPT FORCIBLE RAPE & PROSTITUTION) 0 21 25 37 71 78 0 232 NARCOTIC DRUG LAWS 18 21 213 302 587 915 1 2,057 GAMBLING 0 0 1 0 1 0 0 2 OFFENSES AGAINST FAMILY 2 0 2 1 4 8 0 17 DRIVING UNDER INFLUENCE 5 0 2 6 24 122 0 159 LIQUOR LAWS 4 3 14 29 74 163 0 287 DRUNKENNESS 16 2 40 83 156 223 0 520 DISORDERLY CONDUCT 16 82 218 254 316 326 0 1,212 ALL OTHER OFFENSES (EXCEPT TRAFFIC) 55 58 372 374 540 636 6 2,041 CURFEW & LOITERING LAWS 0 0 0 0 1 2 0 3 RUNAWAYS 0 2 20 24 49 57 0 152 TOTAL PART II CRIME ARRESTS 241 457 1,575 1,729 2,675 3,318 12 10,007 TOTAL CRIME ARRESTS 289 684 2,335 2,485 3,596 4,400 17 13,806 Source: Kentucky State Police

Sourcebook of Criminal Justice Statistics in the Commonwealth
185
Table 10.5: Number of Juveniles Committed and Probated to DJJ, 2010
Unduplicated Duplicated
Juveniles Committed to D.J.J. 1,517 1,517
Juveniles Probated to D.J.J. 1,980 2,716
Source: Kentucky Department of Juvenile Justice
Table 10.6: Youth Placed in DJJ Community Supervision by
Gender, 2010 Gender Unduplicated Duplicated
Female 423 423
Male 2,373 2,373
TOTAL 2,796 2,796
Source: Kentucky Department of Juvenile
Justice
Table 10.7: Youth Placed in DJJ Out of Community Supervision by Gender, 2010
Gender Unduplicated Duplicated
Female 105 338
Male 792 2,259
TOTAL 897 2,597
Source: Kentucky Department of
Juvenile Justice

Sourcebook of Criminal Justice Statistics in the Commonwealth
186
Table 10.8: Youth by DJJ Placement Type, 2010
Placement Type Count
Absent Without Leave 340
Alternative to Detention 8
Cadet Leadership Education Program Camp 118
Cadet Leadership Education Program Aftercare 40
DJJ Community Supervision 3,923
DJJ Detention Center 1,572
DJJ Group Home 239
DJJ Youth Development Center 901
Emergency Shelter 6
Foster Home 84
Medical Hospital 3
Jefferson County (non-DJJ) Detention 300
Out of Home Placement 36
Pre-Disposition Investigation/Pre-Sentencing Investigation 1,646
Pending Closure 1,136
Private Child Care 90
Psychiatric Hospital/Facility 224
Substance Abuse Treatment Facility 101
Unknown 4
TOTAL 10,771
Source: Kentucky Department of Juvenile Justice
Table 10.9: Youth Placed in DJJ Community Supervision by Ethnicity, 2010
Ethnicity Unduplicated Duplicated
Hispanic or Latino 64 64
Not Hispanic or Latino 2,730 2,730
Unknown 2 2
Source: Kentucky Department of Juvenile Justice
Table 10.10: Youth Placed in DJJ Out of Community Supervision by Ethnicity, 2010
Ethnicity Unduplicated Duplicated
Hispanic or Latino 28 70
Not Hispanic or Latino 864 2,521
Unknown 5 6
Source: Kentucky Department of Juvenile Justice

Sourcebook of Criminal Justice Statistics in the Commonwealth
187
Table 10.11: Youth Placed in DJJ Community Supervision by Race, 2010
Race Unduplicated Duplicated
African-American 640 640
White 1,979 1,979
Asian or Pacific Islander 1 1
American Indian or Alaska Native 3 3
Other 9 9
Unknown 2 2
Biracial 162 162
TOTAL 2,796 2,796
Source: Kentucky Department of Juvenile Justice
Table 10.12: Youth Placed in DJJ Out of Community Supervision by Race, 2010
Race Unduplicated Duplicated
African-American 263 673
White 578 1,751
Asian or Pacific Islander 1 1
American Indian or Alaska Native 1 1
Other 3 7
Unknown 5 6
Biracial 46 158
TOTAL 897 2,597
Source: Kentucky Department of Juvenile Justice
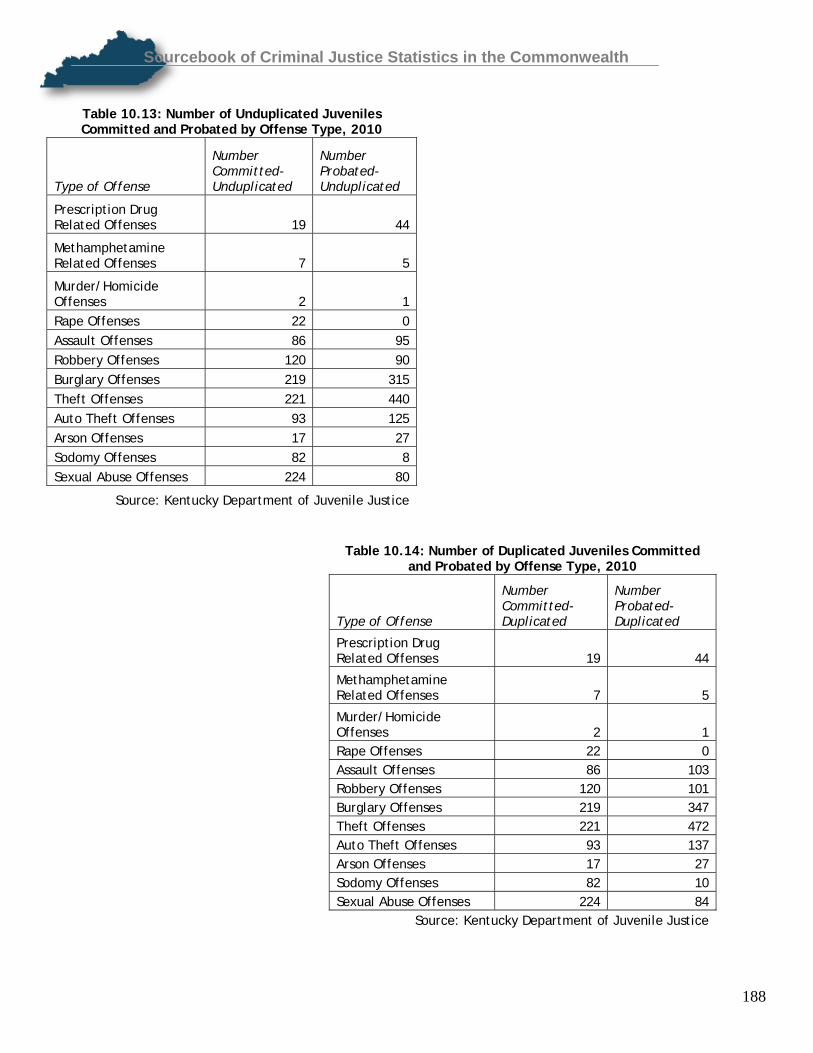
Sourcebook of Criminal Justice Statistics in the Commonwealth
188
Table 10.13: Number of Unduplicated Juveniles Committed and Probated by Offense Type, 2010
Type of Offense
Number Committed-Unduplicated
Number Probated-Unduplicated
Prescription Drug Related Offenses 19 44
Methamphetamine Related Offenses 7 5
Murder/Homicide Offenses 2 1 Rape Offenses 22 0 Assault Offenses 86 95 Robbery Offenses 120 90 Burglary Offenses 219 315 Theft Offenses 221 440 Auto Theft Offenses 93 125 Arson Offenses 17 27 Sodomy Offenses 82 8 Sexual Abuse Offenses 224 80
Source: Kentucky Department of Juvenile Justice
Table 10.14: Number of Duplicated Juveniles Committed and Probated by Offense Type, 2010
Type of Offense
Number Committed-Duplicated
Number Probated-Duplicated
Prescription Drug Related Offenses 19 44
Methamphetamine Related Offenses 7 5
Murder/Homicide Offenses 2 1 Rape Offenses 22 0 Assault Offenses 86 103 Robbery Offenses 120 101 Burglary Offenses 219 347 Theft Offenses 221 472 Auto Theft Offenses 93 137 Arson Offenses 17 27 Sodomy Offenses 82 10 Sexual Abuse Offenses 224 84
Source: Kentucky Department of Juvenile Justice
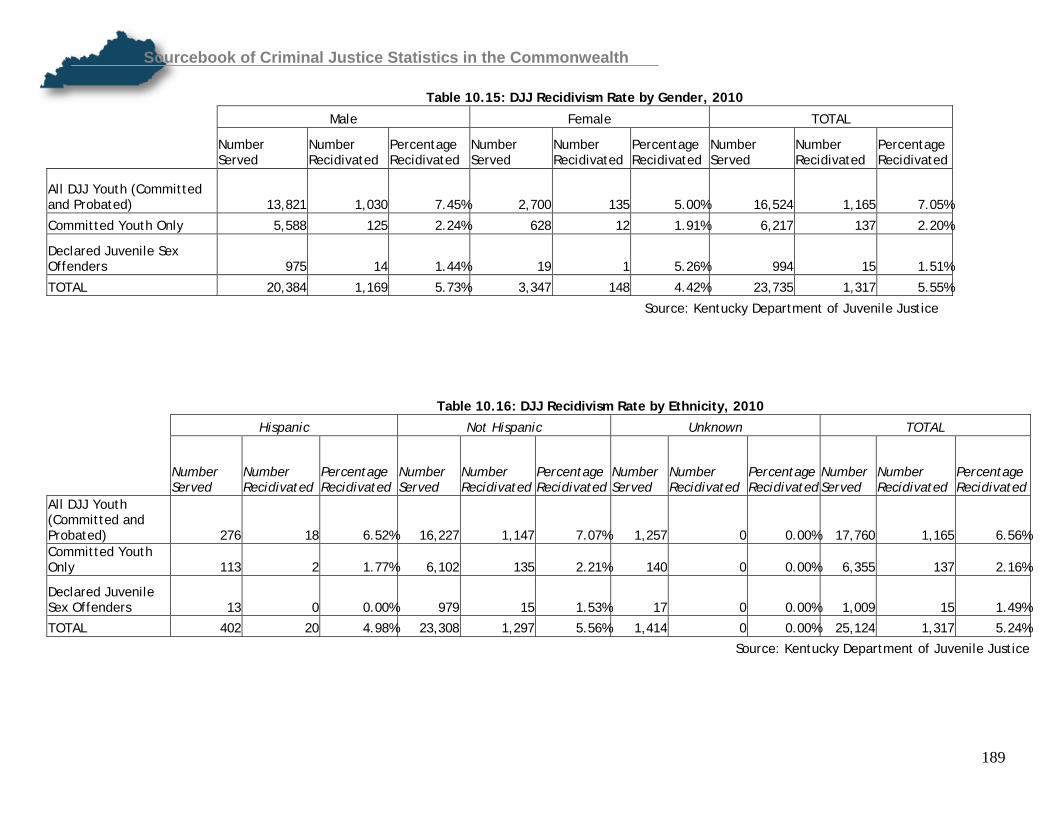
Sourcebook of Criminal Justice Statistics in the Commonwealth
189
Table 10.15: DJJ Recidivism Rate by Gender, 2010
Male Female TOTAL
Number Served
Number Recidivated
Percentage Recidivated
Number Served
Number Recidivated
Percentage Recidivated
Number Served
Number Recidivated
Percentage Recidivated
All DJJ Youth (Committed and Probated) 13,821 1,030 7.45% 2,700 135 5.00% 16,524 1,165 7.05%
Committed Youth Only 5,588 125 2.24% 628 12 1.91% 6,217 137 2.20%
Declared Juvenile Sex Offenders 975 14 1.44% 19 1 5.26% 994 15 1.51%
TOTAL 20,384 1,169 5.73% 3,347 148 4.42% 23,735 1,317 5.55%
Source: Kentucky Department of Juvenile Justice
Table 10.16: DJJ Recidivism Rate by Ethnicity, 2010
Hispanic Not Hispanic Unknown TOTAL
Number Served
Number Recidivated
Percentage Recidivated
Number Served
Number Recidivated
Percentage Recidivated
Number Served
Number Recidivated
Percentage Recidivated
Number Served
Number Recidivated
Percentage Recidivated
All DJJ Youth (Committed and Probated) 276 18 6.52% 16,227 1,147 7.07% 1,257 0 0.00% 17,760 1,165 6.56% Committed Youth Only 113 2 1.77% 6,102 135 2.21% 140 0 0.00% 6,355 137 2.16%
Declared Juvenile Sex Offenders 13 0 0.00% 979 15 1.53% 17 0 0.00% 1,009 15 1.49%
TOTAL 402 20 4.98% 23,308 1,297 5.56% 1,414 0 0.00% 25,124 1,317 5.24%
Source: Kentucky Department of Juvenile Justice

Sourcebook of Criminal Justice Statistics in the Commonwealth
190
Table 10.17: DJJ Recidivism Rate by Race, 2010
African American White Asian or Pacific Islander American Indian or Alaska Native
Number Served
Number Recidivated
Percentage Recidivated
Number Served
Number Recidivated
Percentage Recidivated
Number Served
Number Recidivated
Percentage Recidivated
Number Served
Number Recidivated
Percentage Recidivated
All DJJ Youth (Committed and Probated) 3,391 251 7.40% 12,321 846 6.87% 28 2 7.14% 24 3 12.50% Committed Youth Only 1,617 27 1.67% 4,270 97 2.27% 6 1 16.67% 9 0 0.00% Declared Juvenile Sex Offenders 181
2 1.10% 768 12 1.56% 1 0 0.00% 2 0 0.00%
TOTAL 5,189 280 5.40% 17,359 955 5.50% 35 3 8.57% 35 3 8.57%
Table 10.17: DJJ Recidivism Rate by Race, 2010, Continued Biracial Other Unknown TOTAL
Number Served
Number Recidivated
Percentage Recidivated
Number Served
Number Recidivated
Percentage Recidivated
Number Served
Number Recidivated
Percentage Recidivated
Number Served
Number Recidivated
Percentage Recidivated
All DJJ Youth (Committed and Probated) 668 61 9.13% 71 2 2.82% 1,257 0 0.00% 17,760 1,165 6.56% Committed Youth Only 294 11 3.74% 19 1 5.26% 140 0 0.00% 6,355 137 2.16% Declared Juvenile Sex Offenders 38 1 2.63% 2 0 0.00% 15 0 0.00% 1,009 15 1.49% TOTAL 1,000 73 7.30% 92 3 3.26% 1,412 0 0.00% 25,124 1,317 5.24% Source: Kentucky Department of Juvenile Justice

Sourcebook of Criminal Justice Statistics in the Commonwealth
191
Table 10.18: Juveniles Released by DJJ Before Age 18 by Gender, 2010
Male Female TOTAL
Number Served
Number Released
Before Age 18
Percentage Released
Before Age 18
Number Served
Number Released
Before Age 18
Percentage Released
Before Age 18
Number Served
Number Released
Before Age 18
Percentage Released
Before Age 18
Committed Juveniles Released Before Turning 18 5,073 2,246 44.27% 580 333 57.41% 5,654 2,580 45.63%
Source: Kentucky Department of Juvenile Justice
Table 10.19: Juveniles Released by DJJ Before Age 18 by Ethnicity, 2010
Hispanic Non-Hispanic Unknown TOTAL
Number Served
Number Released
Before Age 18
Percentage Released
Before Age 18
Number Served
Number Released
Before Age 18
Percentage Released
Before Age 18
Number Served
Number Released
Before Age 18
Percentage Released
Before Age 18
Number Served
Number Released
Before Age 18
Percentage Released
Before Age 18
Committed Juveniles Released Before Turning 18 95 46 48.42% 5,557 2,532 45.56% 2 2 100.00% 5,654 2,580 45.63%
Source: Kentucky Department of Juvenile Justice

Sourcebook of Criminal Justice Statistics in the Commonwealth
192
Table 10.20: Juveniles Released by DJJ Before Age 18 by Race, 2010
African American White Asian or Pacific Islander American Indian or Alaska Native
Number Served
Number Released
Before Age 18
Percentage Released
Before Age 18
Number Served
Number Released
Before Age 18
Percentage Released
Before Age 18
Number Served
Number Released
Before Age 18
Percentage Released
Before Age 18
Number Served
Number Released
Before Age 18
Percentage Released
Before Age 18
Committed Juveniles Released Before Turning 18 1,446 624 43.15% 3,914 1,804 46.09% 5 3 60.00% 9 3 33.33%
Table 10.20: Juveniles Released by DJJ Before Age 18 by Race, 2010, Continued
Biracial Other Unknown TOTAL
Number Served
Number Released
Before Age 18
Percentage Released
Before Age 18
Number Served
Number Released
Before Age 18
Percentage Released
Before Age 18
Number Served
Number Released
Before Age 18
Percentage Released
Before Age 18
Number Served
Number Released
Before Age 18
Percentage Released
Before Age 18
100.00% 52.49% 17 7 41.18% 2 2 137
Committed Juveniles Released Before Turning 18 261 5,654 2,580 45.63%
Source: Kentucky Department of Juvenile Justice

Sourcebook of Criminal Justice Statistics in the Commonwealth
193
Table 10.21: Juvenile Complaints with DUI Offenses, 2006-2010
CY 2006 CY 2007 CY 2008 CY 2009 CY 2010
Number of Juvenile DUI Offenses 49 32 27 27 19
Number of Juvenile DUI Complaints 39 32 27 27 19
Number of Juveniles 38 32 27 27 19
Source: Administrative Office of the Courts
Table 10.22: Juvenile Complaints with Prescription Drug Offenses, 2006-2010
CY 2006 CY 2007 CY 2008 CY 2009 CY 2010
Number of Juvenile Prescription Drug Offenses 262 230 213 174 158
Number of Juvenile Prescription Drug Complaints 249 208 195 170 155
Number of Juveniles 243 207 194 169 153
Source: Administrative Office of the Courts
Table 10.23: Juvenile Complaints with Methamphetamine Offenses, 2006-2010
CY 2006 CY 2007 CY 2008 CY 2009 CY 2010
Number of Juvenile Methamphetamine Offenses 6 21 18 26 22
Number of Juvenile Methamphetamine Complaints 6 19 15 22 22
Number of Juveniles 6 19 14 21 21
Source: Administrative Office of the Courts

Sourcebook of Criminal Justice Statistics in the Commonwealth
194
Table 10.24: Juvenile Complaints with Sex Abuse Offenses, 2006-2010
CY 2006 CY 2007 CY 2008 CY 2009 CY 2010
Number of Juvenile Sex Abuse Offenses 376 350 290 287 279
Number of Juvenile Sex Abuse Complaints 349 319 253 268 270
Number of Juveniles 334 300 246 261 255
Number of Juvenile Sodomy Offenses 110 122 128 127 97
Number of Juvenile Sodomy Complaints 106 118 123 111 96
Number of Juveniles 102 114 119 104 94
Number of Juvenile Rape Offenses 68 61 59 75 52
Number of Juvenile Rape Complaints 68 58 57 71 50
Number of Juveniles 65 56 57 69 49
Total Number of Juvenile Sex Abuse Offenses 554 533 477 489 428
Total Number of Juvenile Sex Abuse Complaints 463 429 379 388 365
Total Number of Juveniles 435 399 364 367 343
Source: Administrative Office of the Courts

Sourcebook of Criminal Justice Statistics in the Commonwealth
195
Table 10.25: Rate of Status Offenders by County, 2010
Geographic area Total population Population Ages 10-17
Number of Status Offenses
2010
Population/10,000
Status Offenses
Per 10,000
Adair County 18,656 1,910 9 0.19 47.12
Allen County 19,956 2,218 7 0.22 31.56
Anderson County 21,421 2,562 2 0.26 7.81
Ballard County 8,249 899 0 0.09 0.00
Barren County 42,173 4,991 16 0.50 32.06
Bath County 11,591 1,286 2 0.13 15.55
Bell County 28,691 2,992 7 0.30 23.40
Boone County 118,811 20,654 24 2.07 11.62
Bourbon County 19,985 2,274 6 0.23 26.39
Boyd County 49,542 4,778 14 0.48 29.30
Boyle County 28,432 2,931 6 0.29 20.47
Bracken County 8,488 964 0 0.10 0.00
Breathitt County 13,878 1,599 12 0.16 75.05
Breckinridge County 20,059 2,305 8 0.23 34.71
Bullitt County 74,319 8,973 47 0.90 52.38
Butler County 12,690 1,319 3 0.13 22.74
Caldwell County 12,984 1,335 0 0.13 0.00
Calloway County 37,191 2,992 4 0.30 13.37
Campbell County 90,336 9,257 82 0.93 88.58
Carlisle County 5,104 518 1 0.05 19.31
Carroll County 10,811 1,216 11 0.12 90.46
Carter County 27,720 3,043 7 0.30 23.00
Casey County 15,955 1,768 1 0.18 5.66
Christian County 73,955 7,751 17 0.78 21.93
Clark County 35,613 3,851 33 0.39 85.69
Clay County 21,730 2,254 1 0.23 4.44
Crittenden County 9,315 1,146 3 0.11 26.18
Cumberland County 6,856 675 4 0.07 59.26
Daviess County 96,656 10,327 39 1.03 37.77
Edmonson County 12,161 1,279 0 0.13 0.00
Sources: United States Census Bureau and Kentucky Department of Juvenile Justice

Sourcebook of Criminal Justice Statistics in the Commonwealth
196
Table 10.25: Rate of Status Offenders by County, 2010, Continued
Geographic area Total population Population Ages 10-17
Number of Status Offenses
2010
Population/10,000
Status Offenses
Per 10,000
Elliott County 7,852 737 0 0.07 0.00
Estill County 14,672 1,511 7 0.15 46.33
Fayette County 295,803 25,742 179 2.57 69.54
Fleming County 14,348 1,671 1 0.17 5.98
Floyd County 39,451 3,999 0 0.40 0.00
Franklin County 49,285 4,666 4 0.47 8.57
Fulton County 6,813 605 2 0.06 33.06
Gallatin County 8,589 1,122 1 0.11 8.91
Garrard County 16,912 1,798 2 0.18 11.12
Grant County 24,662 3,114 18 0.31 57.80
Graves County 37,121 4,151 5 0.42 12.05
Grayson County 25,746 2,820 14 0.28 49.65
Green County 11,258 1,470 5 0.15 34.01
Greenup County 36,910 3,875 5 0.39 12.90
Hancock County 8,565 1,011 1 0.10 9.89
Hardin County 105,543 12,070 33 1.21 27.34
Harlan County 29,278 3,062 1 0.31 3.27
Harrison County 18,846 2,167 5 0.22 23.07
Hart County 18,199 2,095 15 0.21 71.60
Henderson County 46,250 4,754 56 0.48 117.80
Henry County 15,416 1,750 3 0.18 17.14
Hickman County 4,902 494 0.05 0.00
Hopkins County 46,920 4,876 11 0.49 22.56
Jackson County 13,494 1,466 2 0.15 13.64
Jefferson County 741,096 75,935 0 7.59 0.00
Johnson County 23,356 2,428 5 0.24 20.59
Kenton County 159,720 17,163 211 1.72 122.94
Knott County 16,346 1,636 3 0.16 18.34
Knox County 31,883 3,605 32 0.36 88.77
Larue County 14,193 1,588 12 0.16 75.57
Sources: United States Census Bureau and Kentucky Department of Juvenile Justice
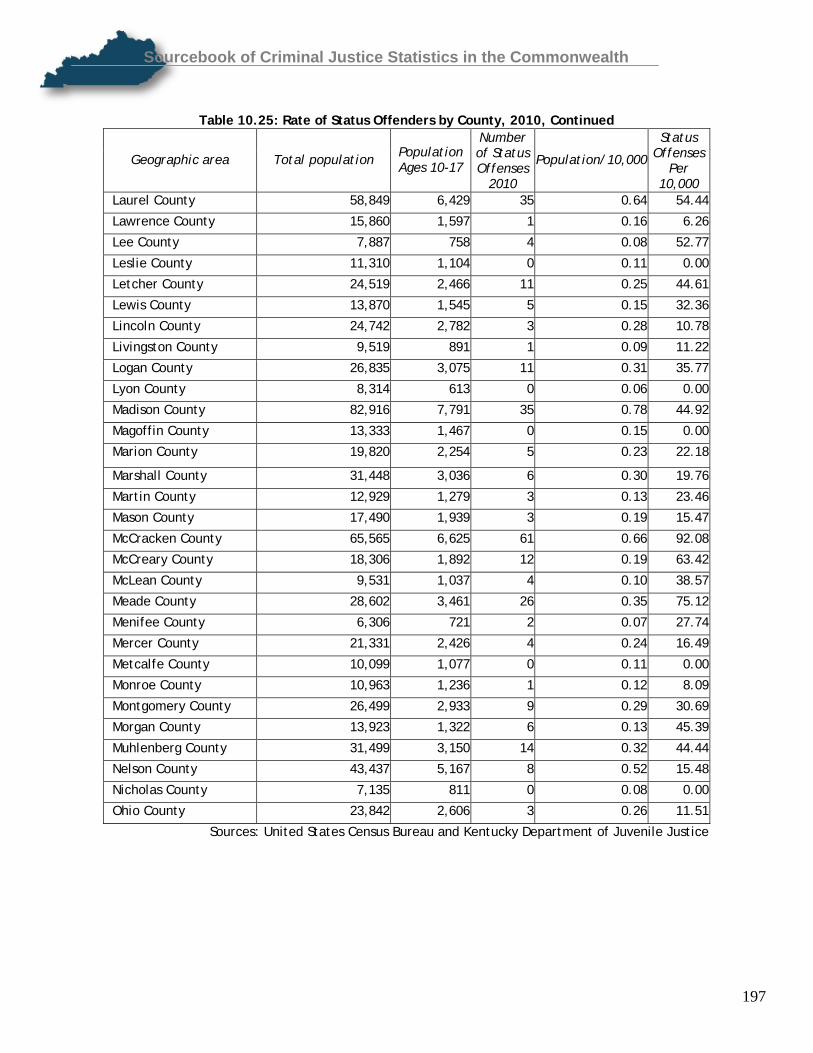
Sourcebook of Criminal Justice Statistics in the Commonwealth
197
Table 10.25: Rate of Status Offenders by County, 2010, Continued
Geographic area Total population Population Ages 10-17
Number of Status Offenses
2010
Population/10,000
Status Offenses
Per 10,000
Laurel County 58,849 6,429 35 0.64 54.44
Lawrence County 15,860 1,597 1 0.16 6.26
Lee County 7,887 758 4 0.08 52.77
Leslie County 11,310 1,104 0 0.11 0.00
Letcher County 24,519 2,466 11 0.25 44.61
Lewis County 13,870 1,545 5 0.15 32.36
Lincoln County 24,742 2,782 3 0.28 10.78
Livingston County 9,519 891 1 0.09 11.22
Logan County 26,835 3,075 11 0.31 35.77
Lyon County 8,314 613 0 0.06 0.00
Madison County 82,916 7,791 35 0.78 44.92
Magoffin County 13,333 1,467 0 0.15 0.00
Marion County 19,820 2,254 5 0.23 22.18
Marshall County 31,448 3,036 6 0.30 19.76
Martin County 12,929 1,279 3 0.13 23.46
Mason County 17,490 1,939 3 0.19 15.47
McCracken County 65,565 6,625 61 0.66 92.08
McCreary County 18,306 1,892 12 0.19 63.42
McLean County 9,531 1,037 4 0.10 38.57
Meade County 28,602 3,461 26 0.35 75.12
Menifee County 6,306 721 2 0.07 27.74
Mercer County 21,331 2,426 4 0.24 16.49
Metcalfe County 10,099 1,077 0 0.11 0.00
Monroe County 10,963 1,236 1 0.12 8.09
Montgomery County 26,499 2,933 9 0.29 30.69
Morgan County 13,923 1,322 6 0.13 45.39
Muhlenberg County 31,499 3,150 14 0.32 44.44
Nelson County 43,437 5,167 8 0.52 15.48
Nicholas County 7,135 811 0 0.08 0.00
Ohio County 23,842 2,606 3 0.26 11.51
Sources: United States Census Bureau and Kentucky Department of Juvenile Justice

Sourcebook of Criminal Justice Statistics in the Commonwealth
198
Table 10.25: Rate of Status Offenders by County, 2010, Continued
Geographic area Total population Population Ages 10-17
Number of
Status Offenses
2010
Population/10,000
Status Offenses
Per 10,000
Oldham County 60,316 8,493 1 0.85 1.18
Owen County 10,841 1,219 1 0.12 8.20
Owsley County 4,755 505 2 0.05 39.60
Pendleton County 14,877 2,613 8 0.26 30.62
Perry County 28,712 2,836 13 0.28 45.84
Pike County 65,024 6,619 6 0.66 9.06
Powell County 12,613 1,430 3 0.14 20.98
Pulaski County 63,063 6,438 5 0.64 7.77
Robertson County 2,282 229 0 0.02 0.00
Rockcastle County 17,056 1,845 0 0.18 0.00
Rowan County 23,333 2,006 3 0.20 14.96
Russell County 17,565 1,758 2 0.18 11.38
Scott County 47,173 5,460 21 0.55 38.46
Shelby County 42,074 4,666 2 0.47 4.29
Simpson County 17,327 1,925 2 0.19 10.39
Spencer County 17,061 2,040 3 0.20 14.71
Taylor County 24,512 2,429 16 0.24 65.87
Todd County 12,460 1,446 5 0.14 34.58
Trigg County 14,339 1,501 3 0.15 19.99
Trimble County 8,809 1,067 4 0.11 37.49
Union County 15,007 1,608 5 0.16 31.09
Warren County 113,792 11,404 43 1.14 37.71
Washington County 11,717 1,258 1 0.13 7.95
Wayne County 20,813 2,198 2 0.22 9.10
Whitley County 35,637 4,033 65 0.40 161.17
Wolfe County 7,355 789 2 0.08 25.35
Woodford County 24,939 2,860 15 0.29 52.45
Sources: United States Census Bureau and Kentucky Department of Juvenile Justice

Sourcebook of Criminal Justice Statistics in the Commonwealth
199
Court Designated Worker Program
In 1986, the Kentucky General Assembly enacted legislation to provide a statewide Court Designated Worker (CDW) program under the direction of the Department of Juvenile Services of the Administrative Office of the Courts, the administrative arm of the Kentucky Court of Justice. The mission of the CDW program is to reduce delinquency among Kentucky’s youth through a collaboration of statewide pre-court services and programs that promote education and accountability. CDWs process juvenile complaints against individuals under the age of 18. The complaints, known as public offenses, are the same as adult crimes. Status offenses are non-criminal forms of juvenile behavior, such as running away from home, skipping class, tobacco offenses, or exhibiting beyond-control behaviors at home or school. Each of Kentucky’s 120 counties has access to the services of a CDW who is available 24 hours a day, seven days a week. A set of uniform criteria determine which juvenile complaints must be forwarded to formal court and which are eligible for informal processing through the CDW program. More serious offenses and repeat offenders are referred to formal court. Juveniles involved in minor offenses are generally eligible for informal processing and enter diversion agreements. A diversion agreement is a voluntary contract between the CDW and the juvenile to resolve a complaint. The data included in this section were provided by the Kentucky Administrative Office of the Courts. Limitations of this data are provided in Appendix D.

Sourcebook of Criminal Justice Statistics in the Commonwealth
200
Table 10.26: Dispositions for Arson Offenses Referred to Court Designated Workers,
2006-2010
CY 2006 CY 2007 CY 2008 CY 2009 CY 2010
Charges 24 28 25 23 33
Complaints* 22 28 22 22 31 Court Designated Worker Referred
Case for Formal Process Juveniles 22 28 22 22 31
Charges 2 7 0 2 1
Complaints* 2 6 0 2 1 Juvenile Requests Formal Court
Hearing Juveniles 2 6 0 2 1
Charges 37 15 28 20 32
Complaints* 37 12 27 2 30 County Attorney Requests Formal
Court Hearing Juveniles 35 12 27 20 30
Charges 59 47 18 23 9
Complaints* 47 42 18 22 9
Judge Requests Formal Court Hearing Juveniles 47 42 18 21 9
Charges 99 43 32 38 64
Complaints* 77 43 32 35 61
Youthful Offender Referral Juveniles 76 43 32 36 61
Charges 13 6 27 13 12
Complaints* 11 6 23 13 12
Successful Diversion Juveniles 11 6 23 13 12
Charges 0 2 0 1 2
Complaints* 0 2 0 1 2
Unsuccessful Diversion Juveniles 0 2 0 1 2
Charges 3 2 1 1 0
Complaints* 3 2 1 1 0 County Attorney Requests Informal
Process/Dismissal Juveniles 3 2 1 1 0
Charges 2 3 3 1 4
Complaints* 2 3 3 1 4 Juvenile Failed to Appear for Preliminary Inquiry Interview Juveniles 2 3 3 1 4
Charges 2 7 4 3 8
Complaints* 2 7 4 3 7
No Probable Cause Juveniles 2 7 4 3 7
Source: Kentucky Administrative Office of the Courts, Court Designated Worker Program
* A complaint may consist of one or multiple charges. The distinct count on complaints includes each only once.

Sourcebook of Criminal Justice Statistics in the Commonwealth
201
Table 10.27: Dispositions for Assault Offenses Referred to Court Designated Workers, 2006-2010
CY 2006 CY 2007 CY 2008 CY 2009 CY 2010 Charges 1,035 1,074 960 950 994 Complaints* 1,034 1,020 910 904 943 Court Designated Worker Referred Case
for Formal Process Juveniles 957 972 876 875 910 Charges 580 503 484 385 382 Complaints* 545 460 462 361 369
Juvenile Requests Formal Court Hearing Juveniles 537 447 443 360 370 Charges 1,096 1,154 1,154 988 964 Complaints* 1,056 1,073 1,072 867 893 County Attorney Requests Formal Court
Hearing Juveniles 1,031 999 1,040 896 869 Charges 653 527 540 425 444 Complaints* 591 483 510 398 412
Judge Requests Formal Court Hearing Juveniles 576 478 497 390 407 Charges 148 165 114 127 102 Complaints* 137 143 106 114 98
Youthful Offender Referral Juveniles 136 135 104 109 96 Charges 460 431 434 527 395 Complaints* 452 415 426 516 389
Successful Diversion Juveniles 440 414 421 512 385 Charges 130 87 125 96 70 Complaints* 103 87 125 92 70
Unsuccessful Diversion Juveniles 100 86 125 92 71 Charges 152 184 205 193 145 Complaints* 152 183 192 188 138 County Attorney Requests Informal
Process/Dismissal Juveniles 151 180 185 187 137 Charges 260 225 190 156 96 Complaints* 260 213 183 148 90 Juvenile Failed to Appear for
Preliminary Inquiry Interview Juveniles 241 207 177 144 83 Charges 99 102 90 86 71 Complaints* 96 101 84 83 67
No Probable Cause Juveniles 96 98 82 82 67 Charges 0 0 0 0 3 Complaints* 0 0 0 0 3
Active Juveniles 0 0 0 0 3 Charges 0 1 1 1 1 Complaints* 0 1 1 1 1
Closed for Unknown Reason Juveniles 0 1 1 1 1 Charges 0 3 3 0 0 Complaints* 0 3 3 0 0 Juveniles 0 3 3 0 0 Information Not Available
Source: Kentucky Administrative Office of the Courts, Court Designated Worker Program
* A complaint may consist of one or multiple charges. The distinct count on complaints includes each only once.

Sourcebook of Criminal Justice Statistics in the Commonwealth
202
Table 10.28: Dispositions for Auto Theft Offenses Referred to Court Designated Workers, 2006-2010
CY 2006 CY 2007 CY 2008 CY 2009 CY 2010
Charges 102 77 44 56 35
Complaints* 95 67 42 52 34 Court Designated Worker Referred
Case for Formal Process Juveniles 93 61 40 52 33
Charges 5 2 3 1 2
Complaints* 5 2 3 1 2 Juvenile Requests Formal Court
Hearing Juveniles 5 2 3 1 2
Charges 121 81 67 46 36
Complaints* 100 74 65 42 34 County Attorney Requests Formal
Court Hearing Juveniles 94 73 62 41 34
Charges 92 69 59 47 34
Complaints* 91 58 42 38 32
Judge Requests Formal Court Hearing Juveniles 89 58 42 37 31
Charges 42 28 21 29 16
Complaints* 38 28 18 26 14
Youthful Offender Referral Juveniles 37 27 16 19 11
Charges 19 7 5 11 12
Complaints* 10 7 5 11 12
Successful Diversion Juveniles 10 7 5 11 12
Charges 4 1 0 2 3
Complaints* 4 1 0 1 3
Unsuccessful Diversion Juveniles 3 1 0 1 3
Charges 2 2 1 0 1
Complaints* 2 2 1 0 1 County Attorney Requests Informal
Process/Dismissal Juveniles 2 2 1 0 1
Charges 3 2 0 3 4
Complaints* 3 2 0 3 4 Juvenile Failed to Appear for Preliminary Inquiry Interview Juveniles 3 2 0 3 4
Charges 2 6 2 1 2
Complaints* 1 3 2 1 2
No Probable Cause Juveniles 1 3 2 1 2
Charges 0 0 0 1 0
Complaints* 0 0 0 1 0
Closed for Unknown Reason Juveniles 0 0 0 1 0
Source: Kentucky Administrative Office of the Courts, Court Designated Worker Program
* A complaint may consist of one or multiple charges. The distinct count on complaints includes each only once.

Sourcebook of Criminal Justice Statistics in the Commonwealth
203
Table 10.29: Dispositions for Burglary Offenses Referred to Court Designated Workers, 2006-2010
CY 2006 CY 2007 CY 2008 CY 2009 CY 2010 Charges 339 334 261 216 270 Complaints* 296 286 235 260 238 Court Designated Worker Referred
Case for Formal Process Juveniles 281 274 137 247 226 Charges 22 9 10 13 12 Complaints* 19 9 10 12 11 Juvenile Requests Formal Court
Hearing Juveniles 19 9 10 12 11 Charges 638 495 530 359 324 Complaints* 535 437 468 309 286 County Attorney Requests Formal
Court Hearing Juveniles 526 415 439 313 279 Charges 278 208 311 251 217 Complaints* 268 204 264 210 173
Judge Requests Formal Court Hearing Juveniles 322 261 256 206 170 Charges 322 261 256 229 222 Complaints* 198 214 207 191 225
Youthful Offender Referral Juveniles 185 208 190 174 183 Charges 189 123 139 147 109 Complaints* 180 115 132 138 104
Successful Diversion Juveniles 178 115 131 138 104 Charges 10 12 16 12 5 Complaints* 10 8 14 9 5
Unsuccessful Diversion Juveniles 10 8 14 9 5 Charges 25 12 12 3 6 Complaints* 25 12 12 3 6 County Attorney Requests Informal
Process/Dismissal Juveniles 25 12 12 3 6 Charges 44 42 65 38 18 Complaints* 42 38 39 35 17 Juvenile Failed to Appear for
Preliminary Inquiry Interview Juveniles 40 37 39 33 16 Charges 8 10 9 4 3 Complaints* 8 10 9 4 3
No Probable Cause Juveniles 8 10 9 4 3 Charges 0 0 1 1 0 Complaints* 0 0 1 1 0
Active Juveniles 0 0 1 1 0 Charges 0 2 0 0 0 Complaints* 0 2 0 0 0 Juveniles 0 2 0 0 0 Closed for Unknown Reason
Source: Kentucky Administrative Office of the Courts, Court Designated Worker Program
* A complaint may consist of one or multiple charges. The distinct count on complaints includes each only once.

Sourcebook of Criminal Justice Statistics in the Commonwealth
204
Table 10.30: Dispositions for Murder/Homicide Offenses Referred to Court Designated Workers, 2006-2010
CY 2006 CY 2007 CY 2008 CY 2009 CY 2010
Charges 3 2 0 3 1
Complaints* 3 2 0 3 1 Court Designated Worker Referred Case
for Formal Process Juveniles 3 2 0 3 1
Charges 1 0 0 0 0
Complaints* 1 0 0 0 0
Juvenile Requests Formal Court Hearing Juveniles 1 0 0 0 0
Charges 6 0 2 0 0
Complaints* 2 0 2 0 0 County Attorney Requests Formal Court
Hearing Juveniles 2 0 2 0 0
Charges 1 0 1 1 0
Complaints* 1 0 1 1 0
Judge Requests Formal Court Hearing Juveniles 1 0 1 1 0
Charges 36 28 38 22 20
Complaints* 28 22 32 22 17
Youthful Offender Referral Juveniles 28 21 32 22 17
Charges 1 0 0 0 0
Complaints* 1 0 0 0 0 County Attorney Requests Informal
Process/Dismissal Juveniles 1 0 0 0 0
Charges 0 0 0 1 1
Complaints* 0 0 0 1 1
No Probable Cause Juveniles 0 0 0 1 1
Source: Kentucky Administrative Office of the Courts, Court Designated Worker Program
* A complaint may consist of one or multiple charges. The distinct count on complaints includes each only once.

Sourcebook of Criminal Justice Statistics in the Commonwealth
205
Table 10.31: Dispositions for Rape Offenses Referred to Court Designated Workers, 2006-2010
CY 2006 CY 2007 CY 2008 CY 2009 CY 2010
Charges 7 9 12 14 3
Complaints* 7 5 9 12 3 Court Designated Worker Referred
Case for Formal Process Juveniles 7 5 9 12 3
Charges 6 5 4 1 6
Complaints* 5 4 4 1 4 County Attorney Requests Formal
Court Hearing Juveniles 5 4 4 1 4
Charges 9 16 6 17 12
Complaints* 9 9 4 11 5
Judge Requests Formal Court Hearing Juveniles 9 9 4 11 5
Charges 51 41 53 55 39
Complaints* 39 38 41 43 33
Youthful Offender Referral Juveniles 38 37 41 42 32
Charges 2 0 0 0 1
Complaints* 2 0 0 0 1 County Attorney Requests Informal
Process/Dismissal Juveniles 2 0 0 0 1
Charges 1 0 0 0 1
Complaints* 1 0 0 0 1 Juvenile Failed to Appear for Preliminary Inquiry Interview Juveniles 1 0 0 0 1
Charges 3 2 0 3 2
Complaints* 3 2 0 3 2
No Probable Cause Juveniles 3 2 0 3 2
Source: Kentucky Administrative Office of the Courts, Court Designated Worker Program
* A complaint may consist of one or multiple charges. The distinct count on complaints includes each only once.

Sourcebook of Criminal Justice Statistics in the Commonwealth
206
Table 10.32: Dispositions for Robbery Offenses Referred to Court Designated
Workers, 2006-2010
CY 2006 CY 2007 CY 2008 CY 2009 CY 2010
Charges 70 17 33 30 40
Complaints* 69 17 32 29 39 Court Designated Worker Referred
Case for Formal Process Juveniles 66 17 32 29 39
Charges 50 36 80 66 58
Complaints* 49 36 80 65 56 County Attorney Requests Formal
Court Hearing Juveniles 49 36 80 64 56
Charges 51 39 11 11 11
Complaints* 51 34 11 11 10
Judge Requests Formal Court Hearing Juveniles 51 34 11 11 10
Charges 238 303 164 185 214
Complaints* 201 247 149 163 191
Youthful Offender Referral Juveniles 178 209 140 152 157
Charges 2 1 5 4 1
Complaints* 2 1 4 4 1
Successful Diversion Juveniles 2 1 4 4 1
Charges 1 1 0 0 0
Complaints* 1 1 0 0 0
Unsuccessful Diversion Juveniles 1 1 0 0 0
Charges 1 3 0 2 1
Complaints* 1 3 0 2 1 County Attorney Requests Informal
Process/Dismissal Juveniles 1 3 0 2 1
Charges 4 0 3 3 1
Complaints* 4 0 3 3 1 Juvenile Failed to Appear for Preliminary Inquiry Interview Juveniles 4 0 3 3 1
Charges 0 1 0 0 0
Complaints* 0 1 0 0 0
No Probable Cause Juveniles 0 1 0 0 0
Charges 0 0 0 0 1
Complaints* 0 0 0 0 1
Active Juveniles 0 0 0 0 1
Charges 1 0 0 0 0
Complaints* 1 0 0 0 0
Information Not Available Juveniles 1 0 0 0 0
Source: Kentucky Administrative Office of the Courts, Court Designated Worker Program
* A complaint may consist of one or multiple charges. The distinct count on complaints includes each only once.

Sourcebook of Criminal Justice Statistics in the Commonwealth
207
Table 10.33: Dispositions for Sexual Abuse Offenses Referred to Court Designated Workers, 2006-2010
CY 2006 CY 2007 CY 2008 CY 2009 CY 2010
Charges 146 148 173 113 79
Complaints* 108 119 88 87 69 Court Designated Worker Referred Case
for Formal Process Juveniles 104 111 77 85 66
Charges 5 2 3 1 6
Complaints* 4 2 3 1 5
Juvenile Requests Formal Court Hearing Juveniles 4 2 3 1 5
Charges 37 51 22 32 22
Complaints* 42 38 20 15 16 County Attorney Requests Formal Court
Hearing Juveniles 31 38 20 13 16
Charges 145 56 48 40 39
Complaints* 40 37 29 26 12
Judge Requests Formal Court Hearing Juveniles 40 22 29 26 12
Charges 145 81 60 95 73
Complaints* 44 52 40 48 45
Youthful Offender Referral Juveniles 43 51 40 48 45
Charges 3 3 2 5 9
Complaints* 3 2 2 5 8
Successful Diversion Juveniles 3 2 2 5 7
Charges 1 0 0 0 0
Complaints* 1 0 0 0 0
Unsuccessful Diversion Juveniles 1 0 0 0 0
Charges 4 6 9 4 4
Complaints* 4 6 9 4 4 County Attorney Requests Informal
Process/Dismissal Juveniles 4 6 9 4 4
Charges 17 11 10 0 4
Complaints* 11 4 8 0 4 Juvenile Failed to Appear for Preliminary
Inquiry Interview Juveniles 11 4 8 0 3
Charges 4 5 6 4 7
Complaints* 3 5 5 4 7
No Probable Cause Juveniles 3 5 5 4 7
Charges 0 0 0 0 1
Complaints* 0 0 0 0 1
Active Juveniles 0 0 0 0 1
Source: Kentucky Administrative Office of the Courts, Court Designated Worker Program
* A complaint may consist of one or multiple charges. The distinct count on complaints includes each only once.

Sourcebook of Criminal Justice Statistics in the Commonwealth
208
Table 10.34: Dispositions for Sodomy Offenses Referred to Court Designated Workers, 2006-2010
CY 2006 CY 2007 CY 2008 CY 2009 CY 2010
Charges 38 49 74 41 38
Complaints* 30 35 45 25 29 Court Designated Worker Referred Case
for Formal Process Juveniles 29 34 42 24 29
Charges 0 0 1 1 1
Complaints* 0 0 1 1 1 Juvenile Requests
Formal Court Hearing Juveniles 0 0 1 1 1
Charges 11 18 26 7 14
Complaints* 8 10 14 7 12 County Attorney Requests Formal Court Hearing Juveniles 8 10 14 7 12
Charges 19 29 16 28 5
Complaints* 11 12 13 19 4 Judge Requests
Formal Court Hearing Juveniles 11 12 13 18 4
Charges 107 126 96 128 105
Complaints* 66 69 64 73 63 Youthful Offender
Referral Juveniles 64 68 63 70 62
Charges 0 1 0 0 4
Complaints* 0 1 0 0 1
Successful Diversion Juveniles 0 1 0 0 1
Charges 0 0 0 2 1
Complaints* 0 0 0 2 1 County Attorney Requests Informal Process/Dismissal Juveniles 0 0 0 2 1
Charges 3 7 1 0 2
Complaints* 3 3 1 0 2 Juvenile Failed to
Appear for Preliminary Inquiry
Interview Juveniles 3 3 1 0 2
Charges 0 0 0 1 1
Complaints* 0 0 0 1 1
Juveniles 0 0 0 1 1 No Probable Cause
Source: Kentucky Administrative Office of the Courts, Court Designated Worker Program
* A complaint may consist of one or multiple charges. The distinct count on complaints
includes each only once.

Sourcebook of Criminal Justice Statistics in the Commonwealth
209
Table 10.35: Dispositions for Theft Offenses Referred to Court Designated
Workers, 2006-2010 CY 2006 CY 2007 CY 2008 CY 2009 CY 2010
Charges 1,016 1,021 996 1,108 1,188 Complaints* 1,012 932 908 1,117 1,085 Court Designated
Worker Referred Case for Formal Process Juveniles 890 903 881 976 1,001
Charges 108 123 119 121 107 Complaints* 107 118 115 119 105 Juvenile Requests
Formal Court Hearing Juveniles 107 116 115 118 104 Charges 884 997 895 773 704 Complaints* 730 768 807 683 636 County Attorney
Requests Formal Court Hearing Juveniles 711 744 679 662 605
Charges 306 284 306 300 259 Complaints* 269 246 234 249 235 Judge Requests
Formal Court Hearing Juveniles 267 244 231 245 232 Charges 161 143 175 150 120 Complaints* 89 84 111 96 108 Youthful Offender
Referral Juveniles 83 83 102 91 91 Charges 1,894 2,339 2,173 2,472 2,062 Complaints* 1,839 2,034 2,107 2,421 1,774
Successful Diversion Juveniles 1,818 2,006 2,085 2,390 1,873 Charges 131 161 177 146 134 Complaints* 125 157 177 140 131 Unsuccessful
Diversion Juveniles 125 153 183 138 128 Charges 146 177 125 124 90 Complaints* 144 168 124 123 89 County Attorney
Requests Informal Process/Dismissal Juveniles 144 167 124 123 89
Charges 326 344 339 322 236 Complaints* 307 330 316 288 227
Juvenile Failed to Appear for
Preliminary Inquiry Interview Juveniles 299 321 305 285 227
Charges 29 57 61 33 33 Complaints* 28 55 60 32 33
No Probable Cause Juveniles 28 54 59 31 33 Charges 0 0 0 1 0 Complaints* 0 0 0 1 0
Active Juveniles 0 0 0 1 0 Charges 0 3 0 0 0 Complaints* 0 3 0 0 0 Closed for Unknown
Reason Juveniles 0 3 0 0 0 Charges 0 0 2 0 0 Complaints* 0 0 2 0 0 Information Not
Available Juveniles 0 0 2 0 0 Source: Kentucky Administrative Office of the Courts, Court Designated Worker
Program
* A complaint may consist of one or multiple charges. The distinct count on complaints includes each only once.

Sourcebook of Criminal Justice Statistics in the Commonwealth
210
Table 10.36: Court Designated Workers- Number of Charges, Complaints, and Juveniles by Type of Offense, 2006-
2010 CY 2006 CY 2007 CY 2008 CY 2009 CY 2010
Charges 189 123 118 104 125 Complaints* 158 111 110 99 112
Ars
on
Juveniles 155 109 110 98 109 Charges 5,230 5,103 4,963 4,649 4,271
Complaints* 4,852 4,723 4,677 4,321 4,008
Ass
ault
Juveniles 4,393 4,248 4,226 3,991 3,680
Charges 405 285 211 200 148
Complaints* 348 251 183 179 141
Aut
o Th
eft
Juveniles 312 236 169 157 128
Charges 2,036 1,522 1,607 1,397 1,246
Complaints* 1,592 1,258 1,326 1,122 1,026
Burg
lary
Juveniles 1,440 1,138 1,175 1,009 912
Charges 48 30 41 27 22
Complaints* 36 24 35 27 19
Mur
der/
H
omic
ide
Juveniles 36 23 35 27 19
Charges 81 73 75 90 71
Complaints* 68 58 58 70 50
Rape
Juveniles 65 56 58 68 49
Charges 418 421 305 296 326
Complaints* 375 347 281 269 295
Robb
ery
Juveniles 333 291 263 245 258
Charges 622 442 410 418 360
Complaints* 346 320 253 268 268
Sexu
al
Abu
se
Juveniles 331 301 246 261 253
Charges 159 217 197 184 143
Complaints* 107 117 123 110 98
Sodo
my
Juveniles 103 114 119 103 96
Charges 5,001 5,462 5,295 5,526 4,812 Complaints* 4,479 4,814 4,832 5,083 4,424
Thef
t
Juveniles 4,143 4,464 4,486 4,719 3,980 Charges 14,189 13,678 13,222 12,891 11,524 Complaints* 11,763 11,533 11,391 11,100 10,032
TOTA
L
Juveniles 10,027 9,878 9,819 9,712 8,545
Source: Kentucky Administrative Office of the Courts, Court Designated Worker Program * A complaint may consist of one or multiple charges. The distinct count on complaints includes each only once.

Sourcebook of Criminal Justice Statistics in the Commonwealth
211
Table 10.37: Court Designated Worker-Complaints Filed by Cases Closed Reason, 2006-2010 CY 2006 CY 2007 CY 2008 CY 2009 CY 2010 Complaints Juveniles Complaints Juveniles Complaints Juveniles Complaints Juveniles Complaints Juveniles
Court Designated Worker Referred Case for Formal Process 8,057 5,655 7,837 5,625 6,763 5,014 6,927 5,046 6,827 4,850
Juvenile Requests Formal Court Hearing 1,259 1,159 1,154 1,087 1,082 1,020 996 941 872 821
County Attorney Requests Formal Court Hearing 6,883 5,808 6,562 5,567 6,175 5,263 4,833 4,231 4,543 3,966
Judge Requests Formal Court Hearing 3,707 3,256 3,918 3,393 3,792 3,144 2,904 2,542 2,618 2,302
Youthful Offender Referral 910 767 958 781 847 712 805 680 802 651
Successful Diversion 10,029 9,383 10,431 9,760 10,497 9,813 11,251 10,471 10,097 9,417
Unsuccessful Diversion 2,129 2,007 2,182 2,074 2,182 2,068 1,845 1,740 1,773 1,678
Source: Kentucky Administrative Office of the Courts, Court Designated Worker Program

Sourcebook of Criminal Justice Statistics in the Commonwealth
212
Table 10.37: Court Designated Worker-Complaints Filed by Cases Closed Reason 2006-2010, Continued
CY 2006 CY 2007 CY 2008 CY 2009 CY 2010
Complaints Juveniles Complaints Juveniles Complaints Juveniles Complaints Juveniles Complaints Juveniles Juvenile Failed to Appear for Preliminary Inquiry Interview 2,436 2,160 2,258 2,034 1,939 1,744 1,576 1,432 1,446 1,356
County Attorney Requests Informal Process/Dismissal 1,952 1,877 1,830 1,774 1,727 1,675 1,664 1,619 1,513 1,477
No Probable Cause 721 691 666 649 693 654 608 587 518 497
Active 0 0 0 0 1 1 3 3 14 13
Closed for Unknown Reason 2 2 13 13 3 3 6 6 6 6
Court Generated Charge 23 19 123 108 162 122 187 138 189 148
Information Not Available 4 4 13 10 13 12 0 0 0 0
TOTAL 38,112 27,551 37,945 27,798 35,876 26,644 33,605 25,455 31,218 23,542 Source: Kentucky Administrative Office of the Courts, Court Designated Worker Program

Sourcebook of Criminal Justice Statistics in the Commonwealth
213
Section XI: Selected Crime Categories and Crime Indicators
In addition to reviewing criminal justice system data pertaining to Part One offenses, data on selected categories of crime have been included for informational purposes. These categories include drug related offenses with a particular focus on methamphetamines and prescription drugs, driving under the influence (DUI) offenses, domestic violence, and sex offenses. Information presented in this section includes data from the Kentucky State Police, Federal Bureau of Investigation, Kentucky Administrative Office of the Courts, Kentucky Department of Corrections, and the Cabinet for Health and Family Services’ Kentucky All Schedule, Prescription Electronic Reporting (KASPER) system.

Sourcebook of Criminal Justice Statistics in the Commonwealth
214
Drug Related Offenses
• The total number of arrests for drug offenses increased 0.47% between 2009 and 2010.
• Over the five year period between 2006 and 2010, arrests for opium or cocaine (and their derivatives) decreased 46.47%, arrests for marijuana decreased 2.65%, arrests for synthetic narcotics increased 36.02%, and arrests for other dangerous non-narcotic drugs increased 34.25%.
• In 2010, there were 61,413 drug arrests in the Commonwealth of Kentucky.
• A total of 1,051 cases of overdose related deaths were autopsied by the Kentucky Office of the Medical
Examiner in 2010. Of these cases, 541 (81%) were ruled as unintentional and 42 (6%) were suicides. The most frequently detected drugs in the blood of overdose victims was Alprazolam (Xanax and other brand names) and Oxycodone (OxyContin and other brand names).

Sourcebook of Criminal Justice Statistics in the Commonwealth
215
Table 11.1: Drug Arrests by Type of Substance, 2006-2010
2010 2009 2008 2007 2006
Percent Change 2006-2010
Percent Change 2009-2010
Opium, Cocaine, and their Derivatives 4,183 5,042 6,300 7,072 7,815 -46.47% -17.04%
Marijuana 21,113 22,516 21,695 22,996 21,688 -2.65% -0.46%
Synthetic Narcotics 2,772 2,121 1,989 2,071 2,038 36.02% 30.69%
Other Dangerous Non-Narcotic Drugs 32,026 29,109 28,443 24,838 34.25% 4.12% 33,345
TOTAL 61,413 61,705 59,093 60,582 56,379 8.93% 0.47%
Source: Kentucky State Police, Crime in Kentucky 2006-2010
Chart 11.a: Drug Arrests by Type of Substance, 2006-2010
0
20,000
40,000
60,000
80,000
100,000
120,000
140,000
2010 2009 2008 2007 2006
Year
Num
ber
of A
rres
ts
TOTAL
Other Dangerous Non-NarcoticDrugs
Synthetic Narcotics
Marijuana
Opium, Cocaine, and theirDerivatives
Source: Kentucky State Police, Crime in Kentucky 2006-2010

Sourcebook of Criminal Justice Statistics in the Commonwealth
216
Table 11.2: Drugs Most Frequently Detected in the Blood of Overdose Victims, 2007-2010
2007 2008 2009 2010 TOTAL
Alprazolam 21 69 207 250 547
Oxycodone 86 102 169 208 565
Methadone 168 144 117 107 536
Diazepam 63 47 81 83 274
Alcohol 58 51 80 68 257
Hydrocodone 74 86 67 148 375
Morphine n/a 46 56 85* 187
Fentanyl n/a 39 44 44 127
Cannabinoids n/a n/a 34 0 34
Cocaine 51 50 32 23 156
Methamphetamine n/a n/a n/a 11 11
Oxymorphone n/a n/a n/a 24 24
Nordiazepam n/a n/a 21 0 21
Heroin n/a n/a 5 0* 5
TOTAL 521 634 913 1,051 3,119
*Morphine represents either the presence of Heroin or a metabolite of Heroin
Source: Kentucky Office of the Medical Examiner

Sourcebook of Criminal Justice Statistics in the Commonwealth
217
Table 11.3: Summary of Total Overdoses Autopsied by Kentucky Medical Examiner Offices, 2007-2010
CY 2007 CY 2008 CY 2009 CY 2010 TOTAL
Manner of Death Number Percent Number Percent Number Percent Number Percent Number Percent
Unintentional 422 84% 485 92% 490 92% 546 81% 1,943 87%
Suicides 54 11% 15 3% 17 3% 42 6% 128 6%
Undetermined/Insufficient Information 16 3% 14 3% 19 4% 58 9% 107 5%
Homicides 0 0% 1 0% 0 0% 0 0% 1 <1%
Complications of Chronic Use 12 2% 13 2% 4 1% 18 3% 47 2%
Pending 0 0% 0 0% 0 0% 10 1% 10 <1%
TOTAL 504 100% 528 100% 530 100% 674 100% 2,236 100%
Source: Kentucky Office of the Medical Examiner

Sourcebook of Criminal Justice Statistics in the Commonwealth
218
Figure 11.b: Map of Per Capita Drug Law Arrests by County, 2010

Sourcebook of Criminal Justice Statistics in the Commonwealth
219
Methamphetamine Related Offenses
In 2005, Kentucky adopted legislation that restricts the sale of products containing pseudoephedrine (PSE) and ephedrine, ingredients used to manufacture methamphetamine. In 2007, Kentucky became the second state to implement a real-time statewide electronic monitoring system capable of blocking the sale of PSE products to individuals in violation of purchasing more than 9 grams in 30 days (KRS 218A.1446). The program, MethCheck, provides 24/7 access to law enforcement officers conducting investigations on individuals suspected of violations of PSE restrictions. In 2009, the system blocked 22,844 attempts to violate PSE restrictions resulting in over 56,848 grams of PSE kept out of the hands of potential methamphetamine cooks. MethCheck is a partnership between the Office of the Inspector General (OIG) Professional Standards Branch, the Cabinet for Health and Family Services, and the Kentucky Office of Drug Control Policy. To illustrate the incidence of methamphetamine manufacturing, trafficking, and abuse in the Commonwealth, this section presents data from the Kentucky State Police, the Kentucky Administrative Office of the Courts, and the Kentucky Department of Corrections.
• Kentucky State Police reported a total of 4,389 methamphetamine related offenses in 2010, up from 2,577 in
2009. This is the highest number of offenses in the past five years and was primarily attributed to an increase in manufacturing offenses. This was an increase of 70.3% since 2009.
• During 2010, 1,078 law enforcement officers responded to clandestine methamphetamine lab incidents. This is
a 45.5% increase from the 741 incidents responded to in 2009.
• In 2010, there were 2,834 methamphetamine related cases in Circuit Court, 3,288 cases in District Court, and 20 cases in Juvenile Court.
• The total number of methamphetamine related charges disposed in Circuit Court rose from 2,104 in 2009 to
2,834 in 2010. In District Court, the number of charges rose from 3,919 in 2009 to 4,737 in 2010, an increase of 20.9%.
• In 2010, the average sentence imposed for methamphetamine related offenses was 11 years.
• The Kentucky Department of Corrections reported 636 new commitments for methamphetamine offenses in
2010, up from 515 in 2009.

Sourcebook of Criminal Justice Statistics in the Commonwealth
220
Figure 11.c: Clandestine Methamphetamine Labs Confiscated in Kentucky, 2001-2010
0
200
400
600
800
1,000
1,200
2010 2009 2008 2007 2006 2005 2004 2003 2002 2001
Year
Num
ber
of C
onfi
scat
ed L
abs
Source: Kentucky State Police
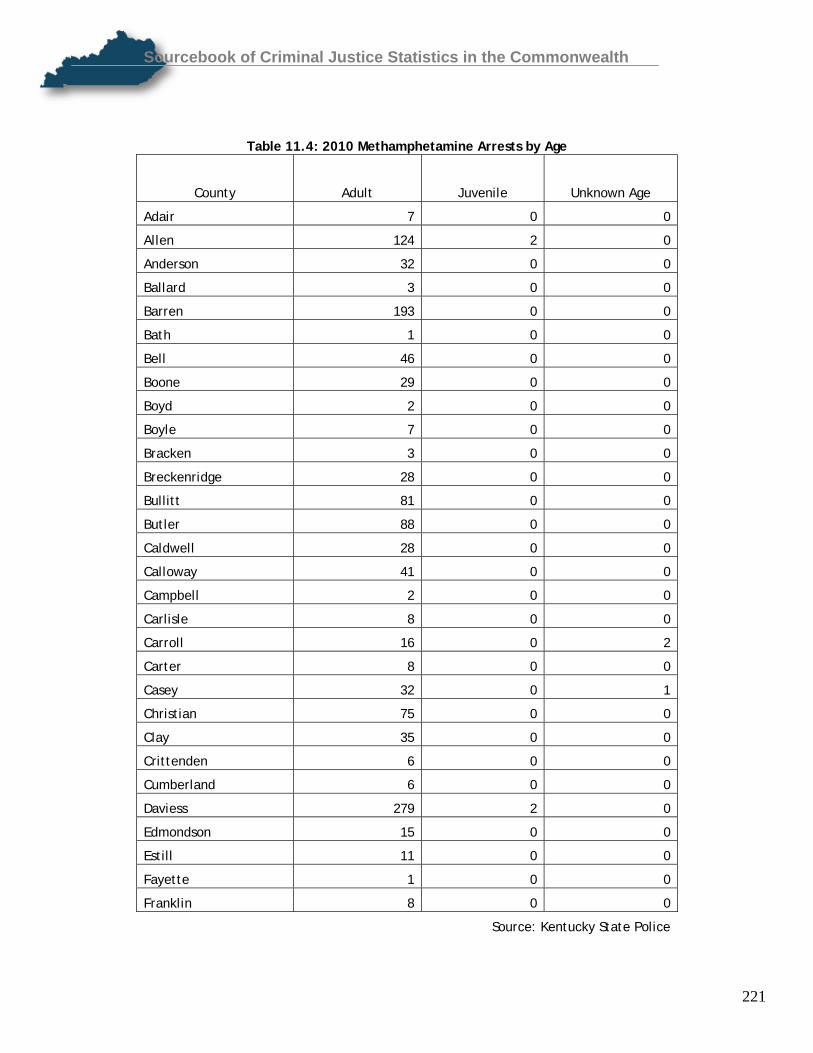
Sourcebook of Criminal Justice Statistics in the Commonwealth
221
Table 11.4: 2010 Methamphetamine Arrests by Age
County Adult Juvenile Unknown Age
Adair 7 0 0
Allen 124 2 0
Anderson 32 0 0
Ballard 3 0 0
Barren 193 0 0
Bath 1 0 0
Bell 46 0 0
Boone 29 0 0
Boyd 2 0 0
Boyle 7 0 0
Bracken 3 0 0
Breckenridge 28 0 0
Bullitt 81 0 0
Butler 88 0 0
Caldwell 28 0 0
Calloway 41 0 0
Campbell 2 0 0
Carlisle 8 0 0
Carroll 16 0 2
Carter 8 0 0
Casey 32 0 1
Christian 75 0 0
Clay 35 0 0
Crittenden 6 0 0
Cumberland 6 0 0
Daviess 279 2 0
Edmondson 15 0 0
Estill 11 0 0
Fayette 1 0 0
Franklin 8 0 0
Source: Kentucky State Police

Sourcebook of Criminal Justice Statistics in the Commonwealth
222
Table 11.4: 2010 Methamphetamine Arrests by Age, Continued
County Adult Juvenile Unknown Age
Fulton 15 0 0
Gallatin 71 0 0
Garrard 8 0 0
Grant 61 0 0
Graves 31 0 0
Grayson 45 0 0
Green 10 0 0
Greenup 1 0 0
Hancock 10 0 0
Hardin 212 0 2
Harlan 33 0 0
Hart 132 0 0
Henderson 77 0 0
Henry 2 0 0
Hickman 1 0 0
Hopkins 108 0 0
Jackson 19 0 0
Jefferson 158 0 0
Jessamine 2 0 0
Johnson 41 0 0
Kenton 6 0 0
Knott 6 0 0
Knox 66 0 0
Larue 138 0 2
Laurel 164 0 0
Lawrence 10 0 0
Lee 11 0 0
Leslie 10 0 0
Letcher 11 0 0
Lewis 2 0 0
Source: Kentucky State Police

Sourcebook of Criminal Justice Statistics in the Commonwealth
223
Table 11.4: 2010 Methamphetamine Arrests by Age, Continued
County Adult Juvenile Unknown Age
Lincoln 22 1 0
Livingston 3 0 0
Logan 92 0 0
Lyon 2 0 0
Madison 13 0 0
Marion 1 0 0
Marshall 56 0 0
Martin 6 0 0
Mason 1 0 0
McCracken 76 0 0
McCreary 48 0 0
McLean 41 0 0
Meade 20 0 0
Menifee 0 0 1
Mercer 15 0 0
Metcalfe 45 0 0
Monroe 24 0 0
Montgomery 2 0 0
Muhlenberg 75 0 0
Nelson 62 0 0
Ohio 74 0 0
Oldham 4 0 0
Owen 11 0 0
Owsley 19 0 0
Pendleton 29 0 0
Perry 2 0 0
Pulaski 82 0 0
Rockcastle 27 0 0
Rowan 6 0 0
Russell 9 0 0
Source: Kentucky State Police

Sourcebook of Criminal Justice Statistics in the Commonwealth
224
Table 11.4: 2010 Methamphetamine Arrests by Age, Continued
County Adult Juvenile Unknown Age
Shelby 1 0 0
Simpson 30 0 0
Spencer 13 0 0
Taylor 20 0 0
Todd 65 0 0
Trigg 1 0 0
Trimble 6 0 0
Union 26 0 0
Warren 407 2 0
Washington 4 0 0
Wayne 137 0 0
Webster 22 0 0
Whitley 113 1 0
Wolfe 1 0 0
STATEWIDE TOTAL 4,389 8 8
Source: Kentucky State Police

Sourcebook of Criminal Justice Statistics in the Commonwealth
225
Table 11.5: 2010 Methamphetamine Arrests by Sex
County Male Female Unknown Gender
Adair 4 3 0
Allen 96 30 0
Anderson 30 2 0
Ballard 2 1 0
Barren 142 51 0
Bath 1 0 0
Bell 33 13 0
Boone 18 11 0
Boyd 2 0 0
Boyle 5 2 0
Bracken 2 1 0
Breckenridge 22 6 0
Bullitt 55 26 0
Butler 68 20 0
Caldwell 20 8 0
Calloway 22 19 0
Campbell 1 1 0
Carlisle 4 4 0
Carroll 16 2 0
Carter 6 2 0
Casey 25 8 0
Christian 48 27 0
Clay 19 16 0
Crittenden 5 1 0
Cumberland 6 0 0
Daviess 196 85 0
Edmondson 14 1 0
Estill 5 6 0
Fayette 1 0 0
Franklin 6 2 0
Source: Kentucky State Police

Sourcebook of Criminal Justice Statistics in the Commonwealth
226
Table 11.5: 2010 Methamphetamine Arrests by Sex, Continued
County Male Female Unknown Gender
Fulton 8 7 0
Gallatin 49 22 0
Garrard 6 2 0
Grant 34 27 0
Graves 24 7 0
Grayson 37 7 1
Green 8 2 0
Greenup 1 0 0
Hancock 9 1 0
Hardin 139 75 0
Harlan 21 12 0
Hart 96 36 0
Henderson 46 31 0
Henry 2 0 0
Hickman 1 0 0
Hopkins 89 19 0
Jackson 11 8 0
Jefferson 101 57 0
Jessamine 2 0 0
Johnson 27 14 0
Kenton 6 0 0
Knott 4 2 0
Knox 56 10 0
Larue 105 35 0
Laurel 117 47 0
Lawrence 5 5 0
Lee 6 5 0
Leslie 8 2 0
Letcher 8 3 0
Lewis 2 0 0
Source: Kentucky State Police

Sourcebook of Criminal Justice Statistics in the Commonwealth
227
Table 11.5: 2010 Methamphetamine Arrests by Sex, Continued
County Male Female Unknown Gender
Lincoln 18 5 0
Livingston 2 1 0
Logan 71 21 0
Lyon 1 1 0
Madison 13 0 0
Marion 1 0 0
Marshall 42 14 0
Martin 6 0 0
Mason 1 0 0
McCracken 49 27 0
McCreary 36 12 0
McLean 33 8 0
Meade 17 3 0
Menifee 1 0 0
Mercer 11 4 0
Metcalfe 31 14 0
Monroe 20 4 0
Montgomery 0 2 0
Muhlenberg 52 23 0
Nelson 53 9 0
Ohio 52 22 0
Oldham 2 2 0
Owen 6 5 0
Owsley 15 4 0
Pendleton 24 5 0
Perry 1 1 0
Pulaski 53 29 0
Rockcastle 16 11 0
Rowan 5 1 0
Russell 8 1 0
Source: Kentucky State Police

Sourcebook of Criminal Justice Statistics in the Commonwealth
228
Table 11.5: 2010 Methamphetamine Arrests by Sex, Continued
County Male Female Unknown Gender
Shelby 1 0 0
Simpson 18 12 0
Spencer 11 2 0
Taylor 11 9 0
Todd 50 15 0
Trigg 1 0 0
Trimble 4 2 0
Union 18 8 0
Warren 291 118 0
Washington 3 1 0
Wayne 99 36 2
Webster 19 3 0
Whitley 73 41 0
Wolfe 1 0 0
STATEWIDE TOTAL 3,142 1,260 3
Source: Kentucky State Police

Sourcebook of Criminal Justice Statistics in the Commonwealth
229
Table 11.6: 2010 Methamphetamine Arrests by Race
County White African-
American
American Indian or Alaskan
Native Asian or Pacific
Islander Unknown
Adair 7 0 0 0 0
Allen 126 0 0 0 0
Anderson 32 0 0 0 0
Ballard 3 0 0 0 0
Barren 190 0 0 0 3
Bath 1 0 0 0 0
Bell 46 0 0 0 0
Boone 29 0 0 0 0
Boyd 2 0 0 0 0
Boyle 7 0 0 0 0
Bracken 3 0 0 0 0
Breckenridge 28 0 0 0 0
Bullitt 79 2 0 0 0
Butler 83 5 0 0 0
Caldwell 28 0 0 0 0
Calloway 41 0 0 0 0
Campbell 2 0 0 0 0
Carlisle 8 0 0 0 0
Carroll 16 0 0 0 2
Carter 8 0 0 0 0
Casey 33 0 0 0 0
Christian 75 0 0 0 0
Clay 35 0 0 0 0
Crittenden 6 0 0 0 0
Cumberland 6 0 0 0 0
Daviess 276 5 0 0 0
Edmondson 15 0 0 0 0
Estill 11 0 0 0 0
Fayette 1 0 0 0 0
Franklin 8 0 0 0 0
Source: Kentucky State Police

Sourcebook of Criminal Justice Statistics in the Commonwealth
230
Table 11.6: 2010 Methamphetamine Arrests by Race, Continued
County White African-
American
American Indian or Alaskan
Native Asian or Pacific
Islander Unknown
Fulton 15 0 0 0 0
Gallatin 70 1 0 0 0
Garrard 8 0 0 0 0
Grant 60 1 0 0 0
Graves 30 1 0 0 0
Grayson 44 0 0 0 1
Green 9 1 0 0 0
Greenup 1 0 0 0 0
Hancock 10 0 0 0 0
Hardin 201 9 0 4 0
Harlan 33 0 0 0 0
Hart 131 1 0 0 0
Henderson 76 1 0 0 0
Henry 2 0 0 0 0
Hickman 1 0 0 0 0
Hopkins 106 2 0 0 0
Jackson 19 0 0 0 0
Jefferson 149 8 0 0 1
Jessamine 2 0 0 0 0
Johnson 41 0 0 0 0
Kenton 6 0 0 0 0
Knott 6 0 0 0 0
Knox 66 0 0 0 0
Larue 140 0 0 0 0
Laurel 164 0 0 0 0
Lawrence 10 0 0 0 0
Lee 11 0 0 0 0
Leslie 10 0 0 0 0
Letcher 11 0 0 0 0
Lewis 2 0 0 0 0
Source: Kentucky State Police

Sourcebook of Criminal Justice Statistics in the Commonwealth
231
Table 11.6: 2010 Methamphetamine Arrests by Race, Continued
County White African-
American
American Indian or Alaskan
Native Asian or Pacific
Islander Unknown
Lincoln 23 0 0 0 0
Livingston 3 0 0 0 0
Logan 92 0 0 0 0
Lyon 2 0 0 0 0
Madison 13 0 0 0 0
Marion 1 0 0 0 0
Marshall 56 0 0 0 0
Martin 6 0 0 0 0
Mason 1 0 0 0 0
McCracken 73 2 1 0 0
McCreary 47 1 0 0 0
McLean 41 0 0 0 0
Meade 20 0 0 0 0
Menifee 1 0 0 0 0
Mercer 15 0 0 0 0
Metcalfe 45 0 0 0 0
Monroe 24 0 0 0 0
Montgomery 2 0 0 0 0
Muhlenberg 71 4 0 0 0
Nelson 62 0 0 0 0
Ohio 74 0 0 0 0
Oldham 4 0 0 0 0
Owen 11 0 0 0 0
Owsley 19 0 0 0 0
Pendleton 29 0 0 0 0
Perry 2 0 0 0 0
Pulaski 80 2 0 0 0
Rockcastle 27 0 0 0 0
Rowan 6 0 0 0 0
Russell 9 0 0 0 0
Source: Kentucky State Police

Sourcebook of Criminal Justice Statistics in the Commonwealth
232
Table 11.6: 2010 Methamphetamine Arrests by Race, Continued
County White African-
American
American Indian or Alaskan
Native Asian or Pacific
Islander Unknown
Shelby 1 0 0 0 0
Simpson 30 0 0 0 0
Spencer 13 0 0 0 0
Taylor 20 0 0 0 0
Todd 65 0 0 0 0
Trigg 1 0 0 0 0
Trimble 6 0 0 0 0
Union 24 2 0 0 0
Warren 396 13 0 0 0
Washington 4 0 0 0 0
Wayne 134 1 0 0 2
Webster 22 0 0 0 0
Whitley 114 0 0 0 0
Wolfe 1 0 0 0 0 STATEWIDE TOTAL 4,329 62 1 4 9
Source: Kentucky State Police

Sourcebook of Criminal Justice Statistics in the Commonwealth
233
Table 11.7: Disposition of Methamphetamine Offenses within Circuit Court, 2006-2010
CY 2006 CY 2007 CY 2008 CY 2009 CY 2010
Charges- Acquitted/Dismissed/Not Guilty 786 603 707 836 1,289
Cases- Acquitted/Dismissed/Not Guilty 584 461 508 580 834
Charges- Amended Dispositions 710 484 529 726 859
Cases- Amended Dispositions 633 440 469 638 796
Charges- Conviction 1,465 1,301 1,506 1,821 2,450
Cases- Conviction 1,172 1,070 1,179 1,405 1,870
Charges- Diversion/Deferred 58 86 202 237 295
Cases- Diversion/Deferred 31 74 145 178 255
Charges- Other Dispositions 30 12 22 15 44
Cases- Other Dispositions 7 11 15 12 30
Charges- Temporary Dispositions 8 10 0 10 23
Cases- Temporary Dispositions 7 9 0 7 17
CHARGES- TOTAL 3,057 2,496 2,966 3,645 4,960
CASES- TOTAL 1,838 1,646 1,753 2,104 2,834
Source: Administrative Office of the Courts This data is provided by the KYCourts/CourtNet database. Counts include attempt, solicitation, conspiracy, facilitation, complicity, and enhancement. The distinct count on cases counts the case only once. A case may consist of one or multiple charges. Charges consist of all original or amended charges within a case. An explanation of the limitations of this data is provided in Appendix D.

Sourcebook of Criminal Justice Statistics in the Commonwealth
234
Table 11.8: Disposition of Methamphetamine Offenses within District Court, 2006-2010
CY 2006 CY 2007 CY 2008 CY 2009 CY 2010
Charges- Acquitted/Dismissed/Not Guilty
429 349 513 673 840
Cases- Acquitted/Dismissed/Not Guilty
356 298 390 550 665
Charges- Amended Dispositions
116 145 190 350 401
Cases- Amended Dispositions
111 142 183 336 386
Charges- Conviction 15 26 49 115 141
Cases- Conviction
15 26 49 114 139
Charges- Diversion/Deferred
0 0 0 0 2
Cases- Diversion/Deferred
0 0 0 0 2
Charges- Other Dispositions
1,307 1,425 1,786 2,777 3,348
Cases- Other Dispositions 1,049 1,142 1,299 2,016 2,484
Charges- Temporary Dispositions
2 1 2 4 5
Cases- Temporary Dispositions 2 1 2 3 5
CHARGES- TOTAL 1,869 1,946 2,540 3,919 4,737
CASES- TOTAL 1,455 1,514 1,746 2,687 3,288
Source: Administrative Office of the Courts
This data is provided by the KYCourts/CourtNet database. Counts include attempt, solicitation, conspiracy, facilitation, complicity, and enhancement. The distinct count on cases counts the case only once. A case may consist of one or multiple charges. Charges consist of all original or amended charges within a case. An explanation of the limitations of this data is provided in Appendix D.

Sourcebook of Criminal Justice Statistics in the Commonwealth
235
Table 11.9: Disposition of Methamphetamine Offenses within Juvenile Court, 2006-2010
CY 2006 CY 2007 CY 2008 CY 2009 CY 2010
Charges- Acquitted/Dismissed/Not Guilty 1 5 11 10 4
Cases- Acquitted/Dismissed/Not Guilty 1 5 9 7 4
Charges- Amended Dispositions 1 2 4 3 8
Cases- Amended Dispositions 1 2 4 3 8
Charges- Conviction 4 7 9 8 8
Cases- Conviction 4 7 8 8 7
Charges- Diversion/Deferred 0 0 0 0 0
Cases- Diversion/Deferred 0 0 0 0 0
Charges- Other Dispositions 0 3 3 4 3
Cases- Other Dispositions 0 3 2 3 3
Charges- Temporary Dispositions 0 0 0 0 0
Cases- Temporary Dispositions 0 0 0 0 0
CHARGES- TOTAL 6 17 27 25 23
CASES- TOTAL 5 16 20 18 20
Source: Administrative Office of the Courts This data is provided by the KYCourts/CourtNet database. Counts include attempt, solicitation, conspiracy, facilitation, complicity, and enhancement. The distinct count on cases counts the case only once. A case may consist of one or multiple charges. Charges consist of all original or amended charges within a case. An explanation of the limitations of this data is provided in Appendix D.

Sourcebook of Criminal Justice Statistics in the Commonwealth
236
Table 11.10: Methamphetamine Related Commitments and Releases, 2005-2010
2005 2006 2007 2008 2009 2010 New
Commitment 382 298 329 348 515 636
Parole 305 395 337 377 425 552
Serve Out 83 84 77 106 122 123
Shock Probation
73 79 87 96 98 112
Source: Kentucky Department of Corrections
Table 11.11: Average Length of Sentence in Years: Methamphetamine and Prescription Drugs, 2005-2010
Year Meth Prescription Drugs
2005 9 6
2006 9 12
2007 9 10
2008 9 6
2009 10 6
2010 11 7
Source: Kentucky Department of Corrections

Sourcebook of Criminal Justice Statistics in the Commonwealth
237
Table 11.12: New Prescription Drug and Methamphetamine Related Commitments CY 2010 CY 2009 CY 2008 CY 2007 CY 2006
Prescription Drug Related Offenses 65 79 68 72 50
Methamphetamine Related Offenses 636 515 348 329 298
Source: Kentucky Department of Corrections
Table 11.13: Juvenile Complaints with Methamphetamine Offenses, 2006-2010
CY 2006 CY 2007 CY 2008 CY 2009 CY 2010
Number of Juvenile Methamphetamine Offenses 6 21 18 26 22
Number of Juvenile Methamphetamine Complaints 6 19 15 22 22
Number of Juveniles 6 19 14 21 21
Source: Administrative Office of the Courts
Table 11.14: Juvenile Complaints with Prescription Drug Offenses, 2006-2010
CY 2006 CY 2007 CY 2008 CY 2009 CY 2010
Number of Juvenile Prescription Drug Offenses 262 230 213 174 158
Number of Juvenile Prescription Drug Complaints 249 208 195 170 155
Number of Juveniles 243 207 194 169 153
Source: Administrative Office of the Courts

Sourcebook of Criminal Justice Statistics in the Commonwealth
238
Prescription Drug Related Offenses Misuse, abuse, and illegal sale of prescription drugs represent a significant threat to public health and safety in the Commonwealth of Kentucky. Illegal prescription drug activity has reached epidemic proportions, with more and more incidents of “doctor shopping” being uncovered and the street values of “legal drugs” reaching all-time highs. The Kentucky All Schedule Prescription Electronic Reporting (KASPER) system is Kentucky’s Prescription Drug Monitoring Program (PDMP). PDMP’s vary in their characteristics, but they all have a common goal of reducing prescription drug abuse and diversion. KASPER is one of the most comprehensive PDMP’s in the country. The system catalogs schedule II-V controlled substance prescriptions dispensed within the state(Hydrocodone, Oxycodone, Methadone, Alprazolam, Tramadol, Buprenorphrine, and Diazepam), and provides a tool for practitioners, pharmacists, law enforcement, and regulatory agencies to improve patient safety and fight the abuse and diversion of controlled substance prescription medications. KASPER is housed in the Cabinet for Health and Family Services, Office of the Inspector General, with the maintenance and enhancements to the system provided by the Cabinet’s Office of Administrative and Technology Services. Kentucky statutes require dispensers of controlled substances to report the prescriptions dispensed once every seven days. The data are then available to authorized users of the system, who may be prescribers for medical treatment of a patient, dispensers for pharmaceutical treatment of a patient, law enforcement officers for an active drug related investigation, licensing boards for a licensee, the Kentucky Medicaid program for a Medicaid member or provider, a grand jury (by subpoena), or a judge or probation or parole office administering a drug diversion or probation program. A KASPER report shows the controlled substance prescriptions a patient received for a specified time period, as well as the practitioner who prescribed them and the dispenser who dispensed them. Kentucky Revised Statute 218A.240 provides that the Cabinet shall use the data for investigations, research, statistical analysis and educational purposes, and shall proactively identify trends in controlled substance usage and other potential problem areas. This section includes data on prescription drug activity in the Commonwealth as collected by the Kentucky State Police, Kentucky Administrative Office of the Courts, Kentucky Department of Corrections, Kentucky Department of Juvenile Justice, and KASPER.
• In 2010, there were 1,378 prescription drug related cases in Circuit Court, 5,410 in District Court, and 141 cases in Juvenile Court.
• There were 65 new prescription drug related commitments to the Department of Corrections in 2010. The
average prison sentence for prescription drug related offenses in 2010 was 7 years.
• In 2010, KASPER records demonstrate that Kentucky’s population received 145 doses per capita of controlled substance prescriptions.
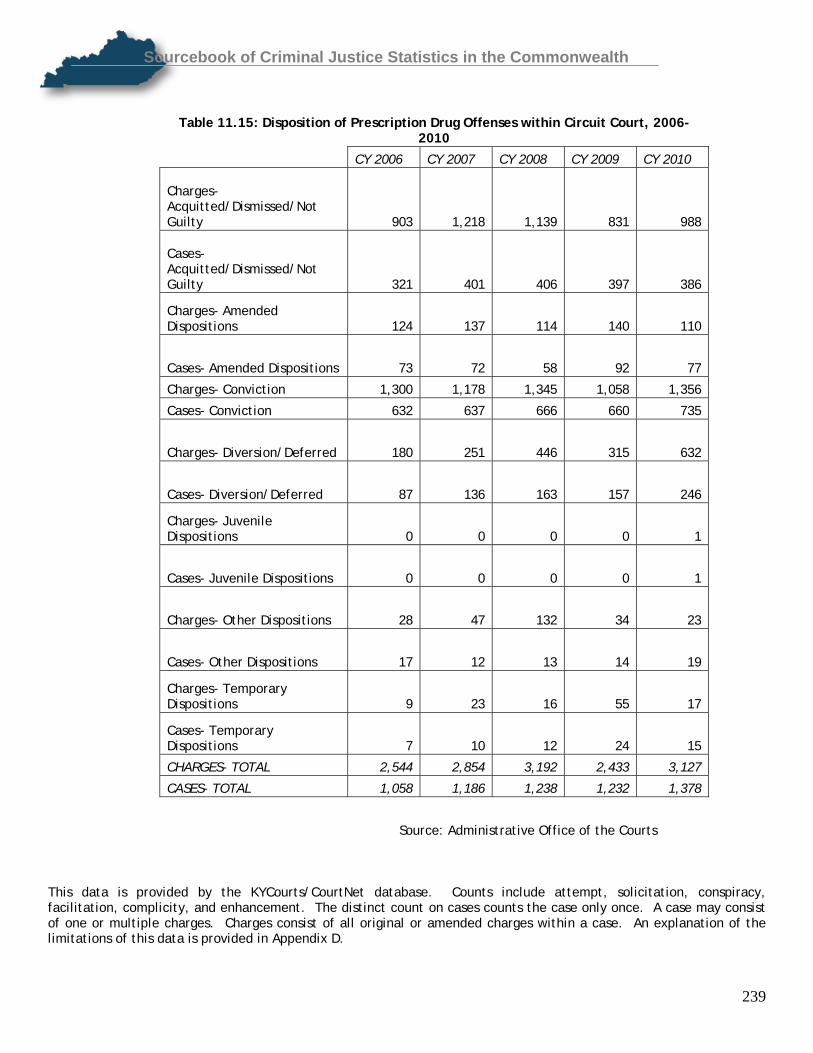
Sourcebook of Criminal Justice Statistics in the Commonwealth
239
Table 11.15: Disposition of Prescription Drug Offenses within Circuit Court, 2006-2010
CY 2006 CY 2007 CY 2008 CY 2009 CY 2010
Charges- Acquitted/Dismissed/Not Guilty 903 1,218 1,139 831 988
Cases- Acquitted/Dismissed/Not Guilty 321 401 406 397 386
Charges- Amended Dispositions 124 137 114 140 110
Cases- Amended Dispositions 73 72 58 92 77
Charges- Conviction 1,300 1,178 1,345 1,058 1,356
Cases- Conviction 632 637 666 660 735
Charges- Diversion/Deferred 180 251 446 315 632
Cases- Diversion/Deferred 87 136 163 157 246
Charges- Juvenile Dispositions 0 0 0 0 1
Cases- Juvenile Dispositions 0 0 0 0 1
Charges- Other Dispositions 28 47 132 34 23
Cases- Other Dispositions 17 12 13 14 19
Charges- Temporary Dispositions 9 23 16 55 17
Cases- Temporary Dispositions 7 10 12 24 15
CHARGES- TOTAL 2,544 2,854 3,192 2,433 3,127
CASES- TOTAL 1,058 1,186 1,238 1,232 1,378
Source: Administrative Office of the Courts This data is provided by the KYCourts/CourtNet database. Counts include attempt, solicitation, conspiracy, facilitation, complicity, and enhancement. The distinct count on cases counts the case only once. A case may consist of one or multiple charges. Charges consist of all original or amended charges within a case. An explanation of the limitations of this data is provided in Appendix D.
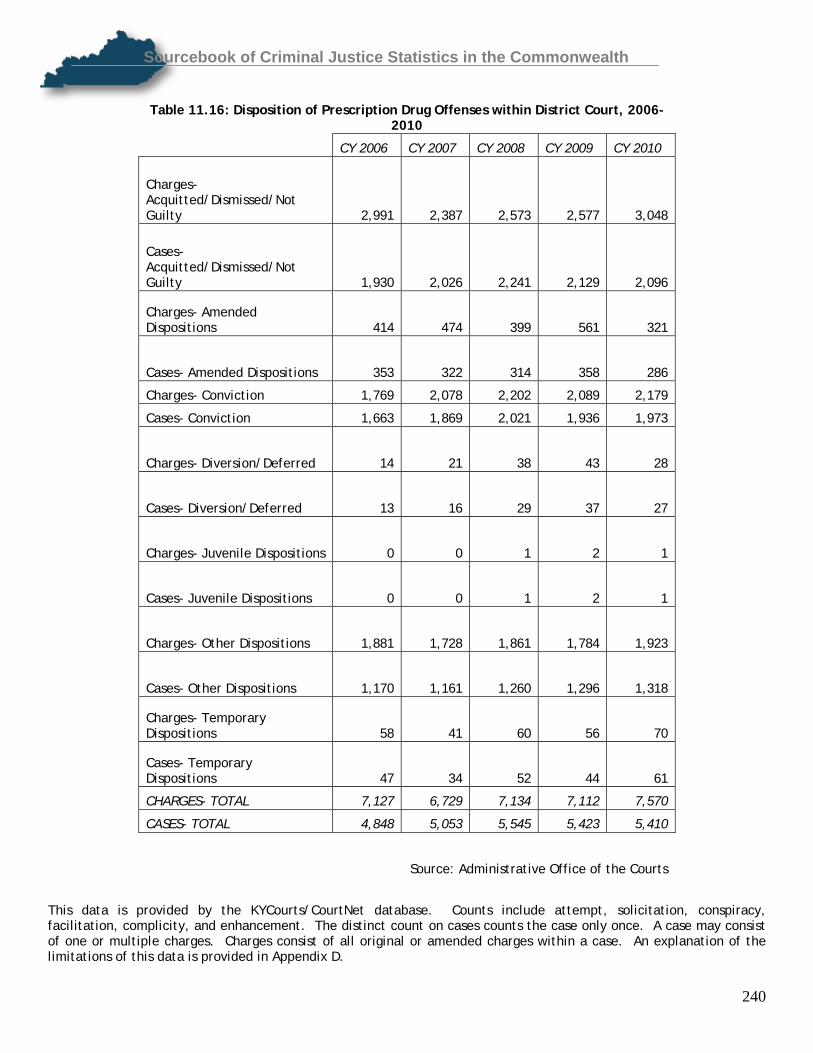
Sourcebook of Criminal Justice Statistics in the Commonwealth
240
Table 11.16: Disposition of Prescription Drug Offenses within District Court, 2006-
2010
CY 2006 CY 2007 CY 2008 CY 2009 CY 2010
Charges- Acquitted/Dismissed/Not Guilty
2,991 2,387 2,573 2,577 3,048
Cases- Acquitted/Dismissed/Not Guilty
1,930 2,026 2,241 2,129 2,096
Charges- Amended Dispositions
414 474 399 561 321
Cases- Amended Dispositions
353 322 314 358 286
Charges- Conviction
1,769 2,078 2,202 2,089 2,179
Cases- Conviction 1,663 1,869 2,021 1,936 1,973
Charges- Diversion/Deferred
14 21 38 43 28
Cases- Diversion/Deferred
13 16 29 37 27
Charges- Juvenile Dispositions
0 0 1 2 1
Cases- Juvenile Dispositions
0 0 1 2 1
Charges- Other Dispositions 1,881 1,728 1,861 1,784 1,923
Cases- Other Dispositions
1,170 1,161 1,260 1,296 1,318
Charges- Temporary Dispositions
58 41 60 56 70
Cases- Temporary Dispositions 47 34 52 44 61
CHARGES- TOTAL 7,127 6,729 7,134 7,112 7,570
CASES- TOTAL 4,848 5,053 5,545 5,423 5,410
Source: Administrative Office of the Courts
This data is provided by the KYCourts/CourtNet database. Counts include attempt, solicitation, conspiracy, facilitation, complicity, and enhancement. The distinct count on cases counts the case only once. A case may consist of one or multiple charges. Charges consist of all original or amended charges within a case. An explanation of the limitations of this data is provided in Appendix D.

Sourcebook of Criminal Justice Statistics in the Commonwealth
241
Table 11.17: Disposition of Prescription Drug Offenses within Juvenile Court, 2006-2010
CY 2006 CY 2007 CY 2008 CY 2009 CY 2010
Charges- Acquitted/Dismissed/Not Guilty 53 61 60 46 43
Cases- Acquitted/Dismissed/Not Guilty 52 57 54 40 39
Charges- Amended Dispositions 19 20 7 13 16
Cases- Amended Dispositions 18 20 5 13 16
Charges- Conviction 74 65 71 50 48
Cases- Conviction 68 60 60 49 47
Charges- Diversion/Deferred 5 3 3 1 2
Cases- Diversion/Deferred 4 2 3 1 2
Charges- Juvenile Dispositions 32 19 19 8 21
Cases- Juvenile Dispositions 29 18 19 7 21
Charges- Other Dispositions 30 41 24 13 21
Cases- Other Dispositions 28 38 22 13 20
Charges- Temporary Dispositions 1 0 2 1 1
Cases- Temporary Dispositions 1 0 2 1 1
CHARGES- TOTAL 214 209 186 132 152
CASES- TOTAL 193 177 159 118 141
Source: Administrative Office of the Courts This data is provided by the KYCourts/CourtNet database. Counts include attempt, solicitation, conspiracy, facilitation, complicity, and enhancement. The distinct count on cases counts the case only once. A case may consist of one or multiple charges. Charges consist of all original or amended charges within a case. An explanation of the limitations of this data is provided in Appendix D.

Sourcebook of Criminal Justice Statistics in the Commonwealth
242
Table 11.18: All 2010 Controlled Substance Prescriptions Dispensed By County
County Number of
Prescriptions Total Units Dispensed
ADAIR 42,065 2,302,185
ALLEN 67,353 3,622,860
ANDERSON 48,770 2,985,029
BALLARD 19,812 1,191,204
BARREN 98,664 5,393,916
BATH 25,607 1,597,125
BELL 115,132 6,950,817
BOONE 234,413 14,954,312
BOURBON 45,008 2,569,320
BOYD 85,201 5,548,914
BOYLE 73,917 4,489,411
BRACKEN 19,226 1,222,797
BREATHITT 59,514 3,486,031
BRECKINRIDGE 43,494 2,837,343
BULLITT 147,781 9,842,936
BUTLER 35,697 2,122,439
CALDWELL 37,021 2,586,685
CALLOWAY 78,929 4,878,166
CAMPBELL 187,678 12,184,980
CARLISLE 15,153 941,557
CARROLL 31,630 1,878,917
CARTER 64,490 4,175,566
CASEY 40,590 2,460,961
CHRISTIAN 114,965 6,861,296
CLARK 93,094 6,138,597
CLAY 91,824 5,567,389
CLINTON 42,732 2,944,390
CRITTENDEN 27,709 2,106,689
CUMBERLAND 26,871 1,524,349
DAVIESS 148,968 9,650,142
Source: KASPER

Sourcebook of Criminal Justice Statistics in the Commonwealth
243
Table 11.18: All 2010 Controlled Substance Prescriptions Dispensed
By County, Continued
County Number of
Prescriptions Total Units Dispensed
EDMONSON 25,572 1,478,814
ELLIOTT 11,992 787,738
ESTILL 45,324 2,873,097
FAYETTE 497,278 28,149,642
FLEMING 28,836 1,846,000
FLOYD 184,982 11,829,640
FRANKLIN 114,855 6,472,106
FULTON 14,012 908,699
GALLATIN 20,157 1,417,055
GARRARD 37,782 2,587,570
GRANT 53,743 3,613,642
GRAVES 99,570 6,350,768
GRAYSON 80,601 5,082,283
GREEN 24,199 1,488,290
GREENUP 124,286 8,686,680
HANCOCK 12,368 853,434
HARDIN 174,926 10,281,537
HARLAN 100,752 6,192,087
HARRISON 45,037 2,547,481
HART 33,523 2,055,542
HENDERSON 134,796 8,004,685
HENRY 42,820 2,551,767
HICKMAN 6,771 388,812
HOPKINS 134,293 9,275,543
JACKSON 35,356 2,131,565
JEFFERSON 1,695,116 102,639,616
JESSAMINE 99,282 5,787,979
JOHNSON 102,781 6,341,053
KENTON 292,142 18,630,794
KNOTT 59,155 3,770,305
Source: KASPER

Sourcebook of Criminal Justice Statistics in the Commonwealth
244
Table 11.18: All 2010 Controlled Substance Prescriptions Dispensed By County, Continued
County Number of
Prescriptions Total Units Dispensed
KNOX 101,812 6,010,726
LARUE 30,073 1,889,582
LAUREL 146,454 8,503,949
LAWRENCE 49,780 3,007,171
LEE 27,456 1,668,835
LESLIE 37,293 2,407,888
LETCHER 85,287 5,374,532
LEWIS 29,599 1,910,599
LINCOLN 63,701 4,090,253
LIVINGSTON 35,259 2,497,443
LOGAN 45,744 2,854,654
LYON 22,536 1,638,012
MADISON 168,055 9,951,129
MAGOFFIN 49,926 2,685,664
MARION 48,036 2,678,492
MARSHALL 53,121 3,433,612
MARTIN 50,835 2,882,476
MASON 32,131 1,901,645
MCCRACKEN 205,902 12,354,098
MCCREARY 41,946 2,603,122
MCLEAN 22,074 1,391,536
MEADE 38,097 2,415,154
MENIFEE 12,024 715,552
MERCER 52,523 3,242,104
METCALFE 25,827 1,432,203
MONROE 38,573 2,283,002
MONTGOMERY 53,891 3,330,164
MORGAN 35,078 1,920,896
MUHLENBERG 86,979 6,004,461
Source: KASPER

Sourcebook of Criminal Justice Statistics in the Commonwealth
245
Table 11.18: All 2010 Controlled Substance Prescriptions Dispensed By County, Continued
County Number of
Prescriptions Total Units Dispensed
NELSON 110,670 6,903,197
NICHOLAS 17,327 1,080,105
OHIO 60,505 3,954,111
OLDHAM 101,870 6,226,491
OWEN 18,553 1,207,422
OWSLEY 22,241 1,349,804
PENDLETON 29,688 1,896,319
PERRY 114,431 7,566,514
PIKE 161,983 10,259,916
POWELL 40,906 2,724,681
PULASKI 173,637 10,527,237
ROBERTSON 3,776 242,491
ROCKCASTLE 48,773 3,222,544
ROWAN 48,488 2,960,408
RUSSELL 18,079 998,708
SCOTT 96,220 5,469,206
SHELBY 91,019 5,335,798
SIMPSON 43,819 2,730,968
SPENCER 39,927 2,711,483
TAYLOR 67,368 4,186,003
TODD 19,180 1,235,251
TRIGG 34,852 2,270,197
TRIMBLE 13,533 870,550
UNION 51,677 3,263,329
UNKNOWN 1,526 87,124
WARREN 241,340 13,280,318
WASHINGTON 24,581 1,461,783
WAYNE 36,646 2,032,004
WEBSTER 41,830 2,893,610
WHITLEY 150,823 8,908,808
WOLFE 27,863 1,691,288
WOODFORD 45,732 2,756,283
TOTAL 10,184,490 625,423,452
Kentucky 2010 Population 4,314,113
Doses per capita 145
Source: KASPER

Sourcebook of Criminal Justice Statistics in the Commonwealth
246
Table 11.19: 2010 Hydrocodone Prescriptions Dispensed by County
County Number of
Prescriptions Total Units Dispensed
ADAIR 13,252 741,275
ALLEN 27,971 1,373,519
ANDERSON 16,615 1,013,742
BALLARD 6,814 445,087
BARREN 36,452 1,862,668
BATH 7,338 422,457
BELL 43,600 2,657,911
BOONE 51,783 2,984,961
BOURBON 13,127 637,056
BOYD 19,907 1,204,846
BOYLE 22,311 1,394,775
BRACKEN 4,637 268,686
BREATHITT 22,218 1,389,510
BRECKINRIDGE 13,531 863,677
BULLITT 48,386 3,157,751
BUTLER 15,049 920,485
CALDWELL 12,032 917,718
CALLOWAY 24,165 1,565,570
CAMPBELL 46,950 2,770,611
CARLISLE 4,889 311,905
CARROLL 9,461 535,832
CARTER 14,296 837,157
CASEY 12,894 720,083
CHRISTIAN 36,290 2,496,638
CLARK 27,772 1,808,220
CLAY 35,381 2,134,925
CLINTON 14,562 962,515
CRITTENDEN 10,305 913,374
CUMBERLAND 9,193 503,226
DAVIESS 40,422 2,822,635
Source: KASPER

Sourcebook of Criminal Justice Statistics in the Commonwealth
247
Table 11.19: 2010 Hydrocodone Prescriptions Dispensed by County, Continued
County Number of
Prescriptions Total Units Dispensed
EDMONSON 10,173 547,783
ELLIOTT 3,070 189,266
ESTILL 14,727 884,263
FAYETTE 130,196 6,894,917
FLEMING 7,655 477,391
FLOYD 68,048 4,706,782
FRANKLIN 35,088 1,992,454
FULTON 5,260 374,174
GALLATIN 5,196 313,808
GARRARD 11,168 745,162
GRANT 13,722 845,629
GRAVES 30,728 2,149,587
GRAYSON 26,242 1,672,272
GREEN 6,322 372,559
GREENUP 27,922 1,819,147
HANCOCK 3,789 284,895
HARDIN 48,284 2,794,058
HARLAN 35,765 2,290,908
HARRISON 11,544 590,118
HART 10,885 624,181
HENDERSON 38,314 2,242,450
HENRY 14,614 798,371
HICKMAN 2,214 129,745
HOPKINS 45,870 3,529,934
JACKSON 12,425 770,788
JEFFERSON 559,565 34,048,460
JESSAMINE 29,299 1,601,798
JOHNSON 34,970 2,204,491
KENTON 64,145 3,695,678
KNOTT 21,179 1,471,269
Source: KASPER

Sourcebook of Criminal Justice Statistics in the Commonwealth
248
Table 11.19: 2010 Hydrocodone Prescriptions Dispensed by County, Continued
County Number of
Prescriptions Total Units Dispensed
KNOX 38,009 2,325,607
LARUE 8,341 536,987
LAUREL 52,850 3,080,516
LAWRENCE 15,336 981,260
LEE 10,685 637,946
LESLIE 13,667 914,774
LETCHER 30,602 2,205,937
LEWIS 8,065 496,777
LINCOLN 20,343 1,254,349
LIVINGSTON 12,748 1,049,179
LOGAN 16,351 987,111
LYON 6,905 514,666
MADISON 48,642 2,855,497
MAGOFFIN 19,003 1,028,360
MARION 16,515 892,646
MARSHALL 15,685 1,103,538
MARTIN 14,680 986,392
MASON 7,313 412,102
MCCRACKEN 64,153 4,323,017
MCCREARY 13,601 880,363
MCLEAN 6,607 446,359
MEADE 13,071 816,884
MENIFEE 3,760 215,575
MERCER 15,950 972,995
METCALFE 9,842 497,269
MONROE 14,134 780,794
MONTGOMERY 15,324 891,105
MORGAN 11,128 568,455
MUHLENBERG 32,217 2,467,213
NELSON 35,101 2,101,800
Source: KASPER

Sourcebook of Criminal Justice Statistics in the Commonwealth
249
Table 11.19: 2010 Hydrocodone Prescriptions Dispensed by County, Continued
County Number of
Prescriptions Total Units Dispensed
NICHOLAS 4,842 304,193
OHIO 20,301 1,396,779
OLDHAM 26,896 1,490,252
OWEN 5,339 332,323
OWSLEY 8,294 523,465
PENDLETON 7,293 426,608
PERRY 40,473 2,879,809
PIKE 60,380 4,138,534
POWELL 13,781 936,387
PULASKI 49,709 3,065,622
ROBERTSON 1,008 61,180
ROCKCASTLE 16,761 1,174,231
ROWAN 12,245 646,687
RUSSELL 5,928 329,430
SCOTT 28,332 1,508,930
SHELBY 29,842 1,631,015
SIMPSON 15,823 894,703
SPENCER 13,543 913,305
TAYLOR 19,875 1,188,095
TODD 6,455 453,140
TRIGG 11,042 780,617
TRIMBLE 4,592 273,871
UNION 16,850 1,162,017
UNKNOWN 534 31,330
WARREN 84,732 4,420,833
WASHINGTON 7,070 395,008
WAYNE 13,305 700,811
WEBSTER 13,568 1,057,675
WHITLEY 50,046 2,909,174
WOLFE 10,738 650,830
WOODFORD 13,198 781,452
Source: KASPER

Sourcebook of Criminal Justice Statistics in the Commonwealth
250
Table 11.20: 2010 Oxycodone Prescriptions Dispensed by
County
County Number of
Prescriptions Total Units Dispensed
ADAIR 1,568 111,473
ALLEN 2,252 193,259
ANDERSON 4,192 269,506
BALLARD 1,300 112,068
BARREN 3,930 258,971
BATH 2,652 212,118
BELL 5,166 370,286
BOONE 37,668 2,934,756
BOURBON 4,995 308,325
BOYD 13,166 1,092,013
BOYLE 4,808 346,160
BRACKEN 2,712 189,471
BREATHITT 3,149 243,002
BRECKINRIDGE 2,626 198,396
BULLITT 13,293 1,032,181
BUTLER 1,705 124,193
CALDWELL 2,227 183,312
CALLOWAY 4,270 301,663
CAMPBELL 30,287 2,386,940
CARLISLE 1,007 82,012
CARROLL 3,884 280,165
CARTER 11,260 991,241
CASEY 1,889 122,207
CHRISTIAN 4,930 341,724
CLARK 11,464 878,854
CLAY 7,876 623,130
CLINTON 5,078 396,974
CRITTENDEN 1,781 159,699
CUMBERLAND 1,097 71,151
DAVIESS 8,370 653,262
Source: KASPER

Sourcebook of Criminal Justice Statistics in the Commonwealth
251
Table 11.20: 2010 Oxycodone Prescriptions Dispensed by County, Continued
County Number of
Prescriptions Total Units Dispensed
EDMONSON 1,206 87,253
ELLIOTT 1,834 168,006
ESTILL 5,491 423,465
FAYETTE 48,544 3,088,990
FLEMING 3,029 215,197
FLOYD 12,972 1,061,396
FRANKLIN 9,618 575,706
FULTON 614 45,239
GALLATIN 3,973 358,768
GARRARD 4,091 333,821
GRANT 11,037 873,470
GRAVES 5,625 396,036
GRAYSON 4,529 301,968
GREEN 931 64,567
GREENUP 20,137 1,715,722
HANCOCK 769 61,182
HARDIN 15,164 1,102,511
HARLAN 7,941 585,378
HARRISON 4,762 313,153
HART 2,061 155,753
HENDERSON 6,991 484,889
HENRY 3,416 221,257
HICKMAN 271 18,340
HOPKINS 8,875 690,344
JACKSON 3,355 239,727
JEFFERSON 128,653 9,457,407
JESSAMINE 11,069 731,995
JOHNSON 8,308 701,008
KENTON 49,523 3,876,186
KNOTT 5,096 402,551
Source: KASPER

Sourcebook of Criminal Justice Statistics in the Commonwealth
252
Table 11.20: 2010 Oxycodone Prescriptions Dispensed by County, Continued
County Number of
Prescriptions Total Units Dispensed
KNOX 6,773 499,467
LARUE 2,184 175,112
LAUREL 10,315 765,733
LAWRENCE 4,913 380,602
LEE 1,842 142,763
LESLIE 3,284 283,060
LETCHER 5,221 405,718
LEWIS 4,171 356,591
LINCOLN 5,352 412,035
LIVINGSTON 2,354 199,313
LOGAN 2,445 174,341
LYON 1,329 115,510
MADISON 19,095 1,333,360
MAGOFFIN 3,269 246,122
MARION 3,335 214,103
MARSHALL 4,096 327,685
MARTIN 3,448 257,765
MASON 3,750 209,982
MCCRACKEN 12,832 975,105
MCCREARY 2,743 206,900
MCLEAN 1,160 79,234
MEADE 3,029 217,010
MENIFEE 1,245 95,107
MERCER 4,776 340,236
METCALFE 1,013 78,123
MONROE 1,260 90,388
MONTGOMERY 6,372 513,142
MORGAN 2,630 204,883
MUHLENBERG 4,484 360,869
NELSON 9,415 641,014
Source: KASPER

Sourcebook of Criminal Justice Statistics in the Commonwealth
253
Table 11.20: 2010 Oxycodone Prescriptions Dispensed by County, Continued
County Number of
Prescriptions Total Units Dispensed
NICHOLAS 1,690 107,435
OHIO 3,174 266,142
OLDHAM 7,828 546,854
OWEN 2,207 164,244
OWSLEY 1,264 85,324
PENDLETON 5,046 369,041
PERRY 12,218 1,027,316
PIKE 6,375 551,477
POWELL 4,748 397,493
PULASKI 13,609 1,017,826
ROBERTSON 407 27,495
ROCKCASTLE 4,467 359,615
ROWAN 5,316 458,536
RUSSELL 772 48,112
SCOTT 9,929 602,735
SHELBY 7,251 496,781
SIMPSON 2,467 176,252
SPENCER 3,319 251,978
TAYLOR 3,718 288,347
TODD 866 60,246
TRIGG 1,745 142,018
TRIMBLE 1,336 89,466
UNION 2,239 158,976
UNKNOWN 84 5,004
WARREN 10,527 693,815
WASHINGTON 1,751 121,211
WAYNE 2,708 184,037
WEBSTER 2,491 208,606
WHITLEY 13,683 1,089,174
WOLFE 1,731 201,852
WOODFORD 4,683 314,357
Source: KASPER

Sourcebook of Criminal Justice Statistics in the Commonwealth
254
Table 11.21: 2010 Methadone Prescriptions Dispensed by
County
County Number of
Prescriptions Total Units Dispensed
ADAIR 106 10,246
ALLEN 374 45,257
ANDERSON 774 92,293
BALLARD 87 8,072
BARREN 348 52,346
BATH 339 37,844
BELL 687 58,931
BOONE 1,849 306,227
BOURBON 461 63,381
BOYD 253 33,475
BOYLE 679 104,421
BRACKEN 128 25,880
BREATHITT 1,041 131,737
BRECKINRIDGE 292 38,610
BULLITT 990 129,113
BUTLER 89 13,213
CALDWELL 96 11,866
CALLOWAY 231 33,151
CAMPBELL 1,778 281,632
CARLISLE 92 12,683
CARROLL 143 15,948
CARTER 448 44,225
CASEY 275 36,087
CHRISTIAN 318 42,625
CLARK 1,310 188,650
CLAY 718 112,437
CLINTON 118 14,730
CRITTENDEN 155 24,301
CUMBERLAND 36 3,893
DAVIESS 417 46,119
Source: KASPER

Sourcebook of Criminal Justice Statistics in the Commonwealth
255
Table 11.21: 2010 Methadone Prescriptions Dispensed by County, Continued
County Number of
Prescriptions Total Units Dispensed
EDMONSON 118 14,683
ELLIOTT 95 7,941
ESTILL 475 69,565
FAYETTE 4,405 589,804
FLEMING 218 39,422
FLOYD 1,408 235,298
FRANKLIN 1,502 162,353
FULTON 33 3,936
GALLATIN 129 16,613
GARRARD 1,085 159,114
GRANT 388 66,514
GRAVES 587 82,476
GRAYSON 408 64,369
GREEN 127 12,526
GREENUP 508 71,048
HANCOCK 30 4,224
HARDIN 637 89,972
HARLAN 548 63,001
HARRISON 441 65,988
HART 178 15,972
HENDERSON 817 124,131
HENRY 135 13,448
HOPKINS 655 76,041
JACKSON 213 34,989
JEFFERSON 9,377 1,450,336
JESSAMINE 1,509 220,668
JOHNSON 460 83,748
KENTON 3,402 538,547
KNOTT 416 60,872
KNOX 449 62,932
Source: KASPER

Sourcebook of Criminal Justice Statistics in the Commonwealth
256
Table 11.21: 2010 Methadone Prescriptions Dispensed by County, Continued
County Number of
Prescriptions Total Units Dispensed
LARUE 103 12,084
LAUREL 1,036 142,619
LAWRENCE 230 21,821
LEE 370 56,008
LESLIE 528 67,581
LETCHER 242 37,891
LEWIS 191 24,039
LINCOLN 827 113,938
LIVINGSTON 215 34,872
LOGAN 250 37,129
LYON 98 13,412
MADISON 2,020 304,644
MAGOFFIN 364 66,629
MARION 592 81,817
MARSHALL 378 60,444
MARTIN 104 13,090
MASON 104 14,191
MCCRACKEN 1,415 205,150
MCCREARY 100 11,957
MCLEAN 92 11,296
MEADE 132 16,897
MENIFEE 136 15,150
MERCER 763 127,746
METCALFE 143 21,926
MONROE 81 13,102
MONTGOMERY 683 85,663
MORGAN 287 27,974
MUHLENBERG 318 44,394
NELSON 666 87,663
NICHOLAS 375 45,411
Source: KASPER

Sourcebook of Criminal Justice Statistics in the Commonwealth
257
Table 11.21: 2010 Methadone Prescriptions Dispensed by County, Continued
County Number of
Prescriptions Total Units Dispensed
OHIO 299 33,011
OLDHAM 392 59,307
OWEN 129 14,450
OWSLEY 539 68,479
PENDLETON 305 57,617
PERRY 1,920 282,019
PIKE 397 55,439
POWELL 730 108,972
PULASKI 799 110,866
ROBERTSON 39 4,725
ROCKCASTLE 323 56,097
ROWAN 652 80,993
RUSSELL 109 16,955
SCOTT 775 99,267
SHELBY 508 59,754
SIMPSON 191 20,483
SPENCER 198 26,988
TAYLOR 711 88,693
TODD 75 12,810
TRIGG 147 21,876
TRIMBLE 122 17,606
UNION 173 19,587
UNKNOWN 11 1,774
WARREN 2,583 315,840
WASHINGTON 294 36,952
WAYNE 151 19,190
WEBSTER 170 18,125
WHITLEY 510 71,201
WOLFE 252 38,814
WOODFORD 494 68,578
Source: KASPER

Sourcebook of Criminal Justice Statistics in the Commonwealth
258
Table 11.22: 2010 Tramadol Prescriptions Dispensed by County
County Number of
Prescriptions Total Units Dispensed
ADAIR 1,683 107,279
ALLEN 1,878 119,309
ANDERSON 2,025 195,353
BALLARD 418 38,866
BARREN 3,463 243,707
BATH 1,740 161,254
BELL 6,249 560,144
BOONE 4,666 432,127
BOURBON 1,881 148,120
BOYD 4,216 344,144
BOYLE 2,868 230,689
BRACKEN 846 73,068
BREATHITT 2,922 218,581
BRECKINRIDGE 2,113 163,388
BULLITT 4,152 356,407
BUTLER 1,362 103,356
CALDWELL 1,574 135,027
CALLOWAY 2,042 177,941
CAMPBELL 3,477 275,537
CARLISLE 629 53,519
CARROLL 942 63,872
CARTER 3,848 328,761
CASEY 1,867 137,553
CHRISTIAN 3,079 192,542
CLARK 3,724 361,879
CLAY 5,301 407,264
CLINTON 1,220 138,602
CRITTENDEN 743 65,310
CUMBERLAND 663 39,677
DAVIESS 4,319 332,277
Source: KASPER

Sourcebook of Criminal Justice Statistics in the Commonwealth
259
Table 11.22: 2010 Tramadol Prescriptions Dispensed by County, Continued
County Number of
Prescriptions Total Units Dispensed
EDMONSON 1,266 115,344
ELLIOTT 538 54,176
ESTILL 2,387 262,933
FAYETTE 17,822 1,384,929
FLEMING 1,063 90,922
FLOYD 9,871 818,234
FRANKLIN 4,859 361,922
FULTON 620 41,972
GALLATIN 639 55,899
GARRARD 1,813 179,435
GRANT 1,636 131,284
GRAVES 3,543 291,067
GRAYSON 4,676 371,382
GREEN 1,384 107,409
GREENUP 6,549 580,286
HANCOCK 397 35,228
HARDIN 8,554 631,300
HARLAN 7,212 638,392
HARRISON 2,338 168,836
HART 1,624 142,672
HENDERSON 4,098 280,440
HENRY 1,193 80,292
HICKMAN 348 29,149
HOPKINS 4,020 374,696
JACKSON 2,443 191,932
JEFFERSON 38,023 2,784,628
JESSAMINE 3,944 361,015
JOHNSON 3,431 242,723
KENTON 6,250 501,244
KNOTT 4,046 358,753
Source: KASPER

Sourcebook of Criminal Justice Statistics in the Commonwealth
260
Table 11.22: 2010 Tramadol Prescriptions Dispensed by County, Continued
County Number of
Prescriptions Total Units Dispensed
KNOX 6,155 466,058
LARUE 1,107 81,568
LAUREL 7,514 574,562
LAWRENCE 2,144 144,994
LEE 1,367 135,695
LESLIE 3,295 298,071
LETCHER 8,162 725,175
LEWIS 1,695 150,329
LINCOLN 3,106 272,525
LIVINGSTON 1,046 97,837
LOGAN 2,360 163,872
LYON 907 79,815
MADISON 7,590 710,994
MAGOFFIN 2,220 152,500
MARION 1,487 91,941
MARSHALL 1,786 135,003
MARTIN 2,025 130,012
MASON 1,298 112,612
MCCRACKEN 5,716 403,977
MCCREARY 2,393 206,993
MCLEAN 861 74,321
MEADE 1,271 105,471
MENIFEE 634 49,546
MERCER 1,710 140,910
METCALFE 900 57,293
MONROE 1,676 107,380
MONTGOMERY 2,998 265,101
MORGAN 3,108 251,805
MUHLENBERG 2,768 229,940
NELSON 3,220 258,361
Source: KASPER

Sourcebook of Criminal Justice Statistics in the Commonwealth
261
Table 11.22: 2010 Tramadol Prescriptions Dispensed by County, Continued
County Number of
Prescriptions Total Units Dispensed
NICHOLAS 869 80,698
OHIO 1,656 140,047
OLDHAM 2,544 182,805
OWEN 887 80,099
OWSLEY 1,662 157,276
PENDLETON 742 59,604
PERRY 6,144 523,576
PIKE 10,558 1,016,103
POWELL 1,137 112,331
PULASKI 5,402 452,834
ROBERTSON 130 10,289
ROCKCASTLE 2,080 185,137
ROWAN 1,805 176,374
RUSSELL 354 25,915
SCOTT 4,650 338,657
SHELBY 2,552 186,161
SIMPSON 2,266 163,224
SPENCER 1,251 125,363
TAYLOR 2,140 176,225
TODD 708 51,111
TRIGG 1,335 109,303
TRIMBLE 431 33,615
UNION 2,042 166,868
UNKNOWN 126 10,228
WARREN 9,198 665,924
WASHINGTON 1,092 78,962
WAYNE 1,795 130,639
WEBSTER 1,662 143,827
WHITLEY 8,741 734,846
WOLFE 1,163 98,123
WOODFORD 1,518 139,192
Source: KASPER

Sourcebook of Criminal Justice Statistics in the Commonwealth
262
Table 11.23: 2010 Buprenorphrine Prescriptions Dispensed by County
County Number of Prescriptions Total Units Dispensed
ADAIR 1,940 50,889
ALLEN 342 6,992
ANDERSON 615 24,976
BALLARD 79 2,228
BARREN 1,018 21,416
BATH 676 20,877
BELL 2,413 77,948
BOONE 2,926 104,272
BOURBON 1,638 43,662
BOYD 2,272 52,076
BOYLE 2,167 49,199
BRACKEN 169 6,326
BREATHITT 1,297 34,090
BRECKINRIDGE 204 3,125
BULLITT 1,137 35,704
BUTLER 108 6,192
CALDWELL 610 9,830
CALLOWAY 898 24,716
CAMPBELL 2,046 76,335
CARLISLE 37 2,221
CARROLL 1,018 15,979
CARTER 2,425 66,898
CASEY 866 38,210
CHRISTIAN 949 28,322
CLARK 1,866 47,166
CLAY 3,143 125,370
CLINTON 310 7,219
CRITTENDEN 70 4,085
CUMBERLAND 447 8,540
DAVIESS 494 19,388
Source: KASPER

Sourcebook of Criminal Justice Statistics in the Commonwealth
263
Table 11.23: 2010 Buprenorphrine Prescriptions Dispensed by County, Continued
County Number of Prescriptions Total Units Dispensed
EDMONSON 122 4,657
ELLIOTT 342 11,081
ESTILL 1,113 51,886
FAYETTE 9,098 271,358
FLEMING 614 20,494
FLOYD 4,406 141,523
FRANKLIN 2,103 69,733
FULTON 15 1,373
GALLATIN 229 8,343
GARRARD 913 21,524
GRANT 585 28,332
GRAVES 557 10,486
GRAYSON 169 6,016
GREEN 304 9,463
GREENUP 2,651 59,095
HANCOCK 59 3,520
HARDIN 1,461 24,144
HARLAN 5,987 209,763
HARRISON 532 18,104
HART 235 7,981
HENDERSON 169 4,128
HENRY 213 6,096
HICKMAN 13 780
HOPKINS 1,203 42,507
JACKSON 649 24,764
JEFFERSON 10,942 326,419
JESSAMINE 2,494 71,670
JOHNSON 1,093 29,524
KENTON 4,693 164,832
KNOTT 1,793 40,117
Source: KASPER

Sourcebook of Criminal Justice Statistics in the Commonwealth
264
Table 11.23: 2010 Buprenorphrine Prescriptions Dispensed by County, Continued
County Number of Prescriptions Total Units Dispensed
KNOX 2,926 103,468
LARUE 189 5,280
LAUREL 3,541 112,145
LAWRENCE 2,055 34,894
LEE 894 22,541
LESLIE 1,310 36,211
LETCHER 6,161 158,144
LEWIS 560 16,645
LINCOLN 1,767 46,762
LIVINGSTON 98 4,728
LOGAN 161 3,259
LYON 38 1,019
MADISON 5,132 130,529
MAGOFFIN 1,364 42,220
MARION 636 22,801
MARSHALL 818 16,111
MARTIN 801 18,810
MASON 1,286 29,987
MCCRACKEN 962 32,064
MCCREARY 1,200 39,414
MCLEAN 88 4,319
MEADE 248 4,453
MENIFEE 440 12,980
MERCER 1,477 37,219
METCALFE 206 3,948
MONROE 24 497
MONTGOMERY 2,349 51,775
MORGAN 675 20,585
MUHLENBERG 920 37,304
NELSON 603 20,009
Source: KASPER

Sourcebook of Criminal Justice Statistics in the Commonwealth
265
Table 11.23: 2010 Buprenorphrine Prescriptions Dispensed by County, Continued
County Number of Prescriptions Total Units Dispensed
NICHOLAS 495 5,911
OHIO 98 3,745
OLDHAM 831 26,098
OWEN 195 6,550
OWSLEY 525 14,664
PENDLETON 617 20,639
PERRY 4,748 123,809
PIKE 5,369 184,391
POWELL 1,185 32,032
PULASKI 4,393 144,483
ROBERTSON 38 1,357
ROCKCASTLE 746 27,536
ROWAN 1,683 43,351
RUSSELL 720 18,220
SCOTT 2,211 77,027
SHELBY 428 14,700
SIMPSON 161 4,492
SPENCER 185 7,295
TAYLOR 1,949 43,452
TODD 119 3,778
TRIGG 161 5,102
TRIMBLE 148 4,298
UNION 112 5,427
UNKNOWN 79 1,746
WARREN 1,227 32,289
WASHINGTON 352 9,635
WAYNE 1,115 26,590
WEBSTER 193 7,234
WHITLEY 4,872 134,848
WOLFE 614 12,367
WOODFORD 756 24,211
Source: KASPER

Sourcebook of Criminal Justice Statistics in the Commonwealth
266
Table 11.24: 2010 Alprazolam Prescriptions Dispensed by County
County Number of
Prescriptions Total Units Dispensed
ADAIR 3,937 237,975
ALLEN 8,507 464,072
ANDERSON 4,869 307,337
BALLARD 1,639 99,582
BARREN 8,079 487,463
BATH 2,710 171,015
BELL 17,557 1,069,701
BOONE 15,317 1,205,182
BOURBON 3,488 210,992
BOYD 7,818 562,773
BOYLE 6,052 456,150
BRACKEN 1,450 101,730
BREATHITT 5,970 342,492
BRECKINRIDGE 5,174 406,146
BULLITT 15,355 1,141,391
BUTLER 2,567 175,634
CALDWELL 2,866 201,232
CALLOWAY 8,267 562,075
CAMPBELL 14,937 1,194,341
CARLISLE 1,178 73,392
CARROLL 2,979 176,885
CARTER 7,136 476,666
CASEY 5,520 390,942
CHRISTIAN 9,566 600,451
CLARK 9,196 611,670
CLAY 9,784 657,300
CLINTON 5,367 394,556
CRITTENDEN 2,091 159,976
CUMBERLAND 2,614 194,152
DAVIESS 17,160 1,189,954
Source: KASPER

Sourcebook of Criminal Justice Statistics in the Commonwealth
267
Table 11.24: 2010 Alprazolam Prescriptions Dispensed by County, Continued
County Number of
Prescriptions Total Units Dispensed
EDMONSON 1,911 113,270
ELLIOTT 1,844 113,094
ESTILL 3,749 247,043
FAYETTE 42,872 2,702,328
FLEMING 3,268 253,708
FLOYD 18,676 1,121,272
FRANKLIN 9,923 628,754
FULTON 1,120 74,570
GALLATIN 1,543 129,083
GARRARD 4,003 318,559
GRANT 3,204 247,353
GRAVES 11,762 802,767
GRAYSON 6,250 420,079
GREEN 2,266 166,463
GREENUP 11,016 763,504
HANCOCK 1,233 91,978
HARDIN 11,440 805,773
HARLAN 9,578 563,285
HARRISON 3,827 259,511
HART 2,256 168,261
HENDERSON 10,677 704,971
HENRY 2,870 176,866
HICKMAN 541 35,846
HOPKINS 7,748 568,325
JACKSON 2,453 170,090
JEFFERSON 157,423 10,719,926
JESSAMINE 7,819 513,219
JOHNSON 13,597 804,843
KENTON 20,262 1,638,065
KNOTT 6,403 377,818
KNOX 12,471 768,612
Source: KASPER

Sourcebook of Criminal Justice Statistics in the Commonwealth
268
Table 11.24: 2010 Alprazolam Prescriptions Dispensed by County, Continued
Number of Prescriptions Total Units Dispensed County
LAUREL 14,850 906,652
LAWRENCE 4,333 262,822
LEE 2,308 153,556
LESLIE 2,616 149,797
LETCHER 6,968 390,745
LEWIS 2,270 147,972
LINCOLN 6,937 539,960
LIVINGSTON 3,218 234,232
LOGAN 4,286 303,280
LYON 2,450 178,548
MADISON 12,703 828,229
MAGOFFIN 7,484 338,858
MARION 4,880 333,141
MARSHALL 4,555 328,474
MARTIN 7,050 326,454
MASON 3,282 229,011
MCCRACKEN 17,453 1,082,095
MCCREARY 3,584 241,942
MCLEAN 2,207 150,670
MEADE 3,550 257,092
MENIFEE 1,276 75,858
MERCER 3,621 268,079
METCALFE 1,814 114,576
MONROE 4,051 274,381
MONTGOMERY 5,976 401,419
MORGAN 4,369 230,335
MUHLENBERG 8,377 591,505
NELSON 11,057 807,818
NICHOLAS 1,344 82,938
OHIO 5,505 407,546
Source: KASPER

Sourcebook of Criminal Justice Statistics in the Commonwealth
269
Table 11.24: 2010 Alprazolam Prescriptions Dispensed by County, Continued
Number of Prescriptions Total Units Dispensed County
OWEN 1,435 97,341
OWSLEY 1,421 87,548
PENDLETON 1,959 138,655
PERRY 11,810 752,816
PIKE 17,871 968,902
POWELL 6,199 389,475
PULASKI 22,752 1,540,010
ROBERTSON 416 30,826
ROCKCASTLE 4,021 309,169
ROWAN 4,406 293,772
RUSSELL 1,929 110,823
SCOTT 7,441 444,451
SHELBY 6,603 433,498
SIMPSON 5,151 336,651
SPENCER 3,730 311,030
TAYLOR 5,375 395,530
TODD 1,910 134,651
TRIGG 2,564 182,084
TRIMBLE 1,032 63,435
UNION 4,630 310,835
UNKNOWN 142 7,539
WARREN 17,870 1,110,655
WASHINGTON 2,349 156,810
WAYNE 4,061 231,220
WEBSTER 3,055 218,288
WHITLEY 15,868 988,444
WOLFE 2,841 170,826
WOODFORD 3,980 263,190
Source: KASPER

Sourcebook of Criminal Justice Statistics in the Commonwealth
270
Table 11.25: 2010 Diazepam Prescriptions Dispensed by County
County Number of
Prescriptions Total Units Dispensed
ADAIR 2,072 109,241
ALLEN 4,431 201,750
ANDERSON 1,045 55,896
BALLARD 879 51,593
BARREN 4,976 280,547
BATH 792 44,737
BELL 4,883 252,276
BOONE 9,926 663,244
BOURBON 1,511 80,039
BOYD 3,205 196,122
BOYLE 3,116 192,230
BRACKEN 871 54,003
BREATHITT 3,834 193,798
BRECKINRIDGE 1,667 111,270
BULLITT 4,277 249,912
BUTLER 2,167 131,324
CALDWELL 1,481 90,986
CALLOWAY 3,668 224,000
CAMPBELL 8,790 611,762
CARLISLE 638 41,157
CARROLL 880 54,461
CARTER 3,104 192,067
CASEY 2,268 143,565
CHRISTIAN 5,046 289,107
CLARK 3,477 207,949
CLAY 4,622 202,353
CLINTON 2,191 157,965
CRITTENDEN 1,099 74,677
CUMBERLAND 942 67,182
DAVIESS 4,493 288,218
Source: KASPER

Sourcebook of Criminal Justice Statistics in the Commonwealth
271
Table 11.25: 2010 Diazepam Prescriptions Dispensed by County, Continued
Number of Prescriptions Total Units Dispensed County
EDMONSON 1,819 106,581
ELLIOTT 703 42,415
ESTILL 1,662 85,947
FAYETTE 15,490 797,929
FLEMING 1,034 65,974
FLOYD 14,119 770,176
FRANKLIN 3,614 182,960
FULTON 808 59,885
GALLATIN 1,157 81,750
GARRARD 1,699 110,976
GRANT 3,496 233,006
GRAVES 4,156 275,233
GRAYSON 5,328 341,989
GREEN 1,537 98,592
GREENUP 4,629 290,671
HANCOCK 412 31,374
HARDIN 4,166 223,787
HARLAN 1,982 116,079
HARRISON 2,813 184,318
HART 1,728 107,941
HENDERSON 5,047 314,197
HENRY 788 35,692
HICKMAN 264 15,887
HOPKINS 4,671 293,332
JACKSON 1,512 69,887
JEFFERSON 60,724 2,776,565
JESSAMINE 3,061 171,686
JOHNSON 10,429 496,753
KENTON 13,198 930,672
KNOTT 2,374 126,473
KNOX 4,382 222,122
Source: KASPER

Sourcebook of Criminal Justice Statistics in the Commonwealth
272
Table 11.25: 2010 Diazepam Prescriptions Dispensed by County, Continued
Number of Prescriptions Total Units Dispensed County
LAUREL 4,837 231,643
LAWRENCE 3,869 210,466
LEE 1,507 83,313
LESLIE 870 43,290
LETCHER 1,771 92,529
LEWIS 1,274 75,315
LINCOLN 2,373 156,171
LIVINGSTON 1,555 102,085
LOGAN 1,687 97,873
LYON 942 64,804
MADISON 5,452 256,818
MAGOFFIN 3,087 142,755
MARION 1,720 98,328
MARSHALL 1,992 118,437
MARTIN 3,377 168,636
MASON 1,248 69,071
MCCRACKEN 8,209 523,903
MCCREARY 1,424 87,570
MCLEAN 776 47,428
MEADE 1,016 66,186
MENIFEE 554 33,559
MERCER 1,974 115,574
METCALFE 1,333 75,987
MONROE 1,505 87,172
MONTGOMERY 1,543 85,731
MORGAN 1,304 61,351
MUHLENBERG 3,532 220,005
NELSON 3,155 186,025
NICHOLAS 595 33,719
OHIO 2,596 162,628
Source: KASPER

Sourcebook of Criminal Justice Statistics in the Commonwealth
273
Table 11.25: 2010 Diazepam Prescriptions Dispensed by County, Continued
County Number of
Prescriptions Total Units Dispensed
OWEN 1,187 77,791
OWSLEY 1,707 86,288
PENDLETON 1,667 116,679
PERRY 3,301 179,333
PIKE 6,704 362,412
POWELL 1,139 66,362
PULASKI 6,091 346,490
ROBERTSON 205 13,141
ROCKCASTLE 3,370 196,038
ROWAN 2,798 170,596
RUSSELL 1,181 60,756
SCOTT 3,043 146,448
SHELBY 2,195 112,596
SIMPSON 1,370 90,757
SPENCER 1,138 67,699
TAYLOR 4,476 322,026
TODD 753 46,423
TRIGG 1,408 98,438
TRIMBLE 209 11,624
UNION 1,463 88,597
UNKNOWN 77 3,577
WARREN 10,790 549,464
WASHINGTON 891 46,360
WAYNE 940 51,091
WEBSTER 1,353 82,725
WHITLEY 5,712 291,023
WOLFE 1,579 74,621
WOODFORD 1,503 78,475
Source: KASPER

Sourcebook of Criminal Justice Statistics in the Commonwealth
274
Driving Under the Influence (DUI) Offenses
• In 2010, Bell, Gallatin, Rockcastle, and Rowan counties had the highest DUI arrest rates in the state with more than 14.8 DUI arrest related events per 1,000 population. Clinton, Adair, and Edmondson Counties had the lowest DUI arrest rates, with less than 2.0 arrests per 1,000 population.
• Statewide, the adult arrest rate for DUI related offenses decreased each year between 2007 and 2010. In 2010,
there were 6.9 arrests per 1,000 population in Kentucky.
• In 2010, a total of 39,493 DUI related charges were disposed in the Kentucky Court System. 75.4% of these
were for first offenses, 18.0% were for second offenses, 4.9% were for third offenses, and the remaining 1.7% were for fourth offenses.
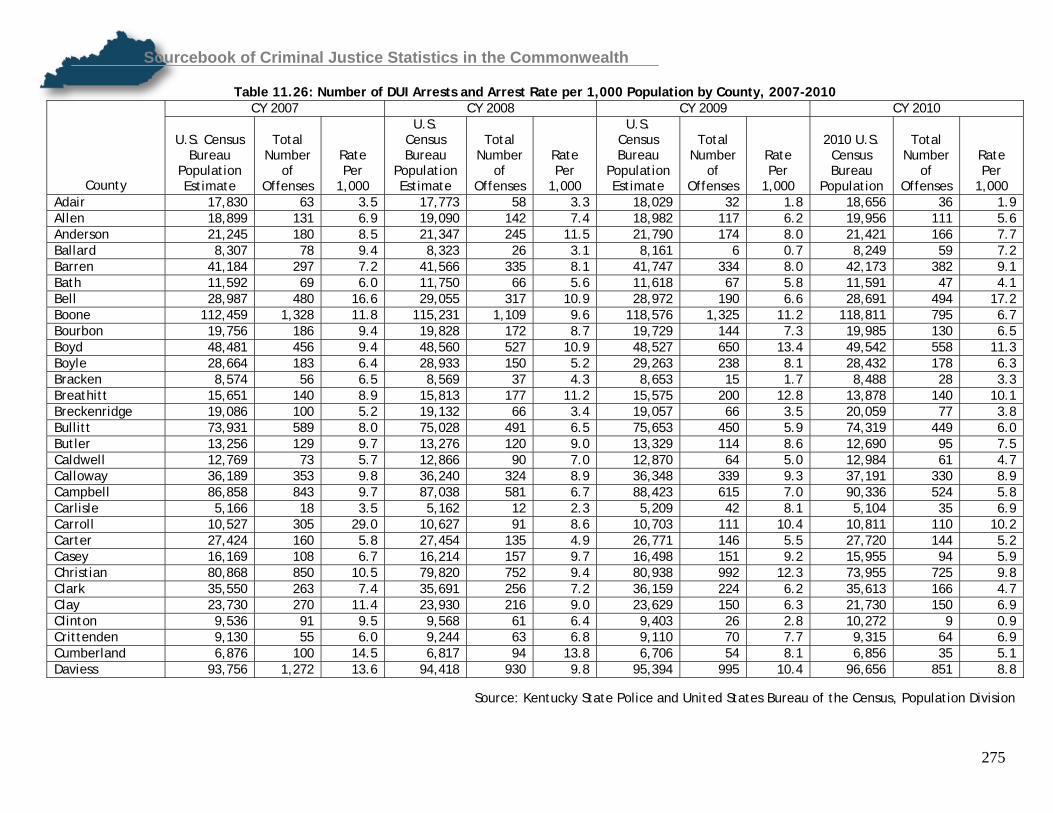
Sourcebook of Criminal Justice Statistics in the Commonwealth
275
Table 11.26: Number of DUI Arrests and Arrest Rate per 1,000 Population by County, 2007-2010 CY 2007 CY 2008 CY 2009 CY 2010
County
U.S. Census Bureau
Population Estimate
Total Number
of Offenses
Rate Per
1,000
U.S. Census Bureau
Population Estimate
Total Number
of Offenses
Rate Per
1,000
U.S. Census Bureau
Population Estimate
Total Number
of Offenses
Rate Per
1,000
2010 U.S. Census Bureau
Population
Total Number
of Offenses
Rate Per
1,000 Adair 17,830 63 3.5 17,773 58 3.3 18,029 32 1.8 18,656 36 1.9 Allen 18,899 131 6.9 19,090 142 7.4 18,982 117 6.2 19,956 111 5.6 Anderson 21,245 180 8.5 21,347 245 11.5 21,790 174 8.0 21,421 166 7.7 Ballard 8,307 78 9.4 8,323 26 3.1 8,161 6 0.7 8,249 59 7.2 Barren 41,184 297 7.2 41,566 335 8.1 41,747 334 8.0 42,173 382 9.1 Bath 11,592 69 6.0 11,750 66 5.6 11,618 67 5.8 11,591 47 4.1 Bell 28,987 480 16.6 29,055 317 10.9 28,972 190 6.6 28,691 494 17.2 Boone 112,459 1,328 11.8 115,231 1,109 9.6 118,576 1,325 11.2 118,811 795 6.7 Bourbon 19,756 186 9.4 19,828 172 8.7 19,729 144 7.3 19,985 130 6.5 Boyd 48,481 456 9.4 48,560 527 10.9 48,527 650 13.4 49,542 558 11.3 Boyle 28,664 183 6.4 28,933 150 5.2 29,263 238 8.1 28,432 178 6.3 Bracken 8,574 56 6.5 8,569 37 4.3 8,653 15 1.7 8,488 28 3.3 Breathitt 15,651 140 8.9 15,813 177 11.2 15,575 200 12.8 13,878 140 10.1 Breckenridge 19,086 100 5.2 19,132 66 3.4 19,057 66 3.5 20,059 77 3.8 Bullitt 73,931 589 8.0 75,028 491 6.5 75,653 450 5.9 74,319 449 6.0 Butler 13,256 129 9.7 13,276 120 9.0 13,329 114 8.6 12,690 95 7.5 Caldwell 12,769 73 5.7 12,866 90 7.0 12,870 64 5.0 12,984 61 4.7 Calloway 36,189 353 9.8 36,240 324 8.9 36,348 339 9.3 37,191 330 8.9 Campbell 86,858 843 9.7 87,038 581 6.7 88,423 615 7.0 90,336 524 5.8 Carlisle 5,166 18 3.5 5,162 12 2.3 5,209 42 8.1 5,104 35 6.9 Carroll 10,527 305 29.0 10,627 91 8.6 10,703 111 10.4 10,811 110 10.2 Carter 27,424 160 5.8 27,454 135 4.9 26,771 146 5.5 27,720 144 5.2 Casey 16,169 108 6.7 16,214 157 9.7 16,498 151 9.2 15,955 94 5.9 Christian 80,868 850 10.5 79,820 752 9.4 80,938 992 12.3 73,955 725 9.8 Clark 35,550 263 7.4 35,691 256 7.2 36,159 224 6.2 35,613 166 4.7 Clay 23,730 270 11.4 23,930 216 9.0 23,629 150 6.3 21,730 150 6.9 Clinton 9,536 91 9.5 9,568 61 6.4 9,403 26 2.8 10,272 9 0.9 Crittenden 9,130 55 6.0 9,244 63 6.8 9,110 70 7.7 9,315 64 6.9 Cumberland 6,876 100 14.5 6,817 94 13.8 6,706 54 8.1 6,856 35 5.1 Daviess 93,756 1,272 13.6 94,418 930 9.8 95,394 995 10.4 96,656 851 8.8
Source: Kentucky State Police and United States Bureau of the Census, Population Division

Sourcebook of Criminal Justice Statistics in the Commonwealth
276
Table 11.26: Number of DUI Arrests and Arrest Rate per 1,000 Population by County, 2007-2010, Continued
CY 2007 CY 2008 CY 2009 CY 2010
County
U.S. Census Bureau
Population Estimate
Total Number
of Offenses
Rate Per
1,000
U.S. Census Bureau
Population Estimate
Total Number
of Offenses
Rate Per
1,000
U.S. Census Bureau
Population Estimate
Total Number
of Offenses
Rate Per
1,000
2010 U.S. Census Bureau
Population
Total Number
of Offenses
Rate Per
1,000 Edmondson 11,978 52 4.3 12,085 67 5.5 11,926 70 5.9 12,161 24 2.0 Elliott 7,139 59 8.3 7,280 56 7.7 9,083 63 6.9 7,852 61 7.8 Estill 14,975 43 2.9 14,948 52 3.5 14,859 65 4.4 14,672 69 4.7 Fayette 279,044 2,312 8.3 282,114 2,540 9.0 296,545 1,401 4.7 295,803 1,231 4.2 Fleming 14,695 28 1.9 14,735 107 7.3 14,667 72 4.9 14,348 99 6.9 Floyd 42,021 462 11.0 42,094 510 12.1 41,899 517 12.3 39,451 418 10.6 Franklin 48,425 573 11.8 48,844 639 13.1 48,968 512 10.5 49,285 518 10.5 Fulton 6,795 143 21.0 6,855 120 17.5 6,814 85 12.5 6,813 95 13.9 Gallatin 8,035 200 24.9 8,071 177 21.9 8,202 149 18.2 8,589 160 18.6 Garrard 17,041 178 10.4 17,021 203 11.9 17,085 121 7.1 16,912 100 5.9 Grant 25,161 233 9.3 25,549 202 7.9 25,542 137 5.4 24,662 145 5.9 Graves 37,557 286 7.6 37,487 375 10.0 37,719 308 8.2 37,121 321 8.6 Grayson 25,356 142 5.6 25,497 131 5.1 25,581 163 6.4 25,746 142 5.5 Green 11,572 57 4.9 11,613 64 5.5 11,510 71 6.2 11,258 54 4.8 Greenup 37,270 166 4.5 37,388 128 3.4 38,020 206 5.4 36,910 195 5.3 Hancock 8,617 41 4.8 8,663 40 4.6 8,635 56 6.5 8,565 34 4.0 Hardin 97,949 1,208 12.3 98,546 1,103 11.2 99,770 1,040 10.4 105,543 850 8.1 Harlan 31,065 365 11.7 30,783 652 21.2 30,956 415 13.4 29,278 334 11.4 Harrison 18,552 103 5.6 18,654 97 5.2 18,794 80 4.3 18,846 95 5.0 Hart 18,409 99 5.4 18,561 100 5.4 18,396 123 6.7 18,199 96 5.3 Henderson 45,296 478 10.6 45,462 526 11.6 45,496 400 8.8 46,250 400 8.6 Henry 15,711 193 12.3 15,741 208 13.2 16,060 186 11.6 15,416 176 11.4 Hickman 4,938 9 1.8 4,936 7 1.4 4,851 12 2.5 4,902 10 2.0 Hopkins 46,286 206 4.5 46,338 438 9.5 46,167 616 13.3 46,920 364 7.8 Jackson 13,586 46 3.4 13,645 29 2.1 13,243 26 2.0 13,494 31 2.3 Jefferson 709,264 3,122 4.4 713,877 3,807 5.3 721,594 3,920 5.4 741,096 3,777 5.1 Jessamine 45,555 390 8.6 46,716 336 7.2 47,589 416 8.7 48,586 384 7.9 Johnson 24,012 308 12.8 24,056 246 10.2 23,827 392 16.5 23,356 358 15.3 Kenton 155,675 1,053 6.8 157,629 970 6.2 158,729 1,016 6.4 159,720 846 5.3 Knott 17,280 137 7.9 17,385 117 6.7 17,126 130 7.6 16,346 162 9.9 Knox 32,528 189 5.8 32,810 112 3.4 32,710 133 4.1 31,883 184 5.8 Source: Kentucky State Police and United States Bureau of the Census, Population Division

Sourcebook of Criminal Justice Statistics in the Commonwealth
277
Table 11.26: Number of DUI Arrests and Arrest Rate per 1,000 Population by County, 2007-2010, Continued
CY 2007 CY 2008 CY 2009 CY 2010
County
U.S. Census Bureau
Population Estimate
Total Number
of Offenses
Rate Per
1,000
U.S. Census Bureau
Population Estimate
Total Number
of Offenses
Rate Per
1,000
U.S. Census Bureau
Population Estimate
Total Number
of Offenses
Rate Per
1,000
2010 U.S. Census Bureau
Population
Total Number
of Offenses
Rate Per
1,000 Larue 13,661 98 7.2 13,722 61 4.4 13,663 74 5.4 14,193 67 4.7 Laurel 57,351 927 16.2 57,586 828 14.4 57,749 840 14.5 58,849 645 11.0 Lawrence 16,322 62 3.8 16,443 54 3.3 16,573 104 6.3 15,860 94 5.9 Lee 7,441 111 14.9 7,414 80 10.8 7,339 85 11.6 7,887 96 12.2 Leslie 11,777 197 16.7 11,639 103 8.8 11,503 88 7.7 11,310 65 5.7 Letcher 24,014 153 6.4 23,890 208 8.7 23,633 142 6.0 24,519 130 5.3 Lewis 13,885 45 3.2 13,807 53 3.8 13,752 31 2.3 13,870 61 4.4 Lincoln 25,245 104 4.1 25,072 82 3.3 25,172 55 2.2 24,742 119 4.8 Livingston 9,610 65 6.8 9,591 83 8.7 9,598 88 9.2 9,519 75 7.9 Logan 27,129 367 13.5 27,117 372 13.7 27,174 282 10.4 26,835 227 8.5 Lyon 8,253 115 13.9 8,245 86 10.4 8,291 83 10.0 8,314 83 10.0 Madison 81,103 1,098 13.5 82,192 750 9.1 83,258 708 8.5 82,916 619 7.5 Magoffin 13,186 110 8.3 13,151 96 7.3 13,166 112 8.5 13,333 84 6.3 Marion 18,933 243 12.8 19,063 207 10.9 19,486 212 10.9 19,820 177 8.9 Marshall 31,258 229 7.3 31,189 256 8.2 31,200 267 8.6 31,448 249 7.9 Martin 11,644 106 9.1 11,602 108 9.3 13,070 120 9.2 12,929 103 8.0 Mason 17,190 179 10.4 17,414 144 8.3 17,378 158 9.1 17,490 102 5.8 McCracken 64,765 754 11.6 65,109 585 9.0 65,880 508 7.7 65,565 573 8.7 McCreary 17,326 160 9.2 17,315 158 9.1 17,795 135 7.6 18,306 144 7.9 McLean 9,731 67 6.9 9,681 61 6.3 9,607 54 5.6 9,531 36 3.8 Meade 27,270 171 6.3 27,043 182 6.7 26,501 178 6.7 28,602 141 4.9 Menifee 6,764 52 7.7 6,744 43 6.4 6,593 45 6.8 6,306 19 3.0 Mercer 21,814 131 6.0 21,920 143 6.5 21,920 116 5.3 21,331 102 4.8 Metcalfe 10,268 69 6.7 10,288 113 11.0 10,063 89 8.8 10,099 50 5.0 Monroe 11,663 128 11.0 11,547 133 11.5 11,569 99 8.6 10,963 55 5.0 Montgomery 25,228 165 6.5 25,618 187 7.3 25,835 186 7.2 26,499 118 4.5 Morgan 14,236 100 7.0 14,156 122 8.6 14,092 157 11.1 13,923 103 7.4 Muhlenberg 31,341 194 6.2 31,187 149 4.8 31,274 190 6.1 31,499 263 8.3 Nelson 42,517 287 6.8 43,113 426 9.9 43,550 292 6.7 43,437 265 6.1 Nicholas 6,889 78 11.3 6,811 71 10.4 6,874 82 11.9 7,135 59 8.3 Source: Kentucky State Police and United States Bureau of the Census, Population Division

Sourcebook of Criminal Justice Statistics in the Commonwealth
278
Table 11.26: Number of DUI Arrests and Arrest Rate per 1,000 Population by County, 2007-2010, Continued
CY 2007 CY 2008 CY 2009 CY 2010
County
U.S. Census Bureau
Population Estimate
Total Number
of Offenses
Rate Per
1,000
U.S. Census Bureau
Population Estimate
Total Number
of Offenses
Rate Per
1,000
U.S. Census Bureau
Population Estimate
Total Number
of Offenses
Rate Per
1,000
2010 U.S. Census Bureau
Population
Total Number
of Offenses
Rate Per
1,000 Ohio 23,560 215 9.1 23,789 234 9.8 23,534 190 8.1 23,842 212 8.9 Oldham 55,935 289 5.2 56,874 334 5.9 58,095 235 4.0 60,316 290 4.8 Owen 11,390 36 3.2 11,432 59 5.2 11,380 49 4.3 10,841 51 4.7 Owsley 4,613 69 15.0 4,634 70 15.1 4,619 53 11.5 4,755 36 7.6 Pendleton 15,058 84 5.6 14,992 75 5.0 14,887 95 6.4 14,877 64 4.3 Perry 29,213 392 13.4 29,241 324 11.1 29,136 362 12.4 28,712 324 11.3 Pike 65,544 1,002 15.3 65,331 971 14.9 65,446 955 14.6 65,024 633 9.7 Powell 13,811 169 12.2 13,859 119 8.6 13,566 117 8.6 12,613 69 5.5 Pulaski 60,148 438 7.3 60,851 527 8.7 60,853 503 8.3 63,063 458 7.3 Robertson 2,202 8 3.6 2,202 4 1.8 2,237 3 1.3 2,282 6 2.6 Rockcastle 16,687 215 12.9 16,788 178 10.6 16,504 201 12.2 17,056 252 14.8 Rowan 22,559 391 17.3 22,733 290 12.8 22,872 373 16.3 23,333 345 14.8 Russell 17,140 183 10.7 17,296 105 6.1 17,377 90 5.2 17,565 66 3.8 Scott 42,954 71 1.7 44,549 96 2.2 45,841 143 3.1 47,173 116 2.5 Shelby 40,458 547 13.5 41,157 451 11.0 42,078 438 10.4 42,074 555 13.2 Simpson 17,070 145 8.5 17,019 80 4.7 17,019 96 5.6 17,327 82 4.7 Spencer 16,837 87 5.2 17,382 117 6.7 17,737 121 6.8 17,061 158 9.3 Taylor 23,917 272 11.4 24,069 220 9.1 24,420 205 8.4 24,512 172 7.0 Todd 12,044 142 11.8 12,173 77 6.3 12,253 92 7.5 12,460 75 6.0 Trigg 13,401 131 9.8 13,418 109 8.1 13,290 128 9.6 14,339 93 6.5 Trimble 8,983 49 5.5 9,012 64 7.1 8,958 61 6.8 8,809 29 3.3 Union 15,092 181 12.0 15,024 190 12.6 14,990 155 10.3 15,007 156 10.4 Warren 104,023 730 7.0 105,862 976 9.2 108,669 1,181 10.9 113,792 1,373 12.1 Washington 11,558 89 7.7 11,595 99 8.5 11,257 84 7.5 11,717 46 3.9 Wayne 20,637 69 3.3 20,696 67 3.2 20,748 73 3.5 20,813 77 3.7 Webster 13,890 96 6.9 13,669 61 4.5 13,706 68 5.0 13,621 75 5.5 Whitley 38,342 225 5.9 38,668 195 5.0 38,813 180 4.6 35,637 206 5.8 Wolfe 7,043 60 8.5 6,989 69 9.9 7,099 43 6.1 7,355 40 5.4 Woodford 24,314 193 7.9 24,526 232 9.5 24,986 213 8.5 24,939 158 6.3 Statewide Total 4,240,474 35,250 8.3 4,269,245 34,296 8.0 4,314,113 33,089 7.7 4,339,367 29,917 6.9 Source: Kentucky State Police and United States Bureau of the Census, Population Division

Sourcebook of Criminal Justice Statistics in the Commonwealth
279
Table 11.27: Circuit Court DUI Charges by Disposition Statewide, 2006-2010 CY 2006 CY 2007 CY 2008 CY 2009 CY 2010
Convicted 620 694 640 643 536
Acquitted/Dismissed 129 116 124 103 116
Amended 25 23 30 15 22
Diversion/Deferred 28 25 20 39 17
Other 33 37 55 68 49
Firs
t D
UI
Total 835 895 869 868 740
Convicted 231 239 240 203 214
Acquitted/Dismissed 38 28 28 29 27
Amended 18 22 25 21 14
Diversion/Deferred 5 5 6 13 4
Other 14 10 13 18 12 Seco
nd D
UI
Total 306 304 312 284 271
Convicted 174 174 159 141 124
Acquitted/Dismissed 17 17 13 15 10
Amended 16 17 21 14 9
Diversion/Deferred 0 2 1 1 0
Other 16 15 7 17 8
Thir
d D
UI
Total 223 225 201 188 151
Convicted 250 289 239 221 179
Acquitted/Dismissed 22 21 20 23 10
Amended 38 40 43 36 23
Diversion/Deferred 1 1 3 1 1
Other 13 13 9 20 9 Four
th D
UI
Total 324 364 314 301 222
Source: Administrative Office of the
Courts

Sourcebook of Criminal Justice Statistics in the Commonwealth
280
Table 11.28: District Court DUI Charges by Disposition Statewide, 2006-2010 CY 2006 CY 2007 CY 2008 CY 2009 CY 2010
Convicted 23,704 24,221 23,152 22,037 20,193
Acquitted/Dismissed 2,415 2,328 2,169 2,032 1,851
Amended 6,073 6,290 6,011 5,665 5,448
Diversion/Deferred 2 4 9 24 18
Indictment by Grand Jury/Information 726 723 724 685 630
Other 675 688 677 921 878
Firs
t D
UI
Total 33,595 34,254 32,742 31,364 29,018
Convicted 5,823 5,904 5,680 5,288 4,628
Acquitted/Dismissed 407 359 349 270 281
Amended 1,844 1,864 1,740 1,646 1,526
Diversion/Deferred 0 0 0 2 1
Indictment by Grand Jury/Information 249 241 232 246 190
Other 128 109 102 193 194
Seco
nd D
UI
Total 8,451 8,477 8,103 7,645 6,820
Convicted 1,387 1,295 1,218 1,023 953
Acquitted/Dismissed 136 112 98 91 83
Amended 739 783 715 684 583
Diversion/Deferred 0 0 0 0 0
Indictment by Grand Jury/Information 178 171 161 127 102
Other 67 42 36 59 70
Thir
d D
UI
Total 2,507 2,403 2,228 1,984 1,791
Convicted 1 1 5 8 2
Acquitted/Dismissed 37 56 50 35 27
Amended 222 539 471 369 257
Diversion/Deferred 0 0 0 0 0
Indictment by Grand Jury/Information 273 286 259 209 153
Other 40 42 30 26 22
Four
th D
UI
Total 573 924 815 647 461
Source: Administrative Office of the
Courts

Sourcebook of Criminal Justice Statistics in the Commonwealth
281
Table 11.29: Juvenile Court DUI Charges by Disposition Statewide, 2006-2010 CY 2006 CY 2007 CY 2008 CY 2009 CY 2010
Convicted 19 19 12 8 6
Acquitted/Dismissed 4 12 7 9 0
Diversion 0 1 1 0 0
Amended 7 1 5 1 3
Other 11 19 8 3 9
Firs
t D
UI
Total 41 52 33 21 18
Amended 1 0 0 0 0
Other 0 0 1 0 0
Thir
d
DU
I
Total 1 0 1 0 0
Amended 0 1 0 0 1
Other 0 1 0 0 0
Four
th
DU
I
Total 0 2 0 0 1
Source: Administrative Office of the
Courts

Sourcebook of Criminal Justice Statistics in the Commonwealth
282
Sex Offenses
• The number of forcible rapes in Kentucky had risen each year between 2006 and 2009. It fell from 1,567 in
2009 to 1,545 in 2010. This was a decline of 1.4%.
• In 2010, the forcible rape arrest rate for Kentucky was 31.8 per 100,000. This is 15.6% higher than the national forcible rape arrest rate (27.5 arrests per 100,000 population).
• Between 2009 and 2010, the forcible rape arrest rate in Kentucky declined 9.14%, from 35.0 per 100,000 to
31.8 per 100,000 population.
• In 2010, the average sentence for rape offenses was 12.3 years, 13.7 years for sodomy offenses, and 9 years for sexual abuse offenses.
• The total number of new commitments to the Kentucky Department of Corrections for sex offenses increased
from 404 in 2009 to 477 in 2010.
• The number of offenders serving out their sentence for sex offenses fell to a six year low of 56 in 2010.
• In 2010, a total of 788 sex offense cases were disposed in Kentucky Courts, 304 of these in Circuit Court and 484 in District Court.

Sourcebook of Criminal Justice Statistics in the Commonwealth
283
Table 11.30: Circuit Court- Sex Offenses By Disposition Type, 2006-2010 CY 2006 CY 2007 CY 2008
Sex Offender Registration Offenses
Unlawful Distribution of Obscene Matter Total
Sex Offender Registration Offenses
Unlawful Distribution of Obscene Matter Total
Sex Offender Registration Offenses
Unlawful Distribution of Obscene Matter Total
Charges- Acquitted/Dismissed/Not Guilty 47 128 175 51 123 174 38 193 231
Cases- Acquitted/Dismissed/Not Guilty 46 16 61 48 19 67 38 39 74
Charges- Amended Dispositions 22 8 30 28 5 33 21 49 70
Cases- Amended Dispositions 19 8 26 28 4 32 21 13 34
Charges- Conviction 139 48 187 191 49 240 174 200 374
Cases- Conviction 128 28 154 177 37 210 161 45 202
Charges- Diversion/Deferred 1 1 2 1 0 1 2 1 3 Cases- Diversion/Deferred 1 1 2 1 0 1 2 1 3 Charges- Other Dispositions 5 1 6 9 3 12 1 7 8
Cases- Other Dispositions 4 1 5 8 2 10 1 3 4
Charges- Temporary Dispositions 2 0 2 0 1 1 3 0 3
Cases- Temporary Dispositions 2 0 2 0 1 1 3 0 3
TOTAL CHARGES 216 186 402 280 181 461 239 450 689
TOTAL CASES 180 44 220 233 56 284 197 83 264
Source: Administrative Office of the Courts

Sourcebook of Criminal Justice Statistics in the Commonwealth
284
Table 11.31: Circuit Court- Sex Offenses By Disposition Type, 2006-2010, Continued
CY 2009 CY 2010
Sex Offender Registration Offenses
Unlawful Distribution of Obscene Matter Total
Sex Offender Registration Offenses
Unlawful Distribution of Obscene Matter Total
Charges- Acquitted/Dismissed/Not Guilty 65 773 838 46 482 528
Cases- Acquitted/Dismissed/Not Guilty 62 45 106 45 51 96
Charges- Amended Dispositions 37 3 40 31 14 45
Cases- Amended Dispositions 37 2 39 29 13 42 Charges- Conviction 212 126 338 148 1,230 1,378 Cases- Conviction 190 48 229 141 75 208
Charges- Diversion/Deferred 1 1 2 1 2 3 Cases- Diversion/Deferred 1 1 2 1 2 3
Charges- Other Dispositions 3 0 3 12 9 21 Cases- Other Dispositions 3 0 3 12 2 14
Charges- Temporary Dispositions 5 0 5 5 1 6
Cases- Temporary Dispositions 5 0 5 5 1 6 TOTAL CHARGES 323 903 1,226 243 1,738 1,981 TOTAL CASES 250 87 324 196 125 304 Source: Administrative Office of the Courts

Sourcebook of Criminal Justice Statistics in the Commonwealth
285
Table 11.32: District Court- Sex Offenses By Disposition Type, 2006-2010
CY 2006 CY 2007 CY 2008
Sex Offender Registration Offenses
Unlawful Distribution of Obscene Matter Total
Sex Offender Registration Offenses
Unlawful Distribution of Obscene Matter Total
Sex Offender Registration Offenses
Unlawful Distribution of Obscene Matter Total
Charges- Acquitted/Dismissed/Not Guilty 106 350 456 187 85 272 111 49 160 Cases- Acquitted/Dismissed/Not Guilty 103 43 146 180 46 223 105 30 134 Charges- Amended Dispositions 64 17 81 74 22 96 72 29 101 Cases- Amended Dispositions 61 10 71 71 14 85 72 19 91 Charges- Conviction 79 72 151 104 21 125 67 30 97 Cases- Conviction 78 27 105 101 21 122 67 26 92 Charges- Diversion/Deferred 0 0 0 1 0 1 0 0 0
Cases- Diversion/Deferred 0 0 0 1 0 1 0 0 0 Charges- Juvenile Dispositions 0 1 1 0 2 2 0 4 4 Cases- Juvenile Dispositions 0 1 1 0 2 2 0 3 3 Charges- Other Dispositions 172 82 254 185 418 603 179 95 274
Cases- Other Dispositions 167 43 207 165 55 215 166 47 208 Charges- Temporary Dispositions 2 0 2 1 0 1 2 0 2 Cases- Temporary Dispositions 2 0 2 1 0 1 2 0 2 TOTAL CHARGES 423 522 945 552 548 1,100 431 207 638 TOTAL CASES 352 114 458 437 126 549 342 111 445 Source: Administrative Office of the Courts
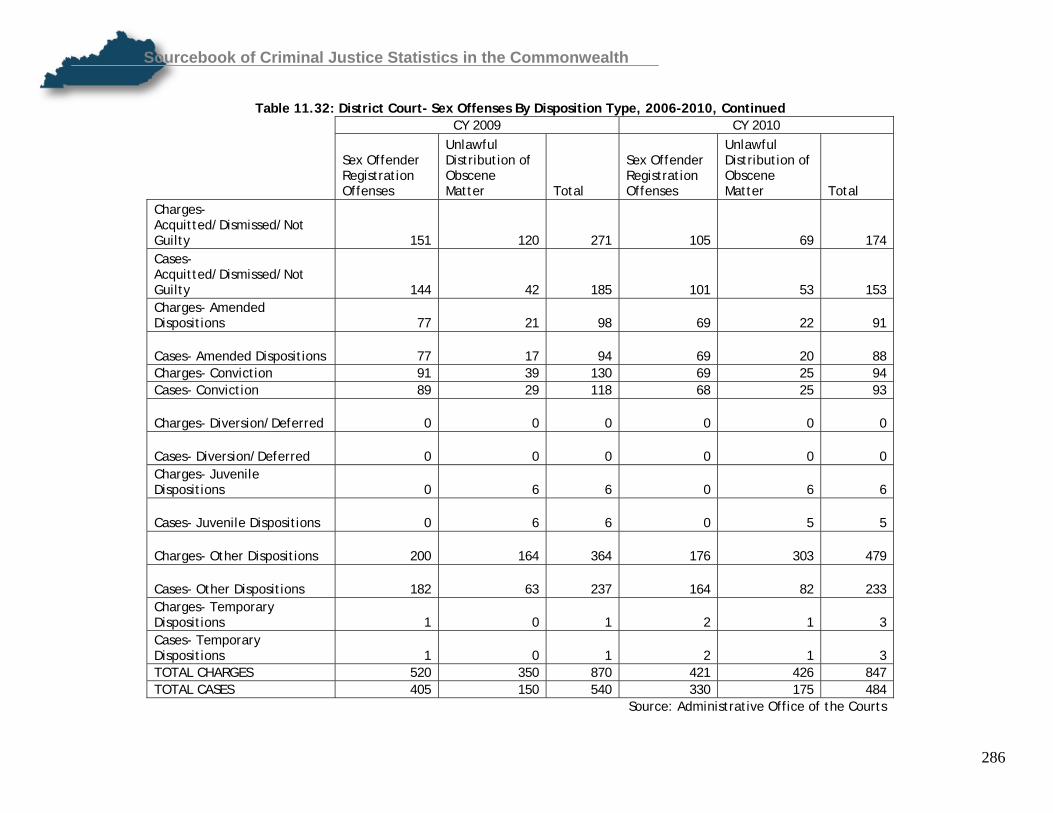
Sourcebook of Criminal Justice Statistics in the Commonwealth
286
Table 11.32: District Court- Sex Offenses By Disposition Type, 2006-2010, Continued
CY 2009 CY 2010
Sex Offender Registration Offenses
Unlawful Distribution of Obscene Matter Total
Sex Offender Registration Offenses
Unlawful Distribution of Obscene Matter Total
Charges- Acquitted/Dismissed/Not Guilty 151 120 271 105 69 174 Cases- Acquitted/Dismissed/Not Guilty 144 42 185 101 53 153 Charges- Amended Dispositions 77 21 98 69 22 91
Cases- Amended Dispositions 77 17 94 69 20 88 Charges- Conviction 91 39 130 69 25 94 Cases- Conviction 89 29 118 68 25 93
Charges- Diversion/Deferred 0 0 0 0 0 0
Cases- Diversion/Deferred 0 0 0 0 0 0 Charges- Juvenile Dispositions 0 6 6 0 6 6
Cases- Juvenile Dispositions 0 6 6 0 5 5
Charges- Other Dispositions 200 164 364 176 303 479
Cases- Other Dispositions 182 63 237 164 82 233 Charges- Temporary Dispositions 1 0 1 2 1 3 Cases- Temporary Dispositions 1 0 1 2 1 3 TOTAL CHARGES 520 350 870 421 426 847 TOTAL CASES 405 150 540 330 175 484 Source: Administrative Office of the Courts

Sourcebook of Criminal Justice Statistics in the Commonwealth
287
Table 11.33: Family Court- Sex Offenses by Disposition Type, 2006- 2010
CY 2008
Unlawful Distribution of Obscene Matter Total
Charges- Amended Dispositions 1 1
Cases- Amended Dispositions 1 1
Charges- Conviction 2 2
Cases- Conviction 2 2
TOTAL CHARGES 3 3
TOTAL CASES 2 2
Source: Administrative Office of the Courts
Table 11.34: Number of Reported Incidents of Forcible Rape, 2006-2010
Year Number of Incidents
2006 1,292
2007 1,375
2008 1,451
2009 1,567
2010 1,545
Source: Kentucky State Police, Crime in Kentucky

Sourcebook of Criminal Justice Statistics in the Commonwealth
288
Table 11.35: Forcible Rape Arrest Rate Per 100,000 Population-Kentucky and Surrounding States, 2007-2010
State
Forcible Rape Arrest Rate per 100,000- CY 2007
Forcible Rape Arrest Rate per 100,000- CY 2008
Forcible Rape Arrest Rate per 100,000- CY 2009
Forcible Rape Arrest Rate per 100,000- CY 2010*
Percent Change CY 2007-2010
Percent Change CY 2009-2010
Kentucky 32.6 33.8 35.0 31.8 -2.45% -9.14%
Illinois 31.9 32.0 30.2 23.6 -26.02% -21.85%
Indiana 27.3 26.7 25.5 27.2 0.37% 6.67%
Missouri 30.4 27.1 26.8 23.9 -21.38% -10.82%
Ohio 40.0 39.2 34.8 32.1 -19.75% -7.76%
Tennessee 35.7 33.4 31.7 33.7 -5.60% 6.31%
Virginia 23.3 23.0 19.2 19.1 -18.03% -0.52%
West Virginia 21.5 21.6 23.8 19.1 -11.16% -19.75%
UNITED STATES TOTAL PART ONE ARRESTS 30.0 29.7 28.7 27.5 -8.33% -4.18% Source: Federal Bureau of Investigation * FBI used 2010 estimated population of 3,042,574

Sourcebook of Criminal Justice Statistics in the Commonwealth
289
Table 11.36: Average Length of Sentence in Years: Sex Offenses, 2005-2010
Year Rape I Rape II Rape III Sodomy I Sodomy II Sodomy
III Sexual Abuse
2005 36 16 7 33 16 8 9
2006 34 12 5 30 14 5 8
2007 28 6 25 12 7 11 9
24 10 5 22 13 7 9 2008
2009 25 9 6 26 11 6 9
2010 21 10 6 21 13 7 9
Source: Kentucky Department of Corrections
Table 11.37: Sex Offenses Commitments and Releases, 2005-2010 2005 2006 2007 2008 2009 2010
New Commitment 538 454 499 469 404 477
84 33 35 27 51 Parole 62
Serve Out 214 298 88 81 68 56 Shock
Probation 25 18 19 15 15 20
Source: Kentucky Department of Corrections

Sourcebook of Criminal Justice Statistics in the Commonwealth
290
Domestic Violence Offenses
• In 2010, a total of 3,835 domestic violence cases were disposed in Kentucky’s Courts of Law. 150 of these cases in Circuit Court, 3,682 in District Court, and the remaining 3 in Juvenile Court.
• Of the 3,682 domestic violence cases disposed in District Courts during 2010, the largest number, 565, were
heard in the Twenty-First Judicial District (Bath, Menifee, Rowan, and Montgomery Counties). Two judicial districts, the Second (McCracken County) and the Thirty-First (Floyd County) disposed no cases, and the Thirty-Sixth Judicial District (Knott and Magoffin Counties) disposed only one domestic violence case.
• Of those domestic violence cases disposed in District Court, nearly 53.3% (1,964) resulted in a conviction. This
is true for 56.6% (85) of the domestic violence cases disposed in Circuit Court, and 33.3% (1) of those in juvenile court.

Sourcebook of Criminal Justice Statistics in the Commonwealth
291
Table 11.38: Domestic Violence Offenses by Outcome and Court Type, 2006-2010 CY 2006 CY 2007 CY 2008 CY 2009 CY 2010 TOTAL
Charges Cases Charges Cases Charges Cases Charges Cases Charges Cases Charges Cases
Acquitted/Dismissed/Not Guilty 46 35 45 38 42 35 47 39 60 47 240 194
Amended Dispositions 0 0 1 1 1 1 3 3 0 0 5 5 Conviction 134 112 134 115 95 83 106 89 108 85 577 484 Diversion/Deferred 0 0 3 3 3 3 4 4 8 6 18 16 Other Dispositions 16 13 7 7 5 5 5 5 18 11 51 41
Temporary Dispositions 0 0 1 1 1 1 0 0 2 1 4 3
CIRC
UIT
TOTAL 196 160 191 165 147 128 165 140 196 150 895 743 Acquitted/Dismissed/Not Guilty 1,926 1,813 1,856 1,742 1,740 1,591 1,580 1,448 1,575 1,427 8,677 8,021
Amended Dispositions 51 51 53 53 58 58 69 68 64 64 295 294 Conviction 2,019 1,976 2,026 1,977 1,982 1,908 2,036 1,927 2,016 1,964 10,079 9,752 Diversion/Deferred 5 5 7 7 4 4 24 24 28 28 68 68 Other Dispositions 258 237 292 203 208 193 222 204 186 173 1,166 1,010
Temporary Dispositions 19 18 22 22 17 17 15 15 27 26 100 98
DIS
TRIC
T
TOTAL 4,278 4,100 4,256 4,004 4,009 3,771 3,946 3,686 3,896 3,682 20,385 19,243
Acquitted/Dismissed/Not Guilty 1 1 4 4 0 0 3 3 1 1 9 9
Conviction 3 3 1 1 1 1 1 1 1 1 7 7
Diversion/Deferred 0 0 0 0 1 1 1 1 0 0 2 2 Juvenile Dispositions 1 1 1 1 0 0 1 1 1 1 4 4 Other Dispositions 1 1 0 0 0 0 0 0 0 0 1 1
JUVE
NIL
E
TOTAL 6 6 6 6 2 2 6 6 3 3 23 23 TOTAL 4,480 4,266 4,453 4,175 4,158 3,901 4,117 3,832 4,095 3,835 21,303 20,009 Source: Administrative Office of the Courts

Sourcebook of Criminal Justice Statistics in the Commonwealth
292
Table 11.39: Closed Domestic Violence District Court Cases, 2006-2010
District CY 2006 CY 2007 CY 2008 CY 2009 CY 2010
One 29 57 35 30 45
Two 16 4 3 4 0
Three 2 4 2 3 13
Four 271 74 7 1 2
Five 10 7 9 7 11
Six 429 437 516 475 447
Seven 62 88 78 84 85
Eight 10 26 2 1 4
Nine 0 20 6 9 8
Ten 159 134 107 144 111
Eleven 302 290 312 298 283
Twelve 13 13 14 21 21
Thirteen 375 61 66 79 84
Fourteen 462 144 1 18 50
Fifteen 249 260 283 266 256
Sixteen 717 19 27 78 24
Seventeen 56 2 1 3 3
Eighteen 6 2 1 1 2
Nineteen 269 245 299 234 241
Twenty 251 97 89 66 58
Twenty-One 498 508 532 516 565
Twenty-Two 0 10 5 6 2
Twenty-Three 403 335 326 239 259
Twenty-Four 54 90 171 128 111
Twenty-Five 49 108 179 197 181
Twenty-Six 294 299 245 277 242
Twenty-Seven 984 189 446 136 151
Twenty-Eight 12 10 14 4 9
Twenty-Nine 230 229 246 202 234
Thirty 0 0 8 19 16
Source: Administrative Office of the Courts

Sourcebook of Criminal Justice Statistics in the Commonwealth
293
Table 11.39: Closed Domestic Violence District Court Cases, 2006-2010, Continued
District CY 2006 CY 2007 CY 2008 CY 2009 CY 2010
Thirty-One 5 0 2 2 0
Thirty-Two 357 438 405 370 378
Thirty-Three 216 225 256 266 237
Thirty-Four 207 170 176 110 132
Thirty-Five 18 12 24 21 4
Thirty-Six 1 142 3 1 1
Thirty-Seven 50 31 41 15 22
Thirty-Eight 264 119 64 52 31
Thirty-Nine 341 353 130 44 52
Forty 269 160 96 88 72
Forty-One 194 179 102 13 14
Forty-Two 87 8 13 11 11
Forty-Three 2 1 0 1 15
Forty-Four 237 271 223 215 240
Forty-Five 178 179 191 240 211
Forty-Six 317 248 289 296 294
Forty-Seven 219 218 221 213 200
Forty-Eight 8 8 25 25 13
Forty-Nine 191 88 46 13 29
Fifty 145 16 7 9 6
Fifty-One 10 18 15 10 4
Fifty-Two 112 113 144 114 134
Fifty-Three 238 28 9 32 9
Fifty-Four 10 10 8 12 11
Fifty-Five 306 388 375 444 315
Fifty-Six 213 232 213 265 198
Fifty-Seven 212 266 311 317 314
Fifty-Eight 149 49 48 19 13
Fifty-Nine 32 44 38 34 28
Sixty 144 148 114 98 92
STATEWIDE TOTAL 10,944 7,924 7,619 6,896 6,598 Source: Administrative Office of the Courts

Sourcebook of Criminal Justice Statistics in the Commonwealth
294
Table 11.40: Domestic Violence Cases Disposed in District Court by County, 2006-2010
County CY 2006 CY 2007 CY 2008 CY 2009 CY 2010
Adair 95 103 114 98 122
Allen 93 58 44 10 18
Anderson 73 14 8 11 5
Ballard 16 29 22 20 10
Barren 2 1 0 1 13
Bath 93 99 118 94 91
Bell 237 271 223 215 240
Boone 0 2 6 5 6
Bourbon 103 33 0 1 7
Boyd 357 438 405 370 378
Boyle 136 12 3 0 0
Bracken 45 31 47 40 56
Breathitt 143 117 35 2 1
Breckenridge 97 53 99 68 69
Bullitt 306 388 375 444 315
Butler 33 4 1 0 1
Caldwell 75 92 77 97 71
Calloway 87 8 13 11 11
Campbell 56 2 1 3 3
Carlisle 16 15 16 14 18
Carroll 68 68 86 76 62
Carter 34 22 32 7 1
Casey 135 126 132 104 112
Christian 2 4 2 3 13
Clark 39 103 173 191 169
Clay 183 175 99 7 2
Clinton 99 95 94 84 72
Crittenden 2 1 0 3 2
Cumberland 53 62 48 37 43
Daviess 429 437 516 475 447
Source: Administrative Office of the Courts

Sourcebook of Criminal Justice Statistics in the Commonwealth
295
Table 11.40: Domestic Violence Cases Disposed in District Court by County, 2006-2010, Continued
County CY 2006 CY 2007 CY 2008 CY 2009 CY 2010
Edmondson 53 14 24 28 16
Elliott 6 3 5 3 9
Estill 210 173 185 151 151
Fayette 0 10 5 6 2
Fleming 102 92 91 73 87
Floyd 5 0 2 2 0
Franklin 8 8 25 25 13
Fulton 18 41 22 21 27
Gallatin 10 8 2 7 5
Garrard 117 47 60 17 25
Grant 153 158 156 128 140
Graves 112 113 144 114 134
Grayson 104 94 87 111 110
Green 38 55 36 51 49
Greenup 178 25 6 7 11
Hancock 40 21 8 17 9
Hardin 0 20 6 9 8
Harlan 294 299 245 277 242
Harrison 2 0 0 0 0
Hart 72 63 49 85 68
Henderson 10 18 15 10 4
Henry 1 1 2 1 9
Hickman 11 16 13 9 18
Hopkins 271 74 7 1 2
Jackson 0 0 0 0 0
Jefferson 0 0 8 19 16
Jessamine 253 5 0 54 58
Johnson 26 21 9 9 16
Kenton 717 19 27 78 24
Knott 1 0 0 0 0
Knox 350 80 379 100 84
Larue 87 71 58 59 43
Laurel 634 109 67 36 67
Source: Administrative Office of the Courts

Sourcebook of Criminal Justice Statistics in the Commonwealth
296
Table 11.40: Domestic Violence Cases Disposed in District Court by County, 2006-2010, Continued
County CY 2006 CY 2007 CY 2008 CY 2009 CY 2010
Lawrence 8 17 29 32 25
Lee 113 94 89 38 62
Leslie 11 4 3 6 12
Letcher 219 218 221 213 200
Lewis 73 72 83 59 47
Lincoln 5 9 6 8 1
Livingston 38 49 42 68 52
Logan 32 48 43 45 59
Lyon 40 24 23 26 31
Madison 10 5 6 6 12
Magoffin 0 142 3 1 1
Marion 85 88 113 103 90
Marshall 149 49 48 19 13
Martin 20 52 133 87 70
Mason 122 122 161 121 98
McCracken 16 4 3 4 0
McCreary 116 89 85 69 87
McLean 43 25 31 52 36
Meade 116 101 103 117 115
Menifee 84 51 37 50 70
Mercer 9 4 4 9 6
Metcalfe 0 0 0 0 2
Monroe 91 86 66 61 49
Montgomery 265 281 269 275 288
Morgan 10 6 4 5 12
Muhlenberg 135 154 160 188 175
Nelson 212 266 311 317 314
Nicholas 2 1 0 0 1
Ohio 138 80 31 7 5
Oldham 7 3 1 16 8
Source: Administrative Office of the Courts

Sourcebook of Criminal Justice Statistics in the Commonwealth
297
Table 11.40: Domestic Violence Cases Disposed in District Court by County, 2006-2010, Continued
County CY 2006 CY 2007 CY 2008 CY 2009 CY 2010
Owen 28 34 41 62 54
Owsley 80 68 52 50 46
Pendleton 2 1 1 1 0
Perry 216 225 256 266 237
Pike 18 12 24 21 4
Powell 127 157 52 39 50
Pulaski 2 3 5 0 6
Robertson 0 0 0 0 1
Rockcastle 10 7 9 4 3
Rowan 56 77 108 97 116
Russell 69 35 2 0 0
Scott 250 80 1 14 28
Shelby 116 13 1 21 2
Simpson 98 30 2 3 11
Spencer 49 1 0 0 2
Taylor 141 113 136 122 115
Todd 30 40 35 39 26
Trigg 60 67 71 74 44
Trimble 5 9 11 4 4
Union 1 3 1 2 4
Warren 10 26 2 1 4
Washington 38 34 27 22 29
Wayne 101 30 0 4 0
Webster 7 3 8 2 5
Whitley 91 81 91 41 45
Wolfe 71 79 43 3 1
Woodford 109 31 0 3 15
STATEWIDE TOTAL 10,944 7,924 7,619 6,896 6,598 Source: Administrative Office of the Courts

Sourcebook of Criminal Justice Statistics in the Commonwealth
298
Section XII: Key Criminal Justice Cost Information
While monitoring changes in crime trends, it is also important to track the range of costs associated with incarceration, community supervision, and criminal justice programs for adults and juveniles. This section includes data from the Kentucky Department of Corrections, Kentucky Department of Juvenile Justice, and the Justice and Public Safety Cabinet’s Grants Management Branch.
• In FY 2010, Kentucky’s criminal justice agencies enacted budgets totaling $909,837,220.00.
• Approximately 33% of the Justice and Public Safety Cabinet’s annual budget goes towards the operation of adult correctional institutions, 20.4% funds Kentucky State Police activities, and 16.9% funds community services and local facilities.
• Kentucky’s criminal justice budget includes over $33 million in grant funding administered by the Cabinet’s
agencies including, among others, Justice Assistance Grants, Violence against Women Act funding, Victims of Crime Act funds, and Title II and Title V funds from the Office of Juvenile Justice and Delinquency Prevention.

Sourcebook of Criminal Justice Statistics in the Commonwealth
299
Table 12.1: 2010 Executive Budget for Kentucky Justice and Public Safety Cabinet Department Federal Funds General Fund Road Funds Fees and Licenses Tobacco Funds Grand Total
Adult Correctional Institutions
$80,771,600.00 (26.86%)
$193,416,100.00 (87.94%)
$0.00 (0%)
$26,534,100.00 (8.80%)
$0.00 (0%) $300,721,800.00
Community Services and Local Facilities
$663,200.00 (0.40%)
$149,639,400.00 (97.20%)
$0.00 (0%)
$3,557,500.00 (2.30%)
$0.00 (0%) $153,860,100.00
Corrections Management $350,000.00
(5.00%) $6,469,900.00
(93.00%) $0.00
(0%) $135,100.00
(1.9%) $0.00
(0%) $6,955,000.00
Criminal Justice Training $1,962,900.00
(3.60%) $0.00
(0%) $0.00
(0%) $52,525,700.00
(96.30%) $0.00
(0%) $54,488,600.00
Justice Administration $18,302,000.00
(48.50%) $11,154,300.00
(29.50%) $0.00
(0%) $6,213,200.00
(16.40%) $2,042,004.00
(5.40%) $37,711,504.00
Juvenile Justice $13,698,300.00
(12.30%) $79,086,900.00
(71.50%) $17,730,100.00
(16.00%) $0.00
(0%) $110,515,300.00 $0.00
(0%)
$0.00 (0%)
$15,355,516.00 (100.00%) Local Jail Support
$0.00 (0%)
$0.00 (0%)
$0.00 (0%) $15,355,516.00
Public Advocacy $2,661,100.00
(5.90%) $38,049,500.00
(84.50%) $0.00
(0%) $4,300,000.00
(9.50%) $0.00
(0%) $45,010,600.00
State Police $36,560,300.00
(19.70%) $56,235,500.00
(30.30%) $73,881,500.00
(3.90%) $18,541,500.00
(10.00%) $0.00
(0%) $185,218,800.00 TOTAL $154,969,400.00 $549,407,116.00 $73,881,500.00 $129,537,200.00 $2,042,004.00 $909,837,220.00 Source: Justice and Public Safety Cabinet, Grants Management Branch

Sourcebook of Criminal Justice Statistics in the Commonwealth
300
Table 12.2a: Grant Awards By County, FY 2010
County
Community Corrections
Grant
Juvenile Accountability
Block Grant
Justice Assistance
Grant Law Enforcement
Service Fee
U.S. Department of Transportation/ Federal Motor Carrier Safety
Association
National Criminal History
Improvement Project
National Forensic Sciences Improvement Act
Office of Juvenile Justice and Delinquency
Prevention, Title II and Title V
State Motorcycle Revenue
Multiple Counties $558,224 $50,000 $4,386,954 $0 $0 $0 $0 $465,145 $0 Statewide $4,500 $0 $11,710,359 $0 $0 $147,660 $222,528 $166,575 $730,168 Adair $0 $0 $22,505 $0 $0 $0 $0 $0 $0 Allen $0 $0 $0 $12,362 $0 $0 $0 $0 $0 Anderson $0 $0 $0 $7,659 $0 $0 $0 $0 $0 Ballard $0 $0 $0 $0 $0 $0 $0 $0 $0 Barren $0 $0 $2,972 $12,909 $0 $0 $0 $0 $0 Bath $0 $0 $0 $0 $0 $0 $0 $0 $0 Bell $0 $0 $0 $0 $0 $0 $0 $0 $0 Boone $0 $0 $0 $10,960 $0 $0 $0 $0 $0 Bourbon $0 $0 $0 $0 $0 $0 $0 $0 $0 Boyd $0 $0 $0 $0 $0 $0 $0 $0 $0 Boyle $0 $0 $0 $0 $0 $0 $0 $0 $0 Bracken $0 $0 $0 $0 $0 $0 $0 $0 $0 Breathitt $0 $0 $0 $0 $0 $0 $0 $0 $0 Breckenridge $0 $0 $0 $0 $0 $0 $0 $0 $0 Bullitt $0 $0 $100,000 $0 $0 $0 $0 $0 $0 Butler $0 $0 $0 $0 $0 $0 $0 $0 $0 Caldwell $0 $0 $15,910 $0 $0 $0 $0 $0 $0 Calloway $0 $0 $0 $0 $0 $0 $0 $0 $0 Campbell $67,650 $0 $79,658 $38,691 $0 $0 $0 $0 $0 Carlisle $0 $0 $0 $0 $0 $0 $0 $0 $0 Carroll $0 $0 $8,276 $12,484 $0 $0 $0 $0 $0 Carter $0 $0 $69,372 $0 $0 $0 $0 $0 $0 Casey $0 $0 $0 $0 $0 $0 $0 $0 $0 Christian $0 $0 $0 $14,122 $0 $0 $0 $0 $0 Source: Justice and Public Safety Cabinet, Grants Management Branch

Sourcebook of Criminal Justice Statistics in the Commonwealth
301
Table 12.2a: Grant Awards By County, FY 2010, Continued
County
Community Corrections
Grant
Juvenile Accountability
Block Grant
Justice Assistance
Grant Law Enforcement
Service Fee
U.S. Department of Transportation/ Federal Motor Carrier Safety
Association
National Criminal History
Improvement Project
National Forensic Sciences Improvement Act
Office of Juvenile Justice and Delinquency
Prevention, Title II and Title V
State Motorcycle Revenue
Clark $0 $0 $0 $0 $0 $0 $0 $0 $0 Clay $0 $0 $0 $0 $0 $0 $0 $0 $0 Clinton $0 $0 $0 $0 $0 $0 $0 $0 $0 Crittenden $0 $0 $24,000 $0 $0 $0 $0 $0 $0 Cumberland $0 $0 $0 $0 $0 $0 $0 $0 $0 Daviess $0 $0 $0 $0 $0 $0 $0 $0 $0 Edmondson $0 $0 $0 $0 $0 $0 $0 $0 $0 Elliott $0 $0 $22,664 $0 $0 $0 $0 $0 $0 Estill $0 $0 $0 $0 $0 $0 $0 $0 $0 Fayette $0 $15,275 $398,056 $40,583 $25,000 $0 $0 $20,000 $0 Fleming $0 $0 $0 $0 $0 $0 $0 $0 $0 Floyd $0 $0 $0 $0 $0 $0 $0 $0 $0 Franklin $0 $0 $0 $7,921 $0 $0 $0 $0 $0 Fulton $0 $0 $30,600 $8,202 $0 $0 $0 $0 $0 Gallatin $0 $0 $0 $0 $0 $0 $0 $0 $0 Garrard $0 $0 $0 $0 $0 $0 $0 $0 $0 Grant $0 $0 $0 $0 $0 $0 $0 $0 $0 Graves $0 $0 $0 $13,740 $0 $0 $0 $0 $0 Grayson $0 $0 $0 $0 $0 $0 $0 $0 $0 Green $0 $0 $0 $0 $0 $0 $0 $0 $0 Greenup $0 $0 $0 $0 $0 $0 $0 $0 $0 Hancock $0 $0 $0 $0 $0 $0 $0 $0 $0 Hardin $73,703 $0 $0 $0 $0 $0 $0 $0 $0 Harlan $0 $0 $28,000 $0 $0 $0 $0 $0 $0 Harrison $0 $0 $0 $0 $0 $0 $0 $0 $0 Hart $0 $0 $0 $0 $0 $0 $0 $0 $0 Source: Justice and Public Safety Cabinet, Grants Management Branch

Sourcebook of Criminal Justice Statistics in the Commonwealth
302
Table 12.2a: Grant Awards By County, FY 2010, Continued
County
Community Corrections
Grant
Juvenile Accountability
Block Grant
Justice Assistance
Grant Law Enforcement
Service Fee
U.S. Department of Transportation/ Federal Motor Carrier Safety
Association
National Criminal History
Improvement Project
National Forensic Sciences
Improvement Act
Office of Juvenile Justice and Delinquency
Prevention, Title II and Title V
State Motorcycle Revenue
Henderson $21,400 $50,000 $106,843 $0 $0 $0 $0 $0 $0 Henry $0 $0 $0 $0 $0 $0 $0 $0 $0 Hickman $0 $0 $0 $0 $0 $0 $0 $0 $0 Hopkins $0 $0 $211,830 $0 $0 $0 $0 $0 $0 Jackson $0 $0 $0 $0 $0 $0 $0 $0 $0 Jefferson $0 $31,725 $788,646 $47,543 $15,000 $0 $0 $6,717 $0 Jessamine $0 $0 $76,124 $0 $0 $0 $0 $0 $0 Johnson $0 $0 $0 $0 $0 $0 $0 $0 $0 Kenton $125,684 $0 $139,416 $59,668 $0 $0 $0 $0 $0 Knott $0 $0 $0 $0 $0 $0 $0 $21,500 $0 Knox $0 $0 $7,453 $0 $0 $0 $0 $23,050 $0 Larue $0 $0 $0 $0 $0 $0 $0 $0 $0 Laurel $0 $0 $0 $0 $0 $0 $0 $0 $0 Lawrence $0 $0 $0 $0 $0 $0 $0 $0 $0 Lee $0 $0 $2,235 $4,515 $0 $0 $0 $0 $0 Leslie $0 $0 $0 $0 $0 $0 $0 $0 $0 Letcher $0 $0 $0 $0 $0 $0 $0 $0 $0 Lewis $0 $0 $0 $0 $0 $0 $0 $0 $0 Lincoln $0 $0 $0 $0 $0 $0 $0 $0 $0 Livingston $0 $0 $0 $0 $0 $0 $0 $71,482 $0 Logan $0 $0 $0 $0 $0 $0 $0 $0 $0 Lyon $0 $0 $0 $0 $0 $0 $0 $0 $0 Madison $0 $0 $100,000 $0 $0 $0 $0 $45,942 $0 Magoffin $0 $0 $0 $0 $0 $0 $0 $0 $0 Marion $0 $0 $8,316 $0 $0 $0 $0 $0 $0 Marshall $0 $0 $0 $0 $0 $0 $0 $0 $0 Source: Justice and Public Safety Cabinet, Grants Management Branch

Sourcebook of Criminal Justice Statistics in the Commonwealth
303
Table 12.2a: Grant Awards By County, FY 2010, Continued
County
Community Corrections
Grant
Juvenile Accountability
Block Grant
Justice Assistance
Grant Law Enforcement
Service Fee
U.S. Department of Transportation/ Federal Motor Carrier Safety
Association
National Criminal History
Improvement Project
National Forensic Sciences
Improvement Act
Office of Juvenile Justice and Delinquency
Prevention, Title II and Title V
State Motorcycle Revenue
Martin $0 $0 $0 $0 $0 $0 $0 $0 $0 Mason $0 $0 $7,500 $0 $0 $0 $0 $0 $0 McCracken $0 $0 $0 $24,933 $0 $0 $0 $0 $0 McCreary $0 $0 $0 $0 $0 $0 $0 $0 $0 McLean $0 $0 $0 $0 $0 $0 $0 $0 $0 Meade $0 $0 $0 $0 $0 $0 $0 $0 $0 Menifee $0 $0 $69,372 $0 $0 $0 $0 $0 $0 Mercer $0 $0 $0 $0 $0 $0 $0 $0 $0 Metcalfe $0 $0 $0 $0 $0 $0 $0 $0 $0 Monroe $0 $0 $8,392 $2,862 $0 $0 $0 $0 $0 Montgomery $0 $0 $0 $0 $0 $0 $0 $0 $0 Morgan $0 $0 $127,736 $0 $0 $0 $0 $0 $0 Muhlenberg $0 $0 $0 $0 $0 $0 $0 $0 $0 Nelson $0 $0 $0 $0 $0 $0 $0 $0 $0 Nicholas $0 $0 $0 $0 $0 $0 $0 $0 $0 Ohio $0 $0 $7,055 $0 $0 $0 $0 $0 $0 Oldham $0 $0 $24,051 $0 $0 $0 $0 $22,463 $0 Owen $0 $0 $0 $3,746 $0 $0 $0 $0 $0 Owsley $0 $0 $25,000 $0 $0 $0 $0 $0 $0 Pendleton $0 $0 $0 $0 $0 $0 $0 $0 $0 Perry $0 $0 $0 $0 $0 $0 $0 $0 $0 Pike $0 $0 $122,768 $0 $0 $0 $0 $0 $0 Powell $0 $0 $0 $0 $0 $0 $0 $0 $0 Pulaski $0 $0 $0 $14,486 $0 $0 $0 $0 $0 Robertson $0 $0 $0 $0 $0 $0 $0 $0 $0 Rockcastle $0 $0 $0 $0 $0 $0 $0 $0 $0 Source: Justice and Public Safety Cabinet, Grants Management Branch
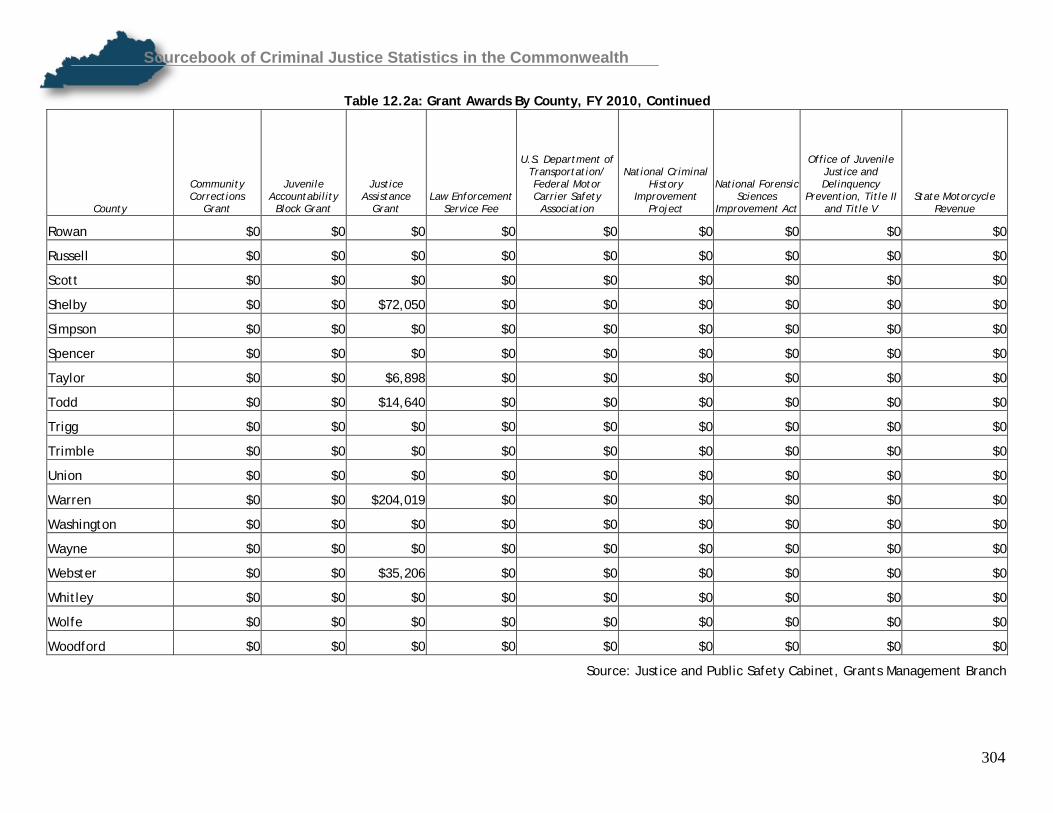
Sourcebook of Criminal Justice Statistics in the Commonwealth
304
Table 12.2a: Grant Awards By County, FY 2010, Continued
County
Community Corrections
Grant
Juvenile Accountability
Block Grant
Justice Assistance
Grant Law Enforcement
Service Fee
U.S. Department of Transportation/ Federal Motor Carrier Safety
Association
National Criminal History
Improvement Project
National Forensic Sciences
Improvement Act
Office of Juvenile Justice and Delinquency
Prevention, Title II and Title V
State Motorcycle Revenue
Rowan $0 $0 $0 $0 $0 $0 $0 $0 $0
Russell $0 $0 $0 $0 $0 $0 $0 $0 $0
Scott $0 $0 $0 $0 $0 $0 $0 $0 $0
Shelby $0 $0 $72,050 $0 $0 $0 $0 $0 $0
Simpson $0 $0 $0 $0 $0 $0 $0 $0 $0
Spencer $0 $0 $0 $0 $0 $0 $0 $0 $0
Taylor $0 $0 $6,898 $0 $0 $0 $0 $0 $0
Todd $0 $0 $14,640 $0 $0 $0 $0 $0 $0
Trigg $0 $0 $0 $0 $0 $0 $0 $0 $0
Trimble $0 $0 $0 $0 $0 $0 $0 $0 $0
Union $0 $0 $0 $0 $0 $0 $0 $0 $0
Warren $0 $0 $204,019 $0 $0 $0 $0 $0 $0
Washington $0 $0 $0 $0 $0 $0 $0 $0 $0
Wayne $0 $0 $0 $0 $0 $0 $0 $0 $0
Webster $0 $0 $35,206 $0 $0 $0 $0 $0 $0
Whitley $0 $0 $0 $0 $0 $0 $0 $0 $0
Wolfe $0 $0 $0 $0 $0 $0 $0 $0 $0
Woodford $0 $0 $0 $0 $0 $0 $0 $0 $0
Source: Justice and Public Safety Cabinet, Grants Management Branch
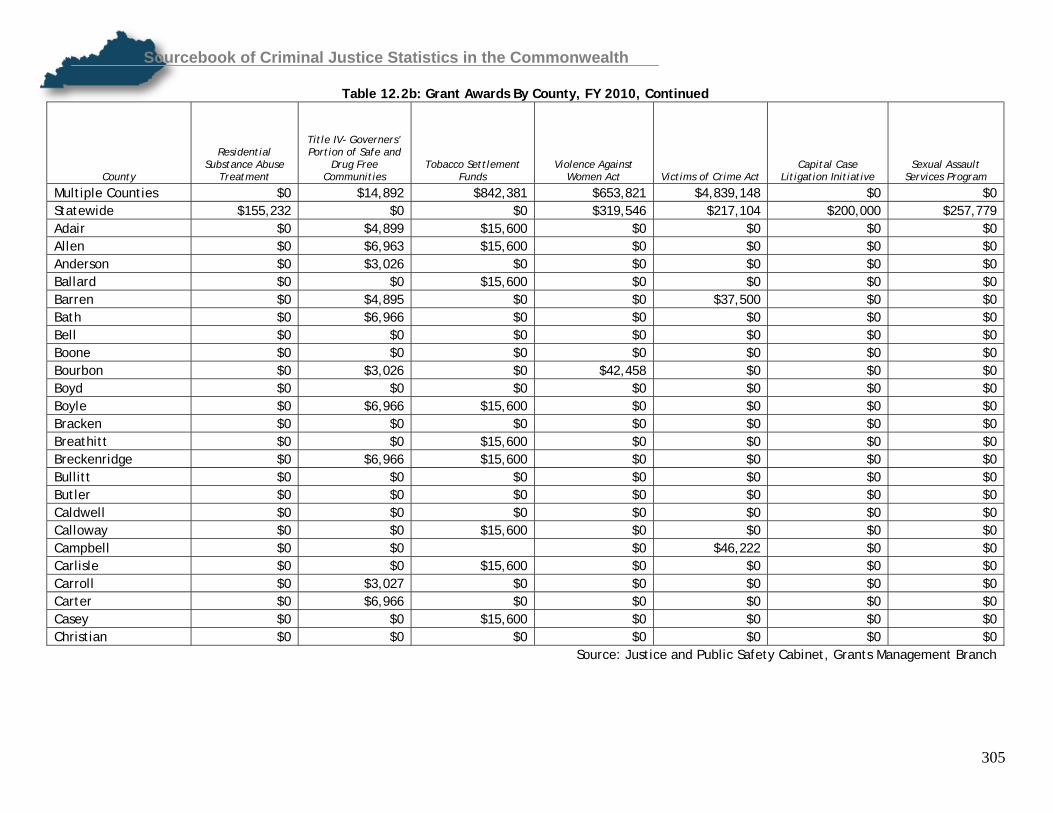
Sourcebook of Criminal Justice Statistics in the Commonwealth
305
Table 12.2b: Grant Awards By County, FY 2010, Continued
County
Residential Substance Abuse
Treatment
Title IV- Governers’ Portion of Safe and
Drug Free Communities
Tobacco Settlement Funds
Violence Against Women Act Victims of Crime Act
Capital Case Litigation Initiative
Sexual Assault Services Program
Multiple Counties $0 $14,892 $842,381 $653,821 $4,839,148 $0 $0 Statewide $155,232 $0 $0 $319,546 $217,104 $200,000 $257,779 Adair $0 $4,899 $15,600 $0 $0 $0 $0 Allen $0 $6,963 $15,600 $0 $0 $0 $0 Anderson $0 $3,026 $0 $0 $0 $0 $0 Ballard $0 $0 $15,600 $0 $0 $0 $0 Barren $0 $4,895 $0 $0 $37,500 $0 $0 Bath $0 $6,966 $0 $0 $0 $0 $0 Bell $0 $0 $0 $0 $0 $0 $0 Boone $0 $0 $0 $0 $0 $0 $0 Bourbon $0 $3,026 $0 $42,458 $0 $0 $0 Boyd $0 $0 $0 $0 $0 $0 $0 Boyle $0 $6,966 $15,600 $0 $0 $0 $0 Bracken $0 $0 $0 $0 $0 $0 $0 Breathitt $0 $0 $15,600 $0 $0 $0 $0 Breckenridge $0 $6,966 $15,600 $0 $0 $0 $0 Bullitt $0 $0 $0 $0 $0 $0 $0 Butler $0 $0 $0 $0 $0 $0 $0 Caldwell $0 $0 $0 $0 $0 $0 $0 Calloway $0 $0 $15,600 $0 $0 $0 $0 Campbell $0 $0 $0 $46,222 $0 $0 Carlisle $0 $0 $15,600 $0 $0 $0 $0 Carroll $0 $3,027 $0 $0 $0 $0 $0 Carter $0 $6,966 $0 $0 $0 $0 $0 Casey $0 $0 $15,600 $0 $0 $0 $0 Christian $0 $0 $0 $0 $0 $0 $0 Source: Justice and Public Safety Cabinet, Grants Management Branch

Sourcebook of Criminal Justice Statistics in the Commonwealth
306
Table 12.2b: Grant Awards By County, FY 2010, Continued
County
Residential Substance Abuse
Treatment
Title IV- Governers’ Portion of Safe and
Drug Free Communities
Tobacco Settlement Funds
Violence Against Women Act Victims of Crime Act
Capital Case Litigation Initiative
Sexual Assault Services Program
Clark $0 $0 $15,600 $32,490 $0 $0 $0 Clay $0 $0 $0 $0 $0 $0 $0 Clinton $0 $0 $15,600 $0 $0 $0 $0 Crittenden $0 $0 $15,600 $0 $0 $0 $0 Cumberland $0 $0 $15,600 $0 $0 $0 $0 Daviess $0 $11,865 $15,600 $0 $28,591 $0 $0 Edmondson $0 $4,898 $15,600 $0 $0 $0 $0 Elliott $0 $6,966 $0 $0 $0 $0 $0 Estill $0 $0 $0 $0 $0 $0 $0 Fayette $0 $3,027 $15,600 $119,700 $222,006 $0 $0 Fleming $0 $0 $0 $39,263 $0 $0 $0 Floyd $0 $0 $0 $0 $0 $0 $0 Franklin $0 $0 $15,600 $0 $60,000 $0 $0 Fulton $0 $0 $0 $0 $0 $0 $0 Gallatin $0 $3,026 $0 $0 $0 $0 $0 Garrard $0 $0 $15,600 $36,908 $0 $0 $0 Grant $0 $6,966 $0 $0 $0 $0 $0 Graves $0 $0 $15,600 $0 $73,000 $0 $0 Grayson $0 $0 $0 $0 $0 $0 $0 Green $0 $0 $15,600 $0 $0 $0 $0 Greenup $0 $0 $0 $0 $0 $0 $0 Hancock $0 $6,966 $15,600 $0 $0 $0 $0 Hardin $0 $6,966 $0 $0 $0 $0 $0 Harlan $0 $0 $0 $0 $0 $0 $0 Harrison $0 $4,899 $0 $0 $0 $0 $0 Hart $0 $6,963 $0 $0 $31,642 $0 $0 Source: Justice and Public Safety Cabinet, Grants Management Branch

Sourcebook of Criminal Justice Statistics in the Commonwealth
307
Table 12.2b: Grant Awards By County, FY 2010, Continued
County
Residential Substance Abuse
Treatment
Title IV- Governers’ Portion of Safe and
Drug Free Communities
Tobacco Settlement Funds
Violence Against Women Act
Victims of Crime Act
Capital Case Litigation Initiative
Sexual Assault Services Program
Henderson $0 $0 $15,600 $0 $0 $0 $0 Henry $0 $4,899 $15,600 $0 $0 $0 $0 Hickman $0 $0 $0 $0 $0 $0 $0 Hopkins $0 $0 $15,600 $26,280 $41,102 $0 $0 Jackson $0 $0 $0 $0 $0 $0 $0 Jefferson $0 $0 $0 $294,325 $319,702 $0 $0 Jessamine $0 $0 $0 $0 $53,000 $0 $0 Johnson $0 $0 $0 $0 $0 $0 $0 Kenton $0 $0 $0 $60,770 $0 $0 $0 Knott $0 $3,027 $15,600 $0 $0 $0 $0 Knox $0 $0 $0 $0 $41,374 $0 $0 Larue $0 $0 $15,600 $0 $0 $0 $0 Laurel $0 $0 $15,600 $0 $45,064 $0 $0 Lawrence $0 $6,966 $15,600 $0 $0 $0 $0 Lee $0 $6,966 $15,600 $0 $0 $0 $0 Leslie $0 $0 $15,600 $0 $0 $0 $0 Letcher $0 $0 $15,600 $0 $0 $0 $0 Lewis $0 $0 $0 $0 $0 $0 $0 Lincoln $0 $3,027 $15,600 $0 $0 $0 $0 Livingston $0 $6,963 $0 $0 $0 $0 $0 Logan $0 $6,963 $0 $0 $0 $0 $0 Lyon $0 $6,966 $0 $0 $0 $0 $0 Madison $0 $3,027 $15,600 $0 $0 $0 $0 Magoffin $0 $0 $15,600 $0 $0 $0 $0 Marion $0 $6,966 $0 $0 $0 $0 $0 Marshall $0 $0 $15,600 $0 $0 $0 $0 Source: Justice and Public Safety Cabinet, Grants Management Branch

Sourcebook of Criminal Justice Statistics in the Commonwealth
308
Table 12.2b: Grant Awards By County, FY 2010, Continued
County
Residential Substance Abuse
Treatment
Title IV- Governers’ Portion of Safe and
Drug Free Communities
Tobacco Settlement Funds
Violence Against Women Act Victims of Crime Act
Capital Case Litigation Initiative
Sexual Assault Services Program
Martin $0 $0 $0 $0 $0 $0 $0 Mason $0 $0 $0 $0 $0 $0 $0 McCracken $0 $4,899 $0 $44,900 $53,875 $0 $0 McCreary $0 $0 $9,730 $0 $0 $0 $0 McLean $0 $3,026 $15,600 $0 $0 $0 $0 Meade $0 $4,899 $0 $0 $0 $0 $0 Menifee $0 $6,966 $15,600 $0 $0 $0 $0 Mercer $0 $3,027 $15,600 $0 $0 $0 $0 Metcalfe $0 $3,025 $0 $0 $0 $0 $0 Monroe $0 $3,025 $15,600 $0 $0 $0 $0 Montgomery $0 $6,966 $15,600 $0 $0 $0 $0 Morgan $0 $6,966 $15,600 $0 $0 $0 $0 Muhlenberg $0 $3,027 $0 $0 $0 $0 $0 Nelson $0 $3,027 $0 $0 $0 $0 $0 Nicholas $0 $3,027 $15,600 $0 $0 $0 $0 Ohio $0 $4,899 $15,600 $0 $0 $0 $0 Oldham $0 $6,966 $0 $0 $0 $0 $0 Owen $0 $3,026 $0 $0 $0 $0 $0 Owsley $0 $6,966 $15,600 $0 $0 $0 $0 Pendleton $0 $6,966 $0 $0 $0 $0 $0 Perry $0 $0 $15,600 $0 $0 $0 $0 Pike $0 $0 $0 $0 $0 $0 $0 Powell $0 $0 $0 $0 $0 $0 $0 Pulaski $0 $0 $15,600 $0 $32,000 $0 $0 Robertson $0 $0 $0 $0 $0 $0 $0 Rockcastle $0 $0 $15,600 $0 $0 $0 $0 Source: Justice and Public Safety Cabinet, Grants Management Branch

Sourcebook of Criminal Justice Statistics in the Commonwealth
309
Table 12.2b: Grant Awards By County, FY 2010, Continued
County
Residential Substance Abuse
Treatment
Title IV- Governers’ Portion of Safe and
Drug Free Communities
Tobacco Settlement Funds
Violence Against Women Act Victims of Crime Act
Capital Case Litigation Initiative
Sexual Assault Services Program
Rowan $0 $6,966 $15,600 $30,172 $0 $0 $0
Russell $0 $4,899 $15,600 $0 $0 $0 $0
Scott $0 $6,966 $15,600 $0 $0 $0 $0
Shelby $0 $4,899 $0 $0 $0 $0 $0
Simpson $0 $6,965 $0 $0 $0 $0 $0
Spencer $0 $6,966 $0 $0 $0 $0 $0
Taylor $0 $6,966 $15,600 $0 $44,133 $0 $0
Todd $0 $6,966 $0 $0 $0 $0 $0
Trigg $0 $6,965 $0 $0 $0 $0 $0
Trimble $0 $0 $0 $0 $0 $0 $0
Union $0 $0 $15,600 $0 $0 $0 $0
Warren $0 $0 $15,600 $0 $34,851 $0 $0
Washington $0 $6,966 $0 $0 $0 $0 $0
Wayne $0 $4,899 $15,600 $0 $0 $0 $0
Webster $0 $4,899 $15,600 $0 $0 $0 $0
Whitley $0 $0 $0 $21,970 $45,000 $0 $0
Wolfe $0 $0 $15,600 $0 $0 $0 $0
Woodford $0 $0 $15,600 $0 $0 $0 $0
Source: Justice and Public Safety Cabinet, Grants Management Branch

Sourcebook of Criminal Justice Statistics in the Commonwealth
310
Appendix A: Description of Existing Criminal Justice Information Systems
CourtNet
Allows easy and expeditious access to criminal and civil cases filed with the Kentucky Court System. Provides court case tracking, consolidates local court information systems (including KY Courts), and serves as the system for accessing statistical data.
eWarrants
Web-based application that provides law enforcement real-time access to arrest warrant information. The system provides a mechanism to create paperless complaints that flow to the judge for review and signature into a warrant then to law enforcement for servicing.
JusticeXchange
Web portal that provides law enforcement and other criminal justice officials instant access to information about offenders held in jails throughout the state and across the country. Based on data collected automatically from local jail management systems, JusticeXchange provides near real-time current and historical information about incarcerated offenders, including biographical information, charges, photographs, and behavioral reports, all accessible through a secure website. Vendor: Appriss.
Juvenile Offender Records Information (JORI)
Case management system that tracks juvenile offenders through the criminal justice system. Includes offenders’ demographic information, charges, work history, education, and treatment. JORI is a Visual Studio.NET application.
Kentucky Offender Management System (KOMS)
Kentucky Offender Management System is a Web-Enabled Integrated Offender Management tool which has replaced outdated individual software applications that were used for managing, processing and tracking Kentucky DOC inmates and Probation & Parole clients. The objectives of KOMS are as follows:
• Maintain a repository of information that applies to all offenders regardless of their current status, such as demographics and criminal history.
• Maintain a repository of information unique to offenders who are under supervision because they are serving probation, parole, etc. Examples of this type of information are supervision fees owed and paid, supervision contacts, and risk/needs assessments.
• Maintain a repository of information unique to offenders who are incarcerated, such as housing, classification, custody level and job assignments.
• Calculate and maintain sentence calculations for all KY offenders regardless of their status. • Maintain a repository of information about facilities, staff, outside organizations, and persons within
those organizations that deal with offenders, regardless of their status. • Store this repository of information in a relational database that is shared across all this functionality. • Provide access to this database through a web browser, such as Microsoft Internet Explorer®, using a
tree-type menu that expands and contracts. • Make the update of this data simple, intuitive, reliable, and secure. • Provide many non-updateable views of this data for everyday use by anyone who is authorized to
access this system via a secure sign on. • Produce operational and management reports and statistics needed by the users.
Kentucky State Police
Core systems described utilize various vendor proprietary technology, in addition to SQL, ORACLE, VB, and FILENET.
• Automated Fingerprint Identification System (AFIS) Statewide system of Livescan devices in each local detention center, state prison facilities, juvenile detention centers and commercial drivers license-HazMat testing sites, tied into centralized AFIS system. Provides for the capture, storage, and search of fingerprint information, and transmission to FBI-IAFIS system. Vendor: Motorola.

Sourcebook of Criminal Justice Statistics in the Commonwealth
311
• Computer Aided Dispatch (CAD)
Utilized by 17 KSP Posts/HQ Dispatch Centers to provide call tracking, emergency medical dispatch, call response, etc., in addition to providing required GIS mapping of land line and mobile callers. Vendor: Interact.
• Computerized Criminal History System (CCH) State criminal history repository for fingerprint supported arrests and supporting participation in Triple
I. Includes utilization of XML rapsheet. Vendor: SAIC. • Kentucky’s Open Portal Solution (KYOPS)
Serves as the statewide law enforcement system for the electronic/hard copy capture, quality control, transmission, storage and retrieval of the following law enforcement report types: traffic collision, crime, uniform citation, courtesy warning, call response, and field information reports which are fed directly to the state’s Intelligence Fusion Center. Features of the electronic reporting component include real time submission of reports, GPS coordinates collection, both integrated crime scene and collision investigation diagramming software and all modules support the utilization of 2D bar code scanners for importing driver’s license data. The system also features a statewide Master Name Index and Master Location Index, utilizing all mentioned data sources. Access to submitted records is provided through a secure web portal, with various “canned” reports available for statistical analysis of crime and collision data, as well as the ability to do custom inquiries across the various data sources for crime/collision analysis, planning and resource allocation. Historical Crime mapping and Collision mapping are also accessible through the web portal. Vendor: IDMS.
• KyWINS Messenger Open source Instant Messaging solution customized for usage by public safety personnel operating on
wireless mobile data system. Provides uniform data/IM interoperability to public safety personnel, across boundaries, agencies and disciplines, free of charge. Also allows communication back to PC based personnel in traditional wired settings. Currently in use for police officers, fire/EMS personnel, and the state Office of Homeland Security, among others. Vendor: Jabber-Jive Software.
• Law Enforcement Information Network of Kentucky (LINK) Serves as the primary law enforcement communications network providing access to NCIC and NLETS.
Also houses all state “hot” files, to include EPO/DVO, wanted, missing persons, sex offenders, etc. Vendor: CPI.
• Mobile Data Computer System (MDCS) Statewide system which encompasses over 125 tower sites and base stations all networked to three
integrated Internet Protocol Network Controllers, providing seamless Mobile Data access to all law enforcement agencies in the state, with no ongoing monthly charge for airtime usage. This access allows agencies to access both state level (LINK) and federal (NCIC) data from their cars, in addition to providing silent dispatch, AVL other features, and instant messaging, depending upon the software utilized by the agency. Agencies utilizing the state standard mobile client software, BIO-key, may utilize the state provided shared mobile message switch, thereby eliminating the need to purchase their own, and giving them access to all agencies/users, utilizing the same platform. Vendor: InterAct.
• Sex Offender Registry (SOR) Serves as the state repository of registered sex offender information, including public access website,
listing all registered offenders. Linked to the National Public Sex Offender registry system. Vendor: CPI. KY Courts
County specific stand-alone electronic case management system that tracks all information related to court cases. Victim Information and Network Everyday (VINE)
The automated notification system that alerts victims about a change in the custody status of their offender. Internet browser front end, SQL server database. Vendor: Appriss.

Sourcebook of Criminal Justice Statistics in the Commonwealth
312
Appendix B: Part I and Part II Offenses
Part I Offenses Murder: Murder/homicide is the willful (non-negligent) killing of one human being by another or the killing of another person through gross negligence. Deaths caused by negligence, attempts to kill, assaults to kill, suicides, and accidental deaths and deaths of persons due to their own negligence, accidental deaths not resulting from gross negligence, and traffic fatalities are excluded. Rape: Rape is defined as the carnal knowledge of a person, forcible or otherwise, against the person’s will. Rapes by force and attempts to rape, regardless of the age of the victim, are included. Excluded are rapes where the victim is under the age of consent and no force is used. Robbery: Robbery is the taking or attempting to take anything of value from the care, custody, or control of a person or persons by force or threat of force or violence and/or by putting the victim in fear. Aggravated Assault: Assault is the unlawful attack by one person upon another for the purpose of inflicting severe or aggravated bodily injury. This type of assault usually is accompanied by the use of a weapon or by means likely to produce death or great bodily harm. All assault attempts where serious injury would have been likely to occur are included. Assaults which do not include the use of a dangerous weapon and in which there was no serious or aggravated injury are excluded. These simple assaults are counted as Part II crimes. Burglary: Burglary is unlawful entering or remaining in a building with the intent to commit a crime. This includes entries where force of any kind is used to gain entrance, entries where no force was used (an unlocked door or by concealment), and attempts to enter forcibly (even though entry was not actually gained). Larceny-theft: Larceny-theft is the unlawful taking, carrying, leading, or riding away of property from the possession or constructive possession of another. Examples are thefts of bicycles, motor vehicle parts and accessories, shoplifting, pocket-picking, or the stealing of any property or article that is not taken by force and violence or by fraud. Attempted larcenies are included. Embezzlement, confidence games, forgery, check fraud, etc., are excluded. Auto Theft: Auto theft includes all thefts and attempted thefts of motor vehicles. Motorboats, construction equipment, airplanes, and farming equipment are specifically excluded from this category. Arson: Arson includes any willful or malicious burning or attempt to burn, with or without intent to defraud, a residence, public building, motor vehicle or aircraft, personal property of another, etc. Only fires determined to have been willfully or maliciously set are classified as arson. Source: Federal Bureau of Investigation’s Uniform Crime Reporting Program

Sourcebook of Criminal Justice Statistics in the Commonwealth
313
Part II Offenses Part II Offenses consist of all other offenses, with the exception of traffic violations. They generally include the following:
• Manslaughter by Negligence • Other Assaults • Arson • Forgery and Counterfeiting • Fraud • Embezzlement • Stolen Property: Buying, Receiving, Possession • Vandalism • Weapons: Carrying, Possession • Prostitution and Commercialized Vice • Sex Offenses • Narcotic Drug Laws • Gambling • Offenses Against Family • Driving Under the Influence • Liquor Laws • Drunkenness • Disorderly Conduct • All Other Offenses (except traffic) • Curfew and Loitering Laws • Runaways
Source: Federal Bureau of Investigation’s Uniform Crime Reporting Program

Sourcebook of Criminal Justice Statistics in the Commonwealth
314
Appendix C: Kentucky Administrative Office of the Courts Data Limitations The Kentucky Administrative Office of the Courts provided the Kentucky Statistical Analysis Center with the following detailed information on the limitations of the data presented in the 2010 Sourcebook of Criminal Justice Statistics. Data obtained from the KYCourts/CourtNet database presented in Sections VI, VII, XI is subject to the following limitations: The data obtained from KYCourts/CourtNet database is aggregate data that can be filtered based upon multiple features. These features include the frequency of cases filed, cases disposed, cases convicted, and some sentencing information. Frequencies can be obtained by referring to a case filing date, case disposition, charge filing date, or charge disposition date. The data can be broken down as a statewide figure or on a county by county basis. Some cases may have multiple charges, which would result in multiple dispositions as dispositions are by charge and not by case; this would also affect the filing and disposition dates. Charge counts may include original and amended charges; this is where the distinct count is important as it will only allow the case to be counted once despite multiple charges or amendments to charges. Additionally, some individuals may have multiple cases; therefore, distinct case counts cannot be inferred as a distinct count of individuals. When examining case disposition data all disposition types will be included. However, when examining conviction data only those cases that include a disposition type that is indicative of guilt will be included. A case may consist of one or more charges; however, for a case to be considered a conviction, only one charge within the case must be guilty. Dispositions that are indicative of guilt include: guilty, guilty – multiple counts, guilty – sealed sentence, and/or pre-payable citation – paid. There are also three disposition types that are unique to juvenile cases which are also considered a conviction; those are Other, Cabinet of Human Resources (CHR), and Department of Juvenile Justice (DJJ). Dispositions in a case are based upon individual charges, since some cases may have multiple charges there can be multiple dispositions. An example would be to have a case with three charges, for which one charge was given a disposition of commitment of juvenile to DJJ (Department of Juvenile Justice), while the other two charges were handled via an informal judgment. Therefore, the number of dispositions will be greater than the number of cases. Some dispositions, such as amended, will cause the case to appear in multiple categories of disposition, jurisdiction, and/or charge. In instances where a case is amended up or indicted from District Court to Circuit Court the case number will change. Therefore, the case would be counted twice, once under each court type. Nevertheless, within each court type, a distinct count of cases is provided that will count the case only once per disposition type, allowing for elimination of duplication. Sentence information is much like dispositions; sentences are based upon the charge not the case. Since a case may contain multiple charges, and multiple dispositions, there may also be multiple sentences. These sentences may run consecutively to each other or they may run concurrent to each other. The length of an individual’s sentence is broken down into months; due to each charge having its own sentence this data is presented as a cumulative figure and does not discern between those sentences that are consecutive versus concurrent. The sentence information provided is merely cumulative sentenced time; additionally, those sentencing conditions of “probated/conditionally discharged/suspended” are also presented as cumulative time. There is a check box on the sentence screen to denote whether the time is concurrent and/or consecutive to other charges/cases, however, AOC does not capture which charges/case that it is concurrent and/or consecutive to. For juvenile cases that are given diversion; the original disposition would be diversion; however, if the juvenile fails to complete the diversion a new disposition is entered of guilty. The original disposition should be removed from the sentence screen and the new disposition entered; however, there may be some cases in which this is not done. Similar scenarios can occur in cases against adults as well. When an individual is convicted and given a sentence of prison but then given a diversion program and the sentence probated in lieu of actually having to serve time, two separate scenarios can occur. If the diversion is successfully completed the case is no longer counted in the frequency of convictions; however, the sentence of prison is never removed from the KYCourts/CourtNet database and is, therefore, still counted in the prison frequency. When this happens, the cases with a sentence of prison can outnumber the cases

Sourcebook of Criminal Justice Statistics in the Commonwealth
315
convicted and cause the prison disposition rate to be reflected as over 100 percent. If the diversion is not completed, the disposition in the case is amended to reflect a disposition of guilty and the sentencing information remains unchanged. Additionally, some jail and prison terms may have some or all of the term suspended. In that event a defendant is granted shock probation that is then tracked in the KYCourts/CourtNet data base through the use of additional UOR codes. In the event that a defendant violates the terms of their probation, a new sentence is entered that is then tied to the new offense of probation violation. A small percentage of offenders each year are ordered by the court to attend Alcohol & Drug Education (ADE) or other types of treatment, with this frequency continuing to decline with the passing of each calendar year. Court of Appeals data is obtained from the appellate Court and is not housed at the Administrative Office of the Courts. Appeals Court data is current as of March 31, 2012. Data obtained from the PRIM (Pretrial Release Information Management) System presented in Section V of the Sourcebook is subject to the following limitations: The data contained herein only applies to pretrial defendants that have not been sentenced and does not include those that are serving a jail sentence or awaiting transport from the Kentucky Department of Corrections (DOC). Therefore, when comparing the frequency of cases that are attended by pretrial officers to the frequency of cases filed in the KYCourts/Courtnet database, the frequency of cases in pretrial will be smaller in proportion. Some individuals who go to jail are released prior to being seen by a pretrial officer; the reasons for their release can be widely varied. There are four classifications of felony (A, B, C, & D) and two classifications of misdemeanor (A & B); whereas criminal violations and traffic violations do not have a classification breakdown and are listed only as an X under either ‘other’ or ‘violation’. Both felony and misdemeanor classifications have an ‘other’ category. A few outliers exist in both the felony and misdemeanor offenses, with a few individuals classification being listed as X. This can occur in felony cases for a few reasons; the first is if the individual is a persistent felony offender (PFO), if an obsolete offense code was utilized, if it was a probation violation, or a contempt of court charge. In the case of a PFO or a probation violation these are normally classified as class C felony; whether it appears in the database as a class C or a class X is dependent upon either how the pretrial officer entered it or how the clerk entered the case into the KYCourts database. For misdemeanors that are classified as an X those are usually due to the offense being a local ordinance, a contempt of court charge, or a probation violation. In the event that it is a probation violation it should actually be listed as a class A misdemeanor and has simply been incorrectly coded. Data is limited to only those counties that have a jail; some neighboring counties utilize the same jail facility in one central location such as Boyle and Mercer Counties. Mercer County does not have its own jail therefore those who offend in Mercer County are taken to the Boyle County Detention Center. Other counties around the state work in similar fashion. Therefore, for pretrial purposes individuals are listed based upon the holding county and not the county in which they were charged. Pretrial officers work to determine a defendant’s risk level. These levels are low, moderate, or high, and are determined using a validated objective risk assessment that measures both flight and anticipated criminal conduct. There are some cases in which the individual was ineligible or not verified; this is determined on a case by case basis. For calendar year 2010 pretrial services determined a public safety rate of 90%. This was determined by defendants who did not get arrested or cited for a new criminal offense while on pretrial release. Data obtained from the Court Designated Worker Case Management System (CDWCMS) presented in Section X is subject to the following limitations: The CDWCMS system was developed to ensure the court designated worker’s (CDW) job was conducted more efficiently by allowing them to track and monitor juvenile complaints and diversion agreements. Data obtained from the CDWCMS system is broken down to list the number of charges, the number of referrals, and a distinct count of juveniles. An individual can have multiple charges within one referral plus an individual can also have multiple referrals. It is important to understand that some of the cases that were filed or closed during one calendar year (CY) may have

Sourcebook of Criminal Justice Statistics in the Commonwealth
316
originated during the previous calendar year; and, there are also some cases that have been filed during the present calendar year that may not be closed until sometime during the following calendar year. Due to the nature of many of the cases there are limitations to the data presented here as there is no clear way to know where potential overlap may occur which may cause inflation to the frequencies. Distinct Counts of referrals and juveniles are provided to counter any potential inflation of the frequencies. All juvenile complaints, including status offenses, are referred to the local Court Designated Workers’ (CDW) office. In general a referral is closed by the CDW as four categories: formal court, informal diversions, dismissals, and other. Within the formal court category there are four subfields: county attorney requested, judge requested, CDW referred (complaint was ineligible for diversion), and court generated charges. The court generated charges are a charge before the court that has not been processed via the CDW office, which typically means that the charge is contempt of court or a probation violation. Under informal diversions there is successful and unsuccessful; similarly dismissals also contain only two subfields: county attorney requested and no probable cause. Those classified as child requested formal and child failed to appear at preliminary interview will typically make their way into a formal court procedure.
Sourcebook of Criminal Justice Statistics in the Commonwealth
317
This project was supported by Grant Number 2010‐BJ‐CX‐K023, awarded by the Bureau of Justice Statistics, U.S. Department of Justice. The opinions, findings, conclusions, and recommendations expressed in this publication are those of the author(s) and do not necessarily reflect the views of the Bureau of Justice Statistics, U.S. Department of Justice, or the Kentucky Justice and Public Safety Cabinet.