source, transport, and partitioning of metals between ... states department of interior u.s....
TRANSCRIPT

UNITED STATES DEPARTMENT OF INTERIOR U.S. GEOLOGICAL SURVEY
Source, Transport, and Partitioning of Metals between Water,
Colloids, and Bed Sediments of the Animas River, Colorado
by
S.E. Church 1 , BA Kimball2 , D.L Fey1 ,
D.A. Ferderer1 , T.J. Yager3 , and R.B. Vaughn 1
U.S. Geological Survey Open-File Report 97-151
1997
1 U.S. Geological Survey, P.O. Box 25046, MS 973, Federal Center, Denver, CO 802252U.S. Geological Survey, 1745 West 1700 South, Salt Lake City, UT 841043U.S. Geological Survey, P.O. Box 25046, MS 415, Federal Center, Denver, CO 80225
This report is preliminary and has not been reviewed for conformity with U.S. Geological Survey editorial standards. Any use of trade, product, or firm names is for descriptive purposes only and does not imply endorsement by the U.S. government.

Table of Contents
Executive Summary 1Introduction 3
Summary of Acid-Mine Drainage Studies in Other Areas 3Study Objectives 5
The Animas River Watershed 5Previous Geochemical Work 8Field Sampling 10
Water and Colloids 10Stream Sediments 16
Results from Water and Colloid Data 16Synoptic Sampling of Water and Colloids, October 1995 16
Aluminum 16Cadmium 19Copper 19Iron 20Manganese 20Strontium 20Zinc 20Arsenic, Mercury, and Selenium 21
High-flow Sampling of Water and Colloids, Spring, 1996 21Dissolved Versus Colloidal Transport 21
Manganese 26Iron and Aluminum 26Copper 31Zinc 31
Comparison of Metal Loads During Low Flow and Snowmelt Runoff 31Results from the Stream-Sediment Data 34
Mineral Creek Drainage Basin 45Arsenic 45Cobalt 46Copper 46Lead 47Strontium 47Zinc 47Vanadium 47Lead-isotopic Data 47
Cement Creek Drainage Basin 54Arsenic 54Cobalt 54Copper 54Lead 54Strontium 55Zinc 55Vanadium 55Lead-isotopic data 61
Animas River Drainage Basin Upstream from Silverton 61Arsenic 61Cobalt 61Copper 61Lead 62Strontium 62

Zinc 62Vanadium 63Lead-isotopic data 63
Animas River Drainage Basin: Silverton, Colorado to Aztec, New Mexico 70Arsenic 70Cobalt 70Copper 71Lead 71Strontium 71Zinc 71Vanadium 72Lead-isotopic data 72Metal transport from the La Plata Mining District 79Metals from the smelter sites south of Durango 79Urban metal signatures 79Selenium and mercury in bed sediments of the Animas River 80
Undiscovered Mineral Resources in the Silverton Area 80Geochemical Signature of Colloidal Component in Water and Bed Sediments 80Comparison of the 1995 and 1996 Bed-Sediment Data 82Calculation of the Contribution to the Total Amount of Metal in Bed Sediments
from Various Sources 82Differential Sorbtion of Copper and Zinc by Colloids 87
Summary and Conclusions 90References Cited 92Appendix I. Methods used to prepare regional sediment geochemical maps 95Appendix II. Analytical Methods 97 Appendix III. Site Identifications, Field Data, and Major Ion Chemistry from Samples
from the Animas River Basin, 1995-96 102Appendix IV. Metals in Water and Colloids from the Animas River Basin, 1995-96 104Appendix V. HCI-H2O2 Data from Stream-Sediment Samples 106Appendix VI. Total Digestion Data from Stream-Sediment Samples 119Appendix VII. Lead-isotopic Data from Selected Samples 132
List of Figures
Figure 1. Index map of southwest Colorado showing Animas River watershed 4Figure 2. Map of Animas River watershed showing topography and mines and prospects 6Figure 3. Geologic map of the Animas River watershed 7Figure 4. Structural map of the Silverton caldera 9Figure 5. Geochemical map of Animas River watershed showing distribution of calcium 11Figure 6. Geochemical map of Animas River watershed showing distribution of copper 12Figure 7. Geochemical map of Animas River watershed showing distribution of lead 13Figure 8. Geochemical map of Animas River watershed showing distribution of zinc 14Figure 9. Hydrograph of the Animas River below Silverton; Oct. 1, 1994 to Oct. 1, 1996 15 Figure 10. Map of Animas River watershed showing localities of water samples
collected in Oct., 1995 17 Figure 11. Map of Animas River watershed showing localities of sediment samples
collected in Oct., 1995 18 Figure 12. Dissolved and colloidal manganese concentrations from water samples,
Oct., 1995 22 Figure 13. Dissolved and colloidal zinc concentrations from water samples,
Oct., 1995 24 Figure 14. Dissolved and colloidal iron concentrations from water samples,
Oct., 1995 27

Figure 15. Dissolved and colloidal aluminum concentrations from water samples,Oct., 1995 29
Figure 16. Summary diagram of mass transfer of aluminum in mixing zonesdownstream from Mineral and Cement Creeks 32
Figure 17. Summary diagram of mass transfer of iron in mixing zonesdownstream from Mineral and Cement Creeks 33
Figure 18. Comparison of metal loads for aluminum, iron, zinc, cadmium, copperand lead at low flow (Oct., 1995) and high flow (May-June, 1996) 35
Figure 19. Ribbon map showing copper dispersion in Animas River,Cement Creek, and Mineral Creek 42
Figure 20. Ribbon map showing lead dispersion in Animas River,Cement Creek, and Mineral Creek 43
Figure 21. Ribbon map showing zinc dispersion in Animas River,Cement Creek, and Mineral Creek 44
Figure 22. Metal distribution profiles for Mineral Creek 49 Figure 23. Lead-isotope distribution profile for Mineral Creek 53 Figure 24. Metal distribution profiles for Cement Creek 56 Figure 25. Lead-isotope distribution profile for Cement Creek 60 Figure 26. Metal distribution profiles for Animas River upstream from Silverton 65 Figure 27. Lead-isotope distribution profile for Animas River upstream from Silverton 69 Figure 28. Metal distribution profiles for Animas River: Silverton, Colo. to Aztec, New Mexico 74 Figure 29. Lead-isotope distribution profile for Animas River: Silverton to Aztec 78 Figure 30. Distribution profiles for selenium and mercury, Animas River 81 Figure 31. Downstream variation of the iron, aluminum, and copper to zinc ratios in
colloids and bed sediments in the Animas River: Silverton to Aztec 83 Figure 32. Predicted sorbtion curves for metals by iron-hydroxides as a function of pH 84 Figure 33. Lead-isotopic model for dilution of metals derived from Animas River watershed 88 Figure 34. Normalized labile copper, lead, and zinc concentrations in bed sediments,
Animas River 90 Figure A-ll. Diagram showing process procedures for water and colloid samples 98
List of Tables
Table 1. Water quality standards for metals, Colorado 19 Table 2. Lead-isotopic data from mineral deposits and mill sites, Silverton area 46 Table 3. Semi-quantitative emission spectrographic data from heavy-mineral separates,
Cunningham Creek and Animas River upstream from Howardsville 63 Table 4. Lead-isotope parameters for calculation of dilution of the metals in the
Animas River from Silverton 87
List of Tables in Appendices
Table A-ll. Replicate analytical results from NIST standard reference materials 99 Table A-lll. Site identifications, field data, and major ion chemistry for water from the
Animas River and major tributaries, 1995-1996 102 Table A-IV. Metals in water and colloids in the Animas River and tributaries, 1995-1996 104 Table A-V.1. Partial digestion (2M HCI-1 %H2O2) data from sediments and other samples,
Animas River watershed, Oct., 1995 106 Table A-V.2. Partial digestion (2M HCI-1 %H2O2) data from sediments and other samples,
Animas River watershed, Aug. and Oct., 1996 116 Table A-VI.1. Total digestion data from sediments and other samples, Animas River
watershed, Oct., 1995 119 Table A-VI.2. Total digestion data from sediments and other samples, Animas River
watershed, Aug. and Oct., 1996 128 Table A-VII. Lead-isotopic data from sediments and other samples, Animas River
watershed, Oct., 1995 132
iii

EXECUTIVE SUMMARY
Reconnaissance geochemical data for water, colloid, and bed sediment samples, collected primarily during low flow in 1995, provide a synoptic view of the sources, movement and partitioning of metals in the Animas River watershed. The source of most of the iron, aluminum, copper, lead, zinc, arsenic, and cadmium in the Animas River is in the Animas River drainage basin upstream from site A-72 at Silverton, Colo.
In the Animas River watershed upstream from Silverton, Cement Creek has the lowest pH (3.89) at low flow and carries most of its metal load in the aqueous phase. Mineral Creek has a pH of 6.35 at low flow and carries most of its metal load in the colloidal phase. Most of the metals in the Animas River above the confluence with Cement Creek reside in the colloidal component of the bed sediments. Downstream from the Animas River-Cement Creek confluence in the mixing zone, most metals from the dissolved load of Cement Creek are partitioned to the colloidal phase. Along upper Mineral Creek, and upstream from the Animas River-Cement Creek confluence, colloids aggregate, settle, and become an integral component of the bed sediments where they are stored until high-flow (snowmelt) runoff.
At site A-72 during low flow, dissolved zinc and aluminum concentrations exceed the acute aquatic-life standard whereas the concentrations of the other metals do not exceed the chronic aquatic-life standard. Dissolved manganese concentrations are just below the chronic aquatic-life standard.
Colloidal concentrations of copper, iron, zinc, and aluminum, if bioavailable upon ingestion as suggested by recent research, could exceed one or both of the aquatic-life standards at site A-72. There is a substantial loss of iron and aluminum colloids and their sorbed metal loads to the bed sediments in the Animas Canyon reach between Silverton and Bakers Bridge during low flow.
More than 50 percent of the zinc in the bed sediments from Mineral Creek, 75 percent of the zinc in the bed sediments from Cement Creek, and 50 percent of the zinc in the bed sediments above the Animas River-Cement Creek confluence is in the form of sphalerite. Zinc concentrations in sphalerite from the bed sediments of the Animas River above the confluence with Cement Creek are about 1,000 ppm, from Cement Creek about 800 ppm, and from Mineral Creek about 400 ppm.
Three water and colloid samples collected at high flow during snowmelt runoff (high flow) indicate that dissolved zinc concentrations far exceed the acute aquatic-life standard at site A-72 and are still twice that level as far downstream as Bondad. Metals stored in the colloidal phase of the bed load are moved downstream during high flow as is indicated by the high colloidal iron, aluminum, copper, lead, and zinc concentrations. Any remedial action that removes acidic metal-bearing discharges into Mineral and Cement Creeks and the upper Animas River or its tributaries will likely lessen the cumulative effect of metal toxicity on aquatic life.
Lead-isotopic data from bed-sediment samples collected at low flow indicate that Mineral Creek contributes five to 10 percent of the total mass of metals in the bed sediments, Cement Creek contributes up to 40 percent of the metals in the bed sediments, and the bed sediments upstream from the Animas River- Cement Creek confluence contribute 50 to 60 percent of the metals at site A-72.
Lead-isotopic data from bed-sediment samples collected downstream from site A-72 document the dilution of the metals derived from the Animas River Basin above Silverton by metal contributions from the tributaries. At Durango 75 km downstream, about 80 percent of the metals in the colloidal component of the bed sediments were derived from the Animas River watershed above Silverton whereas at Aztec, New Mexico, 57 percent of the metals were derived from this upstream source.
No measurable contamination from the La Plata mining district at the headwaters of Junction Creek was found in the Animas River.

Selenium concentrations in the bed sediments of the Animas River are elevated near the confluence of Lightner Creek in Durango, Colo. These elevated concentrations are related directly to the outcrop pattern of the Mancos Shale.
Modeling of the sediment transport using the lead-isotopic data and the normalized labile copper, lead, and zinc data from bed sediments of the Animas River indicates some differential transport of the colloidal phase of the bed sediments. The chemical data from the waters and colloids indicate sorption of dissolved metals as a function of pH which changes with downstream distance where it is stored until remobilized during high-flow events. This colloidal component of the bed sediments dominates the bed sediment chemistry.
Aggregation and transport of the colloidal component to the bed sediments reduces pore space between detrital grains in the bed, introduces toxic levels of metals into the food chain habitat for aquatic invertebrates, and if bioavailable to fish when ingested as suggested by recent research, may be a major cause of the deterioration of fish habitats in the stream bed.
From lead-isotopic data, we have identified five or more discrete mineralization styles in the Animas River watershed above Silverton. Using these data, we can calculate the relative contribution of metals from each of these mineralization styles and the mines that exploited them to Mineral and Cement Creeks and the Animas River above its confluence with Cement Creek. The dominant lead-isotopic signature in the bed sediments of both Cement Creek and the upper Animas River is from the vein-type ore mineralization characteristic of the Eureka graben.
Lead-isotopic data from stream sediments from Browns Gulch on the west side of the Mineral Creek drainage matches the vein-type ore in the Eureka district. These data suggest that vein-type ore from the Eureka district extends to the west of Cement Creek. The surface expression of this structure may be obscured by the hydrothermal alteration associated with Red Mountain No. 3.

INTRODUCTIONThe U.S. Geological Survey Abandoned Mine Lands Initiative (USGS-AML) is focused on the evaluation
of the effect of past mining practices on the water quality and the riparian and aquatic habitats of impacted stream reaches downstream from historic mining districts located primarily on federal lands. This problem is manifest in the eleven western states (i.e., west of 102°) where the majority of hardrock mines having past production are located on federal lands. Ferderer (1996) has developed a prioritization ranking of watersheds affected by historic mining activities on the basis of the number of past-producing metal mines per watershed. Using this mine census data as a first filter on the density of past-producing hardrock mines, he found that 18 watersheds contain more than 300 hardrock mines having past production, 20 watersheds contain 201-300 past producing hardrock mines, and 74 watersheds contain 101-200 past producing hardrock mines. In areas of temperate climate and moderate to heavy precipitation, the effect of rapid chemical and physical weathering of sulfides exposed on mine waste dumps and drainage from mines has resulted in elevated metal concentrations in the streams and bed sediments. The result of these processes is an unquantified impact on the quality of the water and the aquatic and riparian habitats that may limit their recreational resource value. One of the confounding factors in these studies is the determination of the component of metals derived from the hydrothermally altered but unmined portions of these drainage basins (Runnells and others, 1992). Several of these watersheds have been or are being actively studied to evaluate the effects of acid mine drainage (AMD) and acid rock drainage (ARD) on the near surface environment. The Animas River watershed in southwestern Colorado (fig. 1) contains a large number (>300) of past-producing metal mines that have affected the watershed. Beginning in October 1997, the USGS began a collaborative study of these impacts under the USGS-AML Initiative (Buxton and others, 1997).
The initial environmental characterization of the main tributary drainages in the Animas River watershed upstream from Silverton began in 1991 under the auspices of the Colorado Dept. of Public Health and Environment (J.R. Owen, written commun., 1997). These initial studies showed both seasonal and regional variability in surface water chemistry, and noted that, upstream from Silverton, many streams are generally acidic although pH is quite variable, depending on the geologic setting, precipitation, and amount of material that mining has exposed. Rocks in many tributary streams are coated with aluminum- and iron-hydroxides indicating the movement of metals under acidic conditions. Aquatic habitats in the Animas River above Bakers Bridge are known to be impaired.
The present study was funded under a cooperative program between the U.S. Geological Survey, the Bureau of Reclamation, the City of Durango, the Southern Ute Indian Tribe, and the Southwest Water Conservation District in October 1995. The Animas River Stakeholders Group (ARSG), a group of local concerned citizens in the basin from Silverton and Durango, the Colorado Dept. of Public Health and Environment, and the U.S. Environmental Protection Agency (EPA) have cooperated in providing data, consultation, and advice on local conditions within the watershed. Sunnyside Gold allowed access to their property to collect samples as did several property owners downstream from the Animas Canyon. The Southern Ute Indian Tribe provided guided access to our sampling sites on the Southern Ute Indian Reservation. This work was greatly enhanced by consultations with our colleagues on the project and individual members of the ARSG. W.G. Wright was particularly helpful in arranging field access and assisting S.E. Church in the field during October 1995.
Summary of Acid-Mine Drainage Studies in other AreasAcidic metal-rich waters from mine drainage, waste rock, and mill tailings from inactive and abandoned
mines, and naturally acidic waters from hydrothermally altered areas often enter stream reaches in upland watersheds and impact water quality. When these waters mix with less-acidic water and bed sediments from unmineralized areas, the physical and chemical conditions change during downstream transport. Metals are partitioned between water, colloids, and bed sediments through processes such as sorption, mineral precipitation, photoreduction, and biological interaction. Through these processes, all or portions of the metals are separated from water and are carried as suspended colloids or sediments, which ultimately settle to become a part of the bed sediment or become entrapped by microbes (algae). Thus, these metals may become available to aquatic organisms and larger forms of aquatic life in the food chain during transport downstream.
Figure 1. Index map of southwestern Colorado showing the area of the Animas River watershed. The state and county boundaries are from USGS (1989); watershed boundaries are from USGS (1982); and the towns, railroads, and roads are from ESRI (1992).

ANIMAS RIVER WATERSHED STUDY SOUTHWESTERN COLORADO
COUNTY AND WATERSHED INDEX
New Mexico
ExplanationEZB Cowty LiflME3 WaknbMl BoundnwHE] TOWM

One of the most important geochemical processes as mine drainage waters mix with water downstream is the dilution and neutralization of the acid, and subsequent formation of iron colloids (Runnells and Rampe, 1989, Kimball and others, 1995). The iron colloids precipitate in the water where they form larger aggregates and settle from the water to the bed sediment, coating the rocks in the stream. Ochre-colored stream beds are characteristic of many mine-affected streams as well as mineralized areas that have not been disturbed by mining (Runnells and others, 1992). These iron colloids are solids with effective diameters from less than one nanometer (10'9 meters) when they first precipitate to greater than a few microns (10"6 meters) after they aggregate (Ranville and others, 1989; van Olphen, 1977). Hydrous iron-oxide colloids have extensive surface areas that sorb and enhance the partitioning of toxic metals (Jenne, 1977; Morel and Gschwend, 1987; Stumm and Morgan, 1996). The sub-micron particles have a strong tendency to aggregate which creates a continuum of particle sizes from less than 0.001 micrometers (urn) to greater than one urn (Buffle and Leppard, 1995a; 1995b). These particles may be carried downstream as suspended colloidal particles. They also may precipitate on or bind to the surfaces of rocks and sand grains in the stream bed where they form a chemical sediment component of the bed sediments.
Study ObjectivesThe objectives of this study in the Animas River watershed are:
1) to identify the source areas of large metal loads in the Animas River watershed,2) to determine the extent and time frames of metal movement downstream in the Animas River basin,3) to measure the dispersion of metals in the river sediments downstream from these major metal sources,4) to determine the partitioning of metals among water, colloids, and bed sediments, and5) to document the fractionation of the metals between the dissolved phase, a suspended colloidal phase,
and bed sediment and coatings.
THE ANIMAS RIVER WATERSHEDThe Animas River drainage basin (fig. 1) has its headwaters in the mountainous terrain above Silverton,
Colo. and drains south into the San Juan River in northern New Mexico. Elevations range from more than 14,000 ft. at the headwaters to less than 6,000 ft. at the confluence with the San Juan River near Aztec, New Mexico (fig. 2). The major population center in the basin is the city of Durango, Colo. The geology exposed at the surface and underlying the basin is varied. Precambrian rocks crop out in the eastern part of the drainage basin in the Animas Canyon area south of Silverton (fig. 3) forming the high rugged mountainous area of the Animas Canyon. Paleozoic and Mesozoic sedimentary rocks crop out in the southern part of the drainage basin. The headwaters of the Animas River watershed are underlain by the Tertiary igneous intrusive and volcanic rocks that formed as a result of a late Tertiary age episode of andesitic to dacitic volcanism followed by a later episode of ash-flows, lava flows and intrusions of dacitic to rhyolitic composition (Lipman and others, 1976). During this later episode of volcanism, the Silverton caldera formed. Pervasive and intense hydrothermal alteration and mineralization events postdate the formation of the Silverton caldera by several million years (Casadevall and Ohmoto, 1977). This area of the Animas River watershed above Silverton has been extensively fractured, hydrothermally altered, and mineralized by Miocene hydrothermal activity.
Gold deposits were first discovered in 1871 on Arrastra Creek above Silverton by following the occurrence of placer gold upstream. Following the signing of a treaty with the Ute Indians in 1873, between 1,000 and 1,500 mining claims were staked in the Animas River watershed upstream from Silverton. Mining activity spread rapidly throughout the area. The chimney deposits (mineralized breccia pipes, see fig. 4) at the head of Mineral Creek were discovered in 1881. The railroad was brought up from Durango in 1882 providing cheap transportation to the smelters in Durango (Sloan and Skowronski, 1975). Mining continued in the Animas River watershed at various levels of activity until 1991 when the Sunnyside Mine was closed.
Figure 2. Map of the Animas River watershed showing elevation and locations of mines and prospects in the USGS MRDS, RASS, and PLUTO data bases (Ryder, 1994) and the USBM MAS data base (Babitzke and others, 1982). The digital elevation model data are from USGS (1990), towns, railroads, and roads are from ESRI (1992), and the hydrology data are from USGS (1989).
Figure 3. Geologic map of the Animas River watershed area (after Tweto, 1979) The digital geology is from Green (1992); hydrology data are from USGS (1989); and the towns, railroads, and roads are from ESRI (1992).

ANIMAS RIVER WATERSHED STUDY SOUTHWESTERN COLORADO
MRDS, RASS, PLUTOAND MAS/MILS SITES
WITH ELEVATIONS
-N-
I
ExplanationHH C*ZI MRDS Site* CH > 13,000 ft
E*H RASS Site* Hi 12,000 - 13,000 ft.
DEI PLUTO SitM CD 11,000 - 12,000 ft.
DEI MASJMILS Sfee» ! 10,000 - 11.000 ft.
I LikM SUTJ 9,000 - 10.000 ft.
E3 Mqor Hhwrt [Hi «,000 - 9,000 ft
EEE Mqor Rood* Hi 7,000 - 8,000 ft
EEB BalroMb d! 6,000 - 7,000 ft.
E3 Towiuhip LinM dH < 6,000 ft.
I * I M^jor Town*
»>» w t wTto >fl~* A ill III)K«» «cji-imii «^|. . ..- ^ .£ .
10 15 20 25 MilM
5 0 5 10 15 20_25 KUomvun

ANIMAS RIVER WATERSHED STUDY SOUTHWESTERN COLORADO
GEOLOGY
\
5 0 S 10 IS 20 25 KilomeUn

The extent of mining activity within various portions of the Animas River watershed can be estimated from the distribution of mining claims and Minerals Availability System (MAS) records (Babitzke and others, 1982) within the basin. In figure 2, plots of the geochemical data from the USGS mines data bases (Ryder, 1994) are indicative of the density of mines and prospects in the Animas River drainage basin above Silverton, Colo. Mineral deposits in several major mining districts have recorded production. Deposits in the Red Mountain district in the northwestern part of the Silverton caldera, the Eureka district in the Eureka graben within the Silverton caldera, and the South Silverton district along the southern margin of the Silverton caldera east of the town of Silverton (see fig. 4; Burbank and Luedke, 1968; Leedy, 1971; Casadevall and Ohmoto, 1977) comprised the majority of the mineral production. There are also several porphyry molybdenum deposits discovered by drilling in the Mineral Creek area (oral commun., Tom Casadevall, 1996). Some of the porphyry molybdenum deposits are surrounded by large iron bogs at the surface. Iron bogs are found elsewhere within the basin associated with springs flowing from mineralized fractures, some of which have been studied recently by W.G. Wright (written commun., 1996).
PREVIOUS GEOCHEMICAL WORKSurface water quality studies in the Animas River drainage basin above Silverton were undertaken
beginning in 1991 under the auspices of the CDPHE (J.R. Owen, written commun., 1997). Many streams in the region upstream from Silverton are acidic although the pH is quite variable and zinc is derived from multiple sources within the basin. The iron and aluminum concentrations in these acidic waters is great enough to exceed the solubility product of the various iron and aluminum hydroxides (or aluminum hydroxysulfates, W.G. Wright, written commun., 1997). Precipitation of the iron hydroxide occurs when the pH of the waters is greater than 3.5 and precipitation of aluminum hydroxides occurs when the pH of the waters is greater than 5.5 (Broshears and others, 1996). The rocks in many streams are coated with aluminum- and iron-hydroxides and many of these stream reaches do not support aquatic life (J.R. Owen, written commun., 1997).
Previous reconnaissance exploration stream-sediment geochemical sampling of the watershed had been done in the mid-1970's under the National Uranium Resource Evaluation (NURE) program (Shannon, 1980; Warren and others, 1981). These data were used to evaluate the sources of metals in the small tributary drainage basin (areas of 2-10 km2 or more). These data were of adequate sample density and analytical quality to characterize the geochemical landscape of the Animas River watershed. Geochemical data from small tributary streams from the USGS National Geochemical Data Base (Hoffman and Buttleman, 1994) were used to prepare regional geochemical maps of the Animas River watershed following the procedure outlined by Smith (1994). The details of the computational methods are in appendix I. The preliminary geochemical maps were refined using some of the data presented in this report. Some data points where eliminated from the original data set because the geochemical anomalies that could not be verified. In addition, samples collected along the irrigation ditches were also eliminated because these samples were contaminated by colloidal particles from the Animas River water being used for irrigation. Geochemical maps of four elements, calcium, copper, lead, and zinc, (figs. 5-8, respectively) clearly show how the geology of the Animas River watershed controls the geochemistry of the bed sediments in the Animas River. The map of calcium shows that the volcanic rocks hosting the mineralization in the Silverton area are calcium poor, indicating a lack of carbonate present in the basin. Carbonate species buffer the acid generated by weathering of pyrite in hydrothermally altered zones, mineral deposits, and waste rock piles exposed in the headwaters of the basin. In contrast, streams draining the area underlain by Paleozoic sedimentary rocks (fig. 3) have high calcium concentrations and substantial buffering capability as evidenced by the water chemistry below Cascade Creek as discussed below.
Maps of copper, lead, and zinc show high elemental concentrations in stream sediments collected from the Animas River watershed upstream from Silverton. These maps display the geochemical baseline when the samples were collected in the mid-1970s. The value that geochemists refer to as the crustal abundance value (CAV; Fortescue, 1992) in stream sediments is shown in gray on these three maps. Metal concentra-
Figure 4. Simplified structural map showing the belt of chimney deposits in the Red Mountain district, the Eureka graben in the Eureka mining district, and the South Silverton mining district east of Silverton Colorado (from Leedy, 1971). Stippled areas are outcrops of small rhyolite to quartz latite intrusives. The large hachured mass at the bottom of the figure is the outcrop pattern of the Sultan Mountain quartz monzonite pluton.

38*00' =f
37'55
37*50' -
SILVERTON CAULDRON
107*45 I07»40* 107*35'

tions exceed 20 times crustal abundance values in stream sediments above Silverton. Thus, these maps include any effect that mining might have had on the stream reaches within the mining districts. These maps do not give an indication of the premining background levels of metals in the bed-sediments prior to mining in the vicinity of Silverton.
FIELD SAMPLINGIn order to meet the objectives of the study outlined above, new samples were collected for water,
colloid, and bed-sediment chemistry in the larger tributaries of Cement and Mineral Creeks and the Animas River to evaluate stream reaches where major sources of metal loading might be expected. This suite of samples was also used to supplement and validate the previous geochemical data set. The initial stream sediment and water sampling was conducted during the week of Oct. 16-20,1995 during low-flow conditions. Supplementary sampling of the stream sediments was done during the weeks of Aug. 25, 1996, and Oct. 24, 1996, to evaluate annual and seasonal variability. Additional supplementary water sampling was done during snowmelt runoff the weeks of May 9, May 20, and June 20,1996, to evaluate the dissolved and colloid metal loads under high-flow conditions. A hydrograph showing the stream flow discharge for the period from July 1994 to Oct. 1996 is shown in figure 9. The periods during which water sampling were done are indicated on the hydrograph.
Water and ColloidsThe study in the Animas River basin involved the measurement of selected metals in water, colloids,
and bed-sediment samples from the mainstem of the river and from the major tributaries (fig. 10). The sampling included six sites near Silverton, Colorado, and fourteen sites downstream between Bakers Bridge and Aztec, New Mexico. Stream flow discharge was measured at the time of sample collection, and samples were collected by equal-width integration across the channel (Ward and Harr, 1990). Ultrafiltration was used to separate the "dissolved" metals from the colloidal phase. Analytical procedures are in appendix II and the analytical results are in appendices III-IV.
Figure 5. Geochemical map for calcium (Ca) of the Animas River watershed. Data from the National Geochemical Data Base was supplemented by samples from the major tributary streams during the 1995 sampling to evaluate the contributions of metals from the major tributary drainages in the Animas River watershed. Important tributary streams are labeled for reference; hydrology data are from USGS (1989); and the towns, railroads, and roads are from ESRI (1992).
Figure 6. Geochemical map for copper (Cu) of the Animas River watershed. Data from the National Geochemical Data Base (Hoffman and Buttleman, 1994) was supplemented by samples from the major tributary streams during the 1995 sampling to evaluate the contributions of metals from the major tributary drainages in the Animas River watershed. Important tributary streams are labeled for reference; hydrology data are from USGS (1989); and the towns, railroads, and roads are from ESRI (1992).
Figure 7. Geochemical map for lead (Pb) of the Animas River watershed. Data from the National Geochemical Data Base (Hoffman and Buttleman, 1994) was supplemented by samples from the major tributary streams during the 1995 sampling to evaluate the contributions of metals from the major tributary drainages in the Animas River watershed. Important tributary streams are labeled for reference; hydrology data are from USGS (1989); and the towns, railroads, and roads are from ESRI (1992).
Figure 8. Geochemical map for zinc (Zn) of the Animas River watershed. Data from the National Geochemical Data Base (Hoffman and Buttleman, 1994) was supplemented by samples from the major tributary streams during the 1995 sampling to evaluate the contributions of metals from the major tributary drainages in the Animas River watershed. Important tributary streams are labeled for reference; hydrology data are from USGS (1989); and the towns, railroads, and roads are from ESRI (1992).
Figure 9. Hydrograph of the Animas River showing stream flow discharge from data collected at the gaging station below Silverton (A-72) between Oct. 1, 1994 to Oct. 1, 1996.
10

ANIMAS RIVER WATERSHED STUDY SOUTHWESTERN COLORADO
CALCIUM CONCENTRATION IN STREAM SEDIMENTS
(Concentration in Percent)
Explanation
I -^ Mftjor Road* I I BaitoMb
CHI M^jor Towni I ' I Sample Locrtinot
5 0 Mil**
5 0 $ 10 1$ 20 25 KUom«tav
11

ANIMAS RIVER WATERSHED STUDY SOUTHWESTERN COLORADO
COPPER CONCENTRATION IN STREAM SEDIMENTS
(Concentration in PPM)
rife
Explanation
M^jor Koed* EE3 Raflrowta CUD MAJOT Towoi 1 ' I Sampla Location*
"" "
5 0 5 10
5 0 5 10
15 20 25
15 20 25 KUonwUra
12

ANIMAS RIVER WATERSHED STUDY SOUTHWESTERN COLORADO
LEAD CONCENTRATION IN STREAM SEDIMENTS
(Concentration in PPM)
Explanation
*"<r
15 0 5 10
5 0 5 10
IS 20 25
15 20 25 Kilonwttn
13

ANIMAS RIVER WATERSHED STUDY SOUTHWESTERN COLORADO
ZINC CONCENTRATION IN STREAM SEDIMENTS
(Concentration in PPM)
I
Explanation
EEI MflOf Rivwi
Mqor Rowb
EMU MflOf Towns
I * I Suqde Location!
25 Mile*
5 0 5 10 15 20 25 Kiloawtan
14

DISCHARGE, IN CUBIC FEET PER SECOND
o
CO
CO
co en
co en
co en
oo
COen
en o o
o o o
en o o
o o o
en o o
o o5 5 m CD
enLOW FLOW SAMPLING
COen
CO O)
^
CO
o
co(3)
CO
CD
HIGH FLOW SAMPLING
Stream SedimentsStream-sediment samples were collected from sites within selected stream reaches to characterize the
reach as well as to supplement previous sampling. At individual sites, a sample was composited along 50-100 feet of the stream from several localities on both sides of the stream below the active water line. This composite sample was sieved through a minus-10-mesh stainless steel sieve (2 mm) into a plastic gold pan and 1-2 kg sample of fine-grained sediment was transported to the laboratory. The sample was dried at room temperature (about 20°C) and then sieved to collect the minus-100-mesh (minus-149-um) grain-size fraction. This minus-100-mesh sample was used for all chemical and lead-isotopic work. Sample localities from Mineral Creek, Cement Creek, and the Animas River are in figure 11. For further details on the sample handling, see appendix I in Church and others (1993). Chemical procedures, analytical precision, and reproducibility are discussed in appendix II and the analytical results are in appendices V-VII.
Additional samples of overbank sediments, composed of fine-grained sand and silt sediments deposited at high water, were collected in the same manner from the sides of the stream channel to evaluate the effect of wetting and drying of these sediments on the availability of water-soluble metals. These samples were dry- sieved in the field. Some water-soluble efflorescent salts and mill tailings were also collected from along the stream reaches. These special samples are identified and briefly described in the data tables (appendices V and VI).
RESULTS FROM THE WATER AND COLLOID DATAAnalytical data in this report provided the basis for interpretation of the loading, partitioning, and transport
of metals from source areas upstream from Silverton, Colo. to Aztec, New Mexico under low-flow conditions. The synoptic sampling reported in this section took place at low flow in October, when bed sediments were not being transported; thus, the focus of transport in this report is on the dissolved and colloidal loads. It is important to realize that at high flow, during storms, or snowmelt runoff, there will be large amounts of metal transported with movement of the bed sediments. On an annual basis, the amount of metals transported with the bed sediments could greatly exceed the annual fluxes measured for the dissolved and colloidal loads.
Synoptic Sampling of Water and Colloids, October 1995Site identifications, field measurements, and major ion chemistry of samples collected for water and
colloids are in appendix III. Results of chemical determinations for dissolved and colloidal metal concentrations are in appendix IV. In both appendices, data are sorted in downstream order in for the Animas River (mainstem) and tributaries (Mineral and Cement Creeks) to emphasize the changes downstream. These analyses were compared to water-quality standards for aquatic life for Colorado given in table 1 (CDPHE, written commun., 1997).
AluminumIn the headwater stream reaches upstream from Silverton, aluminum coatings (chalk-white precipitates)
seen on the rocks on the sides of the stream channel indicate that aluminum is partially removed from the streams before entering the Animas Canyon. Concentrations of dissolved aluminum ranged from a high of 0.42 mg/L at site A-72, downstream from Silverton, to an average of 0.09 mg/L downstream from the Animas Canyon. Thus, not all the aluminum was removed as coatings before entering the Animas River. The dissolved aluminum concentrations in the Silverton area are in excess of the water quality standard for aquatic life, but below this standard downstream from the Animas Canyon. However, much of the aluminum in the Animas River downstream from Mineral Creek is colloidal (appendix IV). Recent work has noted that colloidal aluminum may be toxic to fish whereas dissolved aluminum may not be (Witters and others, 1996). In fact, Witters and others (1996) found that freshly formed aluminum-hydroxide precipitates may be most toxic to trout. This would be the dominant form of aluminum in the waters within the Animas Canyon reach.
Figure 10. Map of the Animas River watershed showing localities for water and colloid samples collected in Oct., 1995. The hydrology data are from USGS (1989); and the towns, railroads, and roads are from ESRI(1992).
Figure 11. Map of the Animas River watershed showing localities for sediment samples collected from Mineral Creek, Cement Creek, and the Animas River in Oct., 1995. The hydrology data are from USGS (1989); and the towns, railroads, and roads are from ESRI (1992).
16

ANIMAS RIVER WATERSHED STUDY SOUTHWESTERN COLORADO
HYDROLOGY WITH WATER SAMPLE LOCALITIES
-N-
I
ExplanationI + I Sample Location* I Laket
* I I Primary Riven and DrainagesI H Secondary Drainage* and DitchesI~*H Major Roads
EE3 Railroad*GUI Major Town*
dM UNC (kdB Sh)W~ (WRDUrn (BttovEm (B*w BlmtaiftKhw
Bim (
11 Aatax Sim O<aM BD 8M12 Anfami B*w (CUr On too)13 AI^M «h«c (MM, Nnr Mrnkxi)
10 15 20 25 MUM
5 0 5 10 15 20 25 Kilomettn
17

ANIMAS RIVER WATERSHED STUDY SOUTHWESTERN COLORADO
HYDROLOGY WITH BED SEDIMENT SAMPLE
LOCALITIES
*
ExplanationI * I Sample Locations
I Lakes__
T M K I I Primary Rivers and Drainages
I I Secondary Drainages and Ditches
I *H Major Roads
I I Railroads
I * I Major Towns
T J4 M cm HDIDD UHTU HUMB* 95AB3101 95ABS104A 9SABS1M 95ABSHOA 95ABS118 95ABS120A SABS116 9SABS1U 95ABSUJ 93ABS121
93ABS12395ABS1239SABSU795AM 1309SABS131A95ABS149A95ABS13495ABS13795ABS14095AB3US
LOCATEM Upiw A^BH KiwDppv Asian tortt tppv AIUBM Kn* CTypw Anlan Kiw
Cmot Cndt
CHMOlClMkAoimu livw (WSD ito)
95ABS143 95ABSMS 95AB31+6
_ ___ _ _Ammu Kinr OtMln»l « ) Ammm Iir« ADA dto) Aauui Riw (loiMt *t») *mmm Riwr (Akov, 32ml) Am^H Riw 0j£Jit>vaaA) AmmM Xiwr (BOB. Pump)
AalMi RlwrADimu Khw (Aborc Bo»M)Aiuw RiMr (CHkr KU)
10 15 20 25 Miles
10 15 20 25 Kilometers
18

Table 1. Water Quality Standards for Metals, Colorado
Metal Aquatic Life Standard 1 Acute Chronic
Agricultural 2 Domestic 2 Standard Standard
Aluminum
Arsenic
Cadmium
Chromium*3
Chromium*5
Copper
Iron
Lead
Manganese
Mercury
Nickel
Selenium
Silver
750
360
e(1.128[ln(hardness)] - 2.905)
Trout = e(1 - 128(ln(hardnass)l " 3- 828)
e(0.818(ln(hardness)) - 3.688)
16
A i<2~ (0.9422(ln(hardness)] - 0.7703)
A /o_(1.6148{ln(hardnass)] - 2.1805)
2.4
1 /2e(a76'ln(hardness)I + 4 - 02)
20
1 /2e(1 - 72[ln(hardness)l " 6- 52)
87
150
e(0.7852(ln(hardness)) -3.490)
e(0.818(ln(hardness)] - 1.561)
11
e(0.8545(ln(hardness)] - 1.465)
1,000 (total recovery)
e(1.417[ln(hardness)) - 5.167)
1,000
0.1
1/2e(0.76[,n(hardness)l + 1.06)
5
1/2e(1.72(ln(hardness)]-9.06)
100
10
100
100
200
100
200
200
20
50
5
50
50
1,000
300dis
50
50dis
2
100
50
100
Zinc a(0.8473{ln(hardness)] + 0.8604)
Trout = e( 1 -72(|n(hardness>]- 1 o.5i)
.(0.8473[ln(hardness)) + 0.7614) 2,000 5,000
1 Metals for aquatic life standards are dissolved; concentrations are given in ug/L. Water hardness to be used in equations are in mg/L expressed as calcium carbonate. Standards should not be exceed more than once every three years.
2 Metals are expressed as total recoverable metals unless otherwise stated; dis is the dissolved form of themetal.
Data from CDPHE (written commun., 1997)
CadmiumConcentrations of cadmium were below the limit of detection (<0.001 mg/L) in most of the water
samples. Values downstream from Cement Creek and Mineral Creek were measurable where the pH was lower. Cadmium concentrations were not elevated in water or colloids from sites downstream from Silverton during low flow and, at these low concentrations, cadmium did not exceed any water-quality standards.
CopperIn samples from the upper Animas River, dissolved copper concentrations averaged 0.003 mg/L and
colloidal copper concentrations averaged 0.006 mg/L. These values are near the lower detection limit for copper (<0.001 mg/L). The highest concentrations of dissolved copper were in Cement Creek and Mineral Creek. Due to a pH of 6.35 and a substantial source of copper in its headwaters, Mineral Creek had the highest concentration of colloidal copper at 0.055 mg/L. Cement Creek, on the other hand, had the highest concentration of dissolved copper at 0.06 mg/L. Sites downstream from the Animas River-Cement Creek
19
confluence and the Animas River-Mineral Creek confluence had the highest colloidal concentrations of copper at 0.016 mg/L and 0.022 mg/L respectively. Downstream from the Animas Canyon at the KOA Campground site (72.5 km), there was a relatively high colloidal copper concentration of 0.006 mg/L, but all the remaining sites in the basin had concentrations less than 0.004 mg/L. Concentrations at the majority of sites were less than the concentration in the field equipment blank (appendices III and IV), so it is not possible to make distinctions among them. One relatively high concentration of dissolved copper, 0.008 mg/L, was observed at the 32nd Street Bridge in Durango. This must have been from some unidentified source near Durango. The acute water-quality standard for dissolved copper was exceeded only in Cement Creek. However, colloidal copper concentrations exceeded the water-quality standard for chronic toxicity at most other sites. It is not clear what aquatic-life standards are applicable to the colloids, but these copper concentrations could cause chronic toxicity if copper in the colloids were available to aquatic life.
IronIron is the main component of the colloidal material that forms in the streams upstream from Silverton.
Concentrations of colloidal iron were measured in all samples collected all the way downstream to Aztec. The pattern was similar to that observed downstream from mining sources in the Arkansas Basin (Kimball and others, 1995); both rivers show a large increase in the colloidal iron concentration immediately downstream from the source and then a gradual decrease downstream. In the Animas River, the highest concentrations of dissolved iron were 0.64 mg/L downstream from the confluence of Cement Creek and 0.68 mg/L downstream from the confluence of Mineral Creek. Downstream from the Animas Canyon, only a few dissolved iron concentrations were above the limit of detection (<0.001 mg/L), with the greatest concentration at the KOA Campground site (0.012 mg/L) just downstream from the Animas Canyon.
There is an aquatic life standard for total recoverable iron of 1 mg/L. The colloidal concentrations reported here from the sites downstream from Cement Creek and Mineral Creek exceed this water-quality standard. Although iron does not cause acute toxicity, it does influence habitat and chronic toxicity because of its deposition on the substrate of the stream bed and incorporation into the food chain. Witters and others (1996) suggest that colloidal iron may be dissolved in fish guts releasing the sorbed metals.
ManganeseAs observed in many other streams (Kimball and others, 1995), manganese in the Animas River resided
principally in the dissolved phase rather than the colloidal phase. The pattern of dissolved manganese was very similar to the pattern of iron; the highest concentrations were downstream from the confluences of Cement and Mineral Creeks, and then the concentrations decreased downstream. The highest tributary concentration of dissolved manganese was from Cement Creek, with 1.3 mg/L. The dissolved concentrations in the Silverton area were almost at the chronic water-quality standard for manganese; however, there is no manganese standard for acute toxicity.
StrontiumAlthough strontium is not a toxic metal, it is useful to contrast its distribution pattern with other metals.
Almost all of the measured strontium was in solution rather than in the colloidal phase. Strontium concentrations were high in the Animas River near Silverton, decreased downstream and then increased again due to the high inflow concentrations downstream from the Animas Canyon. The highest tributary concentration was in Cement Creek, at 2.6 mg/L, which may reflect the leaching of carbonate minerals (calcite, CaCO3l and rhodochrosite, MnCQ ) present in the Eureka graben vein-type ore. Strontium will substitute for manganese in the rhodochrosite structure. The pattern of concentration downstream differed from that of the mining-related metals because there were substantial sources of strontium downstream from the Cretaceous Picture Cliffs, Kirtland, and Fruitland Formations. The next highest inflow concentrations were from Basin, Hermosa, and Lightner Creeks near Durango. Thus, the strontium data illustrate the pattern of an element that does not originate from the headwaters near Silverton.
ZincLike manganese, zinc occurred principally in the dissolved phase. The highest dissolved concentrations
were near Silverton. Cement Creek had a dissolved zinc concentration of 1.3 mg/L, the highest of any tributary, and the measured pH was 3.89. Unlike some other metals, the dissolved concentration of zinc at Eureka (pH 7.06), upstream from Silverton, was high at 0.46 mg/L. Downstream from Silverton, the concentrations of zinc consistently decreased as pH increased from 6.62 to 7.87 in the Animas Canyon reach.
20

Downstream from the Animas Canyon, the dissolved zinc concentration in the Animas River decreased substantially from that upstream but did not decrease to levels that were comparable to the colloidal zinc concentration until near Bondad Hill where the pH increased to about 8.6.
The concentrations of dissolved zinc exceeded water-quality standards for both chronic and acute toxicity at each of the sites upstream from the Animas Canyon (fig. 10). Concentrations of colloidal zinc in these reaches were below aquatic-life standards, but if sorbed zinc were released in the guts of fish as suggested by the work of Witters and others (1996), colloidal zinc could contribute to chronic zinc toxicity.
Arsenic, Mercury, and SeleniumSamples were analyzed for arsenic, mercury, and selenium to evaluate the dissolved and colloidal loads.
None of the samples had concentrations of these metals above the detection limits. The detection limits were 1 microgram per liter (ug/L) for arsenic and selenium, and 0.1 jjg/L for mercury. The lack of detection in water and colloids emphasizes the tendency of these elements to be associated with the bed sediments.
High-flow Sampling of Water and Colloids, Spring, 1996A second set of samples was collected during the snowmelt runoff period between May and June 1996
to compare the metal loads in water and colloids between low- and high-flow conditions (fig. 9). Results of determinations from these samples are in appendices III and IV. Only three sites were sampled during high flow, so there only is an outline of spatial detail. The samples, however, permit some generalizations about the loading of metals under two different flow regimes.
In the absence of acid-mine drainage, concentrations of dissolved metals generally decrease as flow increases. At high flow from snowmelt runoff, one would expect water quality standards to be achieved. Concentrations of some metals, however, did increase with higher flow, mostly the colloidal concentrations, creating the opportunity to exceed toxicity levels for some organisms. Among the dissolved metals sampled, zinc was the only metal that exceeded the acute toxicity standard. Zinc concentrations far exceeded the acute toxicity standard at site A-72 below Silverton, and at the two downstream sites (Durango and Cedar Hill), it was about twice the acute toxicity standard. Other metal concentrations either exceeded the chronic toxicity standard or were very close to the standard. Concentrations of copper did not exceed the standard, but were only a few micrograms per liter below the standard. During high flow, colloidal iron was greater than 1 mg/L, the standard for "total recoverable" iron concentrations, at both downstream sites. The concentrations of dissolved lead were below detection (<0.01 mg/L).
The samples collected at high flow contained some sand-sized particles that were screened out before measuring the metal concentrations in the colloids. This indicates that there was some unqualified metal transport associated with suspended particulate material (>62 jjm) at high flow associated with these particles. Unfortunately, this component was not analyzed and has been discarded.
Dissolved Versus Colloidal TransportMeasured stream flow discharge was multiplied by concentrations and converted to units of kilograms
per day (kg/day) to evaluate the instantaneous synoptic metal load. There was a clear distinction between metals transported in the dissolved load and those transported in the colloidal load. Both dissolved and colloidal metals, however, had the same downstream profile of metal loading. The profile shows a sharp increase contributed by the inflows of Cement and Mineral Creeks near Silverton and then a gradual decrease during flow through the Animas Canyon and on downstream. The decrease, or attenuation, of the dissolved load resulted either from an increase of the colloidal load, or in sorption of metals onto material in the bed sediments. Attenuation of the colloidal load results from deposition of aggregated colloids to the stream bed and incorporation into the bed sediments.
Figure 12. Dissolved and colloidal manganese in (A) the Animas River and (B) major tributaries.
Figure 13. Dissolved and colloidal zinc in (A) the Animas River and (B) major tributaries.
21

II
Manganese load, in kilograms per day

to
B
D
isso
lved
m
Col
loid
al
Cem
ent
Cre
ek
Min
eral
Cre
ek
Her
mos
a C
reek
Ju
ncti
on C
reek
L
ight
ner
Cre
ekB
asin
Cre
ekF
lori
da R
iver

Zin
c lo
adin
g in
the
Ani
mas
Riv
er
to
P
<P
*
&
*<$
r J\
*
M\J
>
Vo\
/^^
o\
&
<#

Zin
c lo
adin
g fr
om t
ribu
tari
es t
o th
e A
nim
as R
iver
B
Cem
ent
Cre
ek
Min
eral
Cre
ek
Her
mos
a C
reek
Ju
ncti
on C
reek
L
ight
ner
Cre
ek
Bas
in C
reek
Flor
ida
Riv
er

ManganeseManganese and zinc were transported mostly in the dissolved load of the Animas River (figs. 12A and
13A). The inflows from Cement and Mineral Creeks near Silverton were mostly as dissolved manganese and zinc (figs. 12B and 13B). In the mixing zone downstream from each creek, there was no partitioning of the dissolved metals to the colloidal phase, most likely because in the pH range between 6.5 and 7.5, and neither manganese nor zinc tended to sorb to or form colloids in this pH range. Although there was no partitioning to colloidal loads, both the dissolved loads of manganese and zinc decreased downstream indicating that these two metals were lost to the bed sediments. In the bed sediments, zinc, in particular, could increase the toxicity of sediments for aquatic organisms. In the Durango area, there was an increase in the dissolved manganese load, but not in the dissolved zinc load. The manganese may have been from urban sources, but more likely it is from sedimentary rocks that crop out in this section of the basins that are supplying detritus to the drainage.
Iron and AluminumThe profiles of colloidal loads of iron and aluminum were very similar (compare the data in figs. 14A and
15A), and the masses of colloidal iron and aluminum were nearly the same. The inflow of both metals from Cement Creek primarily was as a dissolved load, whereas the inflow from Mineral Creek was mostly as a colloidal load (figs. 14B and 15B). This difference in the chemical form of the load was the result of the different pH conditions in the two streams. In the mixing zone, downstream from the confluence with Cement Creek, the dissolved iron and aluminum loads from Cement Creek were partitioned almost completely to colloidal loads. This process occurred within tens of minutes as the water traveled 1 km from Cement Creek to Mineral Creek.
The contrast in the behavior of aluminum in Cement and Mineral Creeks illustrates the stronger influence of pH on the mode of aluminum transport. In Cement Creek, at a pH of 3.89, dissolved aluminum was 6.0 mg/L and colloidal aluminum was 0.1 mg/L In Mineral Creek, at a pH of 6.35, dissolved aluminum was 0.09 mg/L, and colloidal aluminum was 3.6 mg/L. At sites along the Animas River between Cement Creek (24 km) and Dalton Ranch (81 km), most of the aluminum was colloidal, ranging from 1.72 mg/L (26 km) and 1.18 mg/L (24 km), to an average of 0.09 mg/L at sites beyond 81 km downstream. Downstream from 81 km, both dissolved and colloidal loads of aluminum were low.
The mass transfer or partitioning of aluminum from dissolved to colloidal loads quantifies the process influenced by differences in pH (fig. 16). Three sources of dissolved aluminum were represented: 10.4 kg/day from the upper Animas River above the confluence with Cement Creek, 283 kg/day from Cement Creek, and 12 kg/day from Mineral Creek. Adding the inputs from the upper Animas River and from Cement Creek should result in a dissolved aluminum load of 293 kg/day downstream from Cement Creek, but only 88 kg/day were measured. Thus, 205 kg/day of dissolved aluminum were lost, while 240 kg/day of colloidal aluminum was formed. This is a reasonable mass balance for the process of aluminum partitioning from the dissolved to the colloidal phase.In the mixing zone downstream from the confluence with Mineral Creek, there was a net loss of dissolved and colloidal aluminum from the stream. The loss of dissolved aluminum in that mixing zone was 89 kg/day, but there also was a loss of 256 kg/day of colloidal aluminum. This indicates that there was not only a loss of dissolved aluminum to form colloidal aluminum, but also a net loss'of colloidal aluminum to the stream bed. These data suggest that aluminum precipitation to form colloidal particles and their aggregation in the water column is rapid; it occurred just downstream from Cement Creek. The time required for settling or deposition of the colloidal aggregates to the stream bed sediments is longer; it did not occur until the water traveled downstream from Mineral Creek. This sequence is schematically illustrated in figure 16.
The same process occurs for iron and the mass of iron that is lost to the stream bed was very similar to aluminum (fig. 17). The gain in colloidal iron downstream from Cement Creek was comparable to the loss of dissolved load, and there was a net loss of colloidal iron downstream from Mineral Creek. This amount of colloidal iron and aluminum would substantially affect the habitat of the stream bed by filling up pore space normally occupied by benthic invertebrates.
Figure 14. Dissolved and colloidal iron in (A) the Animas River and (B) major tributaries.
Figure 15. Dissolved and colloidal aluminum in (A) the Animas River and (B) major tributaries.
26

Iron
load
ing
in th
e A
nim
as R
iver
to
D
isso
lved
Q
Col
loid
al
..<?

Iron
load
ing
from
tri
buta
ries
to th
e A
nim
as R
iver
600
Cem
ent
Cre
ek
Min
eral
Cre
ek
Her
mos
a C
reek
Ju
ncti
on C
reek
L
ight
ner
Cre
ek
Bas
in C
reek
Flo
rida
Riv
er

Alu
min
um lo
adin
g in
the
Ani
mas
Riv
er
600
VO
/

Alu
min
um lo
adin
g fr
om t
ribu
tari
es to
the
Ani
mas
Riv
er
600
Cem
ent C
reek
M
iner
al C
reek
H
erm
osa
Cre
ek
Junc
tion
Cre
ek
Lig
htne
r C
reek
B
asin
Cre
ekFl
orid
a R
iver

CopperThe dissolved copper concentration was below the limit of detection downstream from Cement Creek,
even though the concentration entering from Cement Creek was near 6 \jtg/L. Copper was completely partitioned to the colloidal phase, probably as a result of sorption to colloids of iron and aluminum hydroxide, causing the colloidal concentration to increase to 13 ug/L downstream from Cement Creek. Sorption of copper continued downstream from Mineral Creek, and the colloidal concentration reached a maximum of 23 |jg/L The loss of colloidal copper load was about 5 kg/day downstream from Mineral Creek.
ZincUnlike aluminum and iron, only a small amount of zinc was partitioned from the dissolved to the colloidal
phase. In the Animas River downstream from Cement Creek, the dissolved zinc load was 184 kg/day, which was greater than the sum of the individual sources of the upper Animas River and Cement Creek. This increased load may indicate a contribution of zinc from some nonpoint sources, perhaps from dispersed tailings in the alluvium.In the Animas River downstream from Mineral Creek, the load of dissolved zinc was 99 kg/day, which represented a net loss of 131 kg/day of dissolved zinc. This net loss coincided with a gain of colloidal zinc of only 6 kg/day, so most of the dissolved zinc was not partitioned to the colloidal phase. Instead, a substantial loss of dissolved zinc to the stream bed occurred through sorption to the abundant aluminum and iron colloids that had previously settled to the stream bed.
These calculations not only demonstrate the substantial masses involved in the geochemical processes active in the streams, but also indicate the large quantity of colloidal material that becomes stored in the bed sediments. Once the colloids are part of the bed sediments, they influence the bed-sediment chemistry and affect the aquatic habitat. As described in the next section, much of the colloidal material is remobilized during high-flow periods.
Comparison of Metal Loads During Low-Flow and High-Flow ConditionsThe samples that were collected during snowmelt runoff in 1996 indicated substantial differences in the
transport of metals between low-flow and high-flow conditions. Ultrafiltration of the samples, as described in appendix II, provided the best possible measure of the dissolved and colloidal metal concentrations at both stages of discharge. The principal differences in transport patterns between low and high flow were the dominance of colloidal transport processes during high flow, and the greater mass of dissolved and colloidal material transported during high flow.
Dominance of the colloidal load was evident with the transport of aluminum (fig. 18A). At low flow, the colloidal load steadily decreased downstream from Silverton to the point where the dissolved load slightly exceeded the colloidal load at Durango (fig. 15). In contrast, the colloidal load increased continuously downstream during each of the three high-flow sampling trips. The colloidal load was about 10 times greater than the dissolved load during high flow. Dissolved and colloidal iron showed the same general pattern as aluminum (fig. 18B). In particular, the increase in the colloidal iron load from Silverton to Durango was very large compared to the low flow. However, dissolved and colloidal zinc varied from the iron and aluminum patterns because dissolved zinc transport was comparable to the colloidal transport at Silverton. Downstream at Durango and Cedar Hill, colloidal zinc transport was dominant (fig. 18C).
Cadmium, copper, and lead had the same seasonal pattern as aluminum, iron, and zinc. Concentrations of dissolved cadmium were near detection limits in all samples, but concentrations of colloidal cadmium were measurable. During high flow, the colloidal load of cadmium at Durango was 4.3 and 5.6 kg/day for the first two high-flow sampling trips, compared to 0.3 kg/day at low flow (fig. 18D). Colloidal copper loads increased even more between low and high flow, from 1.5 kg/day to greater than 133 kg/day during the May 1996 period (fig. 18E). The increase in the colloidal lead load at Durango was comparable to copper, from less than 3 kg/day to greater than 220 kg/day (fig. 18F). Thus, even though the loads of colloidal cadmium, copper, and lead were small in comparison to loads of aluminum, iron and zinc, these loads increased greatly during high flow and could have effects on toxicity if the metals entered the food chain or became bioavailable in some way.
Figure 16. Summary of mass transfer of aluminum in mixing zones downstream from Cement and Mineral Creeks.
Figure 17. Summary of mass transfer of iron in mixing zones downstream from Cement and Mineral Creeks.
31

Upstream from Cement Creek
Dissolved 10.4 kg/day Colloidal 3.6 kg/day
Cement CreekDissolved 283 kg/day Colloidal 4.6 kg/day
DispersedAggregatedColloids
Mineral CreekDissolved 12 kg/day Colloidal 503 kg/day
Downstream from Cement Creek
Calculated SumDissolved 293 kg/dayColloidal 8.2 kg/day
ObservedDissolved 88 kg/day Colloidal 249 kg/day
Dissolved loss 205 kg/day Colloidal gain 241 kg/day
SettledColloidalAggregates
Downstream from Mineral Creek
Calculated Sum Dissolved 100 kg/day Colloidal 744 kg/day
ObservedDissolved 11 kg/day Colloidal 488 kg/day
Dissolved loss 89 kg/day Colloidal loss 256 kg/day
32

Upstream from Cement Creek
Dissolved < 0.1 kg/day Colloidal 22.3 kg/day
Cement CreekDissolved 210 kg/day Colloidal 114 kg/day
DispersedAggregatedColloids
Mineral CreekDissolved 310 kg/day Colloidal 482 kg/day
Downstream from Cement Creek
SumDissolved 210 kg/day Colloidal 136 kg/day
ObservedDissolved 135 kg/day Colloidal 242 kg/day
Dissolved loss 75 kg/day Colloidal gain 106 kg/day
SettledColloidalAggregates
Downstream from Mineral Creek
SumDissolved 445 kg/day Colloidal 724 kg/day
ObservedDissolved 192 kg/day Colloidal 490 kg/day
Dissolved loss 253 kg/day Colloidal loss 234 kg/day
33

Not only was the colloidal load the dominant phase for these six metals, but the mass of colloidal load at high flow was much greater than at low flow. For example, at Durango, the colloidal zinc load was 15 kg/day during low flow, but 1,060,1,450, and 114 kg/day were observed during the three high-flow sampling periods. High-flow trends of colloidal aluminum and zinc loads were comparable. Thus, during high flow from snowmelt runoff, the colloidal material that was deposited in the bed sediments during low flow was resuspended and flushed downstream. This annual event has important implications for water use downstream because water piped or stored from the Animas River during high flow will have a much greater colloidal load than at low flow. Without filtration and removal from the water, these colloids would be transported through any pumping system almost as if they were dissolved solutes.
RESULTS FROM STREAM-SEDIMENT DATAIn the following discussion, we focus on the geochemical results from the main tributaries using data
for seven elements: arsenic (As), cobalt (Co), copper (Cu), lead (Pb), strontium (Sr), vanadium (V), and zinc (Zn). The concentrations of cobalt, strontium, and vanadium do not vary significantly in the rocks underlying the Animas River watershed and reflect the rock geochemistry throughout the Animas River watershed, whereas the other four metals are largely derived from the various mineral deposits or alteration zones within the upper Animas River watershed upstream from Silverton. The enrichment of metals above crustal abundance values (CAV) is not only environmentally significant, but is used in assessing areas where mineral deposits might be present. In mineral exploration, areas characterized by metal concentrations three or more times above the CAV are routinely evaluated. For the seven elements discussed below, the CAV is: As, 1.8 ppm; Co, 29 ppm; Cu, 68 ppm; Pb, 13 ppm; Sr, 384 ppm; V, 136 ppm; and Zn, 76 ppm (Fortescue, 1992). Whereas we will use this enrichment concept in the discussion and evaluation of the metal distribution
profiles, the CAV for an element in any given area should not be assumed to represent the background in that area. The geochemical background prior to mining must be determined by looking at premining sediments within the watershed.
These seven metals are present in several different mineralogical sites in the rocks and mineralized zones in the watershed. Metals sorbed onto the iron-hydroxides are weakly bound and are totally released by the 2M HCI-1%H202 digestion. Metals in the oxide and sulfide phases will be partially to completely digested by the 2M HCI-1%H2O2 leach procedure whereas metals in the silicate phases will not be removed 2M HCI-1%H2O2 digestion (Church and others, 1987). Minor amounts of metals reside in carbonate phases. Strontium, for example resides almost entirely in the silicate phase. Vanadium resides in the iron oxides hematite and magnetite in volcanic and plutonic rocks. Cobalt resides in both silicate phases and in pyrite. Copper, lead, and zinc reside in silicate phases, but are greatly enriched in mineral deposits as are arsenic and antimony. We will focus our geochemical discussion primarily on the geochemical results from the 2M HCI-1%H2O2 digestion procedure because this digestion removes all of the metals present in iron-hydroxide phases, including the colloidal precipitates. We refer to the metals removed by this leach as the "labile" metal component. Comparisons of the yields from the 2M HCI-1 %H2O2 digestion procedure relative to the data from the total digestion are very useful because significant portions of some metals in the stream sediments may be transported as detrital oxide and sulfide minerals. The primary sulfide minerals are: arsenopyrite (the primary source of arsenic), which is not digested by the 2M HCI-1 %H2O2 leach procedure; pyrite (the primary source of cobalt), which is not digested by the 2M HCI-1 %H2O2 leach procedure; chalcopyrite (the primary source of copper), which is not digested by the 2M HCI-1 %H2O2 leach procedure; galena (one primary source of lead), which is readily digested by the 2M HCI-1 %H2O2 leach procedure; sphalerite (the primary source of zinc), which is partially digested by the 2M HCI-1 %H2O2 leach procedure; and tetrahedrite (a source of copper, lead, silver, arsenic, and antimony), which is not digested by the 2M HCI-1 %H202 leach procedure (S.E. Church, unpubl. data). Thus, a comparison between the two data sets will provide some measure of the distribution of the metals present in the different mineralogical phases present in the bed sediments. In addition, vanadium in this environment is concentrated in magnetite and specular hematite, which are the "heavy" iron-oxide minerals. Some vanadium associated with the weathering of magnetite or hematite can be extracted by the 2M HCI-1 %H2O2 digestion procedure, but vanadium data from the total digestion will be used as an indicator of placer accumulation of heavy minerals at the sites where bed-sediment samples were collected.
Figure 18. Metal loads of aluminum (A), iron (B), zinc (C), cadmium (D), copper (E), and lead (F) at high and low flow in the Animas River. Results are grouped by sampling trips; low-flow conditions, Oct. 1995, and high-flow conditions, May 9-10, May 21-22, and June 18-19. Steam flow discharge is on figure 9.
34

D
ISS
OL
VE
D
Q C
OL
LO
IDA
L
A
<vX
T
^

9£
IRON LOAD, IN KILOGRAMS PER DAY
LV-slslsW-sV-s.s-sVsVsW^ JO v'.s'.sVsVsVs'.s1.
&#&a##&&&^^
^j^j^^j?^vj^j^^^

1000
0
1000
DC
LJJ
Q.
DC
O
O 5
z d O
O z N
10
0
-EE
MID
DLE
RU
NO
FF
=
D
ISS
OL
VE
D
E3 C
OL
LO
IDA
L
0.00
1
*\°
^ s

CADMIUM LOAD, IN KILOGRAMS PER DAY
0
0
^^^^^^^^
£§§?£?j§§?j§'
Oo
EARLY RUNOFF
- <_ -
oTI n
r~
m
i i
i.
OTI TI
10 COLLOIDAL
o

<
o DC
HI
CL DC
(3
O 2 Q
<
O DC
HI
CL
CL O
O
1,00
0
100 10
D
ISS
OLV
ED
®
CO
LLO
IDA
L
E
0°

<
1,00
0.0
DC
UJ
Q. DC
(3
100.
0
10.0
-^ O
8 O1.0
Q 55 0.1
:MC
OLL
OID
AL
10V
VF
-OW
y.
y.;v
;v i
I I^ =1 ,.v«v
EEA
RLY
RU
NO
FF
I «« 1 1 i
i Ki iI S
MID
DLE
RU
NO
FF
I i W i 1i I m ii i ii_jM
E R
UN
OF
F
>v;V
i i 1 S
i$5 i
1 1 I1 ii
i i
i i
i i
i i
i i

Placer accumulation occurs when the carrying capacity of the stream is high and the silicate detrital rock fragments are carried away while leaving the heavy-mineral phases behind. Most of the heavy-mineral phases have a density (specific gravity, sp. gr.) between 4.3 and 5.3 with the exception of galena (sp. gr. of 7.6) and gold (sp. gr. between 15-19); magnetite has a sp. gr. of 5.2. Thus, the monitoring of magnetite distribution is an excellent measure of the placering process. Since we are interested in the supply of metals to the streams rather than concentration of metals at a specific site in a stream reach by hydraulic processes, the use of the vanadium concentration provides a measure of the distribution of magnetite and shows the influence of the placering effect on the geochemical data set.
Bed-sediment samples collected from stream reaches for this study were analyzed for both the labile and total metal content. The geochemical data are presented in two formats, a map format and a profile format plotted against river distance, to aid in the interpretation of the metal dispersion or dilution patterns downstream. Geochemical data showing the dispersion of copper, lead, and zinc from the main tributaries and the Animas River are in a map format on figures 19-21. The metal concentrations for the intervals are the same as those used in the regional geochemical maps (see figs. 6-8). A comparison of the reconnaissance geochemical map for copper (fig. 6) with the "ribbon" map showing the dispersion of copper (fig. 19) indicates that the concentration of copper in bed sediments exceeds 200 ppm for all of the Animas Canyon reach and for much of the lower Animas River south to Durango. In contrast, the copper concentration in stream sediments from tributaries throughout the watershed in areas underlain by either the Precarinbrian rocks that crop out in the Animas Canyon reach or the Paleozoic, Mesozoic, and Tertiary sedimentary rocks (fig. 3) that crop out in the lower Animas River generally have concentrations in the 40 ppm or less range (fig. 6). Clearly the source of copper in the bed sediments of the Animas River south of Silverton is from the Animas River watershed upstream from Silverton. The lead (fig. 7 and fig. 20) and the zinc "ribbon" maps (fig. 8 and fig. 21) show a pattern similar to that of copper, although the concentrations vary in magnitude.
For ease of presentation, the geochemical and lead-isotopic data in the profiles are plotted against downstream distances measured in kilometers (km) from the confluence of Mineral Creek with the Animas River below Silverton, which was arbitrarily assigned a value of 25 km. The reaches of the Animas River above and below Silverton are plotted separately. The sample site on the Animas River below the confluence (that is, site A-72 in the CDPHE data base at 26.25 km) is plotted as the most downstream point on all of the geochemical and lead-isotopic plots of data from the main tributaries (figs. 22-27) and the most upstream point on the plots of the data from the lower Animas River (figs. 28-29).
Sample types on these diagrams have been divided into five different categories: River (bed-sediment samples from the main tributaries or the Animas River), Tribs (bed-sediment samples from small tributary basins), Ovrbk seds (fine-grained sediment samples collected from bars or from the stream banks representing sediment transported during high water that has been subjected to wetting and drying and are a source of water-soluble salts), Other (largely samples of water-soluble efflorescent salts associated with the overbank sediments collected), and Mill tails (fine-grained deposits of mill tailings within the flood plain). Identification of specific sample types is in the data tables in the appendices and on individual figure captions.
Figure 19. Ribbon map showing the dispersion of copper in bed sediments in Mineral and Cement Creeks and the Animas River. Data from the major tributary streams during the 1995 sampling to evaluate the contributions of metals from the major tributary drainages in the Animas River watershed. Important tributary streams are labeled for reference; hydrology data are from USGS (1989); and the towns, railroads, and roads are from ESRI (1992).
Figure 20. Ribbon map showing the dispersion of lead in bed sediments in Mineral and Cement Creeks and the Animas River. Data from the major tributary streams during the 1995 sampling to evaluate the contributions of metals from the major tributary drainages in the Animas River watershed. Important tributary streams are labeled for reference; hydrology data are from USGS (1989); and the towns, railroads, and roads are from ESRI (1992).
Figure 21. Ribbon map showing the dispersion of zinc in bed sediments in Mineral and Cement Creeks and the Animas River. Data from the major tributary streams during the 1995 sampling to evaluate the contributions of metals from the major tributary drainages in the Animas River watershed. Important tributary streams are labeled for reference; hydrology data are from USGS (1989); and the towns, railroads, and roads are from ESRI (1992).
41

ANIMAS RIVER WATERSHED STUDY SOUTHWESTERN COLORADO
DISPERSION OF COPPER IN BED SEDIMENTS
ExplanationBK > 1300 ppra H 650 - 1300 ppm CZ3 325 - 650 ppm I 200 - 325 ppm d] 65 - 200 ppm BB < 65 ppm H Lakaa I I Major Riven EEE Major Roadi E:B Raiboub I ^ I Mbyor Towns I ^ I Sample Location
new »»w
10 15 20 25 Mile*
5 0 5 10 15 20 25 Kilonwten
42

ANIMAS RIVER WATERSHED STUDY SOUTHWESTERN COLORADO
DISPERSION OF LEAD IN BED SEDIMENTS
I
ExplanationBB > 400 ppm i 200 - 400 ppm CD 100 - 200 ppm Hi 60-100 ppm PS- I 20-60 ppm
^H < 20 ppm
I I Myor Riven EE3 Major few*
HE MqjorTfWU I * I Sampl* LocaHoo
UW 1 I W
10 15 20 25 MUM
5 0 5 10 15 20 25 Kilonwton
43

ANIMAS RIVER WATERSHED STUDY SOUTHWESTERN COLORADO
DISPERSION OF ZINC IN BED SEDIMENTS
ExplanationHi > 1500 ppm I 750 - 1500 ppm LZl 375 - 750 ppm I 225 - 375 ppm CZJ 75 - 225 ppm BH < 75 ppm I Late EEl MnJorRiveni E5 MQ<V Ron*
CHI Kbtjcr TBWM I * I Swnplp Location
I_____^_____15^_20 25 Mile*
5 0 5 10 15 20 25 Kilometer*
44

sample types is in the data tables in the appendices and on individual figure captions. Data from both the total digestion data and the 2M HCI-1% H2O2 data are plotted; these data will be referred to as the total metal and the labile metal concentrations.
We also analyzed the labile component for the lead-isotopic composition of the samples to "fingerprint" different sources of lead within the basin and to quantify the relative contributions of metals from the different mining districts to the total mass of metal in the bed sediments. Lead-isotopes can be used as a tracer of the fluvial processes because the unmineralized rocks and mineral deposits have differing lead-isotopic signatures. Three of the four isotopes of lead increase with time because they are the daughter products of the radioactive decay of uranium and thorium. For example, the amount of 206Pb has approximately doubled over the age of the earth. Relative to 204Pb, which has no radioactive parent, the506 Ptf04 Pb value has increased from about 9.35 at the time of the formation of our solar system to about 18.8 today. This change has resulted from the decay of 238U. Similar changes have occurred for the growth in 207Pb resulting from the decay of 235U, and 208 Pb resulting from the decay of232 Th, although the change in th$7 PW Pb is now insignificant for this particular application because of the short half-life of 235U. The "fingerprinting" of the different mineral deposit districts is possible because, at the time of the formation of the deposits, the lead contained in the deposits was separated from the radioactive parents and the composition of the lead-isotopic ratios was "frozen" into the deposits. In contrast, lead in the rocks within the Animas River watershed continues to change with time in direct proportion to the ratio of the parent isotopes to ^Pb. Lead is abundant in these mineral deposits. Lead from the deposits is readily removed by weathering and deposited in the bed sediments by sorbtion to or precipitation with the iron-hydroxide precipitates. This lead is readily removed by the 2M HCI-1%H2O2 leach procedure (100%). In contrast, only a small portion of the silicate-bound lead in unmineralized rock is released by weathering of the silicate minerals in the rocks that crop out in the basin. About 20-25 percent of the "silicate-bound rock lead" is extracted by the 2M HCI-1%H2O2 leach procedure. This "rock-lead" signature will be more radiogenic than the composition one would obtain from the total digestion as shown in earlier work (Gulson and others, 1992; Church and others, 1993). Therefore, the abundant lead from the mineral deposits, which is often present at hundreds to thousands of ppm, overwhelms the lead derived from weathering of silicate-bound lead from unmineralized rocks that crop out within the Animas River watershed and provides a sensitive tracer to measure the contribution of metals from mineralized areas within the basin.
Lead-isotopic data from galena in the deposits in the Silverton area are given in table 2. These limited data suggest that lead-isotopic composition of galena from the vein-type ore from the Eureka graben (fig. 4) varies over a small range (samples 1-3, table 2). The data from the two samples collected from the Eureka Mill and the Sunnyside Mill and from float in Cement Creek are of less value because we do not know which deposits they represent. The analysis from the Marcella Mine represents ore from a deposit associated with the Sultan Stock (fig. 4). The analysis of the lead from the white precipitate from the Paradise portal on the Gem claim on the Middle Fork of Mineral Creek indicates that this deposit differs from that of the vein-type ore lead from the Eureka graben. The composition of lead from the iron-hydroxide precipitate from the Koehler adit (appendix VII) also differs from the Eureka graben vein-type ore lead. The compositions of the galena samples are plotted on the lead-isotope diagrams when the mineralization type is present within the individual subbasin.
Mineral Creek Drainage BasinGeochemical and lead-isotopic results from the bed sediments from Mineral Creek are summarized in
figures 22-23. At the headwaters of Mineral Creek, an iron-hydroxide precipitate sample from the Koehler adit contains enriched concentrations of ore-related metals. This sample was totally digested by the 2M HCI- 1%H2O2 leach demonstrating that metals deposited by precipitation from aqueous AMD solutions in the iron- hydroxides phases are completely extracted by this acid leach solution. The Koehler adit drains into a small collection basin from one of the chimney deposits (fig. 4), which are base-metal-rich breccia pipes associated with porphyry-type mineral deposits (Cox, 1986). Direct discharge of sediments into the headwaters of Mineral Creek from the collection basin below the Koehler adit is not certain. The data from the Koehler adit discharge is used in this report to indicate that the chimney deposits are a source, rather than the only source of these metals.
ArsenicArsenic concentration in the Koehler adit sample (4,400 ppm) is about 2,500 times CAV. The
concentration of arsenic in bed sediments of Mineral Creek downstream from the Koehler adit show a continuous dilution of arsenic resulting from addition of sediments from the tributaries in the basin (fig. 22A).
45

Table 2. Lead-isotopic data from mineral deposits and mill sites in the Silverton study area
Locality 206Pb/204Pb ^Pb/^Pb
Sunnyside Mine1DH-B1 18.285 15.556 37.919 74BRD-4 18.294 15.563 37.949 74BRD-3 18.367 15.562 37.959
Sunnyside Mill 166DV-1
Eureka Mill Site2 95ABS105-GN
Kittimac Mill Site2 95ABS106
Galena in float, Cement Creek2 95ABS120-GN
Paradise portal, Gem claim2 95ABSPD
Marcella Mine, Kendall Mountain 1 46DV39
18.549
18.228
18.787
18.367
18.781
18.498
15.603
15.537
15.635
15.551
15.581
15.595
38.242
37.787
38.278
37.944
38.142
38.056
1 Data from Doe and others (1979).2 New data from this study.
Arsenic is diluted from about 130 times CAV on the upper part of Mineral Creek at Chattanooga to about 11 times CAV above the confluence with the Animas River below Silverton. A comparison of the yields for arsenic in the 2M HCI-1%H2O2 digestion versus the total digestion indicates that arsenic is consistently present in the bed sediments at a concentration of 20-30 ppm higher in the total digestion on a sample-to-sample basis (fig. 22B). This indicates that arsenic is present in both the iron-hydroxide phase as well as in a sulfide phase, probably arsenopyrite. At the Chattanooga site, as much as 85-90 percent of the arsenic may have come from the Koehler adit or from acid mine drainage directly from these chimney deposits. There is no direct measure of the arsenic component that may have been derived from the altered area surrounding the mineral deposits on Red Mountain.
CobaltCobalt concentration is low in the sample from the Koehler adit, and the cobalt concentrations in the total
digestions of the bed sediments of Mineral Creek are only slightly elevated above the concentrations in the tributaries (fig. 22C). The cobalt concentrations in the bed sediments of Mineral Creek are at or near CAV (29 ppm)and range between 10 and 30 ppm. Cobalt concentrations show no regular increase or decrease along the entire course of Mineral Creek. Comparison of the partial (labile) and total digestion data indicates that some portion of the cobalt is probably being transported in the bed sediments in pyrite.
CopperCopper concentrations are about three times CAV (210 ppm) at the Koehler adit, are elevated to 5.6
times CAV at Chattanooga, and rise to about 13 times CAV at Burro Bridge above the confluence of the Middle Fork of Mineral Creek (fig. 22D). Below the Middle Fork of Mineral Creek to the confluence with the
46

Animas River, the concentration of copper drops to 100-110 ppm (about 1.5 times CAV) indicating that there are no substantive sources of copper to the bed sediments of Mineral Creek in these stream reaches. About 30-50 ppm of copper occurs in the sulfide phases, probably in chalcopyrite or a solid-solution component in pyrite. The increase in the copper concentration at Burro Bridge is entirely in the labile phase. Copper concentrations in bed sediments from the main tributaries to Mineral Creek are not supplying substantial amounts of copper to the bed sediments in these stream reaches. The source of the copper in the upper reaches of Mineral Creek has not been identified.
LeadLead concentrations at Koehler adit are 3,500 ppm (about 270 times CAV). Lead concentrations from
bed sediments in the headwaters of Mineral Creek at Chattanooga (about 70 times CAV) and at Mill Creek (about 60 times CAV) indicate that the lead baseline is significantly elevated here (fig. 22E). Substantial mineral production and milling were done in the Red Mountain district near Chattanooga beginning in 1882 (Sloan and Skowronski, 1975). The chimney deposits at the headwaters of Mineral Creek are a major source of lead in the bed sediments of Mineral Creek. Lead concentrations from tributaries, including the Middle Fork of Mineral Creek, are in the range of 90-140 ppm. Lead concentrations drop to 200-240 ppm (15-18 times CAV) in bed sediments in the reach between the South Fork of Mineral Creek and the confluence with the Animas River below Silverton. Lead concentrations in the two digestions are essentially the same; small differences between the measured concentrations are presumed to be due to sample heterogeneity.
StrontiumStrontium concentration data from the total digestion of the bed sediments shows that there is relatively
little strontium in the Koehler adit sample relative to that in the rocks being eroded within the basin. The strontium profile for Mineral Creek is relatively flat and the strontium concentrations in bed sediments from the tributaries brackets the concentration profile for bed sediments in Mineral Creek (fig. 22F). The average strontium concentration (223 ppm) is below the CAV (384 ppm).
ZincLabile zinc in the sample from Koehler adit is 200 ppm or about 2.6 times CAV. Zinc concentrations in
the bed sediments differ substantially between the 2M HCI-1%H2O2 digestion (fig. 22G) and the total digestion (fig. 22H) suggesting that a substantial portion of the zinc in the bed sediments is transported in the sulfide mineral sphalerite. Sphalerite accounts for as much as 85 percent of the zinc in the bed sediments from the site at Chattanooga. Substantial sphalerite is also being added to this stream reach from Browns Gulch. The sphalerite component in the bed sediments of Mineral Creek drops to about 60 percent at Burro Bridge and the zinc concentration in the iron-hydroxide phase is also increased as did the concentration of labile copper at this site. Stream flow at the site above Burro Bridge was slow; the increase in metals associated with the colloidal phase in the bed sediments may be the result of accumulation of colloidal components at this site. Both sphalerite and labile zinc concentrations drop substantially between the Middle and South Forks of Mineral Creek. Downstream of the confluence of the South Fork, sphalerite and labile zinc concentrations again increase dramatically as Mineral Creek enters the mining area west of Silverton.
VanadiumThe profile of vanadium concentrations from the total digestion (fig. 22H) is relatively flat along the
course of Mineral Creek averaging 110 ppm (CAV is 136 ppm), although the vanadium profile for Mineral Creek shows more variation than that for Cement Creek or the upper Animas River upstream from Silverton. Vanadium concentrations from tributaries are close to the values from the Mineral Creek samples and indicate that the samples from these localities are not significantly biased by hydrologic concentration of heavy minerals at any particular site. The site above the confluence of the South Fork of Mineral Creek does have low concentrations of vanadium suggesting that this sample may be somewhat biased toward the iron- hydroxide component rather than the heavy-mineral phases. We conclude that the elevated zinc concentrations are the result of addition of sphalerite to the stream reaches rather than concentration of heavy-mineral phases in a placer.
Lead-isotopic dataThe lead-isotopic data (fig. 23A and B) from the Mineral Creek drainage indicate metals from several
different deposit types are being added to bed sediments from the mineral deposits in the basin. Since there
47

are no published lead-isotopic data from the chimney deposits, the results from the Koehler adit will be used as the signature of this deposit type. The lead-isotopic data available on galena from known mine sites or stream reaches is shown in these diagrams. Note that the composition of lead in the bed sediment from Chattanooga does not match well with the Koehler adit results for ̂ Pb/^Pb, and that it is even more enriched in ^Pb relative to the vein-type ore deposits than lead-isotopic data from the Koehler adit. The lead-isotopic data from Mill Creek and from the Middle and South Forks of Mineral Creek, all of which are on the west side of the Mineral Creek drainage, have lead-isotopic values that are more radiogenic than the vein-type ore signature whereas the bed-sediment sample from Browns Gulch matches the Eureka graben vein-type ore signature. The composition of lead in the sample from Burro Bridge on Mineral Creek above the confluence of the Middle Fork reflects the addition of vein-type ore lead from Browns Gulch. Between the confluence of Middle and South Forks of Mineral Creek, the lead-isotopic data indicate that the influence of the Eureka graben vein-type ore lead is being diluted by the addition of rock lead similar to that found in the tributaries on the west side of the Mineral Creek drainage. The overbank sediment sample from the confluence of the South Fork, however, matches the geochemical and lead-isotopic data from the upper reaches of Mineral Creek and represents a fluvial high-water deposit that contains a larger component of ore and ore-related metals from the upper part of the basin. The lead-isotopic composition in bed-sediments from Mineral Creek at low flow is higher than that of the Eureka graben vein-type ore lead signature, indicating that a different component of ore lead dominates the composition of lead in bed sediments from this drainage. This is not the case for bed sediments from Cement Creek or the upper Animas River above Silverton as will be shown below.
Figure 22. Metal distribution profiles (A-H) for Mineral Creek; metal concentrations for labile arsenic (As), total arsenic, total cobalt (Co), labile copper (Cu), labile lead (Pb), total strontium(Sr), labile and total zinc (Zn; pd-labile zinc from the partial digestion and td-total zinc) and total vanadium (V) are plotted against river distance measured upstream from the confluence of Mineral Creek (at 25 km) with the Animas River below Silverton, Colo. Data from four different sample types are plotted as indicated by the explanation on the diagrams; no mill tailings were sampled on Mineral Creek. Sample localities plotted are, beginning at the headwaters: Mineral Creek-Chattanooga (13 km), Burro Bridge (16 km), Mineral Creek above the confluence with the South Fork (19.6 km), Mineral Creek at the gaging station above the confluence with the Animas River (24.5 km), and the tie point at site A-72 on figure 28; the tributary samples-Mill Creek (13.75 km), Browns Gulch (15.45 km), Middle Fork Mineral Creek (16.7 km), South Fork Mineral Creek (2 samples, one in 1995, one in 1996; 20.45 km); and Other-the Koehler adit (10.1 km).
Figure 23. Lead-isotope distribution profiles for Mineral Creek plotted against river distance measured upstream from the confluence of Mineral Creek (at 25 km) with the Animas River below Silverton, Colo. Data from different sample types are plotted as indicated by the explanation on the diagrams; distances are as noted in the explanation for figure 22. Lead-isotopic data from the Paradise portal on the Gem claim on the Middle Fork of Mineral Creek and from the Eureka graben vein-type ore (table 2) are plotted for comparison. The data from site A-72, the first site on the Animas River below the confluence, are plotted on all the diagrams to provide a tie-point with the data on figure 29.
48
Con
cent
ratio
n of
As
(ppm
)
cr (A cr (A
3 Q)
C/)
CD
0 CD0
Q
.
0)
*-*» c Q.
Con
cent
ratio
n of
As
(ppm
)
0 CD
3 Q)
0) Q) CD
CL (D r-i»
C
CL

Con
cent
ratio
n of
Cu
(ppm
)
2
o> CT
(A O O I
?T (A
CD
Q.
(A H
3 0)
CD
Q)
*
CD0
72
5
£>
CD
IT*
CD
Q
.
C/)
r-K
C Q.
Con
cent
ratio
n of
Co
(ppm
)
o
-
g 5T
o CD01
-
N3
O N3 cn CO
O
ZJ 3'
o> i^ CD
Q3_
O
T3
CDCD
Q
.
O)
< K C
Q.
Animas Watershed StudyMineral Creek
10000
Q.
100 oc o
0)oc oo
10 15 20 Distance (km.)
25 30
River Tribs Other Ovrbk seds 2: Mill tails
Animas Watershed Study
1000
EQ.
I oO
10 i
-»- River
Mineral Creek
10 15 20 Distance (km.)
25 30
Tribs Other Ovrbk seds x Mill tails
51

10000
|_1000 -: Q.
Ioo
10
Animas Watershed StudyMineral Creek
Burro Bridge
10 15 20 Distance (km.)
25 30
River Tribs Other Ovrbk seds x Mill tails
Animas Watershed StudyMineral Creek
10000
1000 -:
Q.a.c o
oc o o
10
10 15 Distance (km.)
20 25
-»- Zn River (pd) Ei Zn Tribs (pd)
Zn River (td) Zn Tribs (td)
V River (td) V-Tribs (td)
30
52

Animas Watershed StudyMineral Creek
19.50
Paradise adit
Vein-type ore Browns Gulch
18.0010 15 20
Distance (km.)25 30
River A Tribs Other Ovrbk seds x Mill tails + Galena
Animas Watershed StudyMineral Creek
39.50
CL8CM
39.00 -
38.50 -
38.00 -
Paradise adit
Vein-type ore Browns Gulch37.50
10 15 Distance (km.)
20 25 30
River A Tribs Other Ovrbk seds x Mill tails + Galena
53

Cement Creek Drainage BasinThe geochemical and lead-isotopic results from the bed-sediments from Cement Creek are
summarized in figures 24-25. Geochemical profiles of Cement Creek differ substantially from those of Mineral Creek or the upper Animas River. Two samples labeled as "Other" are important in discerning the influence of natural weathering and spring seepage processes from mining activities on metal concentrations in the bed sediments. The sample upstream from the first bed-sediment sample of Cement Creek is from a ferricrete deposit on the west-facing slope of Cement Creek. A ferricrete is any rock cemented by iron oxides. Femcretes may contain rounded or angular rock fragments cemented together by iron oxides that precipitate from natural weathering of mineral deposits. The second "Other" sample is from an iron bog forming below a spring on the west side of Cement Creek in the creek bed. Since this sample was collected from a small terrace just above Cement Creek at the low-flow stage, the chemistry of the sample will be affected by bed sediment material and water from Cement Creek entrapped during high-flow conditions. However, the very different geochemistry of the iron-hydroxide precipitates clearly shows that most of the metals in the iron bog are deposited from a different source.
ArsenicArsenic concentrations in bed sediments are elevated ranging from 23 to 43 times CAV (42-78 ppm)
and the profile (fig. 24A and B) of both the partial and the total digestion data indicate that the arsenic concentration in the bed sediments increases significantly below the inflow at the Gladstone Mine and the confluence below Tiger Gulch. This increase is due to a higher arsenic in the iron-hydroxide phases and may represent accumulation of colloidal materials in the bed sediments. As we stated above, if the elevated arsenic concentrations reflect the addition of the chimney-type deposits, the increased arsenic levels could represent an unsampled source of metals coming from Prospect Gulch which drains the east side of Red Mountain, Copper, lead, and zinc do not show a significant change over this stream reach. The sample from Topeka Gulch, a small tributary drainage which has not been substantially affected by mining, contained similar concentrations (46 ppm) of arsenic to those found in the bed sediments of Cement Creek, but much less of it is in the labile phase (fig. 24B). In contrast, the arsenic concentration in the ferricrete sample was less than 10 ppm and in the iron bog sample was 6.7 ppm. The arsenic concentration in the bed sediments of Cement Creek at Memorial Park in Silverton is about twice that in either Mineral Creek or the upper Animas River at site A-72 in Silverton.
CobaltCobalt concentrations in the bed sediments of Cement Creek are low and relatively constant at about
13 ppm (fig. 24C). The range is from about 10-30 ppm, near the CAV and showing a similar range to the other two major tributaries. Cobalt in the ferricrete sample is quite low, but in the iron bog sample is very similar to that in the bed sediments. Cobalt in the bed sediment from Topeka Gulch is higher than that in bed sediments in Cement Creek.
CopperCopper concentrations (fig. 24D) in the headwaters of Cement Creek are elevated to about six times
CAV (410 ppm). Copper concentrations in the ferricrete sample are also elevated (360 ppm) suggesting that some component of the elevated copper concentrations in the headwaters of Cement Creek may represent premining conditions. However, there are a few small mines in Ross Basin which were not sampled that may contribute copper and other ore-related metals to this upper reach of Cement Creek. Over most reaches of Cement Creek, the copper concentration is between 1-2 times CAV. The overbank sediment from just below the confluence of the South Fork of Cement Creek contains 290 ppm copper indicating that this sediment was transported from the uppermost reach of Cement Creek.
LeadLead concentrations (fig. 24E) range from 670 ppm (52 times CAV) at the headwaters to 320 ppm
(25 times CAV) at Memorial Park in Silverton. Lead concentrations in both the ferricrete and the iron bog samples are much lower, in the 5 ppm range. The concentration of lead in the bed sediments from Topeka Gulch is about six times CAV, but substantially below that found in Cement Creek. Again, the lead
54

concentration in the overbank sediment from below the confluence with the North and South Forks of Cement Creek is much higher than that in the sample from Cement Creek at this location.
StrontiumStrontium concentrations in all samples except those from the ferricrete and the iron bog are relatively
constant, averaging 250 ppm and are lower than CAV (384 ppm). The profile is relatively flat (fig. 24F). Strontium in solution behaves conservatively and is not sorbed or retained by the iron-hydroxide minerals; thus, strontium concentrations in the ferricrete and spring seep samples (iron bogs) are very low.
ZincLabile zinc concentrations (fig. 24G) are relatively constant over the course of Cement Creek near
200 ppm (2.6 times CAV) except for the sample from the headwaters where the zinc concentrations are slightly elevated (280 ppm or 3.7 times CAV). Contrasting the leach results from the bed sediments with the total zinc concentration data (fig. 24H) shows that about 33 percent of the zinc in the bed-sediment sample from the headwaters islabile whereas 67 percent is bound in more resistant sulfide mineral phase sphalerite. Microscopic identification of mineral phases and emission-spectrographic analysis of the residue from the leachate confirms that sphalerite, rather than tetrahedrite is present in the residual phase. The concentration of sphalerite-bound zinc in bed sediments remains relatively constant downstream from the Gladstone Mine, where it is 1,200 ppm, to Memorial Park in Silverton, where it is 1,000 ppm. The total zinc concentration in bed sediments at the confluence of Cement Creek with the upper Animas River is about 1,200 ppm or about 16 times the CAV.
VanadiumVanadium concentrations remain constant (averaging 143 ppm) throughout the course of Cement
Creek at concentrations near CAV (fig. 24H). The vanadium profile indicates that there are no samples from Cement Creek that are biased by hydrologic concentration of either iron-hydroxide minerals or placering of heavy minerals.
Figure 24. Metal distribution profiles (A-H) for Cement Creek; metal concentrations for labile arsenic (As), total arsenic, total cobalt (Co), labile copper (Cu), labile lead (Pb), total strontium(Sr), labile and total zinc (Zn; pd-labile zinc from partial digestion and td-total zinc) and total vanadium (V) are plotted against river distance measured upstream from the confluence of Cement Creek (at 24 km) with the Animas River below Silverton, Colo. Data from four different sample types are plotted as indicated by the explanation on the diagrams; no mill tailings were sampled on Cement Creek. Sample localities plotted are, beginning at the headwaters: Cement Creek-Cement Creek above the Gold King Mine (11.5 km), Cement Creek below the confluence of the North and South Fork confluence and below the inflow of the Gladstone Mine (13 km), Cement Creek below the confluence with Tiger Gulch (15.25 km), Memorial Park below gaging station (22.7 km), and the tie point at site A-72 on figure 28; the tributary sample-Topeka Gulch (19 km); and Other is one sample of ferricrete (11 km) and one sample from an iron bog fed by a spring (15.1 km).
Figure 25. Lead-isotope distribution profiles for Cement Creek plotted against river distance measured upstream from the confluence of Cement Creek (at 24 km) with the Animas River below Silverton, Colo. Data from four different sample types are plotted as indicated by the explanation on the diagrams; no mill tailings were sampled on Cement Creek. Data from different sample types are plotted as indicated by the explanation on the diagrams; distances are as noted in the explanation for fig. 24. Lead-isotopic data from the vein-type ore from the Sunnyside Mine (table 2) are plotted for comparison. The data from site A-72, the first site on the Animas River below the confluence, are plotted on all the diagrams to provide a tie-point with the data on figure 29.
55

ON
Con
cent
ratio
n of
As
(ppm
) _,.
-x
o-x
O
O
-»
o
o
o-x
O
O
O
O
+ 2 (D n ^
,0.
® H CT
(A ^ a. T ?. CD
§ < H
cr (A ^
Ol
-
o
-
O
(/>'
5T °
rn
- CD
^
"^ N
J o
-
N3
Ol
~
...... ......
]
......
g
.....
11 \ d / D
>::::: r ^
\ ym
^s.
\ 1 pT '
r- //--
/::::::
/.::::::
l
o
'
'"
-
^
...
13
::: 3
...
0)...
-o
0'.-
' & r^
f*
O
c...
o...
^J
^:
^ro
S"
^U::
Animas
Watershed
Study
Cement
Creek
t 2 0) n K H CT
(/> O CD i 4
? B- ^r
(/>
CD
Q.
(/> H S
5f (/>
Con
cent
ratio
n of
As
(p_x
-»
o
_x
O
O
en
-
o
-
O J2-
to
a
_».
o
/
-(D
W
'j?
3
N3 o
-
N3
01
~
CO
<
. .....
. .
. ..
..
....
)......
-
......
J
t
9
....
. I1 \\ /l<*::
::Y.
». 1 ::::;
*$j£
rr;
pm)
-x
O
O
O
0
0o
o
>
Aj l>0
....
....
o
-1
Animas
Watershed
Study
Cement
Creek

Cn
H cr
CA O Er o> i O
I t/> CD
Q.
(A M rjl to.
tjn
Con
cent
ratio
n of
Cu
(ppm
) _^
_*.
O
-^
O
0
-*
0
0
O-*
o
o
o
o
en
_
o
-
D
to
o£
-
(D
<"
Ni
o
-
Ni
cn
-
CO
11
...
.....
^
::::::
:^m
:: /::: i i i[- \" i;;x ::::::
\......
/ 4 B
I *
mo
J
Animas
Watershed
Study
Cement
Creek
3 H
cr CA O (D i O
cr to
n> Q.
(A H 5T
e/T
Con
cent
ratio
n of
Co
(ppm
)-»
0
-4.
O
O
-*
o
o
o
cn
-
o
-
D
to I
Ni
o
-
10 cn
-
CO
1 >
.......
.....
...
1
f T \i ^$
O
CD 0 C o
.
....
i!
.
o
"
Animas
Watershed
Study
Cement
Creek

Ln 00
i 33
£ > H
cr (fl t O
ET CO i 4
O 1 x- CO 0>
O.
to H n 5T
5F
Con
cent
ratio
n of
Sr
(ppm
)_i
-»
o
-»
o
o
o
o
o
tn
.
-_x o
-
a a>
1
§<
* '
"^
3
to
o
-
NJ cn
-
o
-
....
...
.
.....
.....
^
....
.
1
* *
; ! !!
) 1*
....
.
. ....
.
....
.
....
.
....
...
... m
Animas
Watershed
Study
Cement Creek
t 73
§'
>
H Z5. cr to O
g> -< O 1
?r
to
CD
D.
to H i;
ff to"
0
-
cn
-
o
-
0
w'
5T 8^ -
^ 3
ro
o
-
to
cn
-
CO
Con
cent
ratio
n of
Pb
(ppm
) _^
-*
o
-v
O
O
-i.
O
O
O*
o
o
o
o
£ W A *
H
o "O
CD
7T
D3 CD c o IT
X^f
^>"
i
. ...
(:::::
:
fe !"\
:::::::k
4 r^
o
Animas
Watershed
Study
Cement Creek

Con
cent
ratio
n (p
pm)
_^-"
. o
->
. o
o
-"-
O
O
0
0000
B f
N
N3
3
4
^
N
N
3
3
H
73
1
QJ
3 B
N if
§ §
Ol
-
o
-
g
1 3
to
o
-
to 01
-*
CO
....
....
.M
ll r '/ i k
/ \
/...
.
-A\
......
. ,
*
V" \' II
....
....
Mo
.....
Animas
Watershed
Study
Cement
Creek
CT
O
CD O
CT
(/)
CD a.
H tu
</T
Con
cent
ratio
n of
Zn
(ppm
) _^
-".
0-*
O
O
-*
0
O
O
O
O
0
O
Ol
-
o
-
g
5? 3
N)
o
-
N)
01
-
CO
.....
.....
!!'.!!
i
;;;
; 1
il
/ i k N
\
..... §
v
.... « mo
Animas
Watershed
Study
Cement Creek

Animas Watershed StudyCement Creek
19.50
Topeka Gulch_Q 19.00 - CL
"Vein-type oreCL
co
° 18.50 -
-H-
18.000 5 10 15 20 25 30
Distance (km.)
River A Tribs Other
i -r Ovrbk seds * Mill tails + GalenaIi____________i
Animas Watershed StudyCement Creek
39.50
39.00 4
£ Topeka Gulch^* -Q
38.50 4 CLCO
i CM ^
i 38.00 -
37.50
Vein-type ore
10 15 20 Distance (km.)
25 30
-»- River A Tribs Other
v Ovrbk seds x Mill tails + Galena
60

Lead-isotopic dataLead-isotopic data from the bed sediments, the overbank sediment, and the ferricrete and iron bog
samples closely match the lead-isotopic signature of the Eureka graben vein-type mineralization (figs. 25A and B). The bed-sediment sample from Topeka Gulch, which is largely unimpacted by mining activity, has a composition that differs substantially from the rest of the samples from the Cement Creek drainage and may reflect the contribution of lead from altered, unmined country rock. However, mass balance calculations show that the total contribution of lead of this type to the bed sediment of Cement Creek is small and insignificant. The lead-isotopic data indicated that the majority of the lead in the bed-sediments from Cement Creek below the Gladstone mine matches that of the Eureka graben vein-type ore. Even though the lead-isotopic compositions of the ferricrete and iron-bog samples match the lead-isotopic composition of the vein-type ore, the lead concentrations in these samples are very low and thus, these sources add very little lead to the bed sediments in Cement Creek.
Animas River Drainage Basin Upstream from SiivertonGeochemical and lead-isotopic data from bed sediments from the upper Animas River, that is the
segment of the Animas River above the confluence with Mineral Creek (25 km), are in figures 26 and 27. One mill site, the Kittimac Mill (13.8 km), was sampled specifically because the mill is immediately adjacent to the upper Animas River. This mill processed material from mines on the north side of Minnie Gulch (Sloan and Skowronski, 1975).
ArsenicArsenic concentrations from the 2M HCI-1%H2O2 digestion data indicate a uniform, albeit a gradually
decreasing concentration profile throughout the course of the upper Animas River (figs. 26A and B). The total and the partial digestion data have very similar profiles. The maximum concentration of arsenic found was about 100 ppm (about 55 times CAV) in the upper reach of the Animas River just above the Eureka townsite (a 1996 sample collection site). The arsenic concentration drops steadily along the course of the upper Animas River to 35 ppm just above the confluence with Cement Creek. Arsenic concentrations in Cement Creek and the upper Animas River at their confluence are essentially the same. Arsenic concentrations in the bed sediments from Picayne Gulch near the headwaters are higher than those in the bed sediments at the confluence of Picayne Gulch with the upper Animas River which suggests that the source of elevated arsenic may be from this tributary. Elsewhere along the course of the upper Animas River, the concentration of total and labile arsenic in the stream sediments from the tributaries samples are less than that in the bed sediments of the upper Animas River. Arsenic concentrations in the overbank sediment collected near Eureka are also higher than in the bed sediments at that point indicating transport from upstream during high flow. The efflorescent salt samples collected from along the course of the upper Animas River, except for one sample collected near Eureka, do not concentrate arsenic. The arsenic concentration in the composite surface sample from the Kittimac Mill site is also low. We conclude that the Kittimac Mill site does not appear to be a significant source of arsenic to the bed sediments of the Animas River.
CobaltThe concentration of cobalt in bed sediments from the upper Animas River (averaging 18 ppm) and
its tributaries (averaging 20 ppm) show little variation about the CAV (fig. 26C). The profile is essentially flat and comparable to that from both Mineral and Cement Creeks. The concentration of cobalt is elevated (50- 100 ppm) in three of the four water-soluble salt samples.
CopperCopper concentrations in the bed sediments of the upper Animas River at Animas Forks are
comparable to those in Cement Creek and much of Mineral Creek (fig. 26D). However, just above the confluence with Eureka Gulch and below the Eureka Mill site, labile copper concentrations exceed 4,000 ppm on the coatings of pebbles and reach almost 500 ppm (about seven times CAV) in bed sediments. The total copper concentration in this sample collected from below the confluence with Eureka Gulch is 550 ppm (eight times CAV) sample and more than 80 percent of the copper is labile. Copper concentrations are also elevated in the sample from the Kittimac Mill site as well as in the sample taken below the braided section of the upper
61

Animas River above Howardsville. Below Howardsville, the total copper concentration in bed sediments drops to 270 ppm below the confluence with Cunningham Creek. Copper concentrations in bed sediments are elevated in the section of the upper Animas River adjacent to the Mayflower Mill (between Boulder Gulch and Arrastra Creek). Copper concentrations in stream sediments from the tributaries are below CAV in the upper reaches of the upper Animas River, but are 2,200 ppm (32 times CAV) in Arrastra Creek, 50 percent of which is labile, and 420 ppm in bed sediments at the confluence of Boulder Gulch, 70 percent of which is labile. From the perspective of aquatic-life standards, it is important to note the high concentrations of copper are present in the white efflorescent precipitates that form by evaporation. Rain storms wash these water-soluble salts into the Animas River creating a spike of dissolved copper and other toxic metals that may exceed the acute toxicity standard for copper for aquatic life.
LeadThe concentration profile (fig. 26E) of lead in bed sediments from the upper Animas River is
comparable to that of copper. High concentrations (1,600-2,000 ppm or more) characterize the braided stream reaches below Eureka and below the Mayflower mill. The lead-isotopic data discussed below clearly indicate that the source of the lead in this stretch of the upper Animas River is not from Arrastra Creek. With the exception of the sample from Arrastra Creek, lead in stream sediments from the tributaries is substantially lower in concentration than in the bed sediments of the Animas River ranging from about 160 ppm at Animas Forks (12 times CAV) to 700 ppm in Eureka Gulch (more than 50 times CAV). The concentration of lead in stream sediments in Arrastra Creek is 4,000 ppm (more than 300 times CAV). The lead concentration in the stream-sediment sample from lowermost Boulder Gulch is 1,200 ppm, far too high to be from an unmineralized area. We suspect that the bed-sediment sample from Boulder Gulch has been contaminated by material from the tailings ponds upstream from the sample site. Lead concentrations in the overbank sediment from Eureka and from all of the efflorescent salt samples are substantially elevated above that in the bed sediments of the upper Animas River samples. Again, a rain storm would send a spike of water- soluble lead into the river and perhaps could exceed the acute aquatic-life standard for lead. The highest concentration of lead (17,000 ppm) was found in the mill tailings at the Kittimac Mill site.
StrontiumStrontium concentrations (fig. 26F) are again relatively constant throughout the course of the upper
Animas River averaging 190 ppm if the site just below Cunningham Creek is excluded. There is a major change in concentration of strontium in the bed sediments of the Animas River below the confluence with Cunningham Creek which is consistent with the elevated strontium concentrations in the stream-sediment samples from Cunningham Creek and Maggie Gulch. These elevated strontium concentrations reflect the presence of the Leadville and Dyer limestones outcrops in the headwaters of these basins that are too small to show at the scale of the regional geologic map (see fig. 3). Strontium concentrations are highly variable in the precipitates and vary directly with the calcium concentration. Strontium in the sample from the Kittimac Mill site is very low as is the measured calcium concentration. These measurements verify the low acid- buffering capacity of these mill tailings.
ZincThe profile and the pattern of both labile and total zinc concentrations (figs. 26G-H) are comparable
to those of copper and lead. Total zinc concentrations range between 3,500-4,400 ppm in the reaches of the upper Animas River adjacent to the Eureka and Mayflower mill sites. The overbank sediment and the bed sediments from Cunningham and Arrastra Creeks have zinc concentrations that are higher than those from adjacent segments of the upper Animas River whereas zinc concentrations from other tributaries are lower. The distribution profiles for labile and total zinc concentrations parallel one another. Fifty to 65 percent of the total zinc in bed sediments in the upper Animas River is labile; the remainder is present in the sulfide mineral sphalerite. In contrast, 75-80 percent of the zinc from Cunningham and Arrastra Creeks is labile and 85 percent of the zinc in the Boulder Gulch sample is labile indicating a high fraction of the zinc is carried in the iron-hydroxide phase. Zinc concentrations in three of the four precipitate samples range between 16,000 and 27,000 ppm (about 200-350 times CAV). The overbank sample contains a very high concentration of these water-soluble zinc salts as shown by the comparison between the data from the total and the 2M HCI-1%H2O2 digestion. Zinc in the sample from the Kittimac Mill site is low (310 ppm or four times CAV).
62

Mineral separates were made from the residue fraction of the leachate sample from sites (fig. 11) collected from the Animas River just above Howardsville (95ABS108) and from Cunningham Creek (95ABS109). The dominant sulfide mineral in the sample from Cunningham Creek was a ruby-red variety of sphalerite. In contrast, the dominant sulfide mineral present in the Howardsville sample was the blackjack variety of sphalerite; there were minor amounts of pyrite present. Magnetite and hematite were also present in about equal abundance in sample 95ABS108. The bulk composition of these heavy-mineral concentrates are given in table 3. An analysis of the magnetic fraction is also given. Note the increased concentration of zinc in the nonmagnetic fractions and the concentration of vanadium in the magnetic fraction. The magnetic fraction contains magnetite only whereas the nonmagnetic fraction from 95ABS108 contains some portion of hematite.
VanadiumVanadium concentrations in bed sediments from both the tributaries (average 122 ppm) and the upper
Animas River (average 105 ppm) are essentially the same and form a flat profile indicating that the changes in ore and ore-related metal concentrations are not the result of hydrologic concentration of heavy minerals in placers (fig. 26H). The vanadium profile of all three main tributaries to the Animas River, that is Mineral Creek, Cement Creek, and the upper Animas River above Silverton, indicate that the streams have an essentially constant supply of vanadium from magnetite and hematite in the Tertiary volcanic rocks (fig. 3).
Table 3. Semi-quantitative emission spectrographic data from heavy-mineral separates1 , Cunningham Creek and Animas River upstream from Howardsville
Sample2 Fe Ti Ag As Ba Cd Co Cu Mn Mo Ni Pb Sb V Znwt. wt.pet. pet. ppm ppm ppm ppm ppm ppm ppm ppm ppm ppm ppm ppm ppm
95ABS108-NM 3.0 0.7 1.5 <500 1500 50 20 200 1000 10 <10 50 <200 100 500095ABS109-Mag 20.0 0.5 <1 <500 <50 <50 50 10 500 <10 50 <20 <200 300 <50095ABS109-NM 7.0 1.0 <1 <500 2000 <50 30 100 700 <10 10 30 <200 150 2000
1 S.J. Sutley, analyst.2 NM, nonmagnetic heavy mineral separated from sample following 2M HCI-H202 digestion; Mag, magnetite
separated from sample following 2M HCI-1%H202 digestion.
Lead-isotopic dataLead-isotopic data (figs. 27A and B) show that the mineralization above Animas Forks differs from
the Eureka graben vein-type ore. Likewise, lead-isotopic data from stream sediments from Picayne Gulch reflect a different lead-isotopic signature from that of the Eureka graben vein-type ore. Samples from Eureka Gulch and from the Animas River between Eureka and Howardsville reflect the Eureka graben vein-type ore lead signature. The lead-isotopic composition of mill tailings from the Kittimac Mill site is more radiogenic and reflects a third mineralization style in the upper Animas River subbasin. Since ore from the north side of Minnie Gulch was processed at this mill, it is important to note that the lead-isotopic composition of the stream sediments from Maggie Gulch also differs from that of the Eureka graben vein-type ore lead signature. The lead-isotopic signature from both Cunningham and Arrastra Creeks also differs from the previous three mineralization signatures. As the ore from the South Silverton district was more precious-metal rich, it is not surprising to see that the lead-isotopic signatures differ between the Eureka graben vein-type ore lead of which the Sunnyside mine is typical, and the ore from the South Silverton district. The lead-isotopic composition of the bed sediments in the upper Animas River below the confluence of Cunningham Creek changes slightly indicating the addition of this new lead component. The lead-isotopic composition of the
63

sediments from Boulder Gulch indicates that they also contain some of this more radiogenic component of lead, the source of which cannot be determined at this time. Although there are several mineral districts in the upper Animas River subbasin, each of which seem to have differing lead-isotopic signatures, the isotopic composition of lead in the bed sediments of the upper Animas River is dominated by the Eureka graben vein- type ore lead signature as shown by the results in figure 27. Contributions of lead and their associated metals from the other centers of mineralization in the Animas River subbasin appear to be minor.
The isotopic composition of lead in the bed sediments of Cement Creek at the confluence with the Animas River (24 km) is identical to that measured in bed sediments from the Animas River above the confluence, so no calculation of the relative contributions to the total metal in the bed-sediments from Cement Creek can be made from the lead-isotopic data. There are significant changes in the metal concentrations in bed sediments of the upper Animas River between the site above the confluence of Cement Creek and site A-72 below the confluence with Mineral Creek. However, the sampling density does not allow a definitive calculation of the relative amounts of material added to the bed sediments of the upper Animas River by Cement and Mineral Creeks separately.
The isotopic composition of lead in the bed sediments of Mineral Creek is somewhat different from that of the upper Animas River above the confluence with Cement Creek. These data will be used below to calculate an upper limit for the percentage of material added to the bed sediments of the Animas River by Mineral Creek.
Figure 26. Metal distribution profiles (A-H) for the upper Animas River above Silverton; metal concentrations for labile arsenic (As), total arsenic, total cobalt (Co), labile copper (Cu), labile lead (Pb), total strontium(Sr), labile and total zinc (Zn; pd-labile zinc from the partial digestion and td-total zinc) and total vanadium (V) are plotted against river distance measured upstream from the confluence of Mineral Creek (at 25 km) with the Animas River below Silverton, Colo. Data from five different sample types are plotted as indicated by the explanation on the diagrams. Sample localities plotted are, beginning at the headwaters: upper Animas River (uAR) below Animas Forks (5.75 km), uAR above Eureka (a sample collected in 1996; 10.1 km), uAR below Eureka (a sample collected in 1995; 11.35 km), uAR above Howardsville (15.8 km), uAR below the confluence with Cunningham Creek (17.05 km), uAR above the trailer park (a sample collected in 1996; 22.5 km), uAR at bridge in Silverton (23.7 km), and the tie point at site A-72 with the data on figure 28. The tributary samples are from Picayne Gulch (7.25 km), Eureka Gulch (11.25 km), Maggie Gulch (14.2 km), Cunningham Creek (17.05 km), Arrastra Creek (20 km), and Boulder Gulch (20.9 km). Samples indicated as "Other" are water-soluble precipitates collected from the stream bed above low-flow water and are from the same sites as the overbank sediments. The mill tailings are from the Kittimac Mill site (13.8 km).
Figure 27. Lead-isotope distribution profiles for the upper Animas River plotted against river distance measured upstream from the confluence of Mineral Creek (at 25 km) with the Animas River below Silverton, Colo. Data from five different sample types are plotted as indicated by the explanation on the diagrams; distances are as noted in the explanation for figure 26. Samples indicated as "Other" are water-soluble precipitates collected from the stream bed above the low-flow water. The mill tailings are from the Kittimac Mill site. Lead-isotopic data from the vein-type ore are plotted for comparison (table 2). The data from site A-72, the first site on the Animas River below the confluence, are plotted on all the diagrams to provide a tie-point with the data on figure 29.
64

o\
2 CD TJ Q.
H CT 2 (D H cr
to
Con
cent
ratio
n of
As
(ppm
)
rj 3'
T3 CD
,>
0)
^
'zj-
3
CD
to
Q.
C
Q.
Con
cent
ratio
n of
As
(ppm
)
13 3"
r-
&
C/5
a
<£*
? <
>
0)3
5^"
g'C
D
& 55
^
CD
CD
CL
" CO c
a.

1000
3o
100 -
10 -
Animas Watershed StudyUpper Animas River
-^4-
10 15 20 Distance (km.)
25 30
River Tribs Other Ovrbkseds % Mill tails
Animas Watershed StudyUpper Animas River
10000
1000 $
o o
100 - :::
~
8 10 i
I::::::::::::::::::: : : : : ::::::::: *:::::::::::::::
::::: ::::: E ::::::::::::::::::::::::::::::::
I:::::::::::::::::::::::::::::::::::::::::::
10 15 20 25 Distance (km.)
30
-*- River Tribs Other Ovrbk seds % Mill tails
66

o\
2 CD t H
CT in O
5? CD t 9 3- 7T in
!
H i in
Con
cent
ratio
n of
Sr
(ppm
)
-*
o0
0
en
-
o
-
o in
5T 3
o
-
M cn
-
co
(
H
1i
^
. .....
j ......
| ^.
......
f
......
\
1
> I 1
I
. . .
.
O
O
O
t
. . .
.
. . .
.
*
. . .
. ii
o
J '
Animas
Watershed
Study
Upper Anima
s Rive
r
t 73
<'
-i H cr
w O
Er
CD̂ 4 O 1 CL in H sf.
Con
cent
ratio
n of
Pb
(ppm
) _^
^
_x
O
O
-^
O
O
O-*
o
o
o
o
->
o
o
o
o
o
cn
-
o
-
g
of 3
(0 o
-
(0 cn
-
CO
.......
. ......
.. . ..
......
........
*
^ . >
......
.\""
"\"'
"\"" \" \- "\
<. .
>..
V
....
..
^
......
1
......
/
......
i
1 t 1
>r
fpjS
"^4
w..
o
-1
Animas
Watershed
Study
Upper Anima
s River

ON 00
N
N
3
3
en
<!>
Q.
"R
N
N3
3
en
i!{
to
o ro
en CO o
Con
cent
ratio
n (p
pm)
33'
CD >
13 3 8 (D
Q.
" CO r-
H c Q.
Con
cent
ratio
n of
Zn
(ppm
)
g
3'
CD >
CD13
r£
3
<*8!
c3
CD
d.
c
d.

19.50
CL
.a a.
19.00 -
18.50 -
18.00
Animas Watershed StudyUpper Animas River
Kittimac ill Site
Vein-type ore
10 15 Distance (km.)
20 25
River Ovrbk seds
Tribs Mill tails
Other Galena
30
Animas Watershed StudyUpper Animas River
.a a.s ̂.0 Q_
39.00 -
38.50 -
38.00 -
37.50
Kittimac Mill Site
X
A
Vein-type ore
10 15 Distance (km.)
20 25
River A Tribs Other
Ovrbk sdes :z Mill tails + Galena
30
69

Animas River Drainage Basin: Silverton, Colorado to Aztec, New MexicoThe Animas Canyon reach, defined as that reach of the Animas River below Silverton to the KOA
Campground sample site below Bakers Bridge (at 72.5 km), and the lower Animas River have very different geologic and resulting physiographic character. In the Canyon reach, the bedrock is Precambrian in age (fig. 3), very resistant to weathering, and supplies a small amount of sediment to the Animas River. The Animas River is highly incised and flows rapidly through the Animas Canyon reach transporting the metals and sediments with little addition to the bed sediments from the tributaries. In contrast, in the lower reaches, the Animas River has formed a wide flood plain on glacial terraces, and it flows in wide, meandering courses containing numerous oxbow lakes. In the lower Animas River reach, the bedrock consists of Paleozoic, Mesozoic, and Tertiary sedimentary rocks that are much more readily weathered. The amount of sediment added by individual tributaries varies greatly. In addition, the Animas River passes through the city of Durango and picks up metal loads of possible anthropogenic origin. This contrast in the basic physiographic and morphological features contribute differentially to the total mass of metals in the bed sediments of the Animas River.
Two overbank samples, one from Elk Park (34 km) and one from the KOA Campground below Bakers Bridge (72.5 km), and a stream-sediment sample from Hermosa Creek (80 km) warrant special mention. The two overbank samples, unlike those from the stream reaches above Silverton, do not have metal concentrations elevated above those found in the Animas River at the point where they were collected. Thus, these data, with the exception of zinc, plot on the metal profile curve for the bed sediments from the Animas River and will not be discussed further in this section. The stream-sediment sample from Hermosa Creek (95ABS135, "Other") was collected from a 0.4 km section of Hermosa Creek that is used by an irrigation company to transfer Animas River water from one irrigation canal to another. This sample, shown as the "Other" sample in figure 28, matches the bed sediment profile of the Animas River quite well. A second sample was collected later from Hermosa Creek at the gaging station (96ABS111) to provide geochemical data for Hermosa Creek. Data from this stream prompted us to look more closely at the samples collected in the earlier reconnaissance geochemical studies and to eliminate sediment samples that were affected by metals present in the water from the irrigation canal as noted above. These sites do not represent the geochemistry of the surrounding area and therefore were eliminated from the geochemical data base used to develop the regional geochemical maps. However, they clearly represent a stream-sediment sample whose geochemistry was greatly influenced by the precipitation of metals from the transported Animas River water.
ArsenicArsenic concentrations in bed sediments of the Animas River below Silverton drop from 20 ppm in
the leach (about 10 times CAV) to near the limit of detection at 4 ppm near Durango (fig. 28A). Comparison of the leach data with the total digestion data (fig. 28B) indicates that the bed-sediment samples from the Animas River contain 5-15 ppm arsenic in either sulfide or silicate phases. Total arsenic concentrations increase immediately downstream in the Animas Canyon at Elk Park (34 km) and may reflect the addition of material from Deadwood Gulch (26.5 km) and Deer Park Creek (28 km) which drain mineralized areas on Sultan Mountain south of Silverton. Sediments from tributaries draining into the Animas Canyon reach contain 5-10 ppm arsenic whereas the samples from the tributaries south of Durango contain 3-5 ppm. Total arsenic concentrations increase from 5 to 7 ppm (three to four times CAV) below Durango (105 km) and may indicate the addition of arsenic from sediments derived from the Mesozoic and Tertiary rocks being eroded in this reach or from the abandoned copper smelter south of Durango.
CobaltCobalt concentrations in the bed sediments of the Animas River below Silverton are nearly constant
at about 18 ppm (fig. 28C) except for one site at Weaselskin Bridge (at 122 km). Cobalt concentrations in stream sediments from the tributaries range between 10-15 ppm and are generally somewhat less than that of the bed sediments from the Animas River for most of its distance. Above the confluence of the Florida River (136 km), the concentration of cobalt in the bed sediments of the Animas River and the stream sediments from the tributaries drops to about 12 ppm.
70

CopperCopper concentrations in the leach digestion decrease uniformly through the Animas Canyon reach
from 250 ppm (3.7 times CAV) at Silverton to 58 ppm at Weaselskin Bridge (122 km; fig. 28D). Total copper concentrations over this reach drop steadily from 330 ppm at Silverton to 200 ppm at the KOA Campground site (72.5 km), to 120 ppm at Weaselskin Bridge (122 km). Below the confluence with the Florida River (136 km), this component virtually drops abruptly from about 70 ppm to about 20 ppm. This pattern is noted to a lesser degree in the cobalt profile, but is also very pronounced in the zinc and vanadium profiles. From above the confluence of the Florida River southward (136 km), it would appear that all of the metals transported in the heavy-mineral fraction have been effectively buried in the bed sediments and are removed from active communication with the river water except during high-flow stages.
LeadLead concentrations in the bed sediments of the Animas River below Silverton drop from 1,200 ppm
(about 90 times CAV) to about 300 ppm in Durango (100 km; about 20-25 times CAV) and to 140 ppm (122 km; 10 times CAV) at Weaselskin Bridge (fig. 28E). Below the confluence of the Florida River (136 km), the lead concentration drops to about 30 ppm. However, at Aztec (172 km), the lead concentration rises to 64 ppm. Labile lead concentrations in stream sediments from the tributary samples are uniformly low, generally less than 10 ppm, whereas the total lead concentration in stream sediments from the tributaries is closer to 20 ppm, suggesting that about 50 percent of the lead in the stream sediments from the tributaries is in the silicate phases. However, the lead concentration in the bed sediments over much of the course of the Animas River from Silverton to the confluence of the Florida River (136 km) is totally dominated by leachable lead sorbed onto the iron-hydroxide phase. The rise in the lead concentration in the bed sediment sample from Aztec is interpreted to be the result of accumulation of the iron-hydroxide phase in the sediments because the total digestion data contain only 9 ppm of silicate-bound lead, but 64 ppm of labile lead.
StrontiumThe profile of strontium reflects the geochemistry of bedrock geology of the drainage basin. Through
the Animas Canyon reach, there is no change in the strontium concentration in the bed sediments (fig. 28F). Strontium concentrations in the tributaries draining Precambrian rocks (fig. 3) are lower than that in the bed sediments of the Animas River and have only a minor dilution effect on strontium concentrations in the bed sediments. Below the KOA Campground (72.5 km), strontium concentrations drop in response to sediment being added by tributaries draining basins underlain by Paleozoic rocks. Between Durango and the confluence of the Florida River (100-136 km), there is a dramatic increase in strontium in the bed sediments reflecting sediments derived from the Upper Cretaceous Picture Cliffs, Kirtland, and Fruitland Formations, and the lower Tertiary Animas Formation (fig. 3). The sample from Basin Creek (118 km) has a strontium concentration of 420 ppm. South of the confluence with the Florida River, the strontium concentration in the bed sediments of the Animas River again drops to 200 ppm at Aztec. The strontium data and the heavy- mineral data from the copper, vanadium and zinc profiles all indicate that there is a substantial volume of sediment added to the Animas River between Durango and the Colorado-New Mexico state line (140 km).
ZincZinc concentrations in the 2M HCI-1%H2O2 digestion are about 800 ppm at Silverton and increase
to 1,200 ppm in the bed sediment from the Animas River collected from the KOA Campground site (72.5 km) at the base of the Animas Canyon reach (fig. 28G) indicating a substantial gain in labile zinc in the iron- hydroxide phase in the Animas Canyon reach. This corresponds to a loss of dissolved zinc mass from the water in this stream reach. Labile zinc in stream sediments from the tributaries, except for those from Deadwood Gulch and Deer Park Creek (26.5-28 km), have zinc concentrations of less than 100 ppm. Labile zinc concentrations in the two overbank sediments are lower than in the bed sediments from the Animas River. This is the reverse of what was seen in overbank sediments from reaches above Silverton where the zinc concentration in overbank sediments was always elevated above the concentration in the bed sediment collected at that site. Labile zinc concentrations drop substantially between the KOA Campground site (72.5 km) and the Trimble Bridge site (82 km), and then gradually increase to the Weaselskin Bridge site (122 km).
71

Below the confluence of the Florida River (136 km), labile zinc concentrations drop from 1,100 ppm to 240 ppm but rise again to 290 ppm at Aztec (172 km).
Total zinc concentrations behave quite differently (fig. 28H). At the Animas River site below Silverton (A-72) only 44 percent of the zinc is in the iron-hydroxide phase. Most of the zinc in the bed sediments is in sphalerite. At Elk Park (34 km), the labile zinc concentration decreased to only 30 percent of the total zinc present. At the KOA Campground site (72.5 km), labile zinc constitutes 75 percent of the total zinc in the bed sediments. This pattern is relatively constant through the stretch between the KOA Campground and Weaselskin Bridge (72.5-122 km). Below Weaselskin Bridge, the amount of sediment being added by the tributaries increases dramatically and sphalerite virtually disappears as a heavy-mineral phase in the active bed sediments of the Animas River. The difference between the total and the labile zinc concentrations is reduced to about 50-100 ppm. This difference is comparable to that which we see between the labile and the total zinc concentrations in stream sediments from the tributaries where 50-100 ppm of zinc is silicate-bound. Since the zinc concentration in the sediment from Basin Creek (118 km) is very low (38 ppm), the fact that the labile zinc concentration increases from 230 to 290 ppm between the confluence of the Florida River (136 km) and Aztec (172 kmy indicates that the zinc in the iron-hydroxide phase is settling out of the water column and into the bed sediments over this reach of the Animas River.
VanadiumVanadium concentrations in the bed sediments of the Animas River Canyon reach (26.5-72.5 km; fig.
28H) have a relatively flat profile and reflect the concentrations in Mineral and Cement Creeks and the upper Animas River above Silverton. Between the KOA Campground site below Bakers Bridge and Weaselskin Bridge (72.5 -122 km), there is a gradual increase in vanadium from about 150 to 180 ppm. This increase cannot be attributed to the addition of vanadium in stream sediments being added by the tributaries. To the contrary, the addition of sediments from the tributaries should lower the vanadium concentration in the bed sediments of the Animas River (fig. 28H). We attribute the increase of vanadium and of total zinc concentrations to the accumulation of the heavy minerals magnetite and sphalerite in the near-surface bed sediments of the Animas River below the Animas Canyon reach. Between Weaselskin Bridge (122 km) and the confluence of the Florida River (136 km), the vanadium concentration drops to about 100 ppm matching that of the sediment from the Basin Creek tributary. Since the source of the sediments in Basin Creek is sedimentary rocks, we assume that the vanadium is largely in the silicate minerals.
Lead-isotoplc dataLead-isotopic data from the Marcella Mine on Kendall Mountain closely matches that from the bed
sediments of Deadwood Gulch and Deer Park Creek (26.5 and 28 km respectively) and is slightly elevated above that of the bed sediments of the Animas River below Silverton (figs. 29A and B). Throughout the rest of the Precambrian section exposed in the Animas Canyon reach, lead from the stream sediments sampled from tributaries draining the Precambrian rocks differs substantially from that in the bed sediments of the Animas River in the Canyon reach. The gradual increase in lead-isotopic ratios indicates a small addition of sediment derived from Precambrian rock to the bed sediment of the Animas River. Likewise, sediments derived from erosion of Paleozoic and Mesozoic sedimentary rocks cropping out between the KOA Campground site (72.5 km) and Durango (100 km) add sediment, which results in a gradual change in the lead-isotopic ratios along the course of the Animas River. It is clear from these data, however, that the lead concentration in the bed sediments of the Animas River is dominated by lead from above Silverton that is sorbed to the precipitated colloidal component in the bed sediments.
72

Figure 28. Metal distribution profiles (A-H) for the Animas River below Silverton to Aztec, New Mexico; metal concentrations for labile arsenic (As), total arsenic, total cobalt (Co), labile copper (Cu), labile lead (Pb), total strontium(Sr), labile and total zinc (Zn; pd-labile zinc from the partial digestion and td-total zinc) and total vanadium (V) plotted against river distance measured downstream from the confluence of Mineral Creek (25 km) with the Animas River below Silverton, Colo. Data from four different sample types are plotted as indicated by the explanation on the diagrams; no mill tailings were sampled. Note that metal concentrations in stream sediments from tributary streams below the confluence, but within the Sultan Stock where mines are still present (fig. 4) still have elevated metal concentrations. Metal concentrations in tributary streams below 30 km that drain primarily the area underlain by sedimentary rocks in the Animas watershed have metal concentrations at or below that of crustal abundance values (CAV). Sample localities on the Animas River are indicated, plotted as a function of distance: site A-72 below the confluence with Mineral Creek (26.25 km), Elk Park (34 km), the KOA Campground site below Bakers Bridge (72.5 km), below the Trimble Bridge below the quarry (82.35 km), above the 32nd Street Bridge in Durango (100.75 km), at the Red Lion Inn above the confluence with Lightner Creek (105 km), at the park above Colo. highway 550 (106.2 km), south of Weaselskin Bridge (122 km), above the Bondad Bridge (135.5 km), at the Cedar Hill gaging station (137.5 km), and above the bridge in Aztec, New Mexico (171.5 km). Sample localities of the tributaries to the Animas River are indicated, plotted as a function of distance from north to south: Deadwood Gulch (26.5 km), Deer Park Creek (28 km), Sultan Creek below the Molas Mine (29.5 km), Molas Creek above the confluence with the Animas River (32.75 km), Elk Creek (34.35 km), Lime Creek upstream from U.S. 550 (55 km), Cascade Creek upstream from U.S. 550 (55.05 km), Cascade Creek above the confluence with the Animas River (55.1 km), Grasshopper Creek (57.8 km), Hermosa Creek at the gaging station (80 km), Junction Creek 1.7 km west of town (102.4 km), Lightner Creek (105.1 km), Basin Creek (117.75 km), and the Florida River (136 km). The "Other" samples are from the contaminated segment of Hermosa Creek (80 km) and from Junction Creek (102.35 km) in the city limits of Durango.
Figure 29. Profile plots of the lead-isotopic signatures of acid-soluble metals from sediments from the tributaries draining into the Animas River below the confluence with Mineral Creek (25 km) with the upper Animas River at Silverton Colo. and from sediments from the main course of the Animas River. Data from four different sample types are plotted as indicated by the explanation on the diagrams; distances are as noted in the explanation for figure 28. No mill tailings were sampled. Lead-isotopic data from Deadwood gulch and Dear Park Creek match closely the lead-isotopic signature from the Marcella Mine in the Sultan Stock. Note that the lead-isotopic compositions from tributaries draining the Precambrian rocks have a highly radiogenic 206Pb/204Pb value relative to that from tributaries draining Paleozoic and Mesozoic sedimentary rocks. The two "Other" samples are from the contaminated segment of Hermosa Creek (80 km) and from Junction Creek in the city limits of Durango. Note that the lead-isotopic signature from this Hermosa Creek sample matches that of the area above Silverton. The lead-isotopic data indicate that most of the lead in the bed sediments of the Animas River was derived from the area above Silverton, Colo. "
73

Animas Watershed StudyAnimas River, Silverton Co to Aztec NM
1000
25 50 75 100 125 Distance (km.)
150
River Tribs Other Ovrbk seds x Mill tails
Animas Watershed StudyAnimas River, Silverton Co to Aztec NM
1000 T
EQ.
C 0)oCo o
100
10 -
25 50 75 100 125 Distance (km.)
150
-»- River (pd) a Tribs (pd) -*- River (td) > Tribs (td)
175
74

0> H
in t O Er
0> O
| in
H 5T
5T
Con
cent
ratio
n of
Cu
(ppm
) ^
_i
O
-*
0
0-*
o
o
o
-*
o
o
o
o
Ol
o
-
01
-
g i-* o> o
P
ro
_O
l
01
-o i
.
1^
..*>
i- t
......
. (
V » *
,V
V-
/...
....
/
>'
1
......
. 1
»U
^r-
....
..
«ll
:::::: ......
......
.....«
i\
"/
1 1 ' ' 1 1
/
/.... A' Ja 1'
..1... 3 s^s
^^
TO
l
X te
....
...
>
^^
ZJ 3 0) O ZJ o ZJ CD
CD
O
......
......
II
Animas
Waters!"
Animas
River, Silverton
C v. J
J0
CD;
o
CL
: &
O)
: CD
pJ*
: z C
L^^ ^
^^
*
Ol
o> H
CT
O 0) n O CT
7? in
0)
ex (A H
5T
Con
cent
ratio
n of
Co
(ppm
)-J
. O
_*
o
o
-*
o
o
oN
) .
. .1
..i
Ol
o
-
01
-
0
in
5f
0) O
3
N)
- O
l
Ol
- O
. :::
$r
::::>
i
.... .
^ »* i i
...>-..
1
. ..*.y
l....
.. * ^ /
!!!!!
/. .
.... p
4 \ \ > r
i $ n 1^ !
.
.
....
....
.... s
Ol
Animas
Watershed
Study
Animas
River, Silverto
n Co
to
Azte
c NM

Con
cent
ratio
n of
Sr
(ppm
)
ON
2 (D CT
(A O Er
o> O I 7T
O) 2. C/)
ro
en in
o
gw'
of
o o
CD
O ro
in OJ o
3 2
.Q
) co
(D
O IT
0
CD
o
Q
L
C
z 0-
Con
cent
ratio
n of
Pb
(ppm
)
3 3
Q)
-5co
3 a CD
o \
^
C/)
O IT
0
CDo
Q
L
CD
o C
IZ
0-

Animas Watershed StudyAnimas River, Silverton Co to Aztec NM
10000
Animas Canyon
1025 50 75 100
Distance (km.)125 150 175
-m- River Tribs Other Ovrbk seds Mill tails
Animas Watershed StudyAnimas River, Silverton Co to Aztec NM
10000
50 75 100 125 Distance (km.)
150
-*- Zn River (pd)
si ZnTribs(pd)
Zn River (td)
Zn Tribs (td)
V River (td)
VTribs(td)
175
77

Animas Watershed StudyAnimas River, Silverton Co to Aztec NM
21.50 -i
AA_ . _ _ . __21 oo ............... Hermosa Creek
20.50 - - A ....................A A
CL
CL 19 - 50 AA J^ 8 ^CM 19.00 ------------------ ......... - A .
+18.50 -M -* " * - - -
ms'tjjiyll
Urban/ Comtam.
-
+
18.00 - i i i , , --
25 50 75 100 125 150 175 Distance (km.)
-»- River A Tribs Other T Ovrbkseds x Mill tails -f- Galena
Animas Watershed StudyAnimas River, Silverton Co to Aztec NM
A
O ' jfc ACL A ^^5 jk
d? ^R «;n .............................n *jw.«jwooCM ^
OO f*n XK ^_ i *"" ̂»_ ^r^
^ Her37.50 - i , i '
25 50 75 100 Distance (km.)
-«- River A Tribs
v Ovrbk seds * Mill tails
_ -,
mosa Creek125 150 175
Other + Galena
78

Metal Transport from the La Plata Mining DistrictEckel and others (1949) describe the geology, mines, and production from the La Plata mining district
near the headwaters of Junction Creek and the La Plata River. The La Plata deposit is a porphyry copper deposit associated with the intrusion of a syenite porphyry. Eckel and others (1949) report production of 2,336 tons of copper ore yielding about 224,000 pounds of copper and about 4,500 ounces of silver from a small open-pit from the Copper Hill Mine in the La Plata River watershed. Minor amounts of gold were produced with byproduct copper and silver from the Bay City Mine. Small amounts of both gold and silver were produced from precious-metal veins primarily from the Cumberland Mine, the Doyle Group, the Durango Girl Mine, the Eagle Pass Mine, the Gold King Mine, the Incas Mine, the Jumbo-Morovoratz Mine, the Lucky Discovery Mine, the Mason Mine and the Neglected Mine. The May Day and the Idaho Mines produced the bulk of the precious metals from the district, reporting total production of about 123,000 ounces of gold and 1,140 ounces of silver between 1903 and 1943. These two mines also reported minor byproduct lead and copper. Both cinnabar and native mercury are reported from the precious-metal veins. Of the mines listed above having recorded production, only the Durango Girl Mine and the Neglected Mine are in the headwaters of Junction Creek.
In the National Geochemical data base (Hoffman and Buttleman, 1994), six stream-sediment samples were collected from along Junction Creek downstream from the La Plata mining district and two new stream- sediment samples were collected in this study near Durango. None of the stream-sediment samples contained elevated concentrations of copper, lead, or zinc (figs. 6-8) except for sample 95ABD138 which was collected in Durango, inside the city limits. We see no evidence of the transport of metals to the Animas River from the La Plata mining district via Junction Creek.
Metals from the Smelter Sites South of DurangoThe U.S. EPA conducted a preliminary site assessment of the copper smelter site located on the west
bank of the Animas River about 1 km south of the confluence with Lightner Creek. Slag from the copper smelter is exposed on the west bank of the Animas River (U.S. EPA, 1996a). Analyses of the slag shows high concentrations of copper, lead, zinc, arsenic, manganese and iron were present. Analyses of bed sediments from the Animas River did not indicate that the slag pile was a source of metals to the Animas River (U.S. EPA, 1996b). No remedial action was recommended by the U.S. EPA (1996a). However, this site cannot be ruled out as the source for the small increase in arsenic concentrations found in the bed sediment data (fig. 28A and B) south of Durango. This small change may not be significant given the larger upstream sources of metals.
The EPA conducted a preliminary site assessment of buried slag from a lead smelter located on the west bank of the Animas River about 0.2 km south of the confluence with Lightner Creek. Slag from the lead smelter is exposed in the west cut bank of the Animas River (U.S. EPA, 1996c). Analyses of bed-sediment samples from the Animas River show that there are elevated zinc (28,500 ppm) and cadmium (498 ppm) concentrations at the cut bank site that reflect erosion of slag material from the cut bank, but both upstream and downstream, the metal concentrations were not elevated (U.S. EPA, 1996d). No remedial action was recommended by the U.S. EPA (1996c).
Urban Metal SignaturesTwo samples, one from Junction Creek collected in Durango, and one from the Animas River at the
park above the 32nd Street Bridge, show some urban metal contamination signatures. These urban metal sources contribute small amounts of metal contamination relative to the metal in the bed-sediments from the area above Silverton.
In the river-sediment sample from the park above 32nd Street Bridge (95ABS137), there are elevated concentrations of zinc and copper (fig. 28H). Elevated dissolved copper concentrations were also noted at this site. The absence of tin in the bed sediments would suggest that this is not likely from particulate brass contamination. The source of this urban metal signature is unknown.
The increased metal signature in Junction Creek is evident when comparing the data from sample 95ABS138 (collected one block west of U.S. 550 in Durango) with the data from sample 95ABS139 (collected from Junction Creek where it crosses a farm 1.7 km upstream and outside the city limits of Durango; sample collected with permission of the property owner). The sample from Junction Creek collected in the city limits of Durango (95ABS138) contains elevated concentrations of arsenic, chromium, copper, mercury, nickel, lead,
79

vanadium, and zinc, all metals used in our industrial society. Furthermore, the lead-isotopic compositions in the two samples from Junction Creek differ, probably reflecting lead added to the environment by the combustion of gasoline. These urban metal sources contribute only small amounts of metals to the Animas River.
Selenium and Mercury in Bed Sediments of the Animas RiverSelenium concentrations in bed sediments from Mineral and Cement Creeks, the Animas River, and
their respective tributaries are presented in figure 30A. Although the diagram contains many data points, the most important feature of the plot is the small variation in the data set as a whole. Selenium is isochemical with sulfur and substitutes for sulfur in the sulfide minerals. It is not surprising that the sediments derived from the area above Silverton contain 1-2 ppm selenium and that the bed sediments of the Animas Canyon reach contain about 1 ppm selenium. The crustal abundance value for selenium is 0.5 ppm (Fortescue, 1992). With the influx of sediment from tributaries draining the Paleozoic and Mesozoic rocks below the KOA Campground site (72.5 km), selenium concentrations in the bed sediments drop to CAV. In Durango, selenium concentrations in bed sBdiments again rise to about 1 ppm in response to sediments derived locally from the Mancos Shale which crops out just above Lightner Creek (105 km). Sediments from Lightner Creek are characterized by a large component of Mancos Shale and contain 2.7 ppm selenium. Below the confluence with the Florida River (136 km), the selenium concentration drops again to 0.4 ppm reflecting the large component of sediments supplied by tributaries draining areas underlain by Tertiary rocks (fig. 3).
Mercury concentrations at several sites above Silverton (fig. 306) are significantly elevated above the crustal abundance value (0.09 ppm; Fortescue, 1992). Five of the sites above Silverton contain elevated mercury concentrations, above 0.3 ppm (about three times CAV). All of these sites, except the Kittimac Mill site, are from the headwaters of the respective drainages where early mining activities took place. We cannot distinguish from these data and published geochemical data on the mineral deposits whether these elevated mercury concentrations are related genetically to the epithermal vein mineralization or to early gold recovery practices by individual miners. However, below Silverton, the only sample that contained elevated concentrations of mercury is the sample from Junction Creek in the city of Durango (102 km) which we interpret as urban contamination. Mercury concentrations in bed sediments of the Animas River below Silverton are generally at or below CAV.
Undiscovered Mineral Resources in the Silverton AreaThe lead-isotopic and chemical data from stream sediments from Mineral and Cement Creeks and
their tributaries suggest that the mineralized structures in the Eureka Graben (fig. 4) may extend west of the Gladstone Mine near the confluence of North and South Forks of Cement Creek into the headwaters of Burro Gulch in the Mineral Creek drainage. The lead-isotopic signature of the vein-type ore found in the Sunnyside Mine is present in the sediments of Browns Gulch (fig. 23). The surface expressions of these veins in Prospect Gulch may have been overprinted by the later intrusion and alteration associated with the chimney deposits of the Red Mountain district. Exploration for concealed extensions of the vein-type ore may be warranted in the western portion of upper Cement Creek between Prospect Gulch and Minnesota Gulch west to the headwaters of Browns Gulch where mineralization having the Eureka graben vein-type ore lead-isotopic signature is exposed.
Geochemicai Signature of Colloid Component in Waters and Bed SedimentsThe colloidal component dominates the leachable chemistry component of the bed sediments.
Aggregated colloidal material is deposited during the low-flow cycle like a blanket on the stream bed and adds a substantial amount of metal to the bed sediments (fig. 18). The mass transfer of metals, as shown by the loss of dissolved and colloidal loads, is an indication that the bed sediments are gaining metals. The constant concentration ratios of iron to zinc in the colloids and in the 2M HCI-H2O2 digestions of the bed sediments are
Figure 30. Metal distribution profiles for selenium (Se) and mercury (Hg) for the Animas River below Silverton to Aztec, New Mexico plotted against river distance measured downstream from the confluence of Mineral Creek (25 km) with the upper Animas River below Silverton, Colo. The limit of detection for selenium was 0.02 ppm and for mercury was 0.02 ppm.
80

10.00 -
E*
Q. Q.^ 1-00 -C/D
0
§
2
£ 0.10 -c0O
Animas Watershed StudyAnimas River, Silverton Co to Aztec NM
::::::::: LlC
:::£&u-htner Crk.
^^=^-^1:
^s,.
-^^^k; - - - - - cr '
:::::: : «_^-r-"
:::;::.::.: -JSSg'^y*m^5........... -^^
: :/ :̂ ^*k I'--'::::::::: -\:_: ::::;*:::: f\: gfr :::::::::ni ^~v rm...LJ -UJ- £»fcj
/ \.._m. ..._.._.._. ra ..--.-..--_-..._..
-72 ; ; ; ; ; ; ; : i : : : : : : i : ; : i ; : : : i : : : : : : : :
.... A. .....
0.01 -i ,
0 25 50 75 100 Distance (km.)
125 150 175
-»- Animas River -^. Mineral Creek - - Cement Creek a Tribs A Tribs * Tribs
Animas Watershed StudyAnimas River, Silverton Co to Aztec NM
10.00 i .............................................. .|
E*
Q.
"5 1.00 -
Concentration of Ht
D 0 D '-±
-» o
0
'/
Kittimac Mill Site
i fes5i
: : a : : : 7&g\ :::::::::::::::::::::::iJL ^LP^ j^-^^
d\ ^
..it^_.__1 . 0 ............Qv .
. . ^A £T -----
^i::^::
Urban : : : : :
Contam. - - - -
^^i {^ffiS^^f^n§ - - -^ -a - - - -J*'ri \: ......... .yfe-e^SariH
- - -a - - -a \-^..^_..\n n r-i rvi ^^
25 50 75 100 Distance (km.)
125 150 175
-«- Animas River -* Mineral Creek Cement Creek
a Tribs A Tribs x Tribs
81

a measure of the intimate mixing between colloids and bed sediments downstream from Silverton. Upstream from Silverton and downstream from Cement Creek, the ratios did not agree. Downstream from Mineral Creek, however, after colloids had settled from the Animas River and zinc had sorbed to them, the ratios agreed very well. In fact, the iron to zinc ratios were comparable for a 100-km reach of the Animas River (fig. 31 A). The close agreement in the iron to zinc ratio indicates that the iron hydroxide component digested from the bed sediments was essentially the same as the colloidal material. Some part of the colloidal material that settled to the stream bed had become part of the bed sediment coatings.
A similar correspondence of concentration ratios between colloids and bed sediments occurred for the ratios of aluminum (fig. 31 B) and copper (fig. 31C) with respect to zinc, although the agreement is not as striking. The amount of aluminum deposition from water to bed sediments downstream from the confluence of Mineral Creek was about 260 kg/day. This amount of deposition had a substantial influence on the chemistry of the iron hydroxide fraction of the bed sediments, and thus the metal ratios in the colloids and the bed sediments varied together.
Comparison of the 1995 and the 1996 Bed-Sediment DataComparisons of the yields from samples collected at the same sites in both 1995 and 1996 indicates
that the metals associated with the iron-hydroxide phases, that is copper, lead, and zinc in particular, are enriched in the 1996 data set from 10-50 percent over what these same sites were in 1995. This indicates that the hydrograph affects the amount of colloidal component that accumulates at any given site during the year. The snowpack in 1996 was low and the resulting low-volume spring runoff may not have completely flushed the streams of cumulated colloidal components (fig. 9). Whereas the general form of the metal profiles from year-to-year are the same, it would be difficult to use the sediment samples as a monitoring tool to evaluate the effects of remediation because of the variability caused by this flushing process (see appendix VII). Water chemistry probably provides a better monitoring tool because it provides an instanteous measure of metals in the stream whereas the sediment sample provides a variable, annual integrated measure of the metals in the streams.
Calculation of the Contribution to the Total Amount of Metal in Bed Sediments fromVarious Sources
The partitioning of copper, lead, and zinc between the water, colloidal and bed sediments as a function of pH is very evident from the combined water, colloid, and bed-sediment data in this report. In Cement Creek at Memorial Park, where the pH at low flow was 3.89, copper concentrations were high in the dissolved phase and labile copper in the bed sediments upstream from Memorial Park was in the range of 50-80 ppm (fig. 24D). In the upper Animas River above Silverton, where the pH at low flow was 6.82, copper concentration in the water were low whereas labile copper concentrations in the bed sediments were in the range of 300-500 ppm (fig. 26D). Smith and others (1992) demonstrated that the partitioning of metals in acidic, iron-rich waters followed a predictable path that could be modeled using sorbtion partitioning data and the iron hydroxide content of these waters (fig. 32A and B). As the colloidal content of the water decreases, the pH at which metals are sorbed by the colloids increases. We interpret the data from our study to indicate that copper is partitioned to the bed sediments through the sorption of copper to the colloids as a function of increasing pH. The aggregation and settling of the colloidal phase to the bed sediments results in a partitioning of the metal load from the dissolved and suspended colloids to storage in a static blanket of colloidal material in the bed sediments.
Dissolved and colloidal lead concentrations in the waters of Mineral and Cement Creeks and the upper Animas River are all less than the limit of detection indicating that lead is partitioned into the colloidal phase at low pH and precipitated to the bed sediments as soon as it reaches the streams. The dramatic differences in the lead concentrations in the bed sediments between Cement Creek (a gradual decrease from
Figure 31. Downstream variation of the iron to zinc weight ratio (A) in colloids and bed sediments of the Animas River and tributaries (low flow, Oct. 1995), (B) downstream variation of the aluminum to zinc weight ratio in colloids and bed sediments of the Animas River and tributaries (low flow, Oct. 1995), and (C) downstream variation of the copper to zinc weight ratio in colloids and bed sediments of the Animas River and tributaries (low flow, Oct. 1995).
82

CO
PP
ER
TO
ZIN
C
WE
IGH
T R
AT
IOA
LUM
INU
M T
O Z
INC
W
EIG
HT
RA
TIO
IRO
N T
O Z
INC
W
EIG
HT
RA
TIO
10
oO) o
oo o
o o
10 o
ro o
O) o00 o
o
oro o
Ol o
g H o
oo m O m
Ol o to o o
O
Ol o o o Ol o ro
o o
ro o
m oo r
-w 5
m vo a
i°>
m OD
ro
Ol o o o Ol o 10 o o
.1,1.1.1.1.1

100
A. Model Predictions HFO=1.0 g/L
B. Model Predictions HFO=0.01 g/L .
S. 20
Figure 32. Plots of the predicted sorbtion of metals on suspended iron hydroxides as a function of pH for two different concentrations of iron colloids (HFO); A, model predictions at 1g/L and B, model predictions at 0.01 g/L (from Smith and others, 1992).
600 to 300 ppm; fig. 24E), the upper Animas River (generally greater than 1,000 ppm; fig. 26E), and Mineral Creek (1,000 ppm at the headwaters decreasing to about 200 ppm at the confluence, fig. 22E) demonstrates how lead in bed sediments responds over a short distance to the changes in the sources of lead as was shown previously in the study of acidic streams at Mount Emmons near Crested Butte, Colo. (Gulson and others, 1992). This concept is particularly dramatic in the changes in the lead-isotopic compositions seen in bed sediments from the profile of Mineral Creek (fig. 23A and B).
Zinc concentrations in Cement Creek, where pH at low flow was 3.89, were 1,338 ppb, and zinc in the bed sediments is about 200 ppm above Memorial Park (fig. 24G). In the upper Animas River above Silverton, where the pH at low flow was 6.62, the dissolved zinc concentration was 319 ppb and zinc in the bed sediments was in the range of 3,500-1,000 ppm (fig. 26G) indicating that much of the dissolved zinc has been partitioned to the colloidal phase in the bed sediments as described above. This process also continues through the Animas Canyon reach (fig. 13A>. An understanding of this dynamic process of partitioning metals between the dissolved, colloidal, and bed sediment compartments is necessary to evaluate the process of metal transport over the hydrograph in the Animas River watershed (fig. 9) and their impact on water quality.
The geochemical profiles showing the dispersion and dilution of metals in the bed sediments of the Animas River below Silverton are convincing evidence that the source of these ore metals in the Animas River watershed is above Silverton. A very important question that should be addressed is:
Can we isolate the contributions of the three major tributaries, Mineral and Cement Creeks and the upper Animas River, to determine which tributary provides what portion of the metals in the bed sediments?
There are two basic approaches to this fundamental question: mass balance calculations like those outlined in equation 1 and lead-isotope calculations as outlined in equation 2. We will use a combination of these two approaches to arrive at an estimate of the sediment added by Mineral and Cement Creeks to the total mass of the bed sediment in the Animas River below Silverton.
84

The mass balance or mixing calculations are straight forward. The total concentration of any given metal in the bed sediments is defined by:
T(Me)AB = X(Me)MC + Y(Me)cc + Z(Me)UAR (1)
where: T(Me)AB is the total concentration (ppm) of the metal Me in the bed sediments of the Animas River below Silverton (site A-72),
Xs the fraction of the total metal concentration contributed by bed sediments from Mineral Creek,
(Me)MC is the concentration of the metal Me in the bed sediments from Mineral Creek above the confluence,
Y is the fraction of the total metal concentration contributed by bed sediments from Cement Creek,
(Me)cc is the concentration of the metal Me in the bed sediments from Cement Creek above the confluence,
Z is the fraction of the total metal concentration contributed by bed sediments from the upper Animas River above the confluence with Cement Creek, and
(Me)UAR is the concentration of the metal Me in the bed sediments from the upper Animas River above the confluence.
The solution to this equation requires either an independent determination of one of the variables X, Y, or Z, or a series of equations which can be solved simultaneously. The critical question in this approach to ask is:
What metal concentrations have sufficient variation and provide mathematical leverage in this calculation?
Since there is no significant variation in the geology of the subbasins, there is no significant variation in any of the lithophile element concentrations that can be used to derive percentages of materials added to the Animas River by either Mineral or Cement Creeks. Labile copper and zinc are actively precipitated from solution immediately below the confluence of Mineral and Cement Creeks, so the concentrations of these metals in the bed sediments are highly variable and cannot be used in the calculations. Labile lead concentrations, however, are stable as lead is present in both the colloidal phase and bed sediments in all three drainages.
Lead-isotopic data provide a powerful tool in evaluating the relative contributions of various sources to the bed-sediment concentrations of various metals. As the primary focus of this study was to evaluate the transport and partitioning of metals between the water column and the bed sediments from the Silverton area downstream, it is essential that we have a measure of the amount of metal added to the bed sediments by tributaries along the course of the Animas River. The measurement of the mass of sediment added by individual tributaries is possible using the lead-isotope ratios. The lead-isotope ratios are a function of mass rather than a function of concentration, allowing us to calculate the relative mass of lead added by individual tributaries that causes changes in the lead-isotopic ratios. These percentages are calculated using the following equation:
85

PC={[RB -RT]/[RB -RJ}x100 (2)
where: PC is the percent of the metal derived from the contaminant source,
RB is the ^PbP'Pb value determined in stream sediments in tributaries draining a specific geologic terrain,
RT is the ^Pb/^Pb value determined in the contaminated bed sediment of the Animas River today at a distance downstream from the source of the contaminant, and
Rc is the 206Pb/204Pb value determined at the source of the contaminant.
Similar calculations can be made using the 208Pb/*04Pb. Generally, there is not sufficient analytical resolution to make accurate calculations using the ^Pb/^Pb value unless the source rocks are more than two billion years old because of the short half-life of the parent isotope for 207 Pb, 235U.
The amount of sediment added to the Animas River by Cement Creek cannot be determined using the lead-isotopic data because there is no lead-isotopic difference between the lead-isotopic composition in the labile phase of the bed sediments of Cement Creek and that in the Animas River. There is, however, a difference between the lead in the labile phase of the bed sediments of Mineral Creek and the Animas River. Since there is virtually no change in the isotopic composition of labile lead of the Animas River between site 95ABS113 above the confluence of Cement Creek and site A-72 below the confluence of Mineral Creek, it follows that the amount of labile lead added by Mineral Creek is small. We used equation 2 to determine the value of X in equation 1. The lead-isotope calculation indicates that about 3 percent of the total mass of the labile lead in the bed sediments at site A-72 was derived from Mineral Creek. This number is subject to significant measurement error due to the very small difference in the lead-isotopic values measured in the sediments of the Animas River. Given these analytical limits, we can use the lead-isotopic data to assign an upper limit on the contribution of metals from the bed sediments of Mineral Creek of less than 10 percent of the total labile lead in the Animas River at site A-72. In reality, the number may be closer to 5 percent.
The chemical data can then be used to estimate the contribution of Cement Creek to the Animas River from equation 1. As was shown earlier, both zinc and copper are being actively precipitated from the water below both the confluence of Cement and Mineral Creeks with the Animas River. Thus, the kinetics of the settling process and the variability that this introduces into the sampling precludes the use of either the copper or zinc data from the 2M HCI-1%H2O2 digestion in such a calculation. Only the zinc in the sphalerite component of the sediments is a stable chemical variable in this mixing zone. Unfortunately, there is little variance in the zinc data. The zinc in sphalerite from the Animas River is 1,200 ppm, from Cement Creek is 1,000 ppm, and in the Animas River below Silverton at site A-72 is also 1,000 ppm. There is, however, significant leverage in the lead concentration data which, when combined with the determination of the limits of the sediment contribution from Mineral Creek using the lead-isotopic data, can be used to make a mass balance calculation. The lead concentrations are as follows: (Pb)UAR = 1,900 ppm, (Pb)cc = 370 ppm, (Pb)MC = 270, and (Pb)AB = 1,200. Solving equation 1 and using 5 and 10 percent for the contribution of metals from the bed sediments from Mineral Creek based on the lead data from equation 2, we estimate that Cement Creek contributes about 35 to 40 percent of the total metals in the bed sediments of the Animas River below Silverton at site A-72. The copper data in the insoluble phase give a similar value although the copper data are subject to a much larger fundamental sampling error because the insoluble copper is contained largely in a heavy-mineral phase. If the chemical data had been based on a 50-g sample, the copper data would be more robust.
The lead-isotopic data can also be used to calculate the contributions of metals to the labile phase of the bed sediments for the Animas River below Silverton. We will use the lead-isotopic data from site A-72below Silverton as the composition of the contaminant, Rc . Below Silverton, the composition of the lead supplied by the tributaries is different for the areas underlain by Precambrian, Paleozoic and Mesozoic, and Tertiary rocks. The areas are shown by the model for this calculation in figure 33A; values used for RB and RT are given in table 4. The results expressed in percent of the mass of the contaminant present PC at the
86

point along the river course at RT, are presented in figure 33B and in table 4. Through the Animas Canyon reach, there is little dilution due to the highly resistant nature of the Precambrian rocks to erosion. Major changes in the total mass of metal in the bed sediments of the Animas River take place downstream as stream sediments derived from the areas underlain by Paleozoic, Mesozoic, and Tertiary rocks are added by tributaries draining different sized basins and carrying differing bed sediment materials. Hermosa Creek and the Florida River are major sediment contributors to the bed sediments of the Animas River as indicated by the steep changes in the data in figure 33B. Furthermore, the gradient changes (fig. 33C) which reduces the carrying capacity of the Animas River causing sediment to be deposited in the stream bed.
Table 4. Lead-isotope parameters for calculation of dilution of the metals in the Animas River from Silverton 1
Locality Distance (km) RB RT PC
Silverton (A-72)
KOA Campground
Trimble Bridge
Durango, 32nd Street Bridge
Durango, Red Lion Inn
Above Lightner Creek
Weaselskin Bridge
Above Bondad
Cedar Hill
Aztec, NM
26.26
72.55
82.35
100.8
105.0
106.2
122
135.5
139.5
171.5
20.35
19.25
19.25
19.25
19.20
19.20
19.20
19.20
19.00
18.487
18.510
18.540
18.559
18.592
18.586
18.637
18.684
18.661
100
96
88
84
82
78
77
71
65
57
1 RC is the value at A-72 below Silverton (18.407); the columns give the values used for RB and RT in the model (fig. 33). PC is the percent of the contaminant at each site calculated from equation 2.
Differential Sorbtion of Copper and Zinc by ColloidsEvidence of the sorbtion of copper and zinc to the colloids and the impact of this process on metal
transport can be seen by normalizing the labile concentrations of copper, lead, and zinc in the bed sediments of the Animas River to those values measured for these metals at site A-72 below Silverton. The normalization procedure eliminates to problem of estimating dilution and transport losses of colloidal material as it moves downstream. Because lead is least likely to be affected by any process other than dilution (see fig. 32) and because we can measure the dilution effect as shown above using the lead-isotopic data (fig. 33 and table 4), gains in the total mass of copper and zinc by the colloids as a function of downstream distance can be demonstrated using these normalized data (fig. 34). The normalized lead data show the dilution curve of the colloidal component in the Animas River bed sediments caused by addition of materials by the tributaries draining the Animas River watershed downstream from Silverton. The copper curve plots slightly above the lead curve (fig. 34). Since there are no significant sources for copper other than the dissolved and suspended colloidal copper load described earlier, these gains in copper can be attributed to the aggregation and settling of the suspended colloidal material in the Animas Canyon reach. A much more dramatic change can be seen in the normalized zinc concentration data (fig. 34). Normalized zinc concentrations increase 50
87

percent below the Animas Canyon reach following an abrupt change in stream gradient (fig. 33C). When the dilution of the colloidal component is considered by examining the normalized lead data, the copper gain is about 30 percent and the zinc gain is almost 300 percent! Similar changes in the normalized zinc concentrations also were seen below Dumago where the stream gradient is low. We interpret these data to show the aggregation and settling of the colloidal component and its associated zinc loads to the bed sediments where they are stored until high-flow runoff.
Animas Watershed StudyAnimas River, Silverton Co to Aztec NM
18.0025 50 75 100
Distance (km.)125 150 175
River Tribs Background
Figure 33. Lead-isotopic model for the Animas River from below Silverton (site A-72) to Aztec, New Mexico. The horizontal gray lines (A) indicate the lead-isotopic compositions used to model the contribution of sediments from the area underlain by Precambrian, Paleozoic and Mesozoic, and Tertiary rocks to the bed sediments of the Animas River. Solid squares indicate the measured lead-isotopic composition of bed sediments in the Animas River whereas the solid triangles indicate the lead- isotopic composition of stream sediments in the tributaries. The mathematical details of the model calculated from equation (1) are given in table 4. Figure B is a depiction of the percentage of the labile lead in each sample that can be attributed to lead from the Animas River using the data from site A-72 as the composition of the metal contaminant. About 80 percent of the lead in the bed sediments of the Animas River at Durango can be attributed to the area of the Animas River watershed above Silverton. Compare the dilution of the lead-isotopic signature to the change in river gradient plotted in figure C.
88

Animas Watershed StudyAnimas River, Silverton Co to Aztec NM
§100
25 50 75 100 125 Distance (km)
150 175
Animas Watershed StudyStream Gradients
13000
50000 25 50 75 100 125 150 175
Distance (km)
Mineral Cement u Animas I Animas
89

Animas Watershed StudyAnimas River, Silverton Co to Aztec NM
25 50 75 100 125 Distance (km)
150 175
- Copper Lead Zinc
Figure 34. Plot of normalized labile concentrations of copper, lead, and zinc in bed sediments from the Animas River.
SUMMARY AND CONCLUSIONSThe water, colloid, and bed sediment data presented in this report demonstrate that the source of iron,
aluminum, copper, lead, zinc, arsenic, and cadmium in the Animas River watershed is from the drainage basin upstream from site A-72 at Silverton. Partitioning of the metals between the dissolved, suspended colloidal, and bed sediment phases is dependent upon the source of the metals, the pH of the water, and the flow rate of the streams. Cement Creek has the lowest pH at low flow and carries most of its metal load in the dissolved phase. Mineral Creek carries most of its metal load in the colloidal phase whereas most of the metals in the upper Animas River (above the confluence with Cement Creek) resides in the colloidal component of the bed sediments. Downstream from the confluence of Cement Creek in the mixing zone, most of the metals transported in the dissolved metal load of Cement Creek are partitioned to the colloidal phase. Along the stream courses of upper Mineral Creek and the Animas River upstream from the confluence of Cement Creek, colloids aggregate, settle, and become an integral component of the bed sediments where they are stored until high-flow (snowmelt) runoff.
90

At low flow, dissolved zinc and aluminum concentrations exceed the acute aquatic-life standard at site A-72 whereas the concentrations of the other metals do not exceed the chronic aquatic-life standard. Dissolved manganese concentrations are just below the chronic aquatic-life standard. However, colloidal concentrations of copper, iron, zinc, and aluminum, if bioavailable as suggested by recent research, could exceed one or both of these aquatic-life standards at site A-72. There is a substantial loss of iron and aluminum colloids and their sorbed metal loads to the bed sediments in the Animas Canyon reach between Silverton and Bakers Bridge. More than 50 percent of the zinc in the bed sediments from Mineral Creek, more than 75 percent of the zinc in the bed sediments from Cement Creek, and more than 50 percent of the zinc in the bed sediments of the Animas River above the confluence with Cement Creek is in the form of sphalerite. Zinc concentrations in sphalerite from the bed sediments of the Animas River above the confluence with Cement Creek are about 1,000 ppm, from Cement Creek are about 800 ppm, and from Mineral Creek are about 400 ppm.
Three water and colloid samples collected at high flow during snowmelt runoff indicate that dissolved zinc concentrations far exceed the acute aquatic-life standard at site A-72 and are still twice that level as far downstream as Bondad. Metals stored in the colloidal phase or component of the bed load are flushed downstream in the water column during high flow as is indicated by the high colloidal iron, aluminum, and sorbed copper, lead, and zinc concentrations. Any remedial action that removes acidic metal-bearing discharges into Mineral and Cement Creeks and the upper Animas River or its tributaries should lessen the cumulative effect of potential metal toxicity on aquatic life.
At low flow, the lead-isotopic data indicate that Mineral Creek contributes 5 to 10 percent of the total mass of metals in the bed sediments at site A-72. Using mass balance calculations, the metals contributed from Cement Creek make up less than 40 percent of the metals in the bed sediments at site A-72. Fifty to 60 percent of the metals at site A-72 are derived from the Animas River upstream from the confluence with Cement Creek. Below site A-72, the lead-isotopic data are used to document the dilution of the metals derived from the Animas River Basin above Silverton by metal contributions from the tributaries. At Durango 75 km downstream, about 80 percent of the metals in the colloidal component of the bed sediments were derived from the Animas River watershed above Silverton whereas at Aztec, 57 percent of the metals were derived from this upstream source. No measurable contamination was found from the La Plata mining district at the headwaters of Junction Creek.
Sediment transport, as suggested by the lead-isotopic data and the normalized copper, lead, and zinc data from bed sediments from the Animas River indicate some differential transport of the colloidal phase of the bed sediments. The chemical data from the waters and colloids indicate sorption of dissolved metals as a function of pH which changes with downstream distance. This colloidal component of the bed sediments dominates the bed sediment chemistry. Loss of the colloidal component to the bed sediments reduces pore space between detrital grains in the bed, introduces toxic levels of metals into the food chain habitat for aquatic invertebrates, and, if bioavailable as suggested by recent research, may cause chronic toxicity to fish.
From the lead-isotopic data, we have identified five or more discrete mineralization events in the Silverton caldera. However, the dominant lead-isotopic signature in the bed sediments of both Cement Creek and the upper Animas River is from the vein-type ore mineralization in the Eureka district. Lead-isotopic data from stream sediments from Browns Gulch on the west side of the Mineral Creek drainage indicates that vein- type ore in the Eureka district extends to the west of .Cement Creek. Exploration for concealed, undiscovered vein-type ore between Prospect and Minnesota Gulches could lead to the discovery of new ore reserves. The surface expression of this structure may be obscured by the hydrothermal alteration associated with Red Mountain No. 3.
91

REFERENCES CITED
Babitzke, H.R., Barsotti, A.F., Coffman, J.S., Thompson, J.G. and Bennett, H.J., 1982, The Bureau of MinesMinerals Availability System: An update of the Information Circular 8654: U.S. Bureau of Mines Circular8815, 24 p.
Briggs, P.M., 1996, Forty elements by inductively coupled-plasma atomic emission spectrometry, in Arbogast,B.F., ed., Analytical methods manual for the Mineral Resources Program, U.S. Geological Survey: U.S.Geological Survey Open-File Report 96-525, p. 77-94.
Broshears, R.E., Runkel, R.L, Kimball, B.A., McKnight, D.M. and Bencala, K.E., 1996, Reactive solutetransport in an acidic stream: Experimental pH increase and simulation of controls on pH, aluminum, andiron: Environmental Science and Technology, v. 30, p. 3016-3024.
Buffle, J. and Leppard, G.G., 1995a, Characterization of Aquatic Colloids and Macromolecules. 1. Structureand Behavior of Colloidal Material: Environmental Science and Technology, v. 29, p. 2169-2175.
___, 1995b, Characterization of Aquatic Colloids and Macromolecules. 2. Key Role of Physical Structureson Analytical Results: Environmental Science and Technology, v. 29, p. 2176-2184.
Buxton, H.T., Nimick, DA, von Guerard, Paul, Church, S.E., Frazier, Ann, Gray, J.R., Lipin, B.R., Marsh, S.P.,Woodward, Daniel, Kimball, Briant, Finger, Susan, Ischinger, Lee, Fordham, J.C., Power, M.S., Bunck,Christine and Jones, J.W., 1997, A science-based, watershed strategy to support effective remediationof abandoned mine lands: Fourth Annual International Conference on Acid Rock Drainage, VancouverB.C. Canada (in press).
Burbank, W.S. and Luedke, R.G., 1968, Geology and ore deposits of the San Juan Mountains, Colorado, inRidge, J.D., ed., Ore deposits of the United States, 1933-1967: New York, American Institute of Mining,Metallurgical, and Petroleum Engineers, p. 714-733.
Casadevall, T. and Ohmoto, H., 1977, Sunnyside mine, Eureka mining district, San Juan county, Colorado:Geochemistry of gold and base metal ore deposition in a volcanic environment: Economic Geology, v.92, p. 1285-1320.
Church, S.E., 1981, Multielement analysis of fifty-four geochemical reference samples using inductivelycoupled plasma-atomic emission spectrometry: Geostandards Newsletter, v. 5, p. 133-160.
Church, S.E., Mosier, E.L, and Motooka, J.M., 1987, Mineralogical basis for the interpretation of multielement(ICP-AES), oxalic acid, and aqua-regia partial digestions of stream sediments for reconnaissanceexploration geochemistry: Journal of Geochemical Exploration, v. 29, p. 207-233.
Church, S.E., Holmes, C.E., Briggs, P.M., Vaughn, R.B., Cathcart, James and Marot, Margaret, 1993,Geochemical and lead-isotope data from stream and lake sediments, and cores from the upper ArkansasRiver drainage: Effects of mining at Leadville Colorado on heavy-metal concentrations in the ArkansasRiver: U.S. Geological Survey Open-File Report 93-534, 61 p.
Church, S.E., Wilson, S.A., Vaughn, R.B. and Fey, D.L, 1994, Geochemical and lead-isotopic studies of riverand lake sediments, upper Arkansas River basin, Twin Lakes to Pueblo, Colorado: U.S. GeologicalSurvey Open-File Report 94-412, 44 p.
Church, S.E., Wilson, S.A. and Briggs, P.M., 1995, Geochemical and lead-isotopic studies of stream and riversediments, Alamosa River basin, Colorado: U.S. Geological Survey Open-File Report 95-250, 71 p.
Cox, D.P., 1986, Descriptive model of porphyry Cu, in Cox, D.P. and Singer, D.A., eds., Mineral DepositModels: U.S. Geological Survey Bulletin 1693, p. 76.
Crock, J.G., Lichte, F.E. and Briggs, 1983, Determination of elements in National Bureau of Standardsgeologic reference materials SRM 278 obsidian and SRM 688 basalt by inductively coupled plasma- atomic emission spectroscopy: Geostandards Newsletter, v. 7, p. 335-340.
Doe, B.R., Steven, T.A., Delevaux, M.H., Stacey, J.S., Lipman, P.W. and Fisher, F.S., 1979, Genesis of oredeposits in the San Juan volcanic field, southwestern Colorado-lead isotopic evidence: EconomicGeology, v. 74, p. 1-26.
Eckel, E.B., Williams, J.S. and Galbraith, F.W., 1949, Geology and ore deposits of the La Plata District,Colorado: U.S. Geological Survey Professional Paper 219, 179 p.
Environmental Systems Research Institute (ESRI), 1992, ARCUSA 1:2,000,000 CDROM - Digital Atlas of theUnited States and the Caribbean Outlying Areas, Redlands, Calif.
Ferderer, D.A., 1996, National overview of abandoned mine land sites utilizing the minerals availability system(MAS) and geographic information systems (CIS) technology: U.S. Geological Survey Open-File Report
92

96-549, 42 p. Fortescue, J.A.C., 1992, Landscape geochemistry: retrospect and prospect-1990: Applied Geochemistry,
v. 7, p. 1-54. Gasser, U.G., Walker, W.J., Dahlgren, R.A., Borch, R.S. and Burau, R.G., 1996, Lead release from smelter
and mine waste impacted materials under simulated gastric conditions and relation to speciation:Environmental Science and Technology, v. 30, no. 3, p. 761-769.
Green, G.N., 1992, The digital geologic map of Colorado in ARC/INFO format: U.S. Geological Survey Open- File Report 92-507-A-O, 15 disks.
Gulson, B.L, Church, S.E., Mizon, K.J. and Meier, A.L., 1992, Lead isotopes in iron and manganese oxidecoatings and their use as an exploration guide for concealed mineralization: Applied Geochemistry, v. 7,p. 495-511.
Hageman, P.L and Welsch, E.P., 1996, Arsenic, antimony and selenium by flow injection or continuous flow- hydride generation-atomic absorbtion spectrophotometry, in Arbogast, B.F., ed., Analytical methodsmanual for the Mineral Resources Program, U.S. Geological Survey: U.S. Geological Survey Open-FileReport 96-525, p. 24-30.
Hernandez, LK. and Stallard, R.F., 1988, Sediment Sampling through Ultrafiltration: Journal of SedimentaryPetrology, v. 58, p. 758-759.
Hoffman, J.D. and Buttleman, Kim, 1994, National Geochemical Data Base: National Uranium ResourceEvaluation data for the conterminous United States, with MAPPER display software by R.A. Ambroziakand MAPPER documentation by C.A. Cook: U.S. Geological Survey Digital Data Series DDS-0018-A,CD-ROM.
Horowitz, A.J., Lum, K.R., Garbarino, J.R., Hall, G.E.M., Lemieux, C. and Demas, C.R.,1996a, ProblemsAssociated with Using Filtration to Define Dissolved Trace Element Concentrations in Natural WaterSamples: Environmental Science and Technology, v. 30, p. 954-963.
___, 1996b, Response to Comments on "Problems associated with using filtration to define dissolved traceelement concentrations in natural water samples": Environmental Science and Technology, v. 30, no. 11,p. 3398-3400.
Jenne, E.A., 1977, Trace element sorption by sediments and soils-sites and processes, in Chappel, W., andPetersen, K., eds., Symposium on Molybdenum in the Environment, New York: M. Dekker, Inc. , p.425-552.
Kimball, B.A., Callender, E. and Axtmann, E.V., 1995, Effects of Colloids on Metal Transport in a RiverReceiving Acid Mine Drainage, Upper Arkansas River, Colorado, U.S.A.: Applied Geochemistry, v. 10,p. 285-306.
Lipman, P.W., Fisher, F.S., Mehnert, H.H., Naeser, C.W., Luedke, R.G. and Steven, T.A., 1976, Multiple agesof mid-Tertiary mineralization and alteration in the western San Juan Mountains, Colorado: EconomicGeology, v. 71, p. 571-588.
Leedy, W.P., 1971, Hydrothermal alteration of volcanic rocks in the Red Mountain district of the San JuanMountains, Colorado: Ph. D. dissertation, State University of New York, Buffalo, 165 p.
Moran, S.B. and Moore, R.M., 1989, The distribution of colloidal aluminum and organic carbon in coastal andopen ocean waters off Nova Scotia: Geochimica et Cosmochimica Acta, v. 53, p. 2519-2527.
Morel, F.M.M. and Gschwend, P.M., 1987, The role of colloids in the partitioning of solutes in natural waters[abst.] in Stumm, W.(15): Aquatic Surface Chemistry, Wiley-lnterscience, New York, p. 405-422.
National Institute of Standards and Technology (NIST), 1993a, Certificate of Analysis Standard Referencematerial 2704, Buffalo River Sediment.
____, 1993b, Certificate of Analysis Standard Reference material 2709, San Joaquin Soil. ____, 1993c, Certificate of Analysis Standard Reference material 2710, Contaminated Montana Soil. ____, 1993d, Certificate of Analysis Standard Reference material 2711, Montana Soil. O'Leary, R.M., Hageman, P.L. and Crock, J.G., 1996, Mercury in water, geologic, and plant materials by
continuous flow-cold vapor-atomic absorbtion spectrometry, in Arbogast, B.F., ed., Analytical methodsmanual for the Mineral Resources Program, U.S. Geological Survey: U.S. Geological Survey Open-FileReport 96-525, p. 42-50.
Ranville, J.F., Smith, K.S., Macalady, D.L and Rees, T.F., 1989, Colloidal properties of flocculated bedmaterial in a stream contaminated by acid mine drainage, St. Kevin Gulch, Colorado, in Mallard G.E.,Ragone S.E., eds., U.S. Geological Survey Toxic Substances Hydrology Program -- Proceedings of the
93

technical meeting, Phoenix, Arizona, September 26-30, 1988: U.S. Geological Survey Water-ResourcesInvestigations Report 88-4220, p. 111-118.
Runnells, D.D. and Rampe, J.J., 1989, Natural clean-up of a stream contaminated by mine and mill wastes:A reaction analogous to liming in water treatment, in Miles D.L., ed., Proceedings of the 6m InternationalSymposium on Water-Rock Interaction, Malvern, 3-8 August 1989, Rotterdam: A.A. Balkema, p. 597-598.
Ryder, J.L, 1994, Active- and interactive-, and abandoned-mine information and selected geochemical datafor the state of Colorado: U.S. Geological Survey Open-File Report 94-579, diskette version, 6 p.
Shannon, S.S., Jr., 1980, Uranium hydrogeochemical and stream sediment reconnaissance of the DurangoNTMS quadrangle, Colorado, including concentrations of 42 additional elements: Los Alamos ScientificLaboratory informal report LA-7345-MS Supplement, Los Alamos, NM, U.S. Department of Energy, GrandJunction, Colo., GJBX-138(80), 121 p.
Shiller, A.M. and Taylor, H.E., 1996, Comment on "Problems associated with using filtration to definedissolved trace element concentrations in natural water samples": Environmental Science andTechnology, v. 30, no. 11, p. 3397-3398.
Sloan, R.E. and Skowronski, C.A., 1975, The Rainbow Route, an Illustrated History of the Silverton Railroad,the Northern Silverton Railroad, and the Silverton, Gladstone, & Northerly Railroad, Denver, Colo.:Sundance Publications Limited, 416 p.
Smith, K.S., Ficklin, W.H., Plumlee, G.S, and Meier, A.L, 1992, Metal and arsenic partitioning between waterand suspended sediment at mine-drainage sites in diverse geologic settings, in Kharaka, Y.K. and Maest,A.S., eds., Water-Rock Interaction, Proceedings of the 7th International Symposium on Water-RockInteraction, Park City, Utah, July 13-18, 1992, Rotterdam: A.A. Balkema, p. 443-447.
Smith, S.M., 1994, Geochemical maps of copper, lead, and zinc, upper Arkansas River drainage basin,Colorado: U.S. Geological Survey Open-File Report 94-408, 15 p.
Stumm, W. and Morgan, J.J., 1996, Aquatic Chemistry, 3rd ed., New York: Wiley-lnterscience, 1022 p. Tweto, Ogden, 1979, Geologic map of Colorado: U.S. Geological Survey, scale, 1:500,000. U.S. Environmental Protection Agency (EPA), 1996a, Preliminary Assessment, Durango Copper Smelter,
Durango, Colo., (CERCLIS ID CO0001399930), 13 p. ___, 1996b, Site Inspection - Analytical Results Report, Durango Copper Smelter, Durango, Colo.,
(CERCLIS ID CO0001399930), 24 p., with maps and appendices. ___, 1996c, Preliminary Assessment, Durango Lead Smelter, Durango, Colo., (CERCLIS ID
CO0001399633), 30 p. ___, 1996d, Site Inspection -Analytical Results Report, Durango Lead Smelter, Durango, Colo., (CERCLIS
ID CO0001399633), 28 p., with maps and appendices. U.S. Geological Survey (USGS), 1982, A U.S. Geological Data Standard: Codes for the Identification of
Hydrologic Units in the United States and Caribbean Outlying areas: U.S. Geological Survey Circular 878-A, 115 p.
___, 1989, Digital Line Graphs from 1:100,000-scale maps: U.S. Geological Survey Data Users Guide 2,88 p.
___, 1990, Digital Elevation Models: U.S. Geological Survey Data Users Guide 5, 51 p. van Olphen, H., 1977, An Introduction to Clay Colloid Chemistry, 2nd ed., New York: Wiley-lnterscience, 318
P- . Ward, J.R. and Harr, C.A. 1990, Methods for Collection and Processing of Surface-water and Bed-Material
Samples for Physical and Chemical Analyses: U.S. Geological Survey Open-File Report 90-140, 71 p. Warren, R.G., Gallimore, D.L., Martell, C.J., Sandoval, W.F., Garcia, S.R., Minor, M.M. and Mclnteer, Carlotta,
1981, Data release for intermediate-density hydrogeochemical and stream sediment sampling in theVallecito Creek Special Study Area, Colorado, including concentrations of uranium and forty-six additionalelements: Los Alamos Scientific Laboratory informal report LA-8483-MS, Los Alamos, NM, U.S.Department of Energy, Grand Junction, CO, GJBX-217(81), 101 p.
Wilson, S.A., Briggs, P.M., Mee, J.S. and Siems, D.F., 1994, Determinations of thirty-two major and traceelements in three NIST soil SRMs using ICP-AES and WDXRF: Geostandards Newsletter, v. 18, p. 85-89.
Witters, H.E., Van Puymbroeck, S., Stouthart, A.J.H.X. and Bonga, S.E.W., 1996, Physicochemical changesof aluminum in mixing zones: mortality and physiological disturbances in brown trout (Salmo Trutta L.):Environmental Toxicology and Chemistry, v. 15, no. 6, p. 986-996.
94

APPENDIX I--METHODS USED TO PREPARE REGIONAL SEDIMENT GEOCHEMICAL MAPS
Data were retrieved from the National Uranium Resource Evaluation (NURE) data base (Hoffman and Buttleman, 1994) covering a rectangular area of southwestern Colorado between 37° 00' and 38° 30' north latitude and 107° 00' and 109° 00' west longitude. The evaluation boundary extended outside of the watershed area to eliminate "edge effects" in the grid and contour generation. The total number of sample sites in the bounding area is 4,057,444 of which are in the Animas River watershed. The NURE samples generally were collected along tributary drainage systems (Shannon, 1980; Warren and others, 1981).
The ASCII data files for copper, lead, zinc, and calcium concentrations were evaluated and formatted for grid and contour generation in EarthVision, a software package developed by Dynamic Graphics, Inc (ERDAS). Each chemical constituent was processed separately to evaluate the relative quality of the data and to compare with individual point coverages subsequently generated in ARC/INFO. The intervals generated for the contoured grid surface reflect multiples of the CAV (Fortescue, 1992). The multiples chosen for analysis and display are 1, 3, 5, 10, and 20 times crustal abundance values (CAV; figs. 5-8). The procedure in EarthVision involved a few basic steps:
1) defining raster input headers;2) registering and transforming geographic coordinates;3) creating a 2-D minimum-tension grid with 1,000 meter grid spacing;4) visualizing and generating contour intervals based on crustal abundance values (CAV);5) processing grid files in ERDAS including: flipping, resampling (100m), and converting the data into a
vector format;6) exporting grid files to ARC/INFO for vector processing.
The contoured surfaces were transferred to the vector-base ARC/INFO software package to allow overlay and integration with other spatial themes in the Animas River watershed. ARC/INFO processing steps included:
1) generating NURE point locations and linking attribute information;2) clipping point and contour coverages with the Animas River watershed boundary;3) conversion and smoothing of contours vectorized in ERDAS;4) editing coverages and creating a relational data base5) overlay analysis and map generation.
In addition to the tributary NURE information, sediment samples from major river drainages were collected by USGS personnel in the 1995-96 field season. These samples supplement the regional geochemical analysis of the NURE samples and provide current site-specific information along the Animas River. These data were processed in ARC/INFO using the procedures described above. The Animas River and its major tributaries were extracted from a hydrology layer and buffered (1000 meters) to create a polygon for shading based upon copper, lead, and zinc concentrations. This polygon or "ribbon" was segmented based on the concentration multiples (1,3,5,10, and 20) of CAV. The "ribbons" of concentration are shown in figures 19-21.
95

APPENDIX II--ANALYTICAL METHODS
Stream SedimentsThe fine grained (minus-100 mesh, or minus-150-micron) fraction of the stream sediments was analyzed
by inductively coupled plasma atomic emission spectroscopy (ICP-AES) utilizing both a total digestion procedure and a partial-digestion leach procedure (2M HCI-1%H2O2) on separate splits of each sample. The total decomposition procedure utilizes a combination of hydrochloric, nitric, perchloric and hydrofluoric acids, and is effective in dissolving most minerals, including silicates, oxides, and sulfides. Some resistant or refractory minerals such as zircon, chromite and selected tin oxide minerals are only partially attacked with this procedure (Crock and others, 1983; Briggs, 1996). Previous investigations using a variety of materials support the completeness of this digestion (Church, 1981; Church and others, 1987; Wilson and others, 1994). The partial-digestion leach procedure used involves an extraction performed on the samples using a solution of warm 2M HCI-1%H2O 2 (appendix III of Church and others, 1993). This leaching solution dissolves hydrous amorphous iron- and manganese-oxide minerals, as well as some crystalline iron- and manganese-oxides. The procedure we used differed slightly from that described. We used a 2-g sample in 15 ml of reagent. The samples were placed in 90 ml_ Teflon FEP jars, sealed, and placed in the waterbath at 50° C for three hours to ensure complete removal of the iron- and manganese-oxide coatings from the sediment grains.
Selenium was determined using hydride generation-atomic absorbtion spectrophotometry (Hg-AAS), as was arsenic for those samples whose ICP-AES values were less than 20 ppm. Samples were digested using a combination of nitric, hydrochloric, perchloric, sulfuric and hydrofluoric acids in open teflon vessels (Hageman and Welsch 1996), resulting in total dissolution. The arsenic and selenium in the solutions were reduced to the +3 and +4 states respectively, using a potassium iodide-ascorbic acid solution, after which the respective hydrides were generated by the addition of and mixing with sodium borohydride. The gaseous hydrides were introduced into a heated quartz tube in the optical path of an atomic absorbtion spectrophotometer and analyzed.
Mercury was determined using a cold vapor-atomic absorbtion spectrophotometric method (CV-AAS). Samples were digested using concentrated nitric acid, with the addition of sodium dichromate (O'Leary and others, 1996). The solutions were then introduced into a continuous flow manifold and mixed with air and a sodium chloride-hydroxylamine hydrochloride-sulfuric acid solution. The mercury +2 was then reduced to elemental mercury using stannous chloride, and the vapor introduced into the optical path of an atomic absorbtion spectrophotometer and analyzed.
Samples were randomized and submitted to the laboratory as blind samples. Analytical precision and accuracy of the methods (quality control) were assessed by analyzing blind standard reference materials (SRMs) and a replicate sample (a split of a sample, submitted as two separate samples) with each analytical set. These data are given in table A-ll for the SRM samples in the data tables in appendices V and VI for replicate analyses of blind duplicate samples. The SRMs were MIST-2704, MIST-2709, MIST-2710, and MIST- 2711, available from the National Institute of Standards and Technology (MIST, 1993a, 1993b, 1993c and 1993d). The results for the total-digestion ICP-AES, and for arsenic, selenium and mercury compare favorably with previous work (Church and others, 1993,1994, and 1995), and with the published MIST values.
The lead-isotopic data on the sediment samples were measured using the 2M HCI-1%H2O2 digestion solution following the procedure described in appendix IV of Church and others (1993). The lead was separated from solution in the HBr medium and the lead-isotopic ratios determined on a 68° sector, 12-inch radius, solid-source, thermal ionization MBS mass spectrometer. Analytical precision, based upon replicate analyses of MIST SRM materials is better than 0.1% per mass unit for the reported lead-isotopic ratios. The analytical results are reported in appendix V.
Water and ColloidsLegally and in many standard methods, a dissolved-metal concentration is defined as the concentration
that passes through a 0.45-micrometers (urn) filter (Horowitz and others, 1996a). Hydrous iron oxides can be on the order of 0.001 urn when they initially form in stream water. However, such small particles rapidly aggregate, forming a continuous size range from 0.001 urn to greater than 1 urn (Stumm and Morgan, 1996). Thus, for iron-rich streams affected by mine drainage, 0.45 urn is neither an effective nor a natural break for
96

the distinction of dissolved and participate concentrations. These artifacts confound the sampling procedure and skew the data introducing sampling errors that make it difficult to make a meaningful geochemical interpretation (Shiller and Taylor, 1996; Horowitz and others, 1996b). Many standard methods of water sampling protocol rely on filtration to obtain "dissolved" concentrations. The accepted standard protocol for many regulatory statutes relies on filtration of water samples at an arbitrary breaking point of 0.45 urn. Horowitz and others (1996a) described numerous problems that result from filtration with standard 0.45-um filters. A recent study in the upper Arkansas River basin demonstrated that iron colloids can be separated from river water and analyzed for their metal content using ultrafiltration (Kimball and others, 1995). The methods developed in that study have been followed here with only a slight change in the approach to separate and analyze the colloidal metal concentrations. In this study tangential-flow ultrafiltration through a membrane with an effective pore size less than 0.001 urn was used to differentiate between dissolved and particulate metal fractions (Hernandez and Stallard, 1988; Moran and Moore, 1989; Kimball and others, 1995).
The procedure to distinguish concentrations of metals in water from concentrations in colloidal particles is summarized in figure A-ll. The integrated sample was screened to remove sand, gravel, and debris. However, there was very little material greater than 62 urn. Almost the entire load of the Animas River was dissolved and colloidal. A split of the screened sample allowed the determination of a "total recoverable metal concentration." The rest of the sample was used for ultrafiltration to determine two metal concentrations, the "dissolved" concentration in the filtrate less than 0.001 urn, and the "colloidal" concentration from the concentrated colloids in water. Tangential-flow filtration keeps solid material in suspension rather than forcing it against a filter membrane. This allows water to be removed by osmotic pressure across a filter membrane without "packing" the suspended solids onto a filter membrane, which would change the membrane pore size.
Indirect measurement of metal concentrations in colloids was made by calculating the difference between the metal concentrations in an unfiltered, acidified sample (a total recoverable concentration) and the ultrafiltrate sample. The indirect measurement was reliable for iron, manganese, and zinc at each of the sites, but the direct measurement was necessary for cadmium, copper, and lead because of their lower concentrations.
Dissolved and total recoverable metal concentrations were determined by inductively coupled plasma-atomic emission spectrometry (ICP-AES; Briggs, 1996). Anions were analyzed in the 0.45-um filtered, unacidified samples by ion chromatography. Alkalinity was measured by Gran titration of an unfiltered 0.45-um filtered sample.
The low levels encountered for cadmium, copper, nickel, and lead indicate that either graphite furnace atomic adsorption or ICP Mass Spectrometry should be used for better quantification. The ICP-AES did not allow detection of lead at low levels because the lead concentrations were below the limit of detection.
97

EW
I sa
mpl
e; a
naly
sis
of t
empe
ratu
re,
pll,
and
cond
uctiv
ity
Scr
eene
d th
roug
h 60
um
nyl
on m
esh
Ultr
afilt
ratio
n an
d co
ncen
trat
ion
of c
ollo
ids
Ult
rafi
ltra
te <
0.0
01 u
m
Aci
difi
ed W
/MN
O3
Una
cidi
fied
for
1C
anal
ysis
of
anio
ns
ICP
anal
ysis
for
di
ssol
ved
met
al
conc
entr
atio
ns
J [
Con
cent
rate
>0.
001
um
Aci
difi
ed W
/HN
O3
Fil
trat
ion
w/ 0
.45
um
filte
r
ICP
anal
ysis
for
co
lloi
dal
met
al
conc
entr
atio
ns
Unf
ilter
ed s
plit
Aci
difi
ed W
/HN
O3
Fil
trat
ion
w/
0.45
um
filt
er
ICP
anal
ysis
for
tot
alre
cove
rabl
e m
etal
conc
entr
atio
ns
Figu
re A
-ll.
Dia
gram
sho
win
g pr
oces
sing
pro
cedu
res
for
wat
er a
nd c
ollo
id s
ampl
es.
98

Tab
le A
-ll.
Tot
al d
iges
tion
and
refe
renc
e da
ta fr
om S
tand
ard
Ref
eren
ce M
ater
ials
NIS
T N
o.
96-R
F-2
704
96-R
F-2
704
96
-RF
-27
04
SR
M-2
70
41
96
-RF
-27
09
9
6-R
F-2
70
9
96
-RF
-27
09
SR
M-2
709
2
96-R
F-2
710
SR
M-2
71
03
96-R
F-2
711
96-R
F-2
711
96-R
F-2
711
96-R
F-2
711
SR
M-2
711
4
A,% 5.
8 6.
2 6.
0
6.11
7.2
7.3
7.2
7.50
6.40
6.44
6.40
6.
10
6.20
6.
60
6.53
Ca
%
2.70
2.
70
2.70
2.60
1.90
2.
00
2.00
1.90
1.30
1.25
3.10
2.
90
2.90
3.
00
2.88
Fe%
4.1
4.2
4.1
4.11 3.5
3.5
3.5
3.50
3.60
3.38
3.00
2.
80
2.80
2.
90
2.89
K
%
1.9
2.0
1.
9
2.00 1.9
1.9
1.8
2.03
2.00
2.11
2.30
2.
20
2.30
2.
50
2.45
Mg
%
1.20
1.
20
1.20
1.20
1.40
1.
50
1.50
1.51
0.88
0.85
1.00
1.
00
1.00
1.
10
1.05
Na
%
0.59
0.
64
0.58
0.55
1.10
1.
20
1.20
1.16
1.10
1.14
1.20
1.
10
1.10
1.
30
1.14
P %
0.10
0.
11
0.10
0.1
0
0.07
0.
07
0.07
0.06
0.11
0.11
0.08
0.
09
0.09
0.
09
0.09
Ti%
0.26
0.
33
0.30
0.46
0.32
0.
31
0.32
0.34
0.26
0.28
0.24
0.
26
0.25
0.
26
0.31
Ag
pp
m
<2
<2
<2 --
<2
<2
<
2 0.4
33 35 4 3 3 4 4.6
As
ppm
23
22
18 23 23
21
22 17.7
680
626 94
100
110 97 105
Ba
ppm
' 39
0 43
0 40
0
414
880
910
870
968
680
707
670
650
670
730
726
1 N
IST
(19
93a)
; no
ncer
tifie
d va
lues
in p
aran
thes
.2
NIS
T (
1993
b);
nonc
ertif
ied
valu
es in
par
anth
es.
3 N
IST
(19
93c)
; no
ncer
tifie
d va
lues
in p
aran
thes
.4
NIS
T (
1993
d);
nonc
ertif
ied
valu
es in
par
anth
es.
99

Tab
le A
-ll.
Tot
al d
iges
tion
and
refe
renc
e da
ta f
rom
Sta
ndar
d R
efer
ence
Mat
eria
ls (
cont
.)
NIS
T N
o.
Be
ppm
B
i pp
m
96-R
F-2
704
96-R
F-2
704
96-R
F-2
704
SR
M-2
704
96-R
F-2
709
96-R
F-2
709
96-R
F-2
709
SR
M-2
709
96-R
F-2
710
SR
M-2
710
96-R
F-2
71 1
96-R
F-2
711
96-R
F-2
711
96-R
F-2
711
2 <
102
< 10
2 <
10
-- 4 <
103
< 10
4 <
10
-- 2 21
-- 2 <
10
2 <
102
< 10
2 <
10
Cd
ppm
C
e pp
m
Co
ppm
C
r pp
m
3 3 3 3.5
<2
<2
<2 0.
4
20 21.8
38 37 37 38
55 72 59 (72) 42 42 43 (42)
55 (57) 62 67 67 72
16 16 16 14 15 16 16 13.4
11 (10)
12 12 12 12
140
150
150
135
120
130
140
130
36 (39) 48 48 58 48
Cu
ppm
G
a pp
m
La p
pm
Li p
pm
87 99 88 99 30 32 29 34.6
2600
2950 10
0 97 98 110
14 15 17 (15)
15 16 15 (14) 48 (34)
15 14 15 17
28 36 31 (29)
24 23 24 (23) 31 (34)
35 38 40 38
43 49 47 (50)
51 54 53
--
38 -- 25 26 25 28
Mn
ppm
M
o pp
m
560
580
580
555
530
540
550
538
1000
0
1010
0
670
620
620
660
<2
<2
<2 --
<2
<2
<2 -- 15 (19)
<2
<2
<2
<2
SR
M-2
711
41.7
(6
9)(1
0)
(47)
11
4 (1
5)
(40)
638
(1.6
)
100

Tab
le A
-ll.
Tot
al d
iges
tion
and
refe
renc
e da
ta f
rom
Sta
ndar
d R
efer
ence
Mat
eria
ls (
cont
.)
NIS
T N
o.
Nb
ppm
96-R
F-2
704
96-R
F-2
704
96-R
F-2
704
SR
M-2
704
96-R
F-2
709
96-R
F-2
709
96-R
F-2
709
SR
M-2
709
96-R
F-2
710
SR
M-2
710
96-R
F-2
711
96-R
F-2
711
96-R
F-2
711
96-R
F-2
71 1
14 14 14 -- 16 13 11 -- 13 -- 13 19 20 15
Nd
ppm
25 32 32 -- 17 17 18 -- 27 -- 27 29 30 28
Ni
ppm
43 42 42 44 85 83 85 88 14 14.3
20 20 20 19
Pb
ppm
S
c pp
m
Sr
ppm
T
h pp
m
140
150
140
161 14 14 16 18
.9
4900
5532
1000 990
930
1200
11 12 12 (12) 11 12 12 (12) 9
(8.7
)
9 9 9 10
130
140
130
(130
)
220
230
220
231
330 --
240
230
240
250
7 12 11 (9)
10 10 10 10.8
12 13.5
13 13 13 14
V
ppm
Y
pp
m
85 91 90 95
110
110
110
112
72 76.6
79 76 76 79
23 25 23 -- 18 20 18 18 22 (23) 26 25 26 29
Yb
ppm
2 2 2 (2.8
)
2 1 2 (1.6
)
2 (1.3
)
3 2 2 2
Zn
ppm
430
440
420
438
100
100 99 106
7000
6952
380
330
340
350
SR
M-2
711
20.6
11
62(9
)24
513
.6
81.6
(2
5)
(2.7
) 350
101

App
endi
x Il
l S
ite
iden
tific
atio
ns, f
ield
dat
a, a
nd m
ajor
ion
chem
istry
for
Ani
mas
Riv
er a
nd m
ajor
trib
utar
ies,
199
5-96
. [D
IST,
dow
nstr
eam
dis
tanc
e, i
n ki
lom
eter
s; D
isch
, dis
char
ge, i
n cu
bic
feet
per
sec
ond;
Con
d, C
ondu
ctiv
ity, i
n m
icro
Siem
ens
per
cent
imet
er a
t 25
degr
ees
Cel
cius
; Tem
p, t
empe
ratu
re, i
n de
gree
s C
elci
us;
all c
once
ntra
tions
are
in m
illig
ram
s pe
r lit
er.]
1 Lo
w F
low
Ani
mas
DIS
T SI
TE
DES
CR
IPTI
ON
1 1
AN
IMA
S R
IVER
AT
EUR
EKA
24
AN
IMA
S R
IVER
AT
SILV
ERTO
N
24
AN
IMA
S R
IVER
BLW
CE
ME
NT
CR
EE
K
26
AN
IMA
S R
IVER
BLW
SIL
VER
TON
50
AN
IMA
S R
IVER
AB
CA
SCA
DE
CR
EE
K
52
AN
IMA
S R
IVER
BLW
CA
SCA
DE
CR
EEK
73
AN
IMA
S R
IVER
AT
KO
A C
AM
P
8 1
AN
IMA
S R
IVER
AT
DA
LTO
N
101
AN
IMA
S R
IVER
AT
32nd
ST
BR
IDG
E
105
AN
IMA
S R
IVER
AT
DU
RA
NG
O
106
AN
IMA
S R
IVER
BLW
DU
RA
NG
O
122
AN
IMA
S R
IVER
AT
WEA
SELS
KIN
BR
IDG
1 36
AN
IMA
S R
IVER
NR
BO
ND
AD
HIL
L
138
AN
IMA
S R
IVER
NR
CED
AR
HIL
L
172
AN
IMA
S R
IVER
AT
AZ
TE
C
DA
TE 9510
16
9510
15
9510
16
9510
16
9510
20
9510
20
9510
17
9510
17
9510
17
9510
19
9510
18
9510
19
9510
19
9510
18
9510
18
Dis
ch 7 65 86 116
150
161
232
237
283
327
340
341
341
341
341
Con
d
186
453
494
453
356
344
302
453
556
552
552
553
555
513
538
pH 7.06
6.62
7.12
6.62
6.99
7.48
7.87
7.34
7.53
8.14
8.14
8.27
8.58
8.59
8.36
Tem
p 0.0
7.5
5.0
7.5
3.0
5.0
7.0
13.0
12.5
12.0
12.0 7.5
12.5
13.0
11.0
Cal
cium
29.2
53.0
93.4
68.7
56.2
56.3
46.6
70.2
79.0
83.0
74.9
79.5
81.5
74.2
69.3
Mag
nesi
um 2.1
2.7
2.9
3.6
3.9
4.1
4.1 8.1
10.3 0.2
0.2
12.3 O.I
0.0
11.9
Sodi
um 1.0
2.3
3.0
2.6
2.4
2.4
2.1
15.0
20.7
19.6
19.6
21.8
21.9
22.1
25.1
Chl
orid
e
0.3
0.5
0.5
0.6
0.5
0.4
0.5
15.1
20.1
19.6
19.3
19.3
19.0
16.6
16.8
Sulf
ate
53 95 225
201
148
133 99 106
122
123
123
126
120 99 110
Silic
a
4.5
7.4
13.6
11.0 9.4
9.2
7.5
8.8
9.5
9.5
9.3
7.1
6.3
6.2
5.0
Tri
buta
ries
DIS
T SI
TE
DES
CR
IPTI
ON
24
CE
ME
NT
CR
EE
K N
R M
OU
TH
25
MIN
ER
AL
CR
EE
K N
R M
OU
TH
51
CA
SCA
DE
CR
EEK
NR
MO
UT
H
80
HE
RM
OSA
CR
EEK
NR
HW
Y 5
50
102
JUN
CT
ION
CR
EEK
AT
PAR
K
1 05
LIG
HT
NE
R C
REE
K N
R M
OU
TH
DA
TE 9510
15
9510
15
9510
20
9510
17
9510
18
9510
18
Dis
ch 19 57 11 36 2 4
Con
d
1.05
0
395
221
400
334
682
pH 3.89
6.35
8.11
7.07
8.13
8.30
Tem
p
4.0
7.5
4.0
6.5
5.0
5.5
Cal
cium
173.
0
72.7
33.2
59.6
57.4
88.7
Mag
nesi
um 6.5
5.2
7.2
6.7
0.0
33.9
Sodi
um 4.0
3.1
2.7
3.1
4.0
23.5
Chl
orid
e
0.9
0.6
0.9 1.2
0.6
3.3
Sulf
ate
572
188 12 122 15 150
Silic
a
24.6
14.2 4.0
7.5
6.9
7.4
102

App
endi
x lll
--Si
le i
dent
ific
atio
ns,
field
dat
a, a
nd m
ajor
ion
che
mis
try
for
Ani
mas
Riv
er a
nd m
ajor
tri
buta
ries
, 19
95-9
6.
IDIS
T,
dow
nstr
eam
dis
tanc
e, i
n ki
lom
eter
s; D
isch
, di
scha
rge,
in
cubi
c fe
et p
er s
econ
d; C
ond,
Con
duct
ivity
, in
mic
roSi
cmcn
s pe
r ce
ntim
eter
at
25
degr
ees
Cel
cius
; Tem
p, t
empe
ratu
re,
in d
egre
es C
elci
us;
all
conc
entr
atio
ns a
re in
mill
igra
ms
per
liter
.)
1 L
ow F
low
Tri
buta
ries
DIS
T
SITE
DE
SCR
IPT
ION
118
BA
SIN
CR
EEK
NR
MO
UTH
1 36
FLO
RI D
A R
IVER
NR
MO
UTH
DA
TE 9510
19
9510
19
Dis
cli
Con
d
0 1 .
600
7 36
7
PH 8.33
8.43
Tem
p 8.5
8.0
Cal
cium
114
1
52.1
Mag
nesi
um 81.2 8.7
Sodi
um
Chl
orid
e Su
lfal
e
149.
8 13
.0
695
27.2
5.
8 17
Silic
a
5.2
5.5
2 E
arly
Run
off
DIS
T
SIT
E D
ESC
RIP
TIO
N
26
AN
IMA
S R
IVER
BLW
SIL
VE
RT
ON
1 05
AN
IMA
S R
IVER
AT
DU
RA
NG
O
1 38
AN
IMA
S R
IVER
NR
CED
AR
HIL
L
DA
TE 9605
09
9605
10
9605
10
Ani
mas
Dis
ch
Con
d
901
174
2.25
0 17
9
1.98
0 20
6
pH 7.08
7.80
7.84
Tem
p 3.7
7.5
11.3
Cal
cium
20.0
23.0
25.0
Mag
nesi
um 1.5
3.0
3.4
Sodi
um
Chl
orid
e Su
lfnte
0.9
0.4
61
2.4
2.8
38
3.3
Silic
a
2.6
2.0
2.1
3 M
iddl
e R
unof
f
DIS
T
SIT
E D
ESC
RIP
TIO
N
26
AN
IMA
S R
IVER
BLW
SIL
VE
RT
ON
1 05
AN
IMA
S R
IVER
AT
DU
RA
NG
O
1 38
AN
IMA
S R
IVER
NR
CED
AR
HIL
L
DA
TE
9605
21
9605
22
9605
22
Ani
mas
Dis
ch
Con
d
1.67
0 11
5
2.92
0 14
7
2.47
0 16
5
pH 7.46
7.72
7.93
Tem
p 6.5
8.5
13.0
Cal
cium
16.0
23.0
18.0
Mag
nesi
um 1.2
2.9
2.2
Sodi
um
Chl
orid
e Su
lfat
e
0.9
0.3
40
3.0
2.1
Silic
a
2.2
2.1 1.7
4 L
ate
Run
off
DIS
T
SIT
E D
ESC
RIP
TIO
N
26
AN
IMA
S R
IVER
BLW
SIL
VER
TON
105
AN
IMA
S R
IVER
AT
DU
RA
NG
O
1 38
AN
IMA
S R
IVER
NR
CED
AR
HIL
L
DA
TE 9606
19
9606
18
9606
18
Ani
mas
Dis
ch
Con
d
584
I.I
10
277
870
320
PH 7.42
7.80
7.99
Tem
p
14.0
15.0
Cal
cium
36.0
40.0
23.0
Mag
nesi
um 4.7
5.7 1.5
Sodi
um
Chl
orid
e Su
lfate
8.1
6.6
54
11.0
6.
6 54
1.2
0.6
50
Silic
a
3.2
2.8
2.7
103

App
endi
x IV
~Met
als
in w
ater
and
col
loid
s in
the
Ani
mas
Riv
er a
nd tr
ibut
arie
s, 1
995-
96.
[ALD
, dis
solv
ed a
lum
unim
; A
LC, c
ollo
idal
alu
min
um;
CD
D, d
isso
lved
cad
miu
m;
CD
C, c
ollo
idal
cad
miu
m;
CU
, cop
per
(with
dis
solv
ed a
nd
collo
idal
); FE
, iro
n; M
N, m
anga
nese
; PB
, le
ad;
SR, s
tront
ium
; ZN
, zin
c; A
bla
nk o
r no
val
ue in
dica
tes
the
sam
ple
was
bel
ow li
mit
of
dete
ctio
n; a
ll co
ncen
tratio
ns i
n m
icro
gram
s pe
r lit
er.]
DIS
T 11 24 24 26 73 81 101
105
106
122
136
138
172
DIS
T
24 25 80 102
AL
D
0.03
9
0.06
6
0.41
7
0.04
0
0.10
0
0.08
8
0.08
0
0.09
7
0.08
5
0.07
9
0.09
7
0.09
3
0.08
2
AL
D
6.01
9
0.08
6
0.09
6
0.06
3
AL
C
0.05
9
0.02
3
1.17
6
1.72
0
0.35
4
0.11
8
0.06
7
0.06
0
0.03
9
0.02
9
0.05
0
0.05
7
0.04
7
AL
C
0.09
8
3.58
4
0.18
4
0.02
1
CD
D
0.00
1
0.00
0
0.00
3
0.00
0
0.00
1
0.00
1
0.00
2
0.00
5
0.00
2
0.00
2
CD
D
0.00
1
0.00
0
CD
C
CU
D
0.00
0 0.
006
0.00
0 0.
006
0.00
6
0.00
3
0.00
2
0.00
8
0.00
2
0.00
0
0.00
2
CD
C
CU
D
0.00
0 0.
063
0.00
3
0.00
0 0.
000
cue
0.01
3
0.00
6
0.01
6
0.02
2
0.00
6
0.00
2
0.00
2
0.00
2
0.00
2
0.00
4
0.00
2
0.00
2
0.00
2
cue
0.00
2
0.05
5
0.00
5
0.00
2
1 L
ow F
low
Ani
mas
FED
FE
C
0.00
1 0.
05
0.14
0.64
1 1.
15
0.67
7 1 .
73
0.01
2 0.
56
0.16
0.00
3 0.
17
0.00
4 0.
15
0.13
0.10
0.10
0.10
0.09
Tri
buta
ries
FED
FE
C
4.46
7 2.
42
2.21
1 3.
43
0.00
2 0.
27
0.03
MN
D
0.21
6
0.00
0
0.71
7
0.34
7
0.12
7
0.06
8
0.07
0
0.11
7
0.10
2
0.05
5
0.02
6
0.02
2
0.02
6
MN
D
1.26
5
0.20
5
0.13
2
0.00
2
MN
C
PBD
0.00
2
0.04
2
0.01
6
0.02
3 0.
023
0.02
5
0.01
0
0.00
8
0.00
8 0.
003
0.00
6 0.
010
0.00
8
0.00
9
0.00
9
MN
C
PBD
0.02
1
0.00
1 0.
053
PBC
SR
D
0.87
2
0.81
7
0.87
8
0.91
3
0.86
8
0.87
7
0.81
7
0.00
1 0.
626
0.40
5
0.00
0 0.
688
1.03
0
0.00
1 0.
494
0.17
8
PBC
SR
D
0.00
1 0.
520
2.06
0
0.00
1 0.
708
0.57
8
SRC
0.00
2
0.00
2
0.00
3
0.00
2
0.00
4
0.02
0
0.00
6
0.01
0
0.01
1
0.00
0
0.00
4
0.00
1
SRC
0.00
1
0.00
1
0.00
1
0.00
1
ZN
D
0.46
1
0.31
9
0.87
1
0.34
7
0.15
4
0.09
2
0.06
3
0.03
2
0.02
9
0.02
9
0.01
7
0.00
6
ZN
D
1.33
8
0.32
4
0.11
9
0.01
1
ZN
C
0.01
2
0.02
1
0.00
9
0.04
2
0.03
5
0.00
6
0.01
1
0.01
6
0.01
1
0.01
5
0.01
3
0.01
0
0.00
6
ZN
C
0.02
5
0.02
1
0.00
0
104

App
endi
x IV
--M
cial
s in
wat
er a
nd c
ollo
ids
in t
he A
nim
as R
iver
and
tri
buta
ries
, 19
95-9
6.
[ALD
, dis
solv
ed a
lum
unim
; A
LC
, co
lloid
al a
lum
inum
; C
DD
, di
ssol
ved
cadm
ium
; C
DC
, col
loid
al c
adm
ium
; CU
, co
pper
(w
ith d
isso
lved
and
co
lloid
al);
FE,
iro
n; M
N,
man
gane
se;
PB,
lead
; SR
, st
ront
ium
; ZN
, zi
nc;
A b
lank
or
no v
alue
ind
icat
es t
he s
ampl
e w
as b
elow
lim
it of
de
tect
ion;
all
conc
entr
atio
ns in
mic
rogr
ams
per
liter
.)
DIS
T
105
118
136
DIS
T
26 105
138
DIS
T
26 105
138
DIS
T
26 105
138
ALD
0.16
2
0.31
4
0.08
5
ALD
0.02
2
0.02
0
0.03
5
ALD
0.04
3
0.04
0
0.05
2
ALD
0.05
2
0.03
1
0.03
5
ALC
0.04
4
0.01
4
0.19
9
ALC
0.76
7
0.65
3
0.12
3
ALC
0.51
9
0.48
7
0.09
3
AL
C
0.53
3
0.47
4
0.28
9
CD
D
CD
C
CU
D
0.00
3
0.00
2
CD
D
CD
C
CU
D
0.00
1 0.
003
0.00
1 0.
002
0.00
1 0.
002
CD
D
CD
C
CU
D
0.00
1 0.
003
0.00
1 0.
003
0.00
1 0.
003
CD
D
CD
C
CU
D
0.00
7
0.00
7
0.00
7
cue
0.00
2
0.00
1
0.00
4
cue
0.05
1
0.02
5
0.02
8
cue
0.03
9
0.02
4
0.02
3
cue
0.00
6
0.00
4
0.01
0
1 Lo
w F
low
Tri
buta
ries
FED
FE
C
0.01
2 0.
09
0.00
3 0.
01
0.22
2 E
arly
Run
off
Ani
mus
FED
FE
C
2.30 1.50
1.60
3 M
iddl
e R
unof
f
Ani
mas
FED
FE
C
1.60
1.30
1.10
4 L
ate
Run
off
Ani
mas
FED
FE
C
0.09
9 0.
75
0.36
0.28
MN
D
0.01
1
0.01
0
0.00
9
MN
D
0.34
0
0.02
5
0.00
7
MN
D
0.23
0
0.00
5
0.01
8
MN
D
0.09
5
0.04
2
0.31
0
MN
C
PBD
0.00
2 0.
05 1
0.00
1
0.02
0 0.
009
MN
C
PBD
0.19
9
0.26
9
0.29
2
MN
C
PBD
0.18
7
0.30
5
0.22
8
MN
C
PBD
0.03
5
0.06
9
0.03
9
PBC
SR
D
SRC
Z
ND
0.94
8
0.00
1 0.
661
0.01
4
2.58
5 0.
014
PBC
SR
D
SRC
Z
ND
0.03
5 0.
180
0.03
7 0.
310
0.04
0 0.
180
0.04
2 0.
030
0.03
8 0.
200
0.04
1 0.
015
PBC
SR
D
SRC
Z
ND
0.04
3 0.
140
0.01
9 0.
160
0.04
5 0.
190
0.04
5 0.
019
0.03
6 0.
140
0.03
4 0.
016
PBC
SR
D
SRC
Z
ND
0.39
0 0.
053
0.00
8 0.
450
0.07
5
0.23
0 0.
026
0.01
8
ZN
C
0.00
0
0.00
6
ZN
C
0.27
6
0.19
2
0.20
6
ZN
C
0.20
0
0.20
3
0.17
6
ZN
C
0.07
5
0.04
2
0.05
0
105

App
endi
x V
.1.
Tabl
e of
par
tial d
iges
tion
(2M
HC
I-1%
H2O
J da
ta fr
om s
ites
sam
pled
from
the
Ani
mas
Riv
er w
ater
shed
, Oct
. 19
95
[Con
cent
ratio
ns g
iven
in p
arts
per
mill
ion,
ppm
(ug
/g)]
Sam
ple
No.
Sam
ple
Loca
lity
Sam
ple
Latit
ude
Type
D
eg
Min
S
ecLo
ngitu
de
Deg
M
in
Sec
Dis
tanc
e A
t km
. pp
mC
a pp
mF
e pp
mK
pp
m
Ani
mas
Riv
er u
pstre
am f
rom
Silv
erto
n, C
olo.
95A
BS
101
95A
BS
102
95A
BS
103
95A
BS
104A
95A
BS
104C
95A
BS
104D
95A
BS
105
95A
BS
106
95A
BS
107
95A
BS
108
95A
BS
109
95A
BS
110A
95A
BS
110B
95A
BS
111A
95A
BS
111B
95A
BS
112
95A
BS
113
Cem
ent C
reek
95A
BS
114
95A
BS
DP
1(9
5AB
S11
4)M
ean
95A
BS
115
95A
BS
116
uppe
r Ani
mas
Riv
erbe
low
Cin
nam
on G
ulch
Pic
ayne
Gul
chE
urek
a C
reek
uppe
r Ani
mas
Riv
erup
per A
nim
as R
iver
uppe
r Ani
mas
Riv
erup
per A
nim
as R
iver
Kitt
imac
Mill
site
Mag
gie
Gul
chup
per A
nim
as R
iver
abov
e H
owar
dsvi
llem
ill s
iteC
unni
ngha
m C
reek
uppe
r Ani
mas
Riv
er a
tga
ging
sta
tion
Arr
astra
Cre
ekA
rras
tra C
reek
Bou
lder
Cre
ekA
nim
as R
iver
at W
RD
gagi
ng s
tatio
n
Cem
ent C
reek
, M
emor
ial
Par
k, S
ilver
ton,
Col
o.
fine
sand
& s
ilt, fin
e sa
nd &
silt
fine
sand
& s
iltfin
e sa
nd &
silt
jaro
site
whi
te p
reci
pita
teco
lloid
sta
iling
sfin
e sa
nd &
silt
fine
sand
& s
ilt
fine
sand
& s
iltfin
e sa
nd &
silt
coat
ed p
ebbl
esfin
e sa
nd &
silt
coat
ed p
ebbl
esfin
e sa
nd &
silt
fine
sand
& s
ilt
fine
sand
& s
ilt
Cem
ent C
reek
, M
emor
ial f
ine
sand
& s
iltP
ark,
Silv
erto
n, C
olo.
Top
eka
Gul
chC
emen
t Cre
ek b
elow
fine
sand
& s
iltfin
e sa
nd &
silt
37 5
5 25
37 5
4 42
37 5
2 47
37
52 3
937
52
39
37 5
2 39
37
52 4
837
51
3037
51
15
37
50 4
3
37
50
037
49
5837
49
5837
49
2837
49
2837
49
3137
48
42
37 4
9 2
37 4
9 2
37 5
0 41
37
52
35
107
107
107
107
107
107
107
107
107
107
107
107
107
107
107
107
107
107
107
107
107
33 33 33 33 33 33 33 34 34 35 35 35 35 37 37 38 39 39 39 40 40
47 18 54 44 44 44 45 21 11 14 37 58 58 20 20 0 29 40 40 45 15
5.75
7.25
11.2
511
.35
11.0
013
.80
14.2
015
.80
17.0
517
.55
20.0
0
20.9
023
.70
22.7
0
22.7
0
19.0
015
.25
7400
7000
7500
8300
870
1100
1000
00 200
4600
7200
5900
6500
7800
040
0084
000
7200
6500
5000
5100
5050
1200
038
00
3800
5600
3600
3900
1900
014
000
1200
00 300
5600
5200
6200
4300
4300
031
0032
000
5000
5000
1000
2000
1500
4400
1000
1500
0
2600
034
000
2700
019
000
3700
019
0000
1900
019
000
2900
0
1600
025
000
2700
0021
000
3100
0026
000
2500
0
1500
00
1500
00
1500
0076
000
6500
0
200
300
300
300
200
300
5600
400
200
400
300
300
4000 20
054
00 200
200
400
400
400
600
500
iron
bog
106

App
endi
x V.
1 .
Tabl
e of
par
tial d
iges
tion
(2M
HC
I-1 %
data
from
site
s sa
mpl
ed f
rom
the
Ani
mas
Riv
er w
ater
shed
, O
ct.
1 995
(co
nt.)
Sam
ple
No.
95A
BS
117
95A
BS
118
95A
BS
120A
95A
BS
120B
Min
eral
Cre
ek95
AB
S12
195
AB
S12
295
AB
S12
395
AB
S12
495
AB
S12
5
95A
BS
126
95A
BS
-WD
95A
BS
127
95A
BS
128
95A
BS
129
95A
BS
130
Sam
ple
Loca
lity
Iron
bog,
Cem
ent C
reek
Cem
ent C
reek
abo
veG
old
Kin
g in
flow
Bel
ow c
onflu
ence
of N
and
S Fo
rks
of C
emen
tC
reek
Bel
ow c
onflu
ence
of N
and
S Fo
rks
of C
emen
tC
reek
Koe
hler
adi
t dra
inag
eM
ill C
reek
Min
eral
Cre
ekB
row
ns G
ulch
Min
eral
Cre
ek a
bove
Bur
ro B
ridge
Mid
dle
Fork
Min
eral
Crk
abov
e B
onne
r M
ine
Sam
ple
Type
fine
sand
fine
sand
fine
sand
&si
lt&
silt
&si
lt
over
bank
sed
collo
ids
fine
sand
fine
sand
fine
sand
fine
sand
fine
sand
&si
lt&
silt
&si
lt&
silt
&si
lt
Par
adis
e po
rtal,
Gem
po
lyba
site
clai
m,
Mid
dle
Fork
Min
eral
Cre
ekM
iner
al C
reek
abo
ve S
Fork
Sou
th F
ork
Min
eral
Crk
belo
w ir
on b
ogS
outh
For
k M
iner
al C
rkM
iner
al C
reek
gag
ing
stat
ion
in S
ilver
ton
fine
sand
fine
sand
&si
lt
&silt
over
bank
sed
fine
sand
&si
lt
Latit
ude
Deg
M
in
Sec
37
52
3537
53
54
37
53
22
37
53
22
37
53
4337
52
21
37
52
3437
51
25
37
51
5
37
50
43
37
50
33
37
49
19
37
49
6
37
49
1037
48
12
Long
itude
D
eg
Min
S
ec
107
107
107
107
107
107
107
107
107
107
107
107
107
107
107
40
1538
42
39
18
39
18
42
4244
16
43
2543
24
43
31
44
27
45
50
43
10
43
2
43
740
22
Dis
tanc
e A
l km
. pp
m
15.1
011
.50
13.0
0
10.1
0
10.1
013
.75
13.0
015
.45
16.0
0
16.7
0
- 16
.55
19.6
0
20.5
0
20.4
524
.55
3600
8800
5100
7000
2700
4800
4800
3400
7700
3500
2200
00
4900
5600
5100
6700
Ca
ppm 50
014
00
1400
1700
1000
5000
2000 82
031
00
1600
800
1500
4000
1200
2500
Fe
ppm
4600
0042
000
5400
0
4600
0
1300
0022
000
5100
037
000
3800
0
40
00
0
3000
0
3700
0
1600
0
44
00
034
000
K
ppm 300
420
500
700
2300 30
040
040
030
0
300
<200
400
300
400
200
107

App
endi
x V
.1.
Tabl
e of
par
tial d
iges
tion
(2M
HC
I-1%
HjO
j) da
ta fr
om s
ites
sam
pled
from
the
Ani
mas
Riv
er w
ater
shed
, Oct
. 19
95 (
cont
.)
Sam
ple
No.
Sam
ple
Loca
lity
Sam
ple
Type
Latit
ude
Deg
Min
S
ecLo
ngitu
de
Deg
M
in
Sec
Dis
tanc
e km
.A
l pp
mC
a pp
mF
e pp
mK
ppm
Ani
mas
Riv
er b
elow
Silv
erto
n, C
olo.
95A
BS
131A
(A-7
2)95
AB
S13
1B
95A
BS
SB
195
AB
SS
B2
95A
BS
132
95A
BS
-MC
95A
BS
-EC
95A
BS
133
95A
BS
134
95A
BS
-CC
95A
BS
-GC
95A
BS
135
95A
BS
136
95A
BS
137
95A
BS
DP
2(9
5AB
S13
7)M
ean
95A
BS
138
Ani
mas
Riv
er a
t rai
lroad
fin
e sa
nd &
silt
brid
ge b
elow
Silv
erto
nA
nim
as R
iver
at r
ailro
ad
over
bank
sed
brid
ge b
elow
Silv
erto
nD
eadw
ood
Gul
ch
sand
Dee
r P
ark
Cre
ek
sand
Sul
tan
Cre
ek b
elow
fin
e sa
nd &
silt
Mol
as M
ine
Mol
as C
reek
abo
ve c
onfl
sand
with
Ani
mas
Riv
erE
lk C
reek
abo
ve c
onfl
sand
with
Ani
mas
Riv
erLi
me
Cre
ek a
bv U
S 5
50
fine
sand
& s
iltC
asca
de C
rk a
bove
550
fin
e sa
nd &
silt
Cas
cade
Cre
ek a
bove
sa
ndco
nfl w
ith A
nim
as R
iver
Gra
ssho
pper
Cre
ek
sand
abov
e co
nfl w
ith A
nim
asR
iver
Her
mos
a C
reek
abo
ve
fine
sand
& s
iltU
S 5
50A
nim
as R
iver
abo
ve
fine
sand
& s
iltT
rimbl
e B
ridge
and
belo
w q
uarr
yA
nim
as R
iver
abo
ve
fine
sand
& s
ilt32
nd S
treet
Brid
ge,
Dur
ango
Ani
mas
Riv
er a
bove
fin
e sa
nd &
silt
32nd
Stre
et B
ridge
, D
uran
go
Junc
tion
Cre
ek a
t par
k fin
e sa
nd &
silt
37 4
7 23
37 4
7 23
37 4
7 3
37
46
3137
45
49
37
44
7
37
43
19
37
43
5737
39
35
37
35
57
37
34
42
37
24
52
37
23
8
37
18
1
37
18
1
37
17
18
107
40
0
107
40
0
107
40
1210
7 39
46
107
40
33
107
39
40
107
39
3
107
45
210
7 48
43
107
46
32
107
46
28
107
50
9
107
50
9
107
52
3
107
52
3
107
52
33
26.2
5
26.5
028
.00
29.5
0
32.7
5
34.3
5
55.0
055
.05
55.1
0
57.8
0
80.0
0
82.3
5
100.
75
100.
75
102.
35
5800
-44
00
4200
3800
3800
3000
7400
3100
2000
2800
9100
6300
3800
3300
3600
3450
2300
2900
3200
2700
2700
1200
0
1300
0
2300
6100
1400
097
00
6700
3700
0
3900
4800
5200
5000
5900
0
3200
0
22
00
0
26
00
02
10
00
6700
9200
8700
4400
5100
7300
2300
0
1700
0
1400
0
1000
0
1200
0
1100
092
00
240
200
210
200
280
360
620
300
300
360
1200
410
340
290
310
300
420
108

App
endi
x V
.1 .
Tab
le o
f par
tial d
iges
tion
(2M
HC
I-1 %
data
fro
m s
ites
sam
pled
fro
m th
e A
nim
as R
iver
wat
ersh
ed,
Oct
. 1 9
95 (
cont
.)
Sam
ple
No.
95A
BS
139
95A
BS
140
95A
BS
141
95A
BS
142
95A
BS
143
95A
BS
144
95A
BS
145
95A
BS
146
95A
BS
147
95A
BS
148
95A
BS
149A
95A
BS
149B
Bla
nks
95A
BS
100
95A
BS
100
Sam
ple
Loca
lity
Sam
ple
Latit
ude
Typ
e D
eg
Min
S
ec
Junc
tion
Cre
ek w
est o
f fin
e sa
nd &
silt
Dur
ango
Ligh
tner
Cre
ek a
bove
fin
e sa
nd &
silt
conf
luen
ce w
ith A
nim
as R
iver
Ani
mas
Riv
er,
Red
Lio
n fin
e sa
nd &
silt
Bas
in C
reek
, wes
t of
fine
sand
& s
iltU
S 5
50A
nim
as R
iver
sou
th o
f fin
e sa
nd &
silt
Wea
sels
kin
Brid
geF
lorid
a R
iver
nor
th o
f fin
e sa
nd &
silt
Co.
R
d. 3
1 8
brid
geA
nim
as R
iver
abo
ve
fine
sand
& s
iltB
onda
d B
ridge
Ani
mas
Riv
er a
t Ced
ar
fine
sand
& s
iltH
ill g
agin
g st
atio
n, C
olo.
Ani
mas
Riv
er a
bove
fin
e sa
nd &
silt
Brid
ge, A
ztec
New
Mex
ico
Ani
mas
Riv
er a
t BoR
fin
e sa
nd &
silt
Pum
p st
atio
n si
te a
bove
US
550
, D
uran
go,
Ani
mas
Riv
er a
t KO
A
fine
sand
& s
iltC
ampg
roun
d be
low
Bak
ers
Brid
geA
nim
as R
iver
at K
OA
ov
erba
nk s
ed.
Cam
pgro
und
belo
w B
aker
s B
ridge
Fiel
d bl
ank
qtz
sand
Fiel
d bl
ank
qtz
sand
37 37 37 37 37 37 37 37 36 37
18 16 16 11 9 3 3 2 49 15
4 6 9 11 5 26 5 11 41 48
Long
itude
D
eg
Min
S
ec
107
107
107
107
107
107
107
107
107
107
52 5
2
53
14
53
852
48
53
6
52
4
52 3
1
52 2
8
59
59
52
53
Dis
tanc
e km
.
102.
40
105.
10
105.
0011
7.75
122.
00
136.
00
135.
50
137.
50
171.
50
106.
20
Al
PPm
1000
2300
'
3800
9300
3100
4100
3800
3700
3800
3600
Ca
ppm
1200
0
6300
0
1700
040
000
7500
0
1200
0
1600
0
2400
0
1200
0
1600
0
Fe
ppm
3100
1600
0
1200
016
000
7300
6700
6400
6300
7500
1300
0
K
ppm
220
390
340
620
290
420
340
310
410
350
Col
o.37 37
27 27
18 18
107
107
48
3
48
3
72.5
0
72.5
0
,
6000
3700
<2
0<
7
4800
4000 20 <7
2200
0
1700
0
20 <7
400
300
<2
0<
7
109

App
endi
x V.
1 .
Tabl
e of
par
tial d
iges
tion
(2M
HC
I-1%
data
from
site
s sa
mpl
ed fr
om th
e A
nim
as R
iver
wat
ersh
ed,
Oct
. 19
95 (
cont
.)
Sam
ple
No.
Mg
ppm
Ani
mas
Riv
er u
pstre
am fr
om95
AB
S10
195
AB
S10
295
AB
S10
395
AB
S10
4A95
AB
S10
4C95
AB
S10
4D95
AB
S10
595
AB
S10
695
AB
S10
795
AB
S10
895
AB
S10
995
AB
S11
0A95
AB
S11
0B95
AB
S11
1A95
AB
S11
1B95
AB
S11
295
AB
S11
3
Cem
ent
Cre
ek95
AB
S11
495
AB
SD
P1
Mea
n95
AB
S11
595
AB
S11
695
AB
S11
795
AB
S11
895
AB
S12
0A95
AB
S12
0B
3400
3200
3400
4100
600
2300
5000
0<
200
2300
3600
3100
3900
4700
019
0053
000
3800
3700
2300
2300
2300
1300
2000 90
025
0025
0027
00
Na
ppm
Silv
erto
n<
40 40
<40 40
<80
100
600
<2
00 50 60 50 60
1200 40 70
0<
40 40
<200
<200
<2
00
100
<200
<2
00
<40 90
<80
P
ppm
, Col
o.15
0014
0015
0013
0060
030
018
000
600
1800
1500
1700
1500
1200
010
0014
000
1300
1400
2000
2000
2000
1700
2000
200
1500
1600
1900
Ti
ppm
<40
<40 50
<40
<80
<70
400
<200
<40 70
<40
100
300
<40
300
<40
<40
<200
<200
<200
<70
<200
<2
00 90 200
<80
Ag
ppm
<2 2 4 7 30 40 30 60 <2 20 <2 6
<3 20 10 8 10 <6
<6
<6
<3
<6
<6 3
<3 5
As
ppm
30 57 10 20 30 50<
20
<30 8
20 <8 10
<20 10 <
20
10 20 40 40 40 20 50<
30
20<
20
50
Ba
Be
ppm
pp
m
41
316
0 1
110
211
0 3
140
<2
9 <
219
0 50
40
<3
150
112
0 2
140
< 0.
810
0 1
110
2010
0 <
0.7
300
818
0 1
120
2
70
<3
80
<3
75
<3
130
<2
100
<3
10
<3
77
170
<
211
0 <
2
Bi
ppm
<8
<7 10 <8
<20
<20 30 80 <8 8
<8
<8
<20 10 20 20 8
<30
<30
<30
<20
<30
<30 10
<20
<20
Cd
ppm
<2
<2 10 10 <3 74 70 <6 <2 6
<2 2 5 8 40 20 7
<6
<6
<6
<3
<6
<6
<2
<3
<3
Ce
ppm
53 42 45 477
<6
1500
<10 58 44 43 30
460 40
440 40 40 10 10 10 40 20
<10 40 20 50
Co
ppm 9 10 20 20 <3 9
110
<6 20 20 10 10 60 10 93 20 10 7 9 8 207 6 208 8
Cr
ppm 4 6 4 5
<3
<3 40 <6
<2 3 3 4 20 3 40 3 3
<6
<6
<6 4
<6
<6 7 5 4
Cu
ppm
92 43 360
460
680
750
4000
730 45 320 59 160
1100
950
3900
290
280 60 60 60 60 60 <6
360 82
220
110

App
endi
x V
.1.
Tabl
e of
par
tial d
iges
tion
(2M
HC
I-1%
data
fro
m s
ites
sam
pled
from
the
Ani
mas
Riv
er w
ater
shed
, Oct
. 19
95 (
cont
.)
Sam
ple
No.
Min
eral
Cre
ek95
AB
S12
195
AB
S12
295
AB
S12
395
AB
S12
495
AB
S12
595
AB
S12
695
AB
S-W
D95
AB
S12
795
AB
S12
895
AB
S12
995
AB
S13
0
Mg
ppm
1000
<
1900
1000
<
810
1400
1200
Na
ppm
200 90 200
100 90
<7
0<
200
< 20
014
0020
0016
00 830
Ani
mas
Riv
er b
elow
Silv
erto
n,95
AB
S13
1A95
AB
S13
1B95
AB
SS
B1
95A
BS
SB
295
AB
S13
295
AB
S-M
C95
AB
S-E
C95
AB
S13
395
AB
S13
495
AB
S-C
C95
AB
S-G
C95
AB
S13
595
AB
S13
695
AB
S13
795
AB
SD
P2
Mea
n95
AB
S13
895
AB
S13
9
1800
2000
1200
1400
5100
6500
1700
1300
3000
3300
4200
2900
2200
2200
2400
2300
6400
1600
<8
0 60 100 30
Col
o.30 20 20 30 50 60 20 20 30 30
<40 40 30 40 30 35 100 30
P pp
m
1500
018
0020
0015
0017
0011
0010
0012
0013
0014
0011
00
1300
1200
1100
1100
1200 740
770
1100
1100
960
1200
790
1100 850
960
905
800
780
Ti
ppm
<2
00
<4
0<
200 80
<7
0<
70
<200
<8
010
0 80 50 50 30 40 40 200 90 100
100 90 100
620 50 90 60 80 70 30 30
Ag
ppm 9
<2
<6 <3
<3
<3
<6 <3
<2
<3
<0
.9 5 6 2 3 2<
0.9
<0.9
<0.9
<0.9
<0.9
<2 1 2 3 3 3
<0.9
<0.9
As
ppm
4400 20 210 20 92
<2
0<
30 30 < 8
50 20 20 10 10 9 8 5 5<
4<
4<
4<
9 8 6 4 5 5<
4<
4
Ba
ppm
220
110
200
150
150 60 <3 88 80 160 70 85 100
110
110
140
120
100
170
120
100
170
130 92 83 88 86 130
190
Be
ppm <3 1
<3
<2
<2
<2 20 <2 <0.8
<2 0.
9
1 0.8
0.9
0.8
0.4
0.5
1 0.4
0.5
<0.4
<0.9 1 0.5
0.4
0.4
0.4
0.4
<0.4
Bi
ppm
<3
0<
7<
30
<2
0<
20
<2
0<
30
<2
0<
8<
20
<4
<4 6
<4
<4
<4
<4
<4
<4 <4
<4
<9
<4
<4
<4
<4
<4
<4
<4
Cd
ppm
<6 3
<6
<3
<3
<3
<6
<3
<2
<3 <0.9
2 4 2 3<
0.9
<0.9
<0.9
<0.9
<0.9
<0.9
<2 4
<0.9 2 2 2
<0.9
<0.9
Ce
ppm
20 40 20 20 40 20 20 20 30 20 33 31 26 24 24 21 20 21 21 27 20 57 28 33 21 24 23 20 10
Co
ppm
<6 10 8 6 20 9
<6 10 10 9 29 20 10 20 10 4 6 31 4 8 7 10 21 8 7 7 7 6 3
Cr
ppm 10 2
<6
<3 3
<3
<6
<3 3
<3 4 2 1 2 1 3 5 10 3 3 5 9 3 4 3 4 4 5 2
Cu
ppm
210 50 340 20 830 10 <6 84 20 91 210
250
210
200
190 207 10 5 5 8 20 140
100 80 91 86 10 4
111

App
endi
x V
.1.
Tabl
e of
par
tial d
iges
tion
(2M
HC
I-1 %
H2O
^ da
ta fr
om s
ites
sam
pled
from
the
Ani
mas
Riv
er w
ater
shed
, O
ct.
1995
(co
nt.)
Sam
ple
No.
95A
BS
140
95A
BS
141
95A
BS
142
95A
BS
143
95A
BS
144
95A
BS
145
95A
BS
146
95A
BS
147
95A
BS
148
95A
BS
149A
95A
BS
149B
Bla
nks
95A
BS
100
95A
BS
100
Mg
ppm
1400
028
0054
0030
0015
0015
0014
0017
0034
0027
0022
00
<2
0<
7
Na
PPm
100 60 760
100 90 80 80 100 60 30 20
<2
0<
7
P pp
m 850
1100 370
730
560
500
540
590
1200
1200
1300
<2
0<
7
Ti
ppm
<2
0 70<
20
<2
0<
20
<2
0<
20
<20 70
100
70
<2
0<
7
Ag
ppm
<0.9 2
<0.9
<0.9
<0.9
<0.9
<0.9
<0.9 2 2 2
<0.9
<0.3
As
ppm
<4 4
<4
<4
<4
<4
<4
<4 6 10 8
<4
<2
Ba
ppm
130
110
200
210
290
190
210
180
130
120
110
<0.4
<0.2
Be
ppm 0.4
0.5
0.9
0.4
0.6
0.6
0.6
0.6
0.5
0.8
0.5
<0.4
<0.2
Bi
ppm
<4
<4
<4
<4
<4
<4
<4
<4
<4
<4
<4
<4
<2
Cd
ppm
<0.9 2
<0.9 5
<0.9
<0.9
<0.9
<0.9 2 3 2
<0.9
<0.3
Ce
ppm
20 26 10 20 20 10 10 22 27 35 33 <2
<0.6
Co
ppm 8 8 10 10 6 7 7 7 8 20 9
<0.9
<0.3
Cr
ppm
6 5 3 1 2 1 1 2 4 5 3
<0.9
<0.3
Cu
ppm 20 83 10 58 9 20 20 26 92 150
110 <0.9
<0.3
112

App
endi
x V
.1.
Tabl
e of
par
tial d
iges
tion
(2M
HC
I-1%
data
from
site
s sa
mpl
ed f
rom
the
Ani
mas
Riv
er w
ater
shed
, O
ct.
1995
(co
nt.)
Sam
ple
No.
La
ppm
Ani
mas
Riv
er u
pstre
am fr
om95
AB
S10
195
AB
S10
295
AB
S10
395
AB
S10
4A95
AB
S10
4C95
AB
S10
4D95
AB
S10
595
AB
S10
695
AB
S10
795
AB
S10
895
AB
S10
995
AB
S11
0A95
AB
S11
0B95
AB
S11
1A95
AB
S11
1B95
AB
S11
295
AB
S11
3
Cem
ent C
reek
95A
BS
114
95A
BS
DP
1M
ean
95A
BS
115
95A
BS
116
95A
BS
117
95A
BS
118
95A
BS
120A
95A
BS
120B
40 20 30 30 <6
<6
590
< 10 30 20 20 20 32
020 29
020 20 < 10
< 10
< 10 20
< 10
< 10 20 10 30
Li
ppm
Silv
erto
n10 9 10 20 <6
<6
170
< 10 9 10 10 10 20
010 22
020 10 < 10
< 10
< 10 <6
< 10
< 10 7 8 7
Mn
ppm
, Col
o. 3300
4200
1200
012
000
4100
0>
7000
049
000
3014
0098
0012
0046
0012
000
5700
1800
019
000
9600
520
540
530
870
520
< 10
2400 660
1100
Mo
ppm <2 2 4 7 20 20 110
230 2 9 2 5 8 43 40 30 10 <6
<6
<6
<3
<6
<6 2
<3
<3
Ni
ppm 4 8 9 10 <
3<
3 60 <6 5 6 4 4 40 3 30 9 6 <6
<6
<6
<3
<6
<6 4
<3 4
Pb
ppm
270
170
730
1900
4000
6800
7400
1800
018
021
00 500
1000
3800
4800
1300
014
0019
00 320
310
315 72 500
< 10
620
640
2500
Sb
ppm
<4
<4
<4
<4 20 30 10
<20
<4
<4
<4
<4
<8
<4
<8
<4
<4
<2
0<
20
<2
0 <7
<2
0<
20
<4
<7
<8
Sr
ppm
10 59 51 40 20 4059
0 10 48 42 46 30 450
40 290
54 40 40 40 40 120
50 10 30 50 60
Th
ppm
<3
<3
<3
<3
<6
<6 96
< 10 <3
<3
<3
<3 70 <3
110
<3
<3
< 10
< 10
< 10 <
6<
10<
10 <3
<6
<6
Vpp
m 20,
20 10 20 <3
<3
140
<6 10 10 10 20 110 10 230 10 10 30 30 30 20 20 20 20 20 20
Y
Zn
ppm
pp
m
20
650
10
450
10
2800
10
2600
4 62
03
2000
024
0 27
000
<6
10
020
18
010
17
0010
51
010
97
011
0 87
0010
16
0012
0 16
000
10
3400
10
2000
<6
20
0<
6
200
<6
200
10
86<
6
200
<6
60
10
280
4 20
010
72
0
113

App
endi
x V
.1.
Tabl
e of
par
tial d
iges
tion
(2M
HC
I-1%
H2O
2) d
ata
from
site
s sa
mpl
ed fr
om th
e A
nim
as R
iver
wat
ersh
ed,
Oct
. 19
95 (
cont
.)
Sam
ple
No.
Min
eral
Cre
ek95
AB
S12
195
AB
S12
295
AB
S12
395
AB
S12
495
AB
S12
595
AB
S12
695
AB
S-W
D95
AB
S12
795
AB
S12
895
AB
S12
995
AB
S13
0
La
ppm
10 20 10 9 20 9<
10 10 20 10 20
Ani
mas
Riv
er b
elow
Silv
erto
n,95
AB
S13
1A95
AB
S13
1B95
AB
SS
B1
95A
BS
SB
295
AB
S13
295
AB
S-M
C95
AB
S-E
C95
AB
S13
395
AB
S13
495
AB
S-C
C95
AB
S-G
C95
AB
S13
595
AB
S13
695
AB
S13
795
AB
SD
P2
Mea
n95
AB
S13
895
AB
S13
9
20 10 10 10 10 8 10 10 20 10 40 20 20 10 10 10 8 7
Li
ppm
< 10 8
< 10
<6
<6
<6
< 10
<6 6
<6 3
Col
o. 7 8 5 6 5 410 4 3 4 20 7 8 8 9 9 4<
2
Mn
ppm 20
016
0067
038
022
00 830
< 10
1100 560
530
1400
5200
6200
4600
5200 580
770
780
530
460
500
640
3200
2300
2700
3000
2850 18
024
0
Mo
ppm
<6 7
<6
<3
<3
<3
<6
<3
<2
<3
<0.9
4 4 4 3 1<
0.9
<0.9
<0.9
<0.9
<0.9
<2
<0.9 3 2 2 2
<0.9
<0.9
Ni
ppm
<6 2
<6
<3 4
<3
<6
<3 7
<3 5 4 3 3 3 4 7 38 3 8 7 6 9 4 4 5 5 10 2
Pb
ppm
3500 930
1000 120
630
120 30 200 90 460
220
1200
1300 910
1000 670 20 9 8 6 6 10
290
440
270
290
280 20 6
Sb
ppm
<2
0<
4<
20
<7
<7
<7
<2
0<
8<
4<
8<
2
<2
<2 4
<2
<2
<2
<2
<2
<2
<2
<4
<2
<2
<2 3 3
<2
<2
Sr
ppm 70 77 30 40 50 20 7 20 30 30 27 31 26 26 27 29 20 10 39 27 20 10 16
0 33 25 27 26 190 41
Th
ppm
< 10 <3
< 10 <6
<6
<6
< 10 <6
<3
<6
<2
<2
<2
<2
<2
<2
<2
<2
<2
<2
<2
<4
<2 4
<2 4
<2
<2
<2
Vpp
m 30 , 7 10 10 10 8 80 10 10 10 10 10 10 9 9 7 9 7 8 8 9 20 10 10 8 9 9 10 4
Y
Zn
ppm
pp
m
<6
20
010
60
06
330
5 40
20
680
6 78
20
<6
9 12
010
20
08
100
20
420
10
790
8 82
010
72
08
780
8 97
7 65
8 13
010
20
10
479
3330
64
20
1700
10
500
8 62
09
680
9 65
010
54
6 20
114

App
endi
x V
.1.
Tab
le o
f par
tial d
iges
tion
(2M
HC
I-1 %
HjO
j) da
ta fr
om s
ites
sam
pled
from
the
Ani
mas
Riv
er w
ater
shed
, O
ct.
1995
(co
nt.)
Sam
ple
No.
95A
BS
140
95A
BS
141
95A
BS
142
95A
BS
143
95A
BS
144
95A
BS
145
95A
BS
146
95A
BS
147
95A
BS
148
95A
BS
149A
95A
BS
149B
Bla
nks
95A
BS
100
95A
BS
100
La
ppm 7 20 5 8 9 6 6 10 20 20 20 <
2<
0.6
Li
ppm 5 9 4 4 3 3 3 4 9 8 7
<2
<0.6
Mn
ppm
180
3300
610
4400 540
1100
1100
1100
3200
3400
2900 <2 <0.
6
Mo
ppm 2 1
<0.
9 1<
0.9
<0.
9<
0.9
<0.
9 2 3 2
<0.
9<
0.3
Ni
ppm
20 7 4 8 4 4 4 4 7 9 4
<0.
9 0.4
Pb
ppm
20 260 10 140 8 31 28 64 320
490
570
<2
<0.
6
Sb
ppm
<2
<2
<2
<2
<2
<2
<2
<2
<2
<2
<2
<2
<0
.7
Sr
ppm 140 73 300
230 72 91 110 74 66 36 25 <
0.9
<0.
3
Th
ppm 5
<2
<2
<2
<2
<2
<2
<2 2
<2 3
<2 0.
6
Vpp
m 10 10-
20 8 6 5 5 7 20 10 10 <0.9
<0.3
Ypp
m 10 10 9 8 8 7 7 8 10 10 9
<0.9
<0.3
Zn
ppm 58 790 38
1100 28 230
240
290
830
1200
660 <0.9
<0.3
115

App
endi
x V
.2.
Tab
le o
f par
tial d
iges
tion
(2M
HC
I-1%
H2C
>2) d
ata
from
site
s sa
mpl
ed f
rom
the
Ani
mas
Riv
er w
ater
shed
, Aug
. an
d O
ct.
1996
[C
once
ntra
tions
giv
en in
par
ts p
er m
illio
n, p
pm (
ug/g
)]
Fiel
d N
o.
Ani
mas
Riv
er u
pstre
am fr
om96
-AB
S-1
0696
-AB
S-1
0595
-AB
S-1
10A
96-A
BS
-107
Cem
ent C
reek
96-A
BS
-104
96-A
BS
-108
96-A
BS
-108
d
Min
eral
Cre
ek96
-AB
S-1
0196
-AB
S-1
0296
-AB
S-1
0396
-AB
S-1
09
Ani
mas
Riv
er b
elow
Silv
erto
n96
-AB
S-1
10A
96-A
BS
-110
B95
-AB
S-1
31A
96-A
BS
-125
A96
-AB
S-1
25B
96-A
BS
-112
96-A
BS
-111
96-A
BS
-113
95-A
BS
-137
Al
ppm
Silv
erto
n,97
0062
0062
0064
00
4400
4100
4200
4600
5100
6300
1200
0
, Col
o.76
0060
0060
0054
0044
0010
000
2000
4200
4100
Ca
ppm
Col
o. 3700
5900
3900
5600
1700
1400
1400
1700
1500
3200
2500
2900
2000
2500
3000
2300
4800
4950
071
0050
00
Fe
ppm
1900
023
000
2200
023
000
5630
056
100
5770
0
4050
041
800
2400
040
600
3950
029
000
3000
028
000
3090
028
000
3800
1300
013
000
K
ppm
290
270
350
270
390
350
360
260
290
240
270
260
200
370
270
300
420
420
450
470
Mg
ppm
3000
3400
3600
3500
2100
2100
2100
1400
1100
1600
1200
2100
1500
2200
2300
2200
2500
3300
2900
2700
Na
ppm 30 30 41 41 57 37 41 35 48 42 57 36 31 39 38 39 51 39 70 72
P pp
m
1100
1200
1200
1200
1300
1200
1200
1000
1100
1100
1100
1200
820
1000
1200
1200
1000 540
980
820
Ti
ppm
<3
0 30 120 30 94 58 57
<30
<30 69 44 39 35 35 39 40 93 62 74 75
Ag
ppm 8.1
16 7.8
15 1.9
2.0
2.7
6.2
< 1
< 1
<1 11 8.
57.
18.
29.
63.
4<
1 2.6
3.4
As
ppm
38 18 10 17 9.5
18 20 180 31 6.
923 19 15 16 16 20 13 <6
<6
<6
Sam
ple
loca
litie
s gi
ven
in a
ppen
dix
VI.2
116
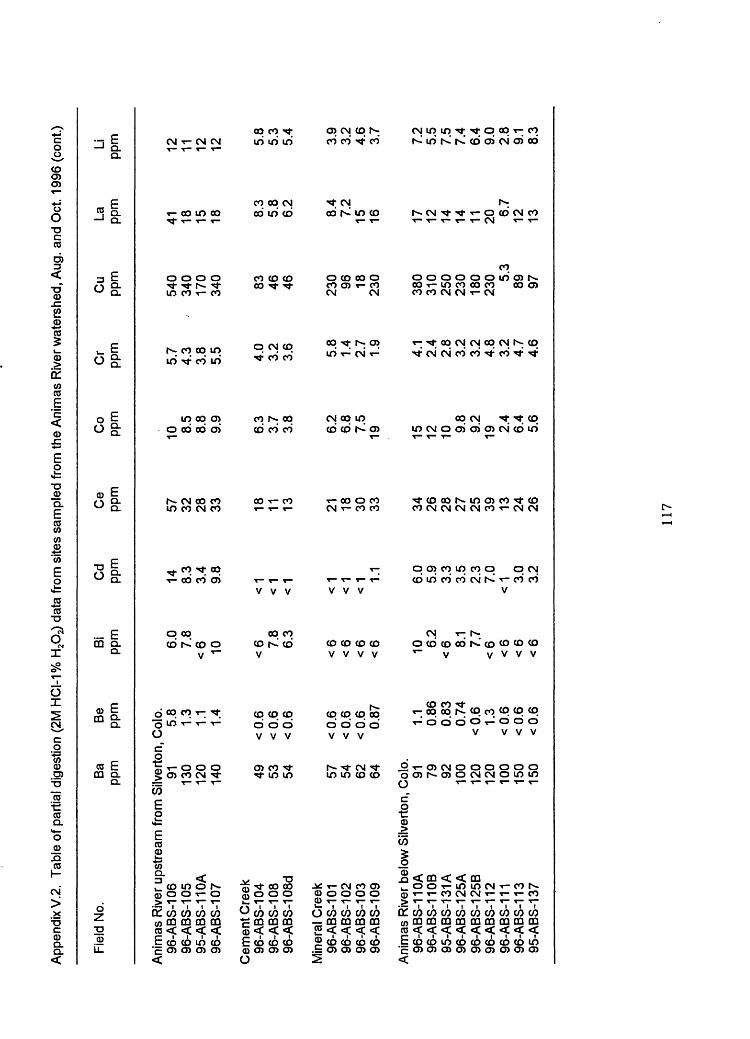
App
endi
x V
.2.
Tab
le o
f par
tial d
iges
tion
(2M
HC
I-1%
data
fro
m s
ites
sam
pled
fro
m th
e A
nim
as R
iver
wat
ersh
ed, A
ug.
and
Oct
. 19
96 (
cont
.)
Fiel
d N
o.
Ani
mas
Riv
er u
pstr
eam
96-A
BS
-106
96-A
BS
-105
95-A
BS
-110
A96
-AB
S-1
07
Cem
ent C
reek
96-A
BS
-104
96-A
BS
-108
96-A
BS
-108
d
Min
eral
Cre
ek96
-AB
S-1
0196
-AB
S-1
0296
-AB
S-1
0396
-AB
S-1
09
Ba
ppm
from
Silv
erto
n,91 13
012
014
0 49 53 54 57 54 62 64
Be
ppm
Col
o. 5.8
1.3
1.1
1.4
<0.6
<0.6
<0.6
<0.6
<0.6
<0.6 0.87
Bi
ppm
6.0
7.8
<6 10 <6 7.
86.
3
<6
<6
<6
<6
Cd
ppm
14 8.3
3.4
9.8
<1
<1
<1 <1
< 1
<1 1.
1
Ce
ppm
57 32 28 33 18 11 13 21 18 30 33
Co
ppm
10 8.5
8.8
9.9
6.3
3.7
3.8
6.2
6.8
7.5
19
Cr
ppm
5.7
4.3
3.8
5.5 4.0
3.2
3.6 5.8
1.4
2.7
1.9
Cu
ppm
540
340
170
340 83 46 46 230 96 18
230
La
ppm
41 18 15 18 8.3
5.8
6.2
8.4
7.2
15 16
Li
ppm 12 11 12 12 5.
85.
35.
4
3.9
3.2
4.6
3.7
Ani
mas
Riv
er b
elow
Silv
erto
n, C
olo.
96-A
BS
-110
A96
-AB
S-1
10B
95-A
BS
-131
A96
-AB
S-1
25A
96-A
BS
-125
B96
-AB
S-1
1296
-AB
S-1
1196
-AB
S-1
1395
-AB
S-1
37
91 79 92 100
120
120
100
150
150
1.1
0.86
0.83
0.74
<0.6 1.3
<0.6
<0.6
<0.6
10 6.2
<6 8.
17.
7<
6 <6
<6
<6
6.0
5.9
3.3
3.5
2.3
7.0
<1 3.
03.
2
34 26 28 27 25 39 13 24 26
15 12 10 9.8
9.2
19 2.4
6.4
5.6
4.1
2.4
2.8
3.2
3.2
4.8
3.2
4.7
4.6
380
310
250
230
180
230 5.
389 97
17 12 14 14 11 20 6.7
12 13
7.2
5.5
7.5
7.4
6.4
9.0
2.8
9.1
8.3
117

App
endi
x V
.2.
Tabl
e of
par
tial d
iges
tion
(2M
HC
I-1 %
\-\2O
J da
ta fr
om s
ites
sam
pled
from
the
Ani
mas
Riv
er w
ater
shed
, Aug
. an
d O
ct.
1996
(co
nt.)
Fiel
d N
o.M
n pp
m
Ani
mas
Riv
er u
pstre
am fr
om S
ilver
ton,
96-A
BS
-106
96-A
BS
-105
95-A
BS
-110
A96
-AB
S-1
07
Cem
ent C
reek
96-A
BS
-104
96-A
BS
-108
96-A
BS
-108
d
Min
eral
Cre
ek96
-AB
S-1
0196
-AB
S-1
0296
-AB
S-1
0396
-AB
S-1
09
9900
1000
040
0010
000
820
420
440
730
640
440
1200
Mo
ppm
Col
o. 6.9
8.0
4.4
9.0
<1
<1
<1 <1 1.
6<
1 1.7
Ni
ppm
8.8
3.9
3.9
5.7
2.0
1.4
1.8
3.3
1.0
6.2
3.6
Pb
ppm 940
2600
1000
2400 54
032
034
0
930
260 91 240
Sb
ppm
<3 3.
3<
3<
3
<3
<3
<3
<3
<3
<3
<3
Sr
ppm
22 32 28 34 44 34 35 19 19 23 25
Th
ppm
<2
<2
<2
<2 2.
0<
2 2.7
<2
<2
<2
<2
V
ppm
13 12 14 12 17 19 20 9.0
9.4
9.0
10
Y ppm
23 9.9
8.6
11 4.4
3.0
3.2 6.2
6.8
12 20
Zn
ppm
3600
1800 960
2500
200
110
120
290
120
210
460
Ani
mas
Riv
er b
elow
Silv
erto
n, C
olo.
96-A
BS
-110
A96
-AB
S-1
10B
95-A
BS
-131
A96
-AB
S-1
25A
96-A
BS
-125
B96
-AB
S-1
1296
-AB
S-1
1196
-AB
S-1
1395
-AB
S-1
37
7400
6700
4500
4700
3800
4500 31
028
0027
00
8.0
6.6
4.5
4.9
6.2
2.9
<1 1.
81.
8
4.6
3.5
3.4
3.8
2.7
12 3.3
5.2
4.4
1700
1300
1200
1300
1200 540 5.
630
031
0
<3
<3
<3
<3
<3
<3
<3
<3
<3
32 23 29 31 26 40 150 35 28
<2
<2
<2
<2 2.
1<
2<
2 2.7
2.3
12 9.1
12 12 12 13 7.9
11 11
16 12 11 10 7.3
21 7.4
9.8
8.2
1100 900
840
850
530
2400 18 78
080
0
118
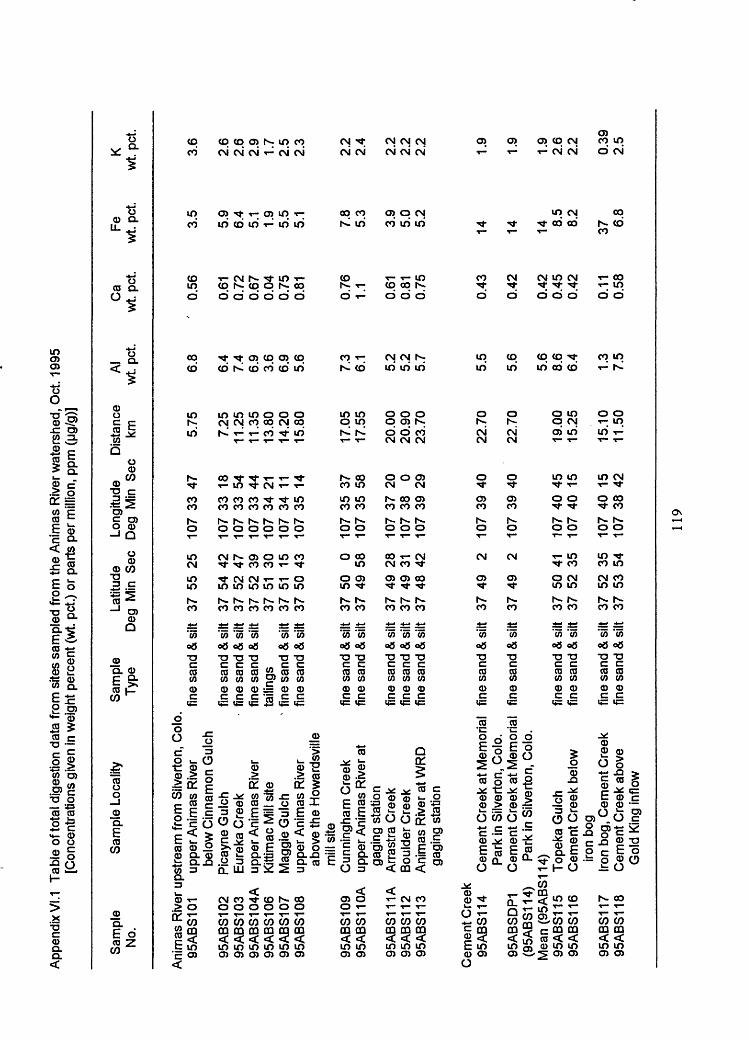
App
endi
x VI
.1
Tabl
e of
tota
l dig
estio
n da
ta fr
om s
ites
sam
pled
from
the
Ani
mas
Riv
er w
ater
shed
, O
ct.
1995
[C
once
ntra
tions
giv
en in
wei
ght p
erce
nt (w
t. pe
t.) o
r pa
rts p
er m
illio
n, p
pm (
M9/
9)]
Sam
ple
No.
Sam
ple
Loca
lity
Sam
ple
Type
Latit
ude
Deg
M
in
Sec
Long
itude
D
eg
Min
S
ecD
ista
nce
kmA
l w
t. pe
t.C
a w
t. pe
t.Fe
w
t. pe
t.K
w
t. pe
t.
Ani
mas
Riv
er u
pstre
am fr
om S
ilver
ton,
Col
o.95
AB
S10
1
95A
BS
102
95A
BS
103
95A
BS
104A
95A
BS
106
95A
BS
107
95A
BS
108
95A
BS
109
95A
BS
110A
95A
BS
111A
95A
BS
112
95A
BS
113
Cem
ent C
reek
95
AB
S11
4
uppe
r Ani
mas
Riv
erbe
low
Cin
nam
on G
ulch
P
icay
ne G
ulch
E
urek
a C
reek
up
per A
nim
as R
iver
K
ittim
ac M
ill s
ite
Mag
gie
Gul
ch
uppe
r Ani
mas
Riv
erab
ove
the
How
ards
ville
mill
site
Cun
ning
ham
Cre
ek
uppe
r Ani
mas
Riv
er a
tga
ging
sta
tion
Arr
astra
Cre
ek
Bou
lder
Cre
ek
Ani
mas
Riv
er a
t WR
Dga
ging
sta
tion
fine
sand
& s
ilt
37
55 2
5 10
7 33
47
Cem
ent C
reek
at M
emor
ial
Par
k in
Silv
erto
n, C
olo.
Cem
ent C
reek
at M
emor
ial
Par
k in
Silv
erto
n, C
olo.
95A
BS
DP
1(9
5AB
S11
4)M
ean(
95A
BS
114)
95A
BS
115
Tope
ka G
ulch
95A
BS
116
Cem
ent C
reek
bel
owiro
n bo
g95
AB
S11
7 Iro
n bo
g, C
emen
t Cre
ek
95A
BS
118
Cem
ent C
reek
abo
veG
old
King
inflo
w
5.75
fine
sand
fine
sand
fine
sand
taili
ngs
fine
sand
fine
sand
fine
sand
fine
sand
fine
sand
fine
sand
fine
sand
fine
sand
fine
sand
fine
sand
fine
sand
fine
sand
fine
sand
&si
lt&
silt
&si
lt
& si
lt&
silt
&si
lt&
silt
&si
lt&
silt
&si
lt
&si
lt
&si
lt
&si
lt&
silt
&si
lt&
silt
37 37 37 37 37 37 37 37 37 37 37 37 37 37 37 37 37
54 52 52 51 51 50 50 49 49 49 48 49 49 50 52 52 53
42 47 39 30 15 43
0 58 28 31 42 2 2 41 35 35 54
107
107
107
107
107
107
107
107
107
107
107
107
107
107
107
107
107
33 33 33 34 34 35 35 35 37 38 39 39 39 40 40 40 38
18 54 44 21 11 14 37 58 20 0 29 40 40 45 15 15 42
7.25
11 11 13
.25
.35
.80
14.2
015 17 17 20 20 23
.80
.05
.55
.00
.90
.70
22.7
0
22 19 15 15 11
.70
.00
.25
.10
.50
6.8
7.3
6.1
5.2
5.2
5.7
5.5
5.6
5.6
8.6
6.4
1.3
7.5
0.56
0.76
1.
1
0.61
0.81
0.75
0.43
0.42
0.42
0.45
0.42
0.11
0.58
3.5
7.8
5.3
3.9
5.0
5.2
14 14 14 8.5
8.2
376.
8
3.6
2.2
2.4
2.2
2.2
2.2
1.9
1.9
1.9
2.6
2.2
0.39
2.
5
119

App
endi
x V
I. Ta
ble
of to
tal d
iges
tion
data
from
site
s sa
mpl
ed fr
om th
e A
nim
as R
iver
wat
ersh
ed,
Oct
. 19
95 (
cont
.)
Sam
ple
No.
95A
BS
120A
95A
BS
120B
Min
eral
Cre
ek95
AB
S12
295
AB
S12
395
AB
S12
495
AB
S12
5
95A
BS
126
95A
BS
127
95A
BS
128
95A
BS
129
95A
BS
130
Sam
ple
Loca
lity
Bel
ow c
onflu
ence
of N
and
S Fo
rks
of C
emen
t Cre
ekB
elow
con
fluen
ce o
f N a
ndS
Fork
s of
Cem
ent C
reek
Mill
Cre
ekM
iner
al C
reek
Bro
wns
Gul
chM
iner
al C
reek
abo
veB
urro
Brid
geM
iddl
e Fo
rk M
iner
al C
reek
abov
e B
onne
r m
ine
Min
eral
Cre
ek a
bove
Sou
thFo
rkS
outh
For
k M
iner
al C
reek
belo
w ir
on b
ogS
outh
For
k M
iner
al C
reek
Min
eral
Cre
ek g
agin
gst
atio
n in
Silv
erto
n
Sam
ple
Latit
ude
Type
D
eg
Min
Sec
fine
sand
& s
ilt
over
bank
sed
.
fine
sand
& s
iltfin
e sa
nd &
silt
fine
sand
& s
iltfin
e sa
nd &
silt
fine
sand
& s
ilt
fine
sand
& s
ilt
fine
sand
& s
ilt
over
bank
sed
.fin
e sa
nd &
silt
37 5
3 22
37 5
3 22
37
52 2
137
52
3437
51
2537
51
5
37 5
0 43
37 4
9 19
37 4
9 6
37 4
9 10
37 4
8 12
Long
itude
D
eg
Min
S
ec
107
107
107
107
107
107
107
107
107
107
107
39 39 44 43 43 43 44 43 43 43 40
18 18 16 25 24 31 27 10 2 7 22
Dis
tanc
e km 13
.00
10.1
0
13.7
513
.00
15.4
516
.00
16.7
0
19.6
0
20.5
0
20.4
524
.55
Al
wt.
pet.
6.8
6.8
7.8
6.9
7.2
7.3
6.4
6.8
6.6
7.1
6.8
Ca
wt.
pet.
0.62
,0.
34
0.81
0.37
0.29
0.46
0.33
0.36
1.2
0.36
0.76
Fe
wt.
pet.
8.1
6.5
6.5
7.4
5.9
7.6
5.3
5.2
5.2
6.4
7.1
K
wt.
pet.
2.4
2.9
2.7
2.3
2.1
2.2
2.2
2.3
2.0
2.2
2.0
Ani
mas
Riv
er b
elow
Silv
erto
n, C
olo.
95A
BS
131A
95A
BS
131B
95A
BS
SB
195
AB
SS
B2
95A
BS
132
95A
BS
-MC
Ani
mas
Riv
er a
t rai
lroad
brid
ge b
elow
Silv
erto
nA
nim
as R
iver
at r
ailro
adbr
idge
bel
ow S
ilver
ton
Dea
dwoo
d G
ulch
Dee
r P
ark
Cre
ekS
ulta
n C
reek
bel
owM
olas
Min
eM
olas
Cre
ek a
bove
con
f.w
ith A
nim
as R
iver
fine
sand
& s
ilt
over
bank
sed
.
sand
sand
fine
sand
& s
ilt
sand
37 4
7 23
37 4
7 23
37 4
7 3
37 4
6 31
37 4
5 49
37 4
4 7
107
107
107
107
107
107
40 40 40 39 40 39
0 0 12 46 33 40
26.2
5
26.5
028
.00
29.5
0
32.7
5
6.2
5.8
5.9
5.6
6.6
5.4
0.59
0.72
0.76
0.70
1.7
1.5
5.3
6.0
7.7
8.5
7.0
4.1
2.0
2.0
1.9
2.0
1.7
1.6
120

App
endi
x V
I.1
Tab
le o
f tot
al d
iges
tion
data
fro
m s
ites
sam
pled
fro
m t
he A
nim
as R
iver
wat
ersh
ed,
Oct
. 19
95 (
cont
.)
Sam
ple
No.
95A
BS
-EC
95A
BS
133
95A
BS
134
95A
BS
-CC
95A
BS
-GC
95A
BS
135
95A
BS
136
95A
BS
137
95A
BS
DP
2(9
5AB
S13
7)
Sam
ple
Loca
lity
Elk
Cre
ek a
bove
con
f.w
ith A
nim
as R
iver
Lim
e C
reek
abo
ve U
S 5
50C
asca
de C
rk a
bove
US
550
Cas
cade
Cre
ek a
bove
con
f.w
ith A
nim
as R
iver
Gra
ssho
pper
Cre
ek a
bove
conf
. with
Ani
mas
Riv
erH
erm
osa
Crk
abv
US
550
Ani
mas
Riv
er, T
rimbl
eB
ridge
and
bel
ow q
uarr
yA
nim
as R
iver
abo
ve 3
2nd
Stre
et B
ridge
, D
uran
goA
nim
as R
iver
abo
ve 3
2nd
Stre
et B
ridge
, D
uran
go
Sam
ple
Latit
ude
Type
D
eg M
in
Sec
sand
fine
sand
& s
iltfin
e sa
nd &
silt
sand
sand
fine
sand
& s
iltfin
e sa
nd &
silt
fine
sand
& s
ilt
fine
sand
& s
ilt
37 4
3
37 4
337
39
37
35
37
34
37
2437
23
37
18
37
18
19 57 35 57 42 52 8 1 1
Long
itude
D
ista
nce
Deg
M
in
Sec
km
107
107
107
107
107
107
107
107
107
39
3
45
248
43
46
32
46
28
50
950
9
52
3
52
3
34.3
5
55.0
055
.05
55.1
0
57.8
0
80.0
082
.35
100.
75
100.
75
Me
an
(95
AB
S1
37
)95
AB
S13
895
AB
S13
9
95A
BS
140
95A
BS
141
95A
BS
142
95A
BS
143
95A
BS
144
95A
BS
145
95A
BS
146
Junc
tion
Cre
ek a
t par
kJu
nctio
n C
reek
1 .7
km
wes
t of D
uran
goLi
ghtn
er C
reek
abo
veco
nf. w
ith A
nim
as R
iver
Ani
mas
Riv
er,
Red
Lio
n In
nB
asin
Cre
ek, w
est o
f roa
dA
nim
as R
iver
sou
th o
fW
ease
lski
n B
ridge
Flor
ida
Riv
er n
orth
of
Co.
R
d. 3
1 8
brid
geA
nim
as R
iver
abo
veB
onda
d B
ridge
Ani
mas
Riv
er a
t Ced
ar H
illga
ging
sta
tion,
Col
o.
fine
sand
& s
iltfin
e sa
nd &
silt
fine
sand
& s
ilt fin
e sa
nd &
silt
fine
sand
& s
iltfin
e sa
nd &
silt
fine
sand
& s
ilt
fine
sand
& s
ilt
fine
sand
& s
ilt
37
1737
18
37
16
37
1637
11
37
9
37
3
37
3
37
2
18 4 6 9 11 5
26
5 11
107
107
107
107
107
107
107
107
107
52
3352
52
53
14
53
852
48
53
6
52
4
52
31
52
28
102.
3510
2.40
105.
10
105.
0011
7.75
122.
00
136.
00
135.
50
137.
50
A!
wt.
pet.
5.4
6.1
5.2
5.7
6.4
5.8
5.3
4.9
4.8
4.9
5.5
4.0
5.7
4.9
9.3
4.8
5.7
6.2
6.0
Ca
wt.
pet.
0.37
0.82
1.8
1.4
2.0
3.8
1.2
1.1
1.1
1.1
6.0
1.3
5.8
2.1
4.3
8.2
1.2
1.6
2.2
Fe
wt.
pet.
4.4
4.0
5.0
3.5
6.4
3.8
8.2
7.1
7.0
7.0
3.5
4.8
2.8
6.6
4.5
5.9
3.4
3.3
3.5
K
wt.
pet.
1.4
1.9
1.8
1.7
1.9
1.8
1.6
1.7
1.6
1.7
1.5
1.4
1.3
1.6
1.4
1.3
1.4
1.7
1.5
121

App
endi
x VI
.1
Tabl
e of
tota
l dig
estio
n da
ta fr
om s
ites
sam
pled
from
the
Ani
mas
Riv
er w
ater
shed
, Oct
. 19
95 (
cont
.)
Sam
ple
Sam
ple
Loca
lity
Sam
ple
Latit
ude
Long
itude
D
ista
nce
Al
Ca
Fe
K
No.
Ty
pe
Deg
Min
Sec
D
eg M
in S
ec
km
wt.
pet.
wt.
pet.
wt.
pet.
wt.
pet.
95A
BS
147
Ani
mas
Riv
er a
bove
brid
ge,
fine
sand
& s
ilt
36 4
9 41
1075959
171.
50
5.5
1.3
3.8
1.6
Azt
ec,
New
Mex
ico
95A
BS
148
Ani
mas
Riv
er a
t BoR
pum
p fin
e sa
nd &
silt
371548
1075253
106.
20
4.8
2.0
7.0
1.6
stat
ion
site
abo
ve U
S 55
0,D
uran
go,
Col
o.
95A
BS
149A
A
nim
as R
iver
, KO
A C
amp-
fin
e sa
nd &
silt
372718
10
74
8
3 72
.50
6.0
1.3
6.9
1.8
grou
nd b
elow
Bak
ers
Brid
ge
95A
BS
149B
A
nim
as R
iver
, K
OA
Cam
p-
over
bank
sed.
3
72
71
8
10
74
8
3 5.
7 1.
3 5.
7 1.
7gr
ound
bel
ow B
aker
s B
ridge
Bla
nks
95A
BS
100
Fiel
d bl
ank
qtzs
and
0.03
0.
006
0.02
<
0.01
95
AB
S10
0 Fi
eld
blan
k qt
zsan
d 0.
04
0.00
6 0.
03
< 0.
01
122

App
endi
x VI
.1
Tabl
e of
tota
l dig
estio
n da
ta fr
om s
ites
sam
pled
from
the
Ani
mas
Riv
er w
ater
shed
, O
ct.
1995
(co
nt.)
Sam
ple
Mg
Na
P Ti
N
o.
wt.
pet.
wt.
pet.
wt.
pet.
wt.
pet.
Ag
ppm
As
As
ppm
pp
m
Hyd
ride
Ba
ppm
Be
ppm
Bi
Cd
ppm
pp
mC
e pp
mC
o pp
mC
r pp
mC
u pp
mG
a pp
m
Ani
mas
Riv
er u
pstre
am fr
om S
ilver
ton,
Col
o.95
AB
S10
195
AB
S10
295
AB
S10
395
AB
S10
4A95
AB
S10
695
AB
S10
795
AB
S10
895
AB
S10
995
AB
S11
0A95
AB
S11
1A95
AB
S11
295
AB
S11
3
Cem
ent C
reek
95A
BS
114
95A
BS
DP
1M
ea
n(9
5A
BS
11
4)
95A
BS
115
95A
BS
116
95A
BS
117
95A
BS
118
95A
BS
120A
95A
BS
120B
Min
eral
Cre
ek95
AB
S12
295
AB
S12
395
AB
S12
495
AB
S12
5
0.90
0.94
1.0
0.97
0.24
0.76
0.65
0.98
0.71
0.58
0.73
0.73
0.61
0.62
0.62
0.54
0.60
0.17
1.0
0.77
1.2
0.83
0.66
0.48
0.67
1.1
0.48
0.47
0.60
0.03
1.1
0.71
1.2
0.94
0.74
0.49
0.74
0.48
0.51
0.5
0.50
0.42
0.14
0.57
0.64
0.51
1.4
0.84
0.82
0.89
0.15
0.14
0.16
0.13
0.06
0.18
0.14
0.16
0.14
0.11
0.11
0.13
0.15
0.15
0.15
0.20
0.17
0.02
0.17
0.18
0.20
0.18
0.15
0.18
0.17
0.25
0.38
0.37
0.28
0.10
0.48
0.29
0.68
0.41
0.17
0.23
0.34
0.38
0.35
0.37
0.46
0.40
0.04
0.37
0.51
0.36
0.36
0.40
0.46
0.49
<2 2 3 5 55 <2 12
.
<2 6 35 10 12 <2
<2
<2
<2 3
<2 2 2 5
<2 3
<2 3
56 110
45
-51 26 21
16
42 23
1629 26 35 35 57 58 58 46 78
<10
6.7
52 42 76 38 240 47 130
970
740
740
730
220
850
710
770
800
910
980
750
550
570
560
970
580
100
900
650
750
760
830
870
990
3 2 2 3 1 2 3 1 2 1 2 2 1 1 1 2 1<
1 2 1 2 2 1 1 2
< 10
<
2<
10
< 2
<10
10<
10
1157
<
2<
10
< 2
< 10
10
< 10
<
2<
10
3<
10
1014
14
< 10
8
< 10
<
2<
10
< 2
< 10
<
2<
10
<2
< 10
<
2<
10
< 2
< 10
<
2<
10
< 2
< 10
<
2
< 10
<
2<
10
<2
< 10
<
2<
10
< 2
84 82 85 83 1810
0 76 92 76 58 69 72 61 61 61 90 68 7 87 8510
0 93 75 82 93
14 24 27 221
26 20 20 15 14 22 17 10 10 10 16 9 7 20 13 14 20 14 930
17 24 23 21 2 19 14 26 17 13 14 16 19 18 19 24 23 < 1 27 25 28 15 23 17 20
120
70430
550
670
68 500
110
270
2200 42
047
0
110
140
125
80 170 6
410
170
290 81 380 50 880
14 17 24 26 8 16 25 18 23 16 20 26 11 10 11 17 16 8 18 17 19 19 23 16 22
123

App
endi
x VI
.1
Tabl
e of
tota
l dig
estio
n da
ta fr
om s
ites
sam
pled
from
the
Ani
mas
Riv
er w
ater
shed
, Oct
. 19
95 (
cont
.)
Sam
ple
Mg
Na
P Ti
N
o.
wt.
pet.
wt.
pet.
wt.
pet.
wt.
pet.
95A
BS
126
95A
BS
127
95A
BS
128
95A
BS
129
95A
BS
130
0.52
0.58
0.90
0.65
0.70
0.98
1.0
1.3
0.86
1.0
0.10
0.12
0.13
0.15
0.14
0.22
0.23
0.40
0.37
0.36
Ag
ppm
<2 <2
<2
<2
<2
As
ppm
38 45 20 80 41
As
ppm
H
ydrid
e
__ 15
Ba
ppm
630
700
670
880
750
Be
Bi
Cd
ppm
pp
m
ppm
1 1 2 1 2
; 10
<
2;
10
< 2
: 10
<
2;
10
< 2
c 10
<
2
Ce
ppm 67 '66 81 83 84
Co
ppm
12 14 18 11 35
Cr
ppm 7 8 31 17 25
Cu
ppm 17 10
029 11
024
0
Ga
ppm 11 14 15 20 18
Ani
mas
Riv
er b
elow
Silv
erto
n, C
olo.
95A
BS
131A
95A
BS
131B
95A
BS
SB
195
AB
SS
B2
95A
BS
132
95A
BS
-MC
95A
BS
-EC
95A
BS
133
95A
BS
134
95A
BS
-CC
95A
BS
-GC
95A
BS
135
95A
BS
136
95A
BS
137
95A
BS
DP
2M
ean(
95A
BS
137)
95A
BS
138
95A
BS
139
95A
BS
140
95A
BS
141
95A
BS
142
95A
BS
143
95A
BS
144
95A
BS
145
0.71
0.72
0.72
0.70
1.1
0.90
0.62
0.80
0.81
0.88
1.2
0.91
0.75
0.69
0.69
0.69
1.1
0.50
1.6
0.73
1.0
0.71
0.44
0.43
0.81
0.74
0.67
0.67
1.7
1.1
0.58
1.4
1.4
1.6
1.3
0.98
1.2
1.1 1.1
1.1
0.60
0.84
0.64
1.1
0.63
0.76
0.92
0.81
0.13
0.13
0.13
0.13
0.11
0.08
0.09
0.10
0.12
0.09
0.14
0.10
0.11
0.09
0.09
0.09
0.09
0.07
0.09
0.11
0.06
0.08
0.06
0.06
0.31
0.41
0.44
0.56
0.57
0.28
0.27
0:34
0.43
0.28
0.62
0.23
0.52
0.39
0.39
0.39
0.27
0.25
0.22
0.42
0.48
0.55
0.41
0.39
4 7 2 5<
2<
2<
2<
2<
2<
2<
2<
2<
2<
2<
2<
2<
2<
2<
2<
2<
2<
2<
2<
2
31 29 32 33 15<
10 14<
10<
10<
10<
10 18 15 14 12 13<
10<
10<
10 12<
10<
10<
10<
10
__ 11 17 7.5
5.1
5.1
8.7
19 15 16 16 9.9
5.9
13 15 3 9.2
4.7
5.9
700
740
950
860
840
460
410
600
790
550
720
560
680
690
660
675
500
790
420
630
620
810
1100
1200
2 2 2 2 2 2 2 2 2 2 2 2 2 2 2 2 2 1 2 2 2 2 2 2
= 10
3
= 10
6
c 10
<
2=
10
4c
10
< 2
c 10
<
2c
10
<2
c 10
<
2c
10
< 2
c 10
<
2c
10
< 2
c 10
3
c 10
<
2c
10
<2
c 10
<
2c
10
< 2
c 10
<
2c
10
< 2
< 10
<
2c
10
< 2
c 10
<
2c
10
2<
10
<2
< 10
<
2
74 77 79 79 89 69 67 90 100 82 120 76 110
120 99 110 63 66 55 97 90 100
120 86
18 18 22 22 16 12 38 12 16 14 18 25 18 16 15 16 11 8 11 16 17 25 12 13
14 17 22 28 40 49 62 50 70 51 50 34 56 62 58 60 63 43 62 54 24 34 27 22
330
380
340
390 36 11 34 17 14 17 20 160
190
340
330
335 22 8 25 220 22 120 23 49
22 21 21 22 16 11 12 15 15 14 19 16 19 19 17 18 14 10 12 19 22 19 15 15
124

App
endi
x VI
.1
Tabl
e of
tota
l dig
estio
n da
ta fr
om s
ites
sam
pled
from
the
Ani
mas
Riv
er w
ater
shed
, O
ct.
1995
(co
nt.)
Sam
ple
No.
Mg
Na
P Ti
A
gw
t. pe
t. w
t. pe
t. w
t. pe
t. w
t. pe
t. pp
mA
spp
mA
s Ba
ppm
pp
mH
ydrid
e
Be ppm
Bi ppm
Cd
ppm
Ce
ppm
Co
ppm
Cr
ppm
Cu
ppm
Ga
ppm
95AB
S146
0.42
0.85
0.06
0.43
<2
< 10
6.6
1300
2
< 10
<2
88
12
22
49
1495
ABS1
47
0.49
0.91
0.07
0.41
<2
< 10
7.
2 19
00
2 < 10
<2
150
13
28
45
1595
ABS1
48
0.75
1.0
0.11
0.41
<2
12
17
680
2 < 10
<2
120
16
60
210
1995ABS149A
0.88
1.1
0.12
0.44
2 20
-
790
2 < 10
<2
100
23
42
200
1895
ABS1
49B
0.85
1.0
0.12
0.45
<2
22
-
720
2 < 10
<2
98
18
27
230
20
Bla
nks
95A
BS
100
< 0.
005
< 0.
005
< 0.
005
< 0.
005
<2<
10
0.6
16
<1
<10<
2
<4
<1
<1
2<
495
AB
S10
0 <
0.00
5 <
0.00
5 <
0.00
5 <
0.00
5 <
2<
10
<
0.5
18
<1
<1
0
<2
<4
<
1 <1
<1
<
4
125

App
endi
x VI
.1
Tabl
e of
tota
l dig
estio
n da
ta fr
om s
ites
sam
pled
from
the
Ani
mas
Riv
er w
ater
shed
, O
ct.
1995
(co
nt.)
Sam
ple
No.
Hg
ppm
La
ppm
Li
ppm
Mn
ppm
Mo
ppm
Nb
ppm
Nd
ppm
Ni
ppm
Pb
ppm
Sc
Se
ppm
pp
m
Hyd
ride
Sr
ppm
Th
ppm
V
ppm
Y
ppm
Yb
ppm
Zn
ppm
Ani
mas
Riv
er u
pstre
am fr
om S
ilver
ton,
Col
o.95
AB
S10
195
AB
S10
295
AB
S10
395
AB
S10
4A95
AB
S10
695
AB
S10
795
AB
S10
895
AB
S10
995
AB
S11
0A95
AB
S11
1A95
AB
S11
295
AB
S11
3
Cem
ent C
reek
95A
BS
114
95A
BS
DP
1M
ean
95A
BS
115
95A
BS
116
95A
BS
117
95A
BS
118
95A
BS
120A
95A
BS
120B
Min
eral
Cre
ek95
AB
S12
295
AB
S12
395
AB
S12
495
AB
S12
595
AB
S12
6
0.09
0.03
0.07
0.89
0.47
0.05
0.14
0.02
0.08
0.43
0.07
0.09
0.07
0.22
0.15
0.05
0.11
<0.0
20.
050.
100.
04
0.05
0.56
0.06
0.39
<0.0
2
52 41 45 45 9 48 40 39 39 31 37 38 28 28 28 38 31 5 42 40 56 49 35 38 43 36
40 29 37 37 46 35 33 44 36 56 55 38 18 19 19 16 16 6 28 23 33 32 24 24 29 26
3200
3800
1100
013
000
360
1600
2400
013
0012
000
5200
1700
020
000
840
850
845
820
930 54
2800
1100
1600
1800 870
610
2300 86
0
3<
2 8 1120
0 412 3 8 62 50 16 4 4 4<
2 5<
2 5 3 2 8<
2<
2<
2 3
22 23 25 22 10 29 18 30 24 15 17 21 20 21 21 28 24 6 23 26 26 29 25 28 28 20
37 34 34 36 6 37 30 32 31 24 25 28 25 22 24 37 27 7 37 30 41 41 29 33 38 27
7 15 14 14 <2 10 7 9 6 6 11 8 4 4 4 5 5
<2 10 7 10 6 7 5 10 3
300
190
820
1900
1700
021
021
00 520
1000
4700
1400
1900 37
036
036
5 96 610 6
790
680
2700
940
1100 17
066
015
0
9 12 14 12 4 11 9 14 11 7 9 10 12 12 12 17 13 3 15 15 16 11 12 12 12 8
0.2
0.4
1.1
0.8
2.5
0.5
0.8
0.4
0.7
0.9
1.0 0.8
1.8
1.9
1.9
1.9
1.9
0.2
1.3
1.9
0.9
1.2
0.6
1.3
0.8
0.7
210
160
200
180 18
250
190
240
260
170
200
180
220
220
220
350
270 44 230
280
170
310
190
320
240
160
13 14 11 12 5 13 10 9 10 9 8 9 12 10 11 14 11 8 13 13 14 11 15 12 14 10
82 130
140
120 38 120 94 190
120 68 87 110
130
130
130
150
140 26 140
160
150
120
110
120
140
60
24 20 20 21 6 21 17 20 18 15 16 16 11 10 11 18 11<
2 18 13 20 18 15 14 23 12
2 2 2 2<
1 2 1 2 2 2 1 2 1 1 1 2 1<
1 2 1 2 2 1 2 2 2
980
590
3500
3600 310
270
3500 670
2000
2600
4000
3200
1200
1300
1250 140
1600 91 830
1400
2200
1100
2500 13
018
00 150
126

App
endi
x VI
.1
Tabl
e of
tota
l dig
estio
n da
ta fr
om s
ites
sam
pled
fro
m th
e A
nim
as R
iver
wat
ersh
ed,
Oct
. 19
95 (
cont
.)
Sam
ple
No.
Hg ppm
La
Lipp
m p
pmM
npp
mM
o N
bpp
m
ppm
Nd
ppm
Ni
ppm
Pb
ppm
Sc
Se
ppm
pp
mH
ydrid
e
Sr
ppm
Th ppm
Vpp
mY
ppm
Yb
Znpp
m
ppm
2 29
02
390
2 14
002
1600
2 16
00
Bla
nks
95A
BS
100
<0.0
2 <
2<
2
<4<
2
<4
<4
<
2
<4
<2
<0
.1
2 <
4
<2<
2
<1
<
295
AB
S10
0 <
0.02
<
22
6<
2
<4
<
4
<2
<4
<2
<0
.1
<2
<4
<
2<
2
<1
4
95AB
S146
0.
02
43
1495ABS147
0.02
78
1795
ABS1
48
0.11
60
2895ABS149A
0.07
52
28
95AB
S149
B 0.04
47
27
1300
1700
5900
5700
8800
<2
<2 4 3 4
23 23 26 26 25
35 64 52 46 39
9 10 15 16 11
39 83 340
500
620
7 7 10 13 13
0.4
0.4
0.8
1.0
1.2
240
200
180
220
210
10 28 23 13 16
94 95 180
150
130
18 22 24 24 18
127

App
endi
x V
I.2.
Tab
le o
f tot
al d
iges
tion
data
from
site
s sa
mpl
ed fr
om th
e A
nim
as R
iver
Wat
ersh
ed, A
ug.
and
Oct
. 19
96
[Con
cent
ratio
ns g
iven
In w
eigh
t per
cent
(w
t. pe
t.) o
r pa
rts
per
mill
ion,
ppm
(ug
/g)]
Fiel
d N
o.S
ampl
e La
titud
e S
ampl
e Lo
calit
y T
ype
Deg
Min
Sec
Long
itude
D
eg M
in S
ecA
l w
t. pe
t.C
a w
t. pe
t.Fe
w
t. pe
t.K
w
t. pe
t.
Ani
mas
Riv
er u
pstr
eam
fro
m S
ilver
ton,
Col
o.96
-AB
S-1
06
96-A
BS
-114
96-A
BS
-115
96-A
BS
-116
96-A
BS
-116
d96
.AB
S-1
05
96-A
BS
-107
Cem
ent C
reek
96-A
BS
-104
96-A
BS
-108
96-A
BS
-108
d
Min
eral
Cre
ek96
-AB
S-1
01
96-A
BS
-102
96-A
BS
-103
96-A
BS
-109
Ani
mas
Riv
er 0
.7 k
m u
pstr
eam
fro
m E
urek
a(a
bove
site
95A
BS
105)
Cun
ning
ham
Cre
ek (
sam
e si
te a
s 95
AB
S10
9)C
unni
ngha
m C
reek
In b
eave
r po
ndC
unni
ngha
m C
reek
bel
ow b
eave
r po
ndou
tflow
Ani
mas
Riv
er a
t gag
ing
stat
ion
(sam
e si
te a
s 95
AB
S1
1 0)
Ani
mas
Riv
er u
pstr
eam
fro
m b
ridge
at R
V c
amp
north
of t
own
(1 .2
km
abo
ve s
ite 9
5AB
S11
3)
Cem
ent
Cre
ek b
elow
con
fluen
ce o
f N a
nd S
For
ks (
sam
e si
te a
s 95
AB
S12
0)C
emen
t Cre
ek a
t Mem
oria
l Par
k(s
ame
site
as
95A
BS
1 14
)
Min
eral
Cre
ek a
t Cha
tnoo
ga(s
ame
site
as
95A
BS
123)
Min
eral
Cre
ek a
bove
con
fluen
ce w
ith S
outh
For
k M
iner
al C
reek
(sa
me
site
as
95A
BS
127)
Sou
th F
ork
Min
eral
Cre
ek (
0.3
kmup
stre
am f
rom
site
95A
BS
128)
Min
eral
Cre
ek a
t gag
ing
stat
ion
(sam
e si
te a
s 95
AB
S13
0)
1 3 3 3 d 3 1 3 3 d 3 3 1 3
37
53
12
37 4
9 53
37 4
9 53
37 4
9 53
37 4
9 53
37 4
9 57
3749
1
37 5
3 22
37
49
13
37
49
13
37 5
2 34
37 4
9 21
37
49
7
37
48
12
1073341
1073534
1073534
1073534
1073534
1073559
1073853
1073918
1073947
1073947
1074325
1074316
1074311
1074022
6.9
7.0
7.1
7.3
7.4
5.2
5.5
6.5
6.6
6.6
7.0
6.7
6.6
7.0
0.70
0.79
0.72
0.77
0.77
0.92
0.87
0.67
0.55
0.53
0.29
0.40
1.20
0.75
5.2
7.7
4.5
4.8
4.8
6.0
5.4
9.6
8.7
8.7
7.0
7.1
6.5
8.4
3.2
2.1
2.2
2.4
2.4
2.0
2.2
2.3
2.3
2.3
2.4
2.2
2.0
1.9
128

App
endi
x V
I.2.
Tab
le o
f tot
al d
iges
tion
data
fro
m s
ites
sam
pled
fro
m th
e A
nim
as R
iver
Wat
ersh
ed,
Aug
. an
d O
ct.
1996
(co
nt.)
Fiel
d N
o.S
ampl
e La
titud
e Lo
ngitu
de
Sam
ple
Loca
lity
Typ
e D
eg M
in S
ec D
eg M
in S
ecA
l w
t. pe
t.C
a w
t. pe
t.Fe
w
t. pe
t.K
w
t. pe
t.
Ani
mas
Riv
er b
elow
Silv
erto
n, C
olo.
96-A
BS
-110
A
96-A
BS
-110
B
96-A
BS
-125
A
96-A
BS
-125
B
96-A
BS
-112
96-A
BS
-111
96-A
BS
-113
Ani
mas
Riv
er b
elow
con
fluen
ce o
f Min
eral
Cre
ek (
A-7
2; s
ame
site
as
95A
BS
131)
Ani
mas
Riv
er b
elow
con
fluen
ce o
f Min
eral
Cre
ek (
A-7
2; s
ampl
ed 2
wee
ks la
ter)
Ani
mas
Riv
er a
t Elk
Par
k (0
.3 k
m a
bove
the
conf
luen
ce w
ith E
lk C
reek
)A
nim
as R
iver
at E
lk P
ark
(0.3
km
abo
veth
e co
nflu
ence
with
Elk
Cre
ek)
Ani
mas
Riv
er a
t KO
A C
ampg
roun
d(s
ame
site
as
95A
BS
149)
Her
mos
a C
reek
at g
agin
g st
atio
n up
stre
amfr
om ir
rega
tion
ditc
h in
flow
Ani
mas
Riv
er a
bove
32
nd S
tree
t Brid
ge ,
Dur
ango
, C
olo.
(sa
me
site
as
95A
BS
137)
3 3 1 2 3 1 3
37 4
7 23
37 4
7 23
37 4
3 26
37 4
3 26
372718
372518
37
18
1
10
74
0
0
10
74
0
0
10
73
91
5
10
73
91
5
10
74
8
3
1075040
10
75
2
2
6.1
5.9
5.9
5.8
6.2
4.5
5.0
0.64
0.63
0.80
0.73
1.20
5.20
1.30
7.2
6.8
6.8
7.8
6.8
3.0
7.2
2.1
2.0
2.1
2.1
1.9
1.9
1.8
1=st
ream
sed
imen
t sam
ple
from
new
site
2=ov
erba
nk s
edim
ent s
ampl
e3=
stre
am-s
edim
ent s
ampl
e fr
om s
ite s
ampl
ed in
Oct
. 19
95.
d=du
plic
ate
anal
ytic
al s
ampl
e
129
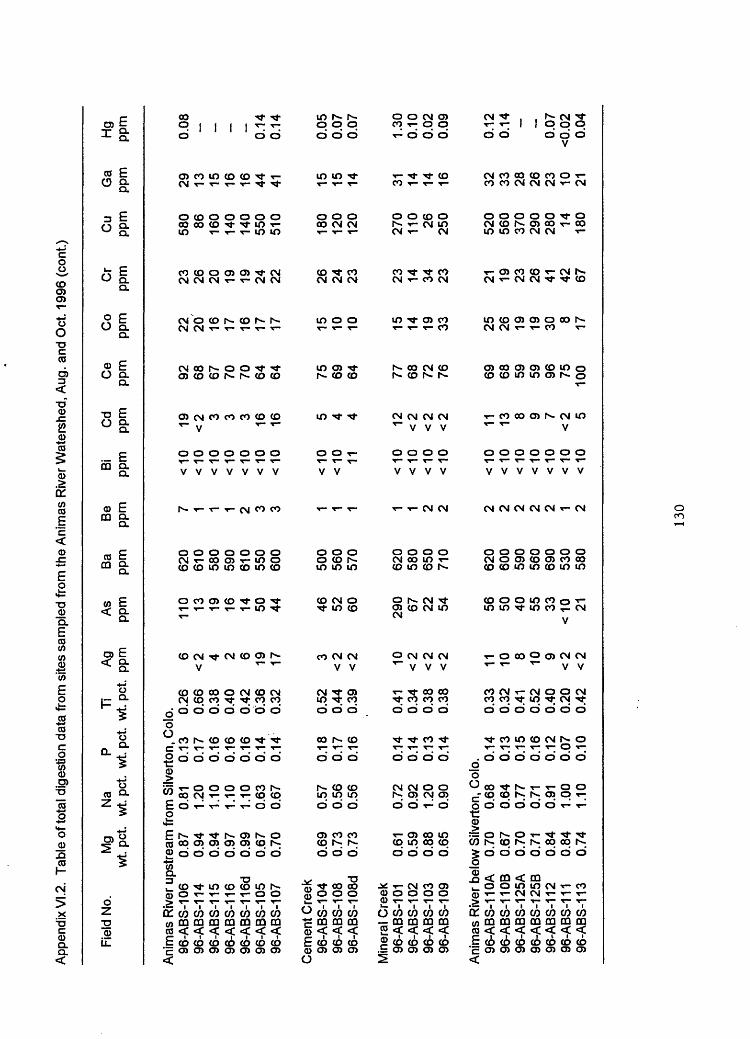
App
endi
x V
I.2.
Tabl
e of
tota
l dig
estio
n da
ta fr
om s
ites
sam
pled
from
the
Ani
mas
Riv
er W
ater
shed
, Aug
. an
d O
ct.
1996
(co
nt.)
Fiel
d N
o.
Mg
wt.
pet.
Na
wt.
pet.
P w
t. pe
t.T
i w
t. pe
t.A
g pp
mA
s pp
mB
a pp
mB
e pp
mBi
C
d pp
m
ppm
Ce
ppm
Co
ppm
Cr
ppm
Cu
ppm
Ga
ppm
Hg
ppm
Ani
mas
Riv
er u
pstre
am fr
om S
ilver
ton,
Col
o.96
-AB
S-1
0696
-AB
S-1
1496
-AB
S-1
1596
-AB
S-1
1696
-AB
S-1
16d
96-A
BS
-105
96-A
BS
-107
Cem
ent C
reek
96-A
BS
-104
96-A
BS
-108
96-A
BS
-108
d
Min
eral
Cre
ek96
-AB
S-1
0196
-AB
S-1
0296
-AB
S-1
0396
-AB
S-1
09
0.87
0.94
0.94
0.97
0.99
0.67
0.70
0.69
0.73
0.73
0.61
0.59
0.88
0.65
0.81
1.20
1.10
1.10
1.10
0.63
0.67
0.57
0.56
0.56
0.72
0.92
1.20
0.90
0.13
0.17
0.16
0.16
0.16
0.14
0.14
0.18
0.17
0.16
0.14
0.14
0.13
0.14
0.26
0.66
0.38
0.40
0.42
0.36
0.32
0.52
0.44
0.39
0.41
0.34
0.38
0.38
6<
2 4 2 6 19 17 3<
2<
2 10 <2
<2
<2
110 13 19 16 14 50 44 46 52 60 290 67 22 54
620
610
580
590
610
550
600
500
560
570
620
580
650
710
7 1 1 1 2 3 3 1 1 1 1 1 2 2
<10
19<
10
< 2
< 10
3
< 10
3
< 10
3
<10
16<
10
16
< 10
5
< 10
4
11
4
<1
0
12<
10
< 2
< 10
<
2<
10
< 2
92 68 67 70 70 64 64 75 69 64 77 68 72 76
22 20 16 17 16 17 17 15 10 10 15 14 19 33
23 26 20 19 19 24 22 26 24 23 23 14 34 23
580 86 160
140
140
550
510
180
120
120
270
110
26 250
29 13 15 16 16 44 41 15 15 14 31 14 14 16
0.08 0.14
0.14
0.05
0.07
0.07
1.30
0.10
0.02
0.09
Ani
mas
Riv
er b
elow
Silv
erto
n, C
olo.
96-A
BS
-110
A96
-AB
S-1
10B
96-A
BS
-125
A96
-AB
S-1
25B
96-A
BS
-112
96-A
BS
-111
96-A
BS
-113
0.70
0.67
0.70
0.71
0.84
0.84
0.74
0.68
0.64
0.77
0.71
0.91
1.00
1.10
0.14
0.13
0.15
0.16
0.12
0.07
0.10
0.33
0.32
0.41
0.52
0.40
0.20
0.42
11 10 8 10 9<
2<
2
56 50 40 55 33<
10 21
620
600
590
560
690
530
580
2 2 2 2 2 1 2
<1
0
11<
10
13
< 10
8
< 10
9
< 10
7
< 10
<
2<
10
5
69 68 59 59 96 7510
0
25 26 19 19 30 8 17
21 19 23 26 41 42 67
520
560
370
290
280 14 180
32 33 28 26 23 10 21
0.12
0.14
0.07
<0.0
20.
04
130

App
endi
x V
I.2.
Tab
le o
f tot
al d
iges
tion
data
from
site
s sa
mpl
ed fr
om th
e A
nim
as R
iver
Wat
ersh
ed, A
ug.
and
Oct
. 19
96 (
cont
.)
Fiel
d N
o.La
Li
pp
m
ppm
Mn
ppm
Mo
ppm
Nb
ppm
Nd
ppm
Ni
ppm
Pb
ppm
Sc
ppm
Se
ppm
Sr
Th
ppm
pp
mV
pp
mY ppm
Yb
ppm
Zn
ppm
Ani
mas
Riv
er u
pstre
am fr
om S
ilver
ton,
Col
o.96
-AB
S-1
0696
-AB
S-1
1496
-AB
S-1
1596
-AB
S-1
1696
-AB
S-1
16d
96-A
BS
-105
96-A
BS
-107
Cem
ent C
reek
96-A
BS
-104
96-A
BS
-108
96-A
BS
-108
d
Min
eral
Cre
ek96
-AB
S-1
0196
-AB
S-1
0296
-AB
S-1
0396
-AB
S-1
09
68 38 37 38 39 38 37 41 37 36 40 37 41 43
34 41 41 42 44 34 34 22 21 21 24 23 25 22
Ani
mas
Riv
er b
elow
Silv
erto
n96
-AB
S-1
10A
96-A
BS
-110
B96
-AB
S-1
25A
96-A
BS
-125
B96
-AB
S-1
1296
-AB
S-1
1 1
96-A
BS
-113
39 37 33 34 54 42 52
30 30 29 29 30 25 29
1000
012
00 570
760
780
2700
024
000
1400 970
970
920
860
850
1600
Col
o. 1500
019
000
1400
011
000
7100 460
5600
10 <2 2
<2
<2 9 10 2
<2
<2
<2 3
<2 3 9 12 6 12 5
<2
<2
15 21 19 18 18 13 12 19 18 18 21 18 19 20 13 16 18 20 20 11 20
45 28 30 31 34 29 29 34 30 27 32 31 35 40 33 32 27 26 46 34 44
16 9 8 9 8 8 9 6 6 5 8 5 18 10 9 9 8 8 22 14 15
900
400
950
740
710
2300
2200 560
390
410
870
260 92 240
1400
1700
1200
1100 510 12 300
10 13 12 12 13 9 9 15 14 14 12 10 11 11 10 10 10 11 12 6 10
0.54 __ __
0.79
0.85
2.00
1.80
1.20
0.88
1.10
0.92
1.10
1.10
1.20 ~ . _. 0.86
0.27
0.35
200
220
210
220
220
160
180
290
270
250
160
220
280
240
200
190
220
220
210
230
160
13 8 7 9 8 8 8 14 14 12 18 14 9 12 9 8 6 7 16 13 17
100
180
110
120
120
120
110
160
150
150
110 94 120
130
120
100
130
150
130 66 160
34 24 21 22 22 20 21 20 18 17 22 20 25 33 26 28 19 20 39 17 27
4800 620
720
730
720
3900
4400
1700
1300
1400
4200 450
330
870
2700
2900
2300
2800
2800 54
1400
131

App
endi
x V
II.
Lead
-isot
opic
dat
a fr
om b
ed-s
edim
ent
and
othe
r sa
mpl
es f
rom
the
Ani
mas
Riv
er W
ater
shed
[C
once
ntra
tion
data
giv
en in
par
ts p
er m
illio
n, p
pm (
|jg/g
)]
Sam
ple
Des
crip
tion
of L
ocat
ion
No.
Sam
ple
Typ
e
206 p
b
204P
b2
07
pb
20
4p
b
20
8p
b
204p
bP
b pp
m
(leac
h)
Abo
ve S
ilver
ton,
Cob.
95A
BS
101
95A
BS
102
95A
BS
105
95A
BS
103
95A
BS
104A
95
AB
S10
4C
95A
BS
104D
95
AB
S10
7 95
AB
S10
8 95
AB
S10
8D9
5A
BS
10
8a
ver
95A
BS
109
95A
BS
110A
95
AB
S11
0B
95A
BS
111A
95A
BS
111B
95
AB
S11
295
AB
S11
3
Cem
ent
Cre
ek95
AB
S11
9A
95A
BS
118
95A
BS
120A
uppe
r A
nim
as R
iver
be
low
Cin
nam
on G
ulch
Pic
ayne
Gul
ch
uppe
r A
nim
as R
iver
E
urek
a C
reek
uppe
r A
nim
as R
iver
up
per
Ani
mas
Riv
er
uppe
r A
nim
as R
iver
M
aggi
e G
ulch
up
per
Ani
mas
Riv
er
abov
e H
owar
dsvi
llem
ill s
iteC
unni
ngha
m C
reek
up
per
Ani
mas
Riv
er a
t ga
ging
sta
tion
Arr
astr
a C
reek
Arr
astr
a C
reek
B
ould
er C
reek
Ani
mas
Riv
er a
t WR
Dga
ging
sta
tion
Sam
ples
fro
m n
atur
al
ferr
icre
te o
n hi
llsid
eC
emen
t C
reek
abo
veG
old
Kin
g in
flow
B
elow
con
fluen
ce o
f N
and
SFo
rks
of C
emen
t C
reek
fine
sand
& s
ilt
fine
sand
& s
ilt
coat
ed p
ebbl
es
fine
sand
& s
iltfin
e sa
nd &
silt
ja
rosi
te-F
eox
whi
te p
reci
pita
te
fine
sand
& s
ilt
fine
sand
& s
ilt
fine
sand
& s
ilt
fine
sand
& s
ilt
coat
ed p
ebbl
es
fine
sand
& s
iltco
ated
peb
bles
fin
e sa
nd &
silt
fine
sand
& s
ilt
goet
hite
fine
sand
& s
ilt
fine
sand
& s
ilt
18.5
38
18.5
52
18.3
58
18.3
7718
.383
18
.305
18
.306
18
.613
18
.377
18
.347
18.3
6218
.968
18
.396
18
.375
18
.815
18.8
54
18.5
8918
.406
18.3
51
18.4
03
18.3
42
15.5
86
15.5
65
15.5
65
15.5
6715
.564
15
.535
15
.543
15
.569
15
.585
15
.553
15.5
6915
.629
15
.557
15
.559
15
.596
15.6
28
15.5
6815
.565
15.5
57
15.5
45
15.5
52
38.1
29
38
.09
6
38.0
10
37.9
8837
.976
37
.849
37
.889
38
.078
38
.034
37.9
09
37.9
72
38.3
82
37
.98
5
37.9
39
38.2
3438
.313
38
.068
37.9
84
37.9
39
37.9
41
37.9
19
270
170
7400
73
019
00
4000
68
00
180
2100
2100 50
0 10
00
3800
48
0013
000
1400
1900
5
620
640
132
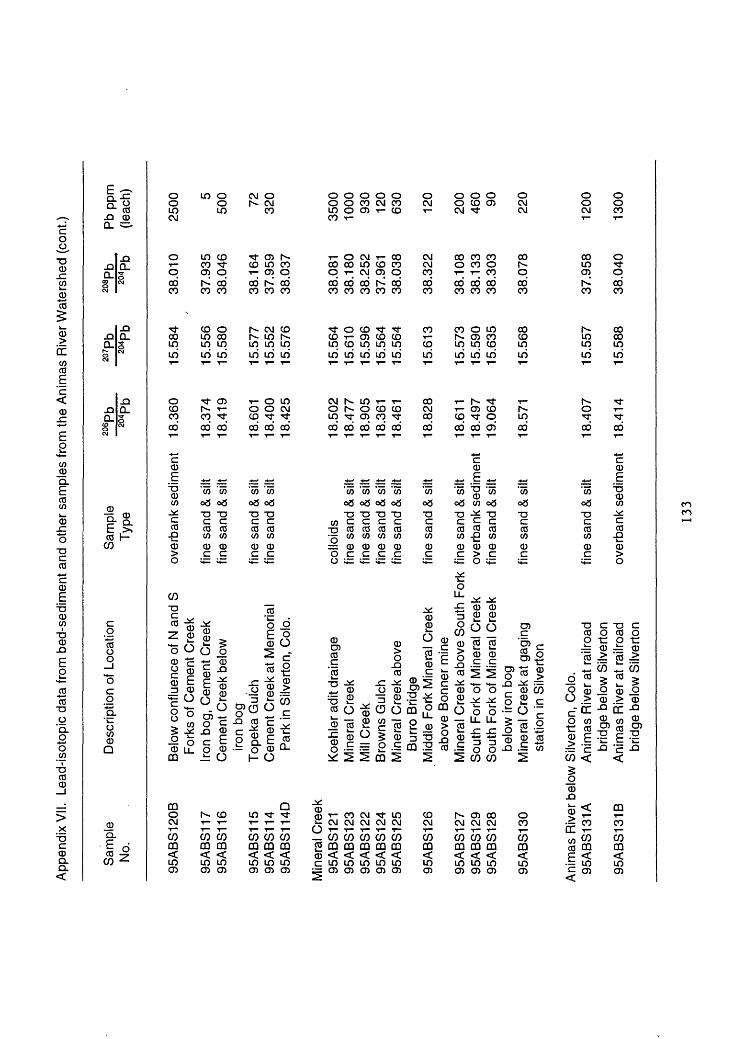
App
endi
x V
II.
Lead
-isot
opic
dat
a fr
om b
ed-s
edim
ent
and
othe
r sa
mpl
es f
rom
the
An
ima
s R
iver
Wate
rshed (
cont
.)
Sam
ple
No.
95A
BS
120B
95A
BS
117
95A
BS
116
95A
BS
115
95A
BS
114
95A
BS
114D
Min
eral
Cre
ek95
AB
S12
195
AB
S12
395
AB
S12
295
AB
S12
495
AB
S12
5
95A
BS
126
95A
BS
127
95A
BS
129
95A
BS
128
95A
BS
130
Des
crip
tion
of L
ocat
ion
Bel
ow c
onflu
ence
of
N a
nd S
For
ks o
f C
emen
t C
reek
Iron
bog
, C
emen
t C
reek
Cem
ent
Cre
ek b
elow
iron
bog
To
pe
ka G
ulch
Cem
ent
Cre
ek a
t M
emor
ial
Par
k in
Silv
erto
n, C
olo.
Koe
hler
adi
t dr
aina
geM
iner
al C
reek
Mill
Cre
ekB
row
ns G
ulch
Min
eral
Cre
ek a
bove
Bur
ro B
ridge
Mid
dle
For
k M
iner
al C
reek
abov
e B
onne
r m
ine
Min
eral
Cre
ek a
bove
Sou
th F
ork
Sou
th F
ork
of M
iner
al C
reek
Sou
th F
ork
of M
iner
al C
ree
kbe
low
iro
n bo
gM
iner
al C
reek
at
gagi
ngst
atio
n in
Silv
erto
n
Sam
ple
Typ
e
over
bank
sed
imen
t
fine
sand
& s
iltfin
e sa
nd &
silt
fine
sand
& s
iltfin
e sa
nd &
silt
collo
ids
fine
sand
& s
iltfin
e sa
nd &
silt
fine
sand
& s
iltfin
e sa
nd &
silt
fine
sand
& s
ilt
fine
sand
& s
iltov
erba
nk s
edim
ent
fine
sand
& s
ilt
fine
sand
& s
ilt
206p
b
204p
b
18.3
60
18.3
7418
.419
18.6
0118
.400
18.4
25
18.5
0218
.477
18.9
0518
.361
18.4
61
18.8
28
18.6
1118
.497
19.0
64
18.5
71
20
7p
b
204p
b
15.5
841
15.5
5615
.580
15.5
7715
.552
15.5
76
15.5
6415
.610
15.5
9615
.564
15.5
64
15.6
13
15.5
7315
.590
15.6
35
15.5
68
208p
b
204p
b
38.0
10
37.9
3538
.046
38.1
6437
.959
38.0
37
38.0
8138.1
80
38.2
5237
.961
38.0
38
38.3
22
38.1
0838
.133
38.3
03
38.0
78
Pb
ppm
(le
ach)
2500
550
0 72 320
3500
1000 93
012
063
0
120
200
460 90
220
Ani
mas
Riv
er b
elow
Silv
erto
n, C
olo.
95
AB
S13
1A
Anim
as
Riv
er a
t ra
ilroa
dbr
idge
bel
ow S
ilver
ton
95A
BS
131B
A
nim
as
Riv
er a
t ra
ilroa
dbr
idge
bel
ow S
ilver
ton
fine
sand
& s
ilt
18.4
07
15.5
57
37.9
58
1200
ove
rbank
sedi
men
t 18
.414
15
.588
38
.040
13
00
133

App
endi
x V
II.
Lead
-isot
opic
dat
a fr
om b
ed-s
edim
ent
and
othe
r sa
mpl
es fr
om t
he A
nim
as R
iver
Wat
ersh
ed (
cont
.)
Sam
ple
No.
95A
BS
SB
195
AB
SS
B-1
D1
95A
BS
SB
-1D
295
AB
SS
B2
95A
BS
132
95A
BS
-MC
95A
BS
-EC
95A
BS
133
95A
BS
134
95A
BS
-CC
95A
BS
-GC
95A
BS
149A
95A
BS
149B
95A
BS
135
95A
BS
135D
95A
BS
136
95A
BS
137
95A
BS
138
95A
BS
139
95A
BS
141
95A
BS
140
95A
BS
148
Des
crip
tion
of L
ocat
ion
Dea
dwoo
d G
ulch
Dee
r P
ark
Cre
ekS
ulta
n C
reek
bel
ow M
olas
min
eM
olas
Cre
ek a
t Ani
mas
con
fl.E
lk C
reek
at A
nim
as c
onfl.
Lim
e C
reek
abo
ve U
S 5
50C
asca
de C
reek
abo
ve U
S 5
50C
asca
de C
reek
at c
onfl.
Gra
ssho
pper
Cre
ek a
t co
nfl.
Ani
mas
Riv
er a
t K
OA
Cam
pgr
ound
abo
ve B
aker
s br
idge
Ani
mas
Riv
er a
t K
OA
Cam
pgr
ound
abo
ve B
aker
s br
idge
Her
mos
a C
reek
abo
ve U
S 5
50
Ani
mas
Riv
er a
bove
Trim
ble
brid
ge a
nd b
elow
qua
rry
Ani
mas
Riv
er a
bove
32n
dS
tree
t B
ridge
, D
uran
go,
Col
o.Ju
nctio
n C
reek
at
park
Junc
tion
Cre
ek 1
.7 k
m w
est
ofD
uran
go,
Col
o.A
nim
as R
iver
, R
ed L
ion
Inn
Ligh
tner
Cre
ek a
bove
conf
luen
ce w
ith A
nim
as R
iver
Ani
mas
Riv
er a
t B
oR p
ump
stat
ion
site
abo
ve U
S 5
50,
Dur
ango
Sam
ple
Type
sand
sand
fine
sand
& s
iltsa
ndsa
ndfin
e sa
nd &
silt
fine
sand
& s
iltsa
ndsa
ndfin
e sa
nd &
silt
over
bank
sed
imen
t
fine
sand
& s
ilt
fine
sand
& s
ilt
fine
sand
& s
ilt
fine
sand
& s
iltfin
e sa
nd &
silt
fine
sand
& s
iltfin
e sa
nd &
silt
fine
sand
& s
ilt
206pb
204p
b
18
.45
218
.461
18
.44
01
8.4
37
18
.91
62
0.2
48
20
.32
42
0.5
00
20
.34
72
1.2
63
21
.26
91
8.4
87
18
.49
6
18
.47
41
8.4
79
18
.51
0
18
.54
0
19
.23
31
9.3
53
18
.55
91
9.4
07
18
.59
2
207P
b
15.5
711
5.5
73
,
15
.55
01
5.5
67
15
.63
51
5.7
34
15
.77
31
5.7
59
15
.80
215
.851
15
.83
91
5.5
77
15
.47
9
15
.55
01
5.5
60
15
.55
8
15
.55
8
15
.66
01
5.6
62
15
.58
51
5.6
87
15
.57
5
2MP
b
38
.02
43
8.0
13
37
.95
63
8.0
30
38
.32
93
8.8
42
39
.30
93
8.9
20
38
.95
03
9.2
55
39
.24
23
8.0
46
37.8
11
37
.97
638
.001
37
.99
5
38
.01
0
38
.77
23
8.6
23
38
.09
53
9.0
56
38
.07
3
Pb
ppm
(le
ach)
910
1000 670 20 9 8 6 6 10
490
570
290
440
290 206
260 20
320
134

App
endi
x V
II.
Lead
-isot
opic
dat
a fr
om b
ed-s
edim
ent
and
othe
r sa
mpl
es f
rom
the
Ani
mas
Riv
er W
ater
shed
(co
nt.)
Sam
ple
No.
95A
BS
142
95A
BS
143
95A
BS
145
95
AB
S1
44
95
AB
S1
46
95
AB
S1
47
Sta
ndar
dsS
RM
-270
9S
RM
-271
0S
RM
-271
1S
RM
-271
1
Des
crip
tion
of L
ocat
ion
Bas
in C
reek
, w
est
of r
oad
Ani
mas
Riv
er s
outh
of
Wea
sels
kin
Brid
geA
nim
as R
iver
abo
ve B
onda
dB
ridge
Flo
rida
Riv
er n
orth
of
Co.
Rd.
31
8 br
idge
Ani
mas
Riv
er a
t C
edar
Hill
gagi
ng s
tatio
n, C
olo.
Ani
mas
Riv
er a
bove
brid
ge,
Azt
ec,
New
Mex
ico
NIS
T R
efer
ence
Soi
lN
IST
Ref
eren
ce S
oil
NIS
T R
efer
ence
Soi
lN
IST
Ref
eren
ce S
oil
Sam
ple
Typ
e
fine
sand
& s
iltfin
e sa
nd &
silt
fine
sand
& s
ilt
fine
sand
& s
ilt
fine.
sand
& s
ilt
fine
sand
& s
ilt
206P
b204pb
18
.99
71
8.5
86
18
.63
7
19.2
71
18
.68
4
18.6
61
19
.06
51
7.8
19
17
.08
61
7.0
97
207P
b204p
b
15
.62
91
5.5
80
'
15
.56
9
15
.66
7
15
.58
7
15
.57
8
15
.64
61
5.5
37
15
.41
91
5.4
30
208p
b
204p
b
38
.70
93
8.1
00
38
.13
5
38
.93
8
38
.21
9
38
.12
9
38
.86
43
8.1
41
36
.88
83
6.9
36
Pb
ppm
(le
ach) 10 140 31 8 28 64 7
51
00
11
00
11
00
Bla
nk<0
.01
135