source apportionment of particles at station nord, north east
TRANSCRIPT

Atmos. Chem. Phys., 13, 35–49, 2013www.atmos-chem-phys.net/13/35/2013/doi:10.5194/acp-13-35-2013© Author(s) 2013. CC Attribution 3.0 License.
AtmosphericChemistry
and Physics
Source apportionment of particles at Station Nord, North EastGreenland during 2008–2010 using COPREM and PMF analysis
Q. T. Nguyen1,2, H. Skov1,3,4, L. L. Sørensen1,4, B. J. Jensen1, A. G. Grube1, A. Massling1, M. Glasius2, andJ. K. Nøjgaard1
1Department of Environmental Science, Aarhus University, 4000 Roskilde, Denmark2Department of Chemistry, Aarhus University, 8000 Aarhus, Denmark3Adjunct Professor University of Southern Denmark, Institute of Chemical Engineering and Biotechnology andEnvironmental Technology, Niels Bohrs Alle 1, 5230 Odense M, Denmark4Arctic Research Centre, Aarhus University, 8000 Aarhus, Denmark
Correspondence to:Q. T. Nguyen ([email protected])
Received: 14 July 2012 – Published in Atmos. Chem. Phys. Discuss.: 17 September 2012Revised: 17 December 2012 – Accepted: 17 December 2012 – Published: 4 January 2013
Abstract. In order to develop strategies for controlling andreducing Arctic air pollution, there is a need to understandthe basic mechanisms for determining the fate of air pollu-tion in the Arctic. Sources of atmospheric particles at StationNord (81◦ 36′ N, 16◦ 40′ W) in North East Greenland wereevaluated for a two-year period from March 2008 to Febru-ary 2010. Source apportionment using Positive Matrix Fac-torization (PMF) and COnstrained Physical REceptor Model(COPREM) was based on measurements of black carbon, el-ements (Al, Si, S, K, Ca, Ti, V, Cr, Mn, Fe, Ni, Cu, Zn, Ga,As, Se, Br, Rb, Sr, Zr, Pb) and inorganic ions (SO2, SO2−
4 ,Na+, NH+
4 , NO−
3 , Cl−). In general, source apportionmentresults by PMF and COPREM showed good agreement. Fivesources adequately explained the measurements, which in-cluded aMarineand aSoilsource of natural origin and threeadditional anthropogenic sources, which were all influencedby metal industries. One anthropogenic source was domi-nated by Zn of which air mass back trajectories using the Hy-brid Single Particle Lagrangian Integrated Trajectory (HYS-PLIT) model suggested a Canadian Arctic origin, despite cer-tain influences from Southern and Eastern origins. Anotheranthropogenic source was characterised by high concentra-tions of Pb and As, which has been historically referred to asa Combustionsource at Station Nord. The impacts of large-scale industry in Siberia, Russia were evident through highCu concentrations in both theCombustionsource and an ad-ditionalCu/Ni source.
Br correlated well with the anthropogenic species S andPb though the elements are unlikely to have a common ori-gin. More likely, sulphuric acid aerosols serve as transportcontainers for Br species of marine origin. Of particular rel-evance to climate, sources of black carbon were identified tobe mainly anthropogenic and most probably of Siberian ori-gin (80–98 %).
1 Introduction
The global temperature increase has been primarily well-attributed to anthropogenic emissions of carbon dioxide.However, the temperature in the Arctic has increased at a ratetwice as high as the rest of the world (IPCC, 2007), whichhas been partly explained by the surface forcing and sur-face temperature response of short-lived pollutants includ-ing methane, tropospheric ozone and black carbon (Quinnet al., 2008; ACIA, 2004). Model calculations suggest thatblack carbon (BC) contributes significantly to Arctic warm-ing through direct absorption of incoming light and indirectlyby reducing the albedo of especially snow and ice-coveredsurfaces (Hansen and Nazarenko, 2004; Flanner et al., 2007,2009).
Investigations over the past decades have shown that a con-siderable part of Greenlandic, Norwegian, Russian, NorthernUSA and Canadian Arctic troposphere is significantly in-fluenced by atmospheric pollution of distant latitude origin
Published by Copernicus Publications on behalf of the European Geosciences Union.

36 Q. T. Nguyen et al.: Source apportionment of particles at Station Nord, North East Greenland
(Heidam et al., 1999, 2004; Flyger et al., 1980; Barrie et al.,1981; Pacyna et al., 1984; Bourgeois and Bey, 2011). Thephenomenon which is known as Arctic haze is widespreadthroughout the Arctic during wintertime. Most notable iden-tified sources include the industrial and other anthropogenicactivities in the Eurasian region (particularly northern Russiaand central Europe) and North America (Heidam et al., 1999;Shindell et al., 2008; Bourgeois and Bey, 2011). Arctic hazeaerosols contain a mixture of sulphate (SO2−
4 ), organic mat-ter (OM), BC and dust, nitrogen compounds, heavy metalsand other elements (e.g. Li and Barrie, 1993; Quinn et al.,2002). The Arctic haze phenomenon results in a typical an-nual variation with elevated concentrations of such elementsduring Arctic winter while the deposition frequency duringthis time of year is low which limits the removal of Arctichaze through deposition (Quinn et al., 2007; Heidam et al.,1999, 2004; Barrie et al., 1981). Arctic haze may also gener-ally add to the warming trend of the Arctic through its poten-tial to absorb thermal infrared radiation (Garrett and Zhao,2006) and also incoming solar radiation when present on topof snow and ice-covered surfaces.
During the Arctic haze phenomenon, the air in the Arc-tic lower troposphere is partially isolated from other layersof the atmosphere by the so-called “Arctic Front” barrier, re-sulting in low potential temperatures at the ground surface(Klonecki et al., 2003; Stohl, 2006). A transported pollutedair mass originating from outside the Arctic must have a sim-ilar low potential temperature (Barrie, 1986; Carlson, 1981;Iversen, 1984; AMAP, 2011; Stohl, 2006), which thus em-phasizes relatively colder regions such as Northern Eurasiaas a major mid-latitude pollution source region in compari-son to other regions further south where the air masses are toowarm to reach the Arctic lower troposphere (Barrie, 1986;Eckhardt et al., 2003; Heidam et al., 2004; Klonecki et al.,2003).
Emissions from sources within the Arctic must also beconsidered to obtain a complete picture of the particle bur-den in this region. The non-ferrous metal smelters on theKola Peninsula (Nikel, Monchegorsk and Zapolyarnyy) andNorilsk in Northern Siberia were identified as major sourcesof anthropogenic pollution within the Arctic (Heidam et al.,1999, 2004; Christensen, 1997) in addition to other anthro-pogenic emissions from the industrial sector, power gener-ation and transport activities in the Arctic cities of Russia.Furthermore, there are also direct and indirect emissions re-sulting from exploitation of oil and gas in the region (Gautieret al., 2009) as well as ship emissions including cargo trans-port, tourist cruise and fishing vessels (Odemark et al., 2012).
In order to develop strategies for controlling and reducingArctic air pollution, there is a need to understand the basicmechanisms for determining the fate of Arctic air pollution,such as long-range transport, transformation of gaseous andparticulate species and their partitioning between the gas andparticle phase. In addition, the nature and source origin of an-thropogenic compounds contributing to Arctic air pollution
must be investigated. This study presents analyses of datafrom 2008–2010 at the high Arctic site Station Nord in NorthEast Greenland using two statistical receptor models; Posi-tive Matrix Factorization (PMF) and the COnstrained Phys-ical REceptor Model (COPREM). The measured concentra-tions can be considered as a remote indicator from which theaverage emissions of a massive emission region in the East-ern part of Europe and Russia can be followed (Heidam etal., 2004).
2 Methods
2.1 Measurement site
The measurement hut “Flygers Hut” at Station Nord(81◦36′ N, 16◦40′ W, 30 m a.s.l.) is located 2.5 km SouthEast of the Danish military Station at North East Green-land (Fig. 1). At this latitude, the polar day prevails frommid-April to the beginning of September, and the polar nightlasts from mid-October to the end of February. Flygers Hut isthe main site for the Danish contribution to the atmosphericpart of the Arctic Monitoring and Assessment Programme(AMAP). It is supplied by electricity from a local JET A-1 fuel generator at Station Nord. The location was selecteddue to the insignificant contribution from local air pollutionand has been described elsewhere (Skov et al., 2004). Only afew episodes of waste burning from the military camp wereidentified to influence the measurements in the summertime(Heidam et al., 2004). Measurements at Station Nord havebeen conducted since 1990 and since 1994 as part of the of-ficial AMAP programme. The local wind is dominated bySouth West directions, with highest wind velocities originat-ing from North West and South West (Fig. 2). The analy-sis is based upon one year wind data obtained from a sonicanemometer (METEK, USA-1, heated) from 31 May 2011to 1 June 2012, but the data coverage is less in the wintermonth due to frost on the anemometer. An analysis of winterdata (November–March), however, also reveals dominatingSouth-Westerly winds (Fig. 2). The wind flow is probably in-fluenced by regional topography with katabatic winds fromthe ice caps flowing out along the fjord located South Westof Station Nord.
2.2 Instrumentation
At Station Nord, a comprehensive list of different com-pounds is measured and described elsewhere (Heidam et al.,2004). Additionally, a custom-built Particle Soot AbsorptionPhotometer (PSAP) was set up in 2008 to derive black carbonmass concentrations based on measurements of the absorp-tion coefficient of the ambient aerosol. While the calibrationof the PSAP is on-going, a preliminary specific absorptioncoefficient is applied in the present study. The specific ab-sorption coefficient was found via a comparison between the
Atmos. Chem. Phys., 13, 35–49, 2013 www.atmos-chem-phys.net/13/35/2013/

Q. T. Nguyen et al.: Source apportionment of particles at Station Nord, North East Greenland 37
Table 1.Analytical methods and sample frequency of measured parameters.
Parameter Analytical method Timeresolution
Uncertainty
40 mm FP nitro cellulose filters
Al, Si, S, K, Ca, Ti, V, Cr, Mn, Fe, Ni,Cu, Zn, Ga, As, Se, Br, Rb, Sr, Zr, PbSO2, SO2−
4 , Na+, NH+
4 , NH3, NO−
3 ,HNO3, Br−, Cl−
Proton Induced X-rayEmission (PIXE)Ion Chromatography
7 days7 days
18 %20 %
PSAP filters
Black carbon Particle Soot AbsorptionPhotometer (PSAP)
15 min 20 %
On-line gas monitors
O3, NOx, SO2 Gas monitor 30 min 20 %
Detection limits are 9 ng m−3 for S-SO2−
4 , 8 ng m−3 for N-NH+
4 , 11 ng m−3 for N-NO−
3 , 5 ng m−3 for S, 0.06 ng m−3 for Pb, 0.08 ng m−3 for Cu,
0.10 ng m−3 for Ni and 0.05 ng m−3 for As.
24
Figures 1
Fig. 1. The Arctic measurement site Station Nord in North East Greenland (81°36’ N, 16°40’W) 2
3
Fig. 2. Windrose showing local wind direction from May 31st 2011 to June 1st 2012 (left) and 4
winter, (November – March 2012) (right). The intensity scale is shown in m s-1. 5
6
Fig. 1.The Arctic measurement site Station Nord in North East Greenland (81° 36′ N, 16° 40′ W).
PSAP and Elemental Carbon (EC) measurements in field atStation Nord.
Filter pack sampler (FPS) collects total suspended parti-cles with an approximate cut-off diameter of 20 µm depend-ing on wind speed. The sampler consists of a sequence of 3filters, of which the first collects particulate matter. The sub-sequent filters are impregnated to collect specific gases, no-tably SO2. The particle filters are analysed for the sulphate(SO2−
4 )-, ammonium (NH+4 )- and nitrate (NO−3 )- ions by ionchromatography. Elements with atom number higher than Al(Table 1), including particulate sulphur S, particle bound Br(see Skov et al. 2004) were analysed using Proton Induced X-
ray Emission (PIXE), albeit with the exception of Cl and Hgwhich evaporate from the particle filter. Gas filters also col-lect ammonia (NH3) if present and nitric acid (HNO3). Thesenitrogen species may evaporate from the particle filter ontothe gas filters, for which reason the sum of the particulate andgaseous fractions, are reported. Sampling runs from Mon-day 00:00 UTC for one week, equivalent to approximately400 m3.
Uncertainties are listed in Table 1.
www.atmos-chem-phys.net/13/35/2013/ Atmos. Chem. Phys., 13, 35–49, 2013

38 Q. T. Nguyen et al.: Source apportionment of particles at Station Nord, North East Greenland
24
Figures 1
Fig. 1. The Arctic measurement site Station Nord in North East Greenland (81°36’ N, 16°40’W) 2
3
Fig. 2. Windrose showing local wind direction from May 31st 2011 to June 1st 2012 (left) and 4
winter, (November – March 2012) (right). The intensity scale is shown in m s-1. 5
6
Fig. 2. Windrose showing local wind direction from 31 May 2011 to 1 June 2012 (left) and winter, (November–March 2012) (right). Theintensity scale is shown in m s−1.
2.3 Receptor modelling
In general, two types of models are used for source appor-tionment of aerosols, including source-oriented models andreceptor models (Schauer et al., 1996). The source-orientedmodels employ emission data inventories and calculate trans-port modes (such as dispersion, deposition and trajectories)to estimate the emission, formation, transformation, trans-port and deposition of aerosols at receptor sites (Eldering andCass, 1996). Although the models can be very useful espe-cially in scenario studies where emission abatement strate-gies are evaluated, the use of this type of models is often lim-ited by the availability and reliability of the emission invento-ries (Viana et al., 2008). In contrast, the receptor models as-sume that the observed concentrations can be adequately ex-plained by a linear combination of a number of sources withfixed source profiles and variable source strengths in time. Inthis work, we use two different source apportionment mod-els, i.e. Positive Matrix Factorization (PMF) and the COn-strained Physical REceptor Model (COPREM) to evaluatethe sources of Arctic particulate matter at Station Nord overa period of two years from March 2008 to February 2010.The obtained factors of the PMF solution and the obtainedsources of the COPREM solution will be both referred to as“source” in this work.
2.4 PMF
PMF is a multivariate factor analysis tool, which derives asource contribution matrixg, and a source strength matrixf
(Paatero, 1997) based on measured mass concentrations ofselected species and weighted by analytical uncertainty.
xij∼=
p∑k=1
gik + eij , (1)
wherexij is the observed mass concentration of compoundi in samplej , p is the number of sources that contribute toxij , gik is the source contribution (or source score),fkj isthe mass fraction (or source loading), andeij is the residualor error (Hopke, 2003). The results are constrained to phys-ically possible solutions, which imply that a sample cannothave a negative contribution from a source. Moreover, eachdata point can be weighted individually, e.g. by regulatingthe uncertainty of the corresponding measured values belowthe detection limit so that they have less influence on the re-sulting solution. The PMF solution minimizes the functionQ:
Q =
n∑i=1
m∑j=1
xij −
p∑k=1
gikfkj
uij
2
, (2)
whereuij is the analytical uncertainty ofxij . Hence, this isa least square problem to identify the matricesg and f (Xieet al., 1999). The uncertainty of the PMF solution can beestimated by generating new data sets, which are consistentwith the original one. Each data set is then decomposed to agandf matrix, which are compared with the base run (Eberly,2005).
Atmos. Chem. Phys., 13, 35–49, 2013 www.atmos-chem-phys.net/13/35/2013/

Q. T. Nguyen et al.: Source apportionment of particles at Station Nord, North East Greenland 39
In this study we used PMF 3.0 provided by the US EPA,which is based on the second version of the Multi linear En-gine (ME-2).
2.5 COPREM
The data was also analysed using the multivariate receptormodel COPREM (Wahlin, 2003; Heidam et al., 2004; Skovet al., 2006). Like any receptor model, COPREM is basedon the assumption that the observed mass concentrations atthe receptor site can be explained by contributions from anumber of sources with constant source profiles, but variablesource strengths in time.
xij∼=
∑k
aikfkj , (3)
wherexij is the measured mass concentration of compoundi in samplej . k is the number of sources, which are requiredto adequately describe the observations.aik is the fixed pro-file, andfkj is the source strength in the individual samples.COPREM may be perceived as a hybrid receptor model be-tween PMF and chemical mass balance (CMB), where CO-PREM resembles PMF or CMB dependent on the numberof constraints. If COPREM is operated with a minor numberof constraints, the model will resemble PMF, which requiresno prior knowledge of the sources (Baltensperger and Pre-vot, 2008). As a result,xij in Eq. (3) is the only necessaryinput though a substantial amount of data is required to inferthe sources. In contrast, the sources can be attributed to evensmall data sets in CMB, as the user can apply constraints anddefine the source profiles in the receptor model.
COPREM requires three input matrices: a(2 ×n ×N) ma-trix with measurement data including analytical uncertainty,a(n ×p) source profile matrix and a(n ×p) form matrix defin-ing additional constraints. In the source matrix, the user de-fines the source profiles (columns) by the ratio of the sourceelements (rows), e.g. as the percentage of particulate mat-ter (PM). In the form matrix, the user can define additionalconstraints. The form matrix has the same number of rowsand columns as the source matrix, and elements are set to ei-ther “0” or “1”. If the profile elements are set to “0”, suchelements are fixed in the ratios defined in the source pro-file, taking the analytical uncertainty into account, whereasif such elements are set to “1”, a solution is allowed wherethe particular elements can be solved different from the val-ues defined in the source profile. The latter is particularlyuseful, where knowledge of the relevant sources is limitedor unknown. Furthermore, specific elements can be excludedfrom a particular source by setting the concentration to “0”in the source profile and “0” in the form matrix.
Equation (3) is solved by an iterative method to determineaik andfkj , while taking the uncertaintyσij of the measure-ments into account. Chi-square statistics provide the squareddifference between measurement and model results.
X2=
∑j
∑i
(xij −
∑k
aikfkj
)2
σ 2ij
, (4)
Negative coefficients in the source profile and negativesource strengths are excluded by built-in constraints in CO-PREM. The Chi-square is minimized until it reaches a stag-nant minimum value during the iteration process within theconstraint limits.
The uncertainty of the fitted source profiles in COPREMis estimated with a specific module using weighted linearregression between the calculated source strengths and themeasured data, taking into account the analytical uncertain-ties of the individual species, which are multiplied by a con-
stant factor√
x2
v, whereν is the degree of freedom. However,
the calculated uncertainty represents a lower estimate, sinceother uncertainties may also influence the fitted source pro-files (e.g. constraints which are not correctly assigned or bythe use of insufficient number of sources).
COPREM fills up a gap in source apportionment analysisas the user-defined constraints can transform the model fromeither multivariate to strictly CMB. This property is conve-nient when the analyst has sound knowledge about the sourcecompositions and wishes to partly control the solution basedon this knowledge. Other sources may be less understood andthe analyst can loosen the constraints on a particular sourceprofile. In contrast, the possibility of COPREM to resembleCMB may become a true disadvantage, if the source profilesfail to meet the actual ones. By combining PMF and CO-PREM, the analyst can critically evaluate present knowledgeof contributing sources.
SoilandMarineprofiles corresponding to elemental abun-dances in igneous rocks (Kaye and Laby, 1959) and seawater(Sverdrup et al., 1942) were used in the COPREM sourceprofiles. TheSoil profile was fully constrained. TheMarineprofile was also constrained except for Cl, V, S, SOx, BCand Br (Table S1). No constraints were imposed on the an-thropogenic profiles, since the knowledge of these sources isscarce. In this regard, the apportionment of the anthropogenicsources in COPREM and PMF followed a strictly mathe-matical solution free of constraints imposed by the analyst,though the degrees of freedom were larger in PMF, wherethe natural sources were not constrained.
3 Results and discussion
Source apportionment on Arctic aerosols is typically con-fined to a limited number of sources due to scarce num-bers of contributing emission sources in the Arctic as well asunique meteorology and transport mechanisms characteristicfor these remote regions. Furthermore, low concentrations ofspecies necessitate longer sampling times (e.g. days to weeks
www.atmos-chem-phys.net/13/35/2013/ Atmos. Chem. Phys., 13, 35–49, 2013
40 Q. T. Nguyen et al.: Source apportionment of particles at Station Nord, North East Greenland
25
1
Fig. 3. Source origin of chemical species apportioned by PMF and COPREM 2
3
4
5
6
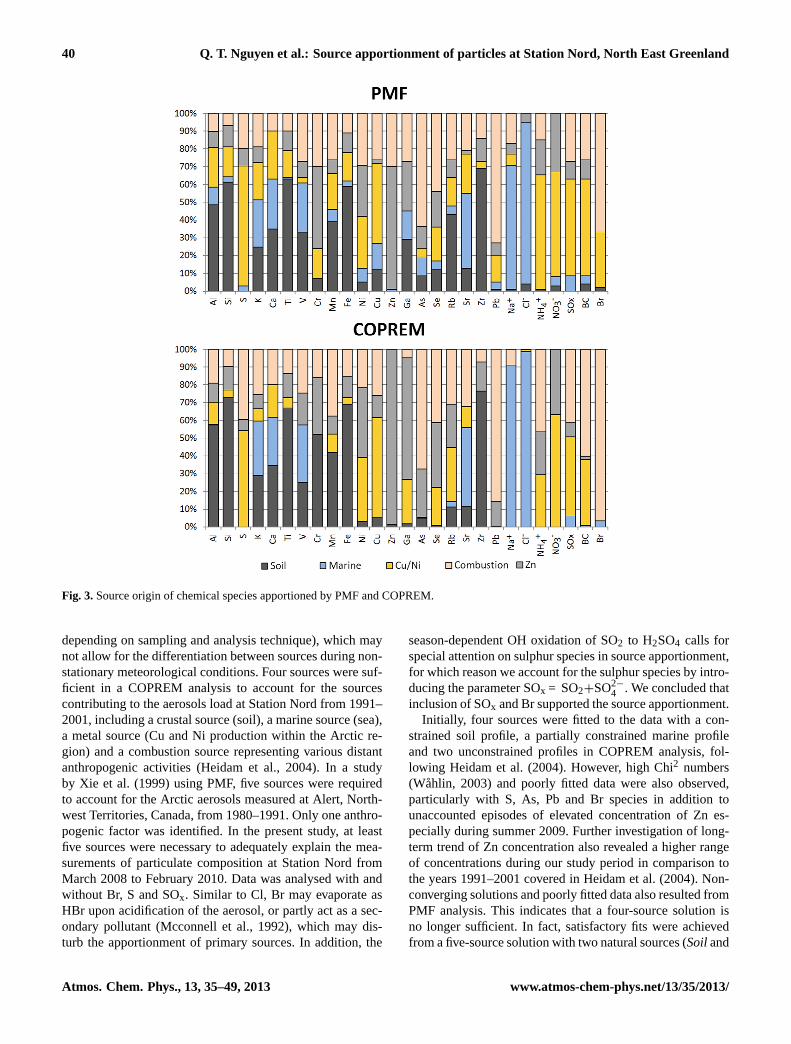
Fig. 3.Source origin of chemical species apportioned by PMF and COPREM.
depending on sampling and analysis technique), which maynot allow for the differentiation between sources during non-stationary meteorological conditions. Four sources were suf-ficient in a COPREM analysis to account for the sourcescontributing to the aerosols load at Station Nord from 1991–2001, including a crustal source (soil), a marine source (sea),a metal source (Cu and Ni production within the Arctic re-gion) and a combustion source representing various distantanthropogenic activities (Heidam et al., 2004). In a studyby Xie et al. (1999) using PMF, five sources were requiredto account for the Arctic aerosols measured at Alert, North-west Territories, Canada, from 1980–1991. Only one anthro-pogenic factor was identified. In the present study, at leastfive sources were necessary to adequately explain the mea-surements of particulate composition at Station Nord fromMarch 2008 to February 2010. Data was analysed with andwithout Br, S and SOx. Similar to Cl, Br may evaporate asHBr upon acidification of the aerosol, or partly act as a sec-ondary pollutant (Mcconnell et al., 1992), which may dis-turb the apportionment of primary sources. In addition, the
season-dependent OH oxidation of SO2 to H2SO4 calls forspecial attention on sulphur species in source apportionment,for which reason we account for the sulphur species by intro-ducing the parameter SOx = SO2+SO2−
4 . We concluded thatinclusion of SOx and Br supported the source apportionment.
Initially, four sources were fitted to the data with a con-strained soil profile, a partially constrained marine profileand two unconstrained profiles in COPREM analysis, fol-lowing Heidam et al. (2004). However, high Chi2 numbers(Wahlin, 2003) and poorly fitted data were also observed,particularly with S, As, Pb and Br species in addition tounaccounted episodes of elevated concentration of Zn es-pecially during summer 2009. Further investigation of long-term trend of Zn concentration also revealed a higher rangeof concentrations during our study period in comparison tothe years 1991–2001 covered in Heidam et al. (2004). Non-converging solutions and poorly fitted data also resulted fromPMF analysis. This indicates that a four-source solution isno longer sufficient. In fact, satisfactory fits were achievedfrom a five-source solution with two natural sources (Soiland
Atmos. Chem. Phys., 13, 35–49, 2013 www.atmos-chem-phys.net/13/35/2013/

Q. T. Nguyen et al.: Source apportionment of particles at Station Nord, North East Greenland 41
26
Fig. 4. Concentration (µg m-3) and uncertainty (standard deviation) of species in PMF (left) and 1
COPREM (right) profile 2
3
Fig. 4.Concentration (µg m−3) and uncertainty (standard deviation) of species in PMF (left) and COPREM (right) profile.
Marine source) and three anthropogenic sources dominatedby the metalsCu/Ni, Zn and Pb/As, respectively (Figs. 3–4, Table S2). Compared to the previous solution proposedby Heidam et al. (1999, 2004) for Station Nord, theCu/Nisource in our study resembles the previous metal sourceand ourCombustionsource probably resembles the previouscombustion source whereasZn source is a newly added one.Concentration and standard deviation of the PMF and CO-PREM profiles are shown in Fig. 4. Q (robust) for the baserun was 7340. In order to check the stability of the solution,100 bootstrap runs were completed of which all converged.Q (robust) varied from 4441–7537 with 25th quartile: 6031,median: 6382 and 75th quartile: 6780. Fpeak runs of strength0.1–0.5 resulted in Q-values from 7145–7249. The calculatedtotal Chi2 statistic for the COPREM solution is 10 683 for to-tal 27 species.
Table 2 shows concentrations of the analysed species atStation Nord during the study period. Due to the frequentinfluence of the Arctic Haze pattern resulting in elevatedconcentrations during winter for many species, the reportedmean and median values maybe in the higher range for sum-mer concentrations and in the lower range for winter con-
centrations. The values however blend well with the con-centration range/values for the corresponding species at dif-ferent sites in the Arctic summarized in Sander and Botten-heim (2012).
3.1 Natural sources
The sourceSoil was dominated by Al, Si, Ca, Ti, Mn, V andFe (Figs. 3–4, Table S2). A crustal source was previously de-scribed as peaking in spring and late summer (Heidam et al.,1999). PMF and COPREM solutions for theSoilsource werehighly consistent with maximum concentration also observedin spring/summer 2008, though this spring/summer peakingtrend was much less pronounced in 2009 (Fig. 5). PMF andCOPREM attributed 33 %PMF and 25 %COPREMof total V tothis source, respectively. V is typically associated with fos-sil oil combustion, but other Arctic studies have associatedV with the crustal source (Heidam et al., 2004; Maenhautand Cornille, 1989) and V occurs in about 65 different min-erals (Wang and Sanudo Wilhelmy, 2009). Notable differ-ences (>20 %) in the PMF and COPREM solutions for theSoil source are seen for Rb (43 %PMF; 11 %COPREM) and Cr
www.atmos-chem-phys.net/13/35/2013/ Atmos. Chem. Phys., 13, 35–49, 2013

42 Q. T. Nguyen et al.: Source apportionment of particles at Station Nord, North East Greenland
Table 2.Concentration of analysed species (ng m−3) at Station Nord during the period 3/2008–2/2010.
Compound Mean/ng m−3 Median/ng m−3 Highest concentrationobserved/ng m−3
Al 37.9 32.7 104.6Si 75.5 59.3 287.6S 178.9 123.4 749.1K 23.2 19.6 68.9Ca 29.7 25.0 85.5Ti 1.8 1.3 8.4V 0.1 0.1 0.5Cr 0.08 0.06 0.4Mn 0.5 0.4 1.4
Fe 19.4 14.3 67.2Ni 0.1 0.06 0.9Cu 0.1 0.08 0.6Zn 1.3 1.1 5.9Ga 0.02 0.02 0.09As 0.06 0.03 0.3Se 0.04 0.03 0.2Rb 0.08 0.06 0.3Sr 0.4 0.3 1.7
Zr 0.08 0.06 0.4Pb 0.6 0.2 3.2Na+ 211.3 123.1 1157.5Cl− 241.3 21.0 2187.5NH+
4 46.8 30.6 166.0NO−
3 29.6 24.5 124.7SOx 238.3 112.3 1028.2BC 19.8 12.4 108.4Br 1.5 0.7 7.6
(7 %PMF; 52 %COPREM) (Table S2), however, measured con-centrations of Rb were low.
Na and Cl are dominating species in theMarinesource, which also included K, Ca, Sr and V (28 %PMF;33 %COPREM), small amounts of SOx (9 %PMF; 6 %COPREM)
and BC (5 %PMF; 1 %COPREM). The worldwide increasingship traffic could explain BC, SOx and V in the naturalMa-rine source. However, V is also relatively abundant in openocean waters (Wang and Sanudo Wilhelmy, 2009). TheMa-rine source shows a clear annual trend with lower summerconcentrations and increased contributions in the autumn andwinter period (Fig. 5). In the autumn, ocean storms may leadto high productions of sea spray aerosols. During winter, thesea surrounding Station Nord is frozen and thus it is notlikely that the aerosols originate from open waters, howeverit is suggested by Fenger et al. (2012) that large Cl− contain-ing particles at Station Nord can originate from frost flowerstorn at high wind speeds. Furthermore a study by Domine etal. (2004) also found that both frost flowers and the marinesnow pack can be sources of sea salt.
The PMF and COPREM solutions for theMarine sourceare fairly similar though the former includes low contribu-
tions of additional elements, including Al, Si, Ti and Fe(Figs. 3–4). The time profiles of PMF and COPREM solu-tions are also highly similar, with slightly higher contribu-tion of theMarinesource during certain intervals of the PMFsolution (Fig. 5). The presence of Al, Si, Ti and Fe in thePMF source (Fig. 3) suggests that theMarinesource is some-how mixed with a crustal source, probably disturbed by thelow (weekly) time resolution or complex long-range trans-port imprinting of the observed samples. K and Ca are alsofound in all sources, except for theZn source. Indeed, un-clear or “blurry” source profiles have been observed in otherstudies in the Arctic region (Xie et al., 1999). The COPREMsolution, on the other hand, is constrained with respect tothese elements, which may explain small deviations in thetime profiles. K, Ca and Sr were assigned to the COPREM in-put source profile (Table S1), since these elements are abun-dant in both seawater and aerosols created from sea spray(Maenhaut and Cornille, 1989; Heidam et al., 2004). Exceptfor V, S, SOx, Br and BC, all elements in the COPREM in-put profile were constrained to a seawater composition pro-file (Sverdrup et al., 1942). Notable differences in the PMFand COPREM solutions are only observed for Na (21 %).
Atmos. Chem. Phys., 13, 35–49, 2013 www.atmos-chem-phys.net/13/35/2013/

Q. T. Nguyen et al.: Source apportionment of particles at Station Nord, North East Greenland 43
Fig. 5. Timme profiles oof PMF and COPREM ssources.
Fig. 5.Time profiles of PMF and COPREM sources.
Se has previously been suggested to originate mainly frommarine biogenic sources in the Norwegian Arctic (Maenhautand Cornille, 1989). However, we find only a negligible ma-rine contribution to Se (5 %PMF; 0 %COPREM) compared tothe anthropogenic sources (83 %PMF; 100 %COPREM).
3.2 Anthropogenic sources
Three sources are characterised by high abundances of theelements Zn, Cu, Ni, Pb and As, which are interpreted as an-thropogenic sources or most likely agglomerates of sources.Two sources influenced by metal industry, which includesmost notably the Cu and Ni smelters on the Kola penin-sula (Nikel, Monchegorsk and Zapolyarnyy) and Norilsk inNorthern Siberia (Christensen et al., 1997; Heidam et al.,1999, 2004) peaked in spring/summer (Cu/Ni source), andwinter (Combustionsource). TheCu/Nisource is probably anagglomerate of sources from Eurasia as evident from the con-tribution of Cu (45 %PMF; 56 %COPREM) and Ni (29 %PMF;36 %COPREM). Cu and Ni are present in both theCu/Niand Combustionsources but virtually absent in the natu-
ral sources. The impact of Cu on anthropogenic and natu-ral sources gives evidence that Eurasia, and in particular theSiberian Cu/Ni industry, is a major source of pollutants in thehigher Arctic. Previously, Cu has almost exclusively been ap-portioned to one anthropogenic source with heavy influencesfrom the metal industry, whereas two distinct anthropogenicsources have contributed to Ni in former studies at StationNord (Heidam et al., 1999, 2004). The highest abundance ofprimary and secondary combustion products were attributedto theCu/Ni source by both PMF and COPREM, i.e. NO−
3(59 %PMF; 63 %COPREM), SOx (54 %PMF; 45 %COPREM) andBC (54 %PMF; 37 %COPREM), which could reflect combus-tion processes fuelled by coal, as indicated by Se (19 %PMF;21 %COPREM), and most likely not oil due to the low abun-dance of V (3 %PMF; 0 %COPREM). Alternatively, the com-bustion products may originate from power generation andother combustion processes connected to the metal industrynear the industrial sites. As mentioned above, we includeda parameter SOx, defined as the sum of SO2 and SO2−
4 . Inthis way, we take into account the variable oxidation rateof SO2 to form SO2−
4 over the seasons, where the avail-ability of sunlight and thereby OH is highly variable. How-ever, the results should be taken with caution. A higher de-position velocity of gaseous SO2 as compared to particulateSO2−
4 (Possanzini et al., 1988) imply an increased scaveng-ing of SO2 during the darker period of the year and conse-quently an underestimation of SOx = S-SO2+S-SO2−
4 . Sincethe source profiles in COPREM and PMF do not change overthe season, this would slightly affect the fit of SOx to thesources. The majority of SOx (54 %PMF; 45 %COPREM) andNO−
3 (59 %PMF; 63 %COPREM) are apportioned toCu/Ni. Theremaining mass of these species is largely found in theZnsource. Although both PMF and COPREM suggestCu/Ni tobe the major source of NO−3 and SO2−
4 , recent findings at Sta-tion Nord show that the particle modes of NO−
3 (maximum at1.2 µm) and SO2−
4 particles (maximum at 0.3 µm) are signif-icantly different (Fenger et al., 2012). H2SO4 which is eitherformed directly or from oxidation of SO2 by OH, may partic-ipate in nucleation processes to form new particles (Napariet al., 2002). In contrast, HNO3 is expected to adsorb ontopre-existing particles and thereby larger particles (Finlayson-Pitts and Hemminger, 2000; Song and Carmichael, 1999),which explains why the two species are present in differentparticle modes despite having the same source origin. Theapportionment by PMF and COPREM generally agree wellwith respect to the abundances of species (Fig. 3-4 and Ta-ble S2) and time profiles (Fig. 5). Notable differences are ob-served for Si, Cr, Fe, Ga, Pb and NH+
4 . Among these species,NH+
4 is believed to originate from long-range transportedhusbandry sources and influence all anthropogenic sources.
Also influenced by Cu/Ni is theCombustionsource, whichis characterised by high concentration of Pb (72 %PMF;86 %COPREM) and As (63 %PMF; 68 %COPREM). This Com-bustion source represents typical anthropogenic pollutants
www.atmos-chem-phys.net/13/35/2013/ Atmos. Chem. Phys., 13, 35–49, 2013

44 Q. T. Nguyen et al.: Source apportionment of particles at Station Nord, North East Greenland
which are long-range transported to Station Nord (Heidamet al., 1999; Heidam et al., 2004). High abundances of V(27 %PMF; 25 %COPREM) and Se (44 %PMF; 41 %COPREM)
indicate oil and coal fuelled industry and/or other anthro-pogenic combustion processes. Primary and secondary com-bustion products also appear with high abundances (Fig. 3-4). As and Se have previously been apportioned to sourcesfrom the Kola Peninsula (Maenhaut and Cornille, 1989).NO3 which is the oxidation product of NOx is however ab-sent from thisCombustionsource, which is possibly due tothe smaller contribution of the species from this source com-pared to the other two anthropogenicCu/Ni andZn sources.
Br (66 %PMF; 96 %COPREM) is largely apportioned to theCombustionsource and plays a key-role in ozone depletionduring Arctic sunrise, though the activation of bromine is notfully understood (Sumner and Shepson, 1999). It has pre-viously been suggested that sea-salt bromine may be accu-mulated in the snowpack during the long polar night andis evolved as Br2 into the atmosphere at polar sunrise (Mc-connell et al., 1992). In the following step, BrO is formed inthe reaction with O3 and Br atoms from photolysis of Br2,or e.g. HOBr from the reaction of BrO with the HO2 radical(Impey et al., 1999). Br may also react with organic com-pounds to form HBr and organic bromine compounds, allof which are suspected to be scavenged by Arctic aerosols(Mcconnell et al., 1992; Impey et al., 1997, 1999). Further-more, Br2 can recycle with or without O3 (Impey et al., 1999;Simpson et al., 2007) and may photolyse to Br atoms whichfurther deplete O3. In addition to theCombustionsource,Bris apportioned toCu/Ni source (31 %PMF; 0 %COPREM) andvirtually no other sources, though the Br has both naturalsources, e.g. sea-salt and marine organisms (Gribble, 2000)and anthropogenic sources, e.g. incineration and chemical in-dustries (Morawska and Zhang, 2002). An anti-correlation isapparent between Br and O3 in 2009 from about polar sunrisein the beginning of March until beginning of June (Fig. 6),after which Br decreases, which is in agreement with pre-vious observations at Station Nord (Skov et al., 2004). Bris only low during summer and increases to ng m−3 levelsfrom November–December (Fig. 6). We assume that this isdue to oceanic storms, since theMarine source peaks ear-lier than bromine concentrations (Figs. 5–6). Br is mainlyapportioned (96 %) toCombustionusing COPREM. UsingPMF, this source accounts for 66 % whereasCu/Nisource ac-counts for additional 31 % (Table S2). Apparent from Fig. 6,Br resembles the anthropogenic elements Pb and S, whichcan probably be explained by S acting as a “transport con-tainer” in addition to S as H2SO4 being a source of H+. Inother words, Br is most unlikely emitted from anthropogenicsources, but probably has marine sources (Simpson et al.,2007).
TheZnsource appears to have a different origin thanCu/NiandCombustionsource, since it is only influenced by Cu toa minor extent. According to Heidam et al. (2004), Zn to-gether with Pb and As were mostly attributed to the combus-
tion source. Compared to the work by Heidam et al. (2004)based on data from 1991–2001, the present work analyses ashorter but more recent data set from 3/2008–2/2010 witha larger number of chemical parameters. A separate CO-PREM analysis is also conducted to investigate whether theinclusion of an additional anthropogenic source is necessarybased on previous source results from Heidam et al. (2004)both with and without the additional chemical parameters.According to this, Zn, Pb and As could no longer be ad-equately explained using a single common source, whichconsequently indicates that the sources have changed. Theapportionment by PMF and COPREM toZn source as thelargest source of Zn (69 %PMF; 98 %COPREM) to Station Nordagrees well.Znsource also accounts for Arctic summer peri-ods, where the contribution of anthropogenic elements washigh (Fig. 5), which was not observed earlier at StationNord (Heidam et al., 1999; Heidam et al., 2004). In thissource, Br is absent whereas SOX (10 %PMF; 8 %COPREM)
and S (10 %PMF; 6 %COPREM) are low in comparison with theSiberian sources imprinted with abundant Brand S. Whilethis stresses the difference of thisZn source compared to theother two anthropogenic sourcesCu/Ni andCombustion, italso supports the hypothesis of S acting as a transport con-tainer for Br. Only minor differences in the apportionment ofother species to thisZn source are observed between PMFand COPREM (Table S2). Finally, all anthropogenic sourcesare influenced by Se (19–44 %), indicative of coal-fuelledprocesses (Sholkovitz et al., 2009) (Figs. 3–4, Table S2).
In order to investigate the origin of theZn source, theHYSPLIT model is used to generate air mass back trajec-tories. Back trajectories are calculated for arrival at 50 m and500 m above sea level every 24 h during the Arctic summerperiods where there was sudden elevation of Zn concentra-tion or consistently high Zn concentrations. As the back tra-jectories are calculated 10 days backwards due to the remotelocation of Station Nord whereas the associated uncertaintyincreases dramatically with time, implications of back trajec-tory results must be interpreted with caution. Calculated airmasses from the back trajectories seem to arrive from variousdirections, including West of Station Nord (Canadian Arc-tic, North America and West Greenland), North of StationNord (the North Pole and Siberia) and South of Station Nord(North Atlantic over Greenland) (Fig. 7). However it was re-vealed that a change in air mass direction to Westerly ori-gins of Station Nord (Canadian Arctic, North America, andWest Greenland), especially from Canadian Arctic is oftenaccompanied with an elevated concentration of Zn, therebyindicating aZnsource from this region. In contrast, there arealso high Zn concentrations associated with air masses arriv-ing from other directions, including the North Atlantic overGreenland and Siberia which are observed less frequentlythan air masses originated from Westerly directions of Sta-tion Nord.
A possible Zn source could be the Canadian ArcticArchipelago mine in Baffin, near the Arctic Bay, which is
Atmos. Chem. Phys., 13, 35–49, 2013 www.atmos-chem-phys.net/13/35/2013/

Q. T. Nguyen et al.: Source apportionment of particles at Station Nord, North East Greenland 45
Fig. 6. Time profiles for Br, O3, S and Pb. Br correlates with S andPb throughout the observation period. Br anti-correlates with O3from about polar sunrise in the beginning of March until beginningof June in 2009, after which Br decreases.
the major Zn mine closest to Station Nord. The mine isalso located in the region of trajectories associated with el-evated Zn concentration. In addition to Zn, Cu and Pb arealso produced at this mine (AMAP, 1997). Whereas a cer-tain percentage of Pb was assigned to theZnsource (7 %PMF;14 %COPREM), the assignment of Cu to this source was morelimited regarding the PMF solution (2 %PMF; 13 %COPREM).Further source discussion is hindered by the lack of produc-tion data of the mine. In addition, a gap in available monitor-ing data between the period 1991–2001 covered in Heidamet al. (2004) and the period 3/2008–2/2010 covered in thisstudy further impedes a direct trend evaluation of emitted Znespecially over the gap of preceding years 2002–2007 com-pared to the recent year. Li and Cornett (2011) also reporteda long-term increase in zinc concentration in the CanadianArctic and Sub-Arctic air resulting from studying particulatesamples collected at various sites in Canada during 1973–2000. A increasing trend of Zn concentrations were foundat many sites, most significant at Coral Harbour (64◦12′ N,83 ◦18′ W) which is not in proximity of any major Zn mine,which has prevented them from linking Arctic Zn mining to
the observed trend. The reported period of the observed in-creasing trend was clearly more dated than our study period.
BC is mainly apportioned to anthropogenic sources(80 %PMF; 98 %COPREM), and predominantly found to haveSiberian origin. Whereas COPREM assigns a higher percent-age of BC toCombustionsource (61 %COPREM) and a lowerpercentage toCu/Nisource (37 %COPREM), the PMF solutionsuggests a lower percentage toCombustion(26 %PMF) com-pared toCu/Ni source (54 %PMF). PMF also apportioned acertain higher amount of BC (10 %PMF) to Zn source com-pared to COPREM (1 %COPREM). Despite such differencesbetween PMF and COPREM, the high contribution fromSiberian metal industries to BC at Station Nord is inevitable,which agrees with other recent findings (Hirdman et al.,2010; Wang et al., 2011).
3.3 Comparison of PMF and COPREM
Using a combination of PMF and COPREM in analysing thesame data set provides certain advantages. First, we are ableto achieve fairly reliable solutions of the better-defined nat-ural Soil and Marine sources using COPREM. Such solu-tions also serve to identify the correspondingSoilandMarinesources from the PMF solution among the initially uniden-tified sources. Second, the anthropogenic sources of CO-PREM can be compared with the remaining PMF sources todetermine the corresponding match of COPREM and PMFsources, though it should be expected that the solution for theanthropogenic sources using COPREM in principle shouldfairly resemble PMF, since no constraints were applied tosuch sources. Third, using COPREM with some knowledgeon the possible number of sources could also serve to limitthe number of PMF sources, especially as PMF tends to findmore sources, than what is actually present in order to pro-vide the best fit.
PMF in return can be used to validate existing COPREMprofile knowledge. The general agreement between PMF andCOPREM solutions increases the confidence in apportion-ment results, especially with our limited 2-year data set ofweekly samples. Meanwhile, as the solutions of COPREMand PMF are not always comparable, which is presumablydue to the set constraints of COPREM, certain species canbe apportioned very differently such as Cr (ofSoil source)and Na (ofMarinesource) (Table S1a).
Current data evaluated by PMF and COPREM failed toapportion biomass combustion, which is an important sourcewhere K and the sugar anhydride levoglucosan are typicallychosen as markers. K is almost evenly distributed among thesources with no clear dominating source and the approxi-mately 10 % difference between PMF and COPREM in theapportionment of K toCu/Ni is probably a consequence ofK being constrained in theSoil source profile (Table S1). Ina previous study at the Canadian Arctic site Alert, K wasapportioned to Marine, Biogenic, Anthropogenic and Photo-chemistry influenced sources in comparable abundances but
www.atmos-chem-phys.net/13/35/2013/ Atmos. Chem. Phys., 13, 35–49, 2013

46 Q. T. Nguyen et al.: Source apportionment of particles at Station Nord, North East Greenland
29
Fig. 7. Air mass back trajectories were calculated for arrival at 50 m and 500 m asl every 24h 1
during summer for the period 03/2008 – 02/2012 using the model HYSPLIT. The trajectories below 2
are examples shown for three typical cases: (left) West of Station North (Canadian Arctic, North 3
America and West Greenland); (middle) The North Pole and Siberia and (right) south of Station 4
North (North Atlantic over Greenland). 5
6
7 Fig. 7.Air mass back trajectories were calculated for arrival at 50 m and 500 m a.s.l. every 24 h during summer for the period 3/2008–2/2012using the model HYSPLIT. The trajectories below are examples shown for three typical cases: (left) West of Station North (Canadian Arctic,North America and West Greenland); (middle) The North Pole and Siberia and (right) south of Station North (North Atlantic over Greenland).
not apportioned toSoil . (Xie et al., 1999). At Station Nord,K has previously been apportioned to mainlySoil andMa-rine and to a minor extent to the copper smelters but not toCombustion(Heidam et al., 2004). K is a well-known quali-tative tracer for biomass burning (Cachier et al., 1995; Lewiset al., 1988), however other sources also contribute to K inthe Arctic environment, mainly earth dust (Frossard et al.,2011).
4 Conclusions
In this work, two different source apportionment modelswere used to explain the chemical observations at StationNord, Northern Greenland during a two-year period fromMarch 2008 to February 2010. PMF and COPREM pro-duced highly comparable solutions with similar source pro-files and source time series. Differences in abundance ofparticular compounds are evident in particular sources asa consequence of the constraints on the natural sources(Marine and Soil) in COPREM. In addition to the naturalsources, we identified three anthropogenic sources which areall highly influenced by metal industries.Cu/NiandCombus-tion sources are subjected to influences from the Cu and Niindustry which is most likely of Siberian origin. As expected,the majority of BC originated from these sources (80–98 %).A third source,Znsource, was only influenced by Cu to a mi-nor extent and explained a significant fraction of Zn, whichcould not be apportioned to the other anthropogenic sources.HYSPLIT back trajectories indicated that this source is prob-ably influenced by the Canadian Arctic, though Southern andeven Eastern air mass origin also exerted influence on thissource. Br is mainly apportioned to Siberian sources thoughit is most likely sulphuric acid from these sources that acts as
transport containers for Br species, which themselves havelocal/marine origin.
Supplementary material related to this article isavailable online at:http://www.atmos-chem-phys.net/13/35/2013/acp-13-35-2013-supplement.pdf.
Acknowledgements.This work was partly financially supportedby the Danish Environmental Protection Agency with meansfrom the MIKA/DANCEA funds for Environmental Support tothe Arctic Region, which is part of the Danish contribution to“Arctic Monitoring and Assessment Program” (AMAP) and to theDanish research project “Short lived Climate Forcers” (SLCF). Thefindings and conclusions presented here do not necessarily reflectthe views of the Agency. The Royal Danish Airforce is gratefullyacknowledged for providing free transport to Station Nord andthe authors wish in particular to thank the staff at Station Nordfor an excellent and unwavering support. The authors gratefullyacknowledge Peter Wahlin for quality assurance of the analyticalmeasurements.
Edited by: A. Stohl
References
ACIA: (Arctic Climate Impact Assessment) Overview Report,Cambridge University Press, Cambridge, 140 pp., 2004.
AMAP: The Impact of Black Carbon on Arctic Climate, edited by:Quinn, P. K., Stohl, A., Arneth, A., Berntsen, T., Burkhart, J.F., Christensen, J., Flanner, M., Kupiainen, K., Lihavainen, H.,Shepherd, M., Shevchenko, V., Skov, H., and Vestreng, V., ArcticMonitoring and Assessment Programme (AMAP), Oslo, 72 pp.,2011.
Atmos. Chem. Phys., 13, 35–49, 2013 www.atmos-chem-phys.net/13/35/2013/

Q. T. Nguyen et al.: Source apportionment of particles at Station Nord, North East Greenland 47
AMAP: (Arctic Monitoring and Assessment Programme) ArcticPollution Issues: A State of the Arctic Environment Report, Oslo,Norway, 188 pp., 1997.
Baltensperger, U. and Prevot, A. S. H.: Chemical analysis ofatmospheric aerosols, Anal. Bioanal. Chem., 390, 277–280,doi:10.1007/s00216-007-1687-z, 2008.
Barrie, L. A.: Arctic Air-Pollution – an Overview of Current Knowl-edge, Atmos. Environ., 20, 643–663, 1986.
Barrie, L. A., Hoff, R. M., and Daggupaty, S. M.: The Influenceof Mid-Latitudinal Pollution Sources on Haze in the CanadianArctic, Atmos. Environ., 15, 1407–1419, 1981.
Bourgeois, Q. and Bey, I.: Pollution transport efficiency toward theArctic: Sensitivity to aerosol scavenging and source regions, J.Geophys. Res., 116, D08213,doi:10.1029/2010jd015096, 2011.
Cachier, H., Liousse, C., Buatmenard, P., and Gaudichet, A.: Partic-ulate Content of Savanna Fire Emissions, J. Atmos. Chem., 22,123–148, 1995.
Carlson, T. N.: Speculations on the Movement of Polluted Air to theArctic, Atmos. Environ., 15, 1473–1477, 1981.
Christensen, J. H.: The Danish Eulerian hemispheric model – Athree-dimensional air pollution model used for the Arctic, At-mos. Environ., 31, 4169–4191, 1997.
Domine, F., Sparapani, R., Ianniello, A., and Beine, H. J.: The originof sea salt in snow on Arctic sea ice and in coastal regions, At-mos. Chem. Phys., 4, 2259–2271,doi:10.5194/acp-4-2259-2004,2004.
Eberly, S.: EPA PMF 1.1 user’s guide. U.S. Environmental Protec-tion Agency (EPA), National Exposure Research Laboratory, Re-search Triangle Park, NC, June, 2005.
Eckhardt, S., Stohl, A., Beirle, S., Spichtinger, N., James, P., Forster,C., Junker, C., Wagner, T., Platt, U., and Jennings, S. G.: TheNorth Atlantic Oscillation controls air pollution transport to theArctic, Atmos. Chem. Phys., 3, 1769–1778,doi:10.5194/acp-3-1769-2003, 2003.
Eldering, A. and Cass, G. R.: Source-oriented model for air pollu-tant effects on visibility, J. Geophys. Res.-Atmos., 101, 19343–19369, 1996.
Fenger, M., Sørensen, L. L., Kristensen, K., Jensen, B., Nquyen,Q. T., Nøjgaard, J. K., Massling, A., Skov, H., and Glasius,M.: Sources of anions in aerosols in northeast Greenland dur-ing late winter, Atmos. Chem. Phys. Discuss., 12, 14813–14836,doi:10.5194/acpd-12-14813-2012, 2012.
Finlayson-Pitts, B. J. and Hemminger, J. C.: Physical chemistry ofairborne sea salt particles and their components, J. Phys. Chem.A, 104, 11463–11477,doi:10.1021/Jp002968n, 2000.
Flanner, M. G., Zender, C. S., Randerson, J. T., and Rasch,P. J.: Present-day climate forcing and response from blackcarbon in snow, J. Geophys. Res.-Atmos., 112, D11202,doi:10.1029/2006jd008003, 2007.
Flanner, M. G., Zender, C. S., Hess, P. G., Mahowald, N. M.,Painter, T. H., Ramanathan, V., and Rasch, P. J.: Spring-time warming and reduced snow cover from carbonaceousparticles, Atmos. Chem. Phys. Discuss., 8, 19819–19859,doi:10.5194/acpd-8-19819-2008, 2008.
Flyger, H., Heidam, N. Z., Hansen, K. A., Rasmussen, L., andMegaw, W. J.: Background Levels of the Summer TroposphericAerosol and Trace Gases in Greenland, J. Aerosol. Sci., 11, 95–110, 1980.
Frossard, A. A., Shaw, P. M., Russell, L. M., Kroll, J. H., Cana-garatna, M. R., Worsnop, D. R., Quinn, P. K., and Bates, T. S.:Springtime Arctic haze contributions of submicron organic par-ticles from European and Asian combustion sources, J. Geophys.Res., 116, D05205,doi:10.1029/2010jd015178, 2011.
Garrett, T. J. and Zhao, C. F.: Increased Arctic cloud longwaveemissivity associated with pollution from mid-latitudes, Nature,440, 787–789,doi:10.1038/Nature04636, 2006.
Gautier, D. L., Bird, K. J., Charpentier, R. R., Grantz, A., House-knecht, D. W., Klett, T. R., Moore, T. E., Pitman, J. K., Schenk,C. J., Schuenemeyer, J. H., Sorensen, K., Tennyson, M. E.,Valin, Z. C., and Wandrey, C. J.: Assessment of Undiscov-ered Oil and Gas in the Arctic, Science, 324, 1175–1179,doi:10.1126/science.1169467, 2009.
Gribble, G. J.: The natural production of organobromine com-pounds, Environ. Sci. Pollut. R, 7, 37–49, 2000.
Hansen, J. and Nazarenko, L.: Soot climate forcing via snowand ice albedos, P. Natl. Acad. Sci. USA, 101, 423–428,doi:10.1073/pnas.2237157100, 2004.
Heidam, N. Z., Wahlin, P., and Christensen, J. H.: Troposphericgases and aerosols in northeast Greenland, J. Atmos. Sci., 56,261–278, 1999.
Heidam, N. Z., Christensen, J., Wahlin, P., and Skov, H.: Arctic at-mospheric contaminants in NE Greenland: levels, variations, ori-gins, transport, transformations and trends 1990–2001, Sci. TotalEnviron., 331, 5–28,doi:10.1016/j.scitotenv.2004.03.033, 2004.
Hirdman, D., Sodemann, H., Eckhardt, S., Burkhart, J. F., Jeffer-son, A., Mefford, T., Quinn, P. K., Sharma, S., Strom, J., andStohl, A.: Source identification of short-lived air pollutants inthe Arctic using statistical analysis of measurement data and par-ticle dispersion model output, Atmos. Chem. Phys., 10, 669–693,doi:10.5194/acp-10-669-2010, 2010.
Hopke, P. K.: Recent developments in receptor modeling, J.Chemometr., 17, 255–265,doi:10.1002/Cem.796, 2003.
Impey, G. A., Shepson, P. B., Hastie, D. R., Barrie, L. A., and An-lauf, K. G.: Measurements of photolyzable chlorine and bromineduring the Polar sunrise experiment 1995, J. Geophys. Res.-Atmos., 102, 16005–16010, 1997.
Impey, G. A., Mihele, C. M., Anlauf, K. G., Barrie, L. A.,Hastie, D. R., and Shepson, P. B.: Measurements of Photolyz-able Halogen Compounds and Bromine Radicals During thePolar Sunrise Experiment 1997, J. Atmos. Chem., 34, 21–37,doi:10.1023/a:1006264912394, 1999.
IPCC: Summary for Policymakers, in: Climate Change 2007: ThePhysical Science Basis. Contribution of Working Group I to theFourth Assessment Report of the Intergovernmental Panel onClimate Change, edited by: Solomon, S., Qin, D., Manning, M.,Chen, Z., Marquis, M., Averyt, K. B., Tignor, M., and Miller, H.L., Cambridge University Press, Cambridge, United Kingdom,New York, NY, USA, 2007.
Iversen, T.: On the Atmospheric Transport of Pollution to the Arctic,Geophys. Res. Lett., 11, 457–460, 1984.
Kaye, G. W. C. and Laby, T. H.: Tables of physical and chemicalconstants and some mathematical functions, 12th edn., Long-mans, London, New York, viii, 231 pp., 1959.
Klonecki, A., Hess, P., Emmons, L., Smith, L., Orlando, J., andBlake, D.: Seasonal changes in the transport of pollutants into theArctic troposphere-model study, J. Geophys. Res.-Atmos., 108,8367,doi:10.1029/2002JD002199, 2003.
www.atmos-chem-phys.net/13/35/2013/ Atmos. Chem. Phys., 13, 35–49, 2013
48 Q. T. Nguyen et al.: Source apportionment of particles at Station Nord, North East Greenland
Lewis, C. W., Baumgardner, R. E., Stevens, R. K., Claxton, L. D.,and Lewtas, J.: Contribution of Woodsmoke and Motor-VehicleEmissions to Ambient Aerosol Mutagenicity, Environ. Sci. Tech-nol., 22, 968–971, 1988.
Li, S. M. and Barrie, L. A.: Biogenic Sulfur Aerosol in the ArcticTroposphere .1. Contributions to Total Sulfate, J. Geophys. Res.-Atmos., 98, 20613–20622, 1993.
Li, C. and Cornett, J.: Increased zinc concentrations in the CanadianArctic air, Atmospheric Pollution Research, 2, 45–48, 2011.
Maenhaut, W. and Cornille, P.: Trace-Element Composition andOrigin of the Atmospheric Aerosol in the Norwegian Arctic, At-mos. Environ., 23, 2551–2569, 1989.
Mcconnell, J. C., Henderson, G. S., Barrie, L., Bottenheim, J.,Niki, H., Langford, C. H., and Templeton, E. M. J.: Photochem-ical Bromine Production Implicated in Arctic Boundary-LayerOzone Depletion, Nature, 355, 150–152, 1992.
Morawska, L. and Zhang, J. F.: Combustion sources of particles. 1.Health relevance and source signatures, Chemosphere, 49, 1045–1058, 2002.
Napari, I., Kulmala, M., and Vehkamaki, H.: Ternary nucleation ofinorganic acids, ammonia, and water, J. Chem. Phys., 117, 8418–8425,doi:10.1063/1.1511722, 2002.
Odemark, K., Dalsoren, S. B., Samset, B. H., Berntsen, T. K., Fu-glestvedt, J. S., and Myhre, G.: Short-lived climate forcers fromcurrent shipping and petroleum activities in the Arctic, Atmos.Chem. Phys., 12, 1979–1993,doi:10.5194/acp-12-1979-2012,2012.
Pacyna, J. M., Vitols, V., and Hanssen, J. E.: Size-DifferentiatedComposition of the Arctic Aerosol at Ny-Alesund, Spitsbergen,Atmos. Environ., 18, 2447–2459, 1984.
Possanzini, M., Buttini, P., and Dipalo, V.: Characterization of a Ru-ral Area in Terms of Dry and Wet Deposition, Sci. Total Environ.,74, 111–120,doi:10.1016/0048-9697(88)90132-5, 1988.
Paatero, P.: Least squares formulation of robust non-negative factoranalysis, Chemometr. Intell. Lab., 37, 23–35, 1997.
Quinn, P. K., Miller, T. L., Bates, T. S., Ogren, J. A., Andrews,E., and Shaw, G. E.: A 3-year record of simultaneously mea-sured aerosol chemical and optical properties at Barrow, Alaska,J. Geophys. Res.-Atmos., 107, 4130,doi:10.1029/2001jd001248,2002.
Quinn, P. K., Shaw, G., Andrews, E., Dutton, E. G., Ruoho-Airola, T., and Gong, S. L.: Arctic haze: current trends andknowledge gaps, Tellus B, 59, 99–114,doi:10.1111/j.1600-0889.2006.00238.x, 2007.
Quinn, P. K., Bates, T. S., Baum, E., Doubleday, N., Fiore, A. M.,Flanner, M., Fridlind, A., Garrett, T. J., Koch, D., Menon, S.,Shindell, D., Stohl, A., and Warren, S. G.: Short-lived pollu-tants in the Arctic: their climate impact and possible mitigationstrategies, Atmos. Chem. Phys., 8, 1723–1735,doi:10.5194/acp-8-1723-2008, 2008.
Sander, R. and Bottenheim, J.: A compilation of tropospheric mea-surements of gas-phase and aerosol chemistry in polar regions,Earth Syst. Sci. Data Discuss., 5, 585–705,doi:10.5194/essdd-5-585-2012, 2012.
Schauer, J. J., Rogge, W. F., Hildemann, L. M., Mazurek, M. A.,and Cass, G. R.: Source apportionment of airborne particulatematter using organic compounds as tracers, Atmos. Environ., 30,3837–3855, 1996.
Shindell, D. T., Chin, M., Dentener, F., Doherty, R. M., Faluvegi, G.,Fiore, A. M., Hess, P., Koch, D. M., MacKenzie, I. A., Sander-son, M. G., Schultz, M. G., Schulz, M., Stevenson, D. S., Teich,H., Textor, C., Wild, O., Bergmann, D. J., Bey, I., Bian, H., Cuve-lier, C., Duncan, B. N., Folberth, G., Horowitz, L. W., Jonson, J.,Kaminski, J. W., Marmer, E., Park, R., Pringle, K. J., Schroeder,S., Szopa, S., Takemura, T., Zeng, G., Keating, T. J., and Zu-ber, A.: A multi-model assessment of pollution transport to theArctic, Atmos. Chem. Phys., 8, 5353–5372,doi:10.5194/acp-8-5353-2008, 2008.
Sholkovitz, E. R., Sedwick, P. N., and Church, T. M.: Influence ofanthropogenic combustion emissions on the deposition of solubleaerosol iron to the ocean: Empirical estimates for island sites inthe North Atlantic, Geochim. Cosmochim. Ac., 73, 3981–4003,doi:10.1016/j.gca.2009.04.029, 2009.
Simpson, W. R., von Glasow, R., Riedel, K., Anderson, P., Ariya,P., Bottenheim, J., Burrows, J., Carpenter, L. J., Frieß, U., Good-site, M. E., Heard, D., Hutterli, M., Jacobi, H.-W., Kaleschke,L., Neff, B., Plane, J., Platt, U., Richter, A., Roscoe, H., Sander,R., Shepson, P., Sodeau, J., Steffen, A., Wagner, T., and Wolff,E.: Halogens and their role in polar boundary-layer ozone de-pletion, Atmos. Chem. Phys., 7, 4375–4418,doi:10.5194/acp-7-4375-2007, 2007.
Skov, H., Christensen, J. H., Goodsite, M. E., Heidam, N. Z.,Jensen, B., Wahlin, P., and Geernaert, G.: Fate of elemental mer-cury in the arctic during atmospheric mercury depletion episodesand the load of atmospheric mercury to the arctic, Environ. Sci.Technol., 38, 2373–2382,doi:10.1021/Es030080h, 2004.
Skov, H., Wahlin, P., Christensen, J., Heidam, N. Z., andPetersen, D.: Measurements of elements, sulphate andSO2 in Nuuk Greenland, Atmos. Environ., 40, 4775–4781,doi:10.1016/j.atmosenv.2006.03.057, 2006.
Song, C. H. and Carmichael, G. R.: The aging process of naturallyemitted aerosol (sea-salt and mineral aerosol) during long rangetransport, Atmos. Environ., 33, 2203–2218,doi:10.1016/S1352-2310(98)00301-X, 1999.
Stohl, A.: Characteristics of atmospheric transport into theArctic troposphere, J. Geophys. Res.-Atmos., 111, D11306,doi:10.1029/2005jd006888, 2006.
Sumner, A. L. and Shepson, P. B.: Snowpack production offormaldehyde and its effect on the Arctic troposphere, Nature,398, 230–233, 1999.
Sverdrup, H. U., Johnson, M. W., and Fleming, R. H.: The oceans,their physics, chemistry, and general biology, Prentice-Hall, inc.,New York,, x p., 1 l., 1087 p. incl. illus., tables, diagrs. charts(part fold.) 1942.
Viana, M., Kuhlbusch, T. A. J., Querol, X., Alastuey, A., Harri-son, R. M., Hopke, P. K., Winiwarter, W., Vallius, A., Szidat, S.,Prevot, A. S. H., Hueglin, C., Bloemen, H., Wahlin, P., Vecchi,R., Miranda, A. I., Kasper-Giebl, A., Maenhaut, W., and Hitzen-berger, R.: Source apportionment of particulate matter in Europe:A review of methods and results, J. Aerosol Sci., 39, 827–849,doi:10.1016/j.jaerosci.2008.05.007, 2008.
Wang, D. and Sanudo Wilhelmy, S. A.: Vanadium speciationand cycling in coastal waters, Mar. Chem., 117, 52–58,doi:10.1016/j.marchem.2009.06.001, 2009.
Wang, Q., Jacob, D. J., Fisher, J. A., Mao, J., Leibensperger, E. M.,Carouge, C. C., Le Sager, P., Kondo, Y., Jimenez, J. L., Cubi-son, M. J., and Doherty, S. J.: Sources of carbonaceous aerosols
Atmos. Chem. Phys., 13, 35–49, 2013 www.atmos-chem-phys.net/13/35/2013/

Q. T. Nguyen et al.: Source apportionment of particles at Station Nord, North East Greenland 49
and deposited black carbon in the Arctic in winter-spring: impli-cations for radiative forcing, Atmos. Chem. Phys., 11, 12453–12473,doi:10.5194/acp-11-12453-2011, 2011.
Wahlin, P.: COPREM – A multivariate receptor model witha physical approach, Atmos. Environ., 37, 4861–4867,doi:10.1016/j.atmosenv.2003.08.032, 2003.
Xie, Y. L., Hopke, P. K., Paatero, P., Barrie, L. A., and Li, S. M.:Identification of source nature and seasonal variations of arcticaerosol by positive matrix factorization, J. Atmos. Sci., 56, 249–260, 1999.
www.atmos-chem-phys.net/13/35/2013/ Atmos. Chem. Phys., 13, 35–49, 2013