sounds for system monitoring
DESCRIPTION
The aim of this project is to design and develop a program that uses different sonification techniques to monitor various aspects of a computers’ system. System monitors are used to monitor multiple system resources such as a computers’ Central Processing Unit (CPU) usage, memory usage and network usage. System monitors are useful as they allow the user to keep track of the computers performance. Sonification is the use of non-speech audio to convey information. This project will aim to implement a system-monitoring program, which uses different sonification techniques to represent the information gathered from the monitor.TRANSCRIPT

Sounds For System Monitoring
Final Year Project Final Report
Niall Heffernan
A thesis submitted in part fulfilment of the degree of BA (Hons) in Computer Science with the supervision of Dr. Chris Bleakley
School of Computer Science and Informatics
University College Dublin
05 May 2011
Project Specification The goal of this project is to develop a program, which will use to sound to inform the user about the current state of the system. The advantage of using sound over graphs and numbers is that users can do something else (e.g. word processing or email) while still getting some information on the state of the system.
Mandatory: Write and test a program to: *Repeatedly read one item of status information from a PC. For example, possibly:
• Memory usage • CPU usage • Network usage
*Generate a sound in real-time, which represents the level of the chosen status item. For example, possibly:
• Indicate memory usage by the loudness of a rumbling sound • Indicate CPU usage by the speed of a ticking sound • Indicate network usage by bell rings
*Provide a graphical user interface, which allows the sound to be switched on and off and the volume adjusted Assess the effectiveness and usability of the program by user survey Discretionary: Increase the number of items being monitored to four. Use different sonification techniques for each. Exceptional: Provide a graphical user interface, which allows the user to associate monitoring items with various sonification techniques. Extend the program to monitor several status items simultaneously.

Abstract The aim of this project is to design and develop a program that uses different sonification techniques to monitor various aspects of a computers’ system. System monitors are used to monitor multiple system resources such as a computers’ Central Processing Unit (CPU) usage, memory usage and network usage. System monitors are useful as they allow the user to keep track of the computers performance. Sonification is the use of non-speech audio to convey information. This project will aim to implement a system-monitoring program, which uses different sonification techniques to represent the information gathered from the monitor.

Table of Contents 1 Introduction ................................................................................................................. 6
1.1 Project Description ......................................................................................................... 6
1.2 Structure of Report ......................................................................................................... 7
2 Background Research ................................................................................................ 7
2.1 Sonification ..................................................................................................................... 7
2.1.1 Applications of Sonification .............................................................................. 8
2.1.2 Sonification Techniques ................................................................................... 9
2.1.3 Sonification Tools and Software ...................................................................... 9
2.2 System Monitoring ....................................................................................................... 10
2.2.1 Existing Applications ...................................................................................... 10
2.2.2 System Monitoring APIs ................................................................................ 11
2.3 JavaSound and JFugue ............................................................................................... 11
3 Approach ................................................................................................................... 13
3.1 Plan Outline .................................................................................................................. 13
3.2 Design Issues ............................................................................................................... 14
4 Final Design and Implementation ............................................................................. 15
4.1 Final Design ................................................................................................................. 15
4.2 Play Class .................................................................................................................... 16
4.3 CPU Gatherer ............................................................................................................... 16
4.4 Memory Gatherer ......................................................................................................... 17
4.5 Process Counter ........................................................................................................... 17
4.6 Uptime .......................................................................................................................... 18
4.7 GUI ............................................................................................................................... 18
5 Testing and Evaluation ............................................................................................. 19
5.1 CPU .............................................................................................................................. 19

5.2 Total Processes ............................................................................................................ 21
5.3 Memory ........................................................................................................................ 22
6 Conclusion and Future Work .................................................................................... 24
6.1 Acknowledgments ........................................................................................................ 24
7 References ................................................................................................................ 25

6 of 26 05 May 2011
1 Introduction
1.1 Project Description A system-monitoring program will be developed to monitor the performance of multiple computer resources, such as CPU usage, network usage and memory usage. The data retrieved from this program will be presented to the user through the use of sonification, which is the use of non-speech audio to convey information [7]. The purpose of this is to give the user regular feedback on how their system is performing without taking the user away from their current tasks.
System monitoring is very useful as it informs the user on how there computer is performing allowing them to make changes to their system in order to improve performance such as closing programs, which are not being using in order to free up RAM allowing the computer to work faster. The resulting program that will be created will use different sounds to represent data collected from monitoring the system. The sounds will be generated using .wav files, these files will then be manipulated within the program to adjust to changes in system status.
Many system-monitoring programs represent data retrieved through the visual mediums of graphs and tables, which contain numbers and percentages. These methods are effective and do accurately represent the data obtained however if a user is working on an essay or reading an online article it is not practical to be constantly referring back to a graph or chart for the purposes of monitoring the system. The aim of this project is to create a monitoring system that runs in the background that constantly alerts the user of the state of the system without the user being detracted from their current activities.
There are few applications that display system information through the use of audio in existence. One such application is Heart Monitor [14] that exclusively monitors a systems CPU usage. The information provided by the application is then displayed to the user in sound that resembles a beating heart. The faster the heartbeats relates to a higher percentage in CPU usage. While the application provides the user with system information using audio it is limited to only providing CPU usage. This project will look to develop on the concept used in Heart Monitor and hopes to build on this technique to provide auditory graphs to display various system status information.
The language that will be used throughout this project is Java. This language was selected because it has many classes that support sound processing and management of sound files. There are also many libraries and API’s that can be added to existing classes that provide methods for collecting system status information. The Eclipse IDE is the environment in which the program will be created.

7 of 26 05 May 2011
1.2 Structure of Report The purpose of this report is to describe the finished project and the preparation that has been carried out to help aid the development of the project.
The introduction is intended to provide an overall description of the project, which outlines the goals and purposes behind the project.
The following chapter contains all the background research that was carried out in preparation for the project. It will discuss the use and effectiveness of system monitors not only in computing but also in other areas such as medicine. It will also look at different applications that exist already and a justification of the importance of the application being developed as a part of this project. The background research section will also describe sonification and its application in everyday life. It will also look at different sonification techniques used in various applications and will also evaluate their effectiveness, research papers that study sonification will be referred to throughout this report. The use of WAV files and the Java Sound class will also be examined within this section.
The third chapter of this report will outline the approach that was taken in order to complete the project including a plan outline that highlights the key milestones that needed to be achieved during the development of the final application. This section will also discuss the initial design overview of the project. A more detailed discussion of the final design and implementation is discussed in chapter 4 of the report.
The next section will examine results and outcomes that have come from testing and evaluating the project. This section will also look at results from a user survey that was carried out.
The conclusion will examine critically the progress that has been made in this project and will examine future work that may be carried out in this subject area. An assessment of challenges, difficulties and successes will also be provided within this section.
2 Background Research In order to get a better understanding of what should be achieved with this project research was carried out. Previous research papers and reports into the area of sonification have been used to gain a deeper insight into the application and benefits of this method.
2.1 Sonification Sonification is the use of non-speech audio to convey information [7]. It can and is used in many different areas as an alternative to visual information. This section will look at the advantages sonification can have over visualisation, it will also look at some sonification techniques and successful applications of sonification in different disciplines.
Sonification is useful in computing disciplines as it allows the user to receive information from their computer without them having to close or minimize windows. With computers getting smaller to the point of handhelds the screen is also getting smaller meaning screen space is becoming more and more valuable, by using sonification to present the user with information means no screen space will be used allowing more space for visual applications.

8 of 26 05 May 2011
The use of audio information over visual information has many advantages. The visual system can only give detailed information about a small area of focus whereas the auditory system can provide general information from anywhere, even outside our peripheral vision [2]. Sound can be heard by humans and animals from any direction such as from behind, above, side to side whereas visual representations can only be seen within ones direct or peripheral vision. This makes sonification more versatile in terms of presenting information. Unlike sound, visual sources are ignorable meaning it is easy to miss something even when you are looking directly at it especially if there is a brief change in the information being visualised. It is very difficult to ignore a change in sound.
The use of sonification over speech audio has many advantages one being the shortness in length of non-speech sounds. Non-speech sounds can be shorter meaning they can be heard more rapidly this results in the user gaining more information faster than speech outputs. Speech audio is a lot slower in presenting information, as a user has to listen to the message from start to finish and then comprehend some words before the message is understood. With speech, much like text, some information can take multiple combinations of words to describe something simple which can take time, also if the information is ever changing then speech output may not be able to keep up.
Since sonification is interdisciplinary the next section will look at different applications and devices that use sonification techniques to convey information in multiple disciplines.
2.1.1 Applications of Sonification
Sonification has been and still is used in a multitude of disciplines such as science, engineering, medicine, oceanography and computer science. This section will look at key tools, technologies and applications that use sonification techniques in these different areas.
The Geiger counter is one of the first and most primitive applications of sonification [11]. It is a device that is used to detect radiation, when radiation is detected the device ‘clicks’ at regular intervals, the more radiation detected the quicker the rate of ‘clicks’. Studies and experiments have shown that detecting radiation levels using audio is more effective than using visual displays [11] applications such as this take advantage of a person’s ability to hear the smallest changes in audio.
In medicine sonification is widely used as a means of monitoring different areas of the body. One device that is used today by surgeons and medical professionals is the Pulse-oximeter. The pulse-oximeter monitors the levels of oxygen in a patient’s blood, it produces a tone that changes in pitch with the level of oxygen [6]. This device allows a surgeon to monitor critical information regarding the patient but also allows them to focus entirely on the surgery. Other medical devices that incorporate sonification are heart rate monitors that display the rate of the heart beat using a sequence of ‘beeps’ the more frequent the beeps are, the faster your heart is beating. Primarily fitness enthusiasts who need to monitor their heart when carrying out training use these. Many heart monitors come with a visual display that graphs the heart beat but when taking part in an activity like running or training for a marathon the runner would not want to break stride to check their heart rate, sonification allows them to keep to a pace while also monitoring their heart.
In fishing and naval activities SONAR (SOund Navigation And Ranging) is a technique that has been used since the early 1900’s by fishermen and the Navy as away of detecting how far objects such as mines, submarines, wreckage are away under water. A burst of sound is sent such as a ‘ping’ the echo from where the sound bounces off the nearest object is listened for [8]. The distance of the object is calculated by dividing the elapsed time by twice the speed of sound. This

9 of 26 05 May 2011
technology was very useful during World War I and World War II as it helped detect enemy submarines and underwater mines.
2.1.2 Sonification Techniques
This section will look at the different techniques are used in sonification. A key factor in what techniques to use comes down to the study of psychoacoustics which is how sound is perceived. If psychoacoustics is not considered when choosing sounds for sonification could lead to the user being unable to remember the sounds or differentiate between sounds [2]. Different factors need to be taken into account when dealing with psychoacoustics such as the frequency of the sound, which is the number of times a sound wave will repeat itself; the pitch and loudness of a sound and the timbre of a sound, which is the quality of the sound [2]. It helps a listener differentiate between two sounds, which have the same pitch and loudness. It gives the listener the ability to know which is the guitar when it is played at the same time as a piano at the same loudness and pitch.
SonicFinder [5] is an application that was developed my Apple in the late 1980s. SonicFinder makes use of Auditory Icons, which uses everyday sounds to represent actions and objects in an interface [2]. SonicFinder is a perfect example of how psychoacoustics is used in sonification. The application assigned sounds to various icons and actions within the interface. Some examples of the use of sonification techniques within SonicFinder are:
• When a folder is clicked in an interface a sound of paper was played,
• A wooden sound was assigned to files and metal sounds were assigned to applications.
• When a file or application is opened a “whooshing” sound is played [4].
• If the user drags a file across the screen a scraping sound is returned.
Audio was also applied to events that happen within the interface such as the act of copying a file. The sound of a liquid being poured into container was used for copying, the rise in pitch represent the progress in copying [2]. The sounds used in this application clearly relate to icons and events, these sounds are unambiguous and represent actions taken by the user extremely well.
2.1.3 Sonification Tools and Software There is few sonification tools and software available that assist in the application of sonification as a way to display data. The few sonification toolkits that are available are not cross platform or rely on specific hardware.
MUSART (MUSical Audio transfer function Real-time toolkit) [15] is a sonification toolkit that uses various audio transfer functions to map sound to datasets. This tool allows a user to ‘view’ various datasets through sound. The user can select how they want their dataset to be mapped by selecting pitch, timbre, loudness, frequency and other elements. They can also choose to emphasize certain data items of a set if it has more importance. Software like MUSART is used in the area of seismology especially in mapping sound to seismic data as a way to detect hidden patterns and anomalies [15] that could be difficult to see by eye. A specific example is the use of MUSART to detect faults in rocks. MUSART applies a drumbeat to the rock. Where a fault is detected there is a rapid beat played, when no fault is detected the rhythm slows down. This is

10 of 26 05 May 2011
useful for seismologists as it can allow them to monitor multiple data simultaneously by applying different sound maps to different datasets.
MUSART is written in C++ making it a platform-dependant application [15]. Sonification Sandbox [16] is an application written in Java that takes concepts and other techniques from MUSART but with the use of the Java Virtual Machine, sonification sandbox can be used on multiple platforms. The sonification sandbox allows users to import CSV files from external software like Microsoft Excel and create auditory graphs from these files. Users can map the datasets to dimensions such as timbre and loudness. Visual graphs can be exported from Sandbox in various formats such as sound files, images and data files. While Sonification Sandbox is a very useful application for creating auditory graphs from data sets it can also be seen as a stepping stone for further research into the area of creating auditory graphs to represent data.
2.2 System Monitoring This section will focus on different system monitors that exist already for different platforms. The idea behind this is to gain an understanding of how different system monitors perform and also look at the usability of these applications and how clearly the results are displayed. This research was carried out with the hope of accurately developing a program that can satisfy a users needs when using a system monitor while also displaying the information gathered using different sonification techniques.
2.2.1 Existing Applications There are many existing system monitoring applications that accurately monitor all of a systems resources such as a systems CPU, network usage, memory usage and disk storage. Mac computers contain a program called Activity Monitor, which gathers information regarding the computers performance through the medium of graphs and numbers. While this is a good application for monitoring the state of the system there still is the problem that the user still needs to switch between windows to view the application. The same can be said for Task Manager, which is the Windows equivalent of Mac’s Activity Monitor. PerfMon offers more to the user than Activity Monitor such as the ability to monitor multiple computers both local and remote. Both programs provide clear and easy to read information regarding the computers performance but don’t offer the user any way of viewing this information without having to change windows.
There are programs available that offer alternative ways of keeping track of a computers status without interrupting the users current tasks; one such application is iStat Menus [1], which was developed by Bjango is a free application exclusively for mac, it is available to download from www.bjango.com. iStat Menus is a system monitor that is constantly running and is viewable in the menu bar on the screen (see figure.1) so no matter what the user is working on they will always be able to keep track of their systems performance without changing windows.
Figure 1. iStat Menus application running in menu bar

11 of 26 05 May 2011
Heart Monitor [14] is an application available to Mac users that exclusively monitors a systems CPU usage displaying the information both visually and audibly. When the application is running a moving image of a beating heart is displayed on the screen, the rate at which the heart beats depends on the CPU usage (faster beat – higher load average). The user also has a choice of turning on sound where the beats of the heart can be heard. While this application successfully applies a sonification technique to monitor a part of the system it is limited as it only monitors the CPU usage of the system. The application being developed, which is the subject of this report, will implement sonification techniques to monitor various aspects of the system not just one exclusive aspect.
2.2.2 System Monitoring APIs An important area that was researched for this project was the availability of system monitoring APIs that can be implemented in Java. This is important because when developing the program an API that can provide methods that can satisfy the needs of the program reliably is needed. For this project an API that provides methods to monitor system aspects such as the CPU usage, memory usage and network usage efficiently is needed.
JSysmon [18] is an open source Java library that provides access to system monitoring information from a Java application. It is available to download freely from sourceforge.net. JSysmon supports only implementations for CPU usage and Memory usage at present, this limits it’s ability to provide a system monitoring application with enough resources to monitor information from other areas of the system such as network usage and disc space. There is very little support offered by JSysmon making it difficult to seek assistance if troubles with the library arise. It is for this reason that it was not used within this project.
The SIGAR (System Information Gatherer) API developed by Hyperic [13] is a system monitoring API that can be implement across various platforms including Linux, Windows, Mac OSX and Solaris. It provides implementations for various system data including CPU usage, Memory usage and network usage. It is a powerful API as it is implemented in the C programming language with bindings to a multitude of languages such as Python, Pearl, and Ruby and most importantly for this project, Java. These bindings allow the API to access system information regardless of the platform. There is also ample support available with the SIGAR API including forums, sample code and mailing lists. SIGARs versatility and wide availability of support have led to it being used within this project.
2.3 JavaSound and JFugue Since a large part of this project involves working with audio it is only necessary that resources should be used to manage and manipulate audio data. The audio used to sonify changes in system data must be manipulated to clearly reflect changes in system information. Java Sound is an API provided by Java that manages the input and output of audio data, this API is used to read and write audio files within the program and also to produce synthetic sounds in real time through the medium of Midi (Musical Instrument Digital Interface).
While the JavaSound API is very powerful in terms of what can be achieved in audio creation it is quite complicated for a novice to audio playback, Midi synthesis and sequencing through java. Luckily there is a vast amount of open source java libraries available one of these libraries is the JMusic [10] API. JMusic contains audio processing tools; it also contains methods that can be

12 of 26 05 May 2011
used for musical composition. JMusic is suitable for manipulating audio files such as increasing the files frequency, sample rate and volume. There is a vast amount of support available for this library including a book written by its co-creator Andrew Brown entitled “Making Music with Java” [3].
JMusic is a useful resource for manipulating audio files but can lose clarity when it comes to creating synthesised audio in real-time. Originally audio files were to be used within this project but after running multiple tests it was decided that they were not suitable the reasons for this are discussed in the following chapter.
JFugue [9] is another open source java API that wraps JavaSound MIDI methods into an easy to use, straightforward library. “A Complete Guide To JFugue” [12] is a comprehensive users manual available to download at a small cost from the website, it is full of easy to follow examples on how to synthetically generate sounds using a large array of instruments. It also provides examples on how these sounds can be manipulated (volume change, pitch change, harmonies). Its simplicity is its greatest attribute making it a perfect library for this project.
13 of 26 05 May 2011
3 Approach In order to develop an idea on how to approach the project an understanding of what should be achieved at the end. The first step in completing the project was to develop a plan that would be used to divide up the project into separate tasks and milestones. Analysing the project specifications and pinpointing key milestones achieved this.
As this project involved using sound to display information to the user, it was important to first develop a method for playing back audio using java. Once this was achieved it would give a better understanding on how to approach the rest of the project.
3.1 Plan Outline The main goal of the project specification is to outline the major requirements and goals the need to be obtained in order to complete this project. These tasks and goals were examined and by dividing these tasks and goals into smaller, achievable milestones a plan could be created. A note of key dates such as exams, deadlines was kept to make it easier to allocate sufficient time to each milestone.
In order to begin, a better understanding of the background to and applications of sonification was needed. Multiple research papers and articles were referred to during the background research section. The importance of this was to gain a better understanding of how the project was going to progress. Once relevant research was carried out, the project was divided into important milestones, which are as follows:
1) Create program that plays back audio
2) Create a program that repeatedly retrieves a piece of system information
3) Extend audio program to play back a sound repeatedly with the ability to adjust audio volume
4) Alter audio playback to reflect changes in system information
5) Design and implement Graphical User Interface
6) Add additional system information to be monitored
Time was allocated by means of a Gantt chart (Figure 2) to each of these milestones, with additional time provided for testing and evaluating each section before continuing. The goal was to have a working program for each section before moving on to the next.

14 of 26 05 May 2011
Figure 2. Gantt Chart Outlining Time Allocated To Approach Plan
3.2 Design Issues As the development of the project progressed some challenges concerning the design were faced. A re-examination of the initial design (Figure 3) and some methods was undertaken in order to improve the functionality of the system.
Figure 3. Initial Design

15 of 26 05 May 2011
The sound-processing program was designed to be able to access a database of different .wav sound files and manipulate them in multiple ways to reflect changes in system information. After extensive testing taken out on a .wav file it was decided that the use of .wav files to display system information was not a sufficient approach. In order to playback a sound file in java it needs to be read into a clip, which is a mixer input in which audio can be loaded into memory prior to playback [17]. Since a sound file needed to be played back repeatedly at very regular intervals with the possibility of changes to how its played (increase/decrease in pitch, frequency of playback, volume change) it was found that the program struggled to keep up with the constant changes as a file would needed to be loaded into memory every time it was to be played back. It was from this that it was decided that Midi would be used to generate sounds in real-time, meaning no sounds would needed to be pre-loaded into memory.
4 Final Design and Implementation
4.1 Final Design The final design of the project can be seen in Figure 4. This design outlines the main classes and methods that exist within the project. The design shows a Play class that can be called anywhere within the system to play sounds where necessary. The Play class relies on the JFugue [9] library JAR file to play audio. Since all sounds were being generated in real time and discarded once they have been played means no sounds are being stored in memory, eliminating any need for a database.
Figure 4. Final System Design

16 of 26 05 May 2011
4.2 Play Class As mentioned above, the Play class uses the JFugue [9] library to generate sound. The method PlayNote() creates a new Player() object, which is native to JFugue. The Player object prepares a pattern that is turned into music by a Renderer. PlayNote() takes in a string as an argument, the JFugue library then parses the string and a sound is produced. For example, to play a single ‘A’ note the user needs to call PlayNote(“A”); within a main method, the resulting output is an A note played on a piano which is the default instrument. The JFugue library contains a large array of instruments and sounds that can be called within the PlayNote() method. The Play class is used throughout the entire system and is a fundamental component of the entire project.
4.3 CPU Gatherer The Cpu class uses the SIGAR library [13] to gather information regarding the systems CPU usage; it also displays information about the machine that is running the program. The SysInfo() gathers information regarding the machine such as the machines vendor, model and total number of CPUs that exist on the machine, on initialization of the GUI this information is displayed to the user through a JTextPane.
The CpuInfo() method returns a double; this double is the percentage CPU usage of the system. The CPU percentage ranges from 0-100%, in order to accurately show changes in the state of the systems CPU the range was divided into 4 sub-ranges which can be seen in Table 1. For every sub-region a chord is assigned, the chord is played periodically. If the CPU percentage leaves a sub-region then a new chord, that reflects that sub-region, is played.
Table 1. Chords assigned to CPU sub-regions
Instrument CPU Rate (%) Musical Chord
Piano
0-25% Emaj
25-50% F#maj
50-75% Gmaj
75-100% Amaj

17 of 26 05 May 2011
In order to gather the CPU information periodically a timer method called CpuTimer() was created; this method uses Javas Timer class to schedule tasks. The method takes in two integer values, the first integer specifies how long to wait before the timer begins, the second integer specifies how long each interval should be. On execution of this timer method the systems CPU usage is printed out every two seconds along with the chord that accompanies it. Each class in the project uses a similar timer method.
4.4 Memory Gatherer The Memory class is designed to gather information regarding the percentage of the total amount of memory being used by the system. Much like in the CPU program the information is divided up into ranges the full list of ranges can be seen in Table 2. The sonification technique used to display the information to the user involves a two-note pattern being played periodically, if the memory usage increases the octave of the pattern also increases by one, the higher the memory usage the higher the pitch of the two-note pattern. Similar to the CPU class the Memory class also uses a Timer method to monitor the memory usage periodically.
Table 2. Notes and Octaves assigned to memory information
4.5 Process Counter The Process class keeps count of the number of processes on the system. Too many running processes can slow the performance of a computer; this class displays the number of processes currently running on the machine in the JTextPanel in the GUI. Once a new process starts running a two-note low-to-high in pitch sequence of “dos” will play alerting the user that the number of running processes has increased. To mirror this technique a two-not high-to-low in pitch sequence of “dos” will play alerting the user that the number of processes has decreased. Many applications can invoke multiple processes when in a running state, with the Process() class the user is able to know how many processes begin to run on the start up of a program by the sound of low-to-high in pitch “dos” that occur. The user will then know to shut the program down once they have finished with it, freeing up vital processing power.
Instrument Memory Usage (%)
Note Pattern and Octave
Synth Bass
0-25% C#-E (Octave 2)
25-50% C#-E (Octave 3)
50-75% C#-E (Octave 4)
75-100% C#-E (Octave 5)

18 of 26 05 May 2011
4.6 Uptime The uptime of a computer is a measure of the total time a computer has been running for without any downtime. It is important to give a machine some downtime, as some updates that can be critical to an operating system’s performance require reboots. Uptime can also be used to measure machines reliability by showing how long the machine can run without crashing. The uptime class monitors the machines uptime and displays the time textually within the GUIs JTextPanel. To represent every second passed a ticking noise is presented to the user, after every minute passed the sound of a bird chirping is then played, once an hour has passed a trumpet pattern is played.
4.7 GUI With keeping in line with the project specifications a Graphical User Interface (GUI) was designed to allow users the ability to easily choose what aspect of the system they would like to monitor. The ‘start’ button initializes the application prompting the display of the systems information within the text field (see Figure 5.).
Figure 5. System Monitor Graphical Interface
Once the application has been initialized the user can then choose what aspect of the system would they like to monitor by selecting its radio button. The radio buttons are all part of a button group meaning that only one can be selected at any one time. Along with displaying system information through various sonification techniques the application will also display the information visually within the text field. The GUI also provides a slider for controlling the volume of the application and a ‘mute’ button to turn the sound off completely.
19 of 26 05 May 2011
5 Testing and Evaluation
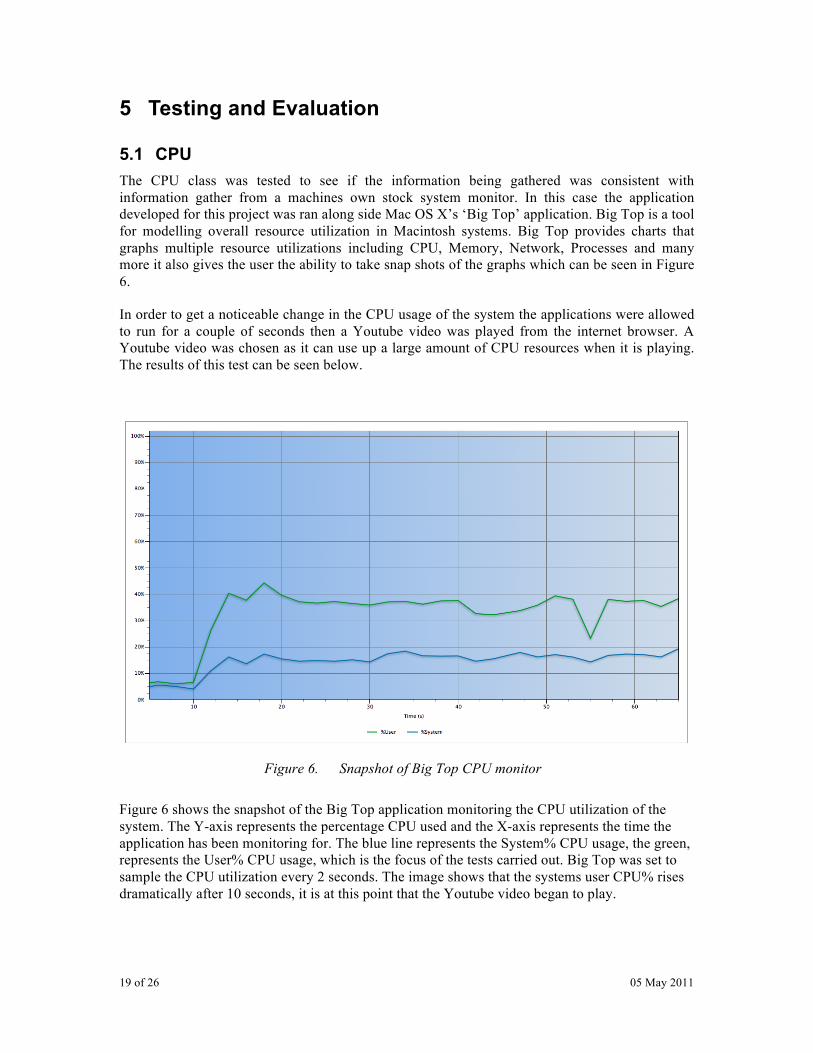
5.1 CPU The CPU class was tested to see if the information being gathered was consistent with information gather from a machines own stock system monitor. In this case the application developed for this project was ran along side Mac OS X’s ‘Big Top’ application. Big Top is a tool for modelling overall resource utilization in Macintosh systems. Big Top provides charts that graphs multiple resource utilizations including CPU, Memory, Network, Processes and many more it also gives the user the ability to take snap shots of the graphs which can be seen in Figure 6.
In order to get a noticeable change in the CPU usage of the system the applications were allowed to run for a couple of seconds then a Youtube video was played from the internet browser. A Youtube video was chosen as it can use up a large amount of CPU resources when it is playing. The results of this test can be seen below.
Figure 6. Snapshot of Big Top CPU monitor
Figure 6 shows the snapshot of the Big Top application monitoring the CPU utilization of the system. The Y-axis represents the percentage CPU used and the X-axis represents the time the application has been monitoring for. The blue line represents the System% CPU usage, the green, represents the User% CPU usage, which is the focus of the tests carried out. Big Top was set to sample the CPU utilization every 2 seconds. The image shows that the systems user CPU% rises dramatically after 10 seconds, it is at this point that the Youtube video began to play.

20 of 26 05 May 2011
Figure 7. Chart of CPU utilization for Project Application
A similar trend can be seen in Figure 7, which shows the systems user CPU% utilization gathered by the SIGAR powered java application developed for this project. Figure 7 shows the same dramatic increase in CPU usage roughly 10 seconds after deployment of the program, the trend also follows the Big Top snapshot nearly identically. The two applications differ slightly in percentages this is a result of the rounding off of the CPU% utilization within the Java application. It is clear to see that the system monitoring application developed for this project is capable of accurately retrieving system information.

21 of 26 05 May 2011
5.2 Total Processes The next step was to test the accuracy of the developed application retrieving the number of processes. This was achieved by using a similar technique used for testing the CPU class. Like in the other test the java application was deployed simultaneously as Big Top for a short period of time. Once the applications were running different programs on the machine were executed in order to increase the number of running processes on the system. The results can be seen below.
Figure 8. Big Top snapshot of running processes
Figure 8 shows the snapshot from Big Top graphing the number of running processes with the Y-axis representing the number of processes while the X-axis represents the time. The black line represents the number of running processes, the red line represents the number of sleeping processes and the blue line in the image represents the total number of processes within the system and is the focus of this test. The image shows an increase in the number of processes close to the 25-second mark, at this time a simple text-editing program was deployed resulting in an increase in running processes. The text-editing program was then terminated roughly 20 seconds later where the image shows a decrease in the number of processes.

22 of 26 05 May 2011
Figure 9. Chart of Running Processes Collected by Project Application
Again the java system monitoring application was deployed simultaneously with Big Top. The results can be seen in Figure 9. Similarly to the CPU tests a near identical trend can be seen in the results from both applications.
5.3 Memory Again the same test as the previous two tests were run to assess the accuracy of the java system monitor against Big Top. The java program was set to monitor the systems free memory, as SIGAR doesn’t provide an option to monitor wired and active and inactive memory separately. The same testing conditions were carried out; both Big Top and the java application were deployed simultaneously and were set to sample every 2 seconds for a period of 1 minute. The results can be seen in Figure 10 and 11.
Figure 10. Snapshot of System Memory Usage from Big Top

23 of 26 05 May 2011
Figure 10 shows the systems memory usage information gathered by Big Top, the blue line shows the systems free memory and will be the focus of discussion. The image shows a decrease in free memory at the beginning of deployment cause by the opening of an application on the system and consistently stays around 9.5MB for the duration of the test. A similar pattern can be seen in Figure 11.
Figure 11. Graph of Free Memory gathered by Java Application
The results from the tests ran on the java system monitor (Figure 11) closely mirrors the results from the Big Top test. The initial drop in system memory in Figure 11 may look more dramatic than in Figure 9; this is due to the scaling of the graphs. The trend follows the same pattern as in the Big Top test, the free memory available in the system stays around the 9.5-10Mb region there are also increases and decreases in both results at the same time in the tests.

24 of 26 05 May 2011
6 Conclusion and Future Work The goal of this project was develop an application that uses sound to display information regarding the state of the system to the user.
Conducting background research proved to be very beneficial for the implementation stages of the project. Understanding the effectiveness of sonification techniques and how they have been used in other applications helped create a program that effectively alerts users to changes in system information audibly without distracting them from their visual tasks.
Chapters 3 and 4 examined the approach and implementation of the project. It was originally anticipated that some milestones of the project would take longer to complete than expected. Unfortunately unexpected problems arose throughout the project, which were not anticipated. There was not an ample amount of time set a side problems resulting in the failure to carry out a user survey assessing the effectiveness and usability of the program. However these once these problems were dealt with the project was able to progress successfully.
Chapter 5 provides results from tests that were carried out to assess the accuracy of the data being collected by the program. The test results show that the program was successful in collecting accurate data regarding system information compared to a powerful, fine tuned system monitor such as Big Top. These tests show that the information that will be displayed through the medium of sound will be accurate allowing the user the ability to make beneficial decisions regarding what is best for their system.
Further research into displaying information using sonification is needed to improve techniques that have been used in this project. Extending the program to monitor more aspects of the system and allowing the user to choose different sonification techniques or allow them to create their own can achieve this. Another approach could be linking the program to a users music library allowing the user to associate musical genres to various system information using songs of different tempo in those genres to alert changes in system information. However, with time constraints it was not possible to further develop these ideas but opens the door for future development in the area of sonification.
6.1 Acknowledgments I wish to acknowledge and thank my supervisor, Dr. Chris Bleakley, whose encouragement, guidance and support from the initial stages to the final product helped me in completing this project.
25 of 26 05 May 2011
7 References [1] Bjango. I-stat menus 3. Bjango. [Online] 2011. http://bjango.com/mac/istatmenus/.
[2] Brewster, S A. Non Speech Auditory Outputs. Human- Computer Interaction Handbook. Mahwaj : Lawrence Erlbaum Associates, 2002, pp. 220-239.
[3] Brown, A R. Making Music with Java. Brisbane : Lulu, 2005.
[4] Frohlich. Auditory Computer Human Interaction: An integrated Approach. Austria : Universitiat Wien, 2007.
[5] Gaver, W. The SonicFinder: An Interface that uses Auditory Icons. California : University of California, 1989, Human Computer Interaction, Vol. 4, pp. 67-94.
[6] Kramers, G. and Walker, B. Sonification Report: Status of the Field and Research Agenda. Santa Fe. : The International Community for Auditory Display, 1998.
[7] McGee, R. Auditory Displays and Sonification: An Introduction and Overview. California : University of California, 2009.
[8] Ridgesoft. Sonar Made Simple. Ridgesoft. [Online] 2003. [Cited: 11 April 2011.] http://www.ridgesoft.com/articles/sonar/SonarMadeSimple.pdf.
[9] Koelle, David. JFugue. JFugue. [Online] 2010. [Cited: 30 March 2011.] http://www.jfugue.org/
[10] Sorenson, A and Brown, A. jMusic - Music Composition in Java. jMusic. [Online] 2009. [Cited: 25 February 2011.] http://jmusic.ci.qut.edu.au/.
[11] Tzelgov, J., et al. Radiation Detection by Ear and Eye. 1, 1987, Human Factors, Vol. 29, pp. 87-98.
[12] Koelle, D. A Complete Guide to JFugue: Programming Music in Java. 2008.
[13] Hyperic. Hyperic API (System Information Gatherer and Reporter). Hyperic. [Online] 2010. [Cited: 1 March 2011.] http://www.hyperic.com/products/sigar.
[14] MacUpdate. Heart Moniter 1.3. MacUpdate. [Online] 2010. [Cited: 27 December 2010.]
[15] Joseph, A. J. and Lodha, S. K. MUSART: Musical Audio Transfer Function Real-Time Toolkit. Kyoto : International Conference on Audion Display, 2002.
[16] Walker, B. and Cothran, J. Sonification Sandbox: A Graphical Toolkit For
Auditory Graphs. Boston : International Conference on Auditory Display ICAD, 2003.

26 of 26 05 May 2011
[17] Sun Microsystems. Java Sound API: Programmer's Guide. California : s.n., 1999.
[18] SourceForge. JSysmon. SourceForge. [Online] 2010. [Cited: 5 January 2011.]
http://sourceforge.net/projects/jsysmon/.