sorption of sulfate on iron oxide minerals
TRANSCRIPT

SORPTION OF SULFATE ON IRON OXIDE MINERALS

SORPTION OF SULFATE ON IRON OXIDE MINERALS:
HEMATITE AND GOETHITE
By
LAURIE JEANNE TURNER
A Thesis
Submitted to the School of Graduate Studies
in Partial Fulfilment of the Requirements
for the Degree
Doctor of Philosophy
McMaster University
(c) Copyright by Laurie Jeanne Turner, December 1988

DOCTOR OF PHILOSOPHY (1988) (Geology)
mcmaster university Hamilton , Ontario
TITLE: Sorption of Sulfate on Iron Oxide Minerals: Hematite and Goethite.
AUTHOR: Laurie Jeanne Turner, B.A. (University of Maine at Farmington)
MSc. (McMaster University)
SUPERVISOR: Professor James R. Kramer
NUMBER OF PAGES: xiii, 158
i i

ABSTRACT
The influence of sulfate on terrestrial and aquatic
ecosystems depends on the mobility of the sulfate anion in
soils. This mobility is determined by several factors, one
being the types and amounts of soi 1 constituents. In this
study, several iron oxide/hydroxide minerals were evaluated
for sulfate sorption characteristics.
Hematite and goethite were synthesized and
positively identified using x-ray diffraction, mossbauer
spectroscopy and scanning electron microscopy. Mineral
surfaces were characterized using surface area and zero
point of charge measurements, infrared spectroscopy and
thermal analyses. Neutron activation and x-ray fluorescence
were used to look for impurities. Samples were compared to
a natura1 hematite sample and a synthetic jarosite.
Sorption experiments, conducted on mineral
suspensions in KNO3 media at room temperature, considered
the variables time, ionic strength, sol id:so lut ion ratio, pH
and sulfate concentrât ion. Sorption was initiated by a fast
reaction, fol lowed by a longer, slower one which reached an
apparent equilibrium in 24 hours. Sorption was unaffected
by sol id:solution ratio and decreased with ionic strength at
pH 5 for goeth i te on 1 y.
i i i

Sorption increased with increasing sulfate
concentration and decreasing pH. A sorption maximum was
reached by a I 1 minerals except synthetic hematite. Under
optimum pH and [SO4J. approximately half of the mineral
surface is covered by su1 fate ions. Sulfate was sorbed
irreversib1 y. Only a fraction of sorbed sulfate can be
desorbed, an amount which increases with pH.
Therma I analyses indicate sulfate to be strongly
bonded. The presence of four infrared bands on sulfate
treated surfaces indicate direct coordination of the anion
to the iron cation. The above evidence, including
irreversibi I ity of sorption, supports inner sphere
complexing of sulfate. Su1 fate sorption on iron
oxide/hydroxide minerals is thus a combination of
nonspecific electrostatic attraction and mono - multi ligand
exchange (including binuclear bridging) which act under
different system conditions to form the basis of sulfate
sorption behavior.
The present observations are important in model ling
of environmental systems, such as in the Direct Delayed
Response Program Model, due to the significance of
irreversibi Iity of sulfate sorption on model assumptions.
i v

acknowledgements
I wish to express appreciation to the fol lowing
persons for their assistance throughout the course of this
study:
Dr. James R. Kramer for his enthusiasm and support during
the supervision of this research.
Dr. H.D. Grundy and Dr. Ward Chesworth for their
encouragement and advice.
Jill Gleed for assisting with A.A. analyses and
chromatographic work.
Joanne Carson for her expert ice with the SEM.
Marianne Crowe for assisting with XRD analyses.
Frank Gibbs for DTA and TGA work.
Ota Mudroch for XRF analyses.
Kathleen Gracey for assisting with NAA analyses.
Ian Thompson for help with IR spectroscopy*
Dr. Tom Birchall for Mössbauer Analyses.
Jack Whorwood for printing the SEM Plates.
Kathy Teeter and Steve Davies for computer advice.
Nancy Harper and Judy Gracey for proofreading the text*
I give my sincere thanks to many friends that have
passed through the department and touched my life. Most of
all I thank my husband, Blair Lagden, whose constant
support,encouragement and optimism have enabled the
completion of this thesis.
v

TABLE OF CONTENTS
PAGE
CHAPTER 1 INTRODUCTION ................................................................ 1
I. Environmental sulfur problems in soils............. 1
A. Sulfur status of soils............................................... 1
B. Ion mobility in soils................................................. 3
C. Atmospheric deposition of H2SO4....................... 5
D. Acid sulfate soils and acid mine drainage 6
II. Summary of research objectives............................... 8
A. Substrate................................................................................. 8
B. Other phases......................................................................... 9
C. Parameters.............................................................................. 10
D. Proposal and research objectives..................... 12
CHAPTER 2 AQUEOUS CHEMISTRY OF SULFUR AND IRON............. 14
I. Aqueous chemistry of sulfur.......................................... 14
II. Aqueous chemistry of iron............................................ 15
III. Sulfur and iron...chemical relations............. 18
CHAPTER 3 LITERATURE REVIEW............................................................... 23
I. Soil research 1 iterature................................................. 23
II. Oxide research literature............................................ 27
CHAPTER 4 OXIDE SURFACE CHEMISTRY............................................... 32
I. Surface groups............................................................................ 32
II. Surface charge and adsorption.................... 33
III. Surface site/species determination.................. 37
vf

IV. Sorption models....................................................................... 38
V. Summary........................................................................................... 38
CHAPTER 5 MINERAL PREPARATION AND CHARACTERIZATION.. 42
I, Mineral preparation methods........................................... 42
II. Methods of mineral characterization.................... 44
A. Surface area...................................................................... 44
B. pH of zero point of charge (zpc).................. 46
C. X-ray diffraction analysis.................................. 49
D. Electron microscopy.................................................... 53
E. Infrared spectroscopy............................................... 54
F. Thermal analysis............................................................ 57
G. Mössbauer spectroscopy............................................ 65
H. X-ray fluorescence....................................................... 69
I. Neutron activation analysis................................ 69
J. Summary.................................................................................... 70
CHAPTER 6 SORPTION EXPERIMENTS ON IRON OXIDES................ 73
I. Exper imenta 1 procedures.................................................... 73
II. Results obtained-genera1 observations............. 74
CHAPTER 7 OTHER EXPERIMENTS............................................................... 83
I. X-ray diffraction and scanning electron
microscopy...................................................................................... 83
II. Infrared spectroscopy....................................................... 83
III. Therma 1 ana lysis................................................................. 86
IV. Mössbauer spectroscopy.................................................... 90
V. Ion concentration product............................................... 90
VI. Exchange capac i ty................................................................. 91
vi i

VII. Hydroxide release vs sulfate sorption........... 96
CHAPTER 8 MODEL OF SULFATE SORPTION ON FERRIC
OXIDES......................................................................................... 100
I. Sorption summary....................................................................... 100
A. General character i st ics.......................................... 100
B. Sorption maxima............................................................... 102
C. Isotherm comparison..................................................... 103
D. Sorption in relation to surface area.... 105
II. Other evidence.......................................................................... 106
A. OH- released / S04 sorbed = R ........................ 106
B. Sample weight loss........................................................ 107
C. Exchange capacity.......................................................... 109
D. Summary.................................................................................... 110
III. Sorption behavior models................................................ Ill
CHAPTER 9 ENVIRONMENTAL IMPLICATIONS........................................ 117
A. Sulfate sorption capacity of soils.............. 117
B. Relevance to watershed acidification
mode Is............................................................................................... 121
C. Other aspects..................................................................... 124
REFERENCES.............................................................................................................. 126
APPENDIX A: SUMMARY OF OXIDE RESEARCH........................................ 153
vi i i

Tab Ie of F i gures
2.1 Eh-pH diagrams illustrating stability fields
of aqueous species and sol ids at 25PC 1 atm
pressure .............................................................................................................. 17
2.2 Solubility diagrams for hematite, goethite, and
and amorphous i ron hydroxide ca1cu1ated using the
equations and constants from Table 2.1 .......................... 2 1
2.3 Eh-pH diagram i1 lustrating stabi1 ity fields
of solid and dissolved forms of sulfur and iron
at 25°C and 1 atm pressure .................................................. 22
4.1 Schematic showing the change in 0~, OH and 0H2+
surface groups with acid/base additions and the
resulting pH change with respect to zpc ............................. 35
4.2 Schematic of substrate surface electrical double
layer at pH = 3 for low and high ionic strength .... 36
4.3 Example of mononuclear and bi nuclear bonding of a
phosphate ion onto an iron oxide ............................................... 37
4.4 Theoretical schematic of sulfate sorption on
iron oxide surfaces ...................................................................... 39
4.5 Schematic of the electric double 1 ayer at pH 3,
high ionic media, with sulfate. Electrostatic
attraction only ................................................................................ 40
4.6 Schematic of the electric double 1 ayer at pH 3,
high media, with sulfate. Ligand exchange .................. 41
lx

5.1 X-Ray diffraction patterns for synthetic
hemat i te and goeth i te ............................................................................ 51
5.2 X-Ray diffraction patterns for natural
hematite and synthetic jarosite .................................................. 52
Plate 5.1 SEM images of mineral samples ....................................... 55
5.3 Differential thermograms of mineral samples ................... 64
5.4 Mössbauer level splitting in 57Fe and the
types of spectra which arise ......................................................... 67
5.5 Mössbauer spectra of mineral samples taken at room
temperature at maximum velocity 10.268 mm/s ................... 68
6.1 Initial goethite experiment: pH vs Time ............................. 75
6.2 Initial goethite experiment: [S04] vs Time ..................... 76
6.3 Percent sorbed of the original solution sulfate
6.4
concentrât i on
Amount sorbed
for 4g/l iron oxide suspension 78
vs equilibrium solution sulfate
concentrât ion 79
6.5 Desorption of sulfate from iron oxide surfaces:
pH dependence 82
7.1 Differential thermograms of mineral samples
after sulfate sorption 89
7.2 Suspension treatment for exchange capacity
determination 92
Schemat1c 11 lustrating the i nterna1 structure
of iron oxides at the PHzpc ........................................... Ill
8.2 Schematic of oxide surface under the system
conditions pH = 3 and constant ionic strength ........ 112
X

116
8.3 Schematic illustrating sulfate sorption onto
surface sites described in Figure 8.2 .............
xi

Table of Tables
Table Page
1.1 Average concentration of sulfur, carbon and
nitrogen in rocks (in ppm) .................................................... 2
2.1 Equations used to draw Figures 2.1, 2.2 and 2.3 .... 20
3.1 Investigations of suI fate sorption on iron
oxyhydrox i de m i nera1s. Exper i mentaI cond i t i ons ........... 31
5.1a Comparison of surface area values for goethite ........... 45
5.1b Comparison of surface area values for hematite ........ 46
5.2a Comparison of ZPC values for hematite ................................. 49
5.2b Comparison of ZPC values for goethite............................... 49
5.3 Infrared spectral peaks obtained ............................................... 58
5.4 Thermogravimetric data for sample weight losses .... 63
5.5 XRF analysis data of oxide samples .......................................... 69
5.6 Neutron activation analysis data of oxide samples .. 70
6.1 Relationship between pH and reversibility ........................ 81
7.1 Surface group peaks in the V SO^ region ............................. 86
7.2 Thermogravimetric data for sample weight loss ............. 88
7.3 Exchange capacity related characteristics ........................ 94
7.4 Reported exchange capacity and surface coverage
values ................................................................................................................... 96
7.5 Ratio of hydrogen consumed to sulfate sorbed
calculated from early raw data .................................................... 99
7.6 Ratio of hydrogen consumed to sulfate sorbed from
xi i

titration data for 500 ppm initial [SO4j .......................... 99
8.1 Sorption reaction observations .................................................. 100
8.2 Sorption maxima and calculated maximum possible
surface coverage by sulfate ................................................ 101
8.3 Percent desorbed from equilibrium solutions ................ 102
8.4a Langmuir isotherm data fit for oxide samples ............. 103
8.4b Freundlich isotherm data fit for oxide samples .... 104
8.5 Sorption in relation to surface area .................................. 105
8.6 Ratio of hydroxyl released vs sulfate sorbed ............. 106
8.7 Weight loss on ignition, and by thermal gravimetric
analysis before and after sulfate sorption, and
resulting OH/nmZ ........................................................................... 108
8.8 Exchange capacity and efficiency ............................................. 109
9.1 Estimated time required to saturate Manitoba
soils with sulfate ................................................................................. 119
xi i i

CHAPTER 1 INTRODUCTION
I. ENVIRONMENTAL SULFUR PROBLEMS IN SOILS
A. Su 1 Fur Status of Soils:
Su 1 fur i s not a maJor const i tuent of the outer crust
as only 0.06% of a 1 I sulfur is found there (Conesa et a 1 .
1982), but it is widely distributed in reduced form in both
igneous and sedimentary rocks as metal lie sulfides (Hem
1970). The average composition of igneous and sedimentary
rock types is given in Table 1.1. Sulfur is present in
variable quantities in al 1 soi Is. Carbon, nitrogen and
sulfur are found in a ratio of 100:10:1 with some variation
due to soil pH (Simon-Sylvestre 1969).
Goldberg (1963) reports seawater concentrâtions of
2,700 mg/1 SO4, 142 mg/1 HCO3 (including C03, H2CO3 and
organic carbon), and 0.5 mg/1 N (including NO3, N02, N2 and
NH4). Rainfall concentrât ions are invariably greater than
1 mg/1 S04. Eriksson (1955, 1960) estimates the average
sulfate content of rain deposited on land to be ~30
kg/hectare/yr.
As a constituent of certain amino acids, sulfur is
an essential nutrient in the cultivation of crops. Sulfur
deficiency is widespread, especially in highly leached
1

2
Table I.1 Average concentration of sulfur, carbon and nitrogen in rocks (in ppm).
# Hem 1970
ELEMENT IGNEOUS ROCKS* SEDIMENTARY ROCKS#sandstone sha 1 e carbonate
su 1 fur 410 945 1850 4550carbon 320 13,800 15,300 1 13,500n i trogen 46 - 600 -* Horn and Adams 1966, Parker 1967
tropical soils. In humid/semi-humid zones and arid/semi-arid
regions, rainy season showers resulting in heavy leaching
have been widely reported. Soil sulfur status information
relating to soil characteristics is needed to prepare a
guideline for fertilization programs.
Soil fertility relating to sulfur was neglected for
a long time because ear 1y determinations of sulfur
requirements by crops were underestimated due to the ashing
techniques used. The fertilizer 'superphosphate' was
thought to supply ample sulfur in conjunction with natural
sources such as atmospheric deposition (Ensminger 1954, Lowe
and Delong 1961). However, modern agricultural practices and
improved crop varieties only intensify sulfur demand.
Recent investigations of sulfur cycling behavior
have shown sulfur to be distributed between two soil
fractions: organic and inorganic. Surface soils contain
several organic forms of sulfur (i.e. carbon bonded sulfur
and ester sulfates —Williams 1975, Fitzgerald 197Q), some
of which can be converted to crop available forms such as

3
sulfate (S04=) by microbial decomposition (Ensminger 1954).
Inorganic soil sulfur is found as sparingly sol ubie minerals
like elemental sulfur, sulfides and sulfates, as well as in
ionic forms (S04=) in soi 1 solution and sorbed onto soi I
col loids. General ly a higher proportion of inorganic sulfur
is found in subsoi 1 than in surface soi 1 (Harward and
Reisenauer 1966). The water soluble sulfate pool in surface
soils (whose concentration fluctuates due to uptake by
biota, mineralization, and leaching from the system) is
thought to be active In sulfur cycling, whereas the water
insoluble subsurface sulfate is an inactive long term sulfur
reserve (Johnson and Henderson 1979).
B. Ion Mobi1ity in Soils:
Sulfur budgets for forest ecosystems indicate net
sulfate accumulations in old, highly weathered soiIs, and
balances between inputs and outputs in young, less weathered
soi 1 s. Kamprath et a 1. 1956, Chao et a 1. 1962, Barrow 1967,
Haque and Wa 1 ams 1 ey 1973 and Sanders and Tinker 1975 al 1
show that sulfate adsorption capacity is related to pH and
to the amount of sesquioxides contained in the soil. The
sesquioxide content Is determined by the parent rock
composition, the soil age, and the extent of weathering.
Ion mobility in soil depends on soil characteristics
such as composition (sol id phases present), pH, presence of
other ions (e.g. phosphate from fertilizers), the pattern,

4
amount and velocity of water movement, and the ion
concentration. The interactions of these factors determine
the fate of sulfate; its distribution in the profile,
availability to biota, and magnitude of losses to drainage
water (Harward and Reisenauer 1966).
It has been we 1 1 estab 1 ished through field and
laboratory studies that soils differ markedly in their
abi 1 ity to retain su1 fate. A variety of su1 fate 1 eaching
losses have been reported for lysimeter percolates
(Mac I nt ire et al. 1941,1952, Stauffer and Rust 1954, McKel 1
and Wil liams 1960, Pratt and Chapman 1961, Harward and
Reisenauer 1966). Superphosphate app1 ¡cations and 1 iming
have been shown to cause soi Is to lose some of their abi I ity
to retain sulfate, after which leaching can begin
(Ensminger 1954, Kamprath et al. 1956).
Johnson and Cole (1980) propose cation nutrient
transport from soil profiles to be regulated by soil
solution anions which maintain electroneutrality. Normal I y,
bicarbonate ions (from soil CO£ pressure and pH) play the
major role, with organic anions. Cl-, N03-, HP04- and SO4 =
taking up the slack. But activities which change the normal
balance of soil anions such as the management practices of
ferti1ization, harvesting and fire, and forms of pollution
(e.g. acid rain) can greatly change cation transport in the
system. When soil solution anions are retained, nutrient

5
cations can also be held; when mobile and leached» they can
take nutrient cations with them.
C. Atmospheric Deposition of H2SO4:
The potential of acid precipitation to increase
nutrient leaching in ecosystems and possibly adversely
affect productivity is causing much concern. Acid rain
affect on nutrient status of many forest sites is being
evaluated by estimating wet and dry atmospheric deposition,
nutrient cycles and hydro logic fluxes. Examples of sites
where sulfate outputs have been found to exceed inputs
(leaching occurs) are the Thompson Site WA. (Cole and
Johnson 1977), Hubbard Brook Watershed N.H. (Likens et a 1 .
1977) and Haney Forest B.C. (Fel 1 er and Kimmins 1979).
Those sites where su1 fate inputs exceed outputs (net
accumulation occurs) are the Sol 1 i ng Site in Germany
(Heinrichs and Mayer 1977), Walker Branch Watershed TN.
(Shriner and Henderson 1978), the La Selva Site in Costa
Rica (Johnson et al. 1979), the Bowl Site N.h. (Martin 1979)
and the Coweeta Watershed N.C. (Swank and Douglas 1977).
Acid input (H+) to a system has several possible
fates:
(a) neutralization by strong base cations (Ca2+, Na+),
which come from sources such as mineral weathering.
(b) passage to ground waters (for soils already acidic or
low in cation exchange capacity, CEC). Acidification of

6
natural waters is of great concern because a drop in pH can /
cause the concentrâtion of toxic forms of elements such as
aluminum to increase to the point where biota are
threatened.
(c) entrance into exchange reactions with cations present
on so il colloids (McFee et al. 1976). So il acidification,
which occurs once the soil buffer capacity is exceeded by
acid inputs, is also of great concern in areas where acid
precipi tat ion is prevalent. Soils with low CEC and moderate
pH are quite sensitive to acidification.
The net effect of acid deposition on an ecosystem
wi11 thus depend on certain site-specific factors such as
present nutrient status (base saturation/buffer capacity),
present H+ content, ion sorption and desorption, mineralogy,
composition and the amount of atmospheric acid input.
D. Acid Sulfate Soils and Acid Mine Drainage:
Acid su 1 fate soils and acid m i ne dra i nage caused by
sulfide mineral weathering are an environmental concern.
Acid sulfate soils develop on waterlogged pyritic sediments
and mine tailings when the water level falls below the
pyritic substratum. Sediments can be exposed through
natural causes such as decreased sea levels or water tables
or through human interferences. Diking, for example, has
caused severe acidification of tidal sediments (Van Breeman
1982). Extended exposure to the atmosphere al lows oxidation
of pyrite to iron (II) sulfate and sulfuric acid. Bacterial

7
oxidation of iron (II) to iron (III) continues the reaction.
The sediment water pH may drop to 4 or lower.
Ions released during sulfide mineral weathering undergo
various reactions:
H+ - some is partly inactivated by ion exchange and
other weathering reactions.
- some is lost to waters where it can lower their pH.
Fe^+ - oxidizes to Fe^+ which precipitates as oxides»
and basic Al3+ and Fe3+ sulfates such as jarosite.
S04= “ a large percentage remains in solution to be
removed by leaching along with cations obtained
from ion exchange and weathering.
- some is precipitated as basic Al3+ and Fe3+
sulfates and possibly as temporary water soluble
hydrated ferrous sulfates (melanterite, copiapite)
which are responsible for increased acidity in
receiving streams during rain events (Nordstrom 1982).
- some is adsorbed onto mineral surfaces.
There are mi 1 1 ions of hectares of potential ly or
currently acidic sulfate soils in recent coastal plains (Van
Breeman 1982). Marine sediments are neutral to alkaline
when submerged, but when drained (e.g. tidal marshes) iron
and sulfur oxidation occurs causing acidification. On
resubmerging, a certain amount of these elements wi11 be
reduced to sulfide again (Harward and Reisenauer 1966).
in mines such as the California Iron Mountain

8
watershed copper mines, a variety of sulfide minerals are
weathering to produce highly acidic mine water. Both
oxidized and reduced iron minerals can be present as
efflorescences and precipitates in or near the acid mine
waters (Nordstrom 1982). Acid mine drainage is especially
characteristic of coal mining, with pyrite being the usual
source of acid weathering products.
II. SUMMARY OF RESEARCH OBJECTIVES
Retention and leaching of cations and anions are
significant in the processes of soil formation, geochemical
circulation of nutrients, ferti 1ization and po 1 Iution of
soils and waters. The influence of sulfate on terrestrial
and aquatic ecosystems depends on sulfate mobility. The
difference between a soil that retains sulfate and one that
does not is dependent on environmental conditions and site
characteristics with a major influence being played by soil
constituents (hydroxides and clays).
A) Substrate:
Natural whole soil samples are a complex mixture of
surfaces with a variety of organic and inorganic species in
the soil solution. They have been examined for sorption
characteristics, but do not readily allow evaluation of
sorption mechanisms due to their complex nature. The
sorption mechanisms of the individual constituents can be

9
interpreted with less difficulty since they can be more
thoroughly characterized than whole soil samples.
Extrapolation of experimental results must be done with
caution because when placed back into the natura 1
environment, constituent behavior is modified by interaction
with other substrate components. The iron oxide hematite,
and hydroxide goethite, referred to collectively as oxides
or oxyhydroxides throughout the text, were chosen for
substrate materials in this study for several reasons.
First, they are common to many soils. Second, they have
been widely studied and are easily prepared and
characterized. Lastly, they are important soil constituents
wh i ch do sorb su 1 fate.
B) Other phases:
The concentrations of ions such as sulfate in
solution are influenced by precipitation and dissolution as
well as sorption and desorption reactions. It is generally
difficult to tel 1 which process is predominant unless a
precipitating phase is visible. Sorption and precipitation
are closely related. Sorption onto surfaces, which is site
dependent, is the first step in sol id phase precipitation,
wh i ch i s dependent on so 1 ut i on concentrât i on. I f nue 1 eat i on,
growth, and dissolution rates are slow, the process wi 1 1
approximate sorption behavior. That is, there may not be a
distinctive boundary between 'pure sorption' and 'pure
10
precipitation' (Nordstrom 1982). But a lower 1 imit of the
boundary can be set, assuming that saturation with respect
to the sol id phase is required For nucleation, because if
the solubility product (Kso) s exceeded, there is the
possibility of precipitation. In this study, the potassium
iron sulfate mineral Jarosite was examined as a possible
precipitant on the oxide surfaces under the experimental
conditions. Jarosite was chosen because it is often found
in acid sulfate soils and acid mine spoils.
C) Parameters:
A general knowledge of substrate sorption
characteristics and consideration of the factors which
influence sorption are prerequisite to the model 1 i ng of
natural sorption in soils.
a) Substrate parameters:
i) Purity - surface impurities often can mask the
sorption characteristics of the substrate of interest.
ii) Pretreatment - pretreatments which may have been
performed to remove surface impurities may in effect
alter the surface by creating new sites or destroying
true sites and thus change the original sorption
character i st i cs.
iii) Surface area - surface area is determined by
grain size, shape and crystal 1 inity and ultimately
determines the number of available surface sites.

11
b) Substrate : solution ratio - may effect sorption at
low substrate concentrât ions.
c) Salt concentrât i on (or ionic strength) - when in high
concentrations, salts can displace e1ectrostatica 1 1 y held
ions. Salt concentration may influence flocculation.
Coagulation into flocs may enhance sorption by increasing
the ion concentrâtion in interstitial waters, or may
decrease sorption by blocking sorption sites.
d) Complexing ligands - when present, complexing ligands
comp 1 i cate sorption reactions. If the 1 igands have an
affinity for the surface, they wl 1 1 enhance sorption. If
not, they wi 1 1 effectively reduce the ions concentration in
solution and decrease sorption.
e) Other ions - when other ions are present, sorption can
be complicated. There may be competition for sorption sites
by surface and solution complexation and formation of
prec ipi tates.
f) Sorbate concentration — anion sorption increases with
concentrâtion. At lower concentrations it may increase
1inearly, with the isotherm being best described by a
distribution coefficient, Kj« At higher concentrations a
nonlinear isotherm with no maximum, often described by the
Freundlich equation, may be observed. At even higher
concentrations a nonlinear isotherm with a maximum, commonly
described by Langmuir equations, can be found.
g) pH - affects H+ as a counterion in nonspecific

12
sorption. Substrate stability and surface charge and
sorbate speciation are dependent on pH .
h) Time - if sorption is considered an equilibrium
process, then the time required to achieve equi 1 ibrium is
important. The kinetics of the reaction will determine if
the process wi 1 1 be slow, or fast, or if in fact it is an
equi1ibrium process at al 1.
D) Proposal and Research Objectives:
This project attempts to characterize clearly
sulfate sorption on iron oxides. If the process on the
individual soil constituents can be clarified, then
para 1 1 e 1 s in who 1 e soil behavior may be def i ned. An
increased understanding of the interaction between soils and
sulfate would contribute to existing knowledge of the sulfur
cycle and would aid in recognition and evaluation of the
environmental effects of anthropogenic inputs to
ecosystems.
General Objective: to contribute to the knowledge of
reactions at solid-liquid interfaces, especially with
respect to the fate of sulfate ions in soils.
Specific Objectives:
- to prepare and characterize several iron oxyhydroxide
minerals and compare them to a natural sample.
- to examine sulfate sorption characteristics of the

13
iron oxides and hyroxides in relation to the variables time«
pH, ionic strength, solid:liquid ratio, and su 1 fate
concentrât i on.
- to examine reversibility (desorption).
- to examine the relation between sorbed sulfate and
the oxide surface. Are there any indications for
prec i p i tat i on ?
- to propose a model for the sorption process.

CHAPTER 2 AQUEOUS CHEMISTRY OF SULFUR AND IRON
I. Aqueous Chemistry of Sulfur
In natural water, dissolved sulfur is found in the
fol lowing thermodynamica1 ly stable forms (25°C 1 atm):
HSO^ , S04-, S®, H£S, HS —, S-
Several intermediate oxidation species (ex. thionate, S4Og=»
sulfite, SO^) have been reported in thermal springs (Hem
1970).
The conversion of oxidized to reduced sulfur forms
is slow; inorganic chemical conversion is not completed.
Thus nonequi 1 ibrium forms can persist for a long time. In
many cases bacteria, of the Thiobaci1 1 us genus, are required
to catalyze the conversion.
An Eh-pH stabi 1ity diagram for sulfur can be
prepared using equi 1 ibrium assumptions and the
equations and constants in Table 2.1. (see Figure 2.1).
This diagram does not present a completely true picture of
sulfur behavior because of the presence of nonequilibrium
conditions in the true system, but is valuable for
predicting general boundary conditions so approximations of
oxidation state and species present can be made. Note, the
boundaries in a stability field diagram are drawn at equal
i on act 1 v i t i es, and the on 1 y boundary that will change on
14

15
increasing or decreasing the total sulfur concentration
will be those around sol id sulfur.
In aerated water (25° C, I atm., pH 4-9 and Eh 0.4
volts)» the most chemical ly stable form of su 1 fur is the
sulfate anion. It forms ion pairs with common cations such
as Ca++, Na+, K+ and Mg++ as we 1 1 as forming salts with
certain metals.
Sulfate reduction occurs when the system Is depleted
of oxygen (ex. anoxic conditions in lake sediments). The
reduction requires bacteria and produces sulfides which
precipitate out as sulfide minerals such as pyrite (FeS2^
and pyrrhotite (FeS).
II. Aqueous Chemistry of Iron
As the fourth most abundant element in the earth's
crust, iron is an important metal in soils, sediments and
natural water systems. Its chemical behavior involves
oxidation and reduction, precipitation and dissolution, and
hydrolysis reactions.
In the absence of strong complexing ligands
(organics), iron cations in solution will react with water
through stepwise hydrolysis. When polymers are not
considered, hydrolysis equilibrium can be established
quickly. Reduced "ferrous" iron wi11 occur in the forms
Fe2+, FeOH+ and Fe(0H)2 (aq). Oxidized "ferric" iron wi 1 1

16
occur as Fe3 + , FeOH2+, Fe(OH)2+, Fe(OH)3 (aq), Fe(OH)4" and
in polymeric forms. The hydrolysis process is pH dependent
and is limited by the précipitât ion of oxyhydroxide phases.
Using chemical equilibrium assumptions and the
equations and constants in Table 2.1, so 1ubi I ity dfagrams
can be prepared for the different naturally occurring solid
phases (ex. Figure 2.2a - amorphous solid, 2.2b - goethite
and 2.2c - hematite). These diagrams are used to predict
saturation under the specified conditions. They i11ustrate
conditions under which a particular sol id phase
predomi nates.
In order to examine the whole picture, an Eh-pH
diagram i 1 lustrating fields of stabi 1 ity of sol ids and
predominant oxidized and reduced ionic species can be
prepared (see Figure 2.1b). Again, boundaries are at equal
ion activities and can shift around the solid phases with
changing total iron concentration.
Standard conditions in aerated water are 25°C, 1
atm.. Eh 0.4 volts and pH 4-9. At lower pHs, iron will be
reduced (Fe?+), at higher pHs oxidized (Fe3+) and most
likely complexed into oxide and hydroxide species.

17
(A) (B)
Figure 2.1 Eh-pH diagrams Illustrating stability fields of aqueous species and solids at 25°C 1 atm pressure.
A. Sulfur species predominance regions assuming totaldissolved sulfur = 10~3 M as sulfate. (From Hem 1970).
B. Iron species predominance regions assuming dissolvediron = 10-4 M and assuming a pK of 37.1 for the ferric oxyhydroxide - Fe2+ boundary. This boundary wi I 1 move towards the left with increasing pK values. (Adapted from Langmu1r and Wh i ttemore 1971)
* The ferric oxyhydroxide field shown represents areas which may be occupied by ferrihydr1te, goethite, or hematite. The area occupied by most soils is also outlined.
** The Fe(OH)£ (s) field also may be occupied by magnetite.

18
III. Sulfur and Iron .... Chemical Relations
The iron cycle begins with the weathering of iron
containing minerals. Silicate minerals weather slowly, but
sulfides such as pyrite weather quickly due to bacteria such
as Th i obac i 1 1 us and F errobac i 1 1 us f erroox i dans which
catalyze the oxidation. Pyrite weathering releases iron and
sulfate to the environment through the fol lowing overal 1
react ion:
regenerated by|<----------------I bacteria
FeS2 + 14 Fe3+ + 8 H20 = 15 Fe2+ + 2 S04= + 16 H+
hydrolysis and preci pitat ion of iron oxyhydroxides and jarosite
which, in large amounts, can lead to the formation of acid
mine drainage and acid sulfate soils. The acidity comes
from S2 (II) oxidation and Fe (III) hydrolysis. One mole
of pyrite can release 4 equivalents of acidity, two equiv
alents can be released from S2 (I I) oxidation, and two from
Fed I) oxidation (Stumm and Morgan 1981). Bacteria
perpetuate the reaction unti 1 the pyrite is used up or the
water leaves the sulfide surfaces. Once the solution has
been removed, it wl 1 1 fu 1 ly oxidize and hydrolyze to form
the various ferric minerals.
Figure 2.3 depicts conditions occuring when sulfur
is taken into account in preparing an iron stability field

19
diagram. This diagram considers solid sulfur, ferric
oxides and hydroxides, Jarosite and the sulfide mineral
pyrite, as being present under the system conditions of
25°C, 1 atm., and fixed Fe, K and S activity. It
i 1 I ustrates that iron is relatively insoluble except under
low pH conditions. In cases of:
a) strong reduction, pyrite is stable,
b) moderate oxidation, ferric oxides and hydroxides are
stable.
In aerated water (Eh 0.4 volts) pyrite is unstable, but iron
oxides and hydroxides are stable.
Note: The diagram summarizes aqueous chemistry in a system
which considers only the minerals listed as being present.
The system is assumed to be at equi1ibrium, with no other
complexing agents (such as organics) present.

20
Table 2.1 Equations used to draw Figures 2.1, 2.2 and 2.3
EQUATION: LOG K @25°C, 0 IS:
H+ + :s= = HS“ 13.9H+ + HS~ = h2s -6.9
H+ + SO4~ = HSO4- 2.0
S(s) + 2 H+ + 2 e~ = H2S (aq) 4.8S(s) + 1 H+ + 2 e- = H§~ -2.2S(s) + 4 H2O = S04= + 8 H+ + 6 e- -36.2S(s) + 4 H2O = HSO4- + 7 H+ + 66 e- -34.2
SO4= + 9 H+ + 8 e- = HS" + 4 h2o 34.0S04= + 8 H+ + 8 e- = S= +4lh2o 20. 1S04= +10 H+ + 8 e- = H2S (aq) + 4 H2O 41.0
Fe++ + S= FeS(s) -18. 1Fe++ + 2H2O = Fe(OH)2(s) + 2H+ -12.8
Fe+++ + 3H2o = Fe(OH)3(s) + 3H+ >-12Fe+++ + 2H20 = OtçFeOOH(s) + 3H+ -0.5Fe+++ + 2H2O am-FeOOH(s) + 3H+ -2.5Fe+++ + 3/2 H20 = 1/2 Fe2O3(s) + 3H+ 0.7
Fe++ + H20 = FeOH+ + H+ -9.5Fe+++ + H20 = FeOH++ + h+ -2.2Fe+++ + 2H2o = Fe(OH)2+ + 2H+ -5.7Fe+++ + 4H20 = Fe(OH)4" + 4H+ -21.6Fe(OH)3(S) + H20 = Fe(OH)4~ + H+ -19.2
Fe++ + H2O = FeOH++ + H+ + e- 15.2Fe++ + 3H2o = am—F e(OH)3 + 3H+ + e- 16.0Fe(OH)2(s) + HoO = Fe+++ + e- =
FFeXOH>3<s) + H+ + e- 4.3 13.0
Sil 1 en and Martel 1References: Stumm and Morgan 1970/1981, 1971, Parks and DeBruyn 1962

21
Figure 2.2: Solubi goethite (c^-FeOOH) calculated using the
A - B = C = 0 =E =
1 Ity diagrams for hematite (C^FezOo), and amorphous iron hydroxide (FeOOH)equations and constants from Table 2.1.
FeOHz+Fe(OH)2+Fe(OH)3Fe(OH)4"

22
Figure 2.3 Eh - pH diagram illustrating stability Fields of sol id and dissolved forms of sulfur and iron at 25°C and 1 atm pressure.
Included are fields of sol id sulfur, pyrite, Jarosite and ferric oxides/hydroxldes whose boundaries will be determined by the solubility products. The ferric oxide/hydroxide field generalizes the location where goethite, hematite and ferrihydrite are found. Activities of dissolved species are Fe = 10-4 M, total S = 10-2 M and K+ = 10“3 m. (Adapted from Garre 1 s and Christ 1965, Hem 1960, 1970, Van Breeman 1982 and Nickel 1984).

CHAPTER 3 LITERATURE REVIEW
I. SOIL RESEARCH LITERATURE
Many soi Is have exhil
sulfate as shown in invest
fo11ow i ng:
Kamprath et a 1. 1956Liu and Thomas 1961Chao et al. 1962Fang et a 1. 1962Chang and Thomas 1963Bornemisza and Llanos 1967Barrow 1967, 1972
whose works have been revi
ited the ability to retain
gâtions performed by the
Barrow et al. 1969Hasan et al. 1970Mekaru and Uehara 1972 Hague and Walmsley 1973 Gebhardt and Coleman 1974 Sanders and Tinker 1975 Couto et al. 1979
i by Harward and Reisenauer
(1966). Sulfate sorption isotherms have been obtained by
the above researchers for some soils.
A soi 1's capacity to retain sulfate has been shown
by the above authors to vary widely with soil properties:
(a) content and nature of clay minerals, (b) hydrated
aluminum and iron oxides, (c) organic matter, (d) pH, (e)
sulfate concentrât ion, (f) accompanying cations and (g)
other anions present. Surface soils, which are higher in
organic matter than subsoils, tend to sorb less sulfate and
desorb it to water easily. Subsoils, which are higher in
sesquioxide content than surface soils, sorb more sulfate.
Sorption increases with decreasing soi I pH and with
increasing sulfate concentration, although a sma1 1er
23

24
percentage is sorbed at higher sulfate concentrâtions.
Efficiency of sorption of sulfate fol lows the order of
chemical valency of the accompanying cation (e.g. 2 valent
CaSO^ > i valent K2SO4). Retention strength of anions
fol lows the order PÛ4 = > SÛ4= > NO3- = C 1 meaning that
phosphate sorbs more strongly than sulfate. That is, the
presence of phosphate decreases the amount of sulfate that
can be sorbed and it will increase desorption by replacing a
1arge percentage of sulfate a 1 ready sorbed onto soils.
Su 1 fate sorpt ion in soils is i n i t i ated by a rap i d
reaction, followed by a longer slow reaction whose time to
equilibrium, if ever reached, is not resolved. Chao et al.
(1962) and Sanders and Tinker (1975) suggest that a steady
state is achieved after 4 hours of reaction time, but Barrow
(1967) states that it takes more than 48 hours; Chang and
Thomas (1963) and Liu and Thomas (1961) conclude that it
takes more than 5 and 8 weeks respectively before
equilibrium is attained.
As sulfate is being sorbed, pH increases due to
consumption of H+ (or production of OH-). But the amount of
hydroxyl released to sulfate sorbed is not constant.
Barrow (1967) is the only investigator to examine
sulfate sorption in soils for soi 1/solution ratio and ionic
strength effects. Although he observes no influence on
sorption of sulfate by soi 1/so 1 ution ratio, there is a

25
noticeable decrease in sorption with increasing ionic
strength up to 0.01 M. Above this concentration, no effect
is observable. Barrow also observes an increase in sulfate
sorption with temperature.
Many studies show that the sulfate sorbed by soi Is
can only be partial ly desorbed. Surface soiIs, containing a
water soluble pool, desorb sulfate more readily than
subsoils (Couto et al. 1979). Sorption reversibi1ity
increases as time periods diminish from the order of days
to the order of hours (Rehm and Ca 1 dwe 1 1 1968), and as
equilibrium concentrations diminish (Barrow 1967). For
example, Sanders and Tinker (1975) observed greater
reversibility over a sorption period of hours when less than
15 mg/1 of sulfate was used in the sorption step.
Desorption of sulfate, by washing with water or solutions of
NaCl or NaNOg, is not as efficient as washing with solutions
containing phosphate (KH2po4) (Ensminger 1954, Chao et a 1 .
1962). Bornemisza and Llanos (1967) observed that in three
extraction steps, water and phosphate removed <65% and >80%
of sorbed sulfate respectively. Yet phosphate did not
completely desorb (replace) all sulfate sorbed by soils.
Sorbed sulfate is in equilibrium with solution
sulfate, as shown by isotopic exchange studies with 35so4
(Chao et al. 1962). Sorption behavior on some soils
conforms to the Langmuir adsorption equation, with its
sorption maximum, especial ly at lower sulfate

26
concentrâtions. For example, Kamprath et al. (1956) find
their data fit Langmuir behavior up to and above 300 mg/1
equilibrium solution sulfate concentration. Data of Couto
et al. (1979) also fit Langmuir behavior. Haque and
Walmsley (1973) find their data to obey the Langmuir
equation, but only at low sulfate concentrations (<100
mg/1). Barrow (1967) also finds that parts of his data are
defined by the Langmuir equation. On the other hand,
investigators such as Fang et a 1 . (1962) find isotherms to
fol low Freundlich behavior, with no sorption maximum, more
closely. Chao et al/s (1962) data also show no sorption
maximum, at least not up to 500 mg/1 sulfate. Bornemisza
and Llanos (1967) find no sorption maximum up to 1000 mg/1
sulfate, the highest sulfate concentration used in their
studies.
Sorpt ion Meehani sms:
There are several possible mechanisms which lead to
sulfate retention in soils and can be used to explain the
above observations:
I) incorporation into soluble and insoluble sulfate minerals
through précipitât ion.
Adams and Rawajfih (1977) propose sulfate precipitates as
insoluble basic aluminum and iron sulfate minerals in soils.
II) interaction with sesquioxides (hydrous oxides and
clays) through:
i) nonspecific electrostatic sorption, and

27
ii) specific sorption involving chemical coordination.
Most investigators believe mechanisms in addition to
nonspecific sorption occur due to a) changes in pH upon
sorption and b) the inability of solutions such as KNO3 to
remove al 1 sorbed sulfate. Some authors suspect that more
than one mechanism is working (Aylmore et al. 1967), or that
more than one site is being activated (Fang et al. 1962,
Barrow 1967, 1969, Haque and Walmsley 1973, Muljadi et al
1966) due to a) deviations in behavior from the Langmuir
equation, b) changes in behavior on exchange with 35S04,
and c) inabi 1 ity of phosphate to replace al 1 sorbed
sulfate.
The most accepted specific sorption mechanism
involves protonation of Al and Fe bearing mineral surfaces
forming aluminol and ferrol groups, followed by ligand
exchange of S04= for OH” to allow coordination of the anion
with the metal cation at the surface (Aylmore et al. 1967,
Hingston et a 1. 1967, Gebhardt and Coleman 1974).
II. OXIDE RESEARCH LITERATURE
There are many investigations which examine the
sorption of anions on oxyhydroxide minerals. As with
sorption on whole soil samples, sulfate sorption on iron
oxyhydroxides is a) pH dependent (increases with decreasing
pH), b) concentration dependent (increases with

28
concentrâtion) and c) time dependent. The high affinity
isotherm produced often reaches a plateau or maximum thus
showing apparent Langmuir behavior over the concentration
ranges studied (Ayl more et a 1 . 1967).
Previous studies on anion sorption produced many
isotherms but few structural models. Studies on sorption
rates and isotopic exchange rates, determination of area
covered by sorbed anions, along with crystal morphology and
infrared studies of surface groups give the data used to
propose sorption mechanisms and structural models.
Due to the rate and extent of sorption of anions on
goethite in comparison to chromic oxide (o^-C^C^) (phosphate
sorbs quickly on both, sulfate and nitrate slower on both),
Yates and Healy (1975) conclude that sulfate is not
sign1ficant 1 y involved in direct exchange with surface
groups on iron oxides and suggest it to be non-specifically
sorbed much 1 ike nitrate.
On the other hand, high affinity for sulfate,
inability of non specifically sorbed ions such as NO3- and
Cl~ to desorb sulfate, and strong pH dependence of sorption,
suggests sulfate to be specifically sorbed on iron
oxides and hydroxides. Shifts in oxide zero point of charge
(zpc) accompanying sorption also indicates specific sorption
of anions. Sulfate sorption increases the pHzpc of goethite
(Yates and Healy 1975, Sfgg and Stumm 1981) and hematite
(Breuwsma and Lyk1 ema 1973).

29
Parks and DeBruyn (1962)» Yopps and Fuerstanau
(1964), Breuwsma and Lyklema (1973), Rajan et al. (1974),
Ryden and Syers (1975) and Parfitt and Russel (1977) al 1
agree that sulfate ligand exchanges with surface OH and H£0
groups to form chemical bonds with oxide metal ions. This
is supported by commonly observed variations in adsorption
capacity with pH. A few investigators (Hingston et al.
1972, Atkinson et al. 1967, Bowden et al. 1973) propose that
a relationship between pKa of the sorbing acid (H2SO4) ahd
pH of optimum sorption exists. Sigg and Stumm (1981) give
evidence that sorbed sulfate forms an inner sphere complex
because the complexing tendency in solution (with free Fe3+)
and on the surface is similar. They found a correlation
between the formation constant of the ligand with Fe3+ in
solution and the equi 1 ibrium constant of the surface
comp1 ex.
When anions such as sulfate and phosphate are sorbed
in amounts > 100 yumol/g, infrared spectra show that
sorption sites for carbonate become blocked (Parfitt and
Russell 1977). Infrared spectra also Indicate that A-type
(singly bonded) hydroxyl groups, on hematite 1010 and
goethite 100 and 010 faces, are lost on sorption of these
anions. Unlike phosphate, sulfate sorption bands do not
shift after D2O treatment and evacuation, indicating that
the sorbed sulfate species is not protonated (S04= vs
HPO4-)« Atkinson et al. (1974) and Russell et al. (1974)

30
used this information and the i rre vers i b i 1 i ty of the
sorption to propose a bi nuclear bridging complex mechanism
for S04= and HPO4- sorption. The bi nuclear bridging complex
forms when one anion adsorbs onto the oxide surface and
coordinates to a metal cation by ligand exchanging with two
adjacent surface hydroxyl sites. Ions complexed in this way
are more strong 1y held than those i nvo1ved i n mononuc1 ear
bonding.
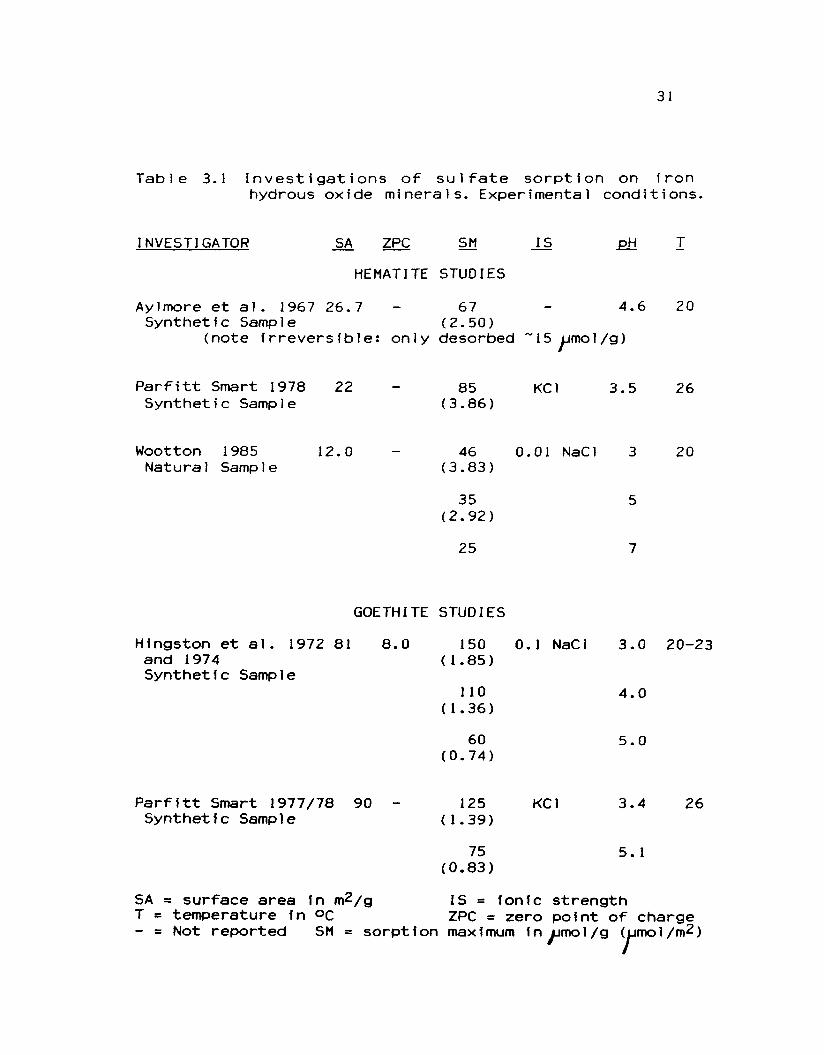
Table 3.1 summarizes the studies of sulfate sorption
on hematite and goethite which report sorption maxima.
Although the table shows increasing sorption with decreasing
pH, the theoretical sorption maximum of 200 yjmo1/g (Parfitt
and Smart 1977) is never achieved. This is because the
minerals are not stable at the pH required for 'maximum'
sorption (pH < 0) and start to dissolve under such
conditions.
31
Investigations of sulfate sorption on iron hydrous oxide minerals. Experimental conditions.
Table 3.1
INVESTIGATOR SA ZPC SM IS pH T
HEMATITE STUDIES
Ayl more et al. 1967 26.7 67 — 4.6 20Synthet i c Samp1e (2.50)
(note Irreversible: only desorbed ~15 yjmo 1 /g )
Parfitt Smart 1978 22 - 85 KC1 3.5 26Synthet i c Samp 1e (3.86)
Wootton 1985 12.0 - 46 0.01 NaCl 3 20Natural Samp 1e (3.83)
35(2.92)
5
25 7
- - Not reported SM = sorption maximum in pmol/g (Limol/m2)
GOETHITE STUDIES
Hingston et al. 1972 81 8.0 150 0. 1 NaCl 3.0 20-23and 1974 (1.85)Synthetic Sample
110(1.36)
4.0
60 5.0(0.74)
Parfitt Smart 1977/78 90 - 125 KC1 3.4 26Synthetic Sample (1.39)
75 5. 1(0.83)
SA = surface area in m^/g IS = ionic strengthT - temperature in °C ZPC = zero po i nt of charge

CHAPTER 4 OXIDE SURFACE CHEMISTRY
Oxide properties are influenced by their
precipitation conditions, crystal 1 ine structure, and
morphology. Their surface chemistry is determined by their
large surface area and electrical charge.
I. SURFACE GROUPS
Some oxides are natura1 ly hydroxylated (contain surface
OH), while others are not:
H H0 0 0II / \
Fe Fe VS Fe Fe\ / \ /
0 0
goethite hematite
Chemisorption of water can occur due to hydroxylation
leading to completion of coordination shelIs (Breuwsma
1973). Depending on the oxide type (hydrous versus
anhydrous) and its surface area, additional water may be
sorbed beyond hydroxylation of the surface (Parks 1965) by
hydrogen bonding to structura 1 or surface hydrogens. This
is referred to as 'physical adsorption' (Breuwsma 1973).
32

33
0
H H\ /
P..H H •* • *••0 0 H H1 1 + H2O = 0 0Fe Fe 1 1\ / Fe Fe
0 \ /
The reactivity of oxide surfaces are determined by this
chemical ly and physical ly sorbed water.
The common surface structures on hydroxides and
oxides are terminal aquo (-M-OH2) and hydroxo (-M-OH)
groups, of which the hydroxo group can be singly, doubly, or
triply bound, as well as
H
oxo (-M M-) and ol (-M M-) groups (Harward andXOX XOX Reisenauer 1966).
H
II. SURFACE CHARGE AND ADSORPTION
The proportions of different surface groups found on
an oxide surface are determined by suspension pH, which in
turn determines surface charge. At the zero point of charge
(zpc), the net positive and net negative groups are
equivalent for a given substrate. The pHzpc of an oxide
will depend on the relative properties of the oxide with
respect to acidity and basicity, where variables such as
hydration state and ion arrangement play a role. Parks

34
(1965) proposed that strongly amphoteric oxides like
hematite (Fe£03) have zpc near neutra1 pH.
Surface charge can be made positive or negative by
raising or lowering, respectively, the pH relative to the
zpc (see Figure 4.1). Excess surface charge is balanced by
an equivalent amount of countei—ions [anions (A-) or cations
(C+)J which diffuse into the surrounding medium forming an
electric double layer near the surface (see Figure 4.2).
The phenomenon whereby ions are adsorbed in the
outer double layer in proportion to the equi1ibrium
activity, is an example of nonspecific e1ectrostatic
adsorption. Chemisorption or specific adsorption, mentioned
above for water, results when ions are held more strongly to
the structural cation by covalent bonds via 0 and OH groups,
or exchange with these ligands in order to penetrate the
coordination shelIs of the cation (Fe^+). The amount sorbed
wi 1 1 depend on many factors such as the specific ion, its
concentration and pH.
Surface charge can be measured by:
(1) potentiometric titration in indifferent electrolyte
such as KNO3 (Parks and DeBruyn 1962),
(2) adsorption of indifferent ions at a range of pH
values (Bolland et al. 1976).

35
Figure 4.1 Schematic showing the change in 0“, OH and 0H2+ surface groups with acid/base additions and the resulting pH change with respect to zpc.
ADD ACID<---------------------------------------------- -----------------
oxx-oh2+XXxx-oh2+—XXxx-oh2+ xxgII_____________________
X2*
XX -XX
XXXX
-0H
-oh2 +_
xx-oh2+XXXX -OHXX
—XX-OH&
-0"XX fxx
XX -oh2+---- XX -OH XX -OH----- XXXX XX XX XXXX -OH XX -OH XX -0" XXXX XX XX XXXX -0“ XX -0" XX -0“ XX>2< Ü2S & &
-0“
0“
■ I
I I
i f
+ > - pH < ZPC
CHARGE : pos i t i ve
+ = - pH = ZPC neutra 1
+ < - pH > ZPC negat i ve
>ADD BASE >
Titration Situations:
1. At ZPC:+ ACID) surface —> positive, pH decreases+ BASE) surface —> negative, pH increases
2. At pH < ZPC:+ ACID) surface —> positive, pH decreases+ BASE) surface —> zpc or above thus becoming negative
pH i ncreases
3. At pH > ZPC:+ ACID) surface —> zpc or below thus becoming positive
pH decreases+ BASE) surface —> negative, pH increases
35

36
Figure 4.2 Schematic of substrate surface electrical double layer at pH=3 for low and high ionic strength.c^l and 03 represent surface charges of the surface layer, inner helmholtz plane and diffuse layer or outer he imho Itz plane respectively).
KXKXKXKXKXKX
*0
-0H2+
-OH
-oh2+
<*1 ¿d
• 0H-
• 0H-
NO IONIC MEDIA
+2 0 -2
LOW IONIC MEDIA CONCENTRATION
*1
NO3
0H-
OR
+2 0 -2
°o.
KXKX -oh2+ •KX NO3-KX -OH eKX .KX -oh2+ • .’OH-kk . •
+2« -1 -1
HIGH IONIC MEDIA CONCENTRATION
^0 <1
X) K)]-°h2+ NO3“
K>4-oh ORK)XI •O<kOH2+
M *
NÓ3-
•+2 -2 0
<> <*1 *d
A••
XX -OH?+ N03"XX •XX -OH •XX • •KX -0H2+ • .NO3-
. •
+2 -1 -1

37
Figure 4.3 Example of mononuclear and bi nuclear of a phosphate ion onto an iron oxide.
bond i ng
0H2 oh2
\oh2 oh2
/ \ /Fe 0 Fe
/ \ II / \ 0/
00 - P - 0
\7
0 P\ OH OH \ o' \\ / \ / OHFe Fe
/ \ / \
MONONUCLEAR BI NUCLEAR(stronger bond)
III. SURFACE SITE AND SPECIES DETERMINATION
The number of surface sites can be estimated by
ligand exchange through exchange capacity titrations. The
species occupying surface sites can often be identified by
infrared spectroscopy. Sorbed ions exhibit characteristic
spectrum peaks. Changes in spectrum after ion sorption
gives clues to the sorption mechanism. For example,
infrared evidence (Atkinson et al. 1974, Russel 1 et a 1.
1974, Parfitt et al. 1975, 1976, Parfitt and Atkinson 1976,
Parfitt and Russel 1 1977, Parfitt and Smart 1977, 1978) has
indicated the formation of bi nuclear bridges in the cases of
phosphate and sulfate adsorption on iron oxide surfaces,
which may explain the partial irreversibi 1 ity seen for these
and other specifically sorbed ions (see Figure 4.3).

38
IV. SORPTION MODELS
Figure 4.4 summarizes general models for sulfate
sorption on oxide surfaces. The sulfate anion can be a)
el ectrostatica I ly held to a positively charged surface site,
or b) chemical ly held by replacement of one or more surface
1 igands. The ratio of 1 igands rep 1 aced to the number of
anions held (R = {0H}/{S04}), can be used to define the
nature of the reaction of S04= and OH- (or H+).
Figure 4.5 i 1 1ustrates nonspecific e1ectrostatic
reactions which may occur under solution conditions of high
ionic strength and low pH as used in this study. Genera 1 ly
electrostatic attraction does not give an R index value
above 0. Figure 4.6 illustrates several possible ligand
exchange reactions. Note that two types of sites, -OH and -
0H2+» can be replaced, and that R can range from 0 to 2
meaning mononuclear and/or binuclear bonding can occur.
V. SUMMARY
Iron oxide and hydroxide sorptive properties depend
strongly on the reactivity of their hydroxylated surfaces.
Their zero points of charge are determined by the net
amounts of different surface groups. Ions may be loosely
sorbed through non-specific electrostatic attraction (Figure
4.5), an outer sphere phenomenon; or more strongly held by

39
specific sorption, an inner sphere phenomenon (Figure 4.6).
Ligand exchange with two surface groups, cal led bi nuclear
bridging, is the strongest form of specific sorption.
Although al 1 ions can be held e 1 ectrostat I ca 1 ly, few ions
are known to be involved in specific sorption.
Figure 4.4 Theoretical schematic of sulfate sorption on iron oxide surfaces. R = [OH] / [SO4]
----- add SO#?
XX XX x> XX XX XX XX XX XX XX XX XX XX XX XX XX XX
0H2+
-oh2+
■OH
•OH
OH
FX1------S04Z_
-O-SO3 + h2o
O-SO3 + OH-
Electrostatic Attraction releases no OH
R = 0
L i gand exchange/rep1acement releases no OH- R = 0
Mono ligand exchange/replacement releases one OH
R = 1
+ 20H~ Bi ligand exchange/replacement releases two OH
R = 2

40
Figure 4.5 Schematic of the electric double high ionic media, with sulfate, attraction only.
layer at pH 3, E Iectrostat i c
<*1 u«Od cr8
H • •XX . XX . • •xx-oh2+ no3- XX-oh2+ • •XX . . XX . • •XX-OH . +SO42" XX-OH so42" • Replaces twoXX . XX . • • NO3- ionsXX-OH2+ NO3- XX-OH2+ • »XX XX . • • R=0
• • +2 -2 Ô •
+2 -2♦0
2Plus more SO4
^0Utftt •
XX** .XX-OH2+ SO42 - ’.K+
XX . •XX-OH • PlusXX . •xx-oh2+ SO42'" *.K+
XX . •
+2«
-4 +2
°Q^
xx^.frl . •
XX-OH2+ SO42 XX .
- ,‘k+
Q_more SO 4 XX-OH2+ SO42
XX .- ÎK+
XX-OH2+ SO42 XX .
- *K+
• • +3 -6 +3
Replaces two more NO3 and attracts two K+ ions
R=0
Attracts an H+ and a K+ ion to neutralize charge
—pH of solution increases- R=.333

41
Figure 4.6 Schematic of the electric double layer at pH 3» high ionic media, with sulfate. Ligand exchange.
°o *1 °d
:x -oh2+ no3~:x:x -OH • • +S042-:x •;x -oh2+ no3~£
+2 -2 0
°d
.0H~
-1
attaches directly to the surface expels one hydroxyl ion thus giving R = {0H)/{S04) = 1
.OH"
-2
OH
attaches directly to the surface and expels two hydroxyl ions
giving R = {OH}/{SO4} = 2 (Note: the OH- in the double layer
can be N03~ as well).
XXXXXXXXXXXXXXXXXX
—0H2+
-OH
-OH
-OH2+
+S042“
no3" .
• a• e
K+
0 0
+ H2°
+2
attaches directly to the surface and expels one watergiving R = (0H}/{S04} = 0
0

CHAPTER 5 MINERAL PREPARATION AND CHARACTERIZATION
The fol lowing sections discuss the general
characteristics of two iron oxides and an iron sulfate
mineral which are important for either identification or
surface reactivity determination with respect to sorption.
The simplest, yet most reproducible mineral preparation
synthesis procedures for the three minerals concerned are
given first, then methods of characterization are discussed,
along with 1 iterature and experimental results.
I. MINERAL PREPARATION METHODS
GOETHITE - the fol lowing procedure was initial ly used by
Atkinson et a 1. 1967, and fol lowed by many other authors.
200 mis of 2.5 N KOH are added to 50 g of Fe(NO3)3*9H2O
in 800 mis of Mil 1 i Q water g i v 1 ng the so 1 ut i on a fl na I
pH of 12. This solution is aged in an oven at 60°C for
> 1 day in linear polyethylene bottles. The resulting
precipitate is washed by centrifugation, decantation
and f i na 1 1 y by filtering (0.45 yiim mi 1 1 1 pore fl Iter)
then either oven, hot plate or vacuum dried.
Fe(NO3)3*9 H20 + 3 KOH = FeOOH + 3 KNO3 + H2°
4 2

43
HEMATITE - the procedure whereby ferric nitrate is
hydrolyzed at the boi 1 ing point of water (Parks and DeBruyn
1962, Atkinson et al. 1967, 1968, and Parfitt et a). 1975)
was used to prepare hematite.
A solution of 20 g of Fe(NO3)3 • 9H20 in 200 mis of
Mil 1 iQ water is prepared at room temperature, then
bo i 1 ed at > 1 00°C for 18 days i n a sand bath. Th is is
performed under reflux conditions to ensure that the
HNOg formed by hydrolysis is prevented from escaping by
vaporization and results in a final pH of around 1.
The precipitate is then washed, filtered and dried in
an oven or on a hot plate.
2 Fe(NO3)3«9 H20 + 3 H2O = Fe2O3 + 6 HNO3
JAROSITE - the fol lowing procedure was used on suggestion of
Ivarson (private communication).
A saturated solution of Fe(SO4)3*nH2O + K2SO4 adjusted
to a pH between 1.8 and 3 is al lowed to age overnight
at room temperature, then is warmed on a hot plate to
facilitate crystal production. The precipitate is
filtered and washed on a 0.45 yum mi 1 1ipore fiIter then
oven or hotplate dried.
6Fe(SO4)3*6H2O + K2SO4 + H2SO4 = 2KFe3(SO4)2(OH)6 +16H2SO4 + 6H2° +180H

44
II. METHODS OF MINERAL CHARACTERIZATION
Mineral samples prepared In this study were identified and
characterized using the following techniques:
X-Ray Diffraction - crystalline identity
Electron Microscopy - morphology
Surface Area, Zero Point of Charge, Infrared Spectroscopy
and Thermal Analyses - surface properties
Mössbauer Spectroscopy - internal structure
Neutron Activation Analysis and X-Ray Fluorescence - purity
Thermal Analyses (Differentia 1 Thermal Analysis, Thermo-
Gravimetric Analysis and Loss on Ignition) - water content
The methods and results are described in detail below.
A) SURFACE AREA -
The classic BET-N2 adsorption method (Brunauer,
Emmett and Tel 1 er 1938) is used for surface area
determination of natural and prepared samples. In BET
theory, gases adsorb in multi- molecular layers. There is a
vapor pressure of N2 at which the surface, in equ i 1 ibrium
with the N2 gas, wi 1 1 adsorb a monolayer. Performing
adsorption at this pressure of N2 will result in adsorption
of a monolayer coverage. The total surface area per unit of
material can be calculated knowing the total amount of gas
adsorbed and the diameter of the N2 molecule.

45
The BET method requires drying the material prior to
the adsorption process. There is some argument against the
use of this method because the drying process may alter the
surface area or structure.
A Micrometrics BET Surface Area Ana 1yzer is used for
the analysis.
EXPERIMENTAL RESULTS:
Of twenty different preparations of goethite, the
surface areas vary between 32.3 (the lowest) and 90.8 m2/g
(the highest), but most give values in the 40's. A group of
goethite samples, most similar in characteristics, was mixed
together for use in sorption experiments. This mixture
exhibited a surface area of 44.1 m2/g.
Table 5.1a Comparison of surface area values for goethite.
SA Investigator SA Invest i gatorm2/g m2/g
70.9 Atkinson et al. 1967 78 Mackenzie et al. 198148.5 Ba 1i strer i/Murray 1981 70.5 Madr i d/Arambarr i 197882 Bl earn & McBride 1985 84 Madrid & Posner 197916 Borggaard 1983 74 Madrid et al. 198482 ff 80 Parfitt et al. 197587.4 Cabrera et al. 1977 90 Parfitt && Smart 197754.4 ft 50 Pr i tchard &1 12 Evans et al. 1979 Ormerod 197689 Forbes et a 1. 1974 50 Rendon & Serna 198117 H i ngston et a 1. 1968 60 Russel et al. 197428 1972, and 1974 96.2 Sibanda & Young 198632 ft 28 Sigg & Stumm 198181 ft 29 ft
16.2 Jur i nak 1964 11 T i pp i ng 198132 Landa and Gast 1974 18 ft
86 Lumsdon et a 1. 1984 48 Yates & Healy 197544.1 This study (synthetic sample)

46
Table 5.1b Comparison of surface area values for hematite.
SA Investigator m2/g
SA Investigator m2/g
23 Albrethson 1963 1.2 Cabrera et al. 197736.4 Atkinson et al. 1967 17.3 ff
34. 1 ft 9.60 Jur i nak 196443.5 ft 1 10 Madrid et al. 198344.6 ft 10 McCafferty and26.7 Ayl more et al. 1967 Zett1emoyer 197114 Borggaard 1983 18.0 McLaughlin et al. 198136 ff 21 Onoda & DeBruyn 196664 ft 22 Parfitt et al. 197556 Boehm 1971 22 Parks and DeBruyn 196218 Breuwsma & Lyk1 ema 1973 43.2 This study, synthetic12.0 This study. natura 1 samp1e samp1e
Surface areas ranged from a low of 27.9 to a high of
43.2 m2/g for the various preparations of hematite. Due to
its similarity in surface area to goethite, the hematite
preparation having the surface area of 43.2 m2/g was used in
sorption experiments. The surface area of a natural
hematite sample was 12 m2/g.
B) pH of Zero Point of Charge (ZPC) -
Solid particles such as oxides develop surface
electrical charges in aqueous solution by adsorption or
desorption of potential determining ions (p.d.i.). By
definition, potential determining ions for oxides such as
^g2^3 are the lattice constituents Fe^+ and 02-, and ions
such as H+ and OH“, which are in equilibrium with them.
Knowing that H + and 0H~ are p.d.i. for the iron oxide

47
surfaces:
MeOH2+ = MeO~ + 2H+
Surface charge measurements can be obtained through
adsorption and desorption measurements for H+ ions, as
carried out by potentiometric titration of oxide suspensions
in an indifferent electrolyte of various ionic strengths
(Parks and DeBruyn 1962).
J where ds = surface charge,= F (z+ I + + z~l ~Y z+ (z") = valence and sign
> (l ~) = adsorption density of p.d.i.
The P^zpc Í s the pH, or concentration of potent i a 1
determini ng H+ ions , at which the net surface charge i s zero
(cfs = 0).
Procedure :
The zpc of the ferric oxyhydroxide and oxides are
determined by an adsorption method utilizing potentiometric
titration of an aqueous suspension of each mineral at
several ionic strengths (1 0“4 to 1 M) at 25°C using a Ross
Orion Microelectrode. Standardized 0.1 M KOH and HNO3 are
used as titrants and KNO3 as the indifferent electrolyte
because it is unlikely to complex Fe(111). A 125 ml teflon
bottle, used as a titration vessel, Is sealed with parafilm
and placed in a thermostated water Jacket to maintain
constant temperature. The vessel is purged with argon to
remove traces of C02 and stirred with a teflon coated
stirring bar.

48
The titration procedure consists of adding 100 g of
suspension (0.4 g of oxide per 100 ml KNO3 media) to the
vessel and degassing for approximately 15 minutes. Then
aliquots of acid or base are added to cover a titration
range of pH 5 to 1 0.Adsorption density ( C***) of OH“ or H+, being the
excess of one over the other ( f^H - f^OH) in meq/g, is
determined by the difference between total titrant added
(acid or base) and the equi 1 ibrium concentration ([H+ ] and
[OH-]) in the suspension in comparison with blank solution
titrations. Reproducibility is established by multiple
titration runs.
The pHzpc is determined by the intersection of the
adsorption curves for the various ionic strengths used. The
surface density of charge (d) can also be ca1 cu 1ated if the
surface area (in m2/g) is known through:
where A i s the surface area
EXPERIMENTAL RESULTS:
The zero points of charge for the synthetic
goethite and hematite preparations and natural hematite used
in later sorption experiments are determined to be 7.1, 8.0,
and 8.8, all ± 0.05 respectively.

49
Table 5.2a Comparison of ZPC values for hematite.
ZPC Reference ZPC Reference
8.0+.05 This study (synthetic)
5.3+.05 Ahmed& Maks i mov 19685.7+.18.7 Albrethson 19638.90+.15 Atk i nson et a 1. 19678.45+.20 If
9.27+.10 ft
8.60+.20 If
7.3 Borggaard 19835.9 ft
7. 1 ft
8.5+.2 Breuwsma &Lyk1 ema 1973
6.45 Cabrera et a 1. 19776.778.6
flHazel & Ayres 1931
8 Jur i nak 19666.7 Madrid et al. 19838.5 Parks & DeBruyn 19628.3 TroeIstra &
Kruyt 19428.8+.05 This study (natural)
Table 5.2b Comparison of ZPC values for goethite.
ZPC References ZPC References
7.55+.15 Atkinson et al. 1967 8.71 Madr i d &7.5 Ba 1i stre i r i Arambarr i 1978
& Murray 1981 8.0 Madrid & Posner 19797.2+.3 Borggaard 1983 8.5 Madrid et al. 19837.6+. 3 II 7.0 S i gg & Stumm 19818.45 Cabrera et al. 1977 7.5 Yates & Healy 19758.75 Evans et a 1. 1979 7.1+.05 This study8.0 Hingston et al. 1972/747.8 If
8.3 If
C) X-Ray D i ffract i on Ana lysis -
The basic structural units in both goethite and
hematite consist of hexagonal close packed oxygen
coordinated with Fe3+ in various octahedral positions (i.e.
in 2/3 of the octahedral positions in the interstices for
hematite), often viewed as assemblages of [FeOg] octahedra.
General I y four major d-spacing values are used to
characterize minerals, although cryptocrystalline particles

50
with very smal 1 particle sizes may appear amorphous to XRD
because of reduced coherent scattering of the x-rays. The
Joint Committee on Powder Diffraction Standards (JCPDS) d-
spac i ngs
MINERAL
for the Fe(iii)
CRYSTAL SYSTEM
oxides are:
dl ( i n Ä) d2 d3 d4
Goethite orthorhombi c 4. 18x 2.693 2.452 4.98Hemat i te hexagona1 (Rh ) 2. 69x 1.696 2.515 3.66Jarosite hexagona1 (Rh ) 3. 08x 3.110 5.090 5.93
with the cel 1 dimensions ••cel 1
MINERAL JCPDS File ao bo co volume Ä°
Goeth i te 17-536 4. 596 9.957 3.021Hemat i te 24-72 5. 038 13.772Jaros i te 22-827 7. 29 17. 16
s-Goethite \ 4.60 + .0 1 9.99 + . 02 3.025 + .004 139.1 1s-Hematite \this 5.029+.001 13.738+.003 300.856n-Hematite /study 5.0 ±•2 13.6 ± -5 291.2s-Jarosite / 7.33 + .02 16.72 + .05 778.16
Procedure • »
X-ray ana 1yses were performed on smear samp 1 es of
goethite» hematite and jarosite scanning a range of 5 ° < 29
<75° (with 29 being the irradiation angle) with Cu/K2 CL
radiation on a Philips diffractometer. The diffraction
patterns are shown in Figures 5.1 and 5.2.
EXPERIMENTAL RESULTS:
Those iron oxide samples chosen for use in later
sorption experiments give x-ray diffraction peaks which
match the above four d-spacings obtained from JCPDS powder
diffraction files. The hematite diffraction pattern shows

51
Inte
nsity
Figure 5.1 X-Ray diffraction patterns for synthetic hematite and goethite.

52
I nte
ns it
y
Irradiation Angle, 26
Figure 5.2 X-Ray diffraction patterns for natural hematite and synthetic Jarosite.

53
a minor amount of goethite by exhibiting a sma I 1 peak for
the 4.18 d-spacing. The d-spacings of the jarosite sample
diffraction pattern also match with the JCPDS values.
Experimental d-spacings were used to calculate the
cel I parameters for the four samples. Results, in ang
stroms, are listed above with the JCPDS values. Calculated
cel 1 parameters are in fair agreement with JCPDS standard
cell parameters and 1iterature values.
D) Electron Microscopy -
Scanning Electron Microscopy is used to examine
morphologies for various natural and synthetic mineral
samples. SEM is used to compare particle size and shapes
for different preparations to help assess reproducibility of
the preparation methods via duplicate samples.
Orthorhombic goethite commonly forms in an acicular
habit, with needles being 0.1 to lyum long, and often
twinned. Hematite and Jarosite commonly form sma 1 1 thick
hexagonal tabular crystals.
Procedurei
Suspensions of samples approximately 0.02% in Fe are
transferred with a pipette to nucleopore filters mounted on
sma 1 1 brass stubs. These are air dried at room temperature,
then coated with gold in a Polaron Sputter Coater.
Samples are examined on an ISI DS-130 Scanning
Electron Microscope at 20,000 to 60,000 times

54
magnification.
EXPERIMENTAL RESULTS:
Under SEM, goethite (Plate 5-la) appears as we 1 I
formed 1 yjm long laths» as observed by other investigators
who have prepared the oxide using a similar procedure
(Atkinson et al 1968 and Landa and Gast 1973). Hematite
(Plate 5-lb), on the other hand, is poorly formed and has
much sma 1 1 er and more equ i-d i mens iona 1 crystals (as shown
here and in the literature). Jarosite crystals (Plate 5-
ld), also poorly formed, are much larger and more developed
than the hematite preparations. The natural hematite sample
(Plate 5-lc) shows no characteristic structure or grain size
due to being a crushed whole rock sample.
E) Infrared Spectroscopy -
Infrared Spectroscopy is used to examine surface
group characteristics to aid in the identification of
natural and synthetic oxide and Jarosite preparations.
Particular surface groups presence and location are used as
diagnostic indicators of mineral identification and purity,
although exact peak locations depend on variables such as
mineral size, shape and composition (Rendon and Serna
1981).
Goethite displays several Identifying peaks which
distinguish it from other iron oxides. The three most
important of these are located at approximately 890, 795


55
Plate 5.1 SEM images of mineral samples:
marker = 1.25 urn
A) Synthetic goethite @ marker = 329 nm
20 KV and 30.4 KX
B) Synthetic hematite @ marker = 329 nm
15 KV and 30.4 KX
C) Natural hematite @marker = 990 nm
20 KV and 10.1 KX
D) Synthetic Jarosite @ 15 KV and 7.99 KX

56
and 640 cm-1 on 1R spectra. Hematite's three major
identifying peaks are found at approximately 560, 465 and
340 cm-1. Jarosite has lattice vibration peaks at 560 and
465 cm-1 as does hematite, but also shows a 500 cm-1
lattice peak and several sulfate vibration peaks.
Oxide surface hydroxyls, which have been studied
through deuteration procedures (Verdonck et al. 1982,
Parfitt et al. 1976, Rochester and Topham 1979), have
characteristic locations in 1R spectra which are described
i n great deta i 1 in the literature. The high end of the
spectrum (3000-4000 cm”l) contains a group of peaks ascribed
to free hydroxyl stretching. The size of these peaks, and
thus the amount of the particular hydroxyl type present,
differs for each oxide due to the nature of their surfaces.
Many researchers consider iron oxides to have three main
types of surface hydroxyls (A=singly, B=doubly and C=triply
bonded) which are progressively difficult to remove, by heat
or ion exchange, due to their bonding. These hydroxyl types
give rise to separate identifiable peaks in the upper
spectrum. The most important of these. the A=type
3440 cm 1, is considered the active site and is monitored
at ~
during sorption processes
Procedure ?
Approximately 1 mg of powdered oxide sample is
ground in a porcelain mortar with approximately 400 mg of

57
dry KBr unti 1 it is equal ly distributed« The mixture is
compressed into a disk and placed in a holder for analysis.
The IR spectra are recorded on a Perkin-Elmer 283 double
beam Spectrophotometer at a speed of 12 cm/min using air as
a reference and on a Nico let FT-IR Infrared Interferometer
using an N£ atmosphere as a reference.
EXPERIMENTAL RESULTS:
Peaks observed in the IR Spectra for analyzed oxide
samp 1es are 1 i sted i n Tab 1e 5.3. The I R spectra posi t i ve 1 y
identify the mineral samples and show all but the synthetic
hematite to be pure. The synthetic hematite exhibits some
smal 1 peaks indicative of goethite as an impurity.
F) THERMAL ANALYSIS
Thermal analyses of oxide samples can give much
information on the stoichiometry and stabi1ity of surface
hydroxyls. Several types of thermal analyses can be
employed for direct and indirect surface studies (Paterson
1980, Paterson and Swaffield 1980, Mackenzie et al. 1981).
Two types are used here:
(a) D i fferent ia 1 Therma1 Ana lysis (DTA)
Mineral thermograms obtained from DTA indicate
temperature regions where endothermic (ex. phase transitions
and dehydration) and exothermic (ex. [rejcrystallization,
decomposition, and oxidation) transitions occur, including
regions where chemisorbed surface water is removed, as well

58
Table 5.3 Infrared spectral peaks obtained.
I RI IR2 A) SYNTHETIC GOETHITE SAMPLE3531 cm-1 \3423 >-------------------V OH O-H stretch of free hydroxyls3141 3120/2919 ???2849 ???
1780\1650 1650 > H-O-H bend of water1600 /1541 1540----------------------------------------NO3- adsorption band1464 \1428 >----------------------------------CO3 = /NO3- adsorption bands1384 1385/^20 \--------------------------------------O-H deformat i on
1045/ c889 882---------------------- OH Ô O-H in plane bend794 790---------------------- OH O-H out of plane bend721-------------------------------------------------------CO3=/NO3~ adsorption band658-------------------------------------------------------CO3= adsorption band640 630----------------------- V Ls Fe-0 lattice bond symmetrical494 \ stretch447 [450] \---------------- V La Fe-0 asymmetrical stretch vibration
[400] / multiplet[360]/254-----------------------V Ls Fe-0 lattice symmetricaI stretch
1383 1385--------------------1030-------------------
IR1 IR23596 cm-1 \3471 3470 \34083167 /3113 3120/2929 29402851 28551648 1650\1604 /1539-
890 888855------------------------------------800 795
602------------A2v564 567-----------EV467 470-----------Ev
410-----------A2v345-----------Ev
B) SYNTHETIC HEMATITE SAMPLE
V OH O-H stretch of free hydroxyls
??????
------------------H-O-H bend of water
----------------- N03- adsorption band ----------------- CO3=/NO3~ adsorption band ----------------- O-H deformation
Goethite $ OH in plane bend ----------------- CO3=/NO3~ adsorption band
Goethite J OH out of plane bend 0— displacement mode /where A=longitu-\ O- displacement mode \dfnal adsorption/
ft f«
•' " where E = transverse’’ ’’ adsorpt i on

59
IR1 1R23830 cm-1 \
3640 \3526 3520 /3444 3460/2951 2970291928702840
2930
1650 \1604 /1456 1460\1376 /1 199 \1 160 1160/1070 \1080 1080/1018 1030\970 /799-616 600-----546 555-----464 467-----420 420—
332-----
C) NATURAL HEMATITE SAMPLE
V OH O-H stretch of free hydroxyls
? ? ?? ? ?????? ?
--------------------- H-O-H bend of water
--------------------- CO3=/NO3~ adsorption bands
--------------------- 0-H deformat i on
--------------------- CO3= adsorption bands
--------------------- 0-H deformat i on
--------------------- CO3=/NO3- adsorption bandA 2v 0— displacement modeE v 0— displacement modeE vA 2vE v
IR1 D) SYNTHETIC JAROSITE SAMPLE3387------------------------------------------ V OH 0-H stretch of free hydroxyls2161 ???2077 ???2020 ???1971 ???1633---------------------------------------------------------H-O-H bend of water1 182\--------------------------------------V3 S041140/--------------------------------------V3 S041002---------------------------------------------------------0-H deformation629----------------------------------------V4 S04569\506 > FeOg octahedral vibrations471/
IR1 = Peaks from Infrared Interferometer (Range 400-4000 cm-1) 1R2 = Peaks from Infrared Spectrophotometer (Range 200-4000 cm-l)

60
as regions where structural dehydroxylation takes place.
Thermograms are dependent upon particle size and
crysta1 1 i n i ty (Der i e et al. 1976, Patterson and Swaf f i e1d
1980, Mackenzie et al. 1981). Large goethite particles tend
to give two endothermic peaks between 250-400°C, sma1 1
particles one sharp peak accompanied by shoulders. DTA
thermograms also often exhibit effects at 670-680°C where
the goethite dehydroxylation product hematite undergoes some
magnetic changes.
EXPERIMENTAL RESULTS
Results found in this study are i 1 lustrated in
Figure 5.3. Synthetic goethite exhibits three endothermic
peaks. A sma 1 1 peak (A) at 85°C represents removal of
surface waters. A large peak at 290°C (B) indicates removal
of structural waters (dehydroxylation 2 FeOOH -> Ee£O3 +
H20)« The last sma 1 1 peak (C) at 620°C represents changes
in the hematite dehydroxylation product.
Synthetic hematite exhibits three endothermic peaks.
The first peak (D) at 100°C arises from surface water
removal, the second peak (E) at 290°C indicates structura1
water removal. This peak has a shoulder at 340°C and is
much sma1 1 er than the corresponding peak in the goethite
spectrum. A sma I 1 inflection (F) at high temperatures
(>700°C) indicate magnetic transitions, which occur in
ferro-magnetic materials at iron's curie temperature of
780°C.

61
The natural hematite sample also has three
endothermic peaks. Surface water removal occurs around 90°C
(G)> structural water removal at 280°C (H) with shoulders
at 235 and 295°C and magnetic effects at 720°C (I).
Synthetic jarosite loses surface water at 114°C (J).
Peaks at 455 (L) and 675°C (N) and inflections at 230 (K)
and 560°C (M) indicate structural water removal and phase
changes. Several investigators (Kerr and Kulp 1948, Kulp
and Adler 1950, Cail 1 ere and Henin 1954) attribute the 400-
450°C endothermic peak to decomposition to K2SO4 and
Fe2(SO4>3» the 500-550°c peak to crystal 1 ization of Fe2O3
and the 650-700°C peak to decomposition of Fe2(S04)3.
(b) Thermoqravimetric Analysis (TGA)
TGA thermograms indicate temperature regions and
weight loss resulting from physical and chemical bond
destruction and formation whereby volatile products,
including surface and structural water, are released.
Paterson (1980) and Paterson and Swaffield (1980)
determined experimental dehydroxy 1 ation weight losses of
11.87, on synthetic goethites. Schwertman et al. (1985)
found structural losses of 0H~ on a series of synthetic
goethites of different sizes, surface areas and
crystal 1 inity and observed a range of 10.34 to 12.00 1.
weight loss. Al 1 of these results reflect an 0H~ excess
over the theoretical structural dehydroxylation loss value

62
of 10.IX. Excesses such as this have general ly been
attributed to either (a), protonation of surface oxide ions,
or (b). a contribution from water coordinated to exposed
Fe(lll) at crystal edges. From their TGA data Schwertman et
al. (1985) calculated an average area of 8 A2 per water
molecule. This is slightly less than the monolayer coverage
of 10 A2 per water molecule as determined by Gast et al.
(1974).
experimental results:
In this study al I three oxide samples and jarosite
are analyzed by Thermogravimetric methods. TGA data are
given in Table 5.4. From experimental data the surface area
covered by surface water molecules can be calculated (or
surface 'density' = molecules per surface area):
ZPCOx i de Samp1e A2/h2O (H20/nm2)
goeth i te 6.7 15.3 7. 1hemat i te 5 19. 7 8.0natural hematite 3.3 29.6 8.8
Notice that the higher the pH of zpc, the more water
molecules per surface area are found. The hydration state
(and charge) when the oxides are ana 1 yzed is therefore
important. At the analysis pH the mineral farthest from zpc
may have the most hydroxyls or waters on its surface.
The synthetic goethite and hematite are uncrushed
samples formed in an aqueous environment whose surfaces are
able to fully hydroxylate. The 1arge dry natural hematite
sample increased its surface area per gram of sample on

i
63
grinding. Crushing may produce surfaces which are unable to
equilibrate (hydroxylate) to their f u I lest potential since
they are kept dry. This is indicated by data for weight
loss on ignition. But experimental 1 y, TGA shows natural
hemat i te to ho 1 d tw i ce as much water as goeth i te and a th i rd
more than the synthetic hematite. For comparison:
Table 5.4
Oxide Sample Ä2/h2O (H20/nm2) Reference
goeth i te 8 13 Schwertman et al. 1985goeth i te 10 10 Gast et al. 1974
1osses.Thermogravimetric data for sample weight
Samp1e AT °C 7. loss DTA peak # Comments**
Syntheti c 70-231 2.0 41-237 A surface H2O/OH"Goethite 231-665 10.0 237-370 B structural 0H~
665-750 Tota 1 =
2.314.3
612-637 C fu1 1 dehydroxy 1 ation of hematite product
Natura 1 196-254 1.0 41-231 D surface HoO/OH” structural 0H~Hemat ite 254-446
(end 500)Total =
2.5 231-330 E inflection 720 F3.5
Synthet i c 55-232 2.5 65-242 G surface HnO/OH- structural OH-Hemat ite 232-320
(end 650)Tota 1 =
3.0 242-361 H inflection 710 I 5.5
Syntheti c 50-195 3.8 35-195 J surface H2O/OH-Jarosite 195-374 1.7 195-269 K\
374-524 11.9 387-479 L \structural 0H~
Tota 1 = 17.4535-582 M 642-698 N/
/
Notes: 1) total structural losses for goethite are close toSchwertman et al/s (1985) theoret i ca1 value of 10.1%.
2) We i ght loss on ignition indicates syntheticgoethite, hematite and natural hematite to be 15.3, 5.5 and 0.85 weight percent water respectively.

64
oosm
. _» ox
m
Figure 5.3 Differential Thermograms of mineral samples.
SG = synthetic goethite SH = synthetic hematite NH = natural hematiteSJ = synthetic Jarosite
A-N designate DTA peaks as listed In Table 5.4

65
Literature values of water per surface area are
lower than those experimental ly determined by TGA. Later
titration data calculations (Chapter 7) give approximate 1y 9
OH/nm^ (or 11 X^/OH-) which is in better agreement with the
literature than TGA data.
G) Mössbauer Spectroscopy -
Due to its specificity towards iron, Mössbauer
spectroscopy is a useful tool in the study of iron
containing minerals (Goodman 1980, Bowen and Weed 1981,
Amarasirwardena et al. 1986). Hematite and goethite, in
particular, possess distinctly different magnetic hyperfine
fields allowing easy identification. Figure 5.4 illustrates
the splitting of Mössbauer levels in different 57Fe
substances and the resulting spectra.
Room temperature Mössbauer spectra of hematite and
goethite should consist of six Lorentzian shaped resonant
peaks indicating magnetic splitting, but hydration state,
particle size, nonstoichiometry, ion substitution by
aluminum and other structural defects can lower the spectra
qua 1ity (Murad 1979, 1982). The sextet could col lapse into
a doublet, indicating quadrupole splitting, in which case
temperatures as low as that of liquid nitrogen or helium
would be required to observe the magnetic hyperfine
splitting. But generally, several s1ight1y different fields
will superimpose so that the hyperfine magnetic field

66
distributions are skewed downwards from the upper limiting
value for the perfectly crystallized mineral (l.e. 382
kilo-oersted (kOe) for goethite)» thus giving rise to the
more typical asymmetrically broadened resonant lines (Murad
1982).
Both hematite and goethite spectra display an isomer
shift (¿) with respect to metal 1 ic iron of approximately
+0.36 mm/s, typical of high spin octahedra1 Fe^+. Goethite,
which has a lower Neel temperature (400 K) and internal
hyperfine field distribution than hematite (956 K), displays
a quadrupole moment (Q) of approximate 1y -0.3 mm/s, whereas
the hematite quadrupole moment is approximately -0.2 mm/s
(Bowen and Weed 1984).
experimental results^.Mössbauer spectra of synthetic and natura1 samples
are taken at room temperature using a 57Co/Rh source- A) 1
spectra display the Fe3+ isomer shift (no Fe2+ present).
Internal hyperfine field and quadrupoIe moment values
positively identify hemat11e and goeth11ee Natura1 hematite
is fitted with a single hematite sextet (Figure 5.50).
Synthetic hematite (Figure 5.5A) displays two sextets, one
for hematite, the other for goethite (approximately 57.).
Synthetic goethite (Figure 5.5B) exhibits 3+ goethite
sextets, indicating that several iron sites are contained in
the mineral. Jarosite is fitted with a doublet (Figure
5.5D) indicating quadrupole splitting at one iron site.

67
Quadrupole splitting
(FeSOt 7HjO)
No splitting
Magnetic Combined magnetic splitting and quadrupole splitting
(K4F«(CN)s.3HjO) (Fe metal) (KFeSjat-U5®C)
Figure 5.4 Mössbauer level splitting in 57Fe and the types of spectra which arise. Examples of substances giving such spectra are named. These spectra are il lustrat.ive only. The spacings are not intended to be comparable.
(From McKay 1971)

68
Figure 5.5 Mössbauer Spectra of mineral samples taken at room temperature at maximum velocity 10.268 mm/s.
a) synthetic hematite exhibits magnetic splitting of hematite and goethite (~ 5% impurity)
b) synthetic goethite exhibits > = 3 magnetic splittingsites.
c) natural hematite exhibits magnetic splitting only.d) synthetic jarosite exhibits quadrupole splitting only.
68

69
H) X-RAY FLUORESCENCE -
The three oxide samples are analyzed for major
elements using X-Ray Fluorescence. Results are 1 isted in
Table 5.5. As expected, the natural hematite sample
contains the highest percentage of impurities. NOTE: the
high potassium of the goethite sample is due to inadequate
rinsing of the sample when separated from the KNO3 media.
Natural Synthetic SyntheticHemat i te Hemat i te Goeth i te
Table 5.5 XRF analysis data of oxide samples.
wt. %
ions in formu1a
wt. %
i ons i n formu1a
wt.7.
ions in formu1 a
SÍ02 3.35 0.08 Si .80 0.02 Si .3 0.00A1203 2.63 0.08 Al .05 0.00 .02 0.00MgO 1.01 0.04 Mg .03 0.00 .06 0.00CaO .23 0.01 Ca .02 0.00 .01 0.00Na20 .03 0.00 .06 0.00 .03 0.00K20 .03 0.00 .03 0.00 3.21 0.06 KTi02 .25 0.00 <.01 0.00 <.01 0.00MnO .09 0.00 .05 0.00 .03 0.00P2O5 .04 0.00 .01 0.00 <.01 0.00H20* .85 0.14 OH 6.62 1.03 OH 15.34 1.41 OH
Fe2O3 91.49 1.72 Fe 92.32 1.63 Fe 80.93 0.84 Fe
* Water content is measured by loss on ignition (LOI) *
Note: The number of ions in the mineral formula are calculated from XRF and LOI data using methods outlined by Deer et a 1. (1966). The minerals calculated formulas are approximately FeinOH, Fe3OH2» and FeOH£ for natural hematite, synthetic hematite and synthetic goethite respectively.
I) NEUTRON ACTIVATION ANALYSIS -
The three oxide samples are analyzed by neutron
activation ana 1 ys i s. Data are listed in Table 5.6. As

70
Table 5.6 Instrumental neutron activation analysis data of oxide samples. Standard deviation and detection limits are shown.
Natural Synthetic SyntheticHematite Hematite Goethite
cone (ppm) det. cone (ppm) det. conc(ppm) det.
found in XRF analyses»
Co 19.0+1.5 4 0 0 0 33.2 + 1.8 3.3Ti 430 + 60 1 76 167 ± 19 50 163 + 33 100Br 22 + 5 15 38 + 5 7 42 ± 5 9Na 222 + 39 120 395 ± 25 40 195 + 28 70K 0 0 0 0 0 0 24000 ± 4000 4000Cl 0 0 0 75 ± 17 50 0 0 0Al 3910 +130 21 69.6 + 29 1.9 129 ± 6 3.1Mn 447 + 32 6 62 + 5 2.2 68 ± 6 3.4Cl 43+9 24 54 + 10 22 87 ± 16 28I 0 0 0 7.4 + 1 .8 1.9 0 0 0Ca 1510 +130 140 0 0 0 0 0 0
the natural hematite sample exhibits
the most impurities. with aluminum being most promi nent.
J) SUMMARY -
Data from analysis of surface area, zero point of charge, x-
ray diffraction patterns, infrared spectra, Mössbauer
spectra and electron microscope observations can be
summarized as fol lows:
SAMPLE XRD MOSS IB ZPC SA~ SEM TGA&DTA
Goeth i te G G G 7. 1 44. 1 orth G
Hemat i te G/H G/H G/H 8.0 43.2 hex. G/H
(Natura 1 Hematite) H H H 8.8 12.0 hex?** H
Jaros i te J J J — — hex?** J
~ units = m2/gG, H and J indicate positive
** Indistinguishable mineral identification

71
Main observations are as follows:
-Iron oxide mineral samples are fairly easy to prepare, with
synthetic hematite being the most difficult because its
purity is hard to maintain.
-Experimentally determined surface areas and pHzpc are
within the range reported in the 1iterature.
-X-ray analysis reveals mineral identities and indicates
impurity of synthetic hematite. Calculated cel 1 parameters
agree with standard cel 1 parameters and 1 iterature values.
-Electron microscopy shows morphologies that indicate
synthetic goethite to be more physically developed than
synthetic hematite and jarosite.
-Infrared spectroscopy confirms mineral identities and
reveals information about surface groups.
-Thermogravimetric analysis and differential thermal
analysis give information on surface and structural water
content, surface hydroxyl stability and mineral stability
(i.e. transition regions). Goethite, hematite, natural
hamatit« and jarosite are 14*3. 5.5, 3.5 and 17.4 wt % water
respect i ve 1 y, of which 10.0, 3.0, 2.5 and 13.6 wt % is
structura 1 water.
-Mössbauer spectroscopy confirms mineral identities and
reveals information about iron sites. Jarosite is the only
mineral which displays a doublet instead of a sextet
indicating no magnetic splitting. All the minerals exhibit
one iron site, except synthetic goethite, which shows at

12
1 east three.
-X-ray fluorescence gives concentrations of major elements
in the minerals thus, along with loss on ignition, al lows
ca 1 eu 1 at ion of minera1 formulasand indicates impurities.
Calculations give synthetic goethite as FeOH2’ synthetic
hematite as Fe^OF^ and natural hematite as FejQOH.
-Loss on Ignition indicates synthetic goethite, hematite and
natural hematite to be 15.3, 5.5 and 0.85 wt % water
respect i vely.
-Neutron activation analysis gives concentrations of
elements in mineral samples also indicating impurities.
These samples have negligible aluminum substitution, a
common impurity in iron oxides and hydroxides (Yapp 1983,
Norrish and Taylor 1961, Nahon et al. 1977, Fitzpatrick and
Schwertman 1982).
CHAPTER 6 SORPTION EXPERIMENTS ON IRON OXIDES
Su I fate sorption experiments on goethite and
hematite are described. Experiments deal i ng with ionic
strength, pH, soi 1/so 1ution ratio, sulfate concentrât ion and
reversibi 1 ity are examined.
I. EXPERIMENTAL PROCEDURES
Basic Procedure for both Goethite and Hematite
Oxide suspensions of constant ionic strength (KNO3
media) are equi 1 ibrated for 24 hours at an adjusted pH
va 1 ue. A known amount of su 1 fate i s added as a K2SO4
solution and allowed to react. At pre-set time intervals,
the pH is recorded and a sample of the suspension removed
and fi ltered through 0.45^um mi 1 1 ipore fi Iter paper. The
filtrate is saved for later sulfate concentrât ion analysis
using a Wescan ion chromatograph.
Var i at ions i n Procedure:
(1) TI ME— sorption in initial experiments is monitored at
the time intervals .5, 1, 6, 24 and 48 hours to determine
the attainment of equilibrium or steady state with respect
to time (kinetics).
(2) pH- experiments are performed at three pH levels (3, 5
and 7) to examine pH effects.
(3) SULFATE CONCENTRATION— a range of original su 1 fate
73

14
concentrations from 0 to 500 ppm are covered to look for
sorption maxima.
(4) ION IC STRENGTH- experiments are run in 10“^, 10-3 and
10-4 M KNO3 media to examine ionic strength effects on
sorpt i on of su1 fate.
(5) SOL ID/SOLUTI ON RATIO- both 0.1 g oxide to 25 mis media
(1:1) and 0.1 g oxide to 50 mis media (1:2) are used in
order to look for the effects of soi 1/so 1ution ratio on
sulfate sorption onto these oxides.
(6) REVERSIBILITY- In order to examine the reversibi 1 ity of
sorption in these systems, some sorption experiments are
fol lowed by desorption experiments. The procedure consists
of resuspending an oxide to which a known amount of sulphate
is sorbed in an ionic media of which pH is known and
control led. After a reaction time of 48 hours, as was used
in the sorption experiments, the suspension is filtered and
the filtrate examined for sulfate content.
II. RESULTS OBTAINED - General Observations
(1) TIME-The sorption process is initiated by a rapid
(instantaneous) reaction fol lowed by a longer slow one.
After 24 hours of reaction time, a steady state or apparent
equilibrium condition is reached with respect to pH and
sorption. That is, no more changes in pH or sorption are
observed after the 24 hour reaction period. See Figures 6.1
and 6.2.

75
Figure 6.1 Initial goethite experiment: pH vs Time.
Notice the instantaneous pH change and the apparent equilibrium reached after 24 hours.
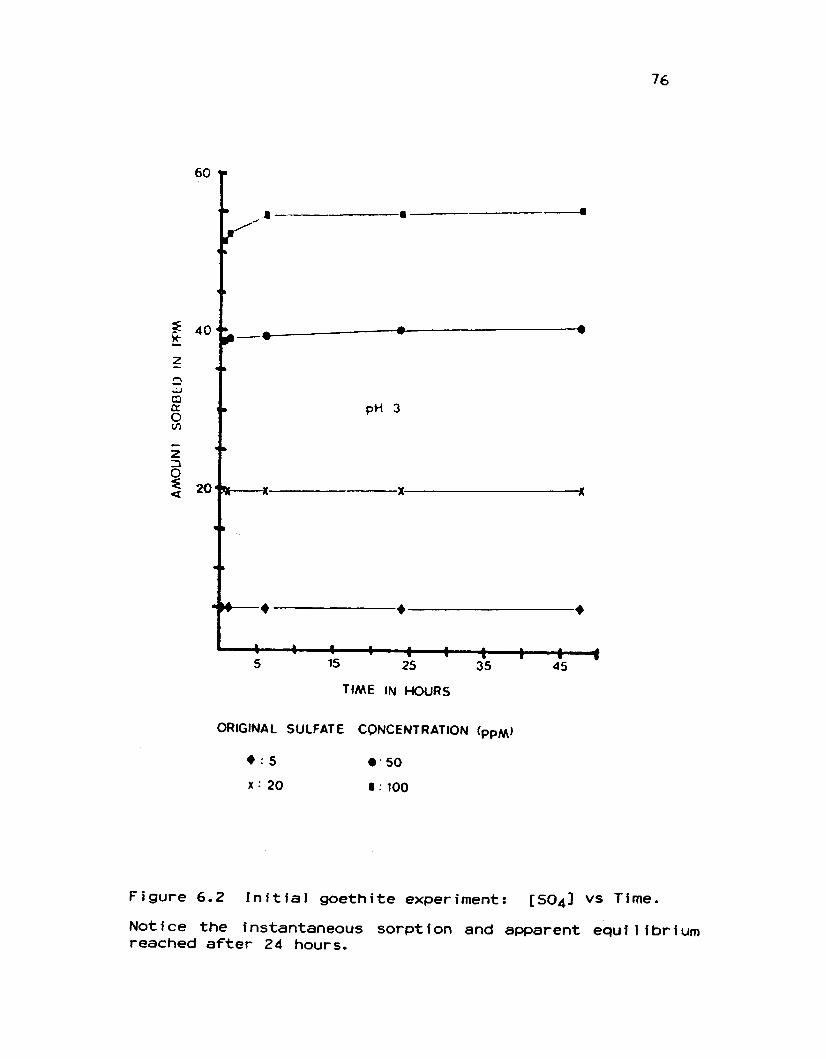
76
ORIGINAL SULFATE CONCENTRATION (ppM)
♦ : 5 • 50
x : 20 «100
Figure 6.2 Initial goethite experiments [SO4] vs Time.
Notice the instantaneous sorption and apparent equilibrium reached after 24 hours.

77
(2) pH- In al I cases, the oxides sorbed increasing amounts
of sulfate as pH decreased. See Figures 6.3 and 6.4.
(3) SULFATE CONCENTRATI0N-
a) Percent sorption vs original solution concentrât ion -
Figure 6.3. For both oxides, the percentage of sulfate
sorbed decreases with increasing original solution sulfate
concentration. pH 3 experiments exhibit the highest 7.
sorbed for any original [SO^j, pH 7 experiments show the
lowest sorption, pH 5 experiments 1ie midway between.
b) Amount sorbed vs equilibrium solution concentrâtion-
Figure 6.4. The amount sorbed increases with solution
concentration. pH 3 experiments exhibit the highest ppm (or
umol/g) removed from solution, pH 7 experiments show the
lowest amount sorbed. Looking at the goethite data, an
apparent sorption maximum is observed after a certain
solution concentration for each pH level, with pH 7
experiments reaching the maxima at the lower concentration
of sulfate. On the other hand, the synthetic hematite data
appear to reach a maximum only in the pH 7 experiments over
the concentration range studied. pH 3 and 5 data show a
continuing increase In sorption with concentration with no
sorption maxima plateau present. In comparison, a natura1
hematite sample examined at pH 3 is found to reach a
maximum, and at a much lower concentrât ion level than the
synthet i c hemat i te.

78
Original Solution Concentration (ppm)
• goethite •hematite
Figure6.3 Percent sorbed of the original sol utionsu 1 fate concentration for 4 g/1 iron oxide suspension.
(A) Synthetic Goethite (8) Synthetic Hematite
Notice as pH decreased the total amounts sorbed increased.

150um
ol/g
Sulfa
te So
rbed
Equilibrium Solution Concentration (mmol/l)
Figure 6.4 Amount sorbed vs equilibrium solution concentration for:(A) Synthetic Goethite(B) Synthetic Hematite(C) Natural Hematite
Notice as the pH decreased, the total amount sorbed increased. Both goethite and natural hematite display apparent sorption maxima whereas synthetic hematite shows a maximum only at the highest pH used in the study. Sorption also appears to have poor reversibility.

80
(4) IONIC STRENGTH- For goethite» experiments held at pH 3
do not show an ionic strength effect at the 10-3M KNO3
level. However, at pH 5, sorpt ion is si i ght 1 y less at the
10-3M ionic strength, than at 10_2M. At 10_4M KNO3 goethite
sorbs even less sulfate. Thus, sorption decreases with
decreasing ionic strength. In synthetic hematite experiments
no effect of ionic strength is observed at either pH 3 or 5,
for 10-2, 10“3 or 10-4M ionic strength. Natural hematite
also shows no ionic strength effect at pH 5 for 1 0-2 or 10“
4M ionic strength.
(5) SOL I D/SOLUTI ON RAT 10- Sol id concentration effects are
examined at pH 5, for goethite, but none are seen.
Hematite is examined at both pH 3 and 5, and also shows no
effect.
(6) REVERS IBILITY- Sulfate sorption is largely irrever
sible. Only the sorption/desorption isotherms at pH 3
appear reversible. There is no measurable desorption (0 7.)
of sulfate at pH 5 and 7.
Reversibility strongly depends upon the pH of
sorption and desorption (see Table 6.1). It appears that
the sorption pH strongly controls the desorption. Sulfate
sorbed at Iow pH is general ly more desorbable than that
sorbed at a higher pH because a larger percentage of sulfate
sorbed at higher pH is strongly bound compared to that
sorbed at lower pH. pH of desorption is also important in

81
that more sulfate is desorbed as desorption pH increases.
For example, sulfate sorbed at a pH of 3 and desorbed at pH
7 shows more su1 fate desorbed than for a desorption pH of 3.
Figure 6.5a shows goethite to desorb the largest percentage
of its sorbed sulfate and natura1 hematite the sma1 lest.
Figure 6.5b indicates that synthetic goethite and hematite
actua 1 1 y desorb about the same yjmo 1 es of su 1 fate per gram of
oxide, whereas the natural hematite releases much less (4
^umol/g versus 60 ^jmol/g).
Raising solution pH shifts surface charge on these
oxides towards the zero point of charge, making the surface
less positive and thus less attractive to e1ectrostatica1ly
held negative ions. A rise in pH also increases the
hydroxyl ion concentration with respect to other anions in
solution with more competition for non-specific sites. The
present evidence suggests sorption of sulfate at higher pH
to be mostly specific in nature, whereas at lower pH
nonspecific sorption and specific sorption are important.
Table 6.1 Relationship between pH and reversibility.
Sorption pH/Desorption pH Amount of Desorption
Low/Low Low/Neutral
Neutra 1/Neutra 1 Neutral/Low
LowHi gher
Nf 1Ni 1

82
Jim
ol/g
sulfa
te de
sorb
ed
% su
lfate
deso
rbed
Figure 6.5 Desorption of sulfate from iron oxide surfaces: pH dependence.
a. pH vs percentage of sulfate desorbed.b. pH vs ^imol/g of sulfate desorbed.
SG = synthetic goethiteSH = synthetic hematiteNH = natural hematite

CHAPTER 7 OTHER EXPERIMENTS
I. X-Ray Diffraction and Scanning Electron Microscopy -
After sorption experiments, suspension samples are
filtered. The filtrates are examined for sulphate and iron
concentration by ion chromatography and atomic absorption.
The oxides are examined by X-ray diffraction and electron
microscopy. Diffraction spectra and SEM images taken before
and after sorption experiments are compared for changes in
composition (crysta1 Iography) and morphology.
Exper i menta1 resu1ts:
No differences in XRD spectra are observed. All XRD
peaks can be attributed to the original minerals. No new
surface structures or crystals are observed in the SEM
image, thus giving no evidence for precipitation.
II. Infrared Spectroscopy -
The free divalent sulfate anion S04= is tetrahedral
(Td) in symmetry. It exhibits two infrared bands; the
stronger one (Vg) at 1060 to 1140 cm“^ and the weaker one
(V4) at 580 to 650 cm~l. The univalent ion HSO4~ has C£v
symmetry. It exhibits four infrared bands; the strongest
(V4) at 570 to 600 cm-1 and three weaker ones at 850 to
83

84
880, 1050 to 1090 and 110 to 1200 cm'* respectively.
Infrared spectroscopy has been used to assess the
bonding of oxyanions, such as sulfate, with hydrous ferric
oxides (Harrison and Berkheiser 1982). When a tetrahedral
oxyanion coordinates with a surface as in sorption, the
symmetry decreases causing the Vg infrared adsorption band
to split. The extent of sp1 itting depends on the point
group symmetry of the ion in its bound state (Nakamoto
1978). If a uni dentate complex forms, two new bands appear
(C 3V symmetry); if a bi dentate complex forms, three new
bands appear (C£\/ symmetry) (Harrison and Berkheiser 1982).
The V SO^ region (S-0 stretch) is found between 900
and 1300 cm-1 with exact peak locations being dependent on
the amount of surface suI fate present and the surface water
content. In sulfate sorption, 4 bands are observed to arise
in the V SO^ region from Vj and the splitting of triply
degenerate Vg vibrations (reduced C£y symmetry). Their
locations on goethite and hematite surfaces have been
reported by investI gators such as Parfitt and Smart (1977,
1978). The presence of 4 infrared bands clearly indicates
direct coordination of the sulfate anion to the metal cation
on the surface (Harrison and Berkheiser 1982).
Exper fmenta1 results ?
Compensation spectra of samples, taken referenced to
air or N2 9as, then referenced to blank oxide samples,

85
clarify the location of sulfate related peaks from the basic
oxide spectrum. Table 7.1 lists experimental peak locations
observed for su1 fate.
All IR spectra indicate the presence of sulfate on
the sample surfaces after sorption. Another important
observation is the reduction in size of the A-type OH peak
on each oxide sample, thus showing sulfate replacement of
those particular hydroxyl groups. But not all the A-types
have been replaced, even though some samples have sorbed
their maximum amount of sulfate. As sulfate progressively
replaces hydroxyl groups it becomes increasingly difficult
to continue replacement, due to steric hinderance between
sulfate groups on an increasingly crowded surface.
The above evidence, along with incomplete
reversibility of su1 fate sorption, indicates variability in
bond strengths. Some sulfate ions may sorb onto more than
one site, as in bi nuclear bridging, forming strong bonds and
effectively covering large surface areas. Other ions form
weak bonds with one site or are only electrostatical ly held
to one s i te

86
Table 7.1 Surface group peaks in the V SO4 region.
Sorbed Su 1 fate Samp 1e E vaporated V3
Su 1 fate Samp 1e VIV3 V3 V3 VI V3 V3
Synthet i c Goeth i te* 1210 1 130 1025 obscured 1220 1 108 1030 obscured# 1220 1 130 1049 965 1226 1 123 1053 obscuredJ 1219 1 138 1038 966 1260 1 144 1050 935
Synthet i c Hemat i te« 1260 1 145 1015 965 1260 1 140 1012 945# 1 162 1 125 1040 982 1230 1155 1023 obscured! 1242 1 159 1041 948 obscured 1120 1040 obscured
Natura 1 Hemat i te« 1255 1130 1030 950 1245 1140 1030 980# 1 160 1 127 1029 972 1199 1 153 1024 973•obscured 1 168 1000 obscured obscured 1 137 1012 975
* Compensation spectra peaks from Spectrophotometer# Peaks from Interferometer using N2 as a reference. ! Compensation spectra peaks from Interferometer
III. Therma1 Ana lysis -
When present on mineral surfaces, anions often
infl uence the DTA and TGA thermograms. Initial
dehydroxylation stages for treated and untreated goethite
and hematite appear identical, but later stages often show
observable differences. For example, on N03- and S04=
treated samples, endothermic peaks at 410 and 660°C have
been reported in DTA thermograms along with extra weight
loss in 400-500°C and 600-700°C regions in TGA thermograms
(Patterson and Swaffield 1980).
In this work, DTA and TGA thermograms are obtained
for mineral samples before and after sulfajte sorption to
look for the evidence of anions influences.

87
Exper imenta1 ResuIts:
DTA thermograms for mineral samples before sulfate
sorption are shown in Figure 5.3. Results obtained after
sulfate treatment are illustrated in Figure 7.1.
DTA thermograms for sulfate treated i ron oxide
mineral samples show no modificat ions in the 600°C region,
but differences in thermograms do occur in other temperature
regions. Synthetic goethite's thermogram displays an
inflection at 390°C (Figure 7.1 point A). An enhanced
exothermic peak appears on synthetic hematite's thermogram
at 318°C (point 1), along with an endothermic peak at 530°C
(point B). The natura 1 hematite thermogram also displays
exothermic peaks, with a larger one located at 230°C (point
2) and a sma 1 1 er one at 335°C (point 3). An endothermic peak
at 496°C (point C) is also observed. Low temperature
endothermic peaks (80-150°C), near the boiling point of
water, represent regions of surface dehydration. Endothermic
peaks at higher temperatures (>200°C) represent structural
dehydration and phase transitions. These temperatures, being
greater than surface dehydration temperatures, indicate
stronger bonding which requires more energy to break.
Exothermic peaks indicate oxidation, crystallization and, as
in the present case, decomposition, with breakdown and
removal of sulfate ions from the surface. Exothermic peaks
in Figure 7.1 occur at temperatures above that of surface
dehydration also indicating the strength of the bonds
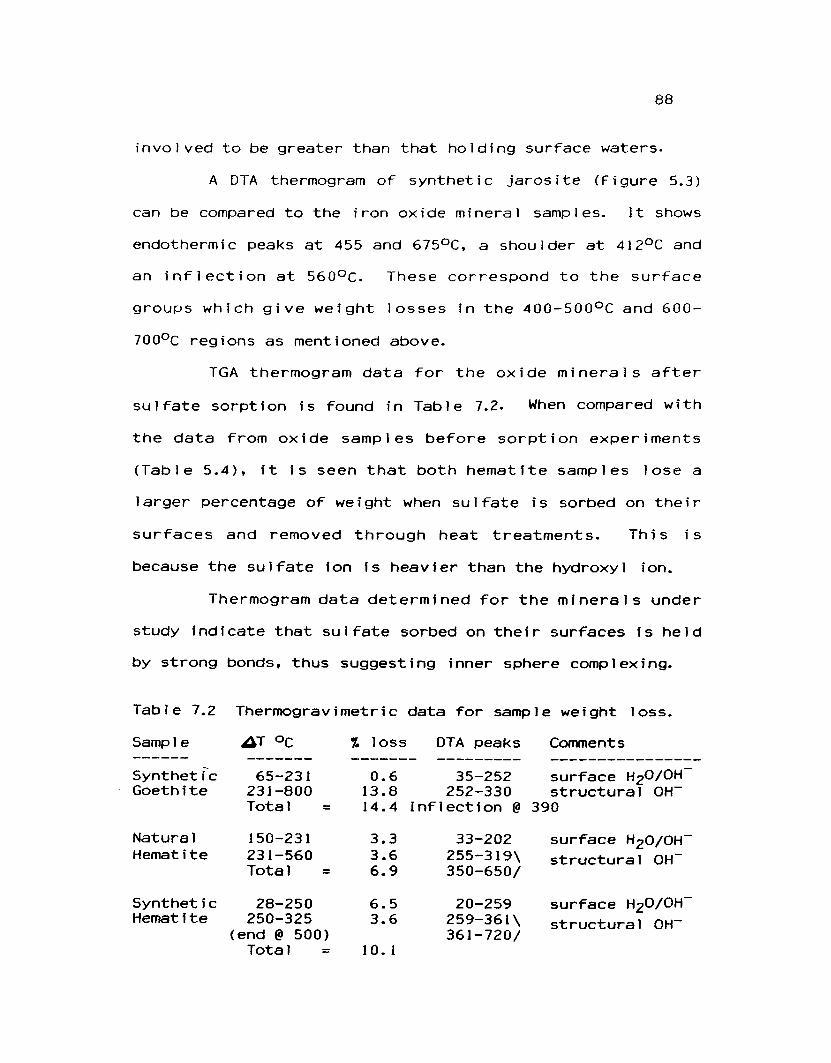
88
involved to be greater than that holding surface waters.
A DTA thermogram of synthetic jarosite (Figure 5.3)
can be compared to the iron oxide mineral samples. It shows
endothermic peaks at 455 and 675°C, a shoulder at 412°C and
an inflection at 560°C. These correspond to the surface
groups which give weight losses In the 400-500°C and 600-
700°C regions as mentioned above.
TGA thermogram data for the oxide minerals after
sulfate sorption is found in Table 7.2. When compared with
the data from oxide samples before sorption experiments
(Table 5.4), it is seen that both hematite samples lose a
1arger percentage of we i ght when suI fate i s sorbed on the i r
surfaces and removed through heat treatments. This is
because the sulfate ion is heavier than the hydroxyl ion.
Thermogram data determined for the minerals under
study indicate that sulfate sorbed on their surfaces is held
by strong bonds, thus suggesting inner sphere complexing.
Thermogravimetric data for sample weight loss.Table 7.2
Samp 1e AT °C % loss DTA peaks Comments
Synthet i c 65-231 0.6 35—252 surface H2O/OH structural OH"Goeth i te 231-800 13.8 252-330
Total = 14.4 Inf1ect i on @ 390
Natural 150-231 3.3 33-202 surface H2O/OH-Hemat i te 231-560
Total3.66.9
255-319\350-650/
structural OH-
Synthet i c 28-250 6.5 20-259 surface H2O/OH”Hemat i te 250-325
(end @ 500)Tota1 =
3.6
10. 1
259-361\361-720/
structural OH-

89
0.4
mv
Figure 7.1 Differential thermograms of mineral after su 1 fate sorpt i on.
samp 1 es
SG = synthetic goethite SH = synthetic hematite NH = natural hematite
2 and 3 are exothermic peaksB and C are endothermic peaks
indicate peak positions before sorption.

90
IV. Mössbauer Spectroscopy -
Mössbauer spectra of the three oxide samples,
previously treated with sulfate, are taken at room
temperature and compared with spectra obtained from
untreated samples (see Figure 5.5). Spectra are taken at
several velocities to get a clearer view of areas which
might be obscured at normal velocities.
No changes in the spectra from those of untreated
samples are observed. No doublet arising from jarosite
quadrupole splitting of possible precipitants is observed in
any of the oxide spectra.
V. Ion Concentrâtion Product -
Experimental oxide suspensions contain ions with
known or control led concentrations ([K+] = IO-2 M, [OH-] =
10-11 M, [S04=] = x). Iron content of suspensions measured
by atomic absorption is 1 0-5 M for hematite and 1 0-^ M for
goethite. Ion concentration products (ICP) can be compared
to known solubility products to determine if mineral
precipitation is possible under said conditions.
Jarosite { K F e 3 ( S O 4 ) 2 ( OH ) 6 } * suspected of
precipitating on iron oxide surfaces, has a solubility
product (pKso) of 98.56 (VIek et al. 1974).
[K+][Fe3+]3[S04j2[0H-]6 = ICP
In solution, if:

91
1CP < Kso, no precipitation occurs (undersaturation).
ICP = Kso, saturation.
1CP > Kso, precipitation is possible (supersaturation).
For saturation with respect to jarosite, the system
requires a minimum concentrât i on of 3 ppb and 30 ppm
su 1 fate ion for hematite and goethite respectively at pH 3.
In present experiments, al 1 solutions were saturated with
respect to jarosite at pH 3. However, no evidence of a
precipitant is observed.
VI. Exchange Capacity -
The titration of a blank (KNOj) sample is completely
reversible. But when an oxide is added to the solution, the
system changes. Some H+ (or OH") remains on the surface and
is removed with the oxide when the suspension is fi 1 tered
and is thus unavailable for back titration (Figure 7.2).
If experimental exchange capacity titrations are
performed on an oxide at its zero point of charge, it is
expected to treat excess amounts of acid and base similarly
because at the zpc there are equal amounts of positive and
negative charges on the surface. That is, the surface is
expected to retain/re1 ease similar amounts of H+ ions upon
acid/base additions
SURFACE :4- H+
Fe-0H2+ <------------l
+0H
start Fe-OH zpc
Fe-0"
(also see Figures 4.1 and 4.2)

92
It must be kept in mind that this system is a
suspension, with a sol id and a 1 iquid part, and that this
solution must be considered when examining exchange
capacity. The PH2pC of goethite is about 7. This is the
point where [H+] = [OH-] in solution and excess amounts of
added acid or base should behave similarly. But the
hematite zpcs are higher (8-8.8) and [OH-] > [H+] in
solution. At a pH below their zpc, these oxides wi 1 1 have
net positive sites on their surface and wi 1 1 be in an
environment where [H+] = [OH-] or [H+] > [OH-], thus having
excess H+ in solution. In solutions where pH is not
neutral, ions may not be treated similarly.
Figure 7.2 Suspension treatment for exchange capacity determ i nat i on.
REMAINING H+NEUTRALIZEDEXCESS H+
* BACK TITRATE H£0 H20—> WITH ------> H20 H20
F KOH pH INCREASEILT
B RY A
OXIDE" SUSPENSION BLANK
pH INCREASE
T I 0N BACK TITRATE REMAINING 0H-
—*—> WITH -------* NEUTRALIZED* hno3 h2o h2o* h2o h2o* pH DECREASE

93
Short (pH 3-7) and long (pH 3-11) titrations are
performed onall oxides. For short A/B and B/A titrations
(where A=acid, B=base and / designates a filtration step)
started at neutraI pH on oxides of neutral PHzpc, the oxide
is expected to exchange equal amounts of acid or base.
Experimental ly, short titrations show a sma 1 1 er exchange
capacity and hydroxy) surface coverage in A/B runs, where
the surface is loaded with H+, than in B/A runs, where the
surface is loaded with OH-. However, short titrations stil 1
give an unclear picture of exchange capacity. For example,
goethite is the only oxide shown to hold H+ on its surface.
To get a better view, extended titrations (covering pH 3 to
11) are performed. Here the initial pH is unimportant as it
is adjusted to 3 or 11 with the first titrant. In AB/A the
surface is loaded with OH-, in BA/B the surface is loaded
with H+ before filtering and back titration.
From Table 7.3, it is seen that although exchange
capacity titrations start on the hematites at pH < zpc and
on goethite at a pH > zpc, al 1 hold OH- on their surfaces
in an extended titration pH range. The titrations give
differing results in that AB/A show more hydroxyls being
exchanged for synthetic minerals and BA/B show more
hydroxyls exchanged for natura 1 hematite. This indicates
the possibility of several surface sites which are being
activated under differing conditions. Note there is no
pattern between oxide zpc and exchange capacity for AB/A vs

94
Table 7.3 Exchange capacity related characteristics.
BET-SA EXCH-CAPSAMPLE ZPC m^/g umoles/g ion/nm^ Comments
412.3
Synthetic 8.0 43.2 3. 150Hemat i te 205.8pH j 6.6 733.5
1229
Natura1 Hemat i te pH j 6.5
8.8 12.0 174.8 196.0 408.3 498.5
Synthet i c 7. 1 44. 1 74.70Goeth i te 230.5pHj 8, 9 1316
/ designates where filtering
OH 0.04 A/B Sorbs moreOH 2.9 B/A SO^ thanOH 10.2 AB/A NHOH 5.8 BA/B
OH 8.8 A/B SorbsOH 9.8 B/A 1 east SO4OH 24.3 AB/A of oxidesOH 24.8 BA/B exami ned
H 1.0 A/B Sorbs lessOH 3.2 B/A SO4 thanOH 18.0 AB/A SHOH 16.8 BA/B
took p 1 ace pHj = initial pH
BA/B. Synthetic hematite, with the mid value zpc, has
exchange capacity measurements which differ most for the two
extended titrations.
Total exchange capacity is the maximum number of
exchangeable hydroxyl groups at the oxide surface (=FeOH-j-)
in yjmol/g. When normalized to surface area (groups/nm^), it
can be compared to literature values listed in Table 7.4.
Experimentally determined values are observed to be higher
than most literature reports. Close agreement is seen
between Yates (1975) goethite data and that of this study.
CALCULATION:
Approximate exchange capacity can be calculated by
assuming the oxide surface to be covered by spheres of
the hydroxy 1 ion radius 1.85 X. Hydroxyl ions should cover

95
approx i mate I y 10.8 x10⁻² nm2 , meaning there are
approximately 9.26 OH per 100 X2 (= 9.26 OH/nm2). Us i ng
the surface areas of the oxide minerals determined i n
Chapter 5, the approximate exchange capacity for synthetic
hematite is 664 y_imo 1 OH/g, for natural hematite is 186 Jarno 1
OH/g and for synthetic goethite is 678 yumo 1 OH/g. Remember
these approximations do not consider surface sites, which
should change the numbers significantly.
Experimentally derived data may differ from
theoretically calculated values due to the differences in
the types and reactivities of 0H~ groups, including binding
and repulsive effects. Experimental values (Table 7.3) for
synthetic oxide samples examined here are lower for
synthetic hematite and goethite in short titrations, but
extended titrations give values general ly higher than
calculated approximations. Different results for short and
long, acid and base, titrations indicate the possibility of
activation of more than one phase or site under differing ph
conditions.
Thermogravimetric data on the removal of surface
water can also be compared to exchange capacity results.
TGA shows 15, 20 and 30 OH/nm2 (versus 18.0, 10.2 and 25.0
OH/nm2 as reported in Tables 7.3 and 7.4) for synthetic
goethite, hematite and natural hematite respectively. Data
for goethite and natural hematite agree well.

96
Table 7.4 Reported coverage
exchange .capacity (SC) va Iues.
(EC) and surface
EC umol/g
SCOH/nm2
SA m2/g Reference Oxides
10 M i ca1e e.t al. C (H+G)200 4 28-\ S i gg and Stumm M (G)350 6-7 29/ M
2.7 Parfitt et al. M (G)1348 16. 74 48.5 Yates M (G)550 3.5-6.9 48-96 Russel et al. M (G)
134-269 4.5-9.0 18 Breuwsma M (H)6.7-7.9 Morimoto et al. M (H)
9 C(68) 4.3 9.6 Jur i nak M (H)(93) 5.6 10 McAfferty and (H)
Zett 1emoyer M1316 18 44. 1 \ M (SG)678 9.26 \ C
733.5 10.2 43.2 \ This Study M (SH)664 9.26 / C f»
498.5 25 12.1 / measured = M (NH)186 9.26 / calculated = C »»
VI I. Hydroxide Release vs Sulfate Sorption -
For sorption experiments, known amounts of K2SO4 are
added to oxide suspensions. During reaction, pH is noticed
to rise. To determine how much OH- is released (or H+
consumed) during sorption (1) a calculation is made from
monitored changes in pH of the. solutions and (2)
experimental titrations are performed to measure hydroxyl
release during reaction.
CALCULATION:
The calculation of hydrogen consumption or hydroxyl
release during reaction is performed for several different

97
initial solution sulfate concentration levels» including the
highest levels run for each oxide. Initial pH before
reaction (initial moles H+) and final pH at the end of
reaction time (final moles H+) are compared to determine
change in moles H+ for the reaction.
Samples of suspension are analyzed for remaining
sulfate to determine sulfate consumed. Then the ratio (R)
of (yumo 1 es H+ consumed} to (yjmoles S04 sorbed} is
calculated. Notice, in Table 7.5, the decrease in R as the
[S04] j increases. Thus the more sulfate sorbed, the less H+
consumed as the experiment proceeds.
EXPERIMENTAL TITRATION:
During several sulfate sorption experiments, acid is
added titrimetrical ly to maintain the original suspension
pH. Acid additions are monitored throughout the time of the
experiments in order to determine the amount of OH- released
from the oxide surface and thus neutralized by the added
acid. At pH 3 (5), the hydroxyls released during sulfate
sorption are 1/10 (1/14), 1/5 (1/6) and 1/5 (1/24) of
measured exchange capacity of goethite, hematite and natural
hemat i te respect i ve1 y.
The ratio (R) = {yjmoles H+ consumed}/^umo1es S04
sorbed} is determined using sulfate values derived from
sorption isotherms (see Table 7.6). Calculation, as in
above section, underestimates the actual H+ consumed during
sorption of sulfate. This is reflected in the ({H+}/{SO4=})

98
ratio by exhibition of lower R values when using calculated
H+ consumed divided by isotherm determined values of sorbed
sulfate. This difference is noticed for al 1 sorption
experiment data, suggesting that there is some buffering in
the system which prevents the actual change in [H+] from
being fu1ly exhibited by observed pH changes. Thus
only titration shows the true H+ consumed.
Raw sulfate data are obtained from one set of early
experiments and used to illustrate changing ratios observed
throughout the range of initial sulfate concentrât ions used
(Table 7.5). For these data [H+] ca1 eu 1ated from observed
pH changes is used since no titrations were being performed
at that t ime.
The early raw data do not reflect later determined
Isotherms we 1 1 nor the i sotherm su 1 fate va 1ues reported i n
Table 7.6. Isotherm values reflect (i) true isotherm
sorption maxima or (ii) 'approximate' sorption maxima
(labeled ~), meaning maximum sorption values determined for
numerous 500 ppm initial su 1 fate concentrât ion experiments
on these oxides. These values are more correct than the
initial 'raw' values and show distinctly different
influences on H+/SO4= ratio calculations.

99
Table 7.5 Ratio of hydrogen consumed to sucalculated from ear 1 y raw data.
(R) (R)ppm {yjmo 1 Hi} (yumo 1 Hi}
OXIDE [SO4]j {pmol S04) hjmol S04}• (pH 3) '(pH 5)
Synthet i c 5 1 .28 0. 16 i dHemat i te 20 0.64 0.08 e
30 0.48 0.08 ! c40 0.58 0.08 r50 0.77 0.08 i e100 0.65 0.07 Î a300 0.55 0.04 ! s500 0.43 0.03 \,'/e
Synthet i c 5 1.28 0.57 i dGoeth i te 20 0.71 0.08 ! e
30 0.66 « c40 0.64 1 r50 0.69 0.05 Î e100 0.57 0.04 Î a300 0.56 0.04 ¡ s500 0.56 0.03 \!/e
Tab 1 e 7.6 Ratio of hydrogen consumed titration data
to su 1 fate sorbed from initial [SO4j.500 ppmfor
OXIDE pH^/umol/g H+} acid used
{umol/g SO4} ’ sorbed
(R) ^jLimol Hi} ÿumol S0/|}
Synthet i cHemat i te 3 154.6 ~ 275 0.56
(Langmu i r g i ves ~ 284 0.54)
5 125.6 ~ 80 1.57(Langmu i r g i ves ~ 82.5 1.52)
Synthet i c Goeth i te 3 147.5 151 0.98
5 93.8 73 1.28Natura 1 Hemat i te 3 106.1 45 2.36
46 ** 2.31(Langmu1r gives ~ 45.7 ** 2.32)
5 21.2 ND —(Langmu i r gives ~ 39.2** 0.54)
** Data from Wootton 1985

CHAPTER 8 MODEL OF SULFATE SORPTION ON FERRIC OXIDES
I. SORPTION SUMMARY
A. General Characteristics
The sorption reaction characteristics observed in
this study (Table 8.1) are comparable to literature reports
and can be summarized as fol lows:
a) The process is i n it iated by a fast react ion fo 1 1 owed by a
Ionger, s1ower one whi ch appears to equ i 1 i brate within 24
hours. pH increases observed during the process due to H +
consumption or 0H~ release also equilibrate within this time
period.
b) Sorption decreases with increasing pH, as is observed in
soil and oxide studies in the 1iterature.
c) As the original solution sulfate concentration increases
the amount sorbed increases. That is, the total pmol/g
Hemat i te
Table 8.1 Sorpt i on react i on character i st i cs.
Equ i1 i br i um Time
Sorption With Respect Increas i ng
: to Desorption Act i V i ty
i n hrs eH fso^i IS s/s
Goethite 24 dec i nc inc @ pH5 ni 1 some
Hemat i te 24 dec inc n i Ì ni 1 some
Natural 24 dec i nc ni 1 ni 1 some
100

101
b1e 8.2 Sorpt i on max i ma and calculated max i mum poss i b1e
Samp
surface coverage by sulfate. i n yumo 1 /g
pH 7
(^imo 1 /m^).
maximum coverase>) e £ti 3 pH 5
Synthetic Goeth i te 151.0 72.9 20.8 372(3.42) (1.65) (0.47) (8.44)
Synthetic Hemat i te - - 17.6 364(0.41) (8.43)
Natura1 Hemat i te 45.0 ND* ND* 102(3.72) (8.43)
* ND = not determined
sorbed increases, although the total percent sorbed
decreases. Both synthetic goethite and natural hematite
reach sorption maximum (Table 8.2), after which increasing
amounts of sulfate cause no further increases in sorption.
d) No effect of ionic strength on the sorption isotherm is
observed for hematite. However, goethite exhibits ionic
strength effects at pH 5, where sorption increases with
ionic strength.
e) No effect on the sorption isotherm is observed when the
solid content/so1ution ratio of solutions is changed.
f) Goethite and hematite show desorption only when sorption
reactions are performed at pH 3, but sorption is not fu 1 )y
reversible. Goethite desorbs more sulfate than hematite
when the desorbing pH is maintained at pH 3 and larger
amounts are released when pH is raised to 7 (see Table 8.3).
Sorption on natura1 hematite is even less reversible than on
synthetic hematite.

102
Table 8.3 Percent desorbed from equilibrium solutions.
PH 1_500 ppm 300 ppm
pH 3500 ppm 300 ppm
Synthetic Goethite 41Synthetic Hematite* 23Natural Hematite 6.4
41296.4
* No sorpn max reached at pH 3 for
11.55.52.4
syntheti c
11.56.42.4
hemat ite
B. Sorption Maxima
Sorption data plots (Figure 6.4) show the curve
fitted maxima listed in Table 8.2. Literature goethite
values of 150 yumol/g (1.85 yjmo 1/m2) at pH 3 reported by
Hingston et al. (1972) and 75 yjmol/g (0.83 yumol/m2) at pH
5.1 reported by Parfitt and Smart (1977) can be compared
with goethite values determined in this study. A maximum of
125 yjmo 1 /g (1.39 yjmol/m2) at pH 3.4 was also reported by
Parfitt and Smart (1977). Inconsistencies between
experimental and literature values arise through differences
in surface area measurements.
Literature values for hematite-of 67 yumo 1/g (2.50
yjmol/m2) at pH 4.6 (Ayl more et al. 1967) and 85 yjmo 1/g (3.8
yjmol/m2) at pH 3.5 (Parfitt and Smart 1978) do not match
well with data obtained on the synthetic hematite due to
lack of adsorption maxima at the lower pH values. The
natural hematite maximum observed here appears to be lower
than that reported in the literature, but does match closely
the work of Wootton (1985) who reported an apparent maximum
at 46 Limo 1/g (3.80 Limol/m2). As above with goethite, the

103
differences between literature and experimental values can
be attributed to variations in measured surface area.
Calculated maximum surface coverage of oxide samples
by sulfate ions, approximately 19.7 X2 (0.197 nm2) in size,
are also 1 i sted i n Tab 1 e 8.2. Data show that only half of
the available surface space is actual ly occupied by sulfate
at pH 3 and less at higher pHs. The maximum coverage is not
reachable due to factors such as mineral dissolution (which
wil 1 occur if the pH is lowered more as required for
increased sorption), steric hinderance as ions crowd the
surface, and location, amount and type of exchange sites.
C. Isotherm Compar i son
Experimental data obtained in this study are
compared using both the Freundlich and Langmuir isotherms to
determine the better fit and in the case of the Langmuir, to
see if ca1cu1ated maxima agree with observed maxima.
Isotherm parameters are summarized in Tables 8.4 a and b.
Langmu i r isotherm data fit for oxide samples.Table 8.4a
Ox i de PH r Slope I Max K
Synthetic 3 0.99999 0.0066 0.2 152.3 32.9Goeth i te 5 0.99920 0.0134 2.5 74.6 186.5
7 0.99800 0.0422 5.5 23.7 130.5
Synthet i c 3 0.98277 0.0036 1.5 278.4 408.3Hematite 5 0.97500 0.0121 7.3 82.4 603.6
Natura17 0.99768 0.0494 6.3 20.2 127.6
Hemat i te 3 0.99895 0.0218 3.8 45.9 173. 1

104
coeffi c i ent
Table 8.4b Freundlich isotherm data fit for <
Oxide pH r Slope I
Synthet i c 3 0.95038 0.1047 1.8Goeth i te 5 0.95669 0.2160 1 . 1
7 0.98576 0.4229 0. 1
Synthet i c 3 0.94137 0.1961 1.7Hemat i te 5 0.94330 0.2237 0.8
7 0.95633 0.4729 0. 1Natura 1Hemat i te 3 0.97940 0.1222 1.2
r = correlation I = i ntercept Max = sorption maximum in yumol/gK = equilibrium constant *
Correlation coefficients show goethite data to have a much
better fit to the Langmuir than to the Freundlich equation.
Hematite data also show a better fit to Langmuir behavior.
for goethite.
The Langmuir sorption maxima for goethite for pH
levels 3, 5 and 7 (Table 8.4a) agree fairly we 1 1 with the
observed maxima
are observed for
of 151.0, 72.9 and 20.8 yumol/g. No maxima
pH 3 or 5 isotherms of synthetic hematite
for the range of concentrations under study (i.e. up to 500
ppm or approximately 5000 yumol/1 original solution sulfate
concentration). However, a maxima of 17.6 yumol/g is
observed at pH 7» which is within range of the Langmuir
calculated maxima. For natura 1 hematite, the calculated
Langmuir adsorption maxima is in fair agreement with the
observed maxima of 45 ybmol/g

105
D. Sorption in Relation to Surface Area
Aylmore et al. (1967) conclude sorption to be2
proportional to surface area due to sorption of 0.50 me/m
sulfate on hematite and pseudoboehmite (see their Table 1),
but their calculations are incorrect. Hematite (surface area
26.7 m2/g) sorbed 13.4 me/100 g (or 67 yjmol/g) of sulfate at
pH 4.6, which calculates to 5.0 yueq/m2 (or 2.51 yumol/m2).
Their pseudoboehmite data (sorption maxima 84.2 me/100 g.
surface area 165.5 m2/g) also gives 5.0 yueq/m2. Results for
the two oxides are expected to be si mi lar since sorption
methods on iron and aluminum oxides are similar. Aylmore et
al. (1967) report sorption maxima and surface area for two
kao 1 inite samples, but not the adsorption per unit area
values of 1.05 and 0.59 yueq/m2. The clay minerals give
different results from the oxides because their sorption
mechanisms are different.
Values determined in this study are listed In Table
8.5. Aylmore et al.'s (1967) data (5.0yueq/m2 or 2.5094
^imo 1/m2 at pH 4.6) are within range of these data. The
decrease in sorption per unit area with increasing pH is
Table 8.5 Sorption in relation to surface area.
pH 3 yumo 1 /m2 yjeq/m2
pH 5yjmo 1 /m2 yueq/m2
BH 7 yumo 1 /mz yueq/m
SG 3.42 6.84 1.65 3.30 0.47 0.94SH - - - - 0.41 0.82NH 3.72 7.44 ND ND ND ND

106
quite obvious in the present data. This leads to the
conclusion that sorption is not directly proportional to
surface area in the way Ayl more et al. (1967) believe.
II. OTHER EVIDENCE
A. OH- Released / S04 Sorbed = R
In Chapter 4, models for sulfate sorption on oxide
surfaces are il lustrated. Figures 4.4, 4.5 and 4.6 list the
ratio of number of ligands replaced to the number of anions
held (R) beside each model. Table 8.6 summarizes the
experimental R values obtained in this study, which can now
be compared to Chapter 4 mode 1 R va 1 ues.
Experimentally, synthetic goethite and hematite show
decreasing R with pH. This is expected since the surfaces
should have fewer hydroxyls, which coincidently are more
strongly held, as pH is lowered. If, for argument sake, a
fixed amount of su 1 fate i s sorbed at any pH, R wou 1 d have to
decrease with pH due to the decrease in available hydroxyls.
Synthetic goethite ratios indicate mono-ligand
exchange (one hydroxyl ion for one sulfate ion) at pH 3 and
Table 8.6 Ratio ofOH/SO4
hydroxyl released vs = (C)/(A) = (R)
sulfate sorbed.
pH 3 umol/g OH 'released
pH 5 "Timo 1 /g OH R 'released
SG 154.6 0.98 125.6 1 .28SH 147.5 0.56 93.8 1.57NH 106. 1 2.36 21.2 ND
* (OH released from 500 ppm initial exper i ment)

107
a 75:25 combination of mono and multi-ligand exchange (one
to two hydroxyls for one sulfate ion) at pH 5. Synthetic
hematite ratios indicate a 50:50 combination of
-0H2+ and -OH mono-ligand exchange at pH 3, and a 50:50
combination of mono and multi-ligand exchange at pH 5.
Electrostatic attraction also gives an R value that is
compatable with synthetic hematites sorption model at pH 3,
but it al lows large amounts of desorption, which is not
experimentally observed under these conditions. It appears
that for the above minerals, as pH changes, the sorption
mechanism shifts from a mono to a mu 11i- 1 igand exchange.
That is, at different pHs, different mechanisms come into
play according to the availability of various surface sites.
The natural hematite ratio indicates mu 11i- 1 igand
exchange, with one to three hydroxyls exchanged per one
sulfate at pH 3. The fol lowing two sections, B and C, show
natural hematite to possess a large hydroxyl surface
coverage and thus the ability to accommodate a high demand
for exchange, but there is at present no model for one
sulfate ion exchanging with three hydroxyl ions. It must be
remembered that this natural hematite sample has been
crushed. It may contain impurities which alter its surface
activity, and may have surfaces which are not behaving as
natura1 mineral faces.
B. Sample Weight Loss
Oxide weight loss through heat treatment is

108
indicative of surface and structural waters. Weight losses
can be used to calculate surface coverage by hydroxyls when
the two types of waters can be distinguished in the weight
loss measurement, as in Thermal Gravimetric Analysis (TGA).
Table 8.7 lists total percentage of weight lost by the oxide
samples when subjected to two types of heat treatment and
their approximate hydroxyl surface coverages.
General ly more weight loss is indicated by Loss On
Ignition (LOI) over TGA, except in the case of synthetic
hematite here, due to its efficiency in complete sample
destruction over the latter method. LOI values are total %
lost, internal ly and external 1 y. Increased weight loss after
sulfate treatment is expected due to the greater weight of
the sulfate ion over the hydroxyl ion.
Theoretical calculations discussed in chapter 7 give
a value of 9.2 0H/nm2 for hydroxyl surface coverage.
Literature values range from 2.7 to 16.74 (See Table 7.4).
Measured experimental values In Table 8.7 are greater than
both calculated and 1 iterature values, excepting LOI for
Weight loss on ignition (L), and by thermal gravimetric analysis before (H) and after(T) sulfate sorption, and resulting OH/nm^.
Table 8.7
% loss on ignition OH/nm^
X loss before sorpn
OH/nm^7. loss after sorpn
SG 15.34 16.4 14.3 15.3 14.4SH 0.85 4.8 3.5 19. 7 6.9NH 6.62 35.6 5.5 29.6 6.5
Approx i mate ca1culat i on us i ng total 7. lost, for compar i son only.

109
synthetic hematite data- The TGA and LOI values For natural
hematite are twice that of synthetic goethite. TGA natural
hematite surface coverage is 507. more than synthetic
hemat. i te.
C. Exchange Capacity
Table 8.8 summarizes exchange capacity data
with respect to hydroxyl surface coverage and sorption
efficiency. Note that synthetic hematite hydroxyl
surface coverage determined by exchange capacity methods is
not in as close an agreement with the TGA and LOI data
discussed above as are the other oxide samples. Exchange
capacity data for synthetic hematite 1ie between TGA and LOI
values. Why synthetic hematite data vary so widely is
uncertain.
Synthetic hematite has the lowest hydroxyl surface
coverage, sorbs the most sulfate of the oxide samples
studied and exhibits a high efficiency (hydroxyl released
on sorption vs maximum available for release). Goethite has
a moderate surface coverage, sorbs a medium amount of
Tab 1 e 8.8 Exchange sorpt i on
capacity and efficiency. (OH (C) / max exchange capacity
released (E) = X)
OH/nm2Efficiency (7.)
yumo1 OH/g pH 3 pH 5
Synthetic Goethite 18.0 1316 11.2 7.1
Synthet i c Hemat ite 10.2 733.5 21.1 17. 1
Natura1 Hemat i te 24.8 498.5 21.3 _,

110
sulfate and shows lower hydroxyl release efficiency. At pH
3, natural hematite has the highest surface coverage and
sorbs the sma1 lest amount of sulfate. It shows an
efficiency higher than goethite, but similar to synthetic
hemat i te.
D. Summary
All oxide samples examined sorb sulfate. Sorption
increases with sulfate concentration. Al 1 the oxides,
except synthetic hematite, reach a sorption maximum.
Sorption increases with decreasing pH. Under optimum pH and
[S04] conditions, approximate 1y half of the mineral surface
wi 1 1 be covered by sulfate ions. The sulfate ion is sorbed
i rre vers i b 1 y. Only a fraction of the sulfate can be
desorbed, an amount which increases as pH is raised.
Thermal analysis indicates the sulfate to be strongly
bonded. The presence of four infrared bands indicates
direct coordination of the sulfate anion with the iron
cation on the oxide surface.
Sulfate is specifically adsorbed by ligand exchange.
No evidence was found to support surface precipitation of
iron hydroxysulfate minerals as a sulfate sorption
mechanism. Sorption characteristics change with pH as
different surface sites (OH and 0H£+) become available to
interact with sulfate. It appears that the sorption
mechanism shifts from a mono to a multi-ligand exchange as
pH increases. Synthetic hematite sorbs the greatest amount

111
of sulfate per gram of oxide fol lowed by synthetic goethite
then natura1 hematite.
III. SORPTION BEHAVIOR MODELS
The iron oxide and hydroxide minerals prepared in
this study were positively identified using X-ray
diffraction, Mössbauer spectroscopy and scanning electron
microscopy. Mineral surfaces were characterized using
surface area, zero point of charge measurements, infrared
spectroscopy and thermal analysis. Neutron activation
analysis and X-ray fluorescence were used to look for
impurities. The structure of the iron oxides can be
pictured at the pH2pC as shown in Figure 8.1. Under
experimental conditions of pH 3 and constant ionic strength,
the structure illustrated in Figure 8.2 will form.
Figure 8.1 Schematic il lustrating the internal structure ofiron ox i des at the pHzpc.
11 0 I11
\ 11 / \ 11 OH
Where M = Fe3+\ 1 / \ 1: /M M
/ 11 \ / !! x +
/ 11 \ / 1! OH?
0 0 0 0\ t
1 / \ !! 0"\ 1
1 / \ !! /M M
/ 11 \ / i ! \
/ ! \ / !! OHi i 0 111

112
Figure 8.2 Schematic of oxide surface under the system conditions pH = 3 and constant ionic strength.
Oq
J 0 1 <
\ 1 / \ 11 OH
\ 11
M/ \ 1
1
M/.
/ 1 \ / 1\'
/ 11 \ / 1
1 oh2+ nÓ3-0 0 0 0\ 1
1 / \ 11 oh2+ no3_
\ i1
M/ \ 1
1
M/.
/ 11 \ / i
i \./ 1
1 \ / i OH0 0 0 0\ 1
1 / \ i i oh
\ 1
M/ \ i
i
M/.
/ 11 \ / i
i \./ 1
1 \ / i » oh2+ no3-
11 0 i
i
+3 -3 0
and <5^ are the charge of the planes respectively.
i nner, outer, and
The oxide surface exhibits positively charged groups
(-0H2+)» negatively charged groups (-0-) and neutral groups
(-0H). At pHZpC, positive and negative charges cancel each
other out so that the net surface charge equa1s zero- That
is, the surface acts as if it were completely covered by
neutral OH groups.
Surface hydroxyls are of three types, which give
rise to different types of reactivity. Triply and doubly
bonded hydroxyls are held strongly, thus are not 1ikely to
be very reactive. Singly bonded hydroxyl groups (A-type)

1 13
are held the least strongly» therefore are 1 fke1y to be the
most reactive. Infrared spectroscopy has uncovered evidence
in support of this idea for both phosphate and sulfate
sorption onto oxide surfaces (Parfitt and Atkinson 1976,
Parfitt et al. 1975, 1976, Parfitt and Russel 1 1977, Parfitt
and Smart 1977, 1978).
Studies in the 1 iterature give the reaction series
HPO3“ >> S04= > NO3“ ~ Cl“ for anion sorption in soils
(Harward and Reisenauer 1966). According to this series,
sulfate is expected to react with the iron oxide surface
much in the same way that nitrate and chloride do. That is,
by forming outersphere complexes through e1ectrostatic
attraction. if this is true, the results of experiments
performed in this study should be predictable as fol lows:
a) the reaction should be instantaneous,
b) there should be no pH change during the reaction as
no hydroxyl ions should be released to solution
(no ligand exchange),
c) there should be no changes in XRD, IR or Mössbauer
spectra (no structural changes),
d) there should be no morpho1ogica 1 changes visible by
SEM,
e) there should be no changes in thermal analysis
(DTA/TGA) spectra,
f) there should be a decrease in sorption per unit
surface area with increasing pH due to change in

1 14
surface charge (and thus +ve sites) with pH,
g) the reaction should be totally reversible,
h) there should be no sorption maxima.
i) the ratio of hydroxyl released to sulfate sorbed
(R) should be zero (no ligand exchange).
Figure 4.5 i11ustrates the possible electrostatic reactions
for the above oxide surface model.
Experimental results obtained in this study do not
agree with the above ’’expected” results for outer sphere
e1ectrostatic attraction as the mechanism for sulfate
sorption. Observations in this study are:
a) sorption is initiated by a rapid reaction which is
fol lowed by a longer slow reaction which takes 24
hours to reach apparent equilibrium,
b) pH increases on sorption as some OH” is released or
H+ consumed on reaction,
c) there are no changes in XRD or Mössbauer spectra,
but IR spectra show that some, not all, A-type
hydroxyls are replaced on sorption and the sulfate
ion symmetry indicates direct coordination with
the surface metal cations,
d) no morphological differences are seen in SEM images
after the sorption reaction,
e) occurrence of exothermic peaks at temperatures
higher than those required for electrostatic
attraction after reaction with sulfate indicate
1 15
breaking of strong bonds holding sulfate,
f) sorption per unit area decreases with increasing pH
due to decreasing number of reaction sites and
decreasing surface charge,
g) sorption is only part 1y reversible, desorption
increases with pH of desorbing solution,
h) sorption maxima are observed for each oxide sample
studied under specific pH conditions.
i) The ratio of hydroxyl released to sulfate sorbed
(R) ranges from 0 to 2, depending on specific
conditions.
The above observations suggest something other than
nonspecific e1ectrostatic attraction is contributing to the
overall behavior of sulfate during sorption. Precipitation
of an iron hydroxy sulfate mineral is one possibility as
supersaturation conditions for Jarosite exist, but no
evidence for formation of a precipitant was found. Another
possibility is inner sphere specific sorption through ligand
exchange. Figure 4.6 i 1 lustrates the possible 1 igand
exchange reactions for sulfate on the above oxide surface
mode 1. F i gure 8.3 illustrates the results of nonspec i f i c
and specific sulfate sorption on the surface sites discussed
in Figure 8.2.
Although some observations are consistent with
nonspecific sorption, others agree better with specific
sorption as the sorption mechanism. Thus, it is suggested

1 16
Figure 8.3 Schematic illustrating sulfate sorption ontosurface sites described in Figure 8.2.
<*i «01I 0 1 f a
•
4
4
. 1i gand exchange\ I1 / \ 11 o-so3- K+ . with OH R = 1\ 11 / \ 1 /. 4
M M 4
/ 11 \ / 11 \. . 1i gand exchange/ 1 \ / 11 0-S03- K+ . with H2o R = 0
0 0 0 0 • 4 4
\ 11 / \ 1
1 oh2+ no3- 4
\ 11 / \ 11 /. 4 4
M M a 4 4
/ 11 \ / 11 \. 4
/ 11 \ / 11 0 .0 . bi nuclear0 0 0 0 •X •bridging R = 2\ 11 / \ ! (Z *0 a . comp 1 ex\ 11 / \ • i /. 4 4
M M 4 4
/ 11 \ / i f \. a . electrostatic/ 11 \ / i i oh2+ S04= . attraction
11 0 ! 4
4
. only R = 04
that sulfate sorption on the iron oxide minerals prepared in
this study is a combination of the two mechanisms,
e1ectrostatic and mono and multi-ligand exchange, which act
under different system conditions to form the basis of
sulfate sorption behavior.

117
CHAPTER 9 ENVIRONMENTAL IMPLICATIONS
In the natural environment, soil is a complex
mixture of minerals (silicates, oxides and hydroxides),
organic matter, liquid (soil solution) and gas. Each phase
interacts with the others to help formu1 ate the behavior of
the soil complex as a whole. One can get a rough idea of
how soil behaves by examining an individual soil phase under
set conditions, then combinations of phases. Comparing
experimental results with true soi 1 behavior al lows
formulation of soil behavioral models.
In this study, sorption behavior for three oxide
samples is examined. Data can be used to give rough
calculations of how soils containing oxides may behave when
subject to sulfate inputs.
A. Sulfate Sorption Capacity of Soils:
A simple calculation can be carried out to determine
the soil sorption capacity for sulfate by comparing the
atmospheric deposition of sulfate to soil sorption.
a) atmospheric deposition:
Lerman (1979) reports the average rainfall on 1 cm2
of surface to be 86 cm3/yr (ml/yr). The average
concentration of sulfate in rainfal 1 over the Northeastern
117

1 18
United States Is 30 yumo 1 / 1 (Likens 1 976). Thus,
approximate 1y 2.58 ^imo 1 S04/yr (86 m1/yr x 0.030 yumo 1
S04/m 1 ) fa 1 1 s on 1 cm^ of soil surface.
b) iron oxide content of soils:
Consider two soils, one w i th a fa i r 1 y h i gh content of
free iron oxides, the other with a lower amount. For
examp 1e:
Average Avg.Type Location % Free Fe£03 PH
Brown podzolic soil Falcon, Manitoba 20 5.4Dark brown/black soil Waskada, Manitoba 3 7.5
Reference: Ehrlich et al. 1955
In these cases free extractable iron oxides refers to the
total soil iron occurring as hydrous oxides and uncombined
with layer structures (Buol et al. 1980).
The bu 1 k dens i ty of most so i 1 s f a 1 1 s in the range < 1
to 2 g/cm3 (Carmichael 1982). If average bulk density of
soil is assumed to be that of sandy loam, 1.4 g/cm3 dry
soil weight (Carmichael 1982), then the above soils contain
0.28 and 0.042 g/cm3 free iron oxides.
c) time required to load soils:
Knowing the average yearly sulfate input through
rainfall (section a) (Note: the present calculated value is
actully higher than Manitoba receives), the amount of iron
oxide in the soi 1 (section b) and the iron oxides sorption
capacity (present experimental results), the time required

119
Time required to saturate 1cm
Table 9.1 Estimated time, in years, required to saturate Manitoba soils with sulfate.
M i nera I PH Fa1 con so i1 Waskada soi1
s-goeth i te 3 16.39 2.465 7.91 1 . 197 0.34 0.63
s-hemat i te 7 1.91 0.295,3 more more
n-hematite 3 4.88 0.735,7 1 ess 1 ess
1oad the i ron oxide surfaces of the above examp
ca1cu1ated and summarized in Tab le 9.1.
It is important to note that the results tabulated
in Table 9.1 are dependent on the following assumptions:
1. all the free iron oxide is of one type (i.e. in
the present calculation, goethite).
2. no sorbed sulfate is desorbed throughout the
loading process.
3. system pH is set at 3, 5 or 7.
4. no other soil constituents are pertinent to the
sorptive properties of the soil, either
pos i t i ve1y or negat i ve1 y.
5. no other system ions are important.
6. soil is a uniform system of components.
Of course all of the above assumptions do not apply to real

120
world situations:
1. Soi 1 iron oxides are of many types with the
percentage of each being dependent on other soi1 properties
(soil type, parent material, age and pH).
2. Soi Is do not hold al 1 the su 1 fate permanent 1 y. Of
that sulfate sorbed, a certain amount is desorbable, an
amount which increases with pH of desorption. The sorbed
ion may be desorbed through washings with rainfal1 of lower
sulfate concentrations or higher pH, or by replacement by
stronger binding ions such as phosphate. Thus in reality,
it wi 1 1 take longer to reach the maximum sorption capacity
of a soil, if it is ever reached, due to possible repeated
'washing out' of sulfate. In other words, desorption can
constantly be occurring causing the sorption maxima to never
be reached.
3. The average pH of rainfal 1 in the eastern U.S.A, is
4.13 (Likens, 1976). The soil pH, listed in Table 9.1,
also differ from the assumed system pH. The combination of
rainfal1 and soi1 solution pH wi11 affect the sorption
reaction strongly.
4. Anion sorption occurs on several types of oxides
(iron and aluminum) as we 1 1 as on some clay surfaces. In
addition, organic materials tend to inhibit the sorption of
sulfate by blocking sorption sites.
5. There are many ions in soil solutions, of which
phosphate is a much stronger binder then sulfate- Phosphate

121
oxyanions wi11 block some of the surface sites and may
replace sulfate on other sites.
6. Soil is not a uniform mixture of components, but is
fairly structured. Different soi 1 types exhibit
characteristic profiles. Components in different parts of
the profile (horizons) come in varying forms and
concentrât ions. For example, spodosols have an oxide rich
horizon and an organic rich horizon. Although the oxide
rich horizon should have a high sulfate sorption capacity,
there will be interference from the organic rich horizon.
In summary, the calculation of soil sulfate sorption
capacity gives only an approximate figure of true sorption
capacity and must be interpreted as such. in reality, many
factors such as those discussed above, influence the
sorption capacity. In environmental studies of catchment
basins and related work, many of these factors are dealt
with and included in complex models to more closely simulate
the natura1 env i ronment.
B. Relevance to Watershed Acidification Models:
Several models which simulate watershed response to
changing inputs of acidic deposition have been used to study
watershed recovery processes. One model, the Direct Delayed
Response Program Model (DDRP) describes the dynamic response
of surface water chemistry as a function of rates of acidic
122
deposition and a few key soil processes. In particular» it
uses soi 1 sulfate adsorption as the control 1 ing factor of
1 ong term su 1 fate dynamics (Gal 1 oway et al. 1983, Cosby et
al. 1986, Hornberger et al. 1986).
The DDRP model uses a Langmuir type expression to
describe the sulfate sorption as a nonl inear function of the
equilibrium sulfate concentration in soil solution. It is
based on a lumped parameter formulation of hydrological and
chemical characteristics and assumes constant soil/soil
water contact. Inherent in the model is the assumption of
reversibility of sulfate adsorption; equilibrium adsorption
and desorption.
The concept behind this model is that if the rate of
acid deposition changes in aquatic and terrestrial systems,
a variety of constituents will respond, namely sulfate, base
cat ions and a 1ka 1 i n i ty. Th i s response i s not necessari 1 y
instantaneous. If the terrestrial system can act as a sink
through sulfate adsorption, a time lag will delay the
attainment of a new steady state (i.e. direct-de1ayed
response). The response time required is a function of the
hydro logic retention time and the amount of sulfate adsorbed
by the soil. So i1s with sma 1 1 su I fate sorpt i on capac i ty
will respond in a time near to the hydro logic response time
(months to years), soils with large sulfate sorption
capacity will respond more slowly (decades). When sulfate
deposition is reduced through emission controls, recovery is

123
again delayed by a time lag control led by hydro logic
retention time and sulfate desorption.
The results of the present work have significant
implications for the above model and all modelling studies
of environmental systems containing soils. This work has
shown sulfate sorption to be for the most part irreversible,
with desorption only occurring under certain specific
condi t ions.
A soil with a measurable amount of sulfate sorption
capacity will follow the DDRP model when amounts of acidic
deposition are increased. That is, the (new excess)
incoming sulfate will adsorb onto the soil oxides delaying
the equi 1 i brat i on of the surface water chemistry with the
new system conditions of increased sulfate concentration
until the sorption capacity is reached. After reaching
sorption capacity, hydrologic retention wi1 1 determine the
remaining time to equilibrium. However, because of
the irreversibility of sulfate sorption, the system wi11 not
react as predicted by the DDRP model when acidic deposition
i s decreased.
A neutra1 or a 1ka1ine soi1 is not likely to adsorb a
1arge amount of sulfate. An acidic soil, on the other hand,
wi11 adsorb a larger amount of sulfate and has the best
chance of desorbing some of that sulfate. Present data
indicate that the amount desorbed will be sma1 1 if the pH
remains low and wi11 only increase if the pH is raised.

124
Thus, if a smal1 amount of adsorbed sulfate is desorbed,
there wi11 be a time lag greater than that of hydrologic
response time before equilibrium is again reached. However,
if no sulfate is desorbed, as is the case with neutral to
a 1ka 1 i ne soils, equ i1i br i urn w i1 1 be estab Ii shed accord i ng to
hydro logic response time alone.
C. Other Aspects
Due to evidence uncovered by this study, it is now
known that a certain amount of sorbed sulfate wi 1 1 be
permanently bonded to soi 1 iron oxide particles. It is of
interest to speculate on the long term role of this sulfate
in soil systems.
Investigations into the coordination chemistry of
mineral weathering have recently led to the proposal of
several pathways for the dissolution of oxide minerals
(Furrer and Stumm 1986, Zinder et al. 1986). One is a
ligand-promoted dissolution reaction in which ligands
exchange with surface hydroxyl groups forming surface
complexes which polarize critical iron-oxygen bonds thus
facilitating the detachment of surface metal species. The
dissolution of reducible oxide minerals, like iron(III)
oxides and hydroxides, is facilitated under reducing
conditions because the Fe(II)-0 bond is more labile than the
Fe(III)-0 bond. Ligands capable of forming multidentate
125
complexes are thought to be most effective in this reaction.
Since the sulfate anion forms bi dentate complexes on iron
oxide surfaces, as evidenced by infrared spectra, it is
possible that sulfate is involved in the (reductive)
dissolution of iron oxide minerals in soil weathering
processes.
Another hypothesis, as to the long term role of
sulfate in soil systems, deals with the formation of basic
ferric sulfate minerals. Although no evidence was found in
this study for the precipitation of the iron hydroxy sulfate
mineral Jarosite, it is possible that in natural soil
systems basic ferric sulfates, such as jarosite, could
precipitate on oxide surfaces with the aid of microbes such
as Thiobaci 1 1 us f erroox i dans. In acid sulfate soils
containing these bacteria, basic ferric sulfates are common
(Ross et a 1. 1982)

126
REFERENCES
Adams. F. and Z. Rawajfih 1977. Basaluminite and
aluminite: a possible cause of sulfate retention by
acid soils. Soil Science Society of America, Journal
41:86-692
Ahmed, S.M. and D. Maksimov 1968. Studies of the oxide
surface at liquid-solid interfaces. (II) Iron
oxides. Canadian Journa1 of Chemistry 46:3841-3846
Albrethson, A.E. 1963. An electrochemical study of the
ferric oxide - solution interface. Ph.D. Thesis.
Massachusetts Institute of Technology, Cambridge,
Massachusetts.
Amarasirwardena, D.D., E. De Grave, L.H. Bowen and S.B.
Weed 1986. Quantitative determination of aluminum
substituted Goethite - Hematite mixtures by Mössbauer
spectroscopy. Clays and Clay Minerals 34:250-256
Atkinson, R.J., A.M. Posner and J.P. Quirk 1967. Adsorption
of potential determining ions at the ferric-oxide
aqueous electrolyte interface. Journal of Physical
Chemistry 71:550-558
Atkinson, R.J., A.M. Posner and J.P. Quirk 1968. Crysta1
nucleation in Fe(III) solutions and hydroxide gels.
Journal of Inorganic Nuclear Chemistry 30:2371-2381

127
Atkinson, R.J., A.M. Posner and J.P. Quirk 1972. Kinetics
of heterogeneous isotopic exchange reactions.
Exchange of phosphate at the c(-FeOOH aqueous solution
interface. Journa 1 of Inorganic and Nuclear
Chemistry 34:2201-2211
Atkinson, R.J., R.L. Parfitt and R.C. Smart 1974.
Infrared study of phosphate adsorption on goethite.
Journa1 of the Chemical Society, Faraday Transactions
I 70:1472-1479
Aylmore, L.A., G.M. Karim and J.P. Quirk 1967. Adsorption
and desorption of sulfate ions from soi 1
constituents. Soil Science 103:10-15
Balistreiri, L.S. and J.W. Murray 1981. The surface
chemistry of Goethite (o^-FeOOH) in major ion
seawater. American Journal of Science 281:788-806
Barrow, N.J., C.J. Asher and P.G. Ozanne 1967. Nutrient
potential and Capacity. III. Minimum value of
potassium potential for availability to Tr i fo1 i um
sybterraneufn in soil and solution culture.
Australian Journal of Agricultural Research 18:55-62
Barrow, N.J. 1967. Sulfur and developing agriculture in
Western Australia. Sulfur Institute Journal 3:2-5.
Barrow, N.J. 1967. Studies on extraction and on availability
to plants of adsorbed plus soluble sulfate. Soil
Science 104:242-249

128
Barrow, N.J. 1967. Studies on the adsorption of su 1 fate by
soi 1 s. Soi I Science 104:342-349
Barrow, N.J. 1969. Effects of adsorption of su 1 fate by
soi Is on the amount of sulfate present and its
avai1ab i1 i ty to plants. Soil Science 108:1 93-201
Barrow, N.J., K. Spencer and W.M. McArthur 1969. Effects
of rainfall and parent material on the ability of
soils to adsorb sulfate. Soil Science 108:120-126
Barrow, N.J. 1972. Influence of solution concentration of
calcium on the adsorption of phosphate, sulfate, and
molybdate by soils. Soil Science 113:175-180.
Barrow, N.J. and T.C. Shaw 1977. On the slow reaction
between soil and anions. Effects of time and
temperature of contact between an adsorbing soil and
sulfate. Soil Science 124:347-354
Bl earn, W.F., and M.B. McBride 1985. Cluster formation
versus isolated site adsorption. A study of Mn (II)
and Mg (II) adsorption on boehmite and goethite.
Journal of Colloid and Interface Science 103:124-132
Boehm, H.P. 1971. Acidic and basic properties of
hydroxylated metal oxide surfaces. Discussions of
the Faraday Society 52:264-275
Bo 1 land, M.D.A., A.M. Posner and J.P. Quirk 1976. Surface
charge on kaolinites in aqueous suspension. Australian
Journal of Soil Research 14:197-216.

129
Borgqaard, O.K. 1982. The influence of iron oxides on the
surface area of soi1. Journal of Soi1 Science
33:433-450
Borggaard, O.K. 1983. Extraction of amorphous Fe oxides by
E.D.T.A. from a mixture of Akaganeite (yB-FeOOH) and
amorphous Fe oxides. Acta Chemica Scandinavica
37A:169-171
Borggaard, O.K. 1983. Effect of surface area and mineralogy
of iron oxides on their surface charge and anion-
adsorption properties. C1 ays and Clay Minerals
31:230-232
Bornemisza, E. and R. Llanos 1967. Sulfate movement,
adsorption, and desorption in three Costa Rican
soils. Soil Science Society of America, Proceedings
31:356-360
Bowen, L.H. and S.B. Weed 1981. Mössbauer spectroscopic
analysis of iron oxides in soi 1 1N Advances in
Chemistry Series 194:247-261
Bowen, L.H. and S.B. Weed 1984. Mössbauer spectroscopy of
soil and sediments. _IN Chemical Mössbauer
Spectroscopy. Ed. R.H. Herber, Plenium Press N.Y.
Bowden, J.W., M.D.A. Bo 1 land, A.M. Posner and J.P. Quirk
1973. A general model for anion and cation
adsorption at oxide surfaces. Nature of Physical
Science (London) 245:81-82

130
Breuwsma, A. and J. Lyklema 1971. Interfacial electro
chemistry of Hematite (c^FeOOH). Discussions of the
Faraday Society 52:324-333
Breuwsma, A. 1973. Adsorption of ions on Hematite (o^
Fe2O3). A col loid - chemical study. Ph.D. Thesis.
Agricultural University, Wageningen, Netherlands.
Breuwsma, A. and J. Lyklema 1973. Physical and chemical
adsorption of ions in the electrical double layer on
hematite (Q^-Fe2O3). Journal of Col loid and
Interface Science 43:437-338
Breuwsma, A. 1973. Adsorption of ions on hematite (Ct
Fe2O3). Med. Landbowhogeschoo1. Wageningen 73-1.
124pp.
Brunauer, S., P.H. Emmett and E. Tel 1 er 1938. Adsorption
of gases in mu 11imo 1 ecu 1 ar layers. Journal of the
American Chemical Society 60:309-319
Buoi, S.W., F.D. Hole and R.J. McCracken 1980 Soi 1
Genesis and Classification Second edition. Iowa
State University Press, Ames, Iowa
Cabrera, F., L. Madrid and P. De Arambarri 1977
Adsorption of phosphate by various ox ides:
Theoretical treatment of the adsorption envelope.
Journal of Soil Science 28:30-313

131
Cabrera, F.» P- De Arambarri, L. Madrid and G.G. Toca
1981. Desorption of phosphate from iron oxides in
relation to equi1ibrium pH and porosity. Geoderma
26:203-21
Cail 1 ere, S. and S. Henin 1954. Sur quelques minéraux du
djebel debar. Bu 1 1 etin de la Société Française de
Minéralogie et de Cristallographie 77:479-490
Cambier, P. 1986. Infrared study of goethite of varying
crystallinity and particle size: I. Interpretation
of OH and lattice vibration frequencies. Clay
Minerals 21:191-200
Cambier, P. 1986. infrared study fo goethite of varying
crysta1 1 i n i ty and particle size: II. Crysta 1 1o-
graphic and morphological changes in a series of
synthetic goethites. Clay Minerals 21:201-210
Carmichael, R.S. 1982. CRC Handbook of Physical Properties
of Rocks. Volume III. CRC Press.
Chang, M.L. and G.W.Thomas 1963. A suggested mechanism
for sulfate adsorption by soils. Soil Science
Society of America, Proceedings 27:281-283
Chao, T.T., M.E. Harward and S.C. Fang 1962. Soi 1
constituents and properties in the adsorption of
sulfate ions. Soil Science 94:276-283
Chao, T.T., M.E. Harward and S.C. Fang 1962. Movement of
S35 tagged sulfate through soil columns. Soil Science
Society of America, Proceedings 26:27-32

132
Chao, T.T., M.E. Harward and S.C. Fang 1962. Adsorption
and desorption phenomena of sulfate ions in soil.
Soil Science Society of America, Proceedings 26:234-
237
Cole, D.W. and D.W. Johnson 1977. Atmospheric sulfate
additions and cation leaching in a Douglas fir
ecosystem. Water Resources Research 13:313-317
Conesa, A.P., J.C. Fardeau and G. Simon-Sylvestre 1982.
Phosphorus and Sulfur. IN Constituents and Properties
of Soi 1. Eds. M. Bonneau and B. Souchier. Academic
Press.
Cosby, B.J., G.M. Hornberger J.N. Gal 1 oway 1985.
Model 1ing the effects of acid deposition: Assessment
of a lumped parameter model of soil water and stream
water chemistry. Water Resources Research 21:51-63
Cosby, B.J., R.F. Wright, G.M. Hornberger and J.N. Gal 1 oway
1985. Model 1 ing the effects of acid deposition:
Estimation of long-term water quality responses in a
sma 1 1 forested catchment. Water Resources Research
21:1591-1601
Cosby, B.J., G.M. Hornberger, R.F. Wright and J.N. Gal 1 oway
1986. Model ling the effects of Acid deposition:
Control of long-term sulfate dynamics by soil sulfate
adsorption. Water Resources Research 22:1283-1291

133
Couto, W., D.J. Lathwe1 1 and D.R. Bouldin 1979- Sulfate
adsorption by two oxisols and an alfisol of the
tropics. Soil Science 127:108-116
Oeer, W.A., R.A. Howie and J. Zussman 1966. Rock Forming
Minerals. Wiley Interscience, New York.
Derie, R., M. Ghodsi and C. Calvo-Roche 1976. DTA study
of the dehydration of synthetic goethite (o^-FeOOH).
Journal of Thermal Analysis 9:435-440
Ehr 1 ich, W.A., H.M. Rice and J.H. El 1 is 1955. Influence
of the composition of parent material on soil
formation in Manitoba. Canadian Journal of
Agricultural Science 35:407-421
Ensminger, L.E. 1954. Some factors affecting the
adsorption of sulfate by Alabama soils. Soil Science
Society of America, Proceedings 18:259-264
Eriksson, E. 1955. Airborne salts and the chemical
composition of river waters. Tellus 7:243-250
Eriksson, E. 1960. The yearly circulation of chloride and
sulfur in nature meteorological, geochemical, and
pedological implications - Part 1. Tellus 11:375-403
Eriksson, E. 1960. The yearly circulation of chloride and
sulfur in nature meteorological, geochemical, and
pedological implications - Part 2. Tellus 12:63-109

134
Evans, T.D., J.R. Leal and P.W. Arnold 1979. Interfacial
electrical chemistry of goethite and especially the
effect of CO2 contamination. Journal of
E 1 ectroana 1 yt i ca 1 Chemistry and Interfacial
Electrical Chemistry 105:161-167
Fang, S.C., R.D. Nauca, T.T. Chao and M.E. Harward 1962.
A chromatographic approach to the determination of
sulfate adsorption and exchange of less retent i ve
soils. Soil Science 94:14-18
Feller, M.C and J.P K i mm i n s 1 979 Chemi c a 1
characteristics of sma 1 1 streams near Haney i n
Water Resources
Research 15:247-258
Fischer, W.R. and U. Schwertman 1975 The formation of
hematite from amorphous iron (III) hydrox i de C 1 ays
and Clay Minerals 23:33-37
Fitzgerald, J.W 1978. Natura 1 1 y occurr i ng organosu1 fur
compounds in soils. IN Sulfur in the Envi ronment,
Part II. Ecological Impacts. Ed J.O Nriagu. John
Wiley and Sons, New York. p. 391-444
Fitzpatrick, R.W. and U. Schwertman 1982 A 1-subst i tuted
goeth i tes an indication of pedogenic and other
weathering environments in South Africa. Geoderma
27:335-347
135
Forbes, E.A., A.M. Posner and J.P. Quirk 1974. The
specific adsorption of inorganic Hg (II) species and
Co (II) complex ions on goethite. Journal of Col loid
and Interface Science 49:403-409
Furrer, G. and W. Stumm 1986. The coordination chemistry
of weathering. I. Dissolution kinetics of -A 1203
and BeO. Geochimica et Cosmochimica Acta 50:1847-
1860
Galloway, J.N., S.A. Norton and M.R. Church 1983.
Freshwateracidification from atmospheric deposition
of sulfuric acid: A conceptual approach.
Environmental Science and Technology 17:541A-545A
Garrels, R.M. and C.L. Christ 1965. Solutions, Minerals,
and Equilibria. Harper and Row, 450 p.
Gast, R.C., E.R. Landa and G.W. Meyer 1974.
interaction of water with goethite (o^FeOOH)
The
and
amorphous hydrated ferric oxide surfaces. Clays and
Clay Minerals 22:31-39
Gebhardt, H. and N.T. Co 1 eman 1974 Anion adsorption by
al 1 ophanic tropical soi Is: (I) Chloride adsorption.
America, Proceedings 38:255-
259
Gebhardt, H. and N.T. Coleman 1974. Anion adsorption by
al lophanic tropical soils: (II) Sulfate adsorption.
Soi1 Science Society of America, Proceedings 38:259-
262

136
Gebhardt, H. and N.T. Coleman 1974. Anion adsorption by
a 1 1 ophan i c tropical soils: (III) Phosphate
adsorption. Soil Science Society of America,
Proceedi ngs 38:263-266
Goldberg, E.D. 1963. Chemistry - the oceans as a chemical
system. 1N The Sea Vol. 2: Composition of Seawater,
Comparative and Descriptive Oceanography. Ed. M.N.
Hill. Interscience Publishers, New York, p 3-25
Goodman, B.A. 1980. MossbauerSpectroscopy. IN Advanced
Chemical Methods for Soil and Clay Minerals Research.
Eds. J.W. Stucki and W.L. Banwart. D. Reidel,
Dordrecht, 1-92
Goodman, B.A. and D.G. Lewis 1981. Mössbauer Spectroscopy
of aluminous goethites (C^FeOOH). Soil Science
32:351-364
Harrison, J.B. and V.E. Berkheiser 1982. Anion
interactions with freshly prepared hydrous iron
oxides. Clays and Clay Minerals 30:97-102
Haque, I. and D. Walmsley 1973. Adsorption and desorption
of sulfate in some soils of the West Indies. Geoderma
9:269-278
Harward, M.E. and H.M. Reisenauer 1966. Reactions and
movements of inorganic sulfur. Soil Science 101:326-
335
137
Hasan, S.M., R.L. Fox and C.C. Boyd 1970. Solubility and
availability of sorbed sulfate in Hawaiian soils.
Soil Science Society of America, Proceedings 34:897-
901
Hazel, F. and G.H. Ayres 1931. Migration studies with
ferric oxide sols. I. Positive sols. Journal of
Physical Chemistry 35:2930-2942
Heinrichs, H. and R. Mayer 1977. Distribution and cycling
of major and trace elements in two central European
forest ecosystems. Journal of Environmental Quality
6:402-407
Hem, J.D. 1960. Some chemical species re 1 ationships among
sulfur species and dissolved ferrous iron. United
States Geological Survey Water Supply Paper 1459-C
Hem, J.D. 1970. Study and interpretation of the chemical
characteristics of natural water. Geological Survey
Water Supply Paper 1473, 2nd edition.
Hingston, F.J., A.J. Atkinson, A.M. Posner and J.P. Quirk
1967. Specific adsorption of anions. Nature
215:1459-1461
Hingston, F.J., A.J. Atkinson, A.M. Posner and J.P. Quirk
1968. Specific adsorption of anions on goethite.
International Congress on Soil Science, 9th
Transactions (Adelaide Australia) 1:669-678

138
Hingston, F.J., A.M. Posner and J.P. Quirk 1972. Anion
adsorption by goethite and gibbsite.(i) The role of
the proton in determining adsorption envelopes.
Journal of Soil Science 23:177-192
Hingston, F.J., A.M. Posner and J.P. Quirk 1974. Anion
adsorption by goethite and gibbsite. (II) Desorption
of anions from hydrous oxidesurfaces. Journal of
Soil Science 25:16-26
Horn, M.K. and J.A.S. Adams 1966. Computer - derived
geochemical balances and element abundances.
Geochimica et Cosmochimica Acta 30:279-297
Hornberger, G.M., B.J. Cosby and J.N. Gal 1 oway 1986.
Model 1 i ng the effects of acidic deposition;
uncertainty and spatial variability in estimation of
long term sulfate dynamics in a region. Water
Resources Research 22:1293-1302
Ivarson, K.C. 1982. Microbiological transformations of
iron and sulfur and their applications to acid
su1 fate soils and tidal marshes. I N Acid Sul fate
Weathering. Soi 1 Science Society of America Spec.
Pub 1n. 10. Madison, Wisconsin
Ivarson, K. C. 1986. Private Communication.
Johnson, D.W. and G.S. Henderson 1979. Su1 fate adsorption
and sulfur fractions in a highly weathered soil under
a mixed deciduous forest. Soi1 Science 128:34-40

139
Johnson, D.W., D.W. Brewer and D.W. Co 1 e 1979. The
i nfIuence of an i on mob i 1 ity on i on 1 c retent i on i n
wastewate r irrigated s o i JournaI of
Env i ronmenta1 Qua 1 ity 8:246-250
Johnson, D.W., D.W Co 1 e and S.P. Gesse 1 1979. Acid
precipitation and soil sulfate adsorption properties
in a tropical and temperate forest soi 1. Biotropica
1 s
1 1:38-42
Johnson, D.W. and D.W Cole 1980. Anion mobility in soils:
re 1evance to nutrient transport from forest
ecosystems Environment Internationa1 3:79-90
Joint Committee on Powder Diffraction Standards (JCPDS)
1974. Selected powder diffraction data for minerals.
Swarthmore» Pennsylvania
Jurinak, J.J 1964 Interaction of water with Fe and Ti
oxide surfaces: goethite, hematite and anatase.
Journal of Colloid and Interface Science 19:477-487
Jurinak, J.J. 1966. Surface chemistry of hematite: anion
penetration effect on water adsorption. Soi1 Science
Society of America, Proceedings 30:559-562
Kamprath, E.J., W.L. Nelson and J.W. Fitts 1956. The
effect of pH, sulfate,and phosphate concentration on
the adsorption of sulfate by soils. Soil Science
Society of America, Proceedings 20:463-466
Kerr, P.F. and J.L. Kulp 1948. Multiple differential
thermal analysis. American Mineralogist 33:387-419

140
Kulp» J.L. and H.H. Adler 1950. Thermal study of
jaros ite. American Journal of Science 248:475-487
Landa» E.R. and R.G. Gast 1974. Mineralogical
characterization and adsorptive properties of
amorphous and crystal 1 ine hydrated ferric oxides.
Tr. Mezhdunar. Kongr. Pochvoved 10th 7:132-8
Langmuir, D. 1964. Stability of carbonates in the system
CaO-MgO-CC^-H^O: Unpublished Ph.D. dissertation,
Harvard University, 142 p.
Langmuir, D. 1971. Particle size effect on the reaction
Goethite =- Hematite + Water. American Journal of
Science 271:147-156
Langmuir, D. and D.O. Whittemore 1971. Variations in the
stabi1ity of precipitated ferric oxyhydroxides. 1 N
Advances in Chemistry Series, Nonequilibrium systems
in natural water chemistry 106:209-234. American
Chemical Society, Washington, D.C.
Lerman, A. 1979. Geochemical Processes in Water and
Sedimentary Environments. John Wiley and Sons.
Likens, G.E., F.H. Bormann, R.S. Pierce, J.S. Eaton and N.M.
Johnson 1977. Biogeochemistry of a Forested
Ecosystem. Springe:—Ver 1ag, Ber1in - New York
Likens, G.E. 1976. Acid precipitation. Chemical and
Engineering News November 22:29-44
Liu, M. and G.W. Thomas 1961. The nature of sulfate
retention by acid soils. Nature 192:384

141
Lowe,L.E. and W.A. Delong 1961. Aspects of the sulfur
status of three Quebec sol Is. Canadian Journal of
Soil Science 41:141-146
Lumsdon, D.G., A.R. Fraser, J.D. Russel I and N.T. L i vesey
1984. New infrared band assignments for the arsenate
ion adsorbed on synthetic goethite (of-FeOOH).
Journa1 of Soil Science 35:381-386
Maclntre, W.H., W.M. Shaw and B. Robinson 1941. Influence
of limestone and dolomite upon sulfate retention from
annua 1 additions of potassium sulphate. Soil Science
51:73-84
Maclntre, W.H., W.M. Shaw and B. Robinson 1952. Nitrogen
recoveries from app 1 icat ions of ammonium chloride,
phosphate, and sulfate and outgo of complimentary
ions in rainwater leachings through a six-foot soil-
subsoi1 column. Soil Science Society of America,
Proceedings 16:301-306
Mackenzie, R.C., E. Paterson and R. Swaffield 1981.
Observation of surface characteristics by DSC and
DTA. Journal of Thermal Analysis 22:269-274
Madrid, L.E. and P. De Arambarri 1978. Adsorption
isotherms and hysteresis of H+ adsorption by
goethite. Geoderma 21:199-208

142
Madrid, L.E., and A.M. Posner 1979. Desorption of
phosphate from goethite. Journal of Soi1 Science
30:697-707
Madrid, L., E. Diaz, F. Cabrera and P. De Arambarri 1983.
Use of a three-plane model to describe charge
properties of some Fe oxides and soil clays. Journal
of Soil Science 34:57-67
Madrid, L., E. Diaz and F. Cabrera 1984. Charge
properties of mixtures of minerals with variable and
constant surface charge. Journal of Soil Science
35:373-380
Martin, C.W. 1979. Precipitation and streamwater
chemistry in an undisturbed forested watershed in New
Hampshire. Ecology 60:36-42
McCafferty, E. and A.C. Zett1emoyer 1970. Entropy of
adsorption and the mobi 1 ity of water vapor on 0^
Fe2°3- Journa1 of Col loid and Interface Science
34:452-460
McCafferty, E. and A.C. Zett1emoyer 1971. Adsorption of
water vapor on ©^-Fe2O3. Discussions of the Faraday
Society 52:239-254
McFee, W.W., J.M. Kel ley and R.H. Beck ' 1976. Acid
precipitation effects on soil pH and base saturation
of exchange sites. IN Proceedings of the First
International Symposium on Acid Precipitation and
Forest Ecosystems, May 12-15 1975, Columbus, Ohio.

143
Eds L.S. Dochinger and T.A. Se 1 i ga. U.S. Forest
Service Technical Report NE-23
McFee, W.W., J.M. Ke 1 ley and R.H. Beck 1976. Acid
precipitation effects on soils in the humid temperate
zone. U.S. Department of Agriculture, Forest Service
Technical Report NE-23
McKay, H.A.C. 1971. Kinetics of exchange reactions.
Nature 142:997-998
McKay, H.A.C. 1971. Principles of Radiochemistry. CRC
Press
McKe 11, C. M. and W.A. Willi ams 1960. A 1 ys i meter study of
sulfur fertilization of an annua 1-range soil.
Journal of Range Management 13:113-117
McLaughlin, J.R., J.C. Ryden and J.K. Syers 1977.
Development and evaluation of a kinetic model to
describe phosphate sorption by hydrous ferric oxide
gel. Geoderma 18:295-307.
McLaughlin, J.R., J.C. Ryden and J.K. Syers 1981.
Sorption of inorganic phosphate by iron- and
aluminum- containing soil components. Journa 1 of
Soil Science 32:365-378
Mekaru, T. and G. Uehara 1972. Anion adsorption in
ferruginous tropical soils. Soil Science Society of
America, Proceedings 36:296-300
144
Micale, F.J., D. Kiernan and A.C. ZettIemoyer 1985.
Characterization of the surface properties of iron
oxides. Journal of Col loid and Interface Science
105:570-576
Morimoto, T., M. Nagaro and F. Tokuda 1969. The relation
between the amounts of chemisorbed and physisorbed
water on metal oxides. Journa1 of Physical Chemistry
73:243-248
Muljadi, D., A.M. Posner and J.P. Quirk 1966. The
mechanism of phosphate adsorption by kaolinite,
gibbsite, and pseudoboehmite. (I) The isotherms and
the effect of pH on adsorption. Journa1 of Soi 1
Science 17:212-229
Muljadi, D., A.M. Posner and J.P. Quirk 1966. The
mechanism of phosphate adsorption by kaolinite,
gibbsite, and pseudoboehmite. (II) The location of
the adsorption s i tes. Journa 1 of Soil Science 17:230-
237
Muljadi, D., A.M. Posner and J.P. Quirk 1966. The
mechanism of phosphate adsorption by kaolinite,
gibbsite, and pseudoboehmite. (Ill) The effect of
temperature on adsorption. Journa1 of Soil Science
17:238-247
Murad, E. 1979. Mössbauer Spectra of goethite, evidence
for structural imperfections. Minera1ogica1 Magazine
43:355-361

145
Murad, E. 1982. The characterization of goethite by
Mössbauer spectroscopy. American Mineralogist
67:1007-1011
Nakamoto, K. 1978. Infrared and Raman Spectra of Inorganic
and Coordination Compounds. 2nd edition. Wiley, New
York, 448 pp.
Nahon, D., C. Janot, A.M. Karpoff, H. Paquet and Y. Tandy
1977. Mineralogy, petrography and structures of iron
crusts (ferricretes) developed on sandstones in the
western part of Senegal. Geoderma 19:263-277
Nickel, E.h. 1984. An unusual pyrite - sulfur - .jarosite
assemblage from Arlcaroola, Southern Australia.
Mineralogical Magazine 48:139-142
Nodvin, S.C., C.T. Driscol 1 G.C. Likens 1968. The effect
of pH on sulfate adsorption by a forest soil. Soil
Science 142:69-75
Nordstrom, D.K. 1982. The effect of su1 fate on aluminum
concentrations in Natural waters. Some stabi 1 ity
relations in the system A12O3-SO3-H2O at 298 K.
Geochimica et Cosmochimica Acta 46:681-692
Nordstrom, D.K. 1982. Aqueous pyrite oxidation and the
consequent formation of secondary iron minerals. I N
Acid Su1 fate Weathering. Soi 1 Science Society of
America (1979) Symposium Proceedings Publication No.
10:37-56

146
Norrish, K. and R.M. Taylor 1961. The isomorphous
replacement of iron by aluminum in soi 1 goethites.
Journa1 of Soil Science 12:294-306
Onoda, G.Y. and P.L. DeBruyn 1966. Proton adsorption at
the ferric oxide aqueous solution interface. (I)
Kinetic study of adsorption. Surface Science 4:48-3
Parfitt, R.L., A.D. Thomas, R.J. Atkinson and R. St. C.
Smart 1974. Adsorption of phosphate on imogo1ite.
Clays and Clay Minerals 22:455-456
Parfitt, R.L., R.J. Atkinson and R.C. Smart 1975. The
mechanism of phosphate fixation by iron oxides. Soi 1
Science Society of America, Proceedings 39:837-841
Parfitt, R.L. and R.J. Atkinson 1976. Phosphate
adsorption on goethite. Nature 24-740-742
Parfitt, R.L., J.D. Russel 1 and V.C. Farmer 1976.
Confirmation of the surface structures of goethite
(ot’FeOOH) and phosphated goethite by infrared
spectroscopy. Journa1 of the Chemical Society,
Faraday Transactions i 72:1082-1087
Parfitt, R.L., V.C. Farmer and J.D. Russel 1 1977.
Adsorption on hydrous oxides. (I) Oxalate and
benzoate on goethite. Journal of Soil Science 28:29-39
Parfitt, R.L., A.R. Fraser, J.D. Russel 1 and V.C. Farmer
1977. Adsorption on hydrous oxides. (II) Oxalate,
benzoate, and phosphate on gibbsite. Journal of Soil
Science 28:40-47
147
Parfitt, R.L. and J.D. Russel 1977. Adsorption on hydrous
oxides. (IV) Mechanism of adsorption of various ions
on goethite. Journal of Soil Science 28:297-305
Parfitt, R.L. and R.St.C. Smart 1977. Infrared spectra
from bi nuclear bridging complexes of sulfate adsorbed
on goethite (c(^FeOOH). Journal of the Chemical
Society, Faraday Transactions 73:796-802
Parfitt, R.L. and R.St.C. Smart 1978. The mechanism of
su1 fate adsorption on iron oxides. Soil Science
Society of America, Journal 42:48-50
Parks, G.A. and P.L. DeBruyn 1962. The zero point of
charge of oxides. Journal of Physical Chemistry
66:967-973
Parks, G.A. 1965. The isoelectric points of solid oxides,
sol id hydroxides, and aqueous hydroxo complex
systems. Chemical Reviews 65:177-198
Parks, G.A. 1967. Aqueous surface chemistry of oxides and
complex oxide minerals. Isoelectric point and zero
point of charge. IN Advances in Chemistry Series
67:121-160
Parker, R.L. 1967. Composition of the earths crust. 1N Data
of Geochemistry. United States Geological Survey
Professional Paper 440-D, 19 p.
Paterson, E. 1980. Use of thermal methods of analysis in
the study of surface phenomena. Analytical
Proceedings 17:234-236.

148
Paterson, E. and R. Swaffield 1980. Influence of adsorbed
anions on the dehydroxy I ation of synthetic goethite.
Journal of Thermal Analysis 18:161-167
Pratt, P.F. and H.D. Chapman 1961. Gains and losses of
mineral elements in an irrigated soi 1 during a 20-
year lysimeter investigation. Hilgardia 30:445-467
Pritchard, D.T. and E.C. Ormerod 1976. The effect of
heating on the surface area of iron oxide. Clay
Minerals 11:327-329
Rajan, S.S.S., K.W. Perrott and W.M.H. Saunders 1974.
Identification of phosphate reactive sites of hydrous
alumina from proton consumption during phosphate
adsorption at constant pH values. Journal of Soi 1
Science 25:438-447
Rehm, G.W. and A.C. Ca 1 dwe I 1 1968. Su 1 f ur supplying
capacity of soils and the relation to soil type.
Soil Science 105:355-361
Rendon, J.L. and C.J. Serna 1981. Infrared spectra of
powder hematite: Effects of particle size and shape.
Clay Minerals 16:375-381
Rochester, C.H. and S.A. Topham 1979. Infrared study of
surface hydroxyl groups on hematite. Journal of the
Chemical Society, Faraday Transactions I 75: 1073-
1088
149
Ross, G.J., K.C. 1 varson and N.M. Miles 1982. Microbial
formation of basic ferric sulfates in laboratory
systems and in soils. IN Acid Sulfate Weathering.
Soil Science Society of America Spec. Pub 1n. 10.
Madison, Wisconsin
Russel, J.D., P.L. Parfitt, A.R. Fraser and V.C Farmer
1974. Surface structure of gibbsite, goethite, and
phosphated goethite. Nature 248:220-221
Russel, J.D., E. Paterson, A.R. Fraser and V.C. Farmer
1975. Adsorption of carbon dioxide on goethite (o^
FeOOH) surfaces and its imp1 ications for anion
adsorption. Journal of the Chemical Society, Faraday
Transactions I 71:1623-1630
Ryden, J.C. and J.K Syers 1975. Rationa1ization of ionic
strength and cation effects on phosphate sorption by
soils. Journal of Soil Science 26:395-406
Ryden, J.C. and J.K. Syers 1975. Charge relations of
phosphate sorption. Nature 255:51-53
Sanders, F.E. and P.B.H. Tinker 1975. Adsorption of
su1 fate by a sandy 1 oam so i 1 (Ca1c i c Camb i so 1).
Geoderma 13:317-324
Schwertmann, U., P. Cambien and E. Murad 1985. Properties
of goethites of varying crystal 1inity. Clays and Clay
Minerals 33:369-378

150
Shriner, D.J. and G.S. Henderson 1978. Sulfur
distribution and cycling in a deciduous forest
watershed. Journal of Environmental Quality 7:392-
397
Sibanda, H.M. and S.D Young 1986. Competitive adsorption
of humic acids and phosphate on goethite, gibbsite,
and two tropical soils. Journal of Soil Science
37:197-204
Sigg, L. and W. Stumm 1981. The interactions of anions
and weak acids with the hydrous goethite surface.
Colloids and Surfaces 2;101-117
Si 1 len, L.G. and A.E. Martel 1 1964. Stabi 1 i ty constants
of meta I-ion complexes. Special Pub 1 icat ion # 17.
The Chemical Society, London.
Si 1 len, L.G. and A.E. Martel 1 1971. Stabi 1 i ty constants
of metal-ion complexes. Supplement #1. Special
Pub 1 ication #25. The Chemical Society, Burl ington
House, London
S i mon-Sylvestre, G. 1969. So 1ub1e su1 fate in soils. Ann.
Agron. 20:435-447
Simon-Syl vestre, G. 1969. The total sulfur content of the
cultivated soils of France. Ann. Agron. 30:609-625
Stauffer, R.S. and R.H. Rust 1954. Leach i ng 1 osses in
ra i nfa1 1 and perco 1 at i on from 8 Illinois soils.
Agronomy Journal 47:207-211

151
Stumm, W. and J.J. Morgan 1970. Aquatic Chemistry. First
edition. Wi1ey-1nterscience, New York, N.Y. 583 pp.
Stumm, W. and J.J. Morgan 1981. Aquatic Chemistry: An
Introduction Emphasizing Chemical Equilibrium in
Natura 1 Waters. Second edition. Wi ley-Interscience,
New York, N.Y. 780 pp.
Swank, W.T. and J.E. Douglas 1977. Nutrient budgets for
undisturbed and manipulated hardwood forest
ecosystems in the mountains of North Carolina. I N
Watershed Research in Eastern North America. Vol 1.
P343-363. Ed. D.L. Corre 1 1. Smithsonian Institute,
Washington, D.C.
Tipping, E. 1981. The adsorption of aquatic humic
substances by iron oxides. Geochimica Cosmochimica
Acta 45:191-199
Troelstra, S.A. and H.R. Kruyt 1942. E1ectrophoretic
measurements on hydrophobic col loids. Koi loid
Zeitschrift 101:182-189
Van Breeman, N. 1982. Genesis, morphology, and
c I assificat i on of acid sulfate soils in coastal
plains. IN Acid Sulfate Weathering. Soil Science
Society of America Special Publication No. 10:95
Verdonck, L., S. Hoste, F.F. Roe 1 and and G.P. Van Der Ke 1 n
1982. Normal coordinate analysis of c^FeOOH. A
molecular approach. Journal of Molecular Structure
79:273-279

152
Vlek, P.L.G., J.M. Blom, J. Beek and W.L. Lindsay 1974.
Determination of solubility products of various iron
hydroxides and jarosite by the chelation method.
Soil Science Society of America, Proceedings 38:429-
432
Wi 1 1 iams, C.H. 1975. The chemical nature of su1fur
compounds in soi 1. IN Su1 fur in Austral ian
Agriculture. p 21-31
Wootton, R.S. 1985. Sorption of sulphate by iron oxides.
BSc Thesis, McMaster University, Hamilton, Ontario
Yates, D.E. 1975. The structure of the oxide - aqueous
electrolyte interface. Ph.D. Thesis, University of
Melbourne, Melbourne, Australia
Yates, D.E. and T.W. Healy 1975. Mechanism of anion
adsorption at the ferric and chromic oxide/ water
interfaces. Journal of Col loid and Interface Science
52:222-228
Yopps, J.A. and D.W. Fuerstanau 1964. The zero point of
charge of alpha-alumina. Colloid Science 19:61-71
Zinder, B., G. Furrer, and W. Stumm 1986. The coordination
chemistry of weathering: II. Dissolution of Fe(II I)
oxides. Geochimica et Cosmochimica Acta 50:1861-1869

153
APPENDIX A
SUMMARY OF OXIDE RESEARCH (Preparation, Sulfate Sorption)
HEMATITE STUDIES SA ZPC SM IS pH T
Ahmed Maksimov 1968 451 5.3+0. 05 — 0.001M KNO3 — __Natural Sample cm2/g 5.4+0. 05 — 0.1 M KNO3 — —
- interface study 308 5.7+0. 1 — 1 M KNO3 —6 — KC1 —
Albrethson 1963 23 8.70 — NaC 1 25
Atkinson et al. 1967 43.5 8.60+0 .2 — kno3 20+1.5Reflux Fe(NO3)3 18 44.6 9.27+0..1 0— KC 1 20+1.5days at b.p. pH 0-1 34. 1 8.45+0 .2 — kno3 20+1.5
- p.d.i. adsorption 36.4 8.90+0 . 15— KC1 20+1.5
Ayl more et al. 1967 26.7 NR 67 NR 4.6 20Reflux Fe(NO3)q 18 [(2.50)]days at b.p. pH 0-1
- adsorption/desorption by soil constituents
Boehm 1971 56 ------ — ------Calcination of precipitated a-FeOOH
-amphoteric propeties of hydroxylated surfaces
Borggaard 1983 14 7.3 — NaClheated goethite @ 560°C for 20 hrsheated feroxyhite @6 7.1 — NaCl — —560°C for 20 hrs
-surface charge/anion adsorption wrt surface area and mineralogy
Breuwsma Lyklema 1973/71 18 8.5+0.2 — KC 1 — 20+0.3boil @ pH 7, age at 140-150°C in an autoclave for 8 hrs
- ion and H20 adsorption, A/B titration.
Cabrera et al. 1977 1.2 6.45 — ------Precip FeC13 at b.p., filter, heat 1000°C for 1 hr heat Fe(NO3)3 9H20 17.3* 6.77at 150°C for 1 hr
- phosphate adsorption envelope
Jurinak 1964/1966 9.60 9.9Fischer Co.(Thermal decomposition of FeSO^)
- H20adsorpt i on
30Act i vat i on
Temperature

154
Madrid et al. 1983 110 6.7 — NaCl2 hr. decomposition of lepidocrocite @ 350°C
- adsorption of p.d.i. and electrolyte ions
McCafferty Zettlemoyer 10 ------ — ------1971 Fischer Co.
- adsorption of H2o
McLaughlin et al . 1981 18.0 ------ — ------ —reflux Fe(NO3)3 at b.p. for 18 days pH 0-1
- phosphate adsorption
Morimoto et al. 1969 14.5 (heat treated 250°C) — 25calcination of FeSÛ4 7H?0 @800°C for 7 hrscalcination of 21.2 (heat treated 250°C) — 25a-FeOOH @ 800°C in air for 5 hrs,then immersed in hot water at 80°C for 3 days
- water on metal oxides
Onoda DeBruyn 1966 21 8.3 fast — NaCl04 — 35hydrolyze Fe(NO3)3 at 8.5 slow titrationb.p. pH 0-1
- H+ adsorpt i on and k i net i cs
Parfitt et al. 1975 22 ------ — ------Reflux Fe(NO3)3 at b.p, pH 0-1 for 2 weeks
- adsorption of phosphate and infrared work
Parfitt Smart 1978 22 ------reflux FeiNOgjg at the b.p. for 2 weeks
- sulfate sorption, infrared work
85 KC1[(3.86)]
3.5 26
Parks DeBruyn 1962 reflux Fe(N0o)3 at
- hydrogen/hydroxyl
22 8.5 — KNO3the b.p. pH 0-1 adsorption, A/B titration
21
Pritchard Ormerod 1976 113 ------ignite goethite for 27 ------2 hrs at (i) 275°C and (ii) 600°C
- effects of heating on surfaces
at Temp > 573°C- infrared study of OH groups
Rochester Topham 1979 68 (NaOH, <673 °C) ------ — —FeC13 + base, aged 38 (NaOH, 673 °C) ------ — —overnight Q pH 7-8 27 (NH3, <623 °C) ------ — —filtered, dried = 117 (NH3, 713 °C) ------ — —fer1ge1. Heat i n 02 57 (NH3, 773 °C) — —

155
Tipping 1981 63 {6.3}reflux FeiNOg)^ at the b.p., pH 0-1
- adsorption of Humic Substances
TroeIstra Kruyt 1942 ------ 8.3 — — —react FeCl3 6H20 with NH4OH f
heat precip in autoclave at 150-160°C in h2o at 5 atm.
Wootton 1985 12.0 ------ 46 0 .01 NaCl 3 RTNatural Sample [(3.83)]
— ------ 35 0 .01 NaCl 5 RT- sulfate sorption [(2.92)]
aged FeCNOj^ at pH 12 for 24 hrs. at 60°C - surface chemistry in seawater
GOETHITE STUDIES SA ZPC SM IS pH T
Atkinson et al . 1967 70.9 7 .55+0.1 5 — KC 1 —20.3+0.4aged Fe(NO3)3 ph 12 for 24 hrs. at 60°C
- p.d.i. adsorption
Atkinson et al. 1972 13.8 — — — — —aged Fe(NO3)3 pH 12 38.2 — — — — —for 24 hrs. at 60°C 57.5 — — — — —
- isotopic exchange 64.3 — — — — —of phosphate (kinetics)
Balistreri Murray 1979• 48.5 7.5 — NaC1/KC1 — —aged Fe(NO3)3/FeC1O4 +0.2pH 12 for 24 hrs. at 60°C
- surface chemistry in1 seawater
Balistreri Murray 1981 51.8 7. 1 — seawater — —
Bl earn McBride 1985 82 ------ — ------ — —aged FeC104 (OH:Fe = l)at pH = 12 for 24 hrs at 60°C
- metal (Mn, Mg) adsorption and changes in surface charge
Borggaard 1983 16 7.2 — NaClaged Fe( 1*403)3 days at 60°C and OH/Fe = 3.5aged FeiNO?), at 82 7.6 — ------OH/Fe = 1.0 for 3 days at RT then age 2 days@ pH 12.3 and 55°C
- surface charge/anion adsorption wrt surface area & mineralogy
Cabrera et al. 1977 87.4 8.45 — ------Fe( 1403)3 + NaOH to pH 11.7, age 10 days at RT
- phosphate adsorption envelope/phosphate precipn from CaHPO4 solutions by Fe and Al oxides

156
Cabrera et al. 1981 54.4 8.4 — ------Fe(NO3)3 + NaOH to 87.4pH 11.7, age 10 days at RT
- phosphate adsorption wrt porosity/equi1ibriurn pH
- H+, OH-, and C02 adsorption/surface charge density, A/B titn
Cambier 1986 and 153 ( 4°C for 68 days) ------ — —Schwertman et a 1 1985 1 19 ( 10°C for 35 days)------ — —
Fe(NO3)3 + KOH aged 101 ( 1 5°C for 28 days)------ — —at X temp Y days 92 (25°C for 13 days)------ — —
85 (30°C for 13 days)------ — —- infrared study wrt 60 (40°C for 13 days)------ — —
particle size and 41 (50°C for 13 days)------ — —crystal 1inity 16 (60°C for 7 days) ------ — —
13 (70°C for 6 days) ------ — —
Evans et a 1. 1979 1 12 8. 75 — Na I __ __aged Fe(NO3)3 PH 12 for 24 hrs. at 60°C
- H+ adsorption and desorption
Forbes et al. 1974 aged Fe(NO3)3 at pH then at pH 1 1.7 for
- metal (Hg and Co) ad
891.9 fo3 day* sorpt i
{7.6} r 48 h > 3"t 6 on
rs at 60°C,0°C
Gast et al. 1974 32 — --- ------ — —aged ferric oxide gel (FeCl 3 + KOH) @ pH 12, at 60°C
- interaction of water with ox i de surfaces
Hingston et al. 1972 81 8.0 150 0.1 NaCl 3.0 20-23and 1974 [(1.85)]
— — 110 0.1 NaCl 4.0 20-23- anion adsorption and [(1.36)]
desorpt i on — — 60 0.1 NaCl 5.0 20-23[(0.74)]
32 7.8 NaC 1 — —28 8.3 NaCl — —17 8.0 NaC 1 — —
Jurinak 1964 16.2 — __ ___ __ 30Fischer Co. Act i vat i on
- H20 adsorption Temperature
Lumsdon et a 1. 1984 86 — ---- ------ __ __- Arsenite adsorption, infrared work
Madrid Arambarri 1978 70.5 8.71 NaCl — — 20+1aged FeiNCHH at 60°C for 24 hrs.

157
heat at 90DC for 16 hrs- phosphate adsorption
Madrid Posner 1979 method of Hingston et
- phosphate desorption
84 al
8.0 1968
NaC 1 25
Madrid et al. 1983 74 8.5 NaC 1 — —method of Hingston et a 1 1968
- adsorption of p.d.i. and electrolyte ions
McLaugh1i n et a 1.1981 17. 0 ------ — ------ — —aged Fe(NO3)3 @ RT at PH 11 for 2 days, then
Murad 1982 30 ------ — ------ —ferrihydrate transformat ion in 0.4 M KOH at 70°C for 14 days
88 ------ — ------ferrihydrate transformation in 2 M KOH at70°C for 8 days
89 ------ __ ------lepidocrocite transformat ion in 2 M KOH/ 1.23 x 10 4 M Si 0 Room Temp.
167 ------ — ------oxidation of 0.05 M FeClq in CH/COp pH 6-7 and RT
- Mössbauer studies
Parfitt et al. 1974 90 ------ — ------and Parfitt Smart 1976aged Fe(NO3)3 for 50 hrs. at pH 12 and 28°C
- phosphate adsorption, infrared studies
Parfitt et al. 1975 80 ------ — ------and Parfitt Atkinson 1976
aged Fe(NO3)3 for 50 hrs. at pH 12 and 28°C- phosphate adsorption, infrared studies
Parfitt Russell 1977 90 ------ — ------aged Fe(NO8)3 for 50 hrs. at pH 12 and 28°C
- ion adsorption, isotopic exchange, and infrared work
Parfitt Smart 1977/78 90 ------ 125 KC1aged Fe(NO3)3 @ pH 12 [(1.39)]for 50 hrs. 28°C ------ ------ ; 75 KC1
- sulfate sorption, infrared work [(0.83)]
3.4
5.1
26
26
Parfitt et al. 1977 90 ------ — ------aged Fe(NO3)3 50 hrs, adjust to pH 11.8, age 4 days at 60 °C
- organics adsorption envelope, infrared studies

158
Pritchard Orme rod 1976 50 ------ — ------ — -Fe(NO^)3 + NaOH stir 1 hr., age at pH 12, 60°C for 90 hrs
- heating effects on surface
Rendon Serna 1981 50 ------ — ------aged Fe(NO3)3 at pH 12 for 24 hrs at 60°C
- i nfrared study
Russel et al. 1974/75 60 ------ — ------age Fe(NO3)3 hrs at RT, adjust to pH 11.8, then age at 60°C for 4 days
- surface structure infrared studies, CO2 adsorption
Sibanda Young 1986 96.2 ------ — ------ —method of Hingston et al 1968
-competetive adsorption between Humic Acids and phosphate
Sigg Stumm 1981 28 7.0 — NaC104aged Fe(NO3)3 24 hrs 29 ------ — ------at pH 12 and 60°C
- A/B titration, anion adsorption work
T i pp i ng 1981aged Fe(NO3)3 24 hrs at pH 12 and 60°C
- adsorption of humic
11 {8.4}15 {8.2}18 {7.0}
substances
—0.002 M NaCl — —0.002 M NaCl — --0.002 M NaCl —
Yates Healy 1975 48aged Fe(NO3)3 for 24 hrs
- anion and H2O sorption,
7.5 — KNO3at pH 12 and 60°C A/B titration
— 25+1
SA = Surface Area (m2/g) IS = Ionic Strength T=Temperature °C {IEP} = Isoelectric Point
ZPC = Zero Point of ChargeSM = Sorption Maxima (/umol/g)
[(SS)] = SORBED SUL F ATE (/Limo 1/m2)