sorption of ammonium ion via cation exchange
TRANSCRIPT

i
Sorption of Ammonium Ion via Cation Exchange
A Final Report Presented by
Sara P. Reutlinger
in
Partial Fulfillment
of the
Requirements for the Degree of
Master of Science
in
Geosciences
with Concentration in Hydrogeology
Stony Brook University
2014
Stony Brook University

ii

iii
Abstract of the Final Report
Sorption of Ammonium Ion via Cation Exchange
A Final Report Presented by
Sara P. Reutlinger
in
Partial Fulfillment
of the
Requirements for the Degree of
Master of Science
in
Geosciences
with Concentration in Hydrogeology
Stony Brook University
2014
There are two purposes of this study. First, I used a cation exchange modeling program to
evaluate the percentage of ammonium released from cesspool effluent that can be sorbed onto
sand grains (Liu, 2005). I found that that only about 12-14% of ammonium can be adsorbed
regardless of CEC.
The second part of this study was the application of the cation exchange program to
predict a CEC value for a site described in a Long Island Pollution Study (NYSDOH,1969). At a
site in West Babylon where the bottom of the cess pool in a septic tank-cess pool system was 2
feet below the water table; the groundwater velocity was 0.67 feet per day; the plume length was
75 feet; the system had been installed five years before the study and the ammonium
concentrations are consistent with ammonium saturation throughout the length of the plume
requires a CEC value of 0.25 meq/100g. These results suggest that in areas with shallow water
tables, the main nitrogen species in a sewage plume may be ammonium not nitrate.

iv
Table of Contents
Introduction ............................................................................................... 1
Cation Exchange Model .............................................................................. 4
Exchange Reactions ................................................................................... 6
Pore Volumes ........................................................................................... 7
Cation Exchange Capacity of Long Island Sediments ......................................... 9
General Results of Cation Exchange Modeling ........................................... 12
Predicting CEC Using West Babylon Case Study ......................................... 15
Groundwater Concentrations ..................................................................... 16
Geologic Log .......................................................................................... 19
CEC of Study Site ................................................................................... 20
Conclusion ............................................................................................... 21
References ............................................................................................... 22

v
List of Figures
Figure 1: Cesspool Construction.................................................................................................. 1
Figure 2: Accuracy of cation exchange model ............................................................................ 3
Figure 3: Model of Transport and Sorption of Cations in a Sewage Effluent Plume .................. 4
Figure 4: Pore Volume Model ..................................................................................................... 8
Figure 5: Cation exchange capacity (CEC) of the core from Cathedral Pine County Park ....... 10
Figure 6: Cation exchange capacity of the sediments from Port Jefferson, South Setauket, soil
near Fox Pond and the beach cliff at David Weld Preserve ....................................................... 11
Figure 7: Percent of Ammonium Adsorbed onto Sand Grains of Varying CECs ..................... 13
Figure 8: Peak Ammonium Percent vs. CEC ............................................................................ 14
Figure 9: Site 2- West Babylon Well Concentrations................................................................ 16
Figure 10: Site 2- West Babylon Site Plan ................................................................................ 18
Figure 11: Detailed Log of Test Well ........................................................................................ 19

vi
List of Tables
Table 1: Selectivity of K+, Mg
2+, Ca
2+ and NH
4+ with respect to Na
+ ......................................... 5
Table 2: CEC of Different Materials ............................................................................................ 9
Table 3: West Babylon Well Concentrations ............................................................................. 15

1
Introduction
There are two parts to this study. The first part is to evaluate the proportion of ammonium
from sewage effluent from a cesspool that can be removed by sorption of ammonium ion onto
sediment surfaces by cation exchange using a cation exchange program. The second part will be
the application of groundwater data from a sewage plume located in West Babylon using the
cation exchange program for the purpose of predicting the soils’ cation exchange capacity or
CEC.
Understanding the nature of sewage plumes is useful especially given that the use of
septic tank cesspool systems with cesspools as leach pits is widespread across Suffolk County,
Long Island. As a result, nitrogen introduction into groundwater has become a major concern.
Residences and commercial buildings in Suffolk County rely on buried sanitary systems (septic
tank-cesspool systems), which add nitrogen first as ammonium and then by mineralization,
nitrate to the underlying groundwater. Figure 1 depicts the construction of a typical cesspool
similar to those found in Suffolk County.
Figure 1: Cesspool Construction- Cesspools are typically constructed of 6 to 12 foot diameter, 4 to 8
foot deep pre-cast concrete rings. Rings can be stacked depending on volume of the system needed. As
seen in the figure, rectangular holes are cut into the rings allowing fluids to leave the pool and for
oxygen to seep into the pool fueling microbial activity.
2
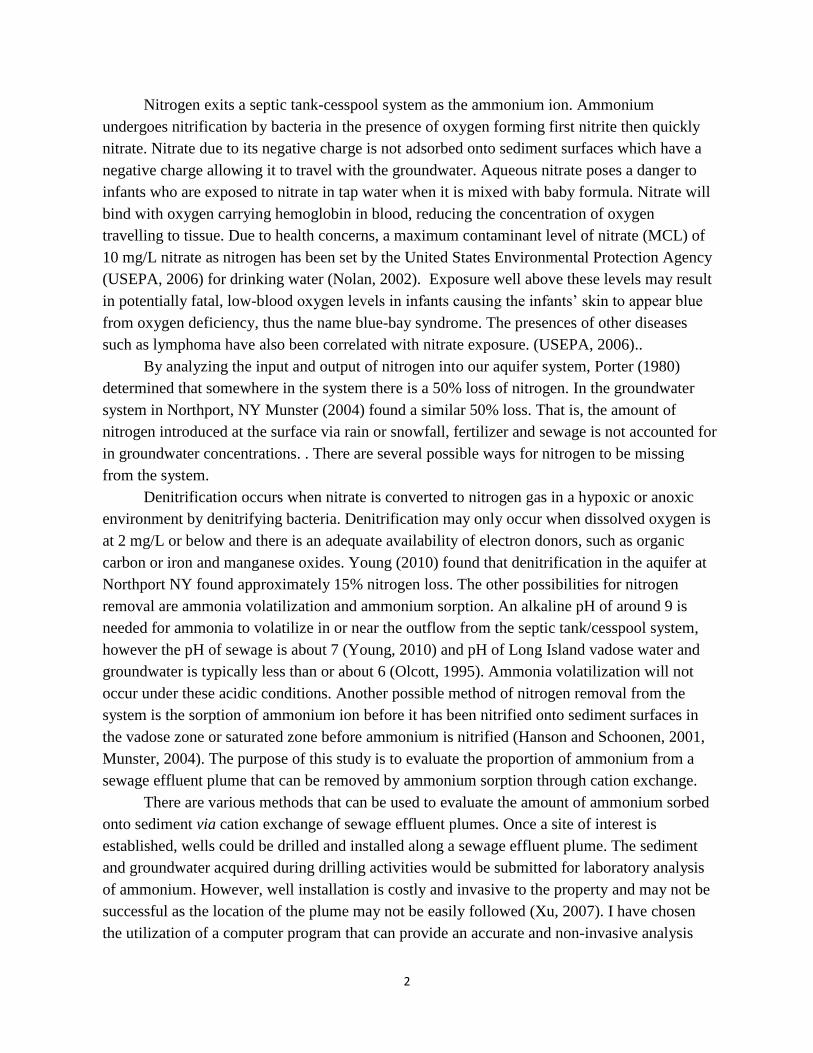
Nitrogen exits a septic tank-cesspool system as the ammonium ion. Ammonium
undergoes nitrification by bacteria in the presence of oxygen forming first nitrite then quickly
nitrate. Nitrate due to its negative charge is not adsorbed onto sediment surfaces which have a
negative charge allowing it to travel with the groundwater. Aqueous nitrate poses a danger to
infants who are exposed to nitrate in tap water when it is mixed with baby formula. Nitrate will
bind with oxygen carrying hemoglobin in blood, reducing the concentration of oxygen
travelling to tissue. Due to health concerns, a maximum contaminant level of nitrate (MCL) of
10 mg/L nitrate as nitrogen has been set by the United States Environmental Protection Agency
(USEPA, 2006) for drinking water (Nolan, 2002). Exposure well above these levels may result
in potentially fatal, low-blood oxygen levels in infants causing the infants’ skin to appear blue
from oxygen deficiency, thus the name blue-bay syndrome. The presences of other diseases
such as lymphoma have also been correlated with nitrate exposure. (USEPA, 2006)..
By analyzing the input and output of nitrogen into our aquifer system, Porter (1980)
determined that somewhere in the system there is a 50% loss of nitrogen. In the groundwater
system in Northport, NY Munster (2004) found a similar 50% loss. That is, the amount of
nitrogen introduced at the surface via rain or snowfall, fertilizer and sewage is not accounted for
in groundwater concentrations. . There are several possible ways for nitrogen to be missing
from the system.
Denitrification occurs when nitrate is converted to nitrogen gas in a hypoxic or anoxic
environment by denitrifying bacteria. Denitrification may only occur when dissolved oxygen is
at 2 mg/L or below and there is an adequate availability of electron donors, such as organic
carbon or iron and manganese oxides. Young (2010) found that denitrification in the aquifer at
Northport NY found approximately 15% nitrogen loss. The other possibilities for nitrogen
removal are ammonia volatilization and ammonium sorption. An alkaline pH of around 9 is
needed for ammonia to volatilize in or near the outflow from the septic tank/cesspool system,
however the pH of sewage is about 7 (Young, 2010) and pH of Long Island vadose water and
groundwater is typically less than or about 6 (Olcott, 1995). Ammonia volatilization will not
occur under these acidic conditions. Another possible method of nitrogen removal from the
system is the sorption of ammonium ion before it has been nitrified onto sediment surfaces in
the vadose zone or saturated zone before ammonium is nitrified (Hanson and Schoonen, 2001,
Munster, 2004). The purpose of this study is to evaluate the proportion of ammonium from a
sewage effluent plume that can be removed by ammonium sorption through cation exchange.
There are various methods that can be used to evaluate the amount of ammonium sorbed
onto sediment via cation exchange of sewage effluent plumes. Once a site of interest is
established, wells could be drilled and installed along a sewage effluent plume. The sediment
and groundwater acquired during drilling activities would be submitted for laboratory analysis
of ammonium. However, well installation is costly and invasive to the property and may not be
successful as the location of the plume may not be easily followed (Xu, 2007). I have chosen
the utilization of a computer program that can provide an accurate and non-invasive analysis

3
(Liu, 2005).
Liu’s, (2005) program effectively predicts the fate of cations in a plume with accuracy
when compared to laboratory analysis. She compared her modeled results with those of a study
focused on cation exchange and transport processes (Voegelin, 2000). Their laboratory
experimentation involved a column of packed soils through which solutions of differing cation
concentrations were leached through. Each solution equilibrated with soil particles and the fluid
effluent was analyzed. Figure 2 is a depiction of laboratory analysis in comparison with Liu’s
modeling. Points represent laboratory analysis while the lines represent Liu’s modeled data.
Concentrations are shown in moles per liter of solution or M.
I will add ammonium concentrations as found in a sewage plume to the contaminant
plume Liu created for the program. Using the output data I will compile results into graphs and
apply constraints to the sewage plume in order to evaluate ammonium ion exchangeability.
Figure 2: Accuracy of cation exchange program. A series of analytical data was plotted along with the
results given by modeling. A clear correlation can be seen between the two sets of data. Based on these
findings, the program can be used to accurately predict the fate of cations.

4
Cation Exchange Model
Liu (2005) developed a cation exchange modeling program using MATLAB. The cation
exchange program is based on exchange reactions of the four major cations found in
groundwater. The four major cations are sodium, potassium, magnesium and calcium. The
program simulates exchange of cations in groundwater with cations on sediment surfaces as a
sewage contaminant plume is introduced as leachate. Cations in groundwater are in equilibrium
with cations on sediment surfaces. As a sewage plume becomes introduced, cations from sewage
plume compete for placement on the surface of ground water sediment and undergo exchange.
Given the concentrations of each cation in groundwater and in the sewage plume, the program
calculates the concentrations of cations that can be expected on sediment surfaces. (Liu, 2005)
The cations and their respective sewage and groundwater concentrations are from
Munster 2004 and Munster 2008. Munster accumulated groundwater cation concentrations for
various locations on Long Island. Groundwater cation concentrations used for the program were
that of rainwater from Munster’s groundwater data from locations coinciding with the locations
studied from the Long Island Groundwater Pollution Study (NYSDOH, 1969). A model of cation
exchange in a sewage plume is shown as Figure 3 (Liu, 2005).
Figure 3: Model of transport and sorption of cations in a sewage effluent plume. Waste water leaches
through the open bottom of a cesspool and into groundwater where its cations undergo exchange with
cations on sediment surfaces (Liu, 2005).
5
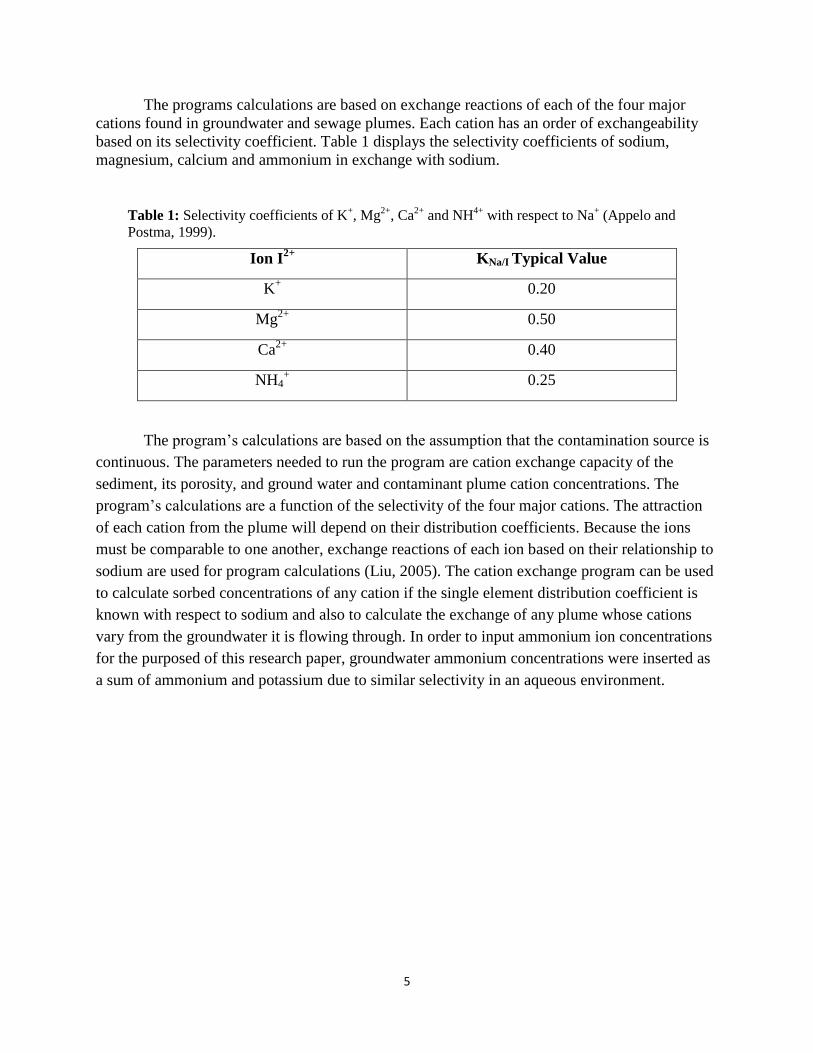
The programs calculations are based on exchange reactions of each of the four major
cations found in groundwater and sewage plumes. Each cation has an order of exchangeability
based on its selectivity coefficient. Table 1 displays the selectivity coefficients of sodium,
magnesium, calcium and ammonium in exchange with sodium.
Table 1: Selectivity coefficients of K+, Mg
2+, Ca
2+ and NH
4+ with respect to Na
+ (Appelo and
Postma, 1999).
Ion I2+
KNa/I Typical Value
K+ 0.20
Mg2+
0.50
Ca2+
0.40
NH4+ 0.25
The program’s calculations are based on the assumption that the contamination source is
continuous. The parameters needed to run the program are cation exchange capacity of the
sediment, its porosity, and ground water and contaminant plume cation concentrations. The
program’s calculations are a function of the selectivity of the four major cations. The attraction
of each cation from the plume will depend on their distribution coefficients. Because the ions
must be comparable to one another, exchange reactions of each ion based on their relationship to
sodium are used for program calculations (Liu, 2005). The cation exchange program can be used
to calculate sorbed concentrations of any cation if the single element distribution coefficient is
known with respect to sodium and also to calculate the exchange of any plume whose cations
vary from the groundwater it is flowing through. In order to input ammonium ion concentrations
for the purposed of this research paper, groundwater ammonium concentrations were inserted as
a sum of ammonium and potassium due to similar selectivity in an aqueous environment.

6
Exchange Reactions
The program’s calculations are based on exchange reactions of each of the four major
cations. The single element distribution coefficient shows the relationship between a cation in
solution and on sediment surfaces and is described by Equation 1:
= (Equation 1)
Where CSI represents the concentration of the element of interest that has sorbed onto solid grain surfaces and CF
I is
the concentration of that same element in fluid.
Single element distribution coefficients can then be related to an additional cation to form
the selectivity coefficient for a cation pair of interest. The program relates each of the cations
with respect to sodium so that trends can be established.
The relationship between sodium and monovalent cations is represented by Equation 2:
= = (Equation 2)
Where Na-X and I-X are concentrations of the monovalent cation of interest and sodium sorbed onto grain surfaces.
Na+ and I
+ are the concentrations of monovalent cation and sodium in fluid.
Because divalent cations are also present in high concentrations the relationship between
divalent cations and sodium can be seen through Equation 3:
= (Equation 3)
Where D represents the divalent cation of interest. (Liu, 2005)
However, the program was developed for the input of four cations. This required the
simultaneous calculation of four quadratic equations which was adequate for considering the four
major cations in groundwater Ca, Mg, Na and K. In order to utilize the program with ammonium,
the ammonium concentration was added to potassium concentration in the sewage effluent. For
the data to be as accurate as possible, the selectivity coefficient KNa/K for potassium must also be
FLUID
SOLID
dK I
F
I
S
C
C
I
NAK
IFLUID
SOLID
d
NaFLUID
SOLID
d
K
K
]][[
]][[
XINa
IXNa
D
NAK 2
1
DFLUID
SOLID
d
NaFLUID
SOLID
d
K
K

7
adjusted to incorporate the exchange of potassium plus ammonium with respect to sodium. We
ran the program using Kds for strictly cation exchange of potassium in addition to exchange of
strictly ammonium. We also ran a simulation of cation exchange using an average of both
ammonium and potassium selectivity coefficients. When the selectivity coefficients for
potassium with respect to sodium and the selectivity coefficients for ammonium with respect to
sodium were averaged, the resulting concentration of K (that is K in fluid or K on solid) was that
of potassium plus ammonium. The selectivity coefficient for potassium plus ammonium with
respect to sodium was estimated at 0.225. This value was estimated by averaging the selectivity
coefficient of potassium with respect to sodium (0.2) and the selectivity coefficient of
ammonium with respect to sodium (0.25). The concentration of groundwater and sewage that
was input in the program was that of potassium plus ammonium. The resulting concentration of
potassium in fluid was then subtracted from its total to determine strictly ammonium
concentration in fluid and on solid grain surfaces.
Pore Volumes
Porosity represents the spaces between particles in the aquifer. Pore volume is the volume
of the effluent in the pore space for a given plume length. In the program, the plume’s pore
volume consists of a series of cells. The larger the number of cells the more precise the
concentrations can be calculated. As cations leave the cesspool they interact with sediment
surfaces and exchange with cations already on the sediment surface. In this program the cations
prior to the influx of sewage are in equilibrium with the cations in the groundwater. The first
travel of sewage through the pore spaces of the plume considered is referred to as the first pore
volume. The program calculates concentrations based on the number of pore volumes and does
not depend on the dimensions of the plume considered. After going through the first pore
volume, the fluid leaving the plume has the same cation concentration as that of initial sewage
concentrations, but has the proportion of cations of the groundwater that the sediments were
originally equilibrated with.
For each pore volume that sewage passes through the cation composition of the effluent
from the plume approaches the composition of the sewage. At some number of pore volumes the
concentration of the cations exiting the plume will have the same concentration of cations as the
sewage. At this point, the plume has equilibrated with the sewage. The program represents the
point of equilibrium as an asymptotic relationship so the data in this paper is representative of
99% with regard to equilibrium. That is, the program was allowed to equilibrate to 99%. For this
study, ground water ammonium concentrations from the “Long Island Ground Water Pollution
Study” were programed to evaluate how much ammonium can be sorbed onto sediment surfaces
through the exchange of positively charged ions in groundwater with ions sorbed onto sediment
surfaces. (NYSDOH, 1969) Chloride concentration in groundwater was utilized to establish the
relationship between denitrification and mixing waters.
8
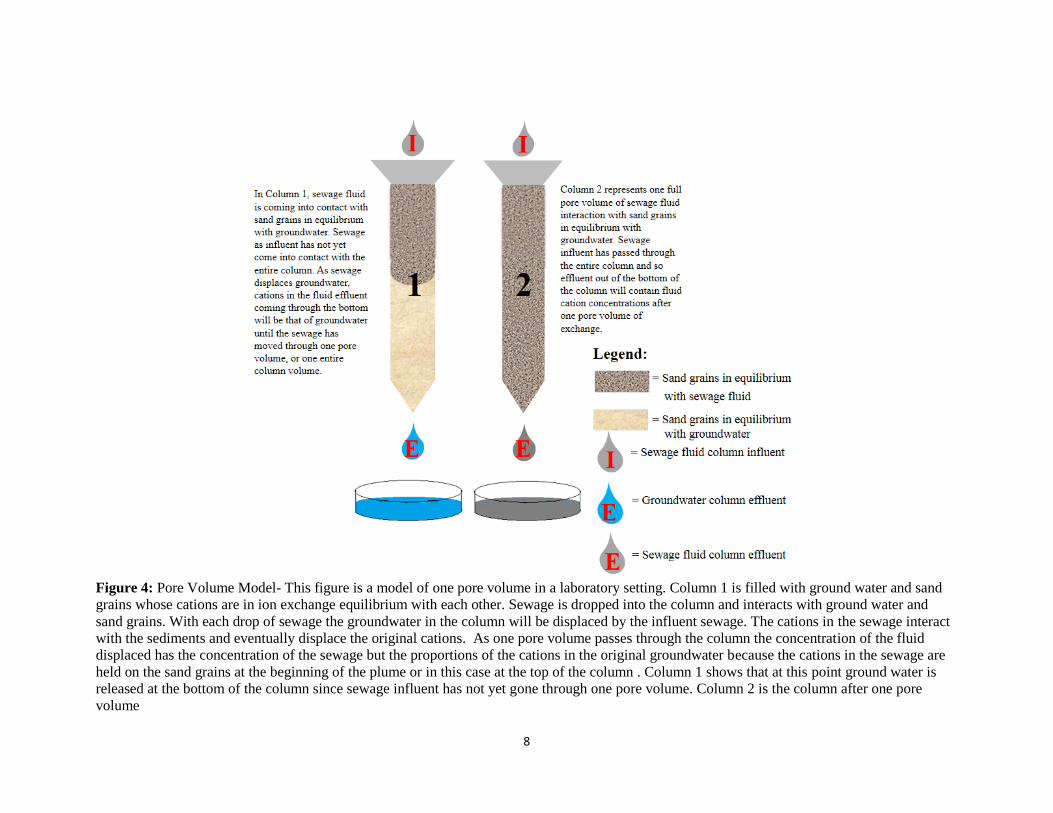
Figure 4: Pore Volume Model- This figure is a model of one pore volume in a laboratory setting. Column 1 is filled with ground water and sand
grains whose cations are in ion exchange equilibrium with each other. Sewage is dropped into the column and interacts with ground water and
sand grains. With each drop of sewage the groundwater in the column will be displaced by the influent sewage. The cations in the sewage interact
with the sediments and eventually displace the original cations. As one pore volume passes through the column the concentration of the fluid
displaced has the concentration of the sewage but the proportions of the cations in the original groundwater because the cations in the sewage are
held on the sand grains at the beginning of the plume or in this case at the top of the column . Column 1 shows that at this point ground water is
released at the bottom of the column since sewage influent has not yet gone through one pore volume. Column 2 is the column after one pore
volume

9
Cation Exchange Capacity of Long Island Sediments
Ions in an aqueous solution interact with ions on solid surfaces of soil grains or aquifer
material. Both anions and cations can undergo exchange in this process; however, cation
exchange is the dominant form of ion exchange in most groundwater systems because sediment
particles have a negative charge (Fetter, 2001) The exchange occurs through the preferential
adsorption of one cation onto grain surfaces for another. Essentially, cations in ground water are
in competition for placement on grain surfaces. (Fetter, 2001)
The concentration of cations a soil holds on its surface is its cation exchange capacity or
CEC express as milliequivalents per 100 grams or centiequivalents per kilogram. The surface of
aquifer material or sand grains is often coated with a thin coating composed of clay and organic
material. A soil’s CEC is directly related to the surface coating, and is the site of cation
exchange. It was found that while organic material accounts for a small percentage of the sand
coatings’ mass on glacial sediments on Long island; the amount of organic coating determines
the CEC (Boguslavsky, 2000). Table 2 displays CECs for various materials that compose grain
surface coatings.
Table 2: Cation Exchange Capacity of Different Materials- (Bugoslavsky, 2000-modified from
Appelo and Postma, 1993 and Velde, 1995) The CEC of organic matter can be much higher than
that of the clay composition. Depending on the percentage of organic matter present in aquifer
material, the CEC can vary greatly. A soils’ CEC variability can also be attributed to variations in
surface charge due to pH and lattice imperfections (Langmuir, 1997). Because the cations are sorbed
onto the surfaces of the grain, the CEC is dependent also on grain size because finer grained
material has a larger surface area. Thus, finer grain size material has a greater CEC.
Type of Material CEC (meq/100g)
Kaolinite 3-15
Chlorite 10-40
Illite 10-40
Smectite 80-150
Organic Matter 150-400
Goethite & Hematite Up to 100

10
Boguslavsky (2000) determined CEC’s for sediments on Long Island and found that silty
sediments in the soil horizon have CEC’s of 15 to 20 meq/100 g. Below about one to two meters
sandy sediments had values of about 2 to 5 meq/100g (Fig. 5 and 6). Silty sediments with
significantly greater surface area at depths of about 10 meters had values of about 20 meq/100g
(Fig. 6).
Figure 5: Cation exchange capacity (CEC) of the core from Cathedral Pine County Park (Bugoslavsky,
2000). Medium and coarse sands hover around the 2-3 meq/100 g range. Clays and silts however will
increase a soil’s CEC.

11
Figure 6: Cation exchange capacity of the sediments from Port Jefferson, South Setauket, soil near Fox
Pond and the beach cliff at David Weld Preserve (Bugoslavsky, 2000). CEC increases with finer materials
and organic composition on particle surfaces. Both figures exhibit the potential for variability between
soils and their CECs.

12
General Results of Cation Exchange Modeling
In this section I present ammonium ion cation exchange modeling results for a range of
CEC’s (Liu, 2005).
Our modeling results indicate that regardless of CEC the peak percentage of ammonium
sorption occurs within the first 5 pore volumes. This is due to the gradual increase of sorbed
ammonium with respect to an exponentially increasing total volume of ammonium input to the
system. Figure 7 is a graphical representation of ammonium sorption percentage for various CEC
values.
The results depicted in Figure 7 indicate that the percentage of ammonium that can sorb
onto sand grains is limited to a window between approximately 13% and 14%. The data was
limited to 25 pore volumes so that the peak percentages could be seen in clearer resolution. The
program was limited to 4 cells per pore volume for ease of tabulating.
As the program runs, data are generated that show the concentration of ammonium
sorbed onto sand grains (KS) for each of the four cells in each pore volume. The concentration of
the ion of interest sorbed in each of the cells given in the data file is added together to create a
total sorbed for that pore volume. In order to isolate ammonium sorption data from the results, I
modeled twice for each CEC value. The first run was an input concentration of ammonium plus
potassium, the second run was an input of just potassium. To isolate ammonium, the potassium
value is subtracted from the ammonium value. The resulting subtracted value represents the total
ammonium sorbed on sand grains in a specific pore volume. The total ammonium input in the
sewage is calculated by multiplying the ion concentration in sewage by the number of cells you
are modeling per pore volume, by the pore volume. For example, I modeled 3 meq/L of
ammonium with 4 cells per pore volume for 25 pore volumes. In order to find the total amount of
ammonium input for the first pore volume, it would be 3 meq/L x 4 x 1 for the first pore volume
or 12 meq/L. The second pore volume would be 3 meq/L x 4 x 2, or 24 meq/L. The percentage
of ammonium sorbed was calculated by dividing the total ammonium sorbed by the total
ammonium input for a given pore volume. I limited the modeling to 25 pore volumes, if
additional pore volumes were graphed, the percentage of ammonium sorbed would decrease for
each CEC value, gradually approaching zero as ammonium is continually added to the system.
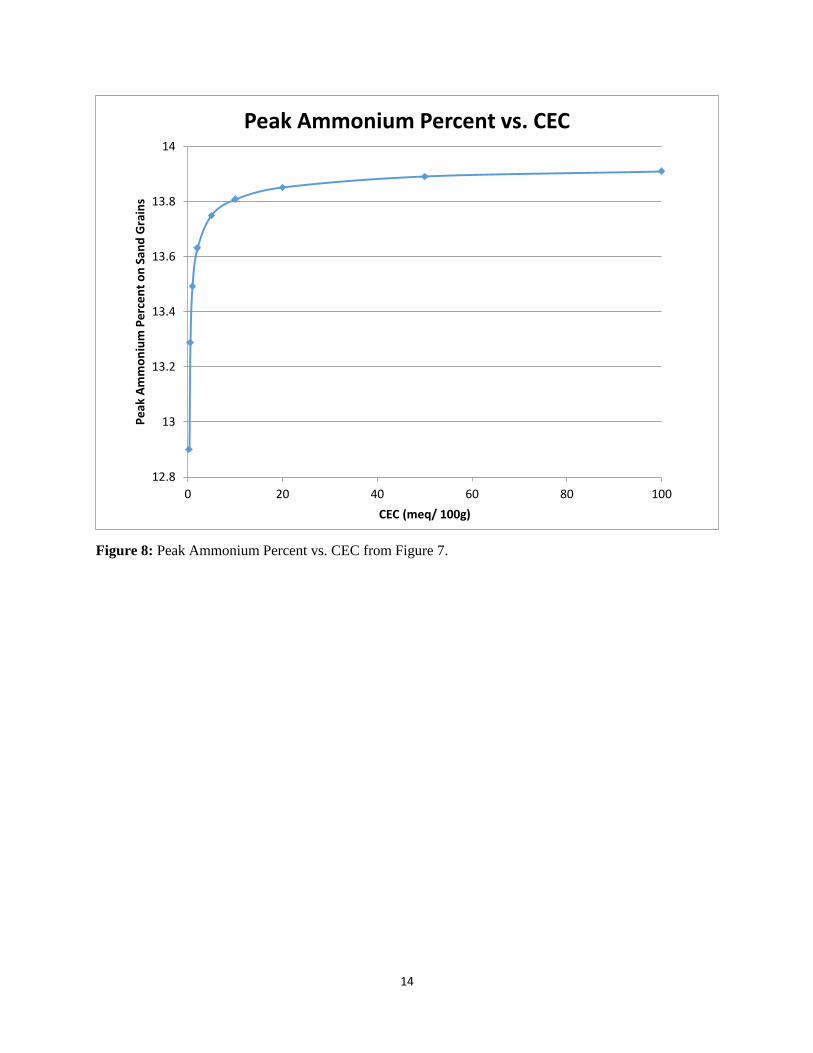
The percentage of sorbed ammonium for any given system can be analyzed in this
manner. The percentage will not vary much based on the soils’ CEC or the length of the effluent
plume due to peak sorption occurring within the first 5 pore volumes, as shown in Figure 8. Peak
percentage of ammonium sorption for CECs of 0.25 meq/100g and 100 meq/100g were between
12.9% and 13.9% of total ammonium input.

13
Figure 7: Percent of ammonium sorbed on sediments sediments with CEC’s varying from 0.25 to 100 meq/100g as a function of pore volumes
passed through the sediments using Liu’s (2005) cation exchange program. The percent of ammonium sorbed peaks between 12.9% and 13.9% of
total ammonium introduced within the first 25 pore volumes.
5
6
7
8
9
10
11
12
13
14
15
0 5 10 15 20 25
Pe
rce
nt
of
Am
mo
niu
m o
n S
and
Gra
ins
Pore Volume
Percent of Ammonium on Sand Grains of Varying CECs
CEC=0.25
CEC=0.5
CEC=1.0
CEC=2.0
CEC=5.0
CEC=10.0
CEC=20.0
CEC=50.0
CEC=100.0
14
Figure 8: Peak Ammonium Percent vs. CEC from Figure 7.
12.8
13
13.2
13.4
13.6
13.8
14
0 20 40 60 80 100
Pe
ak A
mm
on
ium
Pe
rce
nt
on
San
d G
rain
s
CEC (meq/ 100g)
Peak Ammonium Percent vs. CEC
15
Predicting CEC Using West Babylon Case Study
While it appears that CEC is not an important value when considering the percent of
ammonium sorbed, it is however crucial when examining the nature of an actual sewage plume.
A series of six locations in Suffolk County were studied extensively by the New York State
Department of Health as part of “The Long Island Pollution Study (1969)”. Their work included
drilling of wells and boreholes for sampling of ground water around cesspools and particularly in
the sewage plumes to determine the fate of detergents in the sewage plumes. The analyses of the
groundwater and sewage effluent also included chloride, ammonia, nitrate and nitrite. However,
they did not analyze for CEC of the soils encountered. The results allow us to apply Liu’s (2005)
program and analyze the sewage plume in order to predict CEC of soil.
Site 2 in West Babylon was chosen as a focus. Chloride concentrations remained stable
over the effluent plume distance. Chloride which has much higher concentrations in sewage than
in groundwater is not sorbed to sediment surfaces due to its negative charge and travels with
ground water. If chloride concentrations are consistently high over the length of an effluent
plume, little mixing or dispersion is present. Nitrate also has a negative charge and will not be
sorbed, whereas ammonium has a positive charge and will be sorbed. At this site the cesspool
bottom was set two feet into the water table, enabling a direct input of sewage effluent into
groundwater. Additionally, there is chemical data available for a well network in and around the
sewage plume extending 75 feet from the cesspool. The ratio of total nitrogen to chloride, the
low dissolved oxygen and low nitrate concentrations (Table 3), indicate that ammonium is nearly
to totally equilibrated with the sediments by cation exchange and that there is limited mixing or
nitrification occurring. This allows us to evaluate how cation exchange is affecting the system.
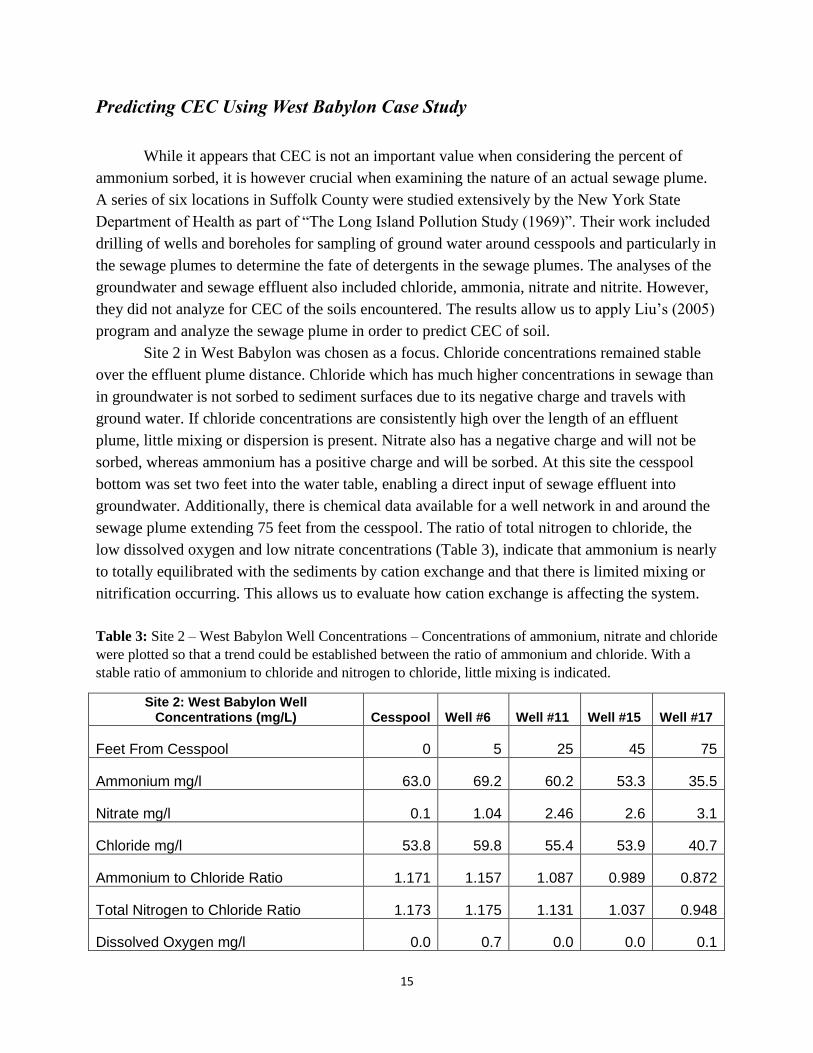
Table 3: Site 2 – West Babylon Well Concentrations – Concentrations of ammonium, nitrate and chloride
were plotted so that a trend could be established between the ratio of ammonium and chloride. With a
stable ratio of ammonium to chloride and nitrogen to chloride, little mixing is indicated.
Site 2: West Babylon Well Concentrations (mg/L) Cesspool Well #6 Well #11 Well #15 Well #17
Feet From Cesspool 0 5 25 45 75
Ammonium mg/l 63.0 69.2 60.2 53.3 35.5
Nitrate mg/l 0.1 1.04 2.46 2.6 3.1
Chloride mg/l 53.8 59.8 55.4 53.9 40.7
Ammonium to Chloride Ratio 1.171 1.157 1.087 0.989 0.872
Total Nitrogen to Chloride Ratio 1.173 1.175 1.131 1.037 0.948
Dissolved Oxygen mg/l 0.0 0.7 0.0 0.0 0.1

16
Groundwater Concentrations
Figure 9: - Semi-log plot of ammonium, chloride, nitrate and total nitrogen concentrations and total nitrogen to chloride and ammonium to
chloride ratios along effluent sewage plume at Site 2-West Babylon well. The data suggest that there is limited mixing, diffusion or nitrification
along the plume as shown by consistent chloride and ammonium concentrations and minor nitrate concentrations.
0.1
1
10
100
0 5 25 45 75
Co
nce
ntr
atio
n (
mg/
L)
Distance From Source (ft)
Site 2: West Babylon Well Concentrations
Ammonium
Chloride
Nitrate
Total Nitrogen
Total Nitrogento ChlorideRatio
Ammonium toChloride Ratio

17
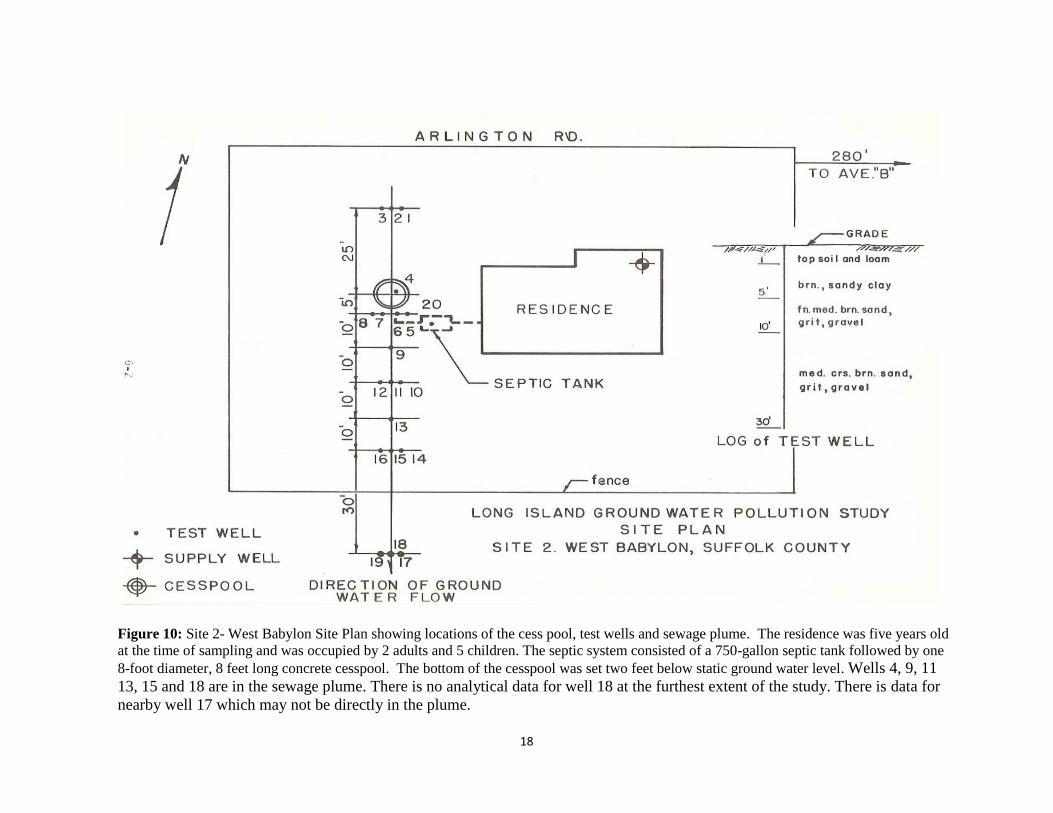
The site is residential and is located on the south side of Arlington Road west of Avenue B in
West Babylon, New York. The home was five years old at the time of sampling and was
occupied by two adults and five children. Based on occupancy, I estimated that 490 gallons of
sewage were disposed of on a daily basis, or 70 gallons of sewage per person (Benefield, 2002).
The sewage disposal system consisted of a 750-gallon septic tank and one eight-foot diameter,
eight-foot deep concrete pre-cast cesspool. The pool extended two feet into ground water.
Fluoride was used as a tracer to establish the ground water velocity as 0.67 feet per day.
(NYSDOH, 1969) Figure 10 is a site plan.
The ammonium plume in groundwater from Site 2 extended more than 75 feet from the
source. The furthest monitoring well at 75 feet from the cesspool exhibited decreasing
ammonium concentrations, however is not in line with the other monitoring wells. This could
indicate that this well is not directly within the effluent plume, but on the edge of it. (NYSDOH,
1969)
18
Figure 10: Site 2- West Babylon Site Plan showing locations of the cess pool, test wells and sewage plume. The residence was five years old
at the time of sampling and was occupied by 2 adults and 5 children. The septic system consisted of a 750-gallon septic tank followed by one
8-foot diameter, 8 feet long concrete cesspool. The bottom of the cesspool was set two feet below static ground water level. Wells 4, 9, 11
13, 15 and 18 are in the sewage plume. There is no analytical data for well 18 at the furthest extent of the study. There is data for
nearby well 17 which may not be directly in the plume.
19
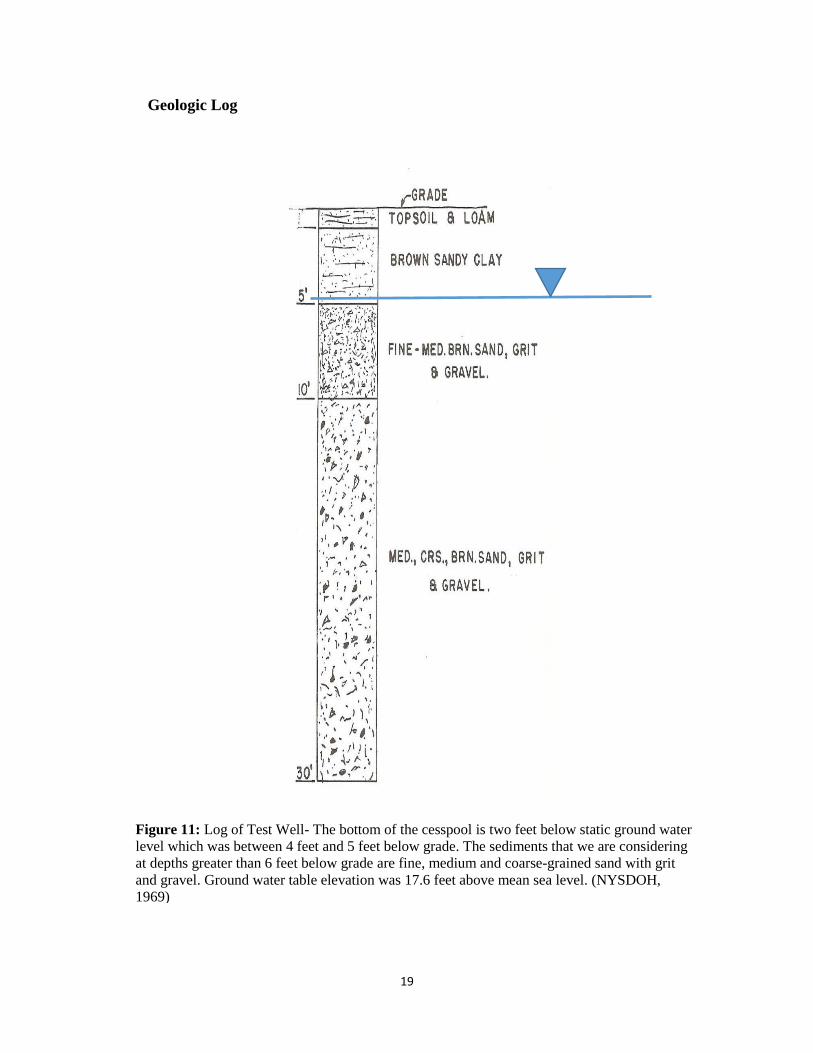
Geologic Log
Figure 11: Log of Test Well- The bottom of the cesspool is two feet below static ground water
level which was between 4 feet and 5 feet below grade. The sediments that we are considering
at depths greater than 6 feet below grade are fine, medium and coarse-grained sand with grit
and gravel. Ground water table elevation was 17.6 feet above mean sea level. (NYSDOH,
1969)

20
CEC of Study Site
Further analysis was needed on CEC of the study site’s soil. Groundwater data was first
input into the program using a CEC of 2 meq/100 g and the program was not able to equilibrate
within the five years of the cesspool’s usage. We know that the plume extends further than 75
feet due to ammonium concentration in the furthest well sustaining almost half that of
ammonium in the cesspool. In order for ammonium to remain at this distance, the soils’ CEC
must be relatively small. The higher a soils’ CEC, the more an ammonium plume will undergo
retardation. Essentially, a great deal of ammonium is sorbed onto soil coatings rather than in the
fluid. However, in West Babylon we have an ammonium plume extending further than 75 feet,
suggesting a very small CEC. A CEC of Site 2 was then predicted based on groundwater
velocity, the age of the cesspool system, ammonium concentration both from the source
(cesspool) and that of the furthest data point down gradient, the distance from the cesspool and
furthest data point down gradient and the amount of pore volumes to equilibrium.
The cesspool had been in use for only 5 years at the time of sampling. This equates to a
system age of 1,825 days. We also know groundwater velocity is 0.67 ft day-1
. There is a finite
length of the effluent plume to the furthest point of sampling at 75 feet. The length of effluent
plume can be explained as one pore volume. Essentially, one pore volume is the distance it
would take ammonium to leave cesspool and travel to 75 feet. Knowing that equilibrium along
the 65 foot plume distance must have occurred at some point prior to 5 years, a CEC of <0.25
meq/100 g was estimated.
0.67 ft day-1
x 75 ft = 50.25 days per pore volume
1,825 days have gone by, so it would take 36 pore volumes to pass for equilibrium to
occur at the 5 year mark exactly. (1,825 days/ 50.25 days) The cation exchange model is required
in order to find the point of equilibrium. Various CECs were modeled to find the point of
equilibrium within 36 pore volumes. In order for the model to equilibrate the data in 36 pore
volumes, the CEC would have to be within 0.25-0.50 meq/100 g.
However, the system at the point of sampling would have had to be in equilibrium, so
equilibrium would have had to occur some point prior to 5 years. If we suppose that only 1,642
days passed for equilibrium to occur or approximately 4.5 years, the model would then need only
33 pore volumes to equilibrate. The CEC still falls within the range of 0.25-0.50 meq/100 g.
However, if equilibrium actually occurred with 2.5 years or approximately 912 days, the model
would only need 18 pore volumes to equilibrate. This means that the CEC would actually fall
below 0.25 meq/100 g. The predicted CEC calculations are based on 99% equilibrated data
because the model will calculate an asymptotic relationship to 100% equilibrium.
21
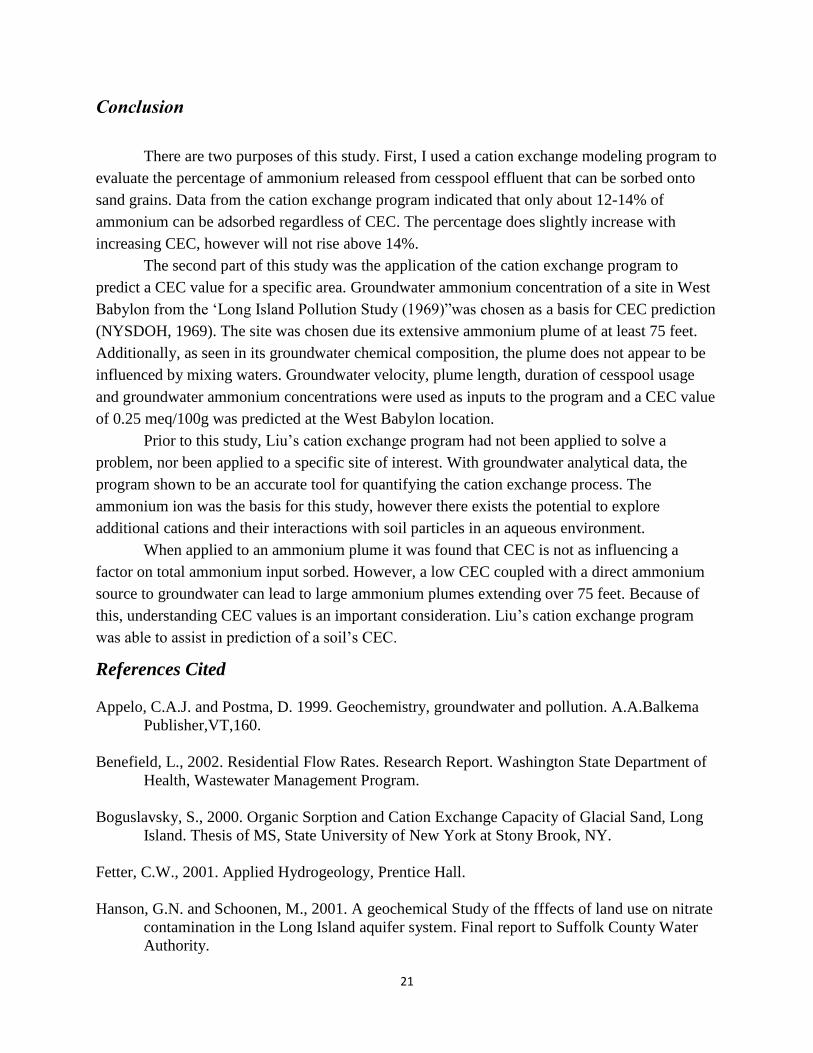
Conclusion
There are two purposes of this study. First, I used a cation exchange modeling program to
evaluate the percentage of ammonium released from cesspool effluent that can be sorbed onto
sand grains. Data from the cation exchange program indicated that only about 12-14% of
ammonium can be adsorbed regardless of CEC. The percentage does slightly increase with
increasing CEC, however will not rise above 14%.
The second part of this study was the application of the cation exchange program to
predict a CEC value for a specific area. Groundwater ammonium concentration of a site in West
Babylon from the ‘Long Island Pollution Study (1969)”was chosen as a basis for CEC prediction
(NYSDOH, 1969). The site was chosen due its extensive ammonium plume of at least 75 feet.
Additionally, as seen in its groundwater chemical composition, the plume does not appear to be
influenced by mixing waters. Groundwater velocity, plume length, duration of cesspool usage
and groundwater ammonium concentrations were used as inputs to the program and a CEC value
of 0.25 meq/100g was predicted at the West Babylon location.
Prior to this study, Liu’s cation exchange program had not been applied to solve a
problem, nor been applied to a specific site of interest. With groundwater analytical data, the
program shown to be an accurate tool for quantifying the cation exchange process. The
ammonium ion was the basis for this study, however there exists the potential to explore
additional cations and their interactions with soil particles in an aqueous environment.
When applied to an ammonium plume it was found that CEC is not as influencing a
factor on total ammonium input sorbed. However, a low CEC coupled with a direct ammonium
source to groundwater can lead to large ammonium plumes extending over 75 feet. Because of
this, understanding CEC values is an important consideration. Liu’s cation exchange program
was able to assist in prediction of a soil’s CEC.
References Cited
Appelo, C.A.J. and Postma, D. 1999. Geochemistry, groundwater and pollution. A.A.Balkema
Publisher,VT,160.
Benefield, L., 2002. Residential Flow Rates. Research Report. Washington State Department of
Health, Wastewater Management Program.
Boguslavsky, S., 2000. Organic Sorption and Cation Exchange Capacity of Glacial Sand, Long
Island. Thesis of MS, State University of New York at Stony Brook, NY.
Fetter, C.W., 2001. Applied Hydrogeology, Prentice Hall.
Hanson, G.N. and Schoonen, M., 2001. A geochemical Study of the fffects of land use on nitrate
contamination in the Long Island aquifer system. Final report to Suffolk County Water
Authority.

22
Langmuir, D., 1997. Aqueous Environmental Geochemistry, Prentice Hall.
Liu, Q., 2005. Modeling Cations in a Contaminant Plume in Saturated Zone. Thesis of MS, State
University of New York at Stony Brook, NY.
Liu, Q., 2005. MATLAB Program for Cation Transport in a Contaminant Plume.
Munster, J., 2004. Evaluating Nitrate sources in Suffolk County groundwater, Long Island, New
York.Thesis of MS, State University of New York at Stony Brook, NY.
New York State Department of Health, 1969. The Long Island Ground Water Pollution Study.
Final Report to the New York State Department of Environmental Conservation.
Nolan, B., 2002. Probability of Nitrate Contamination of Recently Recharged Groundwaters in
the Conterminous United States. Environmental Science and Technology. VOL. 36,
NO.10, 2002.
Olcott, P., 1995. GROUND WATER ATLAS of the UNITED STATES. Connecticut, Maine,
Massachusetts, New Hampshire, New York, Rhode Island, Vermont. United States
Geological Survey. HA 730-M.
Porter, K.S., 1980, An Elevation of Sources of Nitrogen As Causes of Groundwater
Contamination In Nassau County, Long Island: Groundwater, v. 18, p. 617-625.
Valiela, I.,et al, 2004. ELM, an estuarine nitrogen loading model: Formulation and verification
of predicted concentrations of dissolved inorganic nitrogen.Water Air and Soil
Pollution,157,365-391.
Voegelin, A., Vulava, V.M., Kuhnen, F., and Kretzschmar R., 2000, Multicomponent transport
of major cations predicted from binary adsorption experiments. Journal of Contaminant
Hydrology,46: 319-338
Young, C., 2010. Extent of Denitrification in Northport Groundwater. Thesis of MS, State
University of New York at Stony Brook, NY.