sorin cheval*, tamás szentimrey**, ancuţa manea*** *national meteorological administration,...
Post on 21-Dec-2015
217 views
TRANSCRIPT
Sorin CHEVAL*, Tamás SZENTIMREY**, Ancuţa MANEA***
*National Meteorological Administration, Bucharest, Romania andEuro-Mediterranean Centre for Climate Change, Venice, Italy
** Hungarian Meteorological Service, Budapest, Hungary
***National Meteorological Administration, Bucharest, Romania
HOMOGENIZATION OF MONTHLY TEMPERATURE SERIES IN ROMANIA (1901-2005)
USING METADATA

Rationale:
• The meteorological network suffered multiple major changes along the 20th century: transfers between different administrative or political regimes, relocations, wars, changing of instruments/shelters etc.
• Previous studies approached the variability of the annual temperatures in Romania based on raw data, and paid little attention to homogenization
• No homogenized climatic datasets for Romania

Objectives:
• To investigate the homogeneity level of the monthly temperature series recorded at weather stations from Romania in the period 1901-2005
• To test MASH• Significance of metadata

Meteorological Network – Romania 2008
160 weather stations, most of them cover the interval 1961-present, cca. 90 stations automatic

Data:
Monthly average temperatures 1901-2005
31 stations Romania +
4 stations Hungary (homogenized)
Metadata:
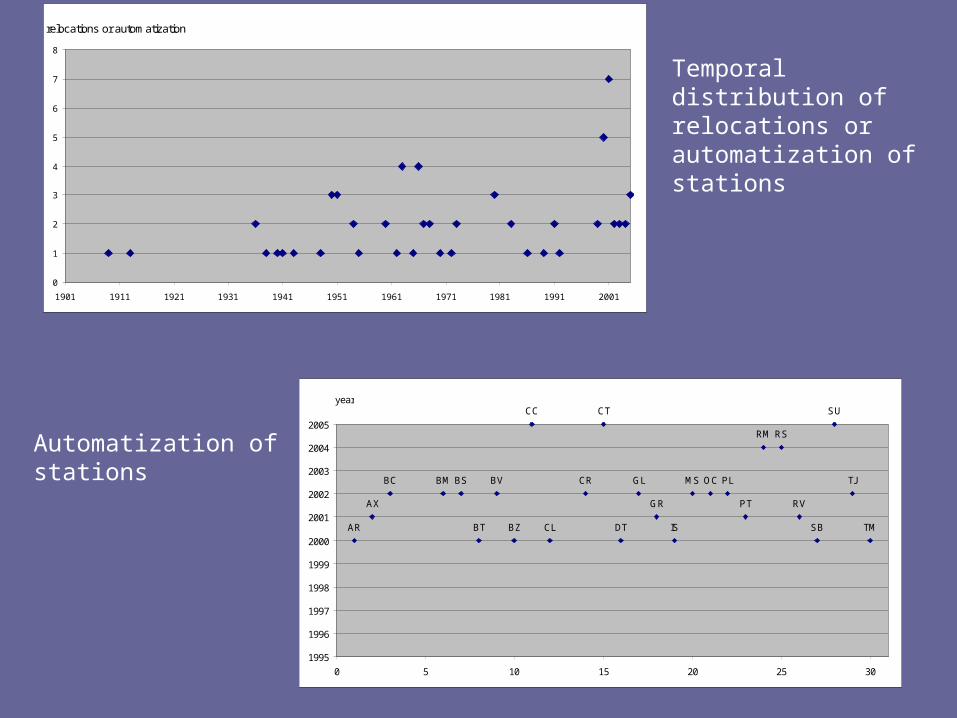
-relocation
-turning from manually operated to automatic weather stations

0.0
5.0
10.0
15.0
20.0
25.0
30.0
AR
AX BC
BD BF
BM BS BT
BV BZ
CC
CL
CP
CR
CT
DT
GL
GR IS MS
OC PL
PT
RM
RS
RV
SB
SU TJ
TM TR
SE
TU
DE
NY
1
2
3
4
5
6
7
8
9
10
11
12
%
Rate of missing data / month

0
2
4
6
8
10
12
14
16
18
1901
1905
1909
1913
1917
1921
1925
1929
1933
1937
1941
1945
1949
1953
1957
1961
1965
1969
1973
1977
1981
1985
1989
1993
1997
2001
2005
missing data/dataset
Rate of missing data / dataset
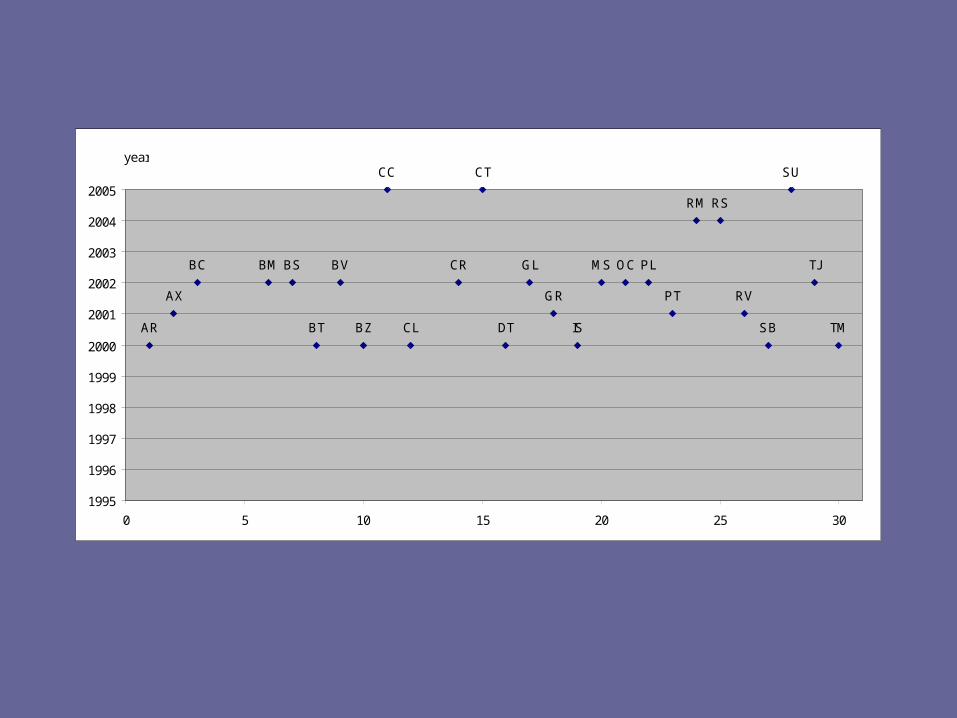
year
AR
AX
BC BM BS
BT
BV
BZ
CC
CL
CR
CT
DT
GL
GR
IS
MS OC PL
PT
RM RS
RV
SB
SU
TJ
TM
1995
1996
1997
1998
1999
2000
2001
2002
2003
2004
2005
0 5 10 15 20 25 30
relocations or automatization
0
1
2
3
4
5
6
7
8
1901 1911 1921 1931 1941 1951 1961 1971 1981 1991 2001
Temporal distribution of relocations or automatization of stations
Automatization of stations

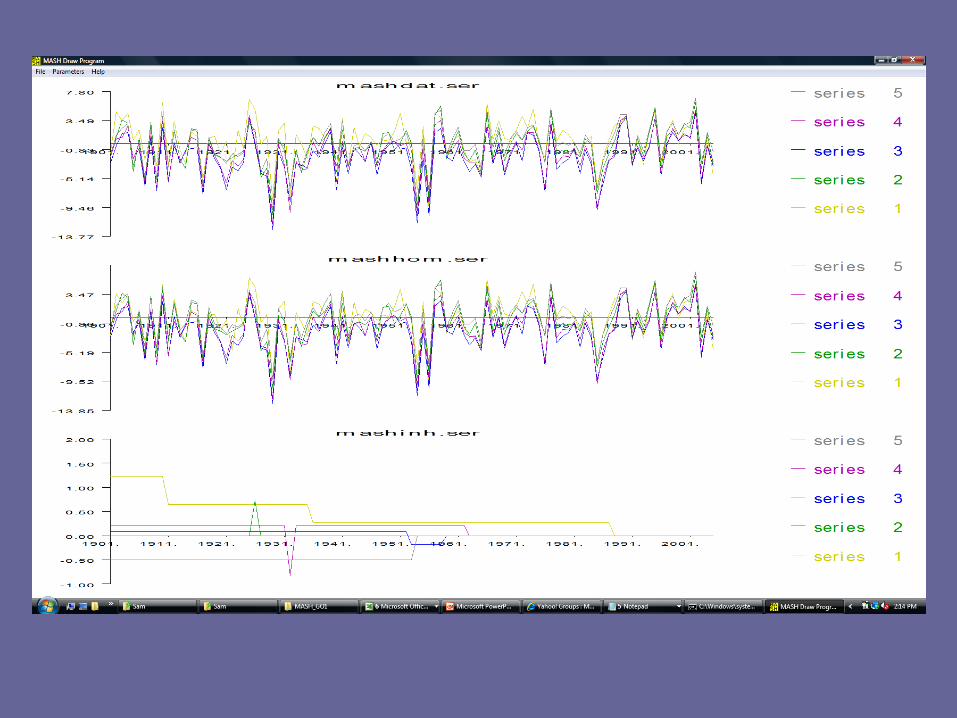
• The homogenization of the dataset used the Multiple Analysis of Series for Homogenization (MASH) v3.02, and took benefit of the metadata existing in the archives of the National Meteorological Administration
• The MASH system can use the metadata information – in particular the probable dates of break points – automatically
• Homogenized temperature series from Hungary near the border were also used during the procedure in order to increase the power.

PROBLEM of HOMOGENIZATION
• Basis: DATA
• Tools:• MATHEMATICS : abstract formulation• META DATA : historical, climatological information• SOFTWARE : automatization
• SOLUTION = MATHEMATICS + META DATA + SOFTWARE
• (i) without SOFTWARE:MATHEMATICS + META DATA = THEORY WITHOUT BENEFIT• (ii) without META DATA:MATHEMATICS + SOFTWARE = GAMBLING• (iii) without MATHEMATICS:META DATA + SOFTWARE = “STONE AGE” + “BILL GATES”

BASIC PRINCIPLES of MASH Procedure
• Relative homogeneity test procedure• Step by step procedure: the role of series (candidate or reference
series) changes step by step in the course of the procedure• Additive or cumulative model can be used depending on the climateelements• Monthly, seasonal or annual time series can be homogenized together(SAM procedure: Seasonal Application of MASH)• META DATA (probable dates of break points) can be usedautomatically• The actual or the final stage of the homogenization can be verified.

Methodology:
• Homogenized for 0.05 level of confidence
• Three homogenization instances:1. no metadata considered2. metadata1: relocation of the stations3. metadata2: relocation of the stations and
automatization

I. TEST STATISTICS FOR SERIES INHOMOGENEITY Null hypothesis: the examined series are homogeneous. Critical value (significance level 0.05): 21.73 Test statistics (TS) is compared to the critical value. The larger TS values are more suspicious!
Series Index TSB Series Index TSB Series Index TSBAR 1 393.26 TR 31 202.2 RS 25 182.79PL 22 164.04 BC 3 160.51 CC 11 147.64AX 2 128.02 PT 23 108.26 BF 5 94.98RM 24 87.87 TJ 29 84.17 CL 12 79.31TM 30 68.43 BZ 10 65.1 CP 13 63.13BM 6 54.23 RV 26 53.48 GR 18 39.98CT 15 33.94 BS 7 31.67 GL 17 30.28DT 16 25.85 BV 9 24.64 CR 14 24.21OC 21 22.27 DE 34 20.93 BT 8 19.48SE 32 19.39 MS 20 18.94 NY 35 18.41BD 4 16.53 IS 19 16.44 SU 28 15.79SB 27 13.82 TU 33 8.17
AVERAGE: 72.52
Series Index TSA Series Index TSA Series Index TSAAR 1 114.37 BC 3 92.04 OC 21 52.33RM 24 51.86 PT 23 51.44 GR 18 46.2BM 6 44.91 CP 13 38.08 RS 25 34.89PL 22 33.97 BF 5 30.19 TM 30 29.71CC 11 27.78 GL 17 26.91 CL 12 26.88CR 14 25.14 CT 15 25.12 AX 2 24.86TR 31 24.51 RV 26 23.85 BV 9 23.76BZ 10 23.09 DE 34 20.97 SE 32 19.36BS 7 19.32 NY 35 18.41 BT 8 18.4MS 20 17.77 TJ 29 17.09 IS 19 16.44BD 4 16.22 SU 28 15.79 DT 16 14.62SB 27 12.99 TU 33 8.17AVERAGE: 31.07
After homogenization
Before homogenization
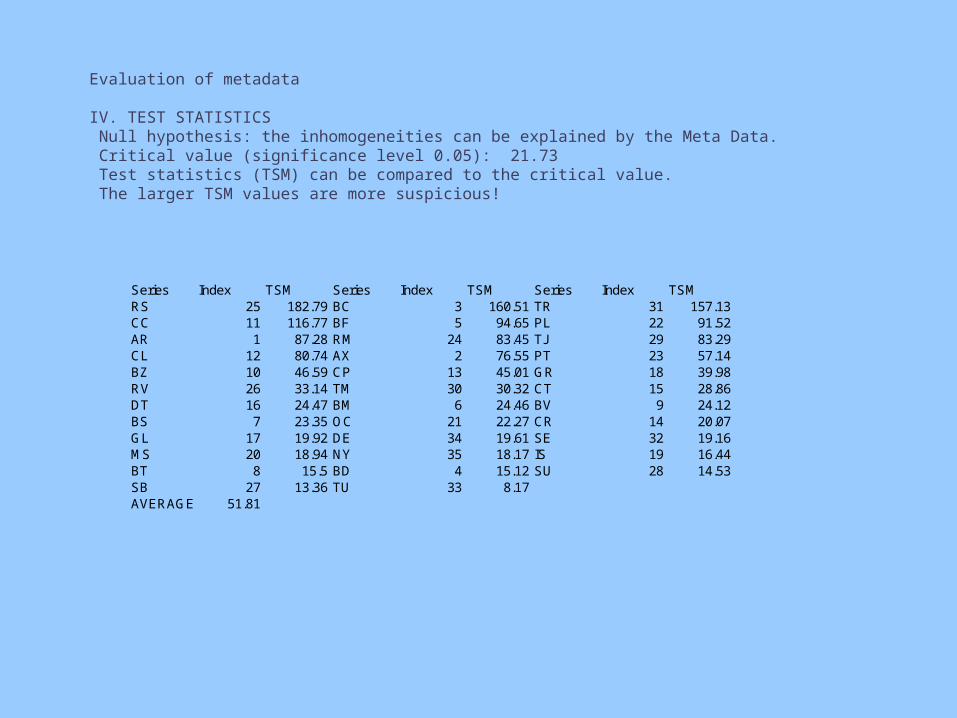
Series Index TSM Series Index TSM Series Index TSMRS 25 182.79 BC 3 160.51 TR 31 157.13CC 11 116.77 BF 5 94.65 PL 22 91.52AR 1 87.28 RM 24 83.45 TJ 29 83.29CL 12 80.74 AX 2 76.55 PT 23 57.14BZ 10 46.59 CP 13 45.01 GR 18 39.98RV 26 33.14 TM 30 30.32 CT 15 28.86DT 16 24.47 BM 6 24.46 BV 9 24.12BS 7 23.35 OC 21 22.27 CR 14 20.07GL 17 19.92 DE 34 19.61 SE 32 19.16MS 20 18.94 NY 35 18.17 IS 19 16.44BT 8 15.5 BD 4 15.12 SU 28 14.53SB 27 13.36 TU 33 8.17AVERAGE: 51.81
Evaluation of metadata
IV. TEST STATISTICS Null hypothesis: the inhomogeneities can be explained by the Meta Data. Critical value (significance level 0.05): 21.73 Test statistics (TSM) can be compared to the critical value. The larger TSM values are more suspicious!


-12
-10
-8
-6
-4
-2
0
2
4
6
8
1901
1905
1909
1913
1917
1921
1925
1929
1933
1937
1941
1945
1949
1953
1957
1961
1965
1969
1973
1977
1981
1985
1989
1993
1997
2001
2005 No homogenization
No metadata
Metadata1
Metadata2
Arad - January

ESTIMATED BREAK POINTS AND SHIFTS
AR:
1904: -0.04/ 1905: -0.08/ 1908: 0.09/ 1909: 0.15/ 1910: 0.13/
1914: -0.02/ 1919: 0.01/ 1922: -0.03/ 1923: -0.06/ 1924: 0.06/
1926: 0.06/ 1927: 0.12/ 1928: 0.07/ 1929: 0.02/ 1935: 0.04/
1937: 0.01/ 1939: 0.02/ 1940: -0.08/ 1941: 0.12/ 1944: 0.02/
1952: 0.01/ 1953: 0.03/ 1958: -0.01/ 1964: 0.03/ 1966: 0.01/
1972: 0.08/ 1974: 0.03/ 1975: 0.02/ 1983: 0.01/ 1987: 0.02/
1999: -0.01/ 2001: -0.03
ESTIMATED BREAK POINTS AND SHIFTS
(Mark M: META DATA 1)
AR:
1904: -0.03/ 1905: -0.04/ 1908: 0.08/ 1909: 0.15/ 1910: 0.18/
1921: -0.01/ 1922: -0.04/ 1923: -0.10/ 1924: 0.05/ 1926: 0.05/
1927: 0.10/ 1928: 0.13/ M1936: 0.04/ 1940: 0.03/ M1951: 0.03/
M1972: 0.07/ 1999: -0.02/ 2001: -0.03
ESTIMATED BREAK POINTS AND SHIFTS
(Mark M: META DATA 2)
AR:
1904: -0.03/ 1905: -0.04/ 1908: 0.08/ 1909: 0.15/ 1910: 0.18/
1921: -0.01/ 1922: -0.04/ 1923: -0.10/ 1924: 0.04/ 1926: 0.06/
1927: 0.10/ 1928: 0.13/ M1936: 0.04/ 1940: 0.03/ M1951: 0.03/
M1972: 0.06/ M1999: -0.09/ 2000: 0.04
year
AR
AX
BC BM BS
BT
BV
BZ
CC
CL
CR
CT
DT
GL
GR
IS
MS OC PL
PT
RM RS
RV
SB
SU
TJ
TM
1995
1996
1997
1998
1999
2000
2001
2002
2003
2004
2005
0 5 10 15 20 25 30
Concluding remarks and further developments
• A major part of the long-term monthly temperature variations in Romania is caused by natural factors, but in some cases the changing in the weather stations location and/or automatization have induced artificial leaps in the series
• Metadata = very useful, but they cannot explain everything!
• More metadata (very possible)• Efforts for series reconstruction (carefully)• Bordering problems (possible)• More methods (very possible)