sophisticated imaging technology in the assessment of...
TRANSCRIPT
10
Sophisticated Imaging Technology in the Assessment of Osteoporosis Risk
Huayue Chen1, Tatsuro Hayashi2, Xiangrong Zhou2, Hiroshi Fujita2, Minoru Onozuka3 and Kin-ya Kubo4
1Department of Anatomy, Gifu University Graduate School of Medicine 2Department of Intelligent Image Information, Gifu University Graduate School of Medicine
3Department of Physiology and Neuroscience, Kanagawa Dental College 4Seijoh University Graduate School of Health Care Studies,
Japan
1. Introduction
Osteoporosis is a common disease characterized by low bone mass and microstructural
deterioration of bone tissue, with an increased fracture risk. With an aging population,
osteoporosis and its related fractures have become an increasingly important health and
socioeconomic issue. The aim of osteoporosis screening and treatment is to prevent bone
fracture. A fracture occurs when the external force applied to a bone exceeds its strength.
The ability of a bone to resist fracture depends on its amount, spatial distribution, and
intrinsic properties. Sophisticated bone imaging techniques, as new modalities, improve the
potential for non-invasive study of bone anatomy, physiology and pathophysiology. The
objective of bone imaging in osteoporosis is to minimize fracture occurrence by identifying
the osteoporotic process at an early stage, differentiate distinctive patterns of bone loss,
predict fracture risk accurately and monitor treatment response precisely. Non-invasive
imaging techniques, such as computed tomography (CT) and magnetic resonance imaging
(MRI), provide structural information, beyond bone mineral density (BMD). Non-invasive
or non-destructive imaging techniques can provide important structural information about
the local and systemic skeletal status and about the propensity to fracture. These advanced
imaging techniques provide information about bone beyond standard bone mineral
densitometry. In this chapter, we will discuss recent progress in bone imaging in a range
from the macro- to micro-structures in order to investigate the structural basis of the skeletal
fragility underlying osteoporosis.
2. Bone mineral density measurement
In bone fragility assessment, BMD is the main parameter to quantify because of its
relationship to bone strength and prediction fracture risk. In the past two decades bone
densitometry has been performed with direct methods such as dual X-ray absorptiometry
(DXA) and quantitative computed tomography (QCT), which also evaluates bone structural
www.intechopen.com

Osteoporosis
182
characteristics. The most commonly used quantitative imaging measure in osteoporosis is
the areal BMD assessed by DXA. The assessment of bone macro- and micro-architecture by
using more sensitive three-dimensional (3D) methods is important to determine certain
aspects of bone structure and quality. Research has especially focused on the assessment of
compartmental BMD and bone microstructure, since it has become technologically possible
to obtain relatively high resolution volumetric images of bone in vivo.
2.1 Dual X-ray absorptiometry
Bone mineral density (BMD) measurement by dual X-ray absorptiometry (DXA) has been available for clinical use since 1987. It provides a quantitative assessment of mineralized bone mass at the axial and appendicular skeleton in vivo. This technique is currently the most readily available surrogate marker of bone strength and fracture risk. DXA measures the attenuation of photons of two different energies during radiation transmission. Bone mineral content (BMC, g) and areal BMD (g/cm2) of a region of interest are obtained. As low areal BMD is a strong risk factor for fractures, this technique provides the basis for the World Health Organization (WHO)’s guidelines for diagnosis of osteoporosis. DXA is limited in that it measures only areal BMD two-dimensionally. DXA is also limited in that it does not distinguish cortical and trabecular bone. Furthermore, measurements are subject to artefacts due to degenerative changes such as osteophytes and aortic calcification. Recommendations from the International Society for Clinical Densitometry regarding DXA examination for all ages have been updated. Although DXA is the gold standard for clinical assessment of fracture risk, its shortcomings are increasingly being recognized. Individual fracture risk has recently been standardized using the WHO Fracture Risk Assessment tool (FRAX), which was released in 2009 (Kanis et al., 2009). FRAX combines BMD from DXA with other well-known major risk factors for osteoporosis, such as age, sex and a parental history of hip fracture, to provide a 10-year risk of hip and other major fractures. Although it is not an ideal system, FRAX represents an important initiative in allowing clinicians to individualize fracture risk based on DXA examination and other factors.
2.2 Quantitative computed tomography (QCT)
In quantitative computed tomography (QCT), the X-ray source and detector rotate in synchronised fashion around the subject. Algorithms are used to reconstruct the attenuation data into 3D images. Use of a bone mineral or hydroxyapatite phantom allows calibration of the data, providing a measurement of bone density that is independent of bone size. Compared with DXA, one advantage of QCT is the capacity for separate analysis of the cortical and trabecular BMD. QCT also provides real bone density per bone volume (mg/cm3). Recently, 3D volume data from the scanning of an entire bone, such as a vertebral body or proximal femur, can be reconstructed to adjust the exact selected region for several serial images in a longitudinal study, which enables monitoring of successive changes with very good precision. QCT-based bone measurements have been used to evaluate age-, sex- and ethnic-related differences in vertebral and femoral geometry and density, providing insights into the development of skeletal fragility.
2.2.1 Volumetric BMD assessment by QCT
CT image is a two step process of initial scan acquisition and then tomographic image
reconstruction by a mathematical process of calculating from acquired raw data. All clinical
www.intechopen.com

Sophisticated Imaging Technology in the Assessment of Osteoporosis Risk
183
CT scanners are calibrated to the X-ray attenuation to the water, resulting in CT numbers,
measured in Hounsfield Units (HU). To transform HU into bone mineral equivalents
(mg/cm3) an appropriate bone mineral phantom is included in the scan field. QCT is the
unique modality that measures the real bone density in a determinate volume (mg/cm³)
without the overlapping of others tissues. QCT differs from DXA as it can allow a selective
assessment of both trabecular and cortical bone. Trabecular BMD obtained by QCT shows a
more rapid age dependent decrement than that measured by DXA. Single Energy QCT is
normally used for clinical setting, though BMD estimation can be altered by quantity of fat
tissue, which substitutes the red marrow in elderly people. This effect produces an
increasing error of evaluation with the increase of elderly patients. Even if Dual Energy QCT
improves the accuracy, nevertheless it uses higher radiation dose and longer scanning times
without increasing QCT sensibility in discriminating between healthy and osteoporotic
subjects. Over the last decade, technical developments in CT, including multi-detector CT
(MDCT) have resulted in images of volumes of tissue being acquired very rapidly, and this
has had an impact on QCT in that 3D volume images can be acquired rapidly. Such 3D
volumetric QCT enables analysis of the hip, the important site of osteoporotic fracture,
which was not feasible with 2D single slices.
2.2.2 Vertebral trabecular QCT assessment
The trabecular BMD, particularly in the vertebra, is metabolically more active and may therefore serve as an early indicator of osteoporosis treatment effect. Vertebral trabecular BMD was demonstrated to have a significant correlation with vertebral fracture. Worldwide, the number of subjects in thoracic and abdominal CT examinations has increased dramatically over the last two decades (McCollough et al., 2009). Several recent studies have shown how it is possible to obtain meaningful QCT BMD values from subjects undergoing thoraco-abdominal CT examinations without the use of a calibration phantom. Such BMD values have a high correlation with BMD values obtained from QCT. These studies demonstrate that it is technically feasible to obtain reasonably accurate BMD values in subjects undergoing thoracic or abdominal CT examinations for other reasons. It is very useful for subjects as it will allow predictions of vertebral fractures without additional radiation exposure (Lenchik et al., 2004). The analysis of BMD at different vertebral levels is necessary because most osteoporotic vertebral fractures are located in the thoracolumbar spine between T4 and L1, with the segments between T7 and L1 most affected (Wasnich, 1996). Osteoporotic fractures of the cervical spine are considered uncommon. The etiology of the striking segmental differences for osteoporotic vertebral fractures is not well explained. Recently we measured the trabecular BMD of thoracic and lumbar vertebrae from 1,031 subjects who had undergone MDCT examination (Hayashi et al., 2011). The vertebral trabecular BMD of both men and women tended to gradually decrease from Th1 to L3 in all age categories (Fig. 1). In relation to vertebral level, L3 had the lowest trabecular BMD among the thoracic and lumbar vertebrae. The correlation of the trabecular BMD among thoracic and lumbar vertebrae was also studied. On the whole, we found that the further the vertebrae were from each other, the weaker were their correlations of the trabecular BMD, and vice versa. This finding indicates that estimating the BMD of distant vertebrae existing beyond the scope of CT images is difficult. For example, if the BMDs of T7 and T12 are estimated using L3 BMD in CT images from abdominal organ examinations, the estimated accuracy of T12 (r=0.92) would be better than that of T7 (r=0.79) because T12 is nearer to L3
www.intechopen.com

Osteoporosis
184
than T7 (Hayashi et al., 2011). That is to say, it may be appropriate to use an arbitrary vertebra as a first approximation for assessing vertebrae which are in the area of predilection for the fracture. If the BMD of one vertebra is known, the BMD of other vertebrae may be estimated using our knowledge of BMD correlations.
Fig. 1. The trabecular BMD of the thoracic and lumbar vertebrae. The BMD tends to decrease from the first thoracic to third lumbar vertebra (Hayashi et al., 2011)
3. Bone quality assessment
As BMD explains only part of the variation seen in bone strength and only some of the
observed reduction in fracture risk that occurs with treatment, recent developments have
focused more on measuring bone structure and quality of both cortical and trabecular bone
rather than bone mass alone. This is done with the knowledge that a measure encompassing
bone quality and structure along with bone mass will provide a better prediction of fracture
risk than bone mass alone.
3.1 Conventional X-rays
Conventional radiography is a low-cost, readily available technique with high spatial
resolution capable of providing fine bone detail, especially for appendicular skeleton such as
the distal forearm and phalanges. It is widely available method, provides a good tissue
contrast and has the potential to reflect bone microstructure. Conventional radiography is the
first and most important method to identify fractures. The distal radius fractures are almost
always identified by standard radiographs, while hip and especially spine fractures may have
a difficult detection with important significance in their management, prognosis and therapy.
0 T1 T2 T3 T4 T5 T6 T7 T9 T10 T11 T12 L2 L3 L4 L5
(mg/cm3)
50
100
150
200
250
T8 L1
www.intechopen.com
Sophisticated Imaging Technology in the Assessment of Osteoporosis Risk
185
A more accurate evaluation of lateral chest radiographs routinely executed could lead to the
detection of a major number of vertebral fractures and earlier diagnosis of osteoporosis.
Although it is ideally suited for use in large population studies, the limitation of radiography
is that as a projection imaging technique, it cannot consistently visualize individual trabecula
and it depends heavily on the depth of tissues under investigation. Despite these limitations,
the trabecular bone properties could be described by texture analysis. Good correlations were
found between direct, 3D measures of trabecular architecture and a multiple parameter model,
based on 2D texture parameters, such as fractal, statistical and anisotropy measures
(Guggenbuhl et al., 2006). With increasing sophistication of structural analysis techniques and
an improving ability to acquire high-resolution radiographic detail, interest remains in
developing radiography to more precisely evaluate trabecular bone microstructure.
3.2 Multi-detector computed tomography (MDCT)
Computed tomography (CT) is a 3D X-ray imaging technique, which provides positive contrast of mineralized tissues. The image formation process begins with the acquisition of serial radiographic projections over a range of angular positions around the object of interest. The cross-sectional field of view is then reconstructed using established computational techniques. Similar to simple radiography, the reconstructed image intensity values represent the local X-ray attenuation. A material property related to the electron density. Several classes of CT devices are presently used for high-resolution imaging of trabecular and cortical bone microstructure. The multi-detector CT (MDCT) is a clinical CT technique, which is available in most diagnostic imaging departments and thus a dedicated scanner is not required. Since its inception, the number of detector rows on clinical CT units has increased from 4 to the current clinical standard of 64 rows, although 320-row MDCT systems are also commercially available. As expected, MDCT fared less well with trabecular thickness and number because the spatial resolution of all MDCT systems (250–300μm) remains larger than the trabecular thickness of 50 to 200μm (Issever et al., 2010). Nevertheless, structural parameters by MDCT provide a better discriminator of change than DXA. It has been shown that trabecular bone parameters obtained with MDCT correlate with those determined in contact radiographs from histological bone sections and micro-CT (Link et al., 2003). The advantage of MDCT technique is that more central regions of the skeleton such as the spine and proximal femur can be visualized. However, in order to achieve adequate spatial resolution and image quality the required radiation exposure is substantial, which offsets the technique’s applicability in clinical routine and scientific studies. High-resolution CT scanning is associated with considerably higher radiation dose compared with standard techniques for measuring BMD. Using clinical imaging in more central regions of the skeleton such as spine and femur, it is still noted that the trabecular bone architecture visualized with MDCT is more a texture of the trabecular bone than a true visualization of the individual trabecular structure.
3.3 Peripheral quantitative CT and high-resolution peripheral quantitative CT
The peripheral QCT (pQCT) with a resolution comparable to that of MDCT has been available since 1990 to examine the peripheral skeleton. pQCT confers a smaller effective radiation dose and is particularly useful for studying cortical bone changes in metabolic bone disorders because the distal radius contains more cortical bone than the vertebral body. As pQCT units use low-power X-ray tubes, these examinations are slow, with a
www.intechopen.com

Osteoporosis
186
tendency toward motion artifact. With this limitation in mind, the feasibility of using clinical CT scanners with a dedicated forearm phantom as an alternative to pQCT has been investigated. The cortical and trabecular BMD, and bone geometrical parameters, such as marrow and cortical cross-sectional area, cortical thickness, periosteal and endosteal circumference, biomechanical parameters can be obtained, like cross-sectional moment of inertia, which is a measure of bending strength, polar moment of inertia, indicating bone strength in torsion and stress strain index (SSI). A non-invasive bone strength marker as SSI measured by pQCT, could be significantly correlated with a biomechanical bone strength index, as maximum load at bone failure, assessed by three-point bending test. pQCT can non-invasively determine bone mechanical properties by assessing parameters with accepted prognostic value on bone strength (Kokoroghiannis, et al., 2009). Bridging the clinical need for an imaging modality with lower radiation dose and better spatial resolution is the high-resolution pQCT (HR-pQCT). This can measure trabecular and cortical bone density and bone microstructure with an isotropic voxel of about 80µm. This technique has excellent precision for both density and structure measurements (Dalzell et al., 2009). In 2005, the first published clinical study assessing HR-pQCT found that postmenopausal women had lower BMD, trabecular number and cortical thickness compared with premenopausal women at the distal radius and tibia, although spine and hip BMD was similar. HR-pQCT is a useful modality for assessing changes in cortical and trabecular bone, with a precision of about 2% to 5% (Boutroy et al., 2005). The main limitation of HR-pQCT is that it requires a dedicated scanner, is confined to examination of distal forearm and leg, has some difficultly with registration in the Z plane and should take into consideration the expected difference among individuals of short or long radial or tibial length.
3.4 Micro-CT (µCT) The earlier conventional tool for assessing trabecular bone architecture was histomorphometry from bone biopsies, which produces a two-dimensional representation of tissue structure, while bone structure is three-dimensional. In recent years, it has progressively been imposed the direct 3D analysis of biopsy specimens imaged by micro-CT
(µCT). The most common application of this technology has been the in vitro quantitation of osteoporotic change in trabecular bone architecture. The µCT system has been demonstrated to be the first device able to non-destructively reveal the “real” trabecular architecture and is an X-ray-based technique that provides 3D images of very high spatial resolution below 8 µm. Since µCT allows the depiction of individual trabecula and enables the full characterization of the trabecular network, many investigators have used it to study the trabecular network at different skeletal sites, in direct relation to biomechanical properties or as a “gold standard” for evaluating other techniques, although most of the µCT are limited to ex vivo investigations. Microarchitectural 3D data elaborated by specific software consents to evaluate many metric and non-metric bone structural parameters, such as the bone volume (BV), tissue volume (TV), bone volume fraction (BV/TV), trabecular thickness (Tb.Th), trabecular number (Tb.N), trabecular separation (Tb.Sp), structure model index (SMI), connectivity degree (Conn.D) and degree of anisotropy (DA).
3.4.1 Hamster bone µCT assessment Age-related bone loss, which is poorly characterized, is a major underlying cause of osteoporotic fractures in the elderly. In order to identify the morphological feature of age-related bone loss, we investigated sex and site (tibia, femur and vertebra) dependence of
www.intechopen.com
Sophisticated Imaging Technology in the Assessment of Osteoporosis Risk
187
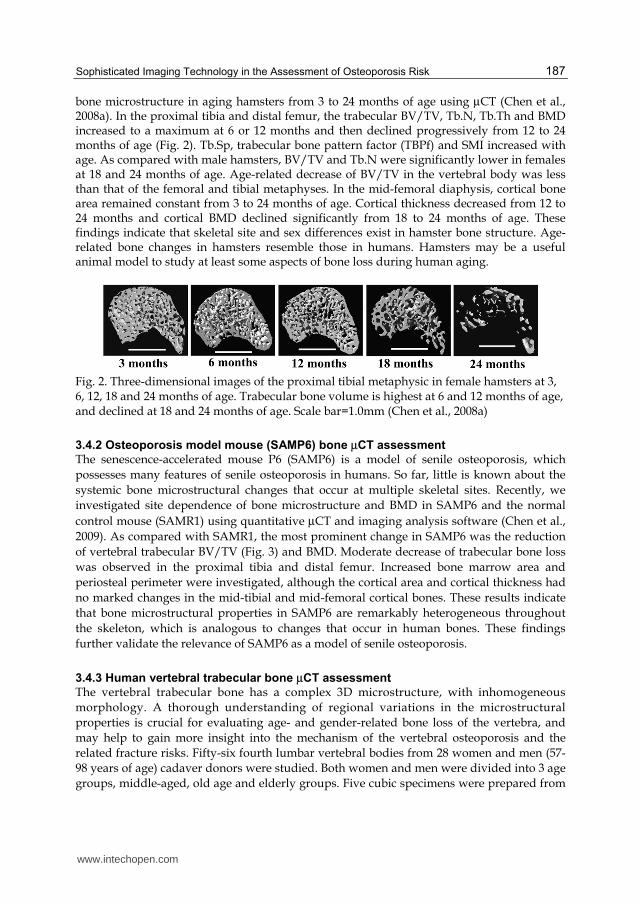
bone microstructure in aging hamsters from 3 to 24 months of age using µCT (Chen et al., 2008a). In the proximal tibia and distal femur, the trabecular BV/TV, Tb.N, Tb.Th and BMD increased to a maximum at 6 or 12 months and then declined progressively from 12 to 24 months of age (Fig. 2). Tb.Sp, trabecular bone pattern factor (TBPf) and SMI increased with age. As compared with male hamsters, BV/TV and Tb.N were significantly lower in females at 18 and 24 months of age. Age-related decrease of BV/TV in the vertebral body was less than that of the femoral and tibial metaphyses. In the mid-femoral diaphysis, cortical bone area remained constant from 3 to 24 months of age. Cortical thickness decreased from 12 to 24 months and cortical BMD declined significantly from 18 to 24 months of age. These findings indicate that skeletal site and sex differences exist in hamster bone structure. Age-related bone changes in hamsters resemble those in humans. Hamsters may be a useful animal model to study at least some aspects of bone loss during human aging.
Fig. 2. Three-dimensional images of the proximal tibial metaphysic in female hamsters at 3, 6, 12, 18 and 24 months of age. Trabecular bone volume is highest at 6 and 12 months of age, and declined at 18 and 24 months of age. Scale bar=1.0mm (Chen et al., 2008a)
3.4.2 Osteoporosis model mouse (SAMP6) bone µCT assessment
The senescence-accelerated mouse P6 (SAMP6) is a model of senile osteoporosis, which
possesses many features of senile osteoporosis in humans. So far, little is known about the
systemic bone microstructural changes that occur at multiple skeletal sites. Recently, we
investigated site dependence of bone microstructure and BMD in SAMP6 and the normal
control mouse (SAMR1) using quantitative µCT and imaging analysis software (Chen et al.,
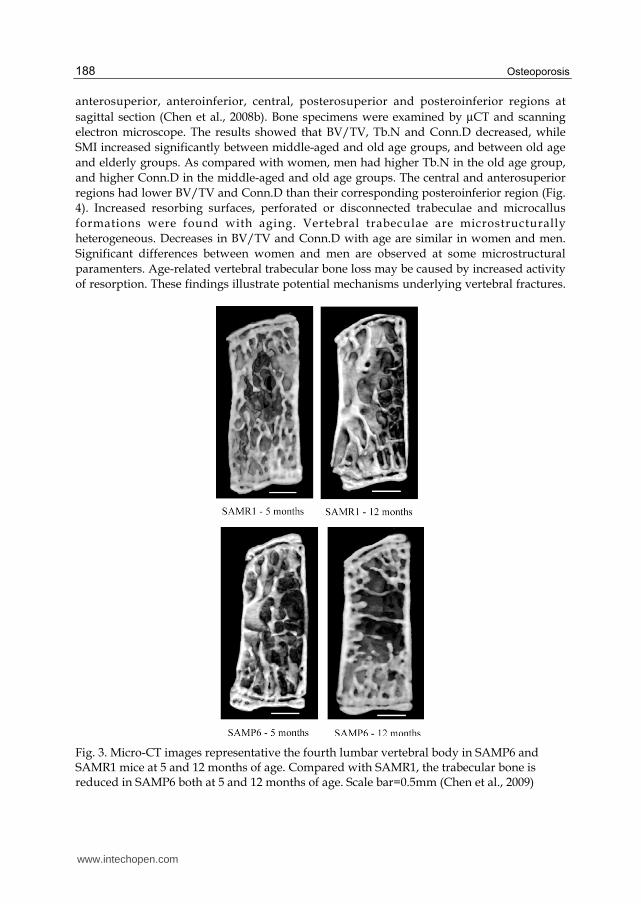
2009). As compared with SAMR1, the most prominent change in SAMP6 was the reduction
of vertebral trabecular BV/TV (Fig. 3) and BMD. Moderate decrease of trabecular bone loss
was observed in the proximal tibia and distal femur. Increased bone marrow area and
periosteal perimeter were investigated, although the cortical area and cortical thickness had
no marked changes in the mid-tibial and mid-femoral cortical bones. These results indicate
that bone microstructural properties in SAMP6 are remarkably heterogeneous throughout
the skeleton, which is analogous to changes that occur in human bones. These findings
further validate the relevance of SAMP6 as a model of senile osteoporosis.
3.4.3 Human vertebral trabecular bone µCT assessment
The vertebral trabecular bone has a complex 3D microstructure, with inhomogeneous
morphology. A thorough understanding of regional variations in the microstructural
properties is crucial for evaluating age- and gender-related bone loss of the vertebra, and
may help to gain more insight into the mechanism of the vertebral osteoporosis and the
related fracture risks. Fifty-six fourth lumbar vertebral bodies from 28 women and men (57-
98 years of age) cadaver donors were studied. Both women and men were divided into 3 age
groups, middle-aged, old age and elderly groups. Five cubic specimens were prepared from
www.intechopen.com
Osteoporosis
188
anterosuperior, anteroinferior, central, posterosuperior and posteroinferior regions at
sagittal section (Chen et al., 2008b). Bone specimens were examined by µCT and scanning
electron microscope. The results showed that BV/TV, Tb.N and Conn.D decreased, while
SMI increased significantly between middle-aged and old age groups, and between old age
and elderly groups. As compared with women, men had higher Tb.N in the old age group,
and higher Conn.D in the middle-aged and old age groups. The central and anterosuperior
regions had lower BV/TV and Conn.D than their corresponding posteroinferior region (Fig.
4). Increased resorbing surfaces, perforated or disconnected trabeculae and microcallus
formations were found with aging. Vertebral trabeculae are microstructurally
heterogeneous. Decreases in BV/TV and Conn.D with age are similar in women and men.
Significant differences between women and men are observed at some microstructural
paramenters. Age-related vertebral trabecular bone loss may be caused by increased activity
of resorption. These findings illustrate potential mechanisms underlying vertebral fractures.
Fig. 3. Micro-CT images representative the fourth lumbar vertebral body in SAMP6 and SAMR1 mice at 5 and 12 months of age. Compared with SAMR1, the trabecular bone is reduced in SAMP6 both at 5 and 12 months of age. Scale bar=0.5mm (Chen et al., 2009)
www.intechopen.com

Sophisticated Imaging Technology in the Assessment of Osteoporosis Risk
189
Fig. 4. Three-dimensional micro-CT image in different regions of the vertebral body from a woman aged 78 years: anterosuperior (a), anteroinferior (b), central (c), posterosuperior (d) and posteroinferior (e) regions. The trabecular bone is higher in the posterosuperior and posteroinferior regions than that of the central and anterosuperior regions (Chen et al., 2008b)
3.4.4 Human femoral neck µCT assessment
Femoral neck fracture, which is one of the most common outcomes of age-related and
postmenopausal osteoporosis, is a significant cause of morbidity and mortality worldwide.
Femoral neck fracture is attributed to both cortical and trabecular bone loss. The relative
contribution of femoral neck cortical and trabecular bone to whole bone strength is unclear.
We identified 3D microstructural changes of both cortical and trabecular bone
simultaneously in human femoral neck from 57 to 98 years of age (Chen et al., 2010). The
findings demonstrate that cortical thickness (Ct.Th) decreased by 10-15%, cortical porosity
(Ca.V/TV) almost doubled between the middle-aged and elderly groups (Fig. 5).
The trabecular BV/TV declined by around 20% between the middle-aged and elderly
groups. The most obvious age-related change in the femoral neck is the increase of
Ca.V/TV. The decrease of BV/TV with age is more noticeable than that of Ct.Th. There was
a significant inverse correlation between Ca.V/TV and BV/TV for both women and men. As
compared with women, men had higher Ct.Th and BV/TV and lower Ca.V/TV. These
findings may serve as reference for ethnic comparison with age and gender and may help to
gain more insight into femoral neck fracture risk.
www.intechopen.com

Osteoporosis
190
Fig. 5. Three-dimensional reconstructed images of the canal networks in the inferior femoral neck cortex from a man aged 62 years (a), a man aged 92 years (b), a woman aged 62 years (c) and a woman aged 92 years (d). There are more enlarged canals in the 92-year-old woman than that of the 62-year-old man. Representative two-dimensional micro-CT image of the femoral neck cortex from a woman aged 92 years (e) is shown. Periosteal surface faces right for all specimens (Chen et al., 2010)
3.4.5 Human proximal tibia µCT assessment
The analyses of local trabecular microstructure have been mainly performed in regions most susceptible to fractures, such as spine, proximal femur and radius. Studies of the proximal tibia also have an important clinical significance, as it is fractured in aging patients, specifically those suffering from osteoporosis. The proximal tibia, with its rich trabecular network, can be used as a donor site for bone grafting and it is the most easily accessible site for quantification of BMD and bone microstructure. The trabecular bone specimens from the medial
www.intechopen.com

Sophisticated Imaging Technology in the Assessment of Osteoporosis Risk
191
compartment of the proximal tibial metaphyses were examined with µCT and scanning electron microscopy (Chen et al., 2011). It was shown that from 57 to 98 years of age, the trabecular BV/TV decreased by 6-7% and the trabecular BMD declined around 4% per decade at the proximal tibia. Figure 6 shows the typical 3D reconstructions of trabecular bone of the middle-aged and elderly groups for both women and men. The trabecular Tb.Th decreased between the middle-aged and elderly groups similarly in women and men. However, Tb.N decreased by 13% between the middle-aged and elderly groups in women and nearly doubled that in men. As compared with women, men had higher BV/TV and lower Tb.Sp in the old age and elderly groups, and higher Tb.N and Conn.D in the elderly group. Increased trabecular resorbing surfaces, perforated or disconnected trabeculae and microcallus formations were observed with age. These findings indicate that both BMD and BV/TV decreased at the proximal tibia with age similarly for women and men, but significant differences between women and men were observed for some microstructural parameters.
Fig. 6. Three-dimensional reconstructed images of trabecular microstructure at proximal tibia from a man aged 62 years (a), a man aged 92 years (b), a woman aged 62 years (c) and a woman aged 92 years (d). The trabecular bone volume fraction is highest in man aged 62 years and lowest in woman aged 92 years (Chen et al., 2011)
www.intechopen.com
Osteoporosis
192
3.5 Magnetic resonance imaging (MRI)
Magnetic resonance imaging (MRI) is a non-ionizing method that uses a strong magnetic
field in combination with specialized sequences of radio-frequency pulses to generate high-
resolution 3D images of cortical and trabecular bone in vivo. Therefore, it is well suitable for
assessing bone structure clinically (Link, 2010). With technical advances in MRI, such as
optimized coil design, fast gradients, high gradients and high field strength, MRI scanners
provide an in vivo spatial resolution close to the diameter of a single trabecula. MRI signal
of trabecular bone itself is not visualized and trabeculae appear as a signal void, surrounded
by high-intensity fatty bone marrows. As a result, the bone structure is assessed indirectly
via measurements of the surrounding marrow and other soft tissues. Advances in the past
decade have focused on image acquisition and analysis techniques to overcome inherent
obstacles in MR imaging of bone. With the advent of parallel imaging, motion correlation
techniques and new sequences, the limits of spatial resolution and scan time can be further
overcome. This non-ionizing, 3D imaging technique is a very attractive tool to analyze
trabecular bone structure, investigating bone structure and metabolism in osteoporosis or
osteoarthritis. Various studies have been undertaken to optimize image acquisition and post
processing, and to calibrate and validate measurements of the trabecular architecture.
However, methods can be technically challenging to achieve and optimize.
4. Conclusion
Bone fragility, composite description of bone’s biomechanical properties, is directly related
to bone’s susceptibility to fracture and is inversely related to bone’s fracture resistance. As
fractures compromise the quality of life and shorten life expectancy, the sophisticated bone
imaging modalities play an important role in clearly and accurately identifying the presence
and features of fragility fractures. The analysis of bone mass and bone microstructure is an
exciting field in the assessment of osteoporotic risk. With the recent advances in MRI and
CT, including the introduction of clinical µCT, imaging of true bone structure is becoming
more feasible. These non-invasive sophisticated imaging techniques help us to gain more
insight into the potential mechanism of metabolic bone diseases, particularly osteoporosis.
However, further research is required for improvements in reproducibility, standardization
and clinical application of these methods. New technological advances may further refine
the imaging of osteoporotic bone and assessment of fracture risk. Recently various
computer-aided diagnosis systems were developed for assessment of osteoporosis risks. The
dental clinics took numerous panoramic radiographs for examining dental diseases
worldwide. Several investigators demonstrated significant associations between mandibular
cortical indices on panoramic radiographs and BMD of the skeleton generally, such as the
spine and femur, biochemical markers of bone turnover and risk of osteoporotic fractures
(Taguchi, 2010). So the computer-aided diagnosis system, based on digital panoramic
radiography, may offer a new triage screening for osteoporosis risk in the near future.
5. Acknowledgment
The authors thank Dr. Ken-ichi Tezuka, Department of Tissue and Organ Development,
Gifu University Graduate School of Medicine, for providing the micro-CT system used in
this study.
www.intechopen.com

Sophisticated Imaging Technology in the Assessment of Osteoporosis Risk
193
6. References
Boutroy, S.; Bouxsein, ML.; Munoz, F. & Delmas, PD. (2005) In vivo assessment of trabecular bone microarchitecture by highresolution peripheral quantitative computed tomography. Journal of Clinical Endocrinology & Metaboliam, Vol.90, No.12, (December 2005), pp. 6508–6515, ISSN 0021-972X (Print); 1945-7197 (Electronic)
Chen, H.; Zhou, X.; Washimi, Y. & Shoumura, S. (2008a) Three-dimensional microstructure of the bone in a hamster model of senile osteoporosis. Bone, Vol.43, No.3, (September 2008), pp. 494-500, ISSN 8756-3282
Chen, H.; Shoumura, S.; Emura, S. & Bunai, Y. (2008b) Regional variations of vertebral trabecular bone microstructure with age and gender. Osteoporosis International, Vol.19, No.10, (October 2008), pp. 1473-1483, ISSN 1433-2965 (Print); 0937-941X (Electronic)
Chen, H.; Zhou, X.; Emura, S. & Shoumura, S. (2009). Site-specific bone loss in senescence-accelerated mouse (SAMP6): a murine model for senile osteoporosis. Experimental Gerontology, Vol.44, No.12, (December 2009), pp. 792-798, ISSN 0531-5565
Chen, H.; Zhou, X.; Shoumura, S.; Emura, S. & Bunai, Y. (2010) Age- and gender-dependent changes in three-dimensional microstructure of cortical and trabecular bone at the human femoral neck. Osteoporosis International, Vol.21, No.4, (April 2010), pp. 627-636, ISSN 1433-2965 (Print); 0937-941X (Electronic)
Chen, H.; Washimi, Y.; Kubo, K. & Onozuka, M. (2011) Gender-related changes in three-dimensional microstructure of trabecular bone at the human proximal tibia with aging. Histology and Histopathology, Vol.26, No.5, (April 2011), pp. 563-570, ISSN 0213-3911 (Print); 1699-5848 (Electronic)
Dalzell, N.; Kaptoge, S.; Morris, N.; Berthier, A.; Koller, B.; Braak, L.; van Rietbergen, B. & Reeve, J. (2009) Bone micro-architecture and determinants of strength in the radius and tibia: age-related changes in a population-based study of normal adults measured with high-resolution pQCT. Osteoporosis International, Vol.20, No.10, (October 2009), pp. 1683-1694, ISSN 1433-2965 (Print); 0937-941X (Electronic)
Guggenbuhl, P.; Bodic, F.; Hamel, L.; Basle, MF. & Chappard, D. (2006) Texture analysis of X-ray radiographs of iliac bone is correlated with bone micro-CT. Osteoporosis International, Vol.17, No.3, (January 2006), pp. 447–454, ISSN 1433-2965 (Print); 0937-941X (Electronic)
Hayashi, T.; Chen, H.; Miyamoto, K.; Zhou, X.; Hara, T.; Yokoyama, R.; Kanematsu, M.; Hoshi, H. & Fujita, H. (2011) Analysis of bone mineral density distribution at trabecular bones in thoracic and lumbar vertebrae using X-ray CT images Journal of Bone and Mineral Metabolism, Vol.29, No.2, (March 2011), pp. 174-185, ISSN 0914-8779
Issever, AS.; Link, TM.; Kentenich, M.; Rogalla, P.; Burghardt, AJ.; Kazakia, GJ.; Majumdar, S. & Diederichs, G. (2010) Assessment of trabecular bone structure using MDCT: comparison of 64- and 320-slice CT using HR-pQCT as the reference standard. European Radiology, Vol.20, No.2, (February 2010), pp. 458–468, ISSN 0938-7994 (Print); 1432-1084 (Electronic)
Kanis, JA.; Johansso,n H.; Oden, A. & McCloskey, EV. (2009) Assessment of fracture risk. European Journal of Radiology, Vol.71, No.3, (September 2009), pp. 392–397, ISSN 0720-048X
www.intechopen.com
Osteoporosis
194
Kokoroghiannis, C.; Charopoulos, I.; Lyritis, G.; Raptou, P.; Karachalios, T. & Papaioannou, N. (2009) Correlation of pQCT bone strength index with mechanical testing in distraction osteogenesis. Bone, Vol.45, No.3, (Semptember 2009), pp. 512-516, ISSN 8756-3282
Lenchik, L.; Shi, R.; Register, TC.; Beck, SR.; Langefeld, CD. & Carr, JJ. (2004) Measurement of trabecular bone mineral density in the thoracic spine using cardiac gated quantitative computed tomography. Journal of Computer Assisted Tomograpgy, Vol.28, No.1, (January 2004), pp. 134-139, ISSN 0363-8715
Link, TM. (2010) The Founder’s Lecture 2009: advances in imaging of osteoporosis and osteoarthritis. Skeletal Radiology, Vol.39, No.10, (October 2010), pp. 943–955, ISSN 0364-2348 (Print); 1432-2161 (Electronic)
Link, T.; Vieth, V.; Stehling, C.; Lotter, A.; Beer, A.; Newitt, D. & Majumdar, S. (2003) High resolution MRI versus Multislice spiral CT - Which technique depicts the trabecular bone structure best? European Radiology, Vol.13, No.4, (April 2003), pp. 663-671, ISSN 0938-7994 (Print); 1432-1084 (Electronic)
McCollough, CH.; Guimarães, L. & Fletcher, JG. (2009) In defense of body CT. American Journal of Roentgenology, Vol.193, No.1, (July 2009), pp. 28–39, ISSN 0361-803X (Print); 1546-3141 (Electronic)
Taguchi, A. (2010) Triage screening for osteoporosis in dental clinics using panoramic radiographs. Oral Diseases, Vol.16, No.4, (May 2010), pp. 316-327, ISSN 1354-523X (Print); 1601-0825 ( Electronic)
Wasnich, RD. (1996) Vertebral fracture epidemiology. Bone, Vol.18, No.3 Suppl., (May 1996), pp. 179S-183S, ISSN 8756-3282
www.intechopen.com

OsteoporosisEdited by PhD. Yannis Dionyssiotis
ISBN 978-953-51-0026-3Hard cover, 864 pagesPublisher InTechPublished online 24, February, 2012Published in print edition February, 2012
InTech EuropeUniversity Campus STeP Ri Slavka Krautzeka 83/A 51000 Rijeka, Croatia Phone: +385 (51) 770 447 Fax: +385 (51) 686 166www.intechopen.com
InTech ChinaUnit 405, Office Block, Hotel Equatorial Shanghai No.65, Yan An Road (West), Shanghai, 200040, China
Phone: +86-21-62489820 Fax: +86-21-62489821
Osteoporosis is a public health issue worldwide. During the last few years, progress has been madeconcerning the knowledge of the pathophysiological mechanism of the disease. Sophisticated technologieshave added important information in bone mineral density measurements and, additionally, geometrical andmechanical properties of bone. New bone indices have been developed from biochemical and hormonalmeasurements in order to investigate bone metabolism. Although it is clear that drugs are an essentialelement of the therapy, beyond medication there are other interventions in the management of the disease.Prevention of osteoporosis starts in young ages and continues during aging in order to prevent fracturesassociated with impaired quality of life, physical decline, mortality, and high cost for the health system. Anumber of different specialties are holding the scientific knowledge in osteoporosis. For this reason, we havecollected papers from scientific departments all over the world for this book. The book includes up-to-dateinformation about basics of bones, epidemiological data, diagnosis and assessment of osteoporosis,secondary osteoporosis, pediatric issues, prevention and treatment strategies, and research papers fromosteoporotic fields.
How to referenceIn order to correctly reference this scholarly work, feel free to copy and paste the following:
Huayue Chen, Tatsuro Hayashi, Xiangrong Zhou, Hiroshi Fujita, Minoru Onozuka and Kin-ya Kubo (2012).Sophisticated Imaging Technology in the Assessment of Osteoporosis Risk, Osteoporosis, PhD. YannisDionyssiotis (Ed.), ISBN: 978-953-51-0026-3, InTech, Available from:http://www.intechopen.com/books/osteoporosis/sophisticated-imaging-technology-in-the-assessment-of-osteoporosis-risk

© 2012 The Author(s). Licensee IntechOpen. This is an open access articledistributed under the terms of the Creative Commons Attribution 3.0License, which permits unrestricted use, distribution, and reproduction inany medium, provided the original work is properly cited.