sopemi - regjeringen.no€¦ · web viewin recruiting manpower from abroad aetat works in close...
TRANSCRIPT

SOPEMINorway
2001
Trends of migration to and from Norway and the situation of immigrants in Norway
Correspondents: Magne Holter and Camilla LandsverkStatistical data provided by Statistics Norway and
The Directorate of Immigration
November 2001
1

Content:
1 GENERAL OVERVIEW..............................................................................................................................................42 MIGRATION FLOWS................................................................................................................................................5
2.1 Migration Flows.............................................................................................................................................52.2 General Regulations.......................................................................................................................................62.3 The Schengen and Dublin Co-operation........................................................................................................7
3 REFUGEES AND ASYLUM SEEKERS.........................................................................................................................73.1 Arrival of Asylum Seekers..............................................................................................................................7Diagram 1. Asylum seekers to Norway 1990-2000..............................................................................................9Table 1. Asylum seekers to Norway 1998 - 30 Sept 2001, by nationality............................................................9Table 2. Asylum seekers granted convention refugee status in 1. instance (Directorate of Immigration) and 2. instance (Ministry of Justice).............................................................................................................................10Table 3. Asylum seekers granted humanitarian status in 1. and 2. instance.....................................................103.2 Resettlement of Refugees..............................................................................................................................10Diagram 2. Number of resettled refugees 1995-2000........................................................................................11Table 4. Resettled refugees in 2000, by country of origin.................................................................................113.3 Family Reunification for Refugees...............................................................................................................123.4 Repatriation of Refugees..............................................................................................................................12Diagram 3. Repatriation by nationality, 2000...................................................................................................13Diagram 4. Number of repatriated refugees 1994-98 by country of origin.......................................................133.5 Collective (Temporary) Protection..............................................................................................................133.6 Placement strategies....................................................................................................................................14
4 LABOUR MIGRATION............................................................................................................................................154.1 Recruitment of Foreign Labour....................................................................................................................154.2 Seasonal Labour Migration.........................................................................................................................15Diagram 5. Number of seasonal work permits issued 1993-2000.....................................................................164.3 Total Labour Immigration............................................................................................................................164.4 Regulations...................................................................................................................................................17
5 ILLEGAL OR IRREGULAR IMMIGRATION...............................................................................................................185.1 Legislation....................................................................................................................................................185.2 Investigations...............................................................................................................................................18
6 FOREIGN POPULATION STOCKS............................................................................................................................196.1 The Stock of Foreign Nationals....................................................................................................................19Table 5. Number of foreign citizens by citizenship in Norway 1999-2001........................................................206.2 The Stock of Immigrants...............................................................................................................................20Table 6. Number of foreign born residents by continent of birth, 1999 - 2001.................................................20Table 7. Number of immigrants by regions of origin, January 1999 - 2001.....................................................21
7 NATURALISATIONS...............................................................................................................................................217.1 Naturalisations.............................................................................................................................................21Diagram 6. Number of naturalised Norwegians by country of previous nationality.........................................237.2 The Norwegian Nationality Act....................................................................................................................23
8 THE INTEGRATION OF IMMIGRANTS.....................................................................................................................248.1 General Policy..............................................................................................................................................248.2 Schooling of Immigrant Children.................................................................................................................24Diagram 7. Minority language pupils in Norwegian schools 1987-2000..........................................................258.3 Adult Education............................................................................................................................................25
9 IMMIGRANTS IN THE LABOUR MARKET...............................................................................................................269.1 Employment of Immigrants..........................................................................................................................26Table 8. Total unemployment rate, and unemployment rate for immigrants. Period from November 1988 to November 2000. Per cent of the workforce........................................................................................................26Table 9. Unemployment rate by continent of origin from May 1996 to May 2001 (per cent of the workforce)27Table 10. Employment rate. 4th quarter 1990-2000. Total population aged 16-74 and first generation immigrants. Per cent of the population..............................................................................................................279.2 Labour Market Measures for Immigrants....................................................................................................28Table 11. Participation in labour market courses in per cent by continent of origin. Per cent of the population............................................................................................................................................................................28
10 PARTICIPATION IN LOCAL ELECTIONS................................................................................................................3011 RACISM AND RACIAL DISCRIMINATION.............................................................................................................30
11.1 General overview.......................................................................................................................................30
2

11.2 New Reports...............................................................................................................................................3111.3 Act Prohibiting Ethnic Discrimination......................................................................................................3111.4 The Centre for Combating Ethnic Discrimination.....................................................................................3110.5 National minorities/The Sami people.........................................................................................................32
12 STATISTICAL ANNEX...........................................................................................................................................33Table 12. Demographic growth, economic growth and migration in 2000. NORWAY. (Annual change in per cent)....................................................................................................................................................................33Table 13. Average annual gross inflows and gross outflows of legal migrants. 1971-2000.............................33Table 14 male. Gross inflows to Norway by previous residence. Male. 2000...................................................34Table 14 female. Gross inflows to Norway by previous residence. Female. 2000............................................35Table 15 male. Gross outflows from Norway by country of destination. Male. 2000........................................36Table 15 female. Gross outflows from Norway by country of destination. Female. 2000................................37Table 16 male. Net migration for Norway by country. Male. 2000...................................................................38Table 16 female. Net migration for Norway by country. Female. 2000............................................................39Table 17. Inflow of foreign population 1). 1986-2000.......................................................................................40Table 18. Outflow of foreign population 1). 1986-2000....................................................................................42Table 19. Net inflow of foreign population 1). 1986-2000.................................................................................44Table 20. Asylum seekers and refugees in Norway............................................................................................46Table 21. Number of asylum seekers by country of origin. 1988-2000.............................................................47Table 22. Total number of immigrations and emigrations by citizenship. 1978-2000......................................48Table 23. Population by country of birth. 1970, 1980, 1990, 1994, 1995, 1996, 1997, 1998, 1999, 2000 and 2001....................................................................................................................................................................49Table 24. Foreign citizens by citizenship per 1 January. 1988-2001................................................................51Table 25. Naturalisations by previous citizenship. 1986-2000..........................................................................52Table 26a. Existing marriages 1) by country of birth of the partners. 1 January 2001....................................53Table 26b. Marriages contracted in 2000 by citizenship of bride and bridegroom..........................................53Table 26c. Divorces 2000 by citizenship............................................................................................................54Table 27. Children born 1987-1989, 1996-2000 by country of birth of the parents 1).....................................55Table 28a. Total fertility rate 1) (TFR) by age 2) and country of background 3).............................................56Table 28b. Fertility among women of age 35-44, by country of background. 1 January 1996, 1999 and 2000.............................................................................................................................................................................57Table 29. Total number of pupils and minority language pupils in primary and lower secondary schools. 1990-2000...........................................................................................................................................................58Table 30. Persons born in Norway, emigrated 1975-2000, and not returned by 1 January 2001....................59Table 31. Employees of age 16-74 by region of birth and age..........................................................................60Table 32. Employees of age 16-74 by region of birth, number of years of residence in Norway, sex and age. Per cent of total number of persons aged 16-74 in each group. 4th quarter 2000............................................61Table 33. Unemployment rate (persons 16-74 years of age) by region of birth, and number of years of residence in Norway. Per cent of total number of persons aged 16-74 in each group.....................................62Table 34. Naturalisation 2000, as per cent of number of persons having stayed in Norway longer than seven years. Selected nationalities...............................................................................................................................64Table 35. Persons with foreign background. 1 January 2001...........................................................................65
3

1 General overview
The growth in the Norwegian economy was moderate in 2000, higher than in 1999, but lower than the average of the growth period between 1993 and 1998. The real GDP, which includes the petroleum production, grew by 2.3 per cent, cf. table 9. The growth rate in 2001 is projected to be roughly the same. The Norwegian economy is highly dependent on trends in international trade and finance, especially in petroleum markets.
Despite the moderate growth rate, capacity utilisation in the Norwegian economy is still high, leading, inter alia, to a shortage of labour in some sectors of the economy. In particular, labour shortage continued to be a feature of the health sector, construction and some industrial branches. The labour force participation rate in Norway, 61.1 per cent in the age group 16-74, is among the highest in the OECD area. Especially the labour force participation rate among women and elderly is high in Norway compared to other countries. Ten years earlier the rate was 54.8 per cent. In the meantime 250,000 jobs were created. Although clearly limited, there may still be a domestic potential for an increased labour force. Immigrants from non-OECD countries constitute such a potential. The labour force participation rate among first generation immigrants is 50.9 per cent, considerably lower than in the population at large.
The decline in unemployment, uninterrupted since 1993, came to a halt in 1999/2000. From May 2000 to May 2001 the unemployment rate declined again. For the total population the rate went down from 2.6 to 2.3 per cent (of the work force). Unemployment among immigrants was considerably higher, but has also been declining: down from 7.3 per cent in May 2000 to 6.6 in May 2001. Immigrants from developing countries have a considerably higher rate of unemployment than other immigrant.
The immigration to Norway was considerably lower in 2000 than in 1999. The total inflow of foreign nationals was reduced from 32,230 to 27,785. Still, 2000 saw one of the highest levels of immigration on record. The reduction is mainly due to reduced labour immigration from neighbouring Sweden and reduced arrivals of asylum seekers from Iraq and Kosovo. It was generally held that the actual immigration did not fully match the need for foreign labour, and that rules and procedures should be relaxed to accommodate the needs of various services and businesses.
The economic policy of the government aims at maintaining stable economic growth, avoiding cyclical fluctuations. The important petroleum revenues do fluctuate. In years of high petroleum revenues, such as in 2000, a large share of these revenues is transferred to the Government Petroleum Fund and invested abroad. Most of Norwegian economic policy debates focus on how much petroleum revenue to inject into the state budget
The labour market policy aims at reducing the level of unemployment by means of various labour market measures. These are designed to enhance the skills of the unemployed, maintaining their links to the labour market and combating exclusion and passivity. In the current situation, with labour shortages in many sectors of the economy, employment policy will be oriented with a view to ensuring the supply of suitably skilled labour by keeping unemployment low and counteracting the tendency of people leaving the labour force before the official retirement age. The Public Employment Service has also been very active in providing assistance to employers who want to recruit staff members from other European countries. Assistance has been provided particularly with regard to recruiting medical doctors, dentists, nurses and engineers.
4

In March 2000, a Centre minority coalition government was replaced by a minority Labour government. Following a general election in the autumn of 2001, the Labour government was again replaced by a coalition Centre/Right government. Although the Labour government made proposals for a relaxed regulation of labour based immigration, it was criticized by the incoming coalition partners for not doing enough. The will to actually go further may be tempered by recent predictions of reduced economic growth in the aftermath of the terrorist attacks on USA.
2 Migration Flows
2.1 Migration Flows
In 2000 the inflow to Norway continued at a historically high level, albeit markedly down from the overall peak year of 1999 cf. tables 14-19. 27,785 foreign nationals were registered as immigrants in the Central Population Register that year, which means that so many foreign nationals came to Norway in 2000 with the intension of staying for more than 6 months. Visitors are not registered. Asylum seekers may be registered if the processing time of their applications is prolonged. Asylum seekers who are returned within a few months are normally not registered. The would-be immigrants come to an increasing degree from developing countries. The immigration from industrialized countries, to which the countries of Central and Eastern Europe are counted, went down from 22,299 to 15,152. The number of refugees from Yugoslavia (Kosovo) accounts for most of this reduction. The immigration from developing countries, on the other hand, increased significantly, from 9,843 to 12,589. Never before have so many immigrants arrived from developing countries.
Two nationalities stand out; Iraqis and Somalis. Both have almost entirely arrived either as spontaneous asylum seekers or as resettled refugees. The Iraqis accounted for 4,486, more than the double of 1999 and the quadruple of 1998. The Somalis accounted for 1,541, around 40 per cent more than the year before. Most of the Iraqi and Somali asylum seekers have been given leave to remain in Norway, although many Iraqis only on a temporary basis and with limited rights.
In the Nordic region, the inflow of Swedes has dominated the picture since the mid 1990s. Many young Swedes have been attracted by better employment opportunities in, in particular, the health sector and restaurants and hotels in Norway. The improvement in the Swedish economy over the last years may, however, explain that we have seen a marked decrease both in 1999 and in 2000. The inflow of Danes and Finns has not fluctuated as much.
In 2000 Norwegian nationals abroad returned to Norway to a lesser extent than they have in any year in the 1990s, but not to a drastically lesser extent. Whereas 9,594 Norwegians on average returned home from a sojourn abroad in the 1990s, 8,757 returned in 2000.
The total inflow to Norway in 2000 then stands at 36,542 persons.
In this year’s report the inflow has been broken down to genders. Of the total number of 36,542 persons who moved to Norway in 2000 17,402 were female and 19,140 were male. For most nationalities the immigrants were relatively evenly divided between the genders. For one group,
5

however, males heavily outweigh the females. That is the Iraqis. Whereas only 921 Iraqi women immigrated to Norway in 2000, as many as 3,461 Iraqi men did the same. That accounts for more than the total male dominance. Most of the Iraqis were ethnic Kurds from the autonomous North. The strategy of this group of Iraqi men, who sought asylum in Norway, has clearly been to reunite with wives and children at a later stage. In early 2001, however, the Government decided not to confer a right to family reunification to this group, thereby upholding the gender imbalance.
2000 saw a total outflow of 26,854 persons; 14,931 foreign nationals and 11,923 Norwegians. The largest country of destination was clearly Sweden. As many as 6,593 crossed the border to this country. Most were Swedish nationals who had been employed in Norway, but also Norwegian nationals. Besides Sweden the majority of emigrants went to other EU countries. 62 per cent of everyone who moved from Norway in 2000 went to an EU country.
The net immigration of foreign nationals in 2000 was 12,854 persons, almost 7,000 less than the year before. Still, the net immigration of foreign nationals was around 20 per cent higher than the average level for the 1990s. Net immigration is particularly noticeable in relation to refugee producing countries as Iraq (4,438 persons), Somalia (1,436) and Iran (519). In relation to an earlier refugee producing country, Yugoslavia, a net emigration was recorded in 2000. That was due to a considerable repatriation of Kosovars who had enjoyed temporary protection since the war in 1999.
Between Norway and the other Nordic countries the tendency is for outflows to overtake inflows. A net outflow of Swedish nationals was reinforced by a net emigration of Norwegians to Sweden. The total net outflow of persons from Norway to Sweden was 1,534. In the latter half of the 1990s there was a considerable net inflow to Norway, due to relatively better job opportunities there. As job opportunities have become more even, the flow of persons go equally both ways. Migration in the Nordic area has traditionally been labour market sensitive, and it continues to be so. Nordic and European workforce tend to be temporary, however. To the extent that Norway needs a more lasting immigrant workforce, it is widely held that one has to recruit workers from farther a field.
Demographic projections for Norway indicate a slowed down population growth and a more unfortunate balance between the elderly and inactive part of the population and the younger and active. These projections have been based on varying immigration scenarios, all significantly lower than the immigration level of the last couple of years. Whether this reduces the fear of a diminished and ageing population, remains to be seen.
In sum, we may say that the inflow to Norway continues at a high level. One factor, in particular the arrival of asylum seekers from countries like Iraq and Somalia, contributed to that. Two factors contributed to a slowdown, the repatriation of Kosovar refugees and the two-ways’ labour migration within the Nordic area.
2.2 General Regulations
The Immigration Act of 24 June 1988 regulates the entry of foreign nationals into Norway and their rights to residence and work. In simplified terms, four categories are admitted: workers who have been offered an employment, refugees and other humanitarian cases, family relations and students. As a general rule, students are only granted temporary residence. The other
6
categories may, dependent on the conditions, be granted either permanent or temporary residence.
Two kinds of permits may be issued: residence permits or work permits. Residence permits only confer the right of residence. The holder may not take up gainful employment. Work permits confer both the right to reside and to take up gainful employment. Thus, foreign nationals who have a work permit do not need, and are not granted, a residence permit. A third kind of permit, the settlement permit, confers permanent rights, and are normally issued three years upon the first issue of a residence or a work permit, provided the conditions are met.
General immigration regulatory conditions apply for the first issue of work permits. First, there must be a concrete offer of employment. Second, pay and working conditions must not be less favourable than those provided by relevant industrial agreements. Third, as a general rule the employment offered must be of full time.
Work permits are mostly granted to skilled workers or persons with special qualifications. The level of skills required has recently been lowered. It is a condition that their competence is deemed absolutely necessary for the activity, though, and that the vacancy cannot be filled with domestic labour.
In addition to foreign nationals meeting the general immigration regulatory conditions for a work permit, residence and work permits are mainly granted to persons in need of international protection, to members of the family of Norwegians or legal immigrants and to students.
EU rules regarding free movement of persons apply to nationals of a state party to the Agreement on the European Economic Area (EEA). For these nationals work permits are not required.
A number of legal amendments regarding labour immigration have been enacted or have been proposed; cf. chapter 4.4. In addition, the government has set down a legal committee which is to present a proposal for a new Immigration Act by the end of 2003.
2.3 The Schengen and Dublin Co-operation
Norway implemented the Schengen-agreement by 25 March 2001 and the rules of the Dublin-convention by 1 April 2001.
The Schengen agreement facilitates free movement of persons by abolishing checks at the common borders of the Schengen-states. As a consequence, the control of persons arriving from non-Schengen countries has been strengthened. The abolishment of checks at internal borders has been compensated by a common visa practice, common standards for external border controls and common measures against trafficking in human beings.
The Dublin-convention determines which state should be responsible for examining applications for asylum lodged in one of the states party to the Convention.
3 Refugees and Asylum Seekers
7

3.1 Arrival of Asylum Seekers
The Directorate of Immigration processes asylum applications in pursuance of the Immigration Act of 1988. A refugee has on application a right to asylum. A refugee within the meaning of the act is a foreign national who falls under Article 1A of the 1951 UN Refugee Convention relating to the Status of Refugees. An asylum seeker who is deemed not to meet the criteria for refugee status may be granted subsidiary protection in the form of residence permit on humanitarian ground.
Despite the fact that the Norwegian government in January 1998 introduced more liberal guidelines to recognise asylum seekers as Convention refugees, relatively few asylum seekers are granted refugee status. However, nearly half have over the last years been given leave to remain on humanitarian grounds.
1999 and 2000 have seen a considerable increase in the number of asylum-seekers in Norway. At the same time major administrative changes of the asylum process have taken place.1 July 2000 the Directorate of Immigration was given the responsibility to conduct interviews with asylum-seekers, hitherto conducted by the police. From 1 January 2001 appeals are to be referred to the Immigration Appeals Board, not to the Ministry of Justice as before. The increase in numbers and the administrative changes have together caused considerable backlogs in the asylum system. The processing times have been declared unacceptable by the government, and additional administrative resources have been mobilised.
Asylum seekers and refugees constitute a major immigrant category. Over the years, variations in the number of arrived asylum seekers have probably accounted for more of the fluctuations in net migration than variations in job opportunities.
The total number of asylum seekers in 2000 was 10,842, around 700 more than the year before. Historically, this is the second highest number ever, cf. diagram 1. The number is somewhat deceptive, however, as it includes Kosovars who, after the lifting of temporary protection, lodged individual applications for asylum. They numbered around 3,000. Thus, only around 7,800 of the asylum seekers actually arrived in 2000.
The asylum seekers come from a variety of countries. South East and East Europeans dominate the picture, around 70 per cent. The Kosovars clearly constitute the largest group. 4,203 applications were lodged totally, of whom 1,177 were newly arrived. Apart from the Kosovars, the largest groups were Rumanians (712 persons), Slovakians (507), Russians (471) and Bosnians (272). Of non-European nationalities Somalis (910 persons), Iraqis (766) and Iranians (327) were the largest.
After a slow start in 2001, the arrivals of new asylum seekers increased considerably in the late spring. By 8 November 2001 11,726 had arrived. This year will then probably see the highest number of asylum seekers ever recorded. Also this year South East and East European asylum seekers are dominating. 24 per cent come from an ex-Soviet republic.
8

Diagram 1. Asylum seekers to Norway 1990-2000
Table 1. Asylum seekers to Norway 1998 - 30 Sept 2001, by nationality
Country of origin 1998 1999 2000 30.09.01Croatia 2,452 60 16 937Bulgaria - - 12 889Russia 141 318 471 884Somalia 955 1,340 910 740Iraq 1,317 4,073 766 714Bosnia-Herzegovina 236 161 272 703Yugoslavia 1,666 1,152 4,188 546Afghanistan 45 172 326 431Iran 270 350 327 238Rumania 77 153 712 162
For both Croatia, Bulgaria and Russia there are clear indications that the bulk of the asylum seekers have been lured by travel agencies specialising in “asylum tours”. Such agencies have “informed” that asylum seekers receive generous benefits, that it is easy to get well-paid jobs and that long processing times guarantee at least a year’s lawful residence.
The applications of Bulgarians and Croatians have, however, been processed in an accelerated procedure. Most applications have been rejected, and more accurate information about the prospects for a successful asylum application has been inserted in local media.
Almost all the Bulgarian asylum seekers came in chartered buses in the course of some few weeks in the end of June and the beginning of July. Their applications were deemed to be unfounded, and by the end of September all of them had been returned. The authorities thereby sent the signal, in particular to the people of Central and East Europe, that although Norway
9

may need foreign labour and although labour immigration may be relaxed, the asylum route is not the way to go for job seekers.
As noted above, the number of asylum seekers granted status as Convention Refugees is rather low. In 1996 and 1997, 6 and 18 asylum seekers respectively were granted Convention status. In the beginning of 1998 new determination criteria were introduced, As a consequence, persecution by non-state agents may now give rise to refugee status. It has also been recognised that gender or sexually based discrimination or inhuman treatment may amount to persecution, and hence provide basis for refugee status. In 1998 and 1999 respectively, 79 and 181 asylum seekers were granted Convention status. In 2000 this number was reduced to 101. The Directorate of Immigration partly explains this reduction by the fact that many of the asylum seekers of 2000 came from countries where there is generally not much persecution, which could give grounds for Convention status.
Table 2. Asylum seekers granted convention refugee status in 1. instance (Directorate of Immigration) and 2. instance (Ministry of Justice)
1991 1992 1993 1994 1995 1996 1997 1998 1999 2000
1. instance 101 63 5 22 29 6 14 66 181 97
2. instance 22 78 0 0 0 0 4 13 0 4
Total 123 141 54 22 29 6 18 79 181 101
This acceptance rate does not give a good picture of the number of asylum seekers who are given protection and leave to remain in Norway. In 2000 3,199 asylum seekers were granted humanitarian status, up from 1,813 of 1998 and 3,032 in 1999 (cf. table 3). 4,899 applications were rejected in the first instance. Thus, around 42 per cent of the applications were granted protection in Norway, in one way or another. That is slightly less than in the last couple of years, when nearly 50 per cent of the asylum seekers were given protection.
Table 3. Asylum seekers granted humanitarian status in 1. and 2. instance
1991 1992 1993 1994 1995 1996 1997 1998 1999 2000
1. instance 1,654 1,044 471 1,353 913 610 550 1,564 2,609 2,856
2. instance 223 450 286 4,313 1,016 255 176 249 423 343
Total 1,877 1,494 757 5,667 1,929 865 726 1,813 3,032 3,199
Asylum seekers may on certain conditions be granted temporary work permits until the application for asylum has been finally decided. Unless there is doubt about the identity of the asylum seeker, or the asylum seeker is to be returned to a safe third country, (s)he has the right to a temporary work permit as soon as the interview of the applicant is finished.
10

3.2 Resettlement of Refugees
In addition to asylum seekers, Norway receives a given number of refugees each year under an annual resettlement quota. Effective from 1 January 1998, the quota is set at 1,500 persons. A three-year perspective is applied, which means that the actual number of refugees resettled in Norway may vary from year to year within this period. Unused quota places may be carried over to following years. In addition, should UNHCR make an appeal for international burden-sharing in a specific large-scale refugee situation, the quota may be expanded.
2000 was the last year in a three-year period started in 1998. In 1998 1,124 refugees were accepted for resettlement, whereas only 834 arrived due to delayed travel arrangements. Most of them arrived in 1999. In 1999, 1,480 new refugees were accepted, and 1,635 arrived. The number of both accepted and arrived refugees under the quota is expected to be lower in 2000.
Diagram 2. Number of resettled refugees 1995-2000
Priority has been given to a selection of refugees from the Middle East. The largest single group has been Iranian and Afghan refugees, followed by Iraqis. In the last couple of years quotas have also been set for African refugees and refugees from the former Yugoslavia.
Table 4. Resettled refugees in 2000, by country of origin
Country of origin Number of refugeesAfghanistan 452Iran 412Ethiopia 203Croatia 115Iraq 94
The 2001 resettlement quota has been allocated to Afghan refugees from Iran or Pakistan (300), Iranian and Iraqi refugees from Turkey (300 and 100, respectively), 250 Africans, 150 refugees from the former Yugoslavia and 100 refugees from East Asia). The other places have not been pre-allocated to particular refugee groups.
11

3.3 Family Reunification for Refugees
Both persons with convention refugee status and persons with humanitarian status have the right to family reunification. For the latter group, which is the larger, this right has, pending permanent residence permit, been dependent upon sufficient subsistence ability. 15 June 1997 this rule was amended, giving the two groups equal rights to family reunification.
The number of family members given right to reside with refugees in Norway were relatively high by the end of the 1980s and the beginning of the 1990s; a good 1,000 annually. Following lower refugee arrival numbers in the mid 1990s, family reunifications to refugees went down. Now, the numbers are rising again. In 2000 1,778 persons were reunited with refugees in Norway, up from 1,542 persons in 1999 and 915 persons in 1998.
3.4 Repatriation of Refugees
Traditionally, few foreign nationals who have sought refuge in Norway return to their home country. Statistics Norway has traced those who got convention refugee or humanitarian status from 1986 to 1990. In 1996 77 per cent still resided in Norway. This contrasts with other immigrants. Of all other immigrants (without refugee background) who arrived in Norway in the same period, only 38 per cent still resided in Norway in 1996.
In line with the recommendations of UN High Commissioner for Refugees, voluntary repatriation is seen as the best durable solution to a refugee problem. Based on the assumption that refugees need assistance to return home, a government programme for voluntary repatriation for refugees was established in 1992. The programme is composed of two main elements: individual benefits and support for return motivating projects. The individual pre-departure assistance is set at NOK 15,000 plus travel expenses. In addition, financial support is given to projects run by municipalities, NGOs and private persons to “keep the dream of the home country alive”. Some projects are aiming at improving the information about conditions in the home country, others at training refugees for the needs of reconstruction, others again are aiming at reconciliation and tolerant minds.
The number of refugees repatriating from Norway reached an all time high in 1999, when 3,846 refugees benefited from the repatriation cash benefit. Most of them, 3,630, were Kosovar refugees who returned soon after the Serb military forces had been driven out of the province. In 2000 the number was more than halved. The total number was 1,634, of which 1,491 were Kosovars and 117 Bosnians.
In 2000, as well as in previous years, refugees from Asia and Africa are virtually absent among the voluntary returnees. So far, refugees from these continents have not been targeted by any information activities relating to repatriation.
12

Diagram 3. Repatriation by nationality, 2000
Diagram 4. Number of repatriated refugees 1994-98 by country of origin
3.5 Collective (Temporary) Protection
Collective Protection has been designed after consultations with the UNHCR. It is to be applied in large-scale refugee flow situations and implies that temporary work or residence permits may be granted collectively. The processing of individual applications for asylum will be suspended for up to three years from the point in time when a temporary work or residence permit is granted.
Collective protection has been applied to two refugee crises: To the Bosnian crises (1993-98) and the Kosovo crisis (1999). Although similarities can be pointed out, these two situations differed considerably.
13

Around 13,000 Bosnians were granted collective protection between 1993 and 1998. The arrangement was not lifted until 31 December 1998. As early as 7 November 1996, however, the government decided that Bosnians enjoying collective protection in Norway on that day would not be required to return to their home country. Instead, after four years of residence in Norway, they would all get a permanent residence or work permit, no matter how conditions develop in Bosnia and Herzegovina. The reason given was that the peace process had taken longer than anticipated and that the situation and status of Bosnian refugees were less predictable than tolerable.
Under the Kosovo crisis in 1999, collective protection was introduced for a second time. It covered 6,000 Kosovar refugees who were received under the Humanitarian Evacuation Programme from FYR of Macedonia, as well as individual asylum seekers. Close to 8,000 refugees from Kosovo were granted collective protection for one year. The regime was lifted in August, only four months after it was introduced. The lifting did not imply a revocation of permits already issued, only that they were not renewed on collective grounds when they elapsed twelve months on. The Kosovars who had enjoyed collective protection could benefit from a repatriation cash benefit of 15,000 NOK a person if they volunteered to return home. On the other hand, they were entitled to apply for asylum on an individual basis.
More Kosovar refugees have repatriated than Bosnian. By the end of September 2001 more than 4,700 out of 8,000 Kosovars had returned voluntarily. In addition, 580 have been deported, which brings the total returnee number to around 5,300. On the other hand, only 1,800 Bosnians out of 13,000 have done the same since the Dayton peace accord. The difference appears to have two main explanations. First, peace came much quicker in Kosovo. They were less integrated into the Norwegian society than the Bosnians were when conditions for safe return were established. Second, the Kosovars could return to an area where they constitute an ethnic majority. That was not the case for many Bosnians.
3.6 Placement strategies
Foreign nationals with refugee or humanitarian status enjoy full freedom of movement. They may in principle choose to settle wherever they want. But in reality, most refugees are dependent on public assistance to find a suitable dwelling. Refugees etc. who cannot provide housing for themselves and are dependent on social welfare, have to settle in the municipality where they are placed. The Norwegian municipalities are sovereign when it comes to deciding how many refugees to accept. They are compensated financially for extra expenses they may have by the central government. The last years the municipalities have in combination not offered a sufficient number of places. As a consequence, asylum seekers who have been granted refugee or humanitarian status have to remain in reception centers for a considerable length of time before they are offered housing in a municipality. Furthermore, refugees accepted for resettlement have to wait for many months in their country of first asylum before they are allowed to enter Norway.
A new procedure for placement of refugees has been agreed between the government and the municipalities. It will enter into force in January 2002. As opposed to the present situation, where each municipality makes independent decisions as to the acceptance of refugees, the new procedure will entail an allocation of quotas of refugees to each county. Within each county then, the municipalities have to agree on how to distribute the refugees among themselves. It is
14

hoped by both parties that this new procedure will mean that refugees don’t have to wait as long in the reception centers and in their countries of first asylum as the case has been lately.
4 Labour Migration
4.1 Recruitment of Foreign Labour
The expansion of the Norwegian economy over the last years has induced an increased demand for labour. Most of this demand has been met by domestic labour force. The labour force expanded by 9 per cent between 1993 and 1998, and the employment rate is now very high. By 1 January 2001 the unemployment rate was 2.7 per cent, which is a slightly higher rate than the previous two years. It is improbable that new segments of the population may be mobilised for the labour force. A reservation should be made for the immigrant population, however, which has a considerably lower employment rate than the rest of the population, cf. chapter 9. In 2000 61.1 per cent of the total Norwegian population between 16 and 74 years of age were gainfully employed. Furthermore, over the last couple of years a considerable number of vacancies have been more difficult to fill. That has especially been the case in the health sector and in construction.
There is a growing concern for the long-term balance of the labour market. The long-term trends seem to be a reduced growth of the labour force, a growth in the number of old age pensioners and elderly in need of (public) care. Other social benefits may also reduce the work force. Predictions made by Statistics Norway show that an annual net immigration of 8,000 persons, which may be said to be a “normal” level for most of the 1990s, is not sufficient to avoid labour shortages in the long run.
The Public Employment Service (Aetat) in Norway has been very active in providing assistance to employers who want to recruit staff members from other European countries. Assistance has been provided particularly with regard to recruiting medical doctors, dentists, nurses and engineers. Training programmes in the Norwegian language and society have been carried out in the home countries of persons interested in working in Norway.
Since 1997 more than 350 medical doctors have been recruited through the Employment Service health recruitment project. The majority of these doctors come from Germany. In 2000 90 medical doctors were recruited from the EEA area. Of the 264 nurses recruited, the majority came from Finland and Germany, and the 23 dentists who took on work in Norway in 2000, were all German. In recruiting manpower from abroad Aetat works in close co-operation with sister organisations in other Nordic countries, Germany, France and Austria. The efforts to recruit health personnel have increased in 2000, and in addition to the countries already mentioned, Ateat now also co-operates with Polish, Italian and Philippine sister organisations on recruitment of nurses to Norway. Poland and the Philippines are the first countries outside the EU that Aetat has signed a contract with.
4.2 Seasonal Labour Migration
EEA nationals may take up work in Norway for up to three months without any permits. Non-EEA nationals do in general need a work permit. In pursuance of section 5, second paragraph (a)
15

of the Immigration Regulations short-term work permits for up to 3 months are issued. Under the former regulations these permits were only valid from 15 May to 31 October. The government has now changed this, making it possible to receive work permits for seasonal work all year round.
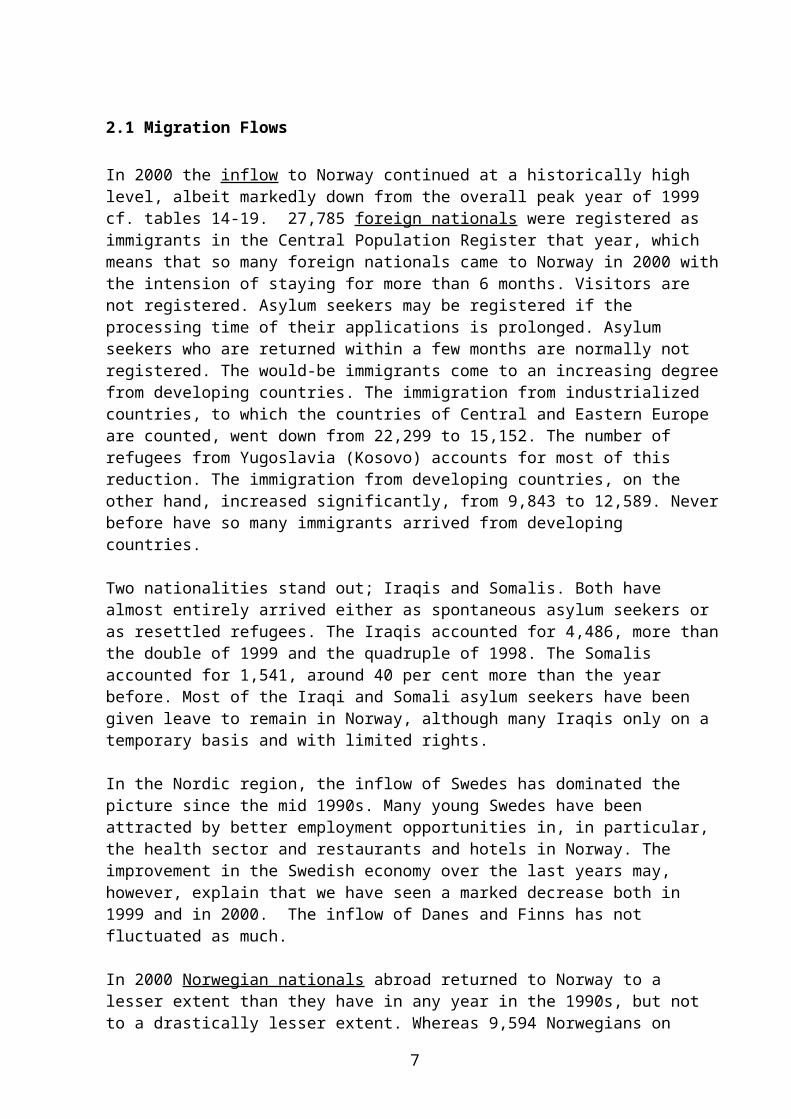
Within an annual quota seasonal permits can be granted through a simplified and accelerated procedure. The size of this quota is based on reported needs in the agricultural sector. In addition seasonal permits may be granted through a regular decision making procedure. For 1999 the number of seasonal permits granted amounted to 8,188, and in 2000 the number increased by 1,706 to 9,894. More than 95 per cent of the seasonal workers come from Central and Eastern Europe, among whom nationals of Poland constitute the dominant group.
Norway has no bilateral agreements on short-term migration for employment.
Diagram 5. Number of seasonal work permits issued 1993-2000
4.3 Total Labour Immigration
It is difficult to obtain an accurate picture of labour-based immigration to Norway. Some foreign nationals do not need a permit to work in Norway (Nordic nationals). Hence, they may not be registered. Others do not need a work permit, only a residence permit (EEA nationals). For other foreign nationals work permits are issued irrespective of their motivation for migrating to Norway.
In 1999 4,854 EEA residence permits were issued. This number includes workers, and also students and family members who do not intend to take up employment. However, statistics show that about 3,275 of these could be labelled labour immigrants. In 2000 the number of EEA residence permits decreased to 2,619. This is due mainly to changes in the presentation of statistics, since residence permits for students and family members now are shown as separate categories. The 2,619 residence permits are therefore likely to involve mostly workers.
16

For non-EEA nationals 19,290 work permits were issued in 1999, renewals disregarded. Not all of those were seeking employment in Norway. Some were granted the permit after having lodged an application for asylum, others after having lodged an application for family reunification. Furthermore, 8,552 of the permits were not renewable. The majority of people who were granted a work permit in Norway in 2000 were non-EEA nationals who were granted a seasonal permit. In addition 305 specialist permits were issued. Only employees from countries outside the EEA area need this kind of permit. All in all, 18,075 non-EEA nationals were granted a work permit. This number includes 305 specialists and 9,894 seasonal permits, but does not include renewals.
Whatever motivated their migration to Norway, however, 2,619 EEA nationals and 17,770 non-EEA nationals, 20,389 persons all together, were included in the Norwegian labour market in 2000.
4.4 Regulations
Up until the beginning of the 1970s Norway had a liberal practice of granting work permits. From this time onwards the liberal labour immigration practice was gradually changed. In order to keep immigration to Norway limited and controlled a so-called immigration ban was introduced l February 1975. The immigration ban was first of all meant to restrict unskilled labour immigration. In effect unskilled labour immigration was curbed after the introduction of the ban. The restrictions, with exemptions, are now included in the Immigration Act of 1988 and the regulations issued in pursuance of it. The Act came into force 1 January 1991.
For the first issue of a work permit there must be a concrete offer of employment (on a prescribed form) from an employer, or a standardised contract of service signed by the applicant and the employer must be presented. An employer with a place of business in the realm is responsible to the immigration authorities pursuant to the Act and its Regulations (section 2). If an employer has no place of business in the realm, an agent with a place of business in the realm must guarantee the offer of the employee and be responsible to the immigration authorities.
An amendment to the Immigration Regulations was enacted 15 June 1997 with the effect that more liberal practice may be applied for certain regions outside the EEA area. For the time being this provision applies to Russians seeking to take up employment in the fishing industry in Northern Norway.
According to the Regulations of the Immigration Act (section 3) it is a condition for obtaining a work permit that the applicant is a higher-level skilled worker or has special qualifications. It is a condition that this competence is deemed absolutely necessary for the activity and that the post cannot be filled with resident labour. 1 May 2000 a change in the regulation concerning higher-level skill requirement came into force. The requirement was changed from “higher-level skills” to only “skills”. This will make it easier to get a work permit in Norway, but it is still to early to tell what this change has meant for the number of work permits applied for and granted.
With effect from 5 October 2001 the requirement that students from outside the EEA must reside outside the realm for five years after completion of their studies in Norway before they could obtain a residence and work permit in this country, was abolished.
17

Due to recent amendments in the Immigration Act, visas may be issued to persons who are skilled workers or have special qualifications who are looking for a job opportunity in Norway. They will also be able to apply for a work permit from the realm within this period.
There are also considered to assess annual quotas for work permits to specialists in order to facilitate the procedures.
Furthermore there are considered more liberal procedures for issuance of work permits. Firstly the police may issue temporary work permits that may permit a foreign national to work whilst the application for permanent work permit is handled. Secondly a number of diplomatic or consular missions may issue work permits when the requirements for such permits are clearly fulfilled.
A revision of the EFTA-Convention grants Swiss nationals the same rights to labour and residence in Norway as EEA-citizens.
Finally, due to an agreement on working holiday visa between Norway and Australia, Australian youth are after 1 August 2001, given the right to reside and work in Norway for up to one year.
5 Illegal or Irregular Immigration
5.1 Legislation
In order to combat illegal immigration effectively, some amendments to the Immigration Act were made effective from 10 January 1997. The maximum penalty for a person who for the purpose of gain conducts organised activity to assist foreign nationals to enter the realm illegally has been raised from 2 to 5 years of imprisonment. Furthermore, it is considered a criminal act to abandon to any other person any passport or travel document, when the person concerned knows or ought to understand that it may be used by any foreign national to enter Norway or any other state. The maximum penalty is two years of imprisonment.
In Norway, there are no special programmes for regularisation of status for illegal migrants. However, foreign nationals who are personally not to blame for the fact that an expulsion order cannot be implemented, have the opportunity to apply for a temporary work permit when they have been resident in Norway for six months after the time at which the application was rejected. The permit expires as soon as it is possible to return the foreign national to his/her country of origin.
5.2 Investigations
Illegal immigration certainly takes place to Norway. The full extent is by nature elusive. In a highly regulated society like the Norwegian, it is assumed that this phenomenon is less widespread in Norway than in most other countries.
18

In 1993 a central illegal immigration intelligence unit was established within the National Bureau of Crime Intelligence Service (NBCI). The unit collects, systematises and processes information regarding illegal immigration, fraudulent documents and trafficking in human beings. It also provides assistance to other police units working with such cases.
The central illegal immigration unit at the NBCI deals with several larger investigation projects on particular routes of trafficking or particular nationalities involved. These projects are often carried out in close co-operation with police authorities in other countries.
In 2000 the Central Illegal Immigration Unit investigated 15 cases of possible trafficking and smuggling in human beings. Several of them resulted in arrests being made, e.g. of persons involved in trafficking of Iraqis from or through Germany to Norway. That again resulted in reduced inflow of Iraqis to Norway.
In 2000 a random check of 790 visa holders was carried out. 341, or around 40 per cent, were not registered as departed at the expiry of the visa. Most of them are expected to have departed to other Schengen countries. A substantial number may have stayed illegally in Norway for some time. Totally, around 100,000 visitor’s visa are issued annually.
6 Foreign Population Stocks
6.1 The Stock of Foreign Nationals
The total population of Norway grew by 24,939 persons throughout 2000, which gives a growth rate of 0.6 per cent. This compares to a growth of 33,168 persons, or 0.7 per cent in 1999. The total population by 1 January 2001 is 4,503 million, cf. table 12.
After a standstill for 3-4 years there was a marked increase (4.5 per cent) in the stock of foreign nationals residing in Norway throughout 1999. The decrease of the mid-1990s, however, is not to be interpreted as a decline in the number of immigrants in Norway. Whereas naturalisations equalled or surpassed net immigration some years in the mid-1990s, 1999 saw a combination of a strong increase in net immigration of foreign nationals and a decrease in the number of naturalisations, cf. table 25. There was still a growth in the number of foreign nationals in 2000, but at a much lower rate than during the previous two years, both due to reduced net immigration and increased naturalisation.
By 1 January 2001 the total number of foreign nationals was 184,337, up 5,651, or 3.2 per cent from the year before, cf. table 24. This figure constitutes 4.1 per cent of the total population.
The number of European nationals is virtually unchanged since last year, and European nationals still constitute the majority of foreign nationals: 114,805 or 62 per cent of all foreign nationals. One year earlier Europeans accounted for 66 per cent. While there has been a decrease in the number of Yugoslavs and Bosnians, the number of Russians and other Eastern Europeans has increased. EU nationals (EU 15) increased modestly, by around 700, in 2000. This is a much lower rate than before. They now number 79,188, or 43 per cent of all foreign nationals. Throughout 2000 the number of Nordic nationals has remained the same. Whereas, in 1999, the
19

number of Nordic nationals increased at a much lower rate than before, the increase came to a standstill in 2000.
The number of Asian nationals increased throughout 1999, and the increase continued through 2000, turning the downward trend of most of the 1990s. Asian nationals now account for 22 per cent of the total foreign population, while by 1 January 2000 they made up 19 per cent.
African nationals increased by 2,000 in 2000. This seems part of an upward trend starting in 1997 and is the biggest influx of Africans ever. By comparison, the increase was a little less than 1,500 people in 1999. Somalis constitute the largest national group. Around 7 per cent of foreign nationals in Norway are African, an increase of 1 per cent since last year.
The largest groups of foreign nationals in Norway originate in Sweden, Denmark, Bosnia and Herzegovina, UK, Yugoslavia, USA, Germany and Pakistan (descending order).
Table 5. Number of foreign citizens by citizenship in Norway 1999-2001
1.1.1999 1.1.2000 1.1.2001
Sweden 24,024 25,136 25,170Denmark 19,101 19,205 19,405Bosnia and Herzegovina 11,813 12,196 11,611UK 11,204 11,367 11,074Yugoslavia 5,472 10,249 8,849USA 8,596 8,325 8,037Germany 6,026 6,707 7,055Pakistan 6,931 7,363 6,731
Cf. Table 24 for more details.
6.2 The Stock of Immigrants
Whereas the number of foreign nationals went up around 5,600 from 2000 to 2001 (from 178,686 to 184,337), the number of foreign born and immigrants increased more. 1 January 2001, 297,731 persons, or about 6.6 per cent of the total population, made up the so-called immigrant population in Norway, cf. table 35.
As of 1 January 2001 305,021 persons were born abroad. Of those some were born of Norwegian parents who happened to be abroad at the time of birth. Thus, this number doesn’t give a useful picture of the foreign or immigrant population. The number of persons born abroad by parents also born abroad is more relevant. 249,904 persons, or 5.5 per cent of the total population, fall in this category. The corresponding figure for 1 January 2000 was 238,462 and for 1 January 1999 220,347. The number thus increased by around 30,000 over the past two years. 20 per cent of persons born abroad by parents also born abroad have a Nordic background, slightly less than 30 per cent have a background in the rest of Europe, almost 4 per cent have a Northern American background and 46 per cent an Asian, African or Latin American background, cf. statistical annex, table 35.
20

Table 6. Number of foreign born residents by continent of birth, 1999 - 2001
1999 2000 2001
Total 220,347 238,462 249,904
Nordic countries 49,867 50,570 50,526Rest of Europe 62,837 72,283 73,857North America 9,514 9,873 9,715Asia, Africa, Latin America and Turkey 98,129 104,903 114,939
The number of immigrants went up by about 15,000 to totally 297,731 people from 1 January 2000 to 1 January 2001, or 6.6 per cent of the total population. 1 January 2000 immigrants made up 6.3 per cent. Immigrants are here defined as persons born in a foreign country of parents with no Norwegian family background and persons born in Norway of parents who are not born in Norway, cf. table 35.
Table 7. Number of immigrants by regions of origin, January 1999 - 2001
1999 2000 2001
Pakistan 21,889 22,831 23,581Sweden 22,413 23,240 23,010Denmark 18,837 18,863 19,049Vietnam 14,929 15,390 15,880Yugoslavia 9,443 15,466 15,469Bosnia and Herzegovina 12,131 12,614 12,944Iraq 7,664 12,357Iran 9,646 10,354 11,016Turkey 9,859 10,481 10,990UK 10,994 11,161 10,925
Whereas European nationals make up 62 per cent of all foreign nationals residing in Norway, European immigrants only make up 45 per cent of the total immigrant population. This discrepancy reflects the fact that fewer Europeans opt for a Norwegian citizenship, when they qualify for that. Asian immigrants make up 38 per cent and Africans 10 per cent. Of the single immigrant communities, Iraqis appeared on the list 1 January 2001, the number increasing from 7,664 to 12,357 during one year. Many of these migrants are Kurdish asylum seekers.
Since 1 January 1990 more than 70,000 foreign national have been given protection in Norway. They are partly refugees resettled in co-operation with UN High Commissioner for Refugees, asylum seekers who have been given leave to remain with refugee or humanitarian status and family members who have been reunited with these categories. Around 8,500 people were added to this broad refugee category in the course of 2000, a decline of about 5,500 people compared to 1999, when more than 14,000 people were given protection in Norway. The difference
21

between the levels of 1999 and 2000 is due to the fact that, in 1999, almost 6,100 Kosovars were given temporary protection in Norway, whereas no temporary permits were given in 2000.
7 Naturalisations
7.1 Naturalisations
As a main rule foreign nationals may acquire Norwegian citizenship after 7 years of legal residence. The acquisition may be suspended for those with a criminal record. No requirements are made as to language proficiency or subsistence. The laws and regulations are quite liberal, but not fundamentally different from the European standard.
During the 1980s the number of naturalisations varied from 1,800 (1983) to 4,600 (1989). The average number in that decade was 2,800. In the 1990s the number of naturalisations increased considerably; resulting in an average of 8,130 per year. Naturalisation is very common in Norway. As Østby (2001) writes, “a qualified guess will be that around fifty per cent of the eligible foreign citizens prefer to change citizenship, fifty per cent prefer not”. This percentage, however, varies between different groups. In 2000 less than 2 per cent of nationals of Nordic, EEA and North American countries who qualified for Norwegian nationality availed themselves of that opportunity, whereas nearly all Colombians, almost 80 per cent of Iraqis and around 50 per cent of Yugoslavs, Vietnamese and Somalis did that. This has been the usual pattern for many years; just a small percentage of Western European and Northern American citizens has naturalised, while the rates for all other countries are much higher. In 2000 37.5 per cent of naturalised persons originated in Europe. 37 per cent of these had their origins in Yugoslavia. Whereas 49 per cent originated in Asia (including Turkey), only 7.3 per cent of naturalised persons originated in Africa. Table 24 indicates the inclination of various nationalities to take up Norwegian nationality. For some countries the number of naturalisation is higher than the number of persons having stayed in the country for more than 7 years. This is due to groups with many minor children, adopted children and people marrying Norwegians. An exception from the required length of residence in Norway applies to all of these.
After the peak years of 1995, 1996 and 1997 there has been a decrease in the number of foreign nationals who have acquired Norwegian citizenship. However, throughout 2000 the number of naturalisations increased modestly, and reached 9,500 people by 1 January 2001. This is a smaller number than the ones of 1996 through 1998, but larger than any year before 1994. The decreased number of naturalisations over the past 3 years reflects that the number of arrivals of nationals who tend to take up Norwegian nationality in great proportions (refugees and other immigrants from third world countries) were low in the period 1990-92 compared with the numbers in the end of the 1980s.
The number of naturalisations may rise again in the years to come. 1993 was a peak year when it comes to arriving asylum seekers. The by far largest group was the Bosnians. Most of them are still in Norway. Originally, they were granted a temporary permit to stay in Norway. These permits were converted to permanent ones, as the situation in Bosnia remained difficult for a number of years. 7 years later, in 2000, 875 Bosnians acquired Norwegian citizenship.
22

After an unexpected drop in the level of naturalisation in 1999, when the number of Pakistanis taking up Norwegian nationality decreased to only 106, Pakistanis were in 2000 back at their previous level of around 1,000. The development has been much the same regarding Turks. Whereas the number of Turks acquiring Norwegian citizenship decreased from 705 to 170 in 1990, the number increased to 523 in 2000. As stated in last year’s report, this development is probably more a reflection of an undersized staff at the Directorate of Immigration and their priorities, which decides the applications for Norwegian citizenship, than of any dramatic changes in the willingness to naturalise.
Diagram 6. Number of naturalised Norwegians by country of previous nationality
7.2 The Norwegian Nationality Act
The Norwegian Nationality Act dates back to 8 December 1950 and is supplemented with several amendments. The present nationality act is based on the principles of single citizenship and no language requirement.
There are two ways of acquiring Norwegian citizenship, by birth or by application. Norwegian citizenship is acquired by birth if the mother is Norwegian or if the father is Norwegian and married to the child’s foreign mother. If the Norwegian father is not married to the child’s
23
foreign mother, the child acquires Norwegian citizenship by the parent’s giving a note to the Norwegian authorities.
To acquire Norwegian citizenship by application the following is acquired:- Being 18 years of age- 7 years of residence - Having shown good conduct (no criminal record)- Not having substantial debt in connection with maintenance payment.
Norwegian citizenship is lost if citizenship of another state is acquired.
The Act is being revisited, and all aspects related to nationality are broadly evaluated. In the revision inter alia single or multiple citizenship and language requirement for obtaining citizenship are being considered.
8 The Integration of Immigrants
8.1 General Policy
In general the government’s Report no. 17 (1996-97) to the Storting (Parliament) onImmigration and the Multi-Cultural Norway, which was submitted on 28 February 1997, still constitutes the major integration policy document. While submitting it, the Minister of Local Government and Labour stated that “Norway is developing more and more into a multi-cultural society, and we have to make the most out of this diversity to strengthen our sense of community and make our society a richer place to live. If our society is to benefit from the resources and the experience immigrants have, it is important that they are allowed to participate in the Norwegian society under the same terms and with the same obligations as the rest of the population”. The Report to the Storting outlines the main principles underlying the measures introduced to meet the challenges posed by immigration since the late 1960s.
Special measures for immigrants were considered necessary to ensure that immigrants have equal opportunities. Strengthened language and job training are considered to be of utmost importance in this respect. Likewise, strengthened effort to combat racism and discrimination. Through such efforts the government hopes to avoid a development towards increased social and economic differences between persons with immigrant background and the rest of the population.
Still, a number of indicators show that many immigrants, especially former asylum seekers, are less integrated than hoped for. To counter that, in the Report no. 17 (2000-2001) to the Storting on Asylum and refugee policy in Norway, submitted on 15 December 2000, the Government proposes new models for integration of immigrants, e.g. an improved introduction programme for qualifying newly arrived immigrants for the labour market.
8.2 Schooling of Immigrant Children
24

Immigrant children and adolescents have the same rights as Norwegian children and adolescents to primary and secondary education and vocational training (16-19 years of age). Children belonging to linguistic minority groups, with the exception of pupils from Sweden and Denmark, are offered teaching in Norwegian as a second language in primary and lower secondary education. The current Curriculum guidelines for primary and lower secondary education include a special section on the teaching of minority languages, i.e. the child’s first language as well as Norwegian as a second language.
In general, migrant students in upper secondary education are integrated in the ordinary classes. The counties receive extra grants to support migrant students, set up separate classes, organise team-teaching etc. on the basis of certain criteria. Integrated students are entitled to follow an alternative programme in Norwegian for linguistic minorities. In the spring of 2001 the counties received grants for a total of 4,386 pupils.
The number of pupils from linguistic minority groups has increased rapidly since the beginning of the 1970s. As an indication, in the fall of 2000 more than 40,000 of the 590,000 pupils in Norwegian schools at primary and lower secondary level belonged to language minorities. About ten years before the equivalent number was 16,000 pupils. Nation-wide 7 per cent of the total number of primary school pupils comes from language minorities. In Oslo the percentage is above 30 per cent. In several schools in Oslo the percentage is around 80 per cent. In other counties the percentage varies between 1 and 7. Throughout Norway more than 120 different languages are spoken. In the fall of 2000 45 per cent of the linguistic minority pupils in primary and lower secondary schools received mother tongue education. 77 per cent received education in Norwegian as a second language.
Diagram 7. Minority language pupils in Norwegian schools 1987-20001
Education in the mother tongue is regarded as a tool to learn Norwegian, not as a separate school subject. Primary school pupils who have a poor knowledge of Norwegian may get their first training in reading and writing in their mother tongue and training in other subjects in both languages. That is assumed to make it easier to learn Norwegian. But the government does not favour a right to education in the mother tongue. Mother tongue language instruction shall be limited to the four first years in primary school. Furthermore, it can be given as a supplementary language at the lower secondary school level. Bilingual teaching can be given to pupils who
1 There has been no classification of pupils according to class levels since year 1999.25

need it until they have learned enough of the Norwegian language. Steps will be taken to increase the number of students with immigrant backgrounds in colleges of education, so as to increase the number of teachers with such background.
8.3 Adult Education
The educational background of the immigrant population differs tremendously. Some are illiterate and lack formal education from their home country, while others are highly qualified. Lack of Norwegian language skills is considered to be a major obstacle to employment.
Adult immigrants are offered a Norwegian language course of 850 hours if they have finished primary education; up to 3000 hours if they are illiterate or have less than primary education. Most of the municipalities provide language courses, although they are not legally required to do so. The municipalities are compensated by the government for giving such classes. Those who attend language training are invited to sit a test at the end of the course in order to obtain a documentation of their acquired language skills. In 1999 22,769 immigrants attended language classes, whereas only 2,280 sat the test. In 2000 21,856 attended classes but only 2,263 sat the test.
9 Immigrants in the Labour Market
9.1 Employment of Immigrants
The positive development for the Norwegian economy is reflected in the employment statistics. Unemployment has been steadily reduced since mid-1993, and was in 1998 down to 2.1 per cent, the lowest level since 1988. In 1999 and 2000 there has been a slight increase in the unemployment rate up to 2.5 per cent.
Table 8. Total unemployment rate, and unemployment rate for immigrants. Period from November 1988 to November 2000. Per cent of the workforce.
Unemployment rate for population 16-74 years
Unemployment rate for Immigrants
1988 2.9 4.51989 3.7 7.11990 3.7 8.11991 4.6 10.31992 4.9 10.81993 4.9 11.31994 4.4 11.51995 4.0 11.41996 3.5 10.51997 2.5 7.91998 2.1 6.01999 2.4 6.62000 2.5 6.8
26

Source: Statistics Norway, 2000
The unemployment rate among immigrants has been steadily reduced since 1996 and was in 1998 down to 6.0 per cent. In 1999 and 2000 there has been a slight increase in the unemployment rate up to 6.8 per cent. In May 2001 the unemployment among immigrants was at 6.6 per cent, while the unemployment for the total workforce was at 2.3 per cent. The unemployment among immigrants is still considerably higher than in the population at large. There are significant variations in unemployment rates among immigrants from different regions of origin. Whereas immigrants from Western European countries are at about the same level as Norwegian nationals, unemployment among immigrants from Asian and African countries, is considerably higher.
Table 9. Unemployment rate by continent of origin from May 1996 to May 2001 (per cent of the workforce)
May 1996
May 1997
May 1998
May 1999
May 2000
May2001
Total 4.0 3.2 2.2 2.2 2.6 2.31. gen. immigrants total
11.5 9.9 7.1 6.3 7.3 6.6
-Nordic countries 4.5 3.4 2.5 2.3 2.6 2.4-West Europe 4.5 3.5 2.6 2.6 3.2 2.9-East Europe 17.1 16.46 10.8 9.1 9.9 8.2-North Americaand Oceania
5.0 3.7 3.0 3.1 3.4 2.8
-Latin America 15.9 12.0 7.7 6.2 8.7 7.5-Asia 16.8 14.2 10.3 9.0 10.4 9.2-Africa 21.5 19.4 14.6 12.5 14.2 12.6
Source: Statistics Norway, 2001
The unemployment rate only reflects the number of persons who are actively seeking employment; that is, the number of persons who are registered as such with the public employment service. Therefore, it does not reflect the total number of persons without a gainful employment.
Of the total population aged between 16 and 74, 61.1 per cent were gainfully employed in 2000. For first generation immigrants the employment rate has been stable from 1998 to 2000 at 50.9 per cent.
27

Table 10. Employment rate. 4th quarter 1990-2000. Total population aged 16-74 and first generation immigrants. Per cent of the population.
1990 1991 1992 1993 1994 1995 1996 1997 1998 1999 2000
Population 54.8 54.6 54.5 55.0 55.8 56.9 58.3 59.6 60.9 61.3 61.1i Immigrants 43.4 42.4 41.3 41.5 42.1 43.2 45.5 48.1 50.950.9 50.9
Cf. table 21 for more details
There are significant variations in employment among immigrants from different regions of origin. Whereas immigrants from Western European countries had an employment rate of 57 per cent in the year 2000, the employment rate among immigrants from African countries was 41.8 per cent. The employment rate for immigrants from Asia was 45.3 per cent, for Eastern Europe 48.8 and for Latin America 54.6. The employment rate for the total population was at 61.1.
9.2 Labour Market Measures for Immigrants
An overall objective of the government is to ensure that newly arrived immigrants are self-reliant as soon as possible after arrival. It is a priority to reduce unemployment among immigrants. The lower employment rate among immigrant groups may have different causes: mismatching qualification, lack of Norwegian language skills, and discrimination. Reports on public and private employers’ attitudes to hire immigrants shows that even under circumstances where the immigrants’ international experience would be of value, there is scepticism to recruit them. In order to reduce discrimination in employment an amendment to Section 55A in the Working Environment Act prohibiting discrimination on grounds of race, colour or national or ethnic background was enacted in April 1998. In 2001 the Act was amended to allow shared burden of proof. The Ministry of Local Government and Regional Development is at present cooperating with several other Ministries on a new Governmental plan of action to combat racism and discrimination (2002-2006) that will contain measures focused on the labour market and the state recruitment policy (see 11.1).
The labour market service is in the process of introducing individual plans of action targeting efforts that will ensure normal employment for as many people as possible. Job applicants and the labour market services will collaborate on the plans which will serve as the foundation for a binding and structured co-operation.
In order to reduce unemployment the government has initiated a number of job training and job qualifying courses. As unemployment is reduced, the number of such courses has also been reduced. As a reflection of the employment situation, immigrants are over-represented in these courses. As of May 2001 immigrants constituted approximately 33 per cent of the participants in job training and job qualifying courses. Of those, approximately 73 per cent had a country of origin outside the Nordic countries, Western Europe and North America.
28

Table 11. Participation in labour market courses in per cent by continent of origin. Per cent of the population
Nov. 1995
Nov.1996
Nov.1997
Nov.1998
Aug. 1999
Mai2000
Mai2001
Total population 1.3 0.9 0.7 0.5 0.1 0.4 0.4
First generation immigrants 4.6 3.7 3.2 2.3 0.8 1.7 2.0
-Nordic countries 1.0 0.7 0.5 0.4 0.1 0.3 0.3-Western Europe 1.1 0.7 0.6 0.5 0.1 0.4 0.3-Eastern Europe 9.1 7.5 6.4 4.5 1.5 3.4 2.9-North America 0.8 0.5 0.4 0.3 0.1 0.3 0.4-Latin America 5.5 4.2 3.7 2.6 0.7 2.0 2.2-Asia 6.2 5.1 4.4 3.2 1.2 2.3 3.0-Africa 8.0 6.2 5.3 4.1 1.6 2.7 3.7
An immigrant who has obtained a general work permit has access to vocational training courses arranged by the Public Employment Service. This rule only applies if the worker is unemployed, or is in danger of losing his/her employment. Norwegian Employment Service gives courses that are specially adapted to the needs of refugees and migrant workers i.e. with facilities for language training combined with vocational training.
An improved introduction programme for newly arrived immigrants is being developed. It is envisaged that participants at such programmes should be granted an introduction benefit, instead of being dependent on social welfare. The co-operation of the various responsible institutions will be crucial. The combination of language instruction, vocational training, and the adaptation of individual plans of action are the most important parts. In order to further develop this model for integration of immigrants at a local level, the Ministry of Local Government and Regional Development took the initiative to start special projects in 26 municipalities. The projects and the results from these will be followed by an ongoing evaluation by an independent research institute, and the evaluation report will be presented in 2001.
In 1999, a committee was appointed to draw up a proposal for an act on economic support to newly arrived immigrants in need of basic qualification, as an alternative to social welfare. The committee submitted its report 26 June 2001. The purpose of the proposed act is to engage immigrants in active qualification to prepare them for integration in regular working life or education, instead of being passive recipients of social welfare. Immigrants who participate in the introduction programme will receive a payment, which is taxable and not means tested. After a public hearing of the committee’s report, the government will elaborate a formal proposal for a new act.
Recognition of qualifications and diplomas from other countries is a problem area in Norway. Immigrants often experience a disparity between their qualifications and their work. The Ministry of Education, Research and Church Affairs is now in the process of improving the information about current measures to approve education and work experience from abroad.
29

Moreover, vocational testing is being established for immigrants who have learned a trade in upper secondary school or through work experience, but do not have a certificate.
The government favours active recruitment of qualified persons with an immigrant background to all levels of public sector. Public sector on all levels is expected to reflect the fact that Norway is a diverse society. The government is not, however, in favour of establishing quotas whereby individuals, for example on ethnic or language criteria, would be appointed to positions instead of others with better qualifications.
Recruitment to the public sector will be strengthened through improving the knowledge of the qualification of persons with an immigrant background, courses in multicultural awareness, including measures to improve the recruitment of persons with an immigrant background in administrative plans. All government agencies must encourage persons with a minority background to apply for positions in their job advertisements. For a trial period of one year, all ministries must interview at least one qualified applicant with a minority background for each vacant position they are filling up.
Recruitment to higher education will be strengthened through information to the target groups and guidance counselling. Special attention will be taken in order to recruit persons of immigrant background to professions in frequent contact with the public.
10 Participation in Local Elections
After having been a resident in Norway for more than 3 years, foreign nationals have the right to vote in local elections. In 1999, when the last local elections were held, 43 per cent of foreign nationals who were entitled to vote, did so. This is an increase compared to 39 per cent in 1995. In the run-up to the local elections in 1999, the Government’s strategy included an information campaign to increase participation in local elections among foreign nationals and Norwegian nationals with an immigrant background. Information concerning voting rights and how to vote has been produced in several languages. The Government also funded projects run by immigrant organisations that aimed to increase participation in elections by the above-mentioned groups. In order to vote in elections on a national level you have to be a Norwegian citizen.
11 Racism and Racial Discrimination
11.1 General overview
In 1998, the Norwegian Government presented its Plan of Action to Combat Racism and Discrimination for the period 1998-2001. By autumn 2001 almost all of the 32 specific measures set out in the action plan have been implemented. Some of the measures have been given another shaping than described in the action plan, but they still follow the plan’s intentions. From the authorities’ point of view, the plan has proved to be a valuable tool in the efforts to combat racism and discrimination. The action plan will be evaluated in 2002.
30

In June 2001, the government presented 12 new measures to combat racism and discrimination in Norway. The measures, of which some are given below, can be grouped into three categories:
a) Children and youtho Increased efforts in schools to combat racism and discrimination.o Financial support to a project that aims at disrupting nationalist
circles.
b) State recruitment policyo All government agencies must encourage persons with a minority
background to apply for positions in their job advertisements.o For a trial period of one year, all Ministries must interview at least
one qualified applicant with a minority background for each vacant position they are filling up.
c) General measureso Legal amendments to prohibit discrimination in the housing
market will be proposed.o A new Plan of Action to Combat Racism and Discrimination will
be presented.o The Centre for Combating Ethnic Discrimination will continue as
a permanent office.
The Ministry of Local Government and Regional Development will in cooperation with several other Ministries present a new Governmental plan of action to combat racism and discrimination for the period 2002-2006. The government will present the new plan of action in 2002, when the current plan of action’s period of operation has ceased.
Documentation and registration of racism and discrimination is not yet satisfactory, but some progress has been made. The work on developing methods for documenting and registering the character and scope of ethnic discrimination and racist acts is given a high priority. The new plan of action to combat racism and discrimination will contain measures aiming at achieving a better and more coordinated monitoring system. Today, there are many different agencies etc. involved in the field, but none of these has a complete overview over all that is being done or where the problem areas are. The Ministry of Local Government and Regional Development has a long-term cooperation with Statistics Norway (SSB), and improvement of the present documentation routines is under consideration.
11.2 New Reports
The Centre for Combating Ethnic Discrimination is expected to present its third annual report titled Moving Toward Better Protection 2001 in the autumn of 2001. The government will submit its 16th report on Norway to UN’s Committee for the elimination of all forms of racial discrimination by the end of 2001.
31

11.3 Act Prohibiting Ethnic Discrimination
The government appointed a committee to draw up a proposal for an act prohibiting discrimination in March 2000. The committee shall consider how legal protection against ethnic discrimination may be strengthened, and submit proposals for legislation prohibiting ethnic discrimination. In addition to reviewing aspects of criminal law, the committee shall consider various civil sanctions against ethnic discrimination. The committee will also discuss how to organise effective enforcement of the legislation, including what kind of role the Centre for Combating Ethnic Discrimination should have. Another task for the committee is to consider how the International Convention on the Elimination of All Forms of Racial Discrimination (ICERD) may be further implemented into Norwegian law. The Committee is to complete its work by June 2002.
11.4 The Centre for Combating Ethnic Discrimination
On 11 September 1998, the Centre for Combating Ethnic Discrimination was established for a trial period until the end of 2002. In February 1999, the Centre for Combating Ethnic Discrimination was officially opened. The Centre, which is an independent government body, provides legal assistance to individuals who are victims of discrimination on the basis of religion, belief, race, colour, or national or ethnic origin. It also monitors the types and extent of racial discrimination in Norway. The Centre is being evaluated, and an evaluation report will be submitted after the trial period.
10.5 National minorities/The Sami people
On 8 December 2000 the Government presented a report to the Storting (the Norwegian parliament) of the groups covered by the policy of national minorities (Report No. 15 (2000-2001) to the Storting on National Minorities in Norway). The report deals with policy in respect of Jews, Kven (descendants of 17th and 18th century Finnish immigrants in North Norway, Roma/Gypsies, the Romani people/Travellers and Skogfinn (descendants of Finnish immigrants of 17th and 18th century in Eastern Norway).
The report to the Storting on national minority policy is part of the follow-up of Norway’s ratification of the Council of Europe’s Framework Convention for the Protection of National Minorities. Among other things, it contains a review and evaluation of Norway’s international obligations in this field, and examines the principles and legal foundation on which the policy is based. The report discusses ways of ensuring equal conditions for participation in society and the preservation of language, culture and cultural identity, and describes official plans for further work in this field.
The Sami people receive wider protection being indigenous people. In 1980, a commission was appointed to study the legal rights of the Sami people. The Government is currently preparing new legislation based on the propositions of the commission. The commission is now looking into the Sami peoples right to land and water resources in the areas south of Finnmark.
32
12 Statistical annex
Table 12. Demographic growth, economic growth and migration in 2000. NORWAY. (Annual change in per cent)
1.1.2000 1.1.2001 GrowthTotal population
4478497 4503436 0,6
Foreign population 178686 184337 3,2Inflow of foreigners 32230 27785 -13,8Real GDP 1) +2,3Total employment 1,2) +0,5
1) Growth of yearly average2) Preliminary figures (all industries), Source: National Accounts Statistics
Table 13. Average annual gross inflows and gross outflows of legal migrants. 1971-2000.
1971-1975
1976-1980
1981-1985
1986-1990
1991-1995
1995 1996 1997 1998 1999 2000
Immigrations 18766 18758 20355 27330 27465 25668
26407
31957
36704
41841
36542
Emigrations 13931 14615 15317 21006 18546 19312
20590
21257
22881
22842
26854
As percentage of total population 1)Immigrations 0,47 0,46 0,49 0,65 0,66 0,59 0,60 0,73 0,81 0,94 0,81Emigrations 0,35 0,36 0,37 0,50 0,42 0,44 0,47 0,48 0,50 0,51 0,60
1) As percentage of mean population in the period
33

Table 14 male. Gross inflows to Norway by previous residence. Male. 2000.
Age Age Age Age Age Age Age AgeCountry Total 0 - 9 10 - 19 20 - 29 30 - 39 40 - 49 50 - 59 60 - 69 70 +Total 19140 2799 2308 6607 4414 1790 826 283 113Denmark 1450 136 88 658 358 135 57 16 2Finland 581 92 43 216 137 69 21 3 -Sweden 2575 204 202 1184 547 235 140 41 22Bosnia- Herzegovina
153 31 24 36 20 12 14 14 2
Bulgaria 45 6 5 10 16 4 2 2 -France 321 40 25 140 63 37 12 3 1Germany 713 89 52 219 242 70 30 9 2Romania 40 7 4 16 5 3 1 3 1Russia 238 54 65 60 32 13 6 6 2Spain 286 27 36 56 45 41 41 19 21Ukraine 21 5 2 5 3 3 2 1 -United Kingdom
957 138 69 248 277 136 76 10 3
Yugoslavia 525 133 92 134 86 47 24 6 3Rest of Europe
1591 266 184 537 348 180 50 20 6
EU 12 4365 517 326 1508 1173 500 239 69 33EU 15 7571 823 575 2929 1866 810 400 113 55Morocco 136 15 25 64 20 7 4 - 1Somalia 760 144 139 207 200 45 18 7 -Rest of Africa
897 184 153 219 230 71 33 6 1
China 148 22 18 40 38 17 10 2 1Hong Kong 23 7 2 1 6 7 - - -Korea, South
114 79 11 1 9 8 4 2 -
Phillipines 118 48 18 17 15 11 3 5 1Iran 232 38 50 44 57 17 8 12 6Iraq 3461 247 414 1548 886 253 81 25 7Pakistan 374 84 75 124 43 25 11 4 8Sri Lanka 106 17 26 18 20 8 5 7 5Thailand 122 48 26 12 18 6 9 2 1Turkey 277 20 41 133 65 14 4 - -Viet Nam 53 12 6 17 11 7 - - -Rest of Asia 966 199 170 204 211 106 55 15 6USA 911 183 114 183 228 109 59 26 9Chile 85 20 13 27 13 7 4 - 1Rest of America
580 173 81 129 104 51 31 10 1
Oceania 168 18 26 58 31 26 5 4 -Not stated 113 13 9 42 30 10 6 3 -
Source: Statistics Norway (2000, and previous issues)
34

Table 14 female. Gross inflows to Norway by previous residence. Female. 2000
Age Age Age Age Age Age Age AgeCountry Total 0 - 9 10 - 19 20 - 29 30 - 39 40 - 49 50 - 59 60 - 69 70 +Total 17402 2623 2623 6401 3326 1384 656 272 117Denmark 1509 134 198 833 223 75 34 7 5Finland 730 72 70 326 134 84 40 4 -Sweden 2484 190 419 1214 339 160 109 33 20Bosnia- Herzegovina
172 24 30 32 34 23 10 13 6
Bulgaria 53 7 7 21 14 3 1 - -France 217 32 24 70 46 27 15 2 1Germany 658 76 76 248 173 55 25 5 -Romania 76 - 7 48 12 3 1 4 1Russia 657 56 89 224 143 100 30 13 2Spain 260 32 31 54 60 19 28 16 20Ukraine 58 7 6 23 12 5 2 2 1United Kingdom
696 133 59 205 182 73 37 3 4
Yugoslavia 507 127 99 113 89 38 14 18 9Rest of Europe
1765 220 259 700 344 152 56 25 9
EU 12 3875 493 447 1550 832 312 163 43 35EU 15 7129 760 941 3105 1313 561 314 80 55Morocco 119 9 19 49 28 10 1 3 -Somalia 664 142 109 239 132 28 9 5 -Rest of Africa
814 157 151 249 168 55 22 9 3
China 305 138 20 73 43 20 6 5 -Hong Kong 18 3 4 4 4 1 1 - 1Korea, South
85 56 3 5 16 4 1 - -
Phillipines 346 37 32 160 76 26 10 4 1Iran 277 31 51 84 58 23 13 12 5Iraq 921 247 182 201 171 70 30 17 3Pakistan 398 68 106 126 43 22 17 11 5Sri Lanka 152 13 13 66 32 2 5 16 5Thailand 439 39 39 185 133 37 6 - -Turkey 187 24 62 51 32 13 2 3 -Viet Nam 156 13 22 81 29 7 3 1 -Rest of Asia 884 195 158 221 169 74 49 15 3USA 797 140 107 194 193 89 51 15 8Chile 106 19 21 24 19 17 3 2 1Rest of America
710 158 105 225 139 57 15 8 3
Oceania 141 20 39 36 26 10 9 1 -Not stated 41 4 6 17 10 2 1 - 1
35

Source: Statistics Norway (2000, and previous issues)
Table 15 male. Gross outflows from Norway by country of destination. Male. 2000.
Age Age Age Age Age Age Age AgeCountry Total 0 - 9 10 - 19 20 - 29 30 - 39 40 - 49 50 - 59 60 - 69 70 +Total 13731 2022 1263 3870 3154 1687 1031 544 160Denmark 1516 200 141 608 323 138 75 23 8Finland 468 64 28 160 121 61 28 5 1Sweden 3322 330 205 1309 724 334 220 151 49Bosnia- Herzegovina
76 9 7 1 12 6 8 17 16
Bulgaria 4 - - 1 1 1 - - 1France 286 47 26 84 62 29 24 11 3Germany 440 62 29 154 105 47 26 15 2Romania 19 2 3 7 2 4 1 - -Russia 48 4 12 18 9 3 1 1 -Spain 646 39 41 59 76 95 141 160 35Ukraine 10 - 3 4 1 1 1 - -United Kingdom
1014 139 100 242 254 157 96 22 4
Yugoslavia 618 176 125 109 105 62 25 10 6Rest of Europe
1291 239 124 332 326 158 73 29 10
EU 12 4453 598 373 1274 963 538 401 248 58EU 15 8298 999 606 2762 1827 938 652 405 109Morocco 33 10 4 3 6 1 7 2 -Somalia 43 19 17 2 5 - - - -Rest of Africa
383 75 37 62 121 57 27 3 1
China 96 13 11 18 38 9 7 - -Hong Kong 10 - 1 3 3 - 2 1 -Korea,South
11 1 - 2 4 4 - - -
Phillipines 60 5 9 4 6 13 15 7 1Iran 19 3 2 2 8 2 - 1 1Iraq 16 7 - 1 5 3 - - -Pakistan 138 70 23 10 11 13 6 5 -Sri Lanka 26 4 - - 14 5 2 1 -Thailand 78 6 7 10 22 6 16 10 1Turkey 62 8 11 12 16 6 2 6 1Viet Nam 10 4 1 1 4 - - - -Rest of Asia 420 91 44 53 135 60 28 7 2USA 1056 202 85 249 260 168 59 23 10Chile 33 3 11 5 6 2 5 1 -
36

Rest of America
308 56 44 58 70 50 22 7 1
Oceania 152 28 20 34 41 15 12 2 -Not stated 1019 106 92 253 258 177 102 24 7
Source: Statistics Norway (2000, and previous issues)
Table 15 female. Gross outflows from Norway by country of destination. Female. 2000.
Age Age Age Age Age Age Age AgeCountry Total 0 - 9 10 - 19 20 - 29 30 - 39 40 - 49 50 - 59 60 - 69 70 +Total 13123 1885 1661 4545 2496 1238 723 419 156Denmark 1746 174 228 900 274 104 43 20 3Finland 573 79 50 246 117 50 28 3 -Sweden 3271 320 338 1479 485 270 215 123 41Bosnia- Herzegovina
79 5 8 6 7 6 6 26 15
Bulgaria 10 1 1 3 2 2 - - 1France 233 47 22 63 52 32 9 6 2Germany 431 47 62 169 93 34 17 8 1Romania 15 - - 10 3 1 - 1 -Russia 58 3 9 27 12 4 - 1 2Spain 568 56 52 55 64 81 121 118 21Ukraine 9 - - 6 3 - - - -United Kingdom
852 150 76 249 227 100 34 11 5
Yugoslavia 631 178 128 103 108 48 27 22 17Rest of Europe
1234 212 155 406 264 114 60 15 8
EU 12 4349 578 486 1581 843 404 247 173 37EU 15 8237 982 880 3322 1458 726 492 299 78Morocco 29 7 9 3 5 3 - 2 -Somalia 38 20 7 7 3 - 1 - -Rest of Africa
277 63 29 57 76 31 16 5 -
China 63 3 3 25 21 5 5 - 1Hong Kong 6 1 - 2 2 - 1 - -Korea, South
17 5 1 4 5 2 - - -
Phillipines 62 6 8 15 13 13 4 - 3Iran 23 5 4 6 3 - 1 3 1Iraq 13 4 2 2 3 - 1 - 1Pakistan 179 73 43 25 27 10 - - 1Sri Lanka 23 5 - 4 8 1 1 3 1Thailand 41 4 9 6 10 9 3 - -Turkey 54 15 11 8 12 3 3 2 -
37

Viet Nam 10 1 2 3 2 - 1 1 -
Rest of Asia 342 68 55 61 85 45 20 1 7USA 947 176 137 200 242 133 40 14 5Chile 44 6 14 6 7 7 4 - -Rest of America
312 52 76 67 61 40 9 3 4
Oceania 162 26 25 43 41 14 11 1 1Not stated 771 73 97 279 159 76 42 30 15
Source: Statistics Norway (2000, and previous issues)
Table 16 male. Net migration for Norway by country. Male. 2000.
Age Age Age Age Age Age Age AgeCountry Total 0 - 9 10 - 19 20 - 29 30 - 39 40 - 49 50 - 59 60 - 69 70 +Total 5409 777 1045 2737 1260 103 -205 -261 -47Denmark -66 -64 -53 50 35 -3 -18 -7 -6Finland 113 28 15 56 16 8 -7 -2 -1Sweden -747 -126 -3 -125 -177 -99 -80 -110 -27Bosnia- Herzegovina
77 22 17 35 8 6 6 -3 -14
Bulgaria 41 6 5 9 15 3 2 2 -1France 35 -7 -1 56 1 8 -12 -8 -2Germany 273 27 23 65 137 23 4 -6 -Romania 21 5 1 9 3 -1 - 3 1Russia 190 50 53 42 23 10 5 5 2Spain -360 -12 -5 -3 -31 -54 -100 -141 -14Ukraine 11 5 -1 1 2 2 1 1 -United Kingdom
-57 -1 -31 6 23 -21 -20 -12 -1
Yugoslavia -93 -43 -33 25 -19 -15 -1 -4 -3Rest of Europe
300 27 60 205 22 22 -23 -9 -4
EU 12 -88 -81 -47 234 210 -38 -162 -179 -25EU 15 -727 -176 -31 167 39 -128 -252 -292 -54Morocco 103 5 21 61 14 6 -3 -2 1Somalia 717 125 122 205 195 45 18 7 -Rest of Africa
514 109 116 157 109 14 6 3 -
China 52 9 7 22 - 8 3 2 1Hong Kong 13 7 1 -2 3 7 -2 -1 -Korea, South
103 78 11 -1 5 4 4 2 -
Phillipines 58 43 9 13 9 -2 -12 -2 -Iran 213 35 48 42 49 15 8 11 5
38

Iraq 3445 240 414 1547 881 250 81 25 7Pakistan 236 14 52 114 32 12 5 -1 8Sri Lanka 80 13 26 18 6 3 3 6 5Thailand 44 42 19 2 -4 - -7 -8 -Turkey 215 12 30 121 49 8 2 -6 -1Viet Nam 43 8 5 16 7 7 - - -Rest of Asia 546 108 126 151 76 46 27 8 4USA -145 -19 29 -66 -32 -59 - 3 -1Chile 52 17 2 22 7 5 -1 -1 1Rest of America
272 117 37 71 34 1 9 3 -
Oceania 16 -10 6 24 -10 11 -7 2 -Not stated -906 -93 -83 -211 -228 -167 -96 -21 -7
Source: Statistics Norway (2000, and previous issues)
Table 16 female. Net migration for Norway by country. Female. 2000.
Age Age Age Age Age Age Age AgeCountry Total 0 - 9 10 - 19 20 - 29 30 - 39 40 - 49 50 - 59 60 - 69 70 +Total 4279 738 962 1856 830 146 -67 -147 -39Denmark -237 -40 -30 -67 -51 -29 -9 -13 2Finland 157 -7 20 80 17 34 12 1 -Sweden -787 -130 81 -265 -146 -110 -106 -90 -21Bosnia- Herzegovina
93 19 22 26 27 17 4 -13 -9
Bulgaria 43 6 6 18 12 1 1 - -1France -16 -15 2 7 -6 -5 6 -4 -1Germany 227 29 14 79 80 21 8 -3 -1Romania 61 0 7 38 9 2 1 3 1Russia 599 53 80 197 131 96 30 12 -Spain -308 -24 -21 -1 -4 -62 -93 -102 -1Ukraine 49 7 6 17 9 5 2 2 1United Kingdom
-156 -17 -17 -44 -45 -27 3 -8 -1
Yugoslavia -124 -51 -29 10 -19 -10 -13 -4 -8Rest of Europe
531 8 104 294 80 38 -4 10 1
EU 12 -474 -85 -39 -31 -11 -92 -84 -130 -2EU 15 -1108 -222 61 -217 -145 -165 -178 -219 -23Morocco 90 2 10 46 23 7 1 1 -Somalia 626 122 102 232 129 28 8 5 -Rest of Africa
537 94 122 192 92 24 6 4 3
China 242 135 17 48 22 15 1 5 -1Hong Kong 12 2 4 2 2 1 - - 1
39

Korea, South
68 51 2 1 11 2 1 - -
Phillipines 284 31 24 145 63 13 6 4 -2Iran 254 26 47 78 55 23 12 9 4Iraq 908 243 180 199 168 70 29 17 2Pakistan 219 -5 63 101 16 12 17 11 4Sri Lanka 129 8 13 62 24 1 4 13 4Thailand 398 35 30 179 123 28 3 - -Turkey 133 9 51 43 20 10 -1 1 -Viet Nam 146 12 20 78 27 7 2 - -Rest of Asia 542 127 103 160 84 29 29 14 -4USA -150 -36 -30 -6 -49 -44 11 1 3Chile 62 13 7 18 12 10 -1 2 1Rest of America
398 106 29 158 78 17 6 5 -1
Oceania -21 -6 14 -7 -15 -4 -2 - -1Not stated -730 -69 -91 -262 -149 -74 -41 -30 -14
Source: Statistics Norway (2000, and previous issues)
Table 17. Inflow of foreign population 1). 1986-2000.
Annual average
Immigration ofcitizens of:
1986-1990 1991 1992 1993 1994 1995 1996 1997 1998 1999 2000
Total foreign citizens
19601 16091 17162 22295 17867 16482 17196 22026 26747 32230 27785
Industrialized world 2)
10459 8635 10345 16432 13323 11847 12263 15423 18242 22299 15152
Nordic countries, total
5111 3462 3465 3949 4937 4799 5840 8602 10402 8121 7258
Of which: Denmark 2672 1847 1692 1723 1856 1590 1632 1807 2128 1779 1939 Sweden 1630 1111 1282 1618 1942 2074 2930 4949 6001 4493 3502Rest of Western Europe
2563 1860 2266 2387 2166 2421 2650 3102 3855 3379 3090
Of which: Germany 380 298 362 396 430 485 567 750 1081 1067 993 U.K. 1272 824 1053 1075 820 849 937 958 1259 980 812EU 12 5143 3625 3896 4009 3949 3891 4182 4786 5819 5011 4914EU 15 5543 5019 5451 5962 6461 6571 7730 10825 13297 10991 9791Eastern Europe 1462 1951 3511 8916 5104 3493 2515 2292 2581 9750 3696Of which:
40

Albania . . 32 30 35 . 11 18 19 65 39 Bosnia- Herzegovina . . 35 6215 3244 1726 1040 586 494 546 355 Bulgaria 117 53 50 42 32 51 80 80 77 96 Czech Republic
. . . . . 36 31 31 51 53 51
Hungary 30 . 30 38 38 51 61 73 75 58 68 Poland 491 382 344 273 278 237 226 243 231 260 240 Romania 90 64 106 74 102 115 123 153 123 107 Russia . . 166 280 355 359 474 555 617 800 875 Slovakia . . . . . . 15 15 37 43 63 Ukraine . . 17 23 25 . 37 48 68 65 77 Yugoslavia 714 999 2517 1782 786 600 162 200 315 6451 654USA 967 1048 882 901 781 783 852 1004 1000 683 712Third world 3) 9095 7150 6710 5784 4503 4607 4888 6564 8438 9843 12589Of which: Chile 947 158 107 102 140 125 104 144 119 146 139 China 226 311 308 211 276 198 268 304 414 333 258 Iran 1132 709 472 407 302 232 284 620 690 665 582 Iraq . . 634 466 211 345 386 749 1117 2063 4486 Korea, South 151 115 118 126 154 161 137 149 160 157 128 Morocco 232 216 212 134 119 106 136 172 224 214 205 Pakistan 853 473 449 441 417 524 450 540 639 549 474 Philippines 453 286 284 274 253 239 238 325 383 345 401 Somalia 328 668 502 566 392 392 367 518 1058 1160 1541 Sri Lanka 853 499 494 392 242 280 354 377 436 407 254 Thailand 160 147 233 207 231 231 277 268 287 415 505 Turkey 594 428 296 268 262 277 320 350 461 471 356 Viet Nam 737 841 803 536 244 212 120 196 154 199 186Stateless and not stated
47 306 105 79 41 28 45 39 67 88 44
1) Foreign citizens intending to stay in Norway for more than 6 months are registered in the Central Population Register, and are included in this table. From 1987, asylum seekers are also included.2) 1993-2000: Includes Europe (excl. Turkey), Japan, Israel, Canada, USA, Australia and New Zealand. 3) 1993-2000: Includes Turkey, Africa, Asia (excl. Japan and Israel), America (excl. Canada and USA), Oseania (excl. Australia and New Zealand).
Source: Statistics Norway (2000, and previous issues).
41

Table 18. Outflow of foreign population 1). 1986-2000.
Annual average
Outmigration ofcitizens of: 1986-1990 1991 1992 1993 1994 1995 1996 1997 1998 1999 2000Total, foreign citizens
9547 8444 8057 10451 9583 8992 10032 10034 12005 12690 14931
Industrialized world 2)
8511 6699 6009 7405 7366 7308 8285 8377 9747 11207 13081
Nordic countries, total
4467 2870 2537 2475 3049 3432 3351 3875 5355 6762 6972
Of which: Denmark 2322 1668 1400 1401 1603 1717 1441 1436 1423 1656 1690 Sweden 1287 713 688 689 986 1036 1137 1671 2741 3509 3608Rest of Western Europe
2497 1954 1632 2195 1835 1918 2197 2000 2146 1958 2788
42

Of which:
Germany 257 228 187 273 209 266 334 352 425 364 620 U.K. 1421 1071 903 1129 936 866 1013 816 783 777 1019EU 12 4741 3560 2974 3521 3318 3570 3559 3366 3461 3538 4345EU 15 5303 4490 3883 4429 4517 4973 5133 5454 6892 8085 9105Eastern Europe
342 739 975 1497 1366 808 1449 1212 1041 1363 2056
Of which: Albania . . 4 6 7 . 5 10 8 9 25 Bosnia- Herzegovina . . - 13 193 286 919 611 381 196 155 Bulgaria 49 35 21 16 16 16 25 12 20 Czech Republic
. . . . . 3 13 22 22 27 22
Hungary 9 20 24 24 24 12 21 29 38 25 24 Poland 108 157 113 181 99 93 101 94 103 76 81 Romania . . 67 20 45 20 17 26 27 24 40 Russia . . 11 24 34 36 98 126 142 135 131 Slovakia . . . . . . 3 15 8 11 15 Ukraine . . - 4 4 . 11 17 16 6 17 Yugoslavia 172 383 602 1089 615 196 107 73 54 674 1339USA 916 854 716 1012 826 873 949 876 856 815 909Third world 3)
1031 1730 2018 3019 2177 1662 1734 1639 2235 1467 1835
Of which: Chile 99 165 170 299 224 148 110 91 80 60 61 China 32 56 63 90 113 84 127 127 180 131 188 Iran 43 117 179 175 124 89 70 55 64 54 63 Iraq . . 42 37 42 20 27 23 42 30 48 Korea, South 13 37 12 36 12 20 25 27 34 26 18 Morocco 24 34 29 63 39 32 30 23 22 38 32 Pakistan 154 166 201 359 212 216 169 113 182 111 118 Philippines 42 84 72 106 77 98 96 108 156 68 88 Somalia 11 83 85 117 98 78 49 49 98 42 105 Sri Lanka 48 165 130 222 181 148 101 120 167 88 77 Thailand 15 16 30 43 38 35 36 30 49 38 46 Turkey 106 91 152 177 107 122 85 54 76 78 78 Viet Nam 25 33 38 25 49 24 36 26 39 17 28Stateless and not stated
5 15 30 27 40 22 13 18 23 16 15
Same sources, notes and definitions as table 6
43

Table 19. Net inflow of foreign population 1). 1986-2000.
Annual average Net immigrationof citizens of: 1986-1990 1991 1992 1993 1994 1995 1996 1997 1998 1999 2000Total, foreign citizens
10054 7647 9105 11844 8284 7490 7164 11992 14742 19540 12854
Industrialised world 2)
1948 1936 4336 9027 5957 4539 3978 7046 8495 11092 2071
Nordic 644 592 928 1474 1888 1367 2489 4727 5047 1359 286
44

countries, totalOf which: Denmark 350 179 292 322 253 -127 191 371 705 123 249 Sweden 343 398 594 929 956 1038 1793 3278 3260 984 -106Rest of Western Europe
66 -94 634 192 331 503 453 1102 1709 1421 302
Of which: Germany 123 70 175 123 221 219 233 398 656 703 373 U.K. -149 -247 150 -54 -116 -17 -76 142 476 203 -207 EU 12 402 65 922 488 631 321 623 1420 2358 1473 569 EU 15 240 529 1568 1533 1944 1598 2597 5371 6405 2906 686Eastern Europe
1120 1212 2536 7419 3738 2685 1066 1080 1540 8387 1640
Of which: Albania . . 28 24 28 . 6 8 11 56 14 Bosnia- Herzegovina . . 35 6202 3051 1440 121 -25 113 350 200 Bulgaria . 117 4 15 21 16 35 64 55 65 76 Czech Republic
. . . . . 33 18 9 29 26 29
Hungary 21 -20 6 14 14 39 40 44 37 33 44 Poland 383 225 231 92 179 144 125 149 128 184 159 Romania . 90 -3 86 29 82 98 97 126 99 67 Russia . . 155 256 321 323 376 429 475 665 744 Slovakia . . . . . . 12 0 29 32 48 Ukraine . . 17 19 21 . 26 31 52 59 60 Yugoslavia 542 616 1915 693 171 404 55 127 261 5777 -685USA 51 194 166 -111 -45 -90 -97 128 144 -132 -197Third world 3)
8064 5420 4692 2765 2326 2945 3154 4925 6203 8376 10754
Of which: Chile 848 -7 -63 -197 -84 -23 -6 53 39 86 78 China 194 255 245 121 163 114 141 177 234 202 70 Iran 1089 592 293 232 178 143 214 565 626 611 519 Iraq . . 592 429 169 325 359 726 1075 2033 4438 Korea, South 138 78 106 90 142 141 112 122 126 131 110 Morocco 208 182 183 71 80 74 106 149 202 176 173 Pakistan 699 307 248 82 205 308 281 427 457 438 356 Philippines 411 202 212 168 176 141 142 217 227 277 313 Somalia 317 585 417 449 294 314 318 469 960 1118 1436 Sri Lanka 805 334 364 170 61 132 253 257 269 319 177 Thailand 145 131 203 164 193 196 241 238 238 377 459 Turkey 488 337 144 91 155 155 235 296 385 393 278 Viet Nam 712 808 765 511 195 188 84 170 115 182 158Stateless and not stated
42 291 75 52 1 6 32 21 44 72 29
Same sources, notes and definitions as table 6
45

Table 20. Asylum seekers and refugees in Norway.
Asylum seekers 1)
Asylum seekers granted
protection 2)
Resettled refugees 3)
46

1980 50-1501981 50-1501982 50-1501983 about 1501984 about 3001985 8291986 27221987 8613 3548 8031988 6602 5352 7741989 4433 6559 10751990 3962 2577 9741991 4569 3142 11421992 5238 3030 20371993 12876 1328 14741994 3379 5909 6941995 1460 2268 15911996 1778 1465 7881997 2271 2094 13431998 8543 3039 11241999 10160 4693 75722000 10842 5319 1481
1) Asylum seekers whose applications have been rejected are expected to return. If not, 2) asylum or residence permit on humanitarian grounds. 3) Refugees accepted for resettlement in Norway, normally based on referrals from UNHCR.
Source: Directorate of Immigration (2000, and previous issues)
Table 21. Number of asylum seekers by country of origin. 1988-2000.
47

Annual average
Citizens of 1988-1990 1991 1992 1993 1994 1995 1996 1997 1998 1999 2000
Total 4999 4569 5238 12876 3379 1460 1778 2271 8543 10160 10842
Bosnia- Herzegovina
. . 390 7051 201 106 73 90 236 161 272
Bulgaria .. 79 42 8 2 6 5 9 14 6 12Croatia . . 44 68 78 29 3 55 2452 60 16Poland 230 120 19 10 72 8 209 19 2 2 68Romania .. 54 59 74 46 10 8 19 77 153 712Russia .. .. .. .. .. .. .. .. 131 318 471Ukraine .. .. .. .. .. .. .. .. 14 34 131Previous Soviet Union 1)
.. 71 84 99 159 151 50 39 122 491 665
Previous Yugoslavia 2)
701 1334 2838 4147 1562 147 76 343 1183 1173 4203
Ethiopia 278 260 42 29 7 18 30 48 81 126 96Ghana 83 6 3 11 5 11 5 - 1 2 1Somalia 408 731 444 259 251 189 180 552 955 1340 910
China .. .. .. .. .. .. .. .. 10 8 12India 82 30 13 22 20 4 9 4 11 10 16Iraq 112 131 111 137 126 99 113 272 1317 4073 766Iran 680 244 130 147 160 163 120 138 270 350 327Lebanon 204 179 65 40 9 18 6 17 28 49 22Pakistan 163 14 17 23 26 31 16 26 146 265 220Sri Lanka 374 556 403 255 233 90 413 196 173 112 165Turkey 211 46 32 30 30 35 24 44 131 279 164
Chile 664 - - 2 3 - 2 4 3 9 2
Stateless .. 201 49 120 27 59 19 42 85 164 120Rest .. 501 453 344 362 286 417 354 1101 975 1471
1) Excl. those stating they are coming from Russia and Ukraine.2) Excl. those stating they are coming from Bosnia-Herzegovina and Croatia.
Source: Directorate of Immigration, unpublished and annual reports.
48

Table 22. Total number of immigrations and emigrations by citizenship. 1978-2000.
Year Foreign citizens Norwegians TotalImmi- gration
Emi- gration
Net immi-gration
Immi- gration
Emi- gration
Net immi-gration
Immi- gration
Emi- gration
Net immi-gration
1978 12 183 7 624 4 559 6 642 7 227 -585 18 825 14 851 3 9741979 11 213 7 619 3 594 6 618 7 466 -848 17 831 15 085 2 7461980 11 833 7 288 4 545 6 943 7 417 -474 18 776 14 705 4 0711981 13 061 7 252 5 809 6 637 7 270 -633 19 698 14 522 5 1761982 13 990 7 218 6 772 6 478 7 510 -1 032 20 468 14 728 5 7401983 13 090 7 955 5 135 6 973 7 823 -850 20 063 15 778 4 2851984 12 837 7 617 5 220 6 851 8 310 -1 459 19 688 15 927 3 7611985 14 906 7 522 7 384 6 952 8 108 -1 156 21 858 15 630 6 2281986 16 534 8 424 8 110 7 662 8 321 -659 24 196 16 745 7 4511987 23 793 8 591 15 202 7 356 8 789 -1 433 31 149 17 380 13 7691988 23 041 9 320 13 721 6 923 10 501 -3 578 29 964 19 821 10 1431989 18 384 10 563 7 821 7 463 16 737 -9 274 25 847 27 300 -1 4531990 15 694 9 768 5 926 9 800 14 016 -4 216 25 494 23 784 1 7101991 16 091 8 444 7 647 10 192 9 794 398 26 283 18 238 8 0451992 17 162 8 057 9 105 9 581 8 744 837 26 743 16 801 9 9421993 22 295 10 451 11 844 9 416 8 452 964 31 711 18 903 12 8081994 17 867 9 583 8 284 9 044 9 892 -848 26 911 19 475 7 4361995 16 482 8 992 7 490 9 196 10 320 -1 124 25 678 19 312 6 3661996 17 196 10 032 7 164 9 211 10 558 -1 347 26 407 20 590 5 8171997 22 026 10 034 11 992 9 931 11 223 -1 292 31 957 21 257 10 7001998 26 747 12 005 14 742 9 957 10 876 -919 36 704 22 881 13 8231999 32 230 12 690 19 540 9 611 10 152 -541 41 841 22 842 18 9992000 27 785 14 931 12 854 8 757 11 923 -3 166 36 542 26 854 9 688
Source: Statistics Norway (2000 and previous issues).
49

Table 23. Population by country of birth. 1970, 1980, 1990, 1994, 1995, 1996, 1997, 1998, 1999, 2000 and 2001.
Country of birth
1.11. 1970
1.11. 1980
1.1. 1990
1.1. 1994
1.1. 1995
1.1. 1996
1.1. 1997
1.1. 1998
1.1. 1999
1.1. 2000
1.1. 2001
Total 3874133 4091132 4233116 4324815 4348410 4369957 4392714 4417599 4445329 4478497 4503436Norway 3797384 3970078 4040530 4099526 4115107 4129673 4145776 4159909 4172095 4186057 4198415Foreign countries
76749 121054 192586 225289 233303 240284 246938 257690 273234 292440 305021
Europe, total
57795 75837 96977 110725 116425 120713 124288 130629 138987 149730 151653
Denmark 13702 16914 21160 21178 21161 20906 20928 21139 21693 21713 21953 Sweden 16148 17875 20429 22242 23219 24315 26000 29255 32562 33401 33241 Bosnia-Herzegovina
1 1 3 6404 9401 10814 11089 11079 11219 11573 11743
Bulgaria 521 422 575 742 . 576 609 667 723 787 858 France 935 2016 2433 2442 2459 2469 2521 2621 2752 2934 2924 Germany 6566 7686 8821 9100 9318 9514 9737 10106 10798 11445 11768 Netherlands 1650 2541 3268 3482 3552 3676 3770 3880 4026 4108 4140 Poland 1165 1617 4367 5032 5157 5257 5350 5467 5610 5738 5861 Romania . . . . 577 662 766 863 981 1082 1139 Russia . . . . 820 1129 1581 1985 2458 3114 3866 Ukraine . . . . 77 103 143 190 251 314 382 United Kingdom
6345 11070 14586 13773 13692 13647 13535 13642 14118 14347 14177
Yugoslavia 1156 1784 4264 7657 7571 7901 7299 7208 7538 13279 12880 Rest of Europe
9606 13911 17071 18673 19421 19744 20960 22527 24258 25895 26721
EU 12 31387 43783 55410 55065 55235 55395 55790 56764 58987 60326 60855 EU 15 50388 66143 80729 82289 83923 85394 87638 92528 98835 101420 101980Africa, total 1879 4402 11620 15676 16196 16830 17490 18565 20545 22907 25330 Morocco 407 1134 2393 2974 3044 3110 3186 3327 3533 3719 3893 Rest of Africa
1472 3268 9227 12702 13152 13720 14304 15238 17012 19188 21437
Asia, total 2686 18486 54707 68369 69980 71856 73980 76917 81324 87015 94804 China 453 584 1559 2453 2878 2970 3086 3174 3405 3617 3818 India 340 1841 4422 4568 4621 4692 4700 4775 4969 5130 5243 Iran 61 190 5198 6896 7055 7146 7307 7710 8328 8857 9325 Iraq .. 24 716 2217 2376 2697 3050 3773 4873 6941 11355 Pakistan 172 5361 10470 11364 11567 11840 12098 12406 12876 13283 13618 Philippines 97 840 3552 4509 4686 4820 4963 5140 5426 5698 6027 South Korea
359 2602 4821 5215 5355 5483 5592 5701 5843 5966 6086
Sri Lanka 23 271 4707 6043 6122 6259 6516 6696 6971 7295 7460 Turkey 240 2149 4977 5850 5974 6114 6334 6554 6930 7300 7563 Viet Nam 91 2095 7522 10419 10594 10760 10809 10923 10994 11177 11298 Rest of Asia
850 2529 6763 8835 8752 9075 9525 10065 10709 11751 13011
North America,
13163 19047 19114 19052 18974 18883 18918 18977 19318 19276 19164
50

total USA 11535 16600 15827 15572 15407 15205 15047 14975 15149 14956 14666 Rest of North America
1628 2447 3287 3480 3567 3678 3871 4002 4169 4320 4498
South America, total
683 2379 9072 10289 10502 10744 10992 11352 11763 12166 12694
Chile 114 930 5496 5305 5249 5219 5205 5263 5355 5444 5516 Colombia 51 383 1618 2431 2584 2703 2821 2963 3101 3230 3471 Rest of South America
518 1066 1958 2553 2669 2822 2966 3126 3307 3492 3707
Oceania, total
543 903 1096 1178 1226 1258 1270 1250 1297 1346 1376
Per cent of total population
2,0 3,0 4,5 5,2 5,4 5,5 5,6 5,8 6,1 6,5 6,8
Source: Statistics Norway (2001, and previous issues).
51

Table 24. Foreign citizens by citizenship per 1 January. 1988-2001.
Annual average1988-
Citizenship 1990 1991 1992 1993 1994 1995 1996 1997 1998 1999 2000 2001Total 133311 143304 147774 154012 162298 164030 160837 157537 157965 165070 178686 184337Europe, total 68210 67335 68608 72434 80821 85726 88757 91976 97484 104946 114838 114805 Denmark 17724 17198 17392 17734 17955 18141 17881 18098 18438 19101 19205 19405 Sweden 12052 11672 12034 12617 13506 14439 15444 17306 20629 24024 25136 25170 Bosnia-Herzegovina . . . . 6318 9525 11225 11516 11599 11813 12196 11611 Bulgaria 182 298 367 345 338 320 288 276 287 309 355 413 France 1987 1768 1768 1862 1896 1892 1880 1908 1994 2114 2293 2279 Germany 4168 4270 4311 4461 4535 4705 4849 5063 5385 6026 6707 7055 Netherlands 2590 2552 2580 2705 2740 2822 2953 3068 3228 3411 3533 3587 Poland 2586 2854 2863 2905 2755 2647 2399 2259 2104 2053 2042 2023 Romania 109 276 316 308 391 397 434 459 439 475 480 480 Russia . . . . . 734 1042 1403 1770 2172 2749 3288 Ukraine . . . . . 61 81 106 132 175 231 284 United Kingdom
12822 11766 11486 11578 11434 11234 11054 10865 10798 11204 11367 11074
Yugoslavia 3116 4242 4826 6758 7296 6731 6412 6024 5696 5472 10249 8849 Rest of Europe
10874 10439 10665 11161 11657 12078 12815 13625 14985 16597 18295 19287
EU 12 42362 40614 40579 41444 41665 41980 41892 42383 43367 45586 47002 47422 EU 15 58436 55863 56221 57708 58887 60455 61586 64105 69076 75489 78482 79188Africa, total 6888 9400 10520 11328 11601 11603 10742 9989 9676 10069 11567 13594 Morocco 1872 2163 2113 2047 1882 1749 1559 1358 1212 1274 1380 1440 Rest of Africa
5016 7237 8407 9281 9719 9854 9183 8631 8464 8795 10187 12154
Asia, total 40028 47615 49301 50690 50684 48065 43929 38832 34948 34322 36790 40500 China 943 1469 1684 1867 1872 1912 1831 1596 1409 1369 1269 1202 India 3100 3459 3421 3336 3032 2911 2680 2407 2219 2238 2203 2174 Iran 4085 5942 6598 6928 6951 5916 4708 3805 3514 3554 3683 3795 Pakistan 10988 11442 11270 10757 10449 10311 9705 8611 7480 6931 7363 6731 Philippines 1991 2304 2306 2246 2235 2173 1953 1792 1603 1685 1781 1962 South Korea 326 290 272 274 255 255 253 243 235 211 200 200 Sri Lanka 3949 5247 5666 6167 6469 6034 5127 4422 3846 3662 3405 3177 Turkey 4810 5523 5531 5577 5422 4995 4432 3932 3449 3191 3481 3299 Viet Nam 6406 6898 6828 6859 6785 6371 5863 4590 3515 2887 2452 1897 Rest of Asia 3430 5041 5725 6679 7214 7187 7377 7434 7678 8594 10953 16063North America, total
11564 11124 11177 11290 11067 10917 10689 10550 10430 10526 10340 10174
USA 9951 9537 9583 9632 9349 9181 8956 8706 8583 8596 8325 8037
52

Rest of North-
America 1613 1587 1594 1658 1718 1736 1733 1844 1847 1930 2015 2137South America, total
5743 6881 6840 6757 6499 6045 5137 4618 4245 4075 3978 4075
Chile 4388 5388 5362 5243 4958 4572 3689 3161 2787 2590 2433 2361 Colombia 456 491 422 422 385 332 268 257 256 267 260 329 Rest of South America 899 1002 1056 1092 1156 1141 1180 1200 1202 1218 1285 1385Oceania, total 667 639 694 732 747 761 771 750 703 730 761 773Stateless and unknown
210 310 634 781 879 913 812 822 479 402 412 416
Per cent of total population
3.2 3.4 3.5 3.6 3.8 3.8 3.7 3.6 3.6 3.7 4.0 4.1
Source: Statistics Norway (2001, and previous issues).
Table 25. Naturalisations by previous citizenship. 1986-2000.
Annual averagePrevious 1986-citizenship 1990 1991 1992 1993 1994 1995 1996 1997 1998 1999 2000Total 3520 5055 5132 5538 8778 11778 12237 12037 9244 7988 9517Europe, total 919 919 973 1213 1773 1891 1591 1851 1737 2434 3586 Denmark 168 108 108 119 187 102 91 143 149 158 170 Sweden 98 103 108 153 150 130 112 167 154 241 246 Bulgaria 10 16 26 25 38 49 50 48 38 21 21 Germany 59 40 46 56 59 45 41 63 55 73 74 Poland 168 234 215 265 275 374 267 282 192 209 196 Romania 5 12 12 9 26 47 72 114 90 91 70 Russia . . 3 3 8 12 34 76 93 102 222 Ukraine . . - - - - 2 6 9 3 7 United Kingdom 88 93 107 106 136 110 162 142 129 94 104 Yugoslavia 102 140 201 275 659 754 554 520 560 1176 1322 Rest of Europe 221 173 147 202 235 268 206 290 268 266 1154 EU 12 421 324 330 371 485 358 375 453 414 388 423 EU 15 572 466 467 579 688 526 522 649 599 686 725Africa, total 231 489 506 642 890 1758 1680 1529 1540 1077 704 Morocco 109 280 299 275 257 248 318 294 154 90 131 Rest of Africa 122 209 207 367 633 1510 1362 1235 1386 987 573Asia, total 1956 3113 3164 3115 5314 6755 7936 7433 5210 3801 4697 China 30 76 95 149 148 235 383 348 279 315 156 India 127 166 220 242 251 346 313 274 157 232 188 Pakistan 484 778 1054 664 616 997 1530 1583 1097 106 1077 Philippines 199 235 298 213 243 343 315 360 155 199 157 South Korea 182 95 107 105 135 121 122 109 146 144 113 Turkey 212 474 238 393 752 793 836 837 705 170 523 Viet Nam 576 1082 931 746 710 727 1446 1276 781 651 738 Rest of Asia 146 207 221 603 2459 3193 2991 2646 1890 1984 1745North America, total 97 84 80 97 125 119 135 152 135 139 139
53

USA 44 49 44 67 56 45 69 65 63 60 54
Rest of North America 53 35 36 30 69 74 66 87 72 79 85South America, total 297 435 392 445 621 1173 794 667 487 450 330
Chile 89 82 81 117 310 923 531 416 240 252 156 Colombia 154 270 221 217 204 143 144 130 111 110 72 Rest of South America 53 83 90 111 107 107 119 121 136 88 102Oceania, total 7 4 7 5 11 6 10 18 4 10 12Stateless and unknown
14 11 10 21 44 73 80 387 131 77 49
Sources: Statistics Norway (2000, and previous issues)
Table 26a. Existing marriages 1) by country of birth of the partners. 1 January 2001.
Wives Husbands Total Norway Europe Africa Asia North
AmericaSouth
AmericaOceania Not
knownTotal 856113 772710 38012 4971 23577 4948 2099 294 9502Norway 781372 744118 22618 960 6338 4213 1044 231 1850Europe 34344 18168 13696 104 380 210 99 23 1664Africa 6357 1603 174 2919 75 14 11 1 1560Asia 22532 1941 363 98 15920 26 16 2 4166North America
4148 3383 227 10 44 378 23 7 76
South America
1715 587 57 6 6 25 858 - 176
Oceania 308 242 21 1 6 4 1 23 10Not known
5337 2668 856 873 808 78 47 7 -
Source: Unpublished data from Statistics Norway
1) Marriages where at least one of the partners were a resident of Norway.
Table 26b. Marriages contracted in 2000 by citizenship of bride and bridegroom.
54

WivesHusbands Total Norway Rest of
EuropeAfrica Asia North
AmericaSouth
AmericaOceania Not
knownTotal 26763 22616 1825 213 1221 224 155 14 495Norway 23901 20556 1395 135 1062 211 126 11 405Rest of Europe
1561 1112 372 9 20 6 9 1 32
Africa 242 162 12 54 1 1 - 1 11Asia 427 252 15 5 114 - - - 41North America
202 190 5 - - 5 - - 2
South America
82 60 1 - - 1 17 - 3
Oceania 30 27 1 - 1 - - 1 -Not known
318 257 24 10 23 - 3 - 1
Source: Statistics Norway 2001
Table 26c. Divorces 2000 by citizenship.
Wives Husbands Total Norway Rest of
EuropeAfrica Asia North
AmericaSouth
AmericaOceania Not
knownTotal 10475 9583 418 85 201 72 35 6 75Norway 9533 8910 298 56 145 64 25 5 30Rest of Europe
506 370 92 1 8 1 1 1 32
Africa 97 77 1 16 - - - - 3Asia 136 80 2 - 44 - - - 10North America
88 75 4 - 1 7 1 - -
South America
33 25 1 - - - 7 - -
Oceania 4 4 - - - - - - -Not known
78 42 20 12 3 - 1 - -
Source: Statistics Norway 2001
55

Table 27. Children born 1987-1989, 1996-2000 by country of birth of the parents 1).
Country of birth of parents
Number of children
1987 1988 1989 1996 1997 1998 1999 2000Total 54 027 57 526 59 303 60 927 59 801 58352 59298 59234Both parents born in Norway
48 252 50 837 52 048 51 575 50 445 48 794 49276 48272
Both parents born abroad 1 704 2 063 2 342 3 549 3 635 3 774 4207 4605Of which born in: Denmark 68 65 74 88 73 71 90 82 Sweden 45 53 56 94 111 127 202 183 Bosnia-Herzegovina 2 1 - 192 150 131 133 141 Bulgaria - - 2 2 2 9 2 6 Romania 1 1 4 3 5 4 8 6 Russia . . . 7 11 18 16 22 Ukraine . . . 4 3 3 3 3 United Kingdom 73 63 76 64 59 72 67 48 Yugoslavia 30 62 83 163 142 173 245 424
56
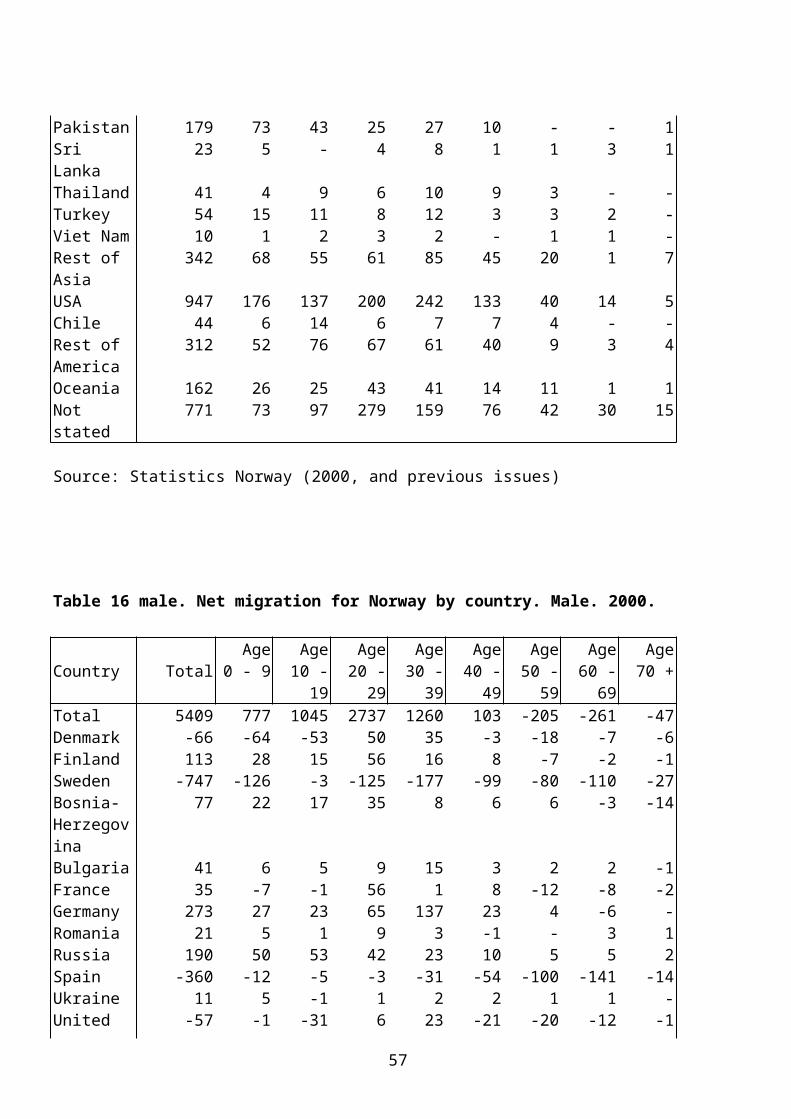
China 8 23 22 67 53 52 46 52
Iran 25 50 80 112 118 122 145 183 Iraq 2 12 15 97 132 160 203 310 Pakistan 476 485 527 506 526 530 521 488 Turkey 2 146 170 243 250 253 272 254 Viet Nam 153 193 204 329 318 276 278 354 Somalia 7 12 44 243 265 278 307 357 USA 59 51 48 44 46 46 38 31One parent born abroad 4 071 4 626 4 913 5 803 5 721 5 784 5815 6357Of which born in: Denmark 482 556 540 620 629 517 569 536 Sweden 629 734 713 1 024 1 046 1 083 1038 1128 Bosnia-Herzegovina 3 2 1 29 23 26 34 38 Bulgaria 15 17 29 28 15 24 19 28 Romania 4 5 5 30 32 40 28 31 Russia . . . 50 56 51 86 129 Ukraine . . . 12 5 6 9 16 United Kingdom 362 423 421 411 405 410 381 444 Yugoslavia 30 43 50 66 70 63 70 52 China 13 7 8 20 22 15 13 27 Iran 13 35 36 108 88 96 87 81 Iraq 2 8 5 21 17 25 22 35 Pakistan 37 47 45 68 80 88 118 127 Turkey 40 53 73 76 75 86 111 114 Viet Nam 37 34 47 58 51 64 68 67 Somalia 1 4 5 31 14 29 46 24 USA 534 571 570 647 531 539 531 517
1) Country of birth of the mother, if she is born abroad, else country of birth of the father
Source: Vassenden and Østby (1989), unpublished data from Statistics Norway
Table 28a. Total fertility rate 1) (TFR) by age 2) and country of background 3). Foreign country background concerns first generation immigrants without Norwegian background 4).
Country of background 1994-1995 1999-2000
The whole population 1.87 1.84Norway 5) 1.83 1.80Foreign countries, total 2.57 2.37Nordic countries 2.15 1.85
57

Western Europe excl. Turkey 1.88 1.90Eastern Europe 2.29 1.94North America and Oceania 1.77 1.92Asia, Africa, America excl. USA and Canada, Turkey
2.93 2.80
Western countries 6) 2.02 1.87Non-Western countries 2.79 2.58
Source: Statistics Norway
1) Total fertility rate (TFR) is the total of 5-year age-specific fertility rates 15-44 years, multiplied with 5.2) Age at the end of the year of birth. 3) Country background is one's own, mother's or father's country of birth if foreign born, else it is Norway.4) Born abroad by two foreign born parents. 5) For persons with Norway as country of background only age are taken into consideration, and not immigration age.6) Western Europe excl. Turkey, and North America and Oceania.
Table 28b. Fertility among women of age 35-44, by country of background. 1 January 1996, 1999 and 2000.
1996 1) 1999 1) 2000 1)Country of background
Number of
women
Average number
of children
Percentage
Number of
women
Average number
of children
Percentage
Number of
women
Average number
of children
Percentage
born in Norwa
y
with 4+ childre
n
born in Norwa
y
with 4+ childre
n
born in Norwa
y
with 4+ childre
n
Norway 286783 2,01 99 7 289534 2,01 97 7 291194 2,01 97 7
58

Denmark 1369 1,78 74 6 1487 1,80 76 6 1513 1,83 77 7Finland 646 1,66 81 5 766 1,47 72 4 818 1,42 70 3Iceland 318 2,14 56 9 431 2,13 43 11 444 2,18 41 13Sweden 1463 1,61 73 5 1939 1,58 69 5 2037 1,60 70 5Bosnia- Hercegovina
1085 1,83 3 4 1114 1,94 10 5 1137 1,96 13 5
France 181 1,93 54 8 183 1,92 66 7 194 1,93 67 8Germany 657 1,80 78 8 752 1,71 74 8 811 1,67 69 7Netherland 342 1,98 77 11 351 1,88 72 9 344 1,95 71 10Poland 1051 1,37 60 2 1149 1,42 65 2 1145 1,42 66 2Russia 152 0,95 17 1 385 1,01 24 1 510 1,00 23 -UK 843 1,84 73 7 790 1,85 69 7 781 1,83 70 7Yugoslavia 645 2,56 33 24 714 2,78 31 31 1113 2,85 23 33
Marocco 242 3,49 65 50 320 3,13 72 43 337 3,09 74 42Somalia 158 3,73 23 50 298 3,86 29 55 400 3,87 34 56
China 317 1,32 47 3 407 1,38 55 2 427 1,38 60 2India 484 2,10 80 9 518 2,09 82 8 527 2,09 81 8Iran 578 2,19 22 11 802 2,17 28 11 889 2,19 29 11Iraq 117 3,53 6 20 233 3,36 17 43 339 3,42 16 44Pakistan 1212 3,69 74 54 1330 3,66 72 54 1364 3,62 73 54Philippines 1036 1,59 74 5 1216 1,64 76 5 1297 1,61 77 6Sri Lanka 423 2,07 47 10 679 2,12 60 9 750 2,09 66 8Thailand 579 1,30 56 4 770 1,28 59 4 879 1,31 60 4Turkey 445 3,14 45 38 538 2,96 54 34 599 2,84 58 30Viet Nam 916 2,91 46 35 1102 2,74 57 32 1150 2,66 62 29
USA 806 1,73 66 6 804 1,81 62 7 770 1,80 67 7
Chile 574 2,20 36 10 683 2,29 45 11 690 2,30 48 11
Source: Unpublished data from Statistics Norway
1) Females 35-44 years by the number of children and country of background (mother's or father's foreign country of birth). Foreign country of background concerns first generation immigrants without Norwegian background i.e. born abroad by two parents born abroad.
Table 29. Total number of pupils and minority language pupils in primary and lower secondary schools. 1990-2000.
1990 1991 1992 1993 1994 1995 1996 1997 1998 1999 2000TOTAL:Total 473078 467501 463309 466605 470774 477236 486242 556764 567265 578084 588515
59

Primary 309432 308516 307461 309889 314062 320752 330619 401652 411878 419805 426475Lower secondary
163646 158985 155848 156716 156712 156484 155623 155112 155387 158279 162040
OF WHICH MINORITY LANGUAGE PUPILS 1):
Total 17319 18939 20932 21614 24428 25911 28217 32850 35945 38587 39584 2)
Primary 12551 13736 15104 15243 17133 18334 19957 24217 26605 28735Lower secondary
4768 5203 5828 6371 7295 7577 8260 8633 9340 9852
PER CENT MINORITY LANGUAGE PUPILS 1):
Total 3,7 4,1 4,5 4,6 5,2 5,4 5,8 5,9 6,3 6,7 6,7 2)Primary 4,1 4,5 4,9 4,9 5,5 5,7 6,0 6,0 6,5 6,8Lower secondary
2,9 3,3 3,7 4,1 4,7 4,8 5,3 5,6 6,0 6,2
1) Minority language pupils defined as pupils speaking another mother tongue than Norwegian (or Sami) at home. The number of pupils speaking Swedish or Danish at home is underestimated.
2) There has been no classification of pupils according to class levels since year 1999.
60

Table 30. Persons born in Norway, emigrated 1975-2000, and not returned by 1 January 2001.
Born in Norway Country of Total Without foreign With foreign Per cent
background background of theemigration emigrants
Number Per cent Number Per cent Number Per cent who hadleft left left foreign1999-2000 1999-2000 1999-
2000background
Total 76024 22 66839 23 9185 18 12
Denmark 10126 25 9125 26 1001 14 10Finland 738 21 493 23 245 17 33Iceland 724 24 332 31 392 19 54Sweden 20018 20 19159 20 859 24 4Belgium 740 31 678 33 62 13 8Bosnia-Herzegovina
65 26 23 26 42 26 65
France 1580 20 1293 23 287 9 18Germany 2814 18 2648 18 166 13 6Greece 395 19 380 19 15 7 4Italy 661 20 616 21 45 13 7Netherlands 1305 20 1112 22 193 12 15Russia 60 38 51 33 9 67 15Spain 4598 33 4503 33 95 31 2Switzerland 1033 18 981 18 52 12 5United Kingdom 6840 24 5662 26 1178 13 17Tanzania 150 35 126 40 24 13 16China 151 48 121 54 30 23 20Japan 266 19 212 22 54 9 20Pakistan 710 30 40 18 670 31 94Saudi-Arabia 210 32 201 32 9 22 4Singapore 434 30 417 31 17 6 4Canada 1400 14 1241 14 159 13 11USA 10513 18 9715 18 798 11 8Australia 1149 17 1025 17 124 11 11The rest 9255 26 6636 27 2619 21 28
Source: Statistics Norway, unpublished data 2001
61

Table 31. Employees of age 16-74 by region of birth and age.Per cent of total number of persons aged 16-74 in each group. 4th quarter 1990, 1998-2000.Employ-
eesEmployees who are first generation immigrants
Year, Age Total TotalNordic countries
Rest of WesternEurope
Eastern Europe
North-America and Oceania Asia 1) Africa
Latin-America
1990Total 54,8 43,4 55,2 48,2 41,6 35,6 36,7 33,8 38,116-24 years 41,6 27,4 42,7 24,2 24,6 7,7 27,6 20,9 24,425-54 years 70,2 48,8 63,1 54,1 47,3 44,2 40,7 36,9 41,755-74 years 31,1 33,2 38,3 32,8 29,4 30,7 20,6 36,9 28,1
1998Total 60,9 50,9 60,4 56,1 46,9 44,4 46,3 41,8 5516-24 years 47,9 38,4 54,7 30,9 33,5 17,5 37,5 30,9 34,225-54 years 74,4 57,2 69,1 63,4 55,8 55,8 50,5 45,3 62,255-74 years 34,3 32,8 38,2 41,8 22,3 24,3 22,4 24,3 34,4
1999 2)Total 61,3 50,9 62,5 57,2 45,3 43,7 46,1 41,5 54,316-24 years 48,4 39,2 59,9 32 33,3 13,9 38,6 30,3 34,925-54 years 74,8 57 71,2 64,8 53,6 55,1 50,1 45,4 61,155-74 years 35,5 33,2 39,1 42,4 21,6 24,9 22,6 24,5 36,5
2000Total 61,1 50,9 62,3 57 48,8 44,2 45,3 41,8 54,616-24 years 48,5 39,7 58,3 30,4 38,6 14,5 38,2 31,4 36,225-54 years 73,9 56,9 71,1 64,8 56,7 55,2 49,4 45,6 61,155-74 years 36,7 33,4 39,9 42,4 23 26,2 21,4 23,2 37,6
1 Turkey included2 Revised numbersSource: Statistics Norway, 2000.
62

Table 32. Employees of age 16-74 by region of birth, number of years of residence in Norway, sex and age. Per cent of total number of persons aged 16-74 in each group. 4th quarter 2000.
Sex, number of years of residence in Norway, age
Em-ployees
total
Employees who are first generation immigrants
Total Nordic count-ries
Rest of WesternEurope
East-Europe
North-America and Oceania
Asia 1) Africa Latin-America
MALES 63,3 54,7 62,5 63 53,2 49,9 49,8 47,3 59,616-24 years 48,3 41,4 57,6 35,4 41,8 16,1 40,7 34,3 36,525-54 years 75,9 60,6 70,2 68,7 62,1 61,1 54,2 51,2 67,555-74 years 39,6 36,9 40,1 50,2 28,4 29,1 26,3 28,1 41,6Stayed less than 4 years
46 65,1 56,4 40,8 42,3 32,1 37,9 44,5
16-24 years 36 60,1 34,5 35,8 15,4 29,5 24,4 2325-54 years 50,3 67,2 60,3 47 50,9 34,2 43,3 53,355-74 years 20,4 47,9 30,5 5,2 17,2 5,9 14 22,2Stayed 4-6 years 60,8 70,3 66,6 57,1 55,2 55,5 54,2 63,516-24 years 45,6 55 42,9 46,4 7,7 45,2 41,7 45,525-54 years 67,1 73,2 68,9 69,4 59,9 59,7 59,7 68,855-74 years 27,3 50,6 39,5 17,5 22,2 16,4 20 50Stayed 7 years and more
57,8 59,5 65,6 58,1 53,5 55,7 51,1 62,4
16-24 years 46 49,2 36 45,1 21,7 47,8 45,4 40,825-54 years 64,4 71,9 73,9 67 69,3 60,5 53,8 70,255-74 years 38,9 39,2 51,6 36 30,3 28,8 29,7 41,9
FEMALES 58,9 47,1 62,1 49,6 45,2 39,3 40,4 33,9 5016-24 years 48,8 38,2 58,8 25,8 35,9 12,9 35,8 28,5 35,925-54 years 71,8 53 71,9 59,1 52,6 49,5 44 36,9 55,455-74 years 33,9 30,4 39,8 35,7 18 24,3 15,7 15,4 33,7Stayed less than 4 years
36 66,2 41,3 28,7 26,3 21,6 21,2 32,4
16-24 years 31,9 60,8 23,5 24,8 11,9 19,3 18,6 22,425-54 years 39,3 69,4 46,9 33 32,1 24 23,3 36,455-74 years 12,6 57,5 18,6 5,4 8,8 3,8 2,4 16,7Stayed 4-6 years 49,1 69,9 53,9 49,9 43,7 40,5 31,5 48,416-24 years 40,9 48,3 26,5 47,3 25 36,2 32,9 41,525-54 years 53,7 72,5 57,2 59,7 47,3 42,4 32,1 50,355-74 years 14,5 63,8 36,7 7 20,8 8,8 3,3 25Stayed 7 years and more
51,9 58,9 51,8 55,3 43,9 47,5 45,6 55,9
63

16-24 years 46,6 50,9 33 45,5 11,5 48,1 48,1 4325-54 years 59,1 73,2 65,2 62,9 58,8 50,8 47,6 62,155-74 years 33 39 36 27,6 25,2 18,7 20,6 34,7
1) Turkey included.Source: Statistics Norway, 2000
Table 33. Unemployment rate (persons 16-74 years of age) by region of birth, and number of years of residence in Norway. Per cent of total number of persons aged 16-74 in each group.
End of November 1995, 1996, 1997, 1998, 1999 and 2000.
Year,Number of years of residence in Norway
Registered unemployed
total
Registered unemployed first generation immigrants
Total Nordic countries
Rest of WesternEurope
East-Europe
North-America and Oceania
Asia 1)
Africa Latin-America
1995Total 2,8 6,5 3,2 3,0 7,0 2,3 9,3 11,1 8,5 Stayed less than 4 years
5,6 3,8 2,5 7,0 1,5 7,2 6,7 6,2
Stayed 4-6 years
9,8 3,8 3,1 10,2 2,4 11,4 14,0 9,8
Stayed 7 years and more
6,1 3,0 3,1 6,1 2,6 9,3 11,7 8,6
1996Total 2,5 6,2 2,8 2,7 8,6 2,1 8,4 10,6 7,1Stayed less than 4 years
5,9 3,3 2,6 9,3 1,7 6,6 5,8 3,8
Stayed 4-6 years
9 3,7 2,6 11,2 2,7 10,2 12,9 9,1
Stayed 7 years and more
5,8 2,6 2,8 6,5 2,2 8,3 11,7 7,4
1997Total 1,8 4,9 2 2 6,9 1,6 6,5 8,4 5,8Stayed less than 4 years
4 2,1 2,3 7,1 1,3 4,7 4,8 4,4
Stayed 4-6 years
7,5 2,7 2 9,2 2,7 8,5 10 8,1
64

Stayed 7 years and more
4,6 1,9 1,9 5,1 1,6 6,6 9,2 5,9
1998Total 1,6 3,9 1,7 1,5 5,6 1,5 5,1 7 4,3Stayed less than 4 years
2,9 1,9 1,5 4,5 1,4 3,6 4,5 2,4
Stayed 4-6 years
6 1,6 1,8 7,8 2 6,5 8,1 4,8
Stayed 7 years and more
3,8 1,6 1,5 4,3 1,5 5,2 7,8 4,6
1999Total 1,8 4,2 1,9 2,2 5,5 2 5,3 6,7 5,2Stayed less than 4 years
3,4 2,1 2,2 4,6 2 4,2 4,3 4,2
Stayed 4-6 years
5,9 1,9 3,2 7,3 2,5 6,9 7,8 4,6
Stayed 7 years and more
4,2 1,8 2,1 4,7 1,8 5,4 7,6 5,5
2000Total 1,8 4,4 2,0 2,2 5,4 1,9 5,5 7,1 5,6Stayed less than 4 years
4,1 2,4 2,3 4,3 1,4 5,4 6,4 4,7
Stayed 4-6 years
5,3 2,2 2,5 6,9 2,0 6,6 7,0 5,4
Stayed 7 years and more
4,3 1,8 2,1 5,4 2,1 5,4 7,6 5,9
Males 2,1 5,3 2,7 2,7 6,5 2,2 6,4 8,9 7,2Stayed less than 4 years
4,8 2,6 2,3 4,6 1,7 6,9 8,3 5,4
Stayed 4-6 years
6,1 2,8 3 8,6 1,7 7,3 9,1 7,2
Stayed 7 years and more
5,5 2,8 2,9 6,6 2,6 6,2 9,1 7,6
Females 1,5 3,3 1,4 1,5 4,4 1,6 4,4 4,3 4,1Stayed less than 4 years
2,8 1,8 1,9 3,8 0,9 3,2 3,5 3,6
Stayed 4-6 years
4,8 1,9 2 5,7 2,5 6,2 5,5 4,3
Stayed 7 years and
3,2 1,1 1,4 4,3 1,8 4,5 4,7 4,3
65

more
1) Turkey included.
Source: Statistics Norway, 2000
Table 34. Naturalisation 2000, as per cent of number of persons having stayed in Norway longer than seven years. Selected nationalities.
Number of citizens Obtained Norwegianin Norway 1.1.2000 citizenship in 2000
Country Stayed Per cent Total longer than Total of 7+
7 yearsDenmark 19 205 13 657 170 1,24Finland 5 731 2 546 49 1,92Sweden 25 136 10 385 246 2,37Bulgaria 355 55 21 38,18Germany 6 707 3 414 74 2,17Poland 2 042 921 196 21,28Romania 480 44 70 159,09Russia 2 749 85 222 261,18Ukraine 231 6 7 116,67United Kingdom 11 367 7 458 104 1,39Yugoslavia 10 249 2 324 1322 56,88Euro 15 78 482 42 815 725 1,69Ethiopia 843 210 59 28,10Morocco 1 380 517 131 25,34Somalia 4 844 683 332 48,61Turkey 3 481 1 347 523 38,83China 1 269 358 156 43,58India 2 203 1 373 188 13,69Iran 3 683 1 056 481 45,55Iraq 5 790 665 524 78,80Pakistan 7 363 4 352 1077 24,75Sri Lanka 3 405 1 435 454 31,64Thailand 2 381 756 142 18,78Viet Nam 2 452 1 387 738 53,21USA 8 325 5 545 54 0,97Chile 2 433 2 207 156 7,07Colombia 260 73 72 98,63
Source: Statistics Norway 2001
66

Table 35. Persons with foreign background. 1 January 2001.
Foreignback-
ground,total
Immigrant population Other immigrant backgroundCountry of Born
abroadwith bothparents
bornabroad
Born inNorway
with bothparents
bornabroad
Bornabroad
with oneparentborn
abroad
Born inNorwaywith oneparentborn
abroad
Bornabroad
with bothparentsborn inNorway
background Total Total Adoptedabroad
Total 505868 297731 249904 47827 208137 14161 23143 153006 17827Europe, total 269583 135008 124383 10625 134575 786 16742 107458 9589Nordic countries 127566 53480 50526 2954 74086 174 9425 58091 6396Of witch: Denmark 48731 19049 17728 1321 29682 45 3158 25459 1020 Finland 12658 6776 6434 342 5882 12 360 5453 57 Sweden 58093 23010 22100 910 35083 108 5567 24194 5214Rest of Europe 142017 81528 73857 7671 60489 612 7317 49367 3193Of witch: Bosnia- 13186 12944 11775 1169 242 - 13 229 - Herzegovina Bulgaria 1382 842 805 37 540 2 12 490 36 France 5219 2350 2241 109 2869 5 438 2183 243 Germany 23073 9448 8923 525 13625 66 1924 10880 755 Nederlands 8348 3848 3388 460 4500 6 526 3724 244 Poland 9689 6432 5698 734 3257 38 151 3054 14 Romania 1621 1054 987 67 567 149 9 408 1 Russia 4524 3749 3662 87 775 149 49 565 12 Ukraine 466 399 379 20 67 1 2 64 - United Kingdom
29604 10925 10342 583 18679 27 2736 14873 1043
Yugoslavia 17063 15469 13001 2468 1594 4 20 1567 3Africa, total 38654 29568 23118 6450 9086 320 669 6784 1313Of witch:
67

Marocco 7100 5719 3870 1849 1381 4 22 1347 8
Somalia 10318 10107 7905 2202 211 2 2 207 -Asia, total 139162 112590 83694 28896 26572 8746 1310 15319 1197Of witch: China 5341 3654 3043 611 1687 756 37 799 95 India 8277 6140 4103 2037 2137 1007 64 965 101 Iran 12230 11016 9645 1371 1214 20 30 1148 16 Iraq 12630 12357 11212 1145 273 1 14 256 2 Pakistan 24915 23581 13554 10027 1334 14 20 1294 6 Philippines 10059 5885 5105 780 4174 522 315 3307 30 South Korea 6495 393 362 31 6102 5570 92 394 46 Sri Lanka 11043 10335 7292 3043 708 160 23 518 7 Turkey 12355 10990 7507 3483 1365 6 30 1321 8 Viet Nam 16804 15880 11231 4649 924 188 28 690 18North America , total
37834 10119 9715 404 27715 640 3604 18323 5148
Of witch: USA 30059 7253 7014 239 22806 247 2945 15192 4422South America, total
18167 9547 8127 1420 8620 3664 530 4050 376
Of witch: Chile 8641 6491 5300 1191 2150 150 67 1905 28 Colombia 3823 604 551 53 3219 2828 61 301 29Oceania, total 2468 899 867 32 1569 5 288 1072 204
Source: Statistics Norway 2001
68