sop 29v5 clay mineralogyfinal 25 naoci ... who wrote the first version of the clay-lab manual, ......
TRANSCRIPT

Questa Rock Pile Stability Study 29v5 Page 1
Rev. 29v5 10/30/2008
Standard Operating Procedure No. 29
Clay Mineralogy
REVISION LOG
Revision Number Description Date
29.0 Original SOP 10/23/03
29.1 Incorporated comments from Sidga 11/13/03
29.2 Revisions by PJP 1/14/04
29.3 Comments-GMLR 01/17/04
29.4 Attached Mineral Resource’s Clay Laboratory Manual 8/23/04
29v5 Simplified instructions for NMT Clay Lab - KMD 1/25/07
29v5 LMK reviewed changes, did minor edits, finalized SOP and sent to Jack Hamilton to post on project website
1/29/07
1. PURPOSE AND SCOPE This Standard Operating Procedure describes the method for determining clay mineralogy. 2. RESPONSIBILITIES AND QUALIFICATIONS The Team Leader and Characterization Team will have the overall responsibility for implementing this SOP. They will be responsible for assigning appropriate staff to implement this SOP and for ensuring that the procedures are followed. All personnel performing these procedures are required to have the appropriate health and safety training. In addition, all personnel are required to have a complete understanding of the procedures described within this SOP, and receive specific training regarding these procedures, if necessary. All environmental staff and assay laboratory staff are responsible for reporting deviations from this SOP to the Team Leader.
Questa Rock Pile Stability Study 29v5 Page 2
Rev. 29v5 10/30/2008
3. DATA QUALITY OBJECTIVES Determine how the clay-mineralogy influences the rock pile stability. 4. RELATED STANDARD OPERATING PROCEDURES The procedures set forth in this SOP are intended for use with the following SOPs: 1 Data management (including verification and validation) 2 Sample management (chain of custody) 4 Taking photographs 5 Sampling outcrops, rock piles, and drill core (solid) 6 Drilling, logging, and sampling of subsurface materials (solid) 7 Decontamination of sampling equipment The procedures set forth in this SOP also are intended for use with the drill plans and sampling plans. 5. EQUIPMENT LIST The following materials are required for prepare sample for XRD-Clay Mineral Analysis: • Oven • Jaw crusher • Jones splitter • Weighing balance (up to 400gm with accuracy of 0.02gm) • Volumetric beakers (100, 500, 1000mL) • Pipette or eye-dropper • Glass slides • Centrifuge with sample vials • Indelible marker • Mixer The following materials are required for analyzing samples in the X-Ray Diffraction (XRD) machine: • XRD machine • Disk, computer and spreadsheet software 6. COLLECTION OF SAMPLES Fine-grained size samples will be collected according to SOP 5.
Questa Rock Pile Stability Study 29v5 Page 3
Rev. 29v5 10/30/2008
7. PROCEDURES These are the simplified instructions from the attached clay manual. 1. Add approximately 20gm of sample to a 100ml beaker and fill with distilled water. 2. Mix and wait 5 min. Remix, wait 15 sec, and pour suspension into a properly labeled
beaker. Allow the beaker and its content to stand for 10 minutes. 3. If the entire sample does not stay in suspension for 10 minutes, stir the sample and
pour it into a centrifuge vial. 4. Place four centrifuge vials in the machine to balance the load. Set the speed to the
maximum and the time to 5 minutes. 5. Once the centrifuge has turned off, decant the water from the sample into a waste
water bucket or beaker. 6. Add more DI water to the vial to wash the sample. Stir the sample until the clay
sample is in solution. 7. Repeat steps 4 and 5 for a total of 5 sample washing cycles. 8. After the final washing cycle, add DI water and pour into a small beaker. Wait 10
minutes to see if the entire sample stays in suspension. 9. If the sample does not stay in suspension add 3 to 5 drops of Calgon® to the sample
and re-stir the sample. Wait 10 minutes. 10. If the sample does not stay in suspension repeat steps 4 – 9 again for another 5 cycles
and add a few more drops of Calgon®. 11. Label two glass slides with the sample number and. After the sample has remained in
suspension for 10min touch the eye-dropper or 2ml pipette to the surface and draw off enough material to cover a glass slide.
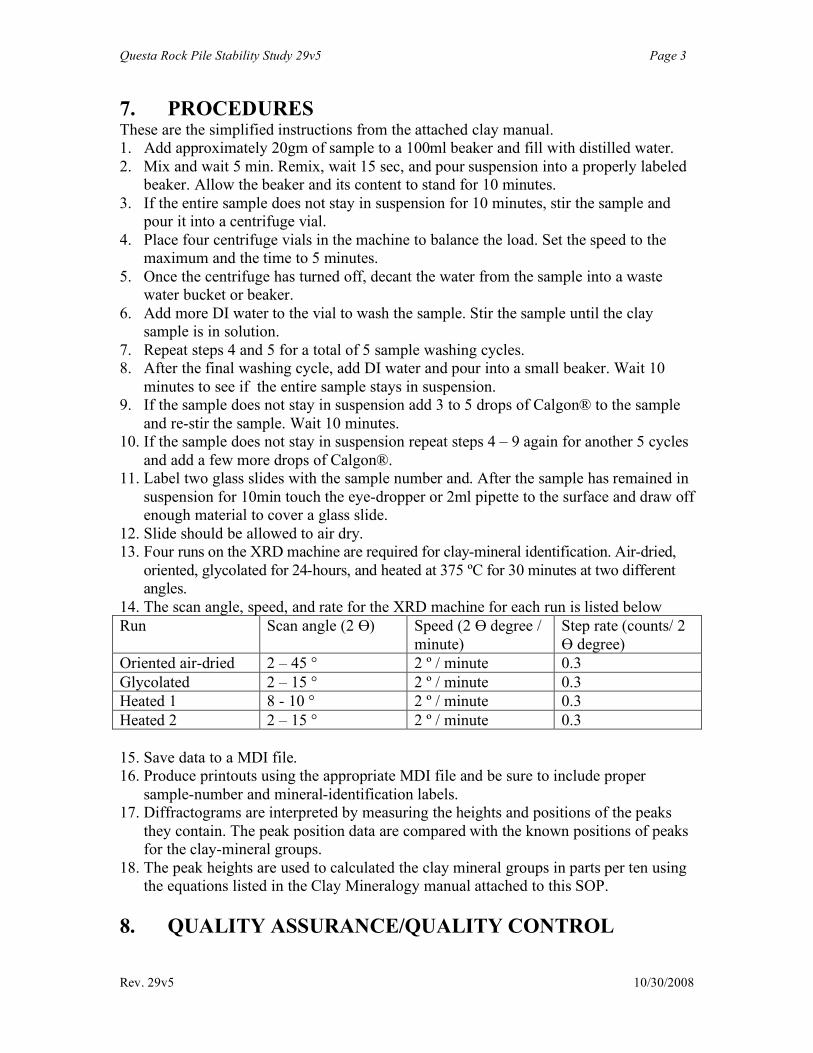
12. Slide should be allowed to air dry. 13. Four runs on the XRD machine are required for clay-mineral identification. Air-dried,
oriented, glycolated for 24-hours, and heated at 375 ºC for 30 minutes at two different angles.
14. The scan angle, speed, and rate for the XRD machine for each run is listed below Run Scan angle (2 Ө) Speed (2 Ө degree /
minute) Step rate (counts/ 2 Ө degree)
Oriented air-dried 2 – 45 ° 2 º / minute 0.3 Glycolated 2 – 15 ° 2 º / minute 0.3 Heated 1 8 - 10 ° 2 º / minute 0.3 Heated 2 2 – 15 ° 2 º / minute 0.3 15. Save data to a MDI file. 16. Produce printouts using the appropriate MDI file and be sure to include proper
sample-number and mineral-identification labels. 17. Diffractograms are interpreted by measuring the heights and positions of the peaks
they contain. The peak position data are compared with the known positions of peaks for the clay-mineral groups.
18. The peak heights are used to calculated the clay mineral groups in parts per ten using the equations listed in the Clay Mineralogy manual attached to this SOP.
8. QUALITY ASSURANCE/QUALITY CONTROL

Questa Rock Pile Stability Study 29v5 Page 4
Rev. 29v5 10/30/2008
Check for flocculation(particles sticking together and acting as larger particles; this is what Calgon® prevents). It is important because flocculation destroys the preferred orientation of the clay particles. Duplicate samples will be run. 9. DOCUMENTATION Diffractograms will be stored electronically and available upon request. Clay mineral analyses in parts per ten will be compared with the bulk chemistry and petrographic analyses to determine if they are reasonable. Data are recorded in the database. 10. REFERENCES Hall, J. S., New Mexico Bureau of Mines and Mineral Resource’s Clay Laboratory Manual

Questa Rock Pile Stability Study 29v5 Page 5
Rev. 29v5 10/30/2008
APPENDIX 1. FORM

Questa Rock Pile Stability Study 29v5 Page 6
Rev. 29v5 10/30/2008
APPENDIX 2. Mineral Resource’s Clay Laboratory Manual
New Mexico Bureau of Mines and Mineral Resource's Clay Laboratory Manual

Questa Rock Pile Stability Study 29v5 Page 7
Rev. 29v5 10/30/2008
Contents INTRODUCTION...........................................................................................................…1
1. SAMPLE PREPARATION…….....................................................................................2
Theory 3
Splitting 3
Drying 4
Weighing 4
Sample Preparation 5
Standard Procedures 5
Splitting 6
Drying 7
Weighing 8
Special Procedures 8
Sample Preparation 9
Splitting 9
2. PARTICLE SIZE ANALYSIS…………......................................................................11
Theory 11
Standard Analysis Procedure 14
Special Procedures 19
Particle-Size Analysis in which Trace Element Analysis Will Be Performed 20
Samples That Persistently Flocculate 21
Well-indurated and/or Carbonate Cemented Samples 21
Chemically Treated Samples 22
Samples That Contain Sulfur 22
3. LEACHING ANALYSES ................................................................................…......24
Theory 24
EDTA 24
HCI 25
NAOCI 26

Questa Rock Pile Stability Study 29v5 Page 8
Rev. 29v5 10/30/2008
Standard Procedures 26
EDTA 27
HCI 29
NAOCI 31
4. CLAY-MINERAL ANALYSIS……......................................................................…..33
Theory 33
Clay-Mineral Structure 33
X-ray Diffraction 40
Standard Procedure 42
Making slides 42
Running Slides on The XRD Machine 43
Interpreting Diffractograms and Performing Semiquantitative Calculations 47
Special Procedures 53
Curlers and Peelers/Flocculation 53
Making Slides with Small Amounts of Sample 54
Alternate Method for Preparing Slides 54
Additional Helpful Techniques 54
5. BULK-MINERAL ANALYSIS. ..........................................……............................... 57
Theory 57
Mineral Structure 57
XRO Using Randomly-Oriented-Powder Mounts 59
Standard Procedures 59
Sample Preparation and Running Samples on the XRD Machine 59
Interpreting Diffractograms 62
Special Procedure 63
REFERENCES.............................................................................................….............…65

Questa Rock Pile Stability Study 29v5 Page 9
Rev. 29v5 10/30/2008
Acknowledgments
It must be recognized that all human endeavors are made possible by the experiences made available to, and sought out by, us collectively and individually; therefore, it is appropriate that I thank those who provided me with the opportunity to make this manual possible.
My first acknowledgment goes to Tanya Baker (Brickle) who wrote the first version of the Clay-lab manual, Without her help, I don't think I would have gotten past my first set of particle-size analyses. I thank George Austin for his help and patience in reviewing this manual and for making many opportunities available to me throughout my undergraduate studies. I am also indebted to many of the staff of the New Mexico Bureau of Mines and Mineral Resources as well as the student workers (Lab Rats) for their suggestions and assistance on various projects as well as this manual. Also, I must thank the New Mexico Bureau of Mines and Mineral Resources for funding me to write this manual.
John S. Hall
Questa Rock Pile Stability Study 29v5 Page 10
Rev. 29v5 10/30/2008
Introduction
This manual is intended for student employees and clay-mineralogy students working at the New
Mexico Bureau of Mines and Mineral Resource's clay laboratory. It will describe the standard
analyses, procedures, and techniques, as well as the principles behind them that are used in the Clay
Lab. Additionally; it will give variations to these analyses, procedures, and techniques for dealing with
special circumstances and difficult samples.
This manual is divided into five major chapters based on the general type of analysis being made or
general-sample-preparation procedures. Chapter 1 deals with general sample preparation procedures
used in some or all of the following chapters. Chapter 2 describes particle-size analysis for determining
the percentages of clay, silt, and sand-sized particles in a sample. Chapter 3 is concerned with the three
types of leaching analyses performed to remove organics and determine the amounts of carbonate and
sulfate minerals in a sample. Chapter 4 deals with XRD (x-ray diffraction)-clay-mineral analysis,
which is used to semiquantitatively determine the amounts of the five major groups of clay minerals.
Chapter 5 describes XRD-bulk- mineral analysis for the determination of the nonclay mineral phases
contained in a sample. Each of these chapters will be further divided into sections on theory standard-
analysis procedure, and special procedures (where necessary).
This manual is designed to provide step-by-step-standard procedures for each of the types of analyses
described. These can be followed nearly verbatim for perhaps the small majority of samples
encountered in the Clay Lab. However, many samples will be encountered for which this basic
procedure will prove inadequate and modifications will have to be made. The reason for this is usually
the nature and characteristics of the sample
1

Questa Rock Pile Stability Study 29v5 Page 11
Rev. 29v5 10/30/2008
involved of even the quantity of sample provided. When the standard procedures and techniques prove
inadequate, workers will find that they must rely on their creativity and ingenuity to modify the
procedure in a manner that allows results to be obtained that are both reproducible and have a
reasonable degree of validity. Some of the procedures in this manual, in addition to the alternate
procedures and suggestions given, are the result of modifications that have been used in this lab to deal
with difficult samples. Clay-lab workers will find them useful; however, these modifications are not
completely comprehensive and they have their limitations. With this in mind, workers will be able to
come up with additional modifications and improvements to the procedures as required.
Clay-lab work has been described as being both an art and a science. This is due to its heavy reliance
upon techniques in which skill must be developed in order to perform them adequately. Additionally,
there are numerous instances when one must use his or her judgment to determine the best course of
action. Experience is often your best guide to know if an experiment has reached completion or if it is
practical to perform a given analysis on a particular sample. A further purpose of this manual is to help
workers gain this experience and develop an understanding of the limits of the procedures and
techniques presented as well as those that they may create and modify on their own.
2
Questa Rock Pile Stability Study 29v5 Page 12
Rev. 29v5 10/30/2008
Chapter 1: Basic Procedures and Sample Preparation
THEORY
All of the analyses presented in this manual have the following requirement:
The sample fraction used in the analysis must be representative of the entire sample delivered to the
lab. Additionally, the sample will be subjected to a gravimetric-analysis procedure in the cases of
particle-size analysis and leaching. Because these requirements are so basic to the successful outcome
of the analyses, the procedures used to achieve them will be discussion separate from the analyses.
These procedures are the splitting, drying, and weighing of samples.
SPLITTING
The basic objective of splitting samples is to take a smaller representative sample for analysis from the
larger sample that is delivered to the lab. In turn, the larger sample is assumed to be representative of
the site from which it was taken. The smaller representative sample is obtained by a process of
homogenization through blending and then systematically splitting the sample into smaller fractions in
a manner that maintains the homogeneity of the sample down to the size required.
Particle or fragment size is a major factor to consider. A sample with sand-sized particles can be split
down to a smaller size than a sample with larger particles (i.e. pebble sized) and still be representative.
The reason for this is statistical with a weight of sand-sized particles having a larger sample population
size of grains compared to an equal weight of larger particles. Similarly, a sample with a small average
grain size but containing a scattering of larger particles or fragments also requires a greater
3

Questa Rock Pile Stability Study 29v5 Page 13
Rev. 29v5 10/30/2008
weight of sample to be representative. Larger particles or fragments scattered throughout a sample act
as outliers that will bias the sample splits. This makes reproducibility difficult as one split may contain
one or two pebble-sized particles and the other has none. A larger sample split must be used to get a
representative amount of these scattered particles or fragments.
DRYING
Drying will be required for samples that undergo a gravimetric analysis procedure as part of the lab
analysis (i.e. particle size or leaching tests). It is necessary to remove the pore water from the sample
split before the initial weighing. This is more accurate because the pore water would interfere with the
gravimetric analysis that requires dried products from the lab analysis. This also creates consistency
between analyses of different samples and between duplicate analyses of the same sample because all
samples will be run with essentially zero pore water.
WEIGHING
Weighing is a straightforward procedure theoretically; however, there are a few considerations that
need to be recognized when using a precision analytical balance that will make measurements to +/-
0.0002g. The first is that objects that are above (or below) the ambient room temperature will generate
convection air currents within the weighing chamber that will cause the balance's readout to drift
erratically. To prevent this, samples should be cooled to room temperature in a desiccant chamber
before weighing. Samples that have been previously dried will pick up moisture from the atmosphere
and therefore should be kept in the desiccant chamber until it is time to weigh them. It is normal for the
weight of the sample to increase slowly when it is sitting on the balance pan picking up moisture,
however
4

Questa Rock Pile Stability Study 29v5 Page 14
Rev. 29v5 10/30/2008
this is usually just a few ten thousandths of a gram in the 10 to 20 seconds it takes for the balance to
stabilize. If the weight decreases slowly, this is an indication that volatiles are being released from the
object being weighed. This can be the result of small water droplets evaporating on an improperly
dried beaker; therefore, it would be a good idea to investigate the situation if a decreasing weight is
encountered.
The mass of what is being weighed is also a factor that should be considered. For masses of one gram
and above, small variations and errors that may occur due to fingerprints on a beaker or minute bits of
debris being unwittingly added to or removed from the object being weighed will have little
significance. These changes would only be a few parts in 10,000 or perhaps 1000. However, a minute
induced error could easily be a few percent when only a few hundredths of a gram are weighed.
SAMPLE PREPARATION
The only initial sample preparation required to perform normal laboratory analyses is crushing and
containerizing. Then, providing the sample is adequately dry so it will not stick, it should be passed
through a small jaw crusher set to break the sample into pieces no larger than 0.5 inch in the longest
direction. If the sample is damp then it will have to be dried in an oven or under a heat lamp prior to
crushing. The crushed sample should be put into the appropriate labeled container. If the volume of
sample is too large for one container, use two or three as necessary.
STANDARD PROCEDURE
The following standard procedures will be used predominantly for splitting, drying, and weighing;
however, there are situations in which modifications must be made. The following section will
describe a couple of circumstances where this is necessary.
5

Questa Rock Pile Stability Study 29v5 Page 15
Rev. 29v5 10/30/2008
SPLITTING
Fig. 2.1. Jones splitter (riffle box).
1. Pour entire sample from lab storage container(s) into rectangular pan.
2. Place two rectangular pans under Jones splitter (riffle box; Fig. 2. 1)
3. Pour sample, in rectangular pan, through Jones splitter making sure that sample goes through all slot
openings of splitter simultaneously-not just a few in the middle. The best way to do this is to evenly
distribute the sample in the rectangular pan and pour into splitter over the widest side of the
rectangular pan that is no wider than the width of the Jones splitter This ensures an even split and
helps maintain homogeneity.
4. Reject one of the two splits by pouring it back into the lab storage container.
5. Take the remaining split and continue to repeat steps 3 and 4 until the two splits are of appropriate
weight for the analysis being performed (both splits of the final splitting process will be used where
samples are run in duplicate).
6

Questa Rock Pile Stability Study 29v5 Page 16
Rev. 29v5 10/30/2008
It is useful to retain the last split that would normally be rejected in a separate pan in case the final
two splits are too small. This way the entire sample need not be resplit again.
Note: Several different sizes of Jones splitters are available. The one in the Clay Lab is adequate for most
splitting operations, but for very small samples of sand-size grains or smaller, it is best to use a
microsplitter. Generally samples with fragment sizes up to 0.5 inches in the longest direction
should not be split to a weight less than 20gm. If these fragments are highly heterogeneous (i. a.
different types of primary particles), It is best to increase the size of the last split(s) to 30 to 40gm.
DRYING
The drying procedures used in the Clay Lab are simple and straightforward. Two procedures are used
depending on whether the entire uncrushed sample requires drying, or crushed and split samples are
prepared for a gravimetric analysis procedure.
In the first case the entire uncrushed sample will require drying because it is too damp, plastic, and
sticky to go through the jaw crusher. Usually a few hours in an oven or under a heat lamp will do.
In the second case, virtually all the pore moisture must be removed. The crushed and split samples are
placed in an oven at 105°C for at least one hour. One hour is sufficient because of the small size of the
sample split and the relatively small size of the fragments with their surface areas for evaporation.
7

Questa Rock Pile Stability Study 29v5 Page 17
Rev. 29v5 10/30/2008
WEIGHING
The balance that you use will depend on the weight of the sample to be weighed and the accuracy
required. For all gravimetric analyses performed in the clay tab, the analytical balance (up to 180 gm.
with accuracy of +/- 0,0002 gm.) is the best choice. For weighing out samples in bulk or balancing
centrifuge tubes, the courser balance (up to 400 gm. with accuracy of 0.02 gm.) is used. If necessary,
heavier balances for weighing bulk samples are available in other locations in the Bureau of Mines,
The procedure is the same in all cases:
1. Check to make sure balance is level (by looking at leveling bubble if so equipped) and that balance pan
is clean.
2. Turn balance on and wait for 0.0000 readout, If read" is different, press the tare bar to reset.
3. Place weighing container in center of balance pan and wait for reading to stabilize (usually 10 to 20
seconds).
4. Record weight and remove weighing container with sample.
Note: Never exceed the maximum weight limit of the balance, place sample directly on balance pan, or
leave object to be weighed on the balance for extended periods of time. Always make sure balance is
clean, level, and turned off after use. It is a good idea to periodically calibrate the balances; follow
the instructions in the appropriate instruction manual.
SPECIAL PROCEDURES
A few deviations from the basic procedures and sample preparation above may be required. Elemental
contamination is a concern for samples that will undergo trace element analysis. The trace elements
being analyzed for will define what is considered a contaminant.
8

Questa Rock Pile Stability Study 29v5 Page 18
Rev. 29v5 10/30/2008
This is to say that it a sample undergoing a trace-metal analysis includes Fe (iron), the sample should
not come into contact with any material or equipment made of Fe, especially in a crushing or grinding
operation. This idea holds for all trace elements being tested for. It would not be a concern for major-
element analyses since any contamination would be insignificant when compared to the concentrations
of the major elements in the sample.
SAMPLE PREPARATION
Preparation for samples undergoing trace-element analysis will be similar to conventional samples,
except one must be conscious of the types of materials used in the process. For instance, a sample that
requires drying before trace-element analysis for Fe should be dried in an aluminum pan or a pan lined
with aluminum foil rather than a steel pan. Additionally, the steel jaw crusher would not be used and
the sample would have to be crushed by hand with a mortar and pestle to the appropriate size, or for
softer samples, a rolling pin with the sample placed on a piece of waxed paper can be employed.
Another reason to avoid the jaw crusher when a trace-element analysis is being performed is that it is
difficult to got the crusher entirely clean and thus possibly contaminating samples with the residue of
previously crushed samples.
SPLITTING
The example of the trace-element analysis that includes Fe also can be used to modify the process of
splitting. Once again the steel of the Jones splitter (riffle box) makes it unsuitable for use and an
alternate method will be needed. The alternate method that works well is the con-and-quarter method
(Fig. 2.2, Head, 1980) as follows:
9

Questa Rock Pile Stability Study 29v5 Page 19
Rev. 29v5 10/30/2008
Fig. 2.2. Cone and quartering.
1. Mix sample thoroughly in pan.
2. Pour sample onto clean surface (i.e. waxed paper) to form a circular conical heap (if fragments are
small enough, poring samples through a large plastic funnel held by a ring stand is helpful).
3. With a straight edge, divide cons into four equal portions (Fig. 2.2)
4. Reject portions 8 and D-placing them in their lab sample container.
5. Mix portions A and C together and repeat steps 2 to 6 until last group of portions are of appropriate
size for the analysis being performed.
10
Questa Rock Pile Stability Study 29v5 Page 20
Rev. 29v5 10/30/2008
Chapter 2: Particle-size Analysis
The primary objective of performing particle-size analysis in the Clay Lab is to measure the weight
percent of sand-and-larger-, sift-, and clay-size particles in a sample. The size of the particles are
agreed upon by the geological community and by definition are set at the following values: sand and
larger size is >63 um (micrometers), silt-size is 163 um to 2 um, and clay-size is <2 um. This chapter
will cover the theories and practices concerned with the separation of a sample into its primary-particle
sizes.
THEORY
Two techniques are used for the separation of the different particle sizes in the Clay Lab. Sieving is
used to separate the sand-and-larger size particles from the whole sample and a sedimentation
technique is used to separate a fraction of clay- sized particles from the remainder. The theories behind
these two techniques are discussed below.
Sieving theory is simple. It is based on passing particles through precision-size- square openings in the
wire screen of the sieve. The condition under which this happens is usually that of shaking/vibrating of
the sieve(s) for an appropriate length of time. This allows particles, smaller than the size of the sieve
openings, to pass through the screen. It is typically performed dry for clean-course sands and gravels.
A wet- sieving procedure must be used for samples that contain silt and clay-sized material to wash
them off the surfaces of courser particles.
Sedimentation theory is not quite as straight forward as sieving theory because it describes phenomena
in the microscopic as well as the macroscopic realm. Furthermore, the phenomenon of particles settling
is described by Stoke's Law in which a number of assumptions are made that are listed below (Head,
1980).
11

Questa Rock Pile Stability Study 29v5 Page 21
Rev. 29v5 10/30/2008
The following formulas (Stoke's Law) can be used to determine the terminal velocity of spherical
particles failing freely through a liquid or the diameter of a particle failing a certain distance in a given
amount of time:
v = D2 g (ps – pl )
18n
D = 18n H
g T (ps – pl )
Where:
D = diameter of particle.
ps = mass density of the solid particle.
pl = mass density of the liquid.
n = dynamic viscosity of liquid.
g = acceleration due to gravity.
v = terminal velocity.
H = distance particle falls.
T = time.

Questa Rock Pile Stability Study 29v5 Page 22
Rev. 29v5 10/30/2008
Assuming:
(1) The condition of viscous flow in a still liquid is maintained.
(2) There is no turbulence: that is, the concentration of particles is such that they do not interfere
with one another.
12

Questa Rock Pile Stability Study 29v5 Page 23
Rev. 29v5 10/30/2008
(3) The temperature of the liquid remains constant.
(4) Particles are small spheres.
(5) Their terminal velocity is small.
(6) All particles have the same density.
(7) A uniform distribution of particles of all sizes is formed within the liquid prior to the start of
settling.
Of course, all of these assumptions will not be met when processing real samples.
Assumptions numbers 3 and 5 will essentially be met, given the small particle size that is being
sampled (clay sized) and the constant temperature of the laboratory over a period of time. The water
temperature is considered to be about room temperature because the distilled water used in the
procedure is stored in the same building or room where the sedimentation procedure is performed.
Assumptions numbers 4 and 6 affect the sedimentation procedure to varying degrees depending on the
makeup of the clay-and silt-sized particles. Physically, this means clay particles settle slower than most
other minerals of the same diameter due to their plate-like nature. Also, Stoke's Law assumes a perfect
spherical shape that presents the least surface area for a given mass. Therefore, particles, given their
imperfect shapes, will settle slower than this ideal particle. In terms of size, this means that the
particles sampled will always be somewhat larger than the size calculated using the formulas given. A
similar situation exists for particle densities that are assumed to be equal for all particles. In real
samples, there will be some variations in particle densities due to the variations in mineralogy
Therefore; an estimated- representative density of the particles anticipated is used. The difference
between this estimated value and the actual value can vary either positively or negatively, but is
assumed to be reasonably small. While assumptions 4 and 6 are entirely characteristics of the sample,
assumptions 1, 2, and 7 are all very much affected by the actions of the worker.
13

Questa Rock Pile Stability Study 29v5 Page 24
Rev. 29v5 10/30/2008
Assumption number 1 states that viscous flow will be maintained in a still liquid. This requires the
sample be undisturbed by vibrations or other movements. Assumption number 2 states that there will
be no turbulence. Turbulence occurs when the concentration of the suspension reaches a point where
particles interfere with each other.
For a clay material, flocculation is reduced by keeping the concentration of particles in the suspension
below a certain amount. Assumption number 7 states that a uniform distribution of particles sizes is
formed within the liquid prior to the onset of settling. The lab worker ensures this through ample
stirring and/or agitation of the sample just prior to settling. It should be clear that consideration of all
these assumptions is important to the interpretation of data collected and that these last three
assumptions should be of particular importance to the Clay-lab worker.
STANDARD ANALYSIS PROCEDURE
1. Label and weigh four 100 ml beakers (one each for the whole-sample/sand- and-larger-size fraction
and clay-size fraction for both the A and B splits/runs).
2. Record these weights on the particle-size data sheets for both the A and B runs. 3. Split, dry, and
weigh sample as described in Chapter 1. Record whole-sample weights on data sheets.
4. Disaggregate sample further by placing it in a Waring blander with about 200ml of distilled water.
Distilled water is always used in sample analyses in the Clay Lab because it has the dissolved solids
removed, which would remain as an impurity in the samples after evaporation. Blend for 1min on
the lowest speed.
5. Check sample for complete disaggregation. Use a spatula to obtain
14

Questa Rock Pile Stability Study 29v5 Page 25
Rev. 29v5 10/30/2008
some of the courser grains (those not in suspension) at the bottom of blender to see if they are
individual primary (non-aggregate) particles or aggregates of smaller particles. If they are individual
primary particles, then place the sample in an ultrasonic cleaner, if available, for 10min to aid the
disaggregation of smaller particles that adhere together or to larger particles (Johnson and Moston,
1976). This disaggregation also occurs in the sieving process during particle-size analysis. Ultrasonic
energy commonly has no affect on larger-well-cemented aggregates of particles. If the particles are
still an aggregate of smaller particles, pour sample from blender to a 1000ml beaker (making sure to
wash all remaining grains into the beaker with distilled water) and allow it to stand overnight. Return
sample to blender and blend for 1min on the third-speed setting. Again, check to see if larger particles
are primary or aggregates. If they are primary, then proceed to step 6. If not, pour liquid portion
(suspension) from blender into the 1000ml beaker.
Wash the remaining part of the sample into a mortar and wet grind until sample is disaggregated into its primary particles. It may be very difficult to determine when this has occurred. Several indicators or ways that may help the worker make the determination are: look at grains with a hand lens or microscope to see if they are primary particles. Stir sample in mortar and pour resulting suspension into the 1000ml beaker. Add more distilled water. Continue grinding sample and removing the suspension (pour it in the 1000ml beaker). Continue until a significant decrease in the amount of suspended material (cloudiness) occurs. (Note: The assumption here is that the primary particles are harder than the aggregate as a whole and will be released relatively intact. However, it is necessary to realize that primary grains will be broken and that grinding should be kept to the minimum necessary for effectively complete disaggregation. In cases where a lot of grinding is necessary and/or the point of completion is not clear, this should be noted on the data sheet.)
15

Questa Rock Pile Stability Study 29v5 Page 26
Rev. 29v5 10/30/2008
6. Wet sieve sample through two 230-mesh sieves (Fig. 2.1). An older-
Fig. 2. 1. Sieve arrangement and locations of size fractions.
16
Questa Rock Pile Stability Study 29v5 Page 27
Rev. 29v5 10/30/2008
worn sieve is placed on top so that further disaggregation can be performed, if necessary, by rubbing
the sample on the screen with a rubber policeman. A newer sieve is positioned Wow the older and is
never rubbed with the rubber policeman. This arrangement allows additional mechanical
disaggregation of the sample on the old sieve while maintaining the precision calibration of the
screen on the newer sieve. Sieving can be performed manually by placing the sieves into a pan and
alternating between rubbing the sample on the top sieve and washing the disaggregated particles
through the sieves with distilled water. The process is complete when essentially only clear water
passes through the sieves.
The preferred method of wet sieving is to put sieves on the sieve shaker designed for wet
sieving operations and shake for a minimum of 5 minutes. While the machine is operating, the lab
worker should alternate between washing the sample through the sieves with distilled water via the
water inlet tubing and removing the suspension by applying a vacuum to the tubulated flask
connected to the water outlet hose. A hand-operated-bildge pump is usually adequate for this
purpose. The vigorous shaking of the machine is often enough to finish disaggregating samples, but
for difficult samples, it may be necessary to rub the sample on the top sieve to break it up further.
Then, proceed with shaking until at least 5 min of shaking has elapsed or sample is thoroughly
sieved, whichever is longer. The sample is considered to be finished when the suspension passing
through the clear outlet tubing is clear.
7. After the sieving process is complete, transfer the >63 um fraction from the two sieves into the
previously weighed and labeled beaker (Stop 1).
8. Transfer the <63 um fraction from the tubulated flask (or pan ff doing particle size manually) into the I
000 ml beaker. If I 000 ml has been exceeded, the volume of liquid must be reduced by
centrifugation (the preferred method) or by adjusting the calculation to reflect the larger
17

Questa Rock Pile Stability Study 29v5 Page 28
Rev. 29v5 10/30/2008
volume of liquid. (Note: keep in mind that if more than one volume measurement is made to get total
volume, the maximum possible error becomes the sum of each individual measurement's error. For
example, if two beakers are used to measure the total volume, the maximum possible error of each
beaker, 5 wt %, adds to 10 wt % for the combined measurement.)
9. Before taking a volume measurement, thoroughly mix and check for flocculation. It appears as a
graininess of the suspension or as a uniform distribution of irregular particles that swirl around
within the suspension (they even move in the upward direction, This would not occur with particles
that are not floccules). If no flocculation is detected, fill beaker to 1000 ml or other appropriate mark
(if the calculation is to be adjusted). If flocculation has occurred, add 10 ml of dispersant. Sodium
hexametaphosphate (Calgon) in a solution of 50gm/l of distilled water is commonly used. Mix and
check for flocculation again. If flocculation persists try another 10ml. If flocculation persists or it the
worker is uncertain about its occurrence, go to the next section of this chapter, Special Procedures,
that covers flocculation problems.
10. If flocculation is not or is no longer a problem, fill beaker to 1000ml, or appropriate mark, mix
thoroughly and allow suspension to stand for 30min.
11. Using a pipette, extract 40 ml of the suspension in the 1000ml beaker from just below the surface (the
tip of the pipette is not submerged more than 0.5cm in depth). Place the suspension from the pipette
into the previously weighed and labeled 100ml beaker (Step 1) and heat to dryness in a 105°C oven.
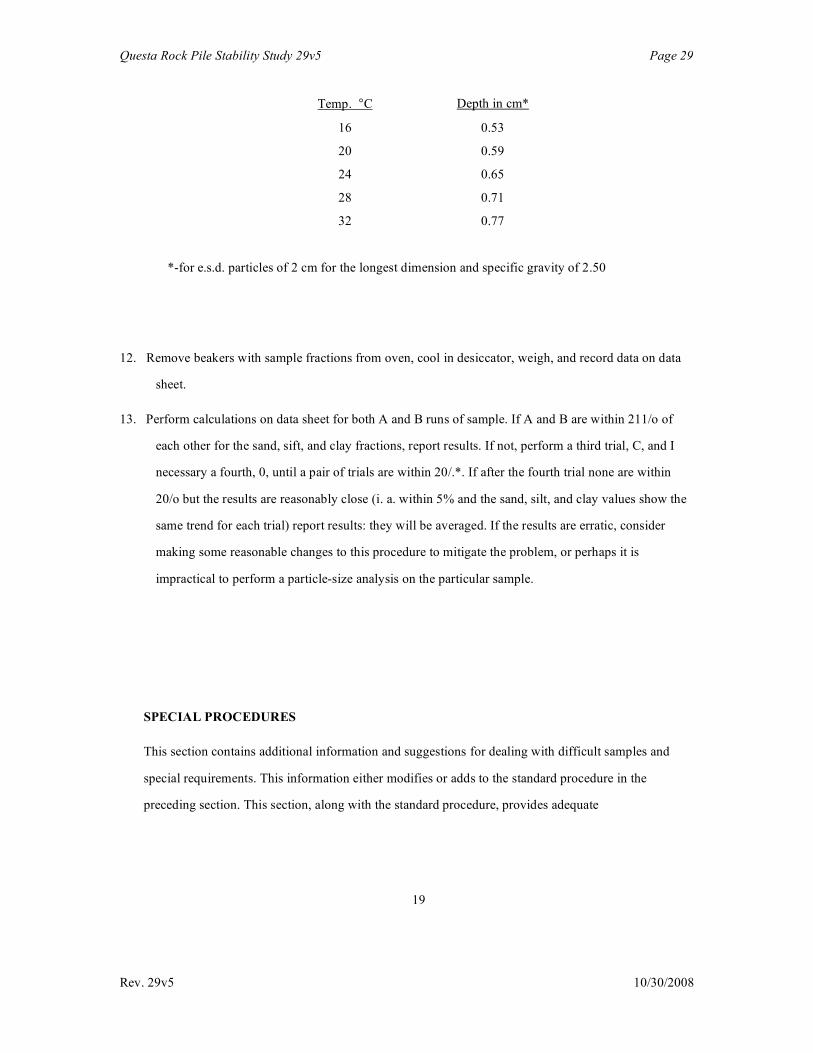
The depth of the clay and clay-silt suspension interface below the surface of the suspension after 30
minutes is as follows:
19
Questa Rock Pile Stability Study 29v5 Page 29
Rev. 29v5 10/30/2008
Temp. °C Depth in cm*
16 0.53
20 0.59
24 0.65
28 0.71
32 0.77
*-for e.s.d. particles of 2 cm for the longest dimension and specific gravity of 2.50
12. Remove beakers with sample fractions from oven, cool in desiccator, weigh, and record data on data
sheet.
13. Perform calculations on data sheet for both A and B runs of sample. If A and B are within 211/o of
each other for the sand, sift, and clay fractions, report results. If not, perform a third trial, C, and I
necessary a fourth, 0, until a pair of trials are within 20/.*. If after the fourth trial none are within
20/o but the results are reasonably close (i. a. within 5% and the sand, silt, and clay values show the
same trend for each trial) report results: they will be averaged. If the results are erratic, consider
making some reasonable changes to this procedure to mitigate the problem, or perhaps it is
impractical to perform a particle-size analysis on the particular sample.
SPECIAL PROCEDURES
This section contains additional information and suggestions for dealing with difficult samples and
special requirements. This information either modifies or adds to the standard procedure in the
preceding section. This section, along with the standard procedure, provides adequate
19
Questa Rock Pile Stability Study 29v5 Page 30
Rev. 29v5 10/30/2008
directions for performing successful particle-size analyses on the majority of samples encountered. On
occasion, samples will be encountered for which the information in this manual will be inadequate. It
is then up to the lab workers to use other resources (personnel, material, and informational on and off
campus) to find a solution to the difficulty encountered.
PARTICLE-SIZE ANALYSES IN WHICH TRACE ELEMENT ANALYSIS WILL BE
PERFORMED ON ONE OR MORE OF THE SIZE FRACTIONS
This situation is a continuation of the special procedures outlined in Chapter 1: Basic Procedures and
Sample Preparation. The concern is still elemental contamination and the elements being analyzed for
define what is considered a contaminant. After following the special procedures for sample preparation
in Chapter 1, the lab worker must consider the particle-size apparatus being used and eliminate, where
possible, all components that can be a source of contamination. It should be kept in mind that sieves
and sieve accessories are commonly made of brass, an alloy of copper and zinc. Additionally, the
screens are soldered in place. Solder is an alloy of lead and tin. Stainless-steel sieves are available but
are very costly and their screens may also be soldered in place. It is not known how significant a
source of contamination the sieves and accessories may be for copper, zinc, tin, and lead. A certain
source of copper and zinc contamination is the brass-bilge pump attached to the top of the tubulated
flask used with the sieve shaking machine. Occasionally it sucks small amounts of water into its pump
chamber and then occasionally drips a dark liquid back into the tubulated flask. A remedy for this is to
attach the pump with a longer line that includes a liquid trap. These are just a couple examples of
potential sources of contamination. It is up to the lab worker to look for and eliminate any potential
sources of contamination that may be applicable to the trace element(s) analyses being made.
20

Questa Rock Pile Stability Study 29v5 Page 31
Rev. 29v5 10/30/2008
SAMPLES THAT PERSISTENTLY FLOCCULATE
Flocculation in most samples is remedied by adding sodium hexametaphosphate as described in the
Standard Procedure. However, some samples will require more extensive attention. If sodium
hexametaphosphate does not work, then wash the sample using 250ml centrifuge bottles and the super-
speed centrifuge set at 10,000 rpm for 5min. Resuspend the sample with distilled water (pour into a
glass beaker if necessary to see better) and check for flocculation. Repeat this washing up to 4 times. If
flocculation persists then try other dispersants such as ammonium hydroxide (especially useful for
samples with high concentrations of kaolinite) or other phosphates (Head, 1980). For a brief discussion
on flocculation and dispersants, read Moore and Reynolds, 1989 p. 187-188. Another method of
controlling flocculation is to decrease the concentration of the suspension by adding distilled water (i.e.
increase volume from 1000ml to 2000ml).
If it is difficult to determine if flocculation is occurring, try looking at the sample through the side of
the glass beaker with a 10X hand lens in strong light. Another way is to treat one sample run (A) by
washing and with dispersants and comparing it with the untreated sample run (B) after stirring and
allowing to settle for 30 minutes.
These methods can be very time consuming, however a large majority of samples with flocculation
problems can be effectively dealt with by these means.
WELL-INDURATED AND/OR CARBONATE CEMENTED SAMPLES
Well-indurated sandstones, and especially siltstone-s, can be nearly impossible to analyze for particle
size by the standard procedure alone. This is because the amount of mechanical disaggregation
required to free the primary particles is excessive and can result in the destruction of those primary
grains.
21

Questa Rock Pile Stability Study 29v5 Page 32
Rev. 29v5 10/30/2008
Additionally, a large amount of time can be spent wet grinding with the mortar and pestle, as well as
rubbing on the sieve screen. Further, in the case of siltstone when grinding and rubbing is finished, one
is often not sure that the sample is broken into its primary particles or just to small enough aggregates
to fit through the sieve opening.
A modified EDTA leaching procedure is very helpful in these situations. First, prepare sample as for
standard particle size, but only use about 12 to 15 gm. Further crush sample in mortar until no pieces
are larger than 114in. in diameter in the longest direction. Perform EDTA leaching procedure as in
next chapter, except do not grind and pass through 70-mesh sieve. It is advisable to use magnetic
stirrers during leaching to further break up sample and to prevent the beaker from bumping. After
leaching is done, perform a particle-size analysis by the standard procedure on the insoluble residue.
CHEMICALLY-TREATEID SAMPLES
Samples that are extremely hydrophobic may have been treated with commercial sealers or other
compounds. It would be advisable to find out what was used to treat the sample in order to decide on
possible solvents to remove the chemical in question. Some solvents used in the Clay Lab are alcohols,
acetone, and carbon tetrachloride. Many organic solvents volatilize readily and produce toxic fumes;
therefore, treatment of samples in these solvents should be done under a fume hood. It may also be
useful to get suggestions from the Chemistry Lab before preceding.
SAMPLES THAT CONTAIN SULFUR
If a sample contains enough sulfur to produce an odor, flocculation problems are almost certain.
Repeated washing in distilled water using the centrifuge has solved this problem for some samples,
while others have
22

Questa Rock Pile Stability Study 29v5 Page 33
Rev. 29v5 10/30/2008
defied every attempt. Additionally, when adding dispersant (either sodium hexametaphosphate or
ammonium hydroxide) a dark precipitate may form in a number of these samples. When precipitation
occurres, the samples may never be cured of flocculation.
23

Questa Rock Pile Stability Study 29v5 Page 34
Rev. 29v5 10/30/2008
Chapter 3: Leaching Analyses
Three different leaching analyses are performed in the Clay Lab. These are EDTA
(ethylenedinitrilotatraacetic acid tetrasodium salt), HCI (hydrochloric acid), and NAOCI (sodium
hypochlorite). The objective of all three is to remove, in solution and as a gaseous phase, certain
groups of materials and to leave the remainder behind as an insoluble residue. The relative weight
percents of the soluble and insoluble portions are calculated and reported. This chapter will present the
theory and the standard procedures for each different leaching analysis.
THEORY
EDTA
EDTA leaching is the preferred method for determining the relative weight percents of insoluble and
soluble materials in a sample as well as separating clays and other silicates from carbonate rocks. This
is because EDTA causes less undesirable damage and alteration to some of the silicate phases when
compared to conventional-acid-dissolution techniques (Bodine and Fernalid, 1973).
EDTA is a chelating or complexing agent that forms multiple-covalent bonds with the alkaline-earth-
metal cations as well as transition-metal cations. When the metal cations complex with the EDTA,
their concentrations in the aqueous solution decrease resulting in further dissolution of the carbonate
and/or sulfate minerals. Carbonate and sulfate minerals are preferentially dissolved because of their
higher solubilities in water than silicates. For this reason, silicates and other highly insoluble minerals
will be little affected by the EDTA and will be left behind as insoluble residue.
24
Questa Rock Pile Stability Study 29v5 Page 35
Rev. 29v5 10/30/2008
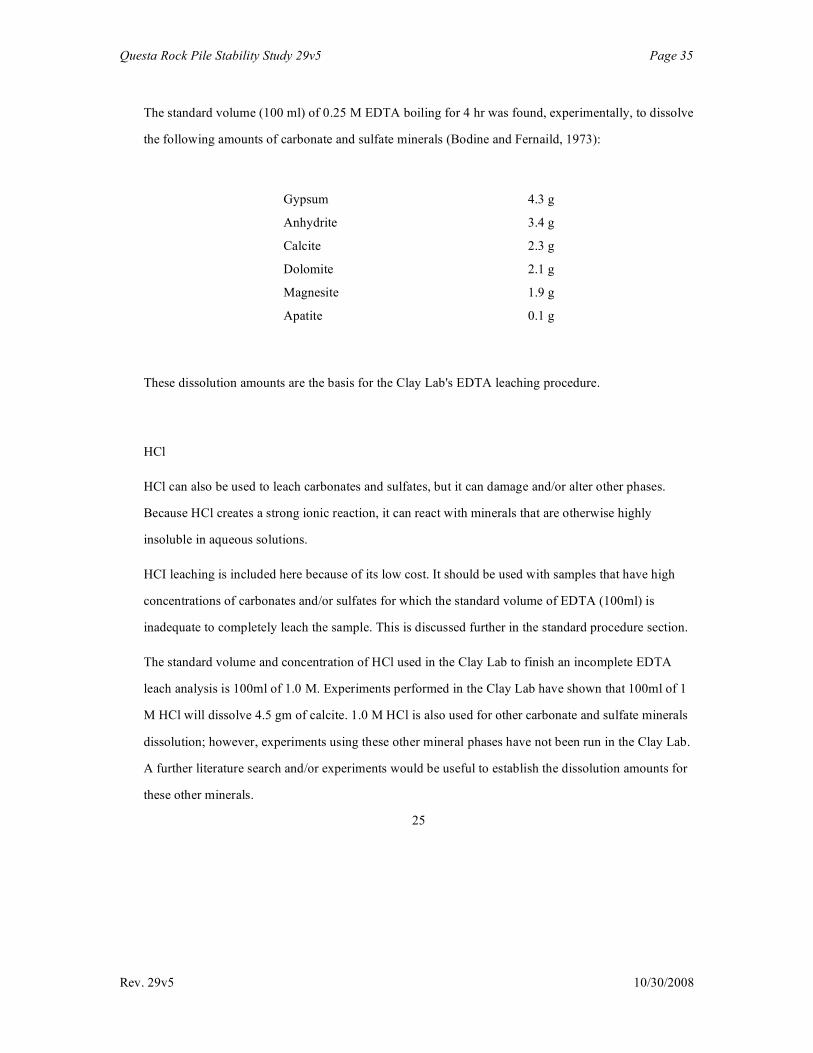
The standard volume (100 ml) of 0.25 M EDTA boiling for 4 hr was found, experimentally, to dissolve
the following amounts of carbonate and sulfate minerals (Bodine and Fernaild, 1973):
Gypsum 4.3 g
Anhydrite 3.4 g
Calcite 2.3 g
Dolomite 2.1 g
Magnesite 1.9 g
Apatite 0.1 g
These dissolution amounts are the basis for the Clay Lab's EDTA leaching procedure.
HCl
HCl can also be used to leach carbonates and sulfates, but it can damage and/or alter other phases.
Because HCl creates a strong ionic reaction, it can react with minerals that are otherwise highly
insoluble in aqueous solutions.
HCI leaching is included here because of its low cost. It should be used with samples that have high
concentrations of carbonates and/or sulfates for which the standard volume of EDTA (100ml) is
inadequate to completely leach the sample. This is discussed further in the standard procedure section.
The standard volume and concentration of HCl used in the Clay Lab to finish an incomplete EDTA
leach analysis is 100ml of 1.0 M. Experiments performed in the Clay Lab have shown that 100ml of 1
M HCl will dissolve 4.5 gm of calcite. 1.0 M HCl is also used for other carbonate and sulfate minerals
dissolution; however, experiments using these other mineral phases have not been run in the Clay Lab.
A further literature search and/or experiments would be useful to establish the dissolution amounts for
these other minerals.
25

Questa Rock Pile Stability Study 29v5 Page 36
Rev. 29v5 10/30/2008
NAOCl
NAOCl leaching is used to remove organic materials when they exist in quantities large enough to
interfere with XRD (x-ray diffraction) patterns or particle- size-analysis results. NAOCl is a strong
oxidizing agent and removes organics by converting organic molecules to gaseous and soluble forms.
It can also alter clay minerals by oxidizing ferrous iron in octahedral sites (Moore and Reynolds, 1989)
and may affect other minerals as well. For this reason, it should be used only if considered necessary;
however, it has been shown that this method, while altering XRD peak positions somewhat, has little
affect on relative peak heights for samples containing a mixture of illite, smectite, mixed-layered
illite/smectite, and kaolinite. For these treated samples, there is virtually no difference in the results
reported using the New Mexico Bureau of Mines and Mineral Resource's semiquantitative clay
minerals analysis technique when compared to untreated samples (Hall, unpublished).
This technique, like the H2O2 (hydrogen peroxide) technique (Head, 1980), could also be used for
determining organic content. It would be a good idea to run experiments comparing the two reagents to
demonstrate that similar results are obtained.
The standard concentration used is 5 % to 6 % NAOCl (common household bleach); however, the
volume used varies depending on the amount of organics in the sample. It is not known what amount
of organics is removed for a given volume of NAOCl solution used; therefore, completion is based on
a color change of the sample.
STANDARD PROCEDURES
26

Questa Rock Pile Stability Study 29v5 Page 37
Rev. 29v5 10/30/2008
EDTA
1. If necessary, prepare a 0.25M EDTA solution with a pH of 10 to 12. Weigh out 104.0 gm of EDTA
(ethylonedinitrilotetraacetic acid tetrasodium salt) powder. Mix powder in a graduated container
with about 900ml of distilled water. A hot plate with a magnetic stirrer works best. Heat and stir
until powder is dissolved and solution is clear. Add distilled water until solution volume is 1000 ml.
If you used the tetrasodium salt of EDTA named above, the pH will be between 10 to 12 and no
other adjustments will be necessary.
2. Split the sample as described in Chapter 1, but only keep one 25 to 30gm split.
3. Grind the split in a mortar and pass through a 70-mesh sieve.
Any sample that does not pass through the sieve should be returned to the mortar for further
grinding. Repeat the sieving and grinding until entire sample is passed through the sieve.
4. Thoroughly mix ground sample, and split once more. Place one split into a small 1 oz bottle (it can be
used later for bulk-mineral analysis and/or third and fourth leach runs if necessary). The remaining
split will be passed through the Jones splitter once more and the resulting splits will be placed in two
properly labeled and pre-weighed 100 ml beakers (one beaker is the A run and the other is the B
run). Dry, cool, and weigh beakers with samples as described in Chapter 1. Record weights on leach
data sheets.
5. Pour samples from beakers into two properly labeled erlenmeyer flasks. Add 4 glass beads and 1 00
mi of EDTA solution to each.
6. Place flasks on hot plates and connect condensers to their tops (Fig. 3.1). Turn on the water, at a
modest volume, to the condensers (make sure water is flowing through all condensers). Turn hot
plates on high (do not leave unattended) until boiling starts. Reduce hot plate setting to maintain
moderate boiling. Check condenser; condensation should stop
27
Questa Rock Pile Stability Study 29v5 Page 38
Rev. 29v5 10/30/2008
about half -way up the condenser. If not, adjust water accordingly
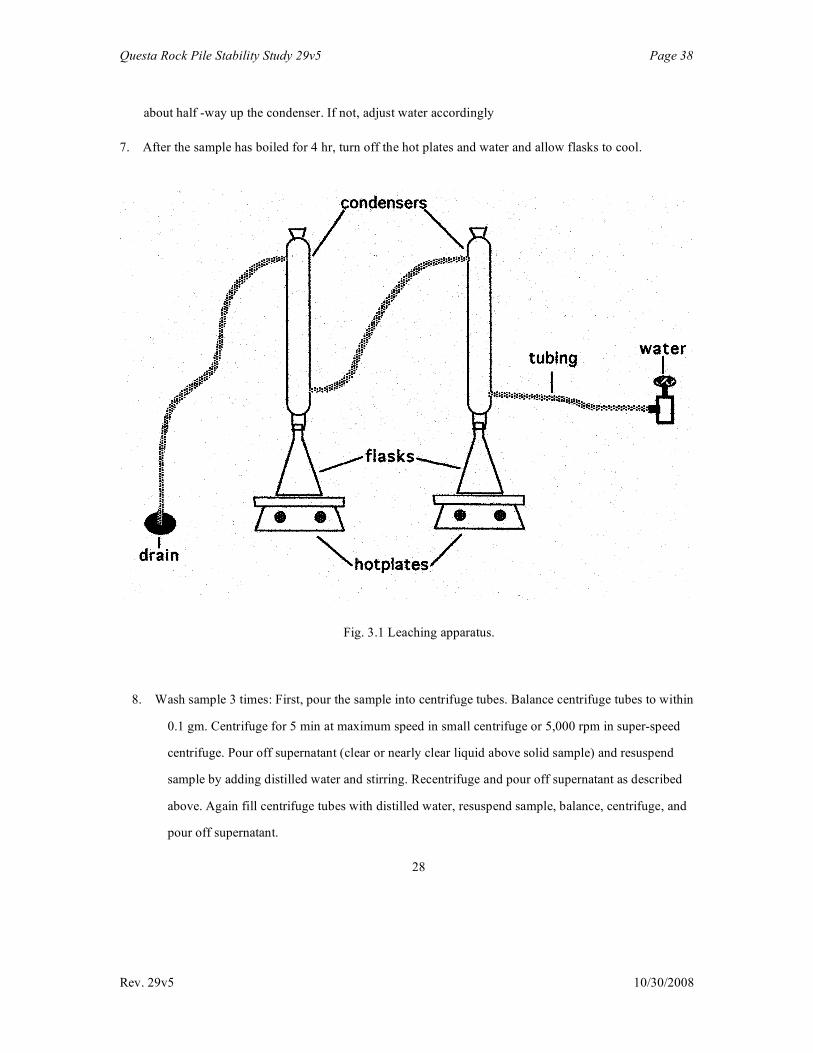
7. After the sample has boiled for 4 hr, turn off the hot plates and water and allow flasks to cool.
Fig. 3.1 Leaching apparatus.
8. Wash sample 3 times: First, pour the sample into centrifuge tubes. Balance centrifuge tubes to within
0.1 gm. Centrifuge for 5 min at maximum speed in small centrifuge or 5,000 rpm in super-speed
centrifuge. Pour off supernatant (clear or nearly clear liquid above solid sample) and resuspend
sample by adding distilled water and stirring. Recentrifuge and pour off supernatant as described
above. Again fill centrifuge tubes with distilled water, resuspend sample, balance, centrifuge, and
pour off supernatant.
28

Questa Rock Pile Stability Study 29v5 Page 39
Rev. 29v5 10/30/2008
9. Recover sample, both A and B runs, into their appropriate pre-weighed and labeled beakers. Dry
samples in I 05'D 0 oven, cool in desiccator, weigh, record weights on leach data sheets, and
calculate results. If the amount of insoluble residue is <80%, the EDTA may not have been in excess
and the leaching may not be complete. Therefore, go to the HCI leaching procedure in the next
section. If the amount of insoluble residue is >80 %, then report results. The results should be within
2%. If not, perform a third and if necessary a fourth run until a pair are within 211/a. Unlike particle-
size analysis, there is no reason why a reproducibility within 211/o can not be achieved; therefore, if
results are erratic, recheck technique and be sure no sample is being lost in any of the steps.
HCl
1. Pour about 50ml of 1.0 M HCl into the beaker with insoluble residue from EDTA leach. If the sample
effervesces, this is a sure indication that the EDTA leaching was incomplete. Wait until
effervescence slows and pour in the remainder of 100ml of 1.0 M HCI.
2. When effervescence slows again, place beakers in a boiling-water bath for about I hr (Fig 3.2). Make
sure the reaction does not precede too rapidly, as sample loss may occur.
3. After I hr, turn off the hot plate and allow beakers to cool.
4. Wash sample 3 times: First, pour the sample into centrifuge tubes. Balance centrifuge tubes to within
0.1 gm. Centrifuge for 5 min at maximum speed in small centrifuge or 5,000 rpm in super-speed
centrifuge. Pour off supernatant (clear or nearly clear liquid above solid sample) and resuspend
sample by adding distilled water and stirring.
29
Questa Rock Pile Stability Study 29v5 Page 40
Rev. 29v5 10/30/2008
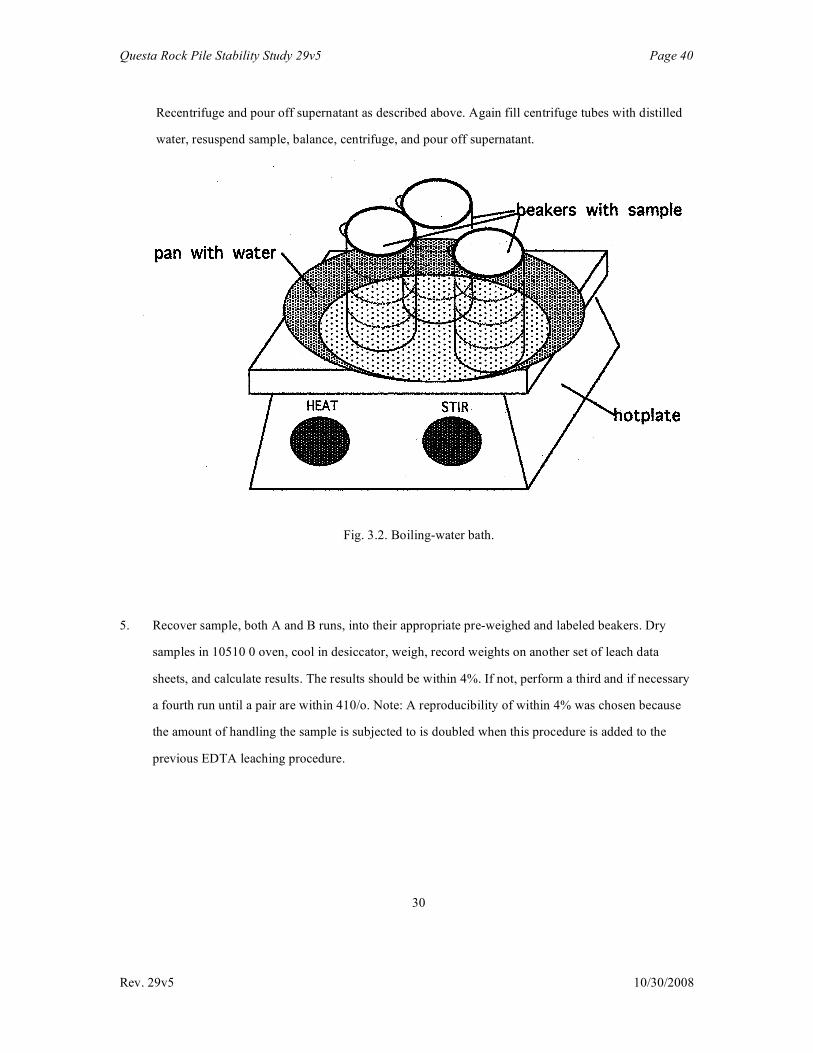
Recentrifuge and pour off supernatant as described above. Again fill centrifuge tubes with distilled
water, resuspend sample, balance, centrifuge, and pour off supernatant.
Fig. 3.2. Boiling-water bath.
5. Recover sample, both A and B runs, into their appropriate pre-weighed and labeled beakers. Dry
samples in 10510 0 oven, cool in desiccator, weigh, record weights on another set of leach data
sheets, and calculate results. The results should be within 4%. If not, perform a third and if necessary
a fourth run until a pair are within 410/o. Note: A reproducibility of within 4% was chosen because
the amount of handling the sample is subjected to is doubled when this procedure is added to the
previous EDTA leaching procedure.
30

Questa Rock Pile Stability Study 29v5 Page 41
Rev. 29v5 10/30/2008
Additionally, this procedure may be scaled up and used for samples with known high carbonate
and/or sulfate contents without performing the EDTA leach first. It may also be scaled up and
used where larger volumes of carbonate or sulfate materials must be leached prior to particle-size
analysis.
NAOCl
1 Use household bleach for the NAOCl solution. Adjust to pH 9.5 with HCl just prior to treatment.
2. For each 10gm of sample being leached, pour 50ml of NAOCl into the beaker containing the sample.
3. Place beakers in a boiling-water bath for about 15 min (Fig. 3.2).
4. After 15 min, turn off the hot plate and allow the beakers to cool.
5. Wash sample and check for completeness of leaching: Pour the sample into centrifuge tubes. Balance
centrifuge tubes to within 0.1 gm. Centrifuge for 5 min at maximum speed in small centrifuge or
5,000 rpm in super-speed centrifuge. Pour off supernatant (clear or nearly clear liquid above solid
sample). Repeat steps 2 through 5 until organic material is removed as evidenced by a change in
sample color to white, gray, or red (Moore and Reynolds, 1989). When color change occurs, precede
to step 6.
6. Wash sample: Centrifuge for 5 min and pour off supernatant as described above. Resuspend sample by
adding distilled water and stirring. Recentrifuge and pour off supernatant. At this point, the sample
should have been washed 3 times after the last leaching.
6. Recover sample into a labeled beaker. Dry samples in 105°C oven and cool in desiccator. If data on
the amount of organics is desired then weigh, record weight on a leach data sheet, and calculate
result.
31

Questa Rock Pile Stability Study 29v5 Page 42
Rev. 29v5 10/30/2008
Because this technique, for determining the amount of organics in a sample, has not been adequately
verified in the Clay Lab, no reproducibility error has been established. Therefore, the sample does
not need to be run in duplicate and any data collected should be considered only a rough estimate of
organic content. If data on the amount of organics is not desired, simply use the leached material as
the input to a particle-size analysis or an x-ray analysis.
32

Questa Rock Pile Stability Study 29v5 Page 43
Rev. 29v5 10/30/2008
Chapter 4: Clay-Mineral Analysis
Clay-mineral analysis at the New Mexico Bureau of Mines and Mineral Resource's Clay Lab is
intended to identify the major clay-mineral groups and give a semiquantitative indication of the
relative amounts of the illite, smectite, kaolinite, I/S (mixed-layered illite/smectite), and chlorite
groups. In some cases, where characteristic XRD (x-ray diffraction) patterns are produced, more
specific identifications of particular species can be made. This chapter will cover the theory necessary
to interpret XRD patterns and the procedure for identifying and estimating the amounts of the clay-
mineral groups illite, smectite, kaolinite, I/S, and chlorite.
THEORY
In order to interpret XRD patterns of clay minerals, the lab worker must have an understanding of the
structure of clay minerals and the nature of XRD. This section will look at both of these topics in a
rudimentary fashion. Additionally, the theories behind making oriented-clay slides will also be
discussed.
CLAY-MINERAL STRUCTURE
Clay minerals are hydrous-aluminum silicates and are classified as phyilosilicates, or layered silicates.
Most have in common a plate-like morphology and perfect (001) cleavage (Moore and Reynolds, 1
989). The (00 l) is one of the (hk l) or Miller indices that defines the orientation of an internal
crystal plane. In this case, the (001) represents the plane perpendicular to the c-axis in which clay-
mineral layers often stack (Fig.4.1). For a further explanation of this system, consult an introductory
mineralogy text.
The clay-mineral layers that form the stack in Fig. 4.1 can be further
33

Questa Rock Pile Stability Study 29v5 Page 44
Rev. 29v5 10/30/2008
Fig. 4.l. Clay mineral layers on crystallographic axes.
broken down into tetrahedral sheets (corner-linked tetrahedra of Si4+ or Al3+ with attached oxygens)
and octahedral sheets (edge-linked octahedra of A13+, Mg2+, Fe2+, Fe3+, or less commonly, other
transition elements with attached oxygen). The octahedral sheet can have two types of structure;
trioctahedral containing 3 Mg2+ cations and having a cation-to-anion ratio of 1:2 (brucite-like) or
dioctahedral containing 2 A13+ cations and having a cation-to-anion ratio of 1:3 (gibbsit8-like) (Moore
and Reynolds, 1989).
The tetrahedral and octahedral sheets are joined together in an alternating fashion to form the layers
illustrated in Fig. 4. 1. These layers are of two types. The first has one tetrahedral sheet (T) joined to an
octahedral sheet (O) and is called a 1:1 layer-silicate structure.
34

Questa Rock Pile Stability Study 29v5 Page 45
Rev. 29v5 10/30/2008
The second type has two tetrahedral sheets with an octahedral sheet in between (Fig. 4.2) and is called
a 2:1 -layer-silicate structure (Moore and Reynolds, 1989). The 1:1-layer-silicate structure most often
corresponds to the kaolin- group-clay minerals (Al-rich) which are identified as kaolinite in the Clay
Lab. It also corresponds to serpentine (Mg-rich) which is not a clay minerals and is not identified as
such in the Clay Lab. The most basic 2:1 -layer-silicate structure corresponds to the minerals
pyrophyllite (Al-rich) and talc (Mg-rich) which are not clay minerals and are not identified as such in
the Clay Lab (Fig 4.2).
Fig. 4.2. The 1:1- and 2:1-layer-silicate structures of kaolinite, pyrophyilite, and talc with c-axis and d-spacing.
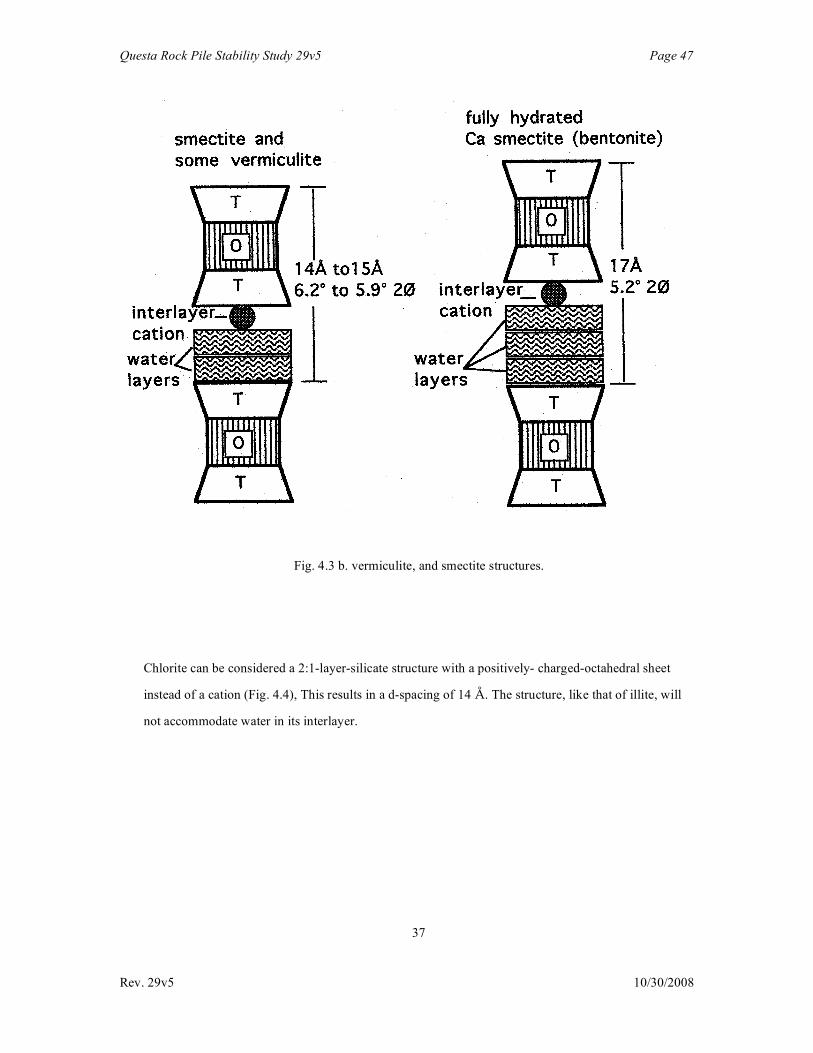
The 2:1-layer-silicate structure clay minerals are illite, glauconite, vermiculite and smectite; chlorite
will be dealt with later. Illite, glauconite, vermiculite and smectite have interlayer cations. Vermiculite
and smectite can also accommodate varying amounts of water into their interlayer spaces (Fig. 4.3 a &
b). It can be seen that several different combinations of d-spacings can be obtained for these hydratable
minerals.
35
Questa Rock Pile Stability Study 29v5 Page 46
Rev. 29v5 10/30/2008
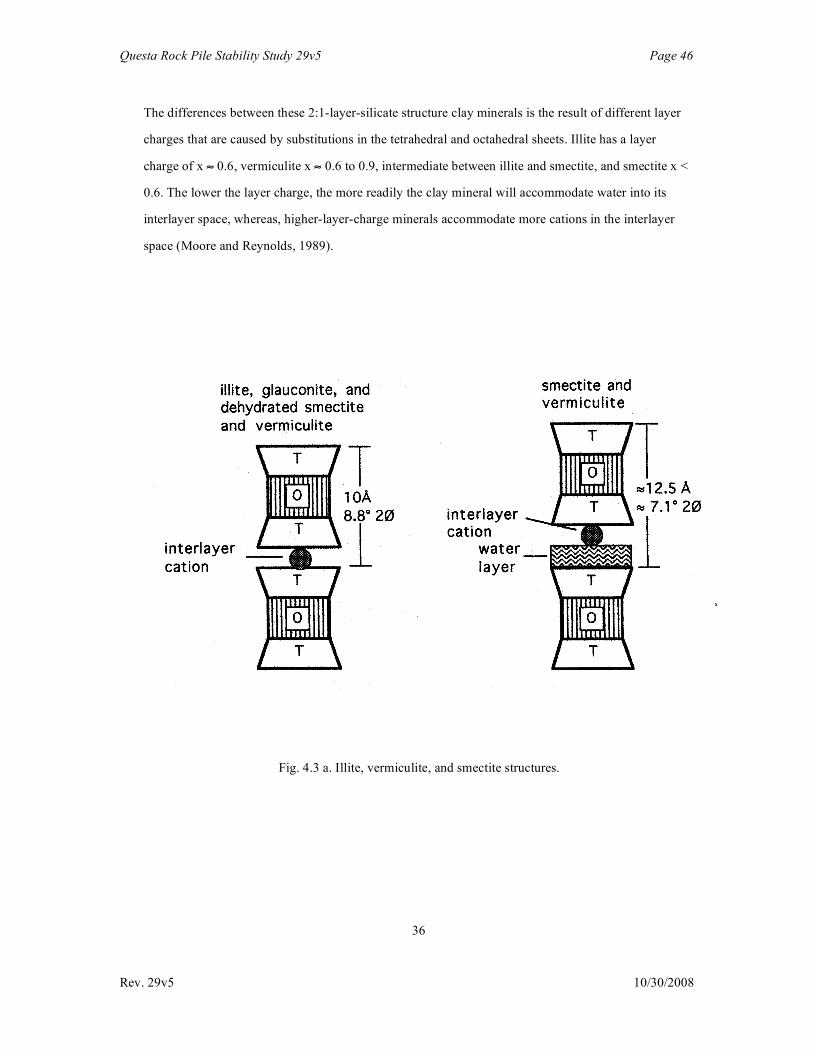
The differences between these 2:1-layer-silicate structure clay minerals is the result of different layer
charges that are caused by substitutions in the tetrahedral and octahedral sheets. Illite has a layer
charge of x ≈ 0.6, vermiculite x ≈ 0.6 to 0.9, intermediate between illite and smectite, and smectite x <
0.6. The lower the layer charge, the more readily the clay mineral will accommodate water into its
interlayer space, whereas, higher-layer-charge minerals accommodate more cations in the interlayer
space (Moore and Reynolds, 1989).
Fig. 4.3 a. Illite, vermiculite, and smectite structures.
36
Questa Rock Pile Stability Study 29v5 Page 47
Rev. 29v5 10/30/2008
Fig. 4.3 b. vermiculite, and smectite structures.
Chlorite can be considered a 2:1-layer-silicate structure with a positively- charged-octahedral sheet
instead of a cation (Fig. 4.4), This results in a d-spacing of 14 Å. The structure, like that of illite, will
not accommodate water in its interlayer.
37

Questa Rock Pile Stability Study 29v5 Page 48
Rev. 29v5 10/30/2008
Fig. 4.4. Chlorits structure.
Mixed-layered-clay minerals are clay minerals formed of two or more types of clay layers, however,
mixtures of more than two components are quite rare (Moore and Reynolds, 1989). Of all the possible
types, US is the most common and is found in the majority of samples analyzed in the Clay Lab.
Corrensite, an ordered chlorite/smectite, has also been seen on occasion.
The layers are stacked along the c-axis or perpendicular to (00,0. They can be arranged in an ordered,
partially ordered, or random sequence (Fig. 4.5). This interlayering results in clay particles with larger
d-spacings that depend on the ordering arrangement (s) of the two different types of clay layers.
In the case of the ordered-mixed-layered-clay minerals, the effective d-spacing, for this particular
ordering pattern, becomes the sum of the illite and smectite d-spacings or 20A to 27A, depending on
the hydration state of the smectite.
38

Questa Rock Pile Stability Study 29v5 Page 49
Rev. 29v5 10/30/2008
For random-mixed-layered-clay minerals this is not the case, because no one ordering scheme is
followed.
Fig. 4.5. Ordering of mixed-layered-clay minerals.
39

Questa Rock Pile Stability Study 29v5 Page 50
Rev. 29v5 10/30/2008
X-RAY DIFFRACTION THEORY
Diffraction of x-rays is usually referred to as reflection. This is probably because the angle of
reflection or diffraction is equal to the angle of incidence. Diffraction of x-rays is different than
reflection of Visible light because it only occurs at specific angles as determined by the clay mineral's
d-spacing and Bragg's Law whereas visible light is reflected at all angles. Also, unlike visible light, it
is essential that the distance between scattering centers be about the same as the wavelength of the x-
rays being scattered (Moore and Reynolds, 1989).
When scattering centers (atoms) interact with incident x-rays, they reradiate in all directions at the
same wavelength of the incident beam. Wherever many of these reradiated wavelengths are in phase,
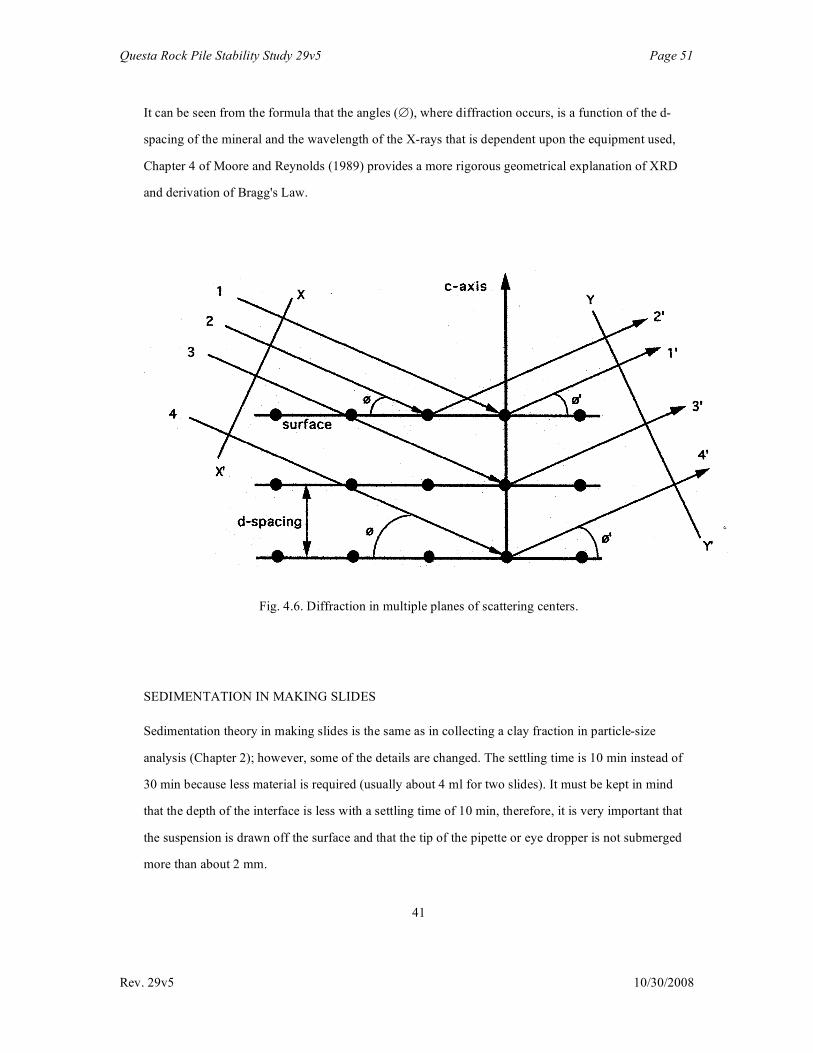
and therefore constructively interfering, diffracted or reflected beams will result. Consider Fig. 4.6, in
which incident rays 1, 2,3, and 4 interact with 4 scattering centers to produce reflected rays 1', 2', 3',
and 4'. The scattering centers (black dots) are located on internal crystal planes (heavy lines) that are
spaced a distance (d) apart: this is the d-spacing of the clay mineral's unit cell along the c-axis. The
angle of incidence is ∅ and is equal to ∅' in all cases. If rays 1, 2, 3, and 4 of the incident beam are in
phase, X-X' represents a wavefront. It is easily seen that the paths traveled by rays 1 and 2 from X-X'
to Y-Y' are of equal length; therefore, these rays will still be in phase at Y-Y' and will constructively
interfere. This will occur for any angle of ∅. The paths for rays 3 and 4, that travel below the surface,
are successively longer than rays 1 and 2 at the surface. If these paths are longer by a whole number
multiple of the rays' wavelength, rays 3 and 4 will also be in phase with rays 1 and 2 leading to
maximum constructive interference. When this occurs, a diffracted x-ray beam will be produced.
Under what conditions does this occur? The reradiated wavelengths from the atoms making up the
internal planes beneath the surface will all be in phase when Bragg's Law (2d sin∅ = nλ) is satisfied.
40
Questa Rock Pile Stability Study 29v5 Page 51
Rev. 29v5 10/30/2008
It can be seen from the formula that the angles (∅), where diffraction occurs, is a function of the d-
spacing of the mineral and the wavelength of the X-rays that is dependent upon the equipment used,
Chapter 4 of Moore and Reynolds (1989) provides a more rigorous geometrical explanation of XRD
and derivation of Bragg's Law.
Fig. 4.6. Diffraction in multiple planes of scattering centers.
SEDIMENTATION IN MAKING SLIDES
Sedimentation theory in making slides is the same as in collecting a clay fraction in particle-size
analysis (Chapter 2); however, some of the details are changed. The settling time is 10 min instead of
30 min because less material is required (usually about 4 ml for two slides). It must be kept in mind
that the depth of the interface is less with a settling time of 10 min, therefore, it is very important that
the suspension is drawn off the surface and that the tip of the pipette or eye dropper is not submerged
more than about 2 mm.
41

Questa Rock Pile Stability Study 29v5 Page 52
Rev. 29v5 10/30/2008
The material, when placed on a slide, undergoes settling again. The plate-like clay particles settle in an
oriented fashion with the c-axis perpendicular and (001) parallel to the surface of the slide. This
orientation is important because it is the (001) that is diagnostic in the semiquantitative method and
must be measured. Flocculation is the primary difficulty in obtaining this orientation because the clay
particles agglomerate in a variety of orientations and then settle onto the slide. The elimination of
flocculation will be discussed in the Standard Procedure Section.
STANDARD PROCEDURE
The Standard Procedure is divided into 3 parts: 1.) Making Slides; 2.) Running The Slides; 3.)
Interpreting Diffractograms and Performing Semiquantitative Calculations. This is because each one of
these parts is distinct and is completed before moving on to the next. Additionally, samples are usually
run in batches of 3 to 10 in the Clay Lab.
MAKING SLIDES
1. Place about 20 gm of sample in a 100 ml beaker and fill with distilled water. Mix and wait 5 min.
Remix, wait 15 sec, and pour suspension into a properly labeled beaker.
2. If clay flocculates (for description of flocculation, go to Chapter 9, p. 18), wash in centrifuge (for
description of centrifugation, go to Chapter 3, p. 28) up to 5 times.
3. If flocculation still persists, remix and pour 1/2 of suspension into another beaker. Add a few drops of
concentrated ammonium hydroxide (NH4 OH) to one of the beakers and remix. If clay is still not
dispersed, wash in centrifuge up to 3 times.
42

Questa Rock Pile Stability Study 29v5 Page 53
Rev. 29v5 10/30/2008
4. If clay still flocculates, Fill both beakers up to 100ml; remix the one treated with ammonium
hydroxide, and check for flocculation. If it flocculates, add a few drops of sodium
hexametaphosphate solution (Calgon®) to other beaker and mix. If flocculation persists wash in
centrifuge up to 3 times.
5. If clay is still not dispersed and its concentration is still high enough, try further dilutions by pouring
off suspension and adding more distilled water. If flocculation still persists go to the Curlers and
Peelers/Flocculation Part in the Special Procedures Section of this chapter.
6. Once the clay is dispersed, remix and allow the beaker and its contents to stand for 10 min. Label two
glass slides with the sample number and one as A and the other as B using a diamond stylus. At the
end of 10 min touch the eye dropper or 2ml pipette to the surface and draw off enough material to
cover a glass slide. It is desirable to make two slides of each sample at this time. Make the second
slide (B) a bit thinner than the first in case the sample turns out to be a curler and peeler. Slides
should be allowed to air dry. If clay flocculates on slide while drying (this rarely occurs), remake
slide after washing sample several times using the centrifuge and distilled water. This is important
because, as already discussed, flocculation destroys the preferred orientation of the clay particles.
RUNNING SLIDES ON THE XRD MACHINE
Four runs on the XRD machine are required for clay-mineral identification and to perform the
semiquantitative determination of the amounts of these clay minerals. The basic instructions and
parameters are contained in the following procedure, however, the specific instructions
43
Questa Rock Pile Stability Study 29v5 Page 54
Rev. 29v5 10/30/2008
for setting up and using the XRD machine, as well as generabng the appropriate diffractograms, are
contained in the Talk and Jade programs' instruction manuals. The X-ray Lab Supervisor can also
be of help if questions or problems arise.
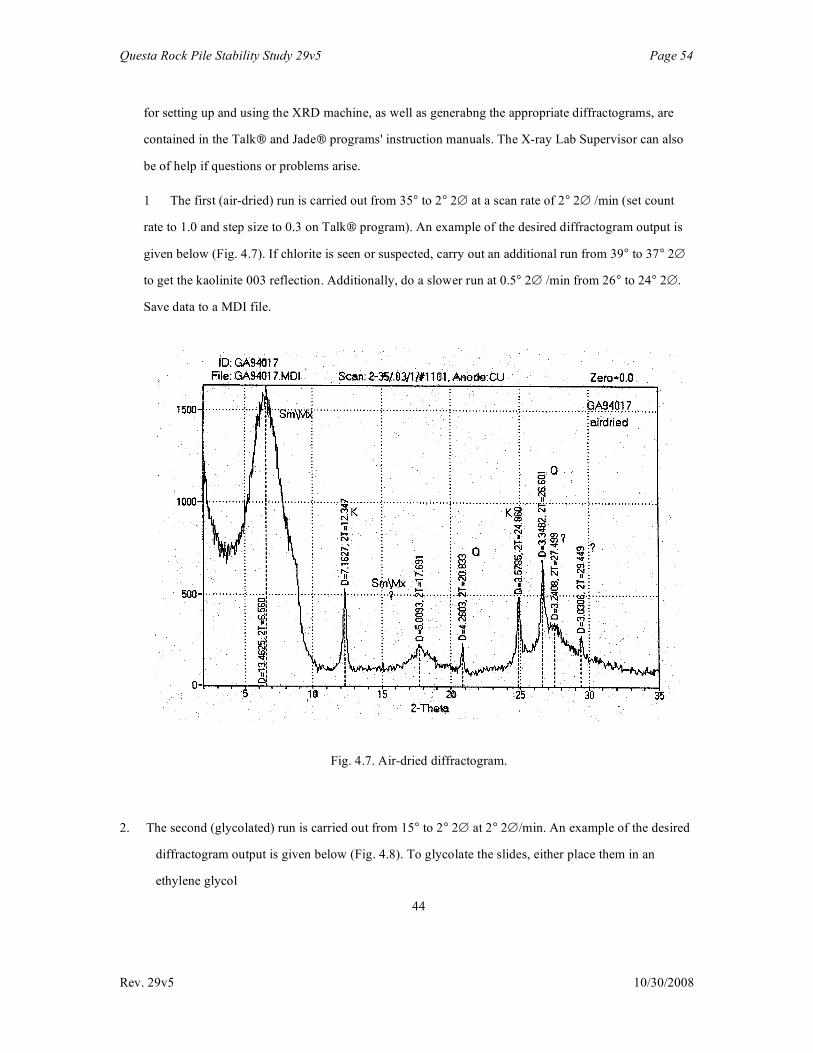
1 The first (air-dried) run is carried out from 35° to 2° 2∅ at a scan rate of 2° 2∅ /min (set count
rate to 1.0 and step size to 0.3 on Talk program). An example of the desired diffractogram output is
given below (Fig. 4.7). If chlorite is seen or suspected, carry out an additional run from 39° to 37° 2∅
to get the kaolinite 003 reflection. Additionally, do a slower run at 0.5° 2∅ /min from 26° to 24° 2∅.
Save data to a MDI file.
Fig. 4.7. Air-dried diffractogram.
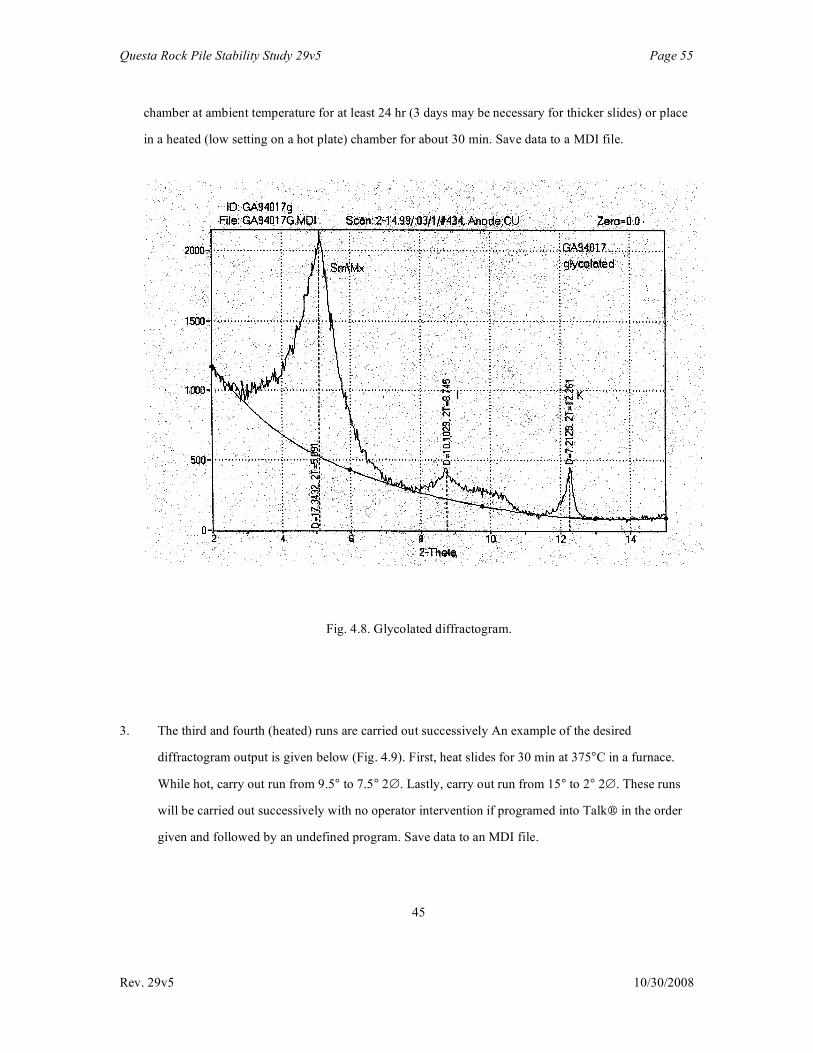
2. The second (glycolated) run is carried out from 15° to 2° 2∅ at 2° 2∅/min. An example of the desired
diffractogram output is given below (Fig. 4.8). To glycolate the slides, either place them in an
ethylene glycol
44
Questa Rock Pile Stability Study 29v5 Page 55
Rev. 29v5 10/30/2008
chamber at ambient temperature for at least 24 hr (3 days may be necessary for thicker slides) or place
in a heated (low setting on a hot plate) chamber for about 30 min. Save data to a MDI file.
Fig. 4.8. Glycolated diffractogram.
3. The third and fourth (heated) runs are carried out successively An example of the desired
diffractogram output is given below (Fig. 4.9). First, heat slides for 30 min at 375°C in a furnace.
While hot, carry out run from 9.5° to 7.5° 2∅. Lastly, carry out run from 15° to 2° 2∅. These runs
will be carried out successively with no operator intervention if programed into Talk in the order
given and followed by an undefined program. Save data to an MDI file.
45

Questa Rock Pile Stability Study 29v5 Page 56
Rev. 29v5 10/30/2008
Fig. 4.9. Heated diffractogram.
4. Produce printouts using the appropriate MDI file and the Jade program for runs 1, 2, and 4 (run 3
will be overlaid onto run 4). Be sure to include proper sample-number and mineral-identification
labels as well as a designation of airdried, glycolated, or heated. A background curve should be
included on the glycolated and heated runs. Also, lines further dividing the computer-generated
divisions in halves, fourths, and possibly eighths is useful to measure counts later. Save
diffractogram to a SAV file and print a hard copy of the three runs for calculations.
46
Questa Rock Pile Stability Study 29v5 Page 57
Rev. 29v5 10/30/2008
INTERPRETING DIFFRACTOGRAMS AND PERFORMING SEMIQUANTITATIVE
CALCULATIONS
Diffractograms are interpreted by measuring the heights and positions of the peaks they contain. The
peak position data are compared with the known positions of peaks for the five clay-mineral groups,
The positions of the peaks are dependent upon the d-spacing of the unit cell in the c-axis direction and
is related to the angle 20 by Bragg's Law as described in the theory section. The d-spacings are
different for some of the clay-mineral groups, and behave in distinctly different ways for others,
allowing for their identification. The peaks, that are observed, are of the first-order, 001 reflection,
second-order, 002 reflection, third-order, 003 reflection, and fourth-order, 004 reflection. The first-
order peak is an actual measurement of the minerals d- spacing and the rest are usually multiples of
this first-order angle. The exception to this is the disordered or random-mixed-layered-clay minerals.
For these, the peaks are broader and their positions lie at irregular intervals. Their positions are
between the normal positions of the closest peaks of the constituent clay minerals: this is Mering's
principle (Moore and Reynolds, 1989).
The heights of the peaks are a measurement of the diffracted x-ray beam's intensity and are taken to
indicate the relative abundances of the different clay-mineral groups. It should be noted that the height,
or intensity, of the diffracted-x-ray beam increases significantly at the lower angles (less than about 8°
2∅) due to polarization as described by the Lorentz-Polarization Factor (Moore and Reynolds, 1989).
This is taken into account when performing the calculations for the semiquantitative method. (Note:
Peak heights can no longer be compared directly from one run to another or between samples because
of the autosealing feature of the Jade program. It is now necessary to compare the count values
whose scale is located on the vertical axis of the diffractogram.)
47

Questa Rock Pile Stability Study 29v5 Page 58
Rev. 29v5 10/30/2008
The semiquantitative method used at the New Mexico Bureau of Mines and Mineral resources
indicates the presence and estimates the amounts of the clay mineral groups illite, smectite, kaolinite,
chlorite, and I/S. The method does not differentiate between specific clay-mineral species and it does
not distinguish vermiculite from other clay minerals.
1. Measure and record the following peak heights (counts on the vertical axis of the diffractogram)
above the background line.
If chlorite is present:
Mineral Order Symbol* Run Position 2∅
kaolinite 1 K1 air dried 12.35°
illite 2 I2 air dried 17.6°
chlorite 3 C3 air dried 18.4° to 18.9°
kaolinite 2 K2 air dried 24.9°
chlorite 4 C4 air dried 25.1°
Smectite/mixed 1 S1g glycolated 5.2°
illite 1 I1g glycolated 8.8°
illite 1 I1h heated 8.8°
*The Symbols (i.e. S1g) are interpreted as follows: The letter, in the first position, indicates the
mineral type; the number, in the second position, is the peak order; and the letter, in the third
position, indicates the particular run the peak comes from (airdried = no designation, g =
glycolated, and h = heated).
48

Questa Rock Pile Stability Study 29v5 Page 59
Rev. 29v5 10/30/2008
It may be necessary to perform a slower run over the C4 chlorite peak to differentiate chlorite from
kaolinite as previously described. Also compare the kaolinite peaks (K1) on the glycolated and heated
runs, They should have about the same count values above background. If not, this may indicate a
fluctuation in the XRO machine or degradation of the clay slide. If the difference is > 20%,
compensate for any corresponding changes in the illite peaks between the glycolated and heated runs
by applying the following correction, 1 h corrected = 1 h X (K1g/K1h).
If chlorite is not present:
Mineral Order Symbol Run Position 2∅
smectite/mixed 1 Slg glycolated 5.2°
illite 1 I1g glycolated 8.8°
kaolinits 1 K1 glycolated 12.35°
illite 1 I1h heated 8.8°
Compare the kaolinite peaks (K1) on the glycolated and heated runs. They should have about the same count values above background. If not, this may indicate a fluctuation in the XRD machine or degradation of the clay slide. If the difference is > 20%, compensate for any corresponding changes in the illite peaks between the glycolated and heated runs by applying the following correction: I 1 h corrected = I 1 h X (K1 g/K1 h).
Plug the values obtained in step I into the following formulas where appropriate. Calculate the amounts of the clay-mineral groups and round off to the nearest part in 10. All of the clay- mineral group’s amounts together should add 10 parts in 10.
49
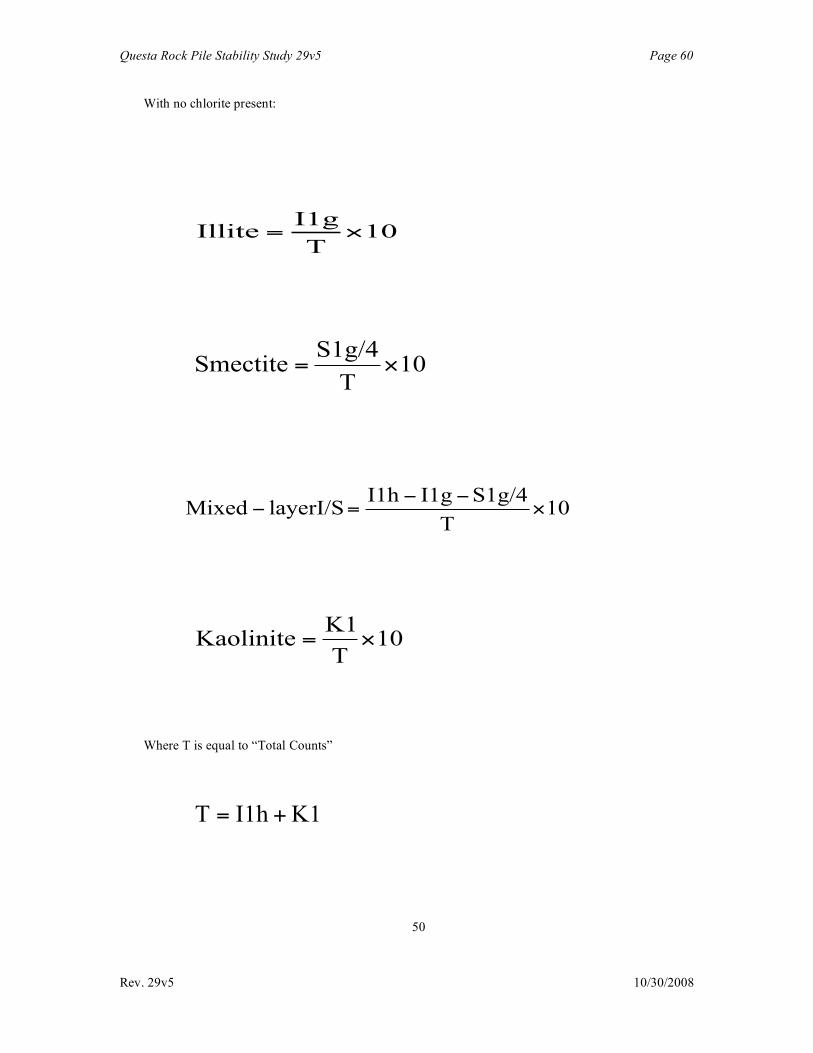
Questa Rock Pile Stability Study 29v5 Page 60
Rev. 29v5 10/30/2008
With no chlorite present:
Where T is equal to “Total Counts”
50
10T
I1gIllite !=
10T
S1g/4Smectite !=
10T
S1g/4I1gI1hlayerI/SMixed !
""="
10T
K1Kaolinite !=
K1I1hT +=
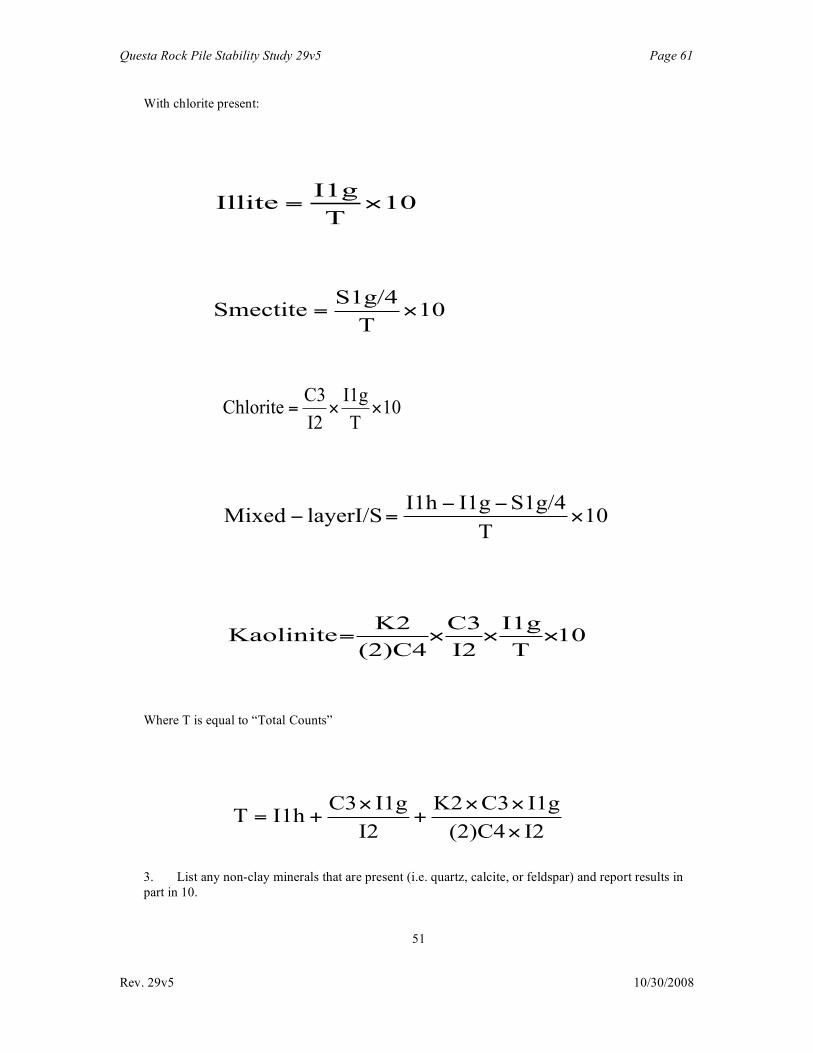
Questa Rock Pile Stability Study 29v5 Page 61
Rev. 29v5 10/30/2008
With chlorite present:
Where T is equal to “Total Counts”
3. List any non-clay minerals that are present (i.e. quartz, calcite, or feldspar) and report results in part in 10.
51
10T
I1gIllite !=
10T
S1g/4Smectite !=
10T
S1g/4I1gI1hlayerI/SMixed !
""="
10T
I1g
I2
C3
(2)C4
K2Kaolinite !!!=
10T
I1g
I2
C3Chlorite !!=
I2(2)C4
I1gC3K2
I2
I1gC3I1hT
!
!!+
!+=

Questa Rock Pile Stability Study 29v5 Page 62
Rev. 29v5 10/30/2008
At this point, a brief explanation of the basis of the formulas is appropriate. The simpler case without
chlorite will be covered. The formulas for each of the clay- mineral suites are fractions of the total, and
as such, should always add up to 10 parts in 10. The total intensity count (I1h + K1) theoretically
includes all the counts of all the clay-mineral suites involved. The term K1 is the counts for kaolinite.
The term I1 h contains the counts for illite, smectite, and I/S. This is because the smectite structure, in
both the pure smectite and I/S, collapses to 10 Å when heated due to the expulsion of water from its
interlayer space, Under this condition, no distinction can be made between illite and smectite with
XRD because their d-spacings are identical. The peak intensity (count) is raised by the added
diffraction contributed by the collapsed smectite at the angle corresponding to I 1 h.
The individual clay-mineral formulas use peaks that are the result of the specific clay mineral being
calculated. The intensities (counts) of these peaks are divided by the total to give ratios that are the
relative proportions of the individual clay minerals. The only exception to this is I/S in which the
proportion is found by calculating a remainder, or difference, by subtracting the known intensities
(counts) form I 1 h. This leaves only the mixed-layer fraction to account for the remaining intensity
(count).
It should be noted that S1 is divided by 4. The reason for this is that peaks at low angles of 2∅ have
exaggerated intensities due to polarization as described by the Lorentz-Polarization Factor. This
adjustment works well for the large majority of samples analyzed, but occasionally fails when the
sample contains a large amount of pure smectite and virtually no mixed-layer illite/smectite. When this
happens, the mixed-layer illite/smectite calculation gives a negative value that is physically impossible.
In this case, I 1 g and S 1 /4 combined are larger than I I h from which they are subtracted.
52

Questa Rock Pile Stability Study 29v5 Page 63
Rev. 29v5 10/30/2008
SPECIAL PROCEDURES
CURLERS AND PEELERS/FLOCCULATION
On occasion, particularly recalcitrant flocculation and curlers and peelers (material that delaminates
from the glass slides) may be encountered. These are considered together because their remedies
beyond the Standard Procedure are similar.
First, as already mentioned in the Standard Procedure, dilution should be tried. Continue diluting
samples until either flocculation or curling and peeling stops, or until the slides are too thin (have too
little clay) to obtain a usable diffraction pattern. (Note: it is possible to do some dilution on the slide by
placing less material on it. If necessary to cover the entire slide, put distilled water on it prior to adding
the clay suspension.
The water and suspension should be mixed with the tip of the dropper or pipette. This is particularly
useful for curlers and peelers.)
There is another technique that may be helpful for dealing with curlers and peelers. If dilution alone
does not solve the problem, consider making two slides that are as identical as possible. Use one for
the air-dried and glycolated runs and the other for the heated run. Because the one used for the heated
run is not expanded as far as when glycolated, less contraction occurs, therefore, there is less chance of
curling and peeling. It is not desirable to use two different slides for one analysis, but in this case, it
may be the best that can be done. The smear method for dealing with curlers and peelers, mentioned in
Chapter 5 of Moore and Reynolds (1 989) does not solve the problem of curling and peeling on the
heated run where it occurs most. Therefore, it will not be considered here.
53

Questa Rock Pile Stability Study 29v5 Page 64
Rev. 29v5 10/30/2008
MAKING SLIDES WITH SMALL AMOUNTS OF SAMPLE
If slides must be prepared from only a few grams of sample and/or only a small amount of clay exists
in a sample, the standard procedure may produce slides that are too thin. This is remedied by wet
grinding the sample, if necessary, to release as much clay as possible. The sample should be collected
into a 100 ml beaker and filled with only a small amount of distilled water. The beaker should be filled
to 10 ml to 20 ml. If necessary, a larger volume can be reduced to this amount by centrifugation.
ALTERNATE METHOD FOR PREPARING SLIDES
It has not been necessary to use other methods of preparing slides in the Clay Lab, However, one
method is worth mentioning and has its benefits. It is the Millipore Filter Transfer Method. The
method requires collecting clay suspension with particle sizes of < 2um and filtering the clay out of
suspension onto a paper filter. The clay film on the filter is then transferred to a glass slide. The benefit
of this method over the conventional glass slide method is that the clay surface presented to the x-ray
beam is more representative of the actual amounts of the various clay minerals. This method is
preferred for quantitative analysis. The drawback is that the method is time consuming and requires a
lot of practice to perfect. The procedures for this method and other methods are given in Chapter 5 of
Moore and Reynolds, 1989.
ADDITIONAL HELPFUL TECHNIQUES USED FOR CLAY MINERALS.
There are some situations in which it may be difficult to distinguish between two clay-mineral groups or more detailed information is desired. Additional techniques may be required to resolve the problem. Two techniques that can be useful are heating and cation saturationlexchange (or both).
54

Questa Rock Pile Stability Study 29v5 Page 65
Rev. 29v5 10/30/2008
Heating clay minerals can do several things. At temperatures lower than 500°C interlayer water,
ethylene glycol, or glycerol are removed with resulting changes in the diffraction patterns.
At temperatures higher than 500°C, the clay-mineral structures can be altered or destroyed completely.
Different clay minerals undergo these changes at different temperatures and in different ways allowing
for additional or further identification. For example, heating a sample suspected of having a mixture of
chlorite and kaolinite to 550°C for 1hr will destroy the kaolinite structure leaving behind chlorite. The
result of heating will be seen on the diffraction pattern. This technique, depending on the outcome,
may not be definitive, but it may help. Heating can also differentiate between vermiculite and chlorite.
By heating a sample suspected of containing vermiculite and chlorite to 3000 for 1 hr, the vermiculite
structure will collapse to IOA leaving the remaining chlorite peak at 14A. Heating is also used to
distinguish between Fe-rich and Mg-rich chlorite. If heating a chlorite sample at 5000' C for 1 hr
increases the peak intensity at 14A, the sample is Fe-rich. If heating the sample at 60011 C for 1 hr
increases the peak intensity at 14A, the sample is Mg-rich (Austin and Leininger, 1976).
Cation exchange/ saturation is important because it can be used in some cases for further identification,
and for determining/controlling other physical properties that are related to interlayer cations. Cations
can be exchanged, and a clay mineral can become saturated, by exposing it to a salt solution rich in a
particular cation. In general, the ease with which one cation can be replaced by another is as follows
(Moore and Reynolds, 1989):
Na+ < K+ < Ca2+ < Mg2+ < NH4+
i.e. ca2+ is held more firmly in the interlayer space than Na+. An interesting property of expandable-
clay minerals is a positive correlation between cation
55

Questa Rock Pile Stability Study 29v5 Page 66
Rev. 29v5 10/30/2008
exchange capacity and layer charge. Working backwards, it is possible to estimate layer charge based
on measured cation-exchange capacity.
Cation saturation before using XRD identification techniques can make them more effective by reducing the diffuseness of the diffraction maxima. For example, using a 1 N solution of Mg2+ will make the distinction between smectite, vermiculite, and chlorite more pronounced.
56
Questa Rock Pile Stability Study 29v5 Page 67
Rev. 29v5 10/30/2008
Chapter 5: Bulk-Mineral Analysis
Bulk-mineral analysis in the Clay Lab is primarily intended to identify non-clay minerals using
randomly-oriented-sample-mounting techniques, however, peaks of clay-mineral phases can
sometimes be seen. This chapter will cover the theory of randomly-oriented-sample preparation and
how peaks are produced from these orientations. Additionally, the standard procedure for running
these samples on the XRD machine and interpreting the diffractograms will also be presented. With the
addition of newer equipment, it is also necessary to provide a special procedure for using this
equipment to take advantage of its beneficial features.
THEORY
In order to interpret bulk-mineralogy-XRD patterns, the lab worker must have an understanding of
both mineralogy and XRD. This section will add to the information already presented in Chapter 4 by
extending it to all crystallographic dimensions. It will also consider the production of peaks (x-ray-
reflection maximums) using randomly- oriented-powder-mounting techniques.
MINERAL STRUCTURE.
A mineral is a naturally occurring inorganic element or compound having an orderly-internal structure
and characteristic-chemical composition, crystal form, and physical properties (Bates and Jackson,
1987). Dimensions related to the crystal form of a mineral are measured using XRD and are used for
the identification of mineral phases in bulk-mineral analysis.
The primary difference between bulk-mineral analysis and clay-mineral analysis is that bulk-mineral
analysis uses XRD to measure the
57
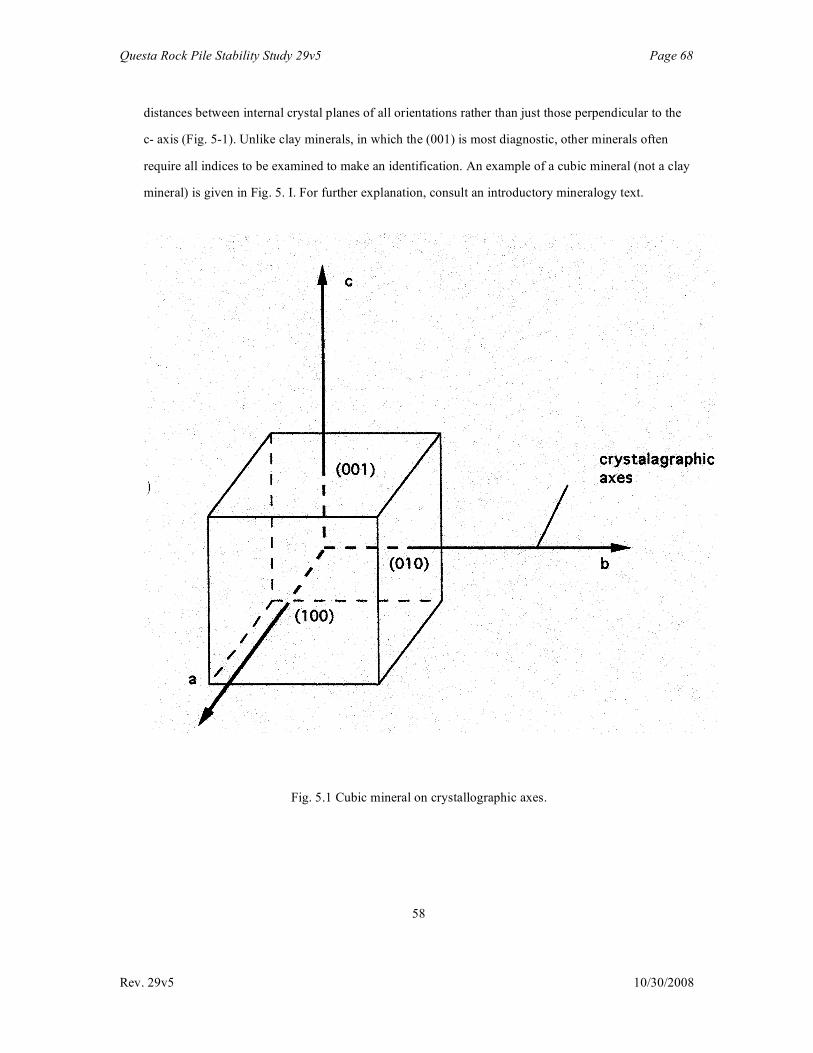
Questa Rock Pile Stability Study 29v5 Page 68
Rev. 29v5 10/30/2008
distances between internal crystal planes of all orientations rather than just those perpendicular to the
c- axis (Fig. 5-1). Unlike clay minerals, in which the (001) is most diagnostic, other minerals often
require all indices to be examined to make an identification. An example of a cubic mineral (not a clay
mineral) is given in Fig. 5. I. For further explanation, consult an introductory mineralogy text.
Fig. 5.1 Cubic mineral on crystallographic axes.
58

Questa Rock Pile Stability Study 29v5 Page 69
Rev. 29v5 10/30/2008
XRD USING RANDOMLY ORIENTED POWDER MOUNTS
The powder mounts used ideally have perfect-random-oriented-crystal grains. This is accomplished by
grinding the sample to < 70 mesh and pouring them into a sample holder in a manner that does not
align the crystals preferentially along their faces. When exposed to an incident x-ray beam, certain
crystal grains, with the appropriate orientations, will produce a reflected (diffracted) beam in
accordance with Bragg's law. These reflected beams show up as peaks on the diffractogram. The
explanation of how these peaks are produced at the specific angles is very complex and beyond the
scope of this manual. For a simplified case of XRD, refer to the Theory Section in Chapter 4 of this
manual. For a further explanation of this phenomenon, see Klug and Alexander (1974).
STANDARD PROCEDURE
The standard procedure is in two sections. The first covers sample preparation and running samples on
the XRD machine (Norelco@ with a horizontal-sample-mount goniometer: the axis of rotation is also
horizontal). The second covers interpreting diff ractograms.
SAMPLE PREPARATION AND RUNNING SAMPLES ON THE XRD MACHINE
1. If available, use remaining sample from EDTA leaching procedure that was split, crushed, and passed
through a 70-mash sieve. Go to step 4. If not available, precede to step 2.
2. Split the sample as described in Chapter 1, but only keep a 20-gm split. 3. Grind the split in a
mortar and pass through a 70-mesh sieve.
Any sample that does not pass through the sieve should be returned to the mortar for further grinding.
Repeat the sieving and grinding until entire
59
sample is passed through the sieve. Mix sample thoroughly.

Questa Rock Pile Stability Study 29v5 Page 70
Rev. 29v5 10/30/2008
4. Attach the glass slide to the aluminum sample well with a clip. Slowly pour sample into sample well
using the special-design-funnel device (Fig. 5.2). It is preferable to pour the sample by lightly
tapping the sample container and allowing the sample well to fill slowly than pouring the sample
rapidly into the funnel in one fast shot. This causes the sample to stick in the funnel, and if tapping is
used to free it, there is a tendency to orient the sample grains along the plane of the glass slide.
Fig. 5.2. Sample well loading equipment.
5. load sample onto Norelco XRD with a horizontal-mount goniometer
60
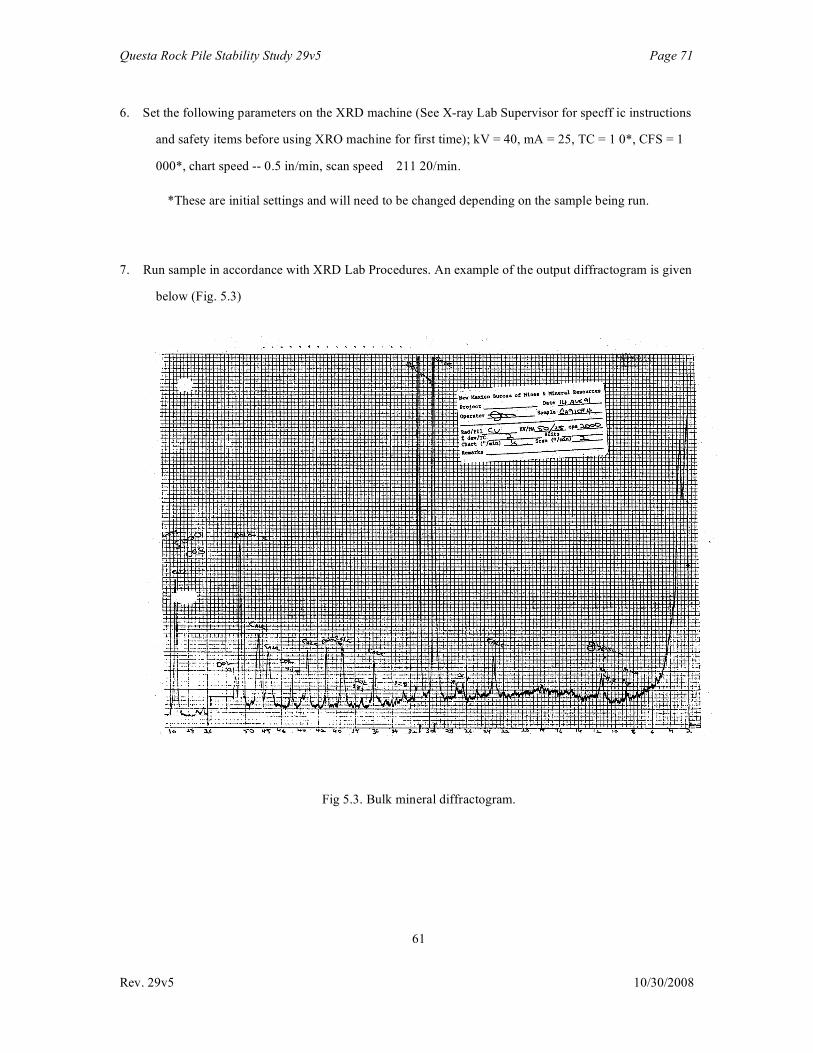
Questa Rock Pile Stability Study 29v5 Page 71
Rev. 29v5 10/30/2008
6. Set the following parameters on the XRD machine (See X-ray Lab Supervisor for specff ic instructions
and safety items before using XRO machine for first time); kV = 40, mA = 25, TC = 1 0*, CFS = 1
000*, chart speed -- 0.5 in/min, scan speed 211 20/min.
*These are initial settings and will need to be changed depending on the sample being run.
7. Run sample in accordance with XRD Lab Procedures. An example of the output diffractogram is given
below (Fig. 5.3)
Fig 5.3. Bulk mineral diffractogram.
61

Questa Rock Pile Stability Study 29v5 Page 72
Rev. 29v5 10/30/2008
INTERPRETING DIFFRACTOGRAMS
Diffractogram analysis can be very easy, in cases where only one or two common minerals are to be
identified, or it can be extremely difficult when a sample contains numerous uncommon minerals. The
following procedure has evolved over time in the Clay Lab as a means of analyzing most
diffractograms. If this standard procedure proves insufficient, go to the special procedure that employs
a computerized search of the Powder Diffraction File (PDF).
1. Compare diffractogram with pre-prepared traces of common minerals. Both the Clay Lab and the X-
ray Lab have collections of these. If minerals are identified, label the associated peaks as those
minerals.
2. Look up the identified minerals in the PDF and search for peaks (paying attention to intensites) that
may be missing on the pre-prepared traces. label any that are found.
3. The remaining peaks (or all the peaks if none were eliminated in step 1) should be checked using
tables in Walker and Renault (1972). If minerals are identified, label the associated peaks as those
minerals.
4. Look up the identified minerals in the POF and search for peaks (paying attention to intensities) that
are not listed in Walker and Renault (I 972).
5. All remaining peaks should be looked up in the determinative table in Brindley and Brown (I 980). It
is best to make a list of possible minerals (with intensities) next to each peak. When this is done for
each peak, likely minerals will show up in several of the lists. Check to see that the relative
intensities of the peaks reasonably match those given in the table for each mineral identified.
62

Questa Rock Pile Stability Study 29v5 Page 73
Rev. 29v5 10/30/2008
6. Look up the identified minerals in the PDF and search for additional peaks (paying attention to
intensities) that were not listed in the determinative table in Brindley and Brown (1980).
7. By now, most of the peaks should be accounted for. If just a few peaks remain, it is not likely that their
identities will be found. Label them with a question mark. If more than a few peaks remain or if this
method did not work, go to the Special Procedure Section of this chapter.
SPECIAL PROCEDURE
This special procedure uses the search/match function contained in the Jade XRD analysis program.
This function searches the PDF, according to parameters set by the operator, to find matches with the
data being analyzed. The specific instructions for using Jade will not be discussed here, but they are
available in the Jade- Instruction Manual. Also the X-ray Lab Supervisor can be of some help.
The biggest obstacle to using this procedure is entering the data into the Jade-XRD-analysis
program. There are several ways of doing this. The first way, and the most impractical in terms of
time, is to set up a numerical data file that approximates the data (peaks) obtained from the Standard
Procedure; this has not been done by Clay-lab workers to date.
The second method is to graphically create a blank scan (see Jade Instruction Manual), This allows
you to graphically create a copy of the diffractogram obtained from the Standard Procedure. This
method has met with some success, but has the drawback of loosing precision of peak heights and
positions. The third procedure, which will be presented here, is to prepare the sample to be run on the
XRD machine connected to the computer containing Jade. The sample preparation is different
because this XRD machine has a vertical-mount goniometer.
63

Questa Rock Pile Stability Study 29v5 Page 74
Rev. 29v5 10/30/2008
1 - There are three sample preparation techniques for running samples on the vertical- mount goniometer.
They are as follows:
a. Prepare the sample and load it into the sample well as in the standard procedure. Cover the sample
in the well with x-ray-transparent film to keep the sample from coming out of the well. Use tape to
attach the film.
b. Grind the sample to a much finer size and press it into a sample well with a glass slide. The
smaller size is much more likely to stay in the well when placed in a vertical position and will become
less oriented when pressed.
c. Grind the sample to a much finer size and press into a rotating mount. See the X-ray Lab
Supervisor for details.
2. Run samples on the XRO machine using parameter settings analogous to the standard procedure
(refer to the Jade@ and Talk@ Instruction Manuals).
3. Analyze resulting data using the Search/Match function of the Jade@ program (refer to the
Jade@& Instruction Manual).
64

Questa Rock Pile Stability Study 29.2 Page 75
Rev. 29.3 1/14/04
References
Austin G. S., and Leininger, 1976, The aff ect of heat-treating sedimented mixed-layer [-S as related to quantitative clay mineral determinations: Journal of Sedimentary Petrology v46, p. 206-21 5.
Bates, R. L., and Jackson, J. A., eds., 1987, Glossary of Geology: American Geological Institute, Alexandria, Virginia, 788 p.
Bodine, M. W., and Fernaild, T. H., 1973, EDTA Dissolution of gypsum, anhydrite, and Ca-Mg carbonates: Journal of Sedimentary Petrology, v. 43, p. 1152-1156.
Brindley, G. W., and Brown, G., 1980, Crystal Structures of Clay Minerals and Their X-ray Identification: Mineralogical Society, London, p. 305-359.
Head, K. H., 1980, Manual of Soil Laboratory Testing: v. 1, Pentech Press, London, p. 1-44, 143-186, 238-260.
Kezdi, A., 1979, Handbook of Soil Mechanics, v. 2, Elsievier Scientific Publishing Company, New York, p. 61-75.
Johnson, A. 1. and Moston, R. P., 1976, Use of ultrasonic energy for disaggregation of soil samples; in Wheeler, J. B., ed., Soil Specimen Preparation: American Society for Testing and Materials, Philadelphia, p. 308-312.
Klug, H. P., and Alexander, L. E., 1974, X-ray Diffraction Procedures: John Wiley & Sons, New York, p. 38-41, 132-135, 175,176.
Liu, C., and Evett, J. B., 1984, Soil Properties: Prentice-Hall, Englewood Cliffs, New Jersey, p. 61-87.
Moore, 0. M., and Reynolds, R. 0. Jr., 1989, X-Ray Diffraction and the Identification and Analysis of Clay Minerals: Oxford University Press, New York, p. 57, 86, 86, 90, 102-105, 115-117, 185-188, 241.
65
Walker, C. W., and Renault, J. R., 1972, Determinative Tables of 20 Cu and 20 Fe for Minerals of Southwestern United States: New Mexico Bureau of Mines and Mineral Resources, circular 127, 102 p.