sonic boom research - nasa preface a. richard seebass invited papers brief review of the basic...
TRANSCRIPT

SONIC BOOM
- - \ '
8 (ACCESSION N ~ B E R )
3 1 ; j 0, '(PAGES) t /'
RESEARCH
(THRU) ., rrl
(CATEGORY)
https://ntrs.nasa.gov/search.jsp?R=19680011944 2018-05-18T14:44:10+00:00Z
SONIC BOOM
~ ~~
N A S A SP-147
RESEARCH
EDITED BY
A. R. SEEBASS
Proceedings of a conference held at the National Aero- nautics and Space Administration, Washington, D. C., April 12, 1967, on research on the generation and propagation of sonic booms and chaired by W. D. Hayes of Princeton University.
Scientific and Technical Information Division OFFICE OF TECHNOLOGY UTILIZATION 1967 NATIONAL AERONAUTICS AND SPACE ADMINISTRATION
Washington, D.C.
Preface
This NASA Special Publication contains invited papers and contributed written remarks from the Sonic Boom Research Con- ference held at NASA Headquarters on April 12, 1967. This in- formal conference was organized by the Research Division of the Office of Advanced Research and Technology. The purpose of the meeting was to ascertain those areas of sonic boom research that are the most pressing from the standpoint of commercial super- sonic transport (SST) operation and to determine whether or not all possible aerodynamic means of reducing sonic boom overpres- sures were being explored. We were fortunate to have Professor Wallace D. Hayes serve as chairman of the meeting. He did an admirable job of keeping the meeting informal, the discussion open, and the discourse fruitful.
It is difficult to overemphasize the importance of the phenome- non we call the sonic boom. At present several countries are con- sidering regulations restricting proposed SST’s to subsonic opera- tion over populated areas. It is my feeling that many countries will require the first generation of these transports to circumnavi- gate such areas or to operate subsonically over them in order to avoid public reaction to their sonic booms. For the SST generation of aircraft to be a true economic success, it may be necessary for later generation SST’s to be capable of supersonic operation over- land.
Nobody knows what sonic boom overpressures will eventually prove to be acceptable. A nominal overpressure value of 1.5 pounds per square foot seems to be tolerable; however, it seems unlikely that such a value will prove to be acceptable on a routine basis. Current opinion is that the overpressures may have to be reduced to values as low as 1 pound per square foot to be acceptable.
There are two obvious ways to reduce sonic boom overpressures ; neither seems practical at present. Obviously, if the airplane can fly higher with no increase in weight, then the overpressures will be reduced. However, a 20-percent reduction in overpressure requires an 18-percent increase in altitude, which means bigger engines, more weight, more drag due to lift, and so forth. Thus,
iii

to achieve a 20-percent reduction in overpressure a t the altitudes of interest requires not only an 18-percent increase in altitude, but also a substantial decrease in the payload. Real breakthroughs in engine technology seem needed to change this situation. An- other way to reduce the overpressures is to make the SST’s lighter and longer. Bringing the cruise overpressures of current SST’s down to 1 pound per square foot would necessitate making the aircraft 50 percent longer and a t the same time halving their cruise weight ; weight reduction makes the major contribution to this decrease in overpressure level. These changes would require an enormous advance over present materials and structural tech- nology.
It is clear that we must be certain that all aerodynamic means of reducing sonic boom overpressures have been explored. The sentiment among many knowledgeable aerodynamicists is that all means have been explored, and that we cannot expect sizable reductions in the anticipated overpressure levels. The usual argu- ment is that the weight of the aircraft must be supported on the ground, and that the overpressures there are necessary to carry the weight of the aircraft. While this is indeed the situation, the full argument is somewhat more complex. Typically, a 700 000- pound, 300-foot-long aircraft flying at a Mach number of 3 and an altitude of 70 000 feet has an overpressure level of 1.5 pounds per square foot. Yet if the pressures on the ground were distributed uniformly in the axial direction between the intersection of the aircraft‘s fore and af t Mach cones with the ground and if they decayed in the usual manner with radial distance and azimuthal angle, then the maximum pressure on the ground required to sup- port the aircraft would be less than 0.01 pound per square foot. The actual overpressures that result are most easily understood by relating them to the pressure field generated by the aircraft. It is important to recognize that while it is possible to move a given volume through the air a t supersonic speeds without producing a sonic boom, and while it is impossible to generate supersonic lift alone without incurring the boom, it is possible to employ volume effects to alleviate a portion of the boom due to lift alone.
A panel composed of four of the participants discussed the meeting with members of the Research Division. From their re- marks and subsequent letters we reached the following con- clusions :
(1) It is clear that it is possible to predict accurately the sonic boom signatures for steady flight in a homogeneous atmosphere. Futhermore, attempts at sonic boom reduction through midfield modification at the signature seem to offer the only realistic hope
iv

'
of reducing the boom by aerodynamic design. There is some chance, however, that we aerodynamicists have been too conven- tional in our thinking and have overlooked exotic configurations with reduced sonic booms and otherwise reasonable aerodynamics.
(2) At present only one group in this country has taken a care- ful look a t the effects of the atmosphere on the propagation of the boom. Their results are suspect on several minor, but perhaps not inconsequential, points. Furthermore, present quantitative studies of the effects of the atmosphere on the sonic boom have yet to be generalized to give the full overpressure signature. (3) In view of the importance of the phenomenon, present
scientific understanding is not as complete as it should be; there is a clear need for the active participation of knowledgeable aero- dynamicists and engineers in sonic boom research in order to elevate the level of our understanding.
My assessment of the meeting is that it stimulated interest in various aspects of sonic boom research. Also, it gave NASA a chance to acquaint outside scientists with its research efforts and to have those efforts appraised by a competent and critical group. Further, i t showed that there is no unanimity on whether or not all means for reducing the boom were being pursued, and in fact the general sentiment seemed to be that they were not. Neverthe- less, many of the participants seem to share my skepticism that there are any avenues which are not currently being explored that will lead to real aircraft configurations with substantially lower peak overpressures.
A. RICHARD SEEBASS August 1967
V
Contents
Preface A. RICHARD SEEBASS
INVITED PAPERS
Brief Review of the Basic Theory WALLACE D. HAYES
Experimental and Analytical Research on Sonic Boom Generation a t NASA
HARRY W. CARLSON
Sonic Boom Flight Research-Some Effects of Airplane Operations and the Atmosphere on Sonic Boom Signatures
DOMENIC J. MAGLIERI
Some Effects of the Atmosphere on Sonic Boom EDWARD J. KANE
Sonic Boom Effects on People and Structures HARVEY H. HUBBARD AND WILLIAM H. MAYES
CONTRIBUTED REMARKS
Sonic Boom Reduction ADOLF BUSEMANN
Page
iii
3 J 9 J
49 J 65 ./
79
The Possibilities for Reducing Sonic Boom by Lateral 83 Redistribution
A. R. GEORGE
Possible Means of Reducing Sonic Booms and Effects 95 Through Shock Decay Phenomena and Some Comments on Aural Response
RICHARD K. KOEGLER
vii

On Supersonic Vehicle Shapes for Reducing Auditory 103 Response to Sonic Booms
WALTON L. HOWES
Brief Remarks on Sonic Boom Reduction ANTONIO FERRI
A Boomless Wing Configuration E. L. RESLER, JR.
107
109
Comments on Focusing Due to the Atmosphere 115 M. B. FRIEDMAN
Participants 117
viii

INVITED PAPERS
Brief Review of the Basic Theory
WALLACE D. HAYES Princeton University
An aircraft moving through the atmosphere at supersonic speed emits a disturbance which moves in the atmosphere approxi- mately as an acoustic wave system. Although in most aspects this wave system propagates according to the laws of linear acoustics, there are weak but cumulative nonlinear effects which distort the wave signatures. As a result of these effects, shock waves can be created or can merge. A general tendency is for the signature to approach an N wave, with two shock waves, an expansion wave in between, and generally a weak “tail” behind the second shock.
When this distorted acoustic signal hits an observer, he hears a “sonic boom,” and this term (sonic bang in Great Britain) is used to refer to the signal. When a sonic boom hits a building, the windows may rattle and even break, and there may be some structural damage. An important factor in the design of a super- sonic transport to fly over land is the necessity to keep these effects within acceptable limits. Knowledge and utilization of the appropriate theory is essential in a study of sonic boom.
The phenomenon of sonic boom is well described by a theory of quasilinear geometrical acoustics. This theory may be divided conceptually into several component parts, corresponding to the calculations required in a computation: (a) for the local flow field near the aircraft and the associated asymptotic disturbance far from the aircraft; (b) for the tracing of a sound ray through a nonuniform atmosphere with winds; (c) for the calculation of the area of a ray tube as it varies along a ray; (d) fo r the calcu- lation of an “age” variable; and (e) the use of the age variable in obtaining the signature after its distortion due to nonlinear effects.
The appropriate theory (a ) , due to Hayes (ref. l), is that cor-
3

4 SONIC BOOM RESEARCH
responding to the term “supersonic area rule.” An alternative exposition has been given by Lomax and Heaslet (ref. 2) . In this theory, the asymptotic disturbance field f a r from the aircraft is first calculated from linearized theory. In the original application of the theory these results are then used in the calculation of the drag of the aircraft. The results of the first part of the calculation are precisely what are needed in the sonic boom calculation ; these results are for the Whitham F function, as functions of an azimuthal angle and of a signature coordinate.
The appropriate theory (b) for the ray according to geometrical acoustics, as also the corresponding theory for geometrical optics, is one for the extremals in a minimum time problem of the cal- culus of variations. The assumption of an ideal layered atmos- phere, one without vertical winds and with all properties being functions of altitude alone, leads to a Snell’s law, essentially a first integral for the extremals. This Snell’s law gives the inclina- tion of the wave fronts; the rays are normal to the wave fronts only where the winds are zero.
A ray tube is simply a bundle of neighboring rays. In a partic- ular calculation the rays form a two-parameter family. The ap- propriate theory (c) for the ray-tube area A is a direct extension of that for the rays, one which involves a differentiation with respect to the two parameters determining the rays. In an atmos- phere without winds the acoustic energy p2/pa2 per unit volume is conserved, and for each value of the signature coordinate p2A/pa is constant along a ray. With steady winds, acoustic energy is not conserved, and must be replaced by the Blokhintsev (ref. 3) en- ergy invariant p2cJPa3 ; here c,=a+n - v, v is the wind velocity, and n is a unit vector normal to the wave fronts. This “energy” flows with the group velocity c=an+v. The quantity p 2 ~ , 2 A / p a 3 is constant along rays, where A is the area of a ray tube as cut by a wave front. Alternative expositions of the Blokhintsev invariant have been given by Ryzhov and Shefter (ref. 4) and by Hayes (ref. 5) .
The strength of the acoustic signal is, of course, changed during propagation as a result of changes occurring in the various quan- tities appearing in the acoustic (or Blokhintsev) energy invariant, for example, p, a, and A . In addition, the signal is distorted as a result of nonlinear effects. The correct theory for this distortion was given by Landau (ref. 6 ) for the cases of planar, cylindrical, and spherical symmetry in a uniform atmosphere. An equivalent theory was presented by Whitham (ref. 7) for the case of a super- sonic body of revolution, essentially the cylindrical case. As was shown by Hayes (ref. 8), the case of an aircraft in uniform flight
BRIEF REVIEW OF THE BASIC THEORY 5
in a uniform atmosphere leads to the same problem as for the body of revolution, but with the azimuth angle as an independent parameter. The basic equation in the planar case may be identified as an inviscid Burgers’ equation.
The mathematical problem in the general case, with the atmos- phere nonuniform and the aircraft not necessarily in uniform flight, can be reduced to the form appropriate to the planar prob- lem through the introduction of an “age” variable. In Landau’s original analysis this variable is simply distance in the planar case, r‘h in the cylindrical case and In r in the spherical case. In the general case without winds it is proportional Ja-#,,-’hA-Hds ; where s is distance along the ray. Such an age variable for a nonuniform atmosphere was first used by Whitham (ref. 9).
The appropriate theory (d) is thus one which reduces the prob- lem to that of solving an inviscid Burgers’ equation. The trans- formation that accomplishes this defines the age variable. It is a little more complicated with steady winds than without winds. The proper form was applied to N waves by Ryzhov and Shefter (ref. 4), using the results of Shefter (ref. 10) . The form given by Hayes (ref. 5 ) is in error, and requires a factor u/c, under the integral.
Finally, the appropriate theory (e) for the distortion of the pro- file is that of Landau (or Whitham) mentioned earlier. The signature is distorted through a simple affine transformation de- pendent upon the “age,” and the problem remains of locating shock waves in the signature and of determining what parts of the curve correspond to actual points in the final signature. This is done through a (by now) well-known integral condition. An in- structive alternative method is due to Burgers (ref. 11).
Thus the basic theory is a composite one, involving a local theory near the aircraft, a geometric acoustics theory, and a nonlinear distortion theory. As with any simplified theory, there are errors of various kinds and cases where the theory fails. The prizcipal assumptions are those of geometric acoustics-that the charac- teristic scale and time of the signature are small compared with the atmospheric scale height and wave front radius of curvature and with various natural periods of the atmosphere. The failure of these assumptions near the aircraft does not limit the theory, as this factor is taken care of by the local analysis. The theory fails completely near a caustic, where the rays have an envelope and the geometric ray-tube area goes to zero. Here, additional theoretical work needs to be done, particularly on nonlinear effects in caustics. The theory does not cover diffraction effects near a “shadow” or “cutoff” point, where rays are tangent to the ground.
6 SONIC BOOM RESEARCH
One question not fully resolved is whether nonlinear effects can significantly alter the rays or can significantly affect the ray- tube areas. Such effects could appear only with appreciable lateral derivatives of the signature profile, that is, derivatives in the wave fronts. Here also additional theoretical work is required.
Little has been done on the problem of specifically determining how to design an aircraft to have small sonic boom or minimum sonic boom. The first question here is what measure of this sonic boom properly measures its deleterious effects. In other words, just what should be minimized, or just what should be kept below a fixed value for the boom to be acceptable? The maximum shock strength does not appear to give the best measure.
I n the design of the aircraft certain parameters are inescapable, in particular the volume of the aircraft, the lift on the aircraft, and its drag. Although a certain minimum drag cannot be avoided, it is also essential that the drag not be too great. The concept of the Busemann biplane and the extensions of the concept in three dimensions indicate that the volume of the aircraft presents no inherent unavoidable limitation.
According to the concept of Hayes (ref. l ) , that underlying the supersonic area rule, for a distant observer at a given azimuth angle the aircraft is equivalent to a linear source distribution. It is the signal observed by such an observer that develops into the sonic boom. There is only one essential inescapable parameter controlling this signal ; this parameter is the total equivalent source strength, or zeroth moment of the equivalent linear source distribution, for the given azimuth angle. This parameter is the sum of three terms. The first term is proportional to the lift times the cosine of the azimuthal angle measured from the direction opposite the lift vector. The second and third terms together correspond to the total net source strength represented by the aircraft system. The second term is proportional to the total cross- sectional area of the engine jets fa r downstream minus the corre- sponding upstream area of the air captured by the engine intakes. The third term is proportional to the density decrease from the heating by the shock wave system of the air flowing outside the aircraft and closely proportional to the total entropy increase in '
the outer flow or to the drag of the aircraft. These three terms are generally all of the same sign below the
aircraft, so that the total equivalent source strength connected with the sonic boom cannot ever be zero. Thus the sonic boom below the aircraft is truly inescapable. The best we can hope for is that the boom is a minimum for given values of this parameter, with limits on the magnitude of the drag.

I BRIEF REVIEW OF T H E BASIC THEORY 7 * D.
REF E R ENC ES
1. HAYES, W. D.: Linearized Supersonic Flow. Thesis, Calif. Inst. of Tech., 1947. (Reprinted as North American Aviation Report AL-222, 1947.)
2. LOMAX, H.; AND HEASLET, M. A.: Recent Developments in the Theory of Wing-Body Wave Drag. J. Aero. Sci., vol. 23, 1956, pp. 1061-1074.
3. BLOKHINTSEV, D. I.: Acoustics of a Nonhomogeneous Moving Medium. Gostekhizdat, Moscow, U.S.S.R., 1946. (Translated as NACA TM- 1399, 1956.)
4. RYZHOV, 0. S.; AND SHEFTER, G. M.: On the Energy of Acoustic Waves Propagating in Moving Media. Prikl. Mat. Mekh., vol. 26, 1962, pp.
5. HAYES, W. D.: Long-Range Acoustic Propagation in the Atmosphere. Inst. for Defense Analyses, Jason Res. Paper No. P-50, 1953.
6. LANDAU, L. D.: On Shock Waves Far From Their Source. Prikl. Mat. Mekh., vol. 9, 1945, pp. 286-292.
7. WHITHAM, G. B.: The Flow Pattern of a Supersonic Projectile. Comm. Pure Appl. Math., vol. 5, 1952, pp. 301-348.
8. HAYES, W. D. : Pseudotransonic Similitude and First-Order Wave Struc- ture. J. Aero. Sci., vol. 21, 1954, pp. 721-730.
9. WHITHAM, G. B.: The Propagation of Weak Spherical Shocks in Stars. Comm. Pure Appl. Math., vol. 6, 1953, pp. 397-414.
10. RYZHOV, 0. S.: Attenuation of Shock Waves in Nonuniform Media. Prikl. Mat. Tekhn. Fiz., no. 2, 1961, pp. 15-25.
11. BURGERS, J. M.: Further Statistical Problems Connected With the Solu- tion of a Simple Nonlinear Partial Differential Equation. Proc. Kon. Ned. Akad. Wetens., ser. B, vol. 57, 1954, pp. 159-169.
1293-1309.

I
~
I
I
Experimental and Analytic Research on Sonic Boom Generation at NASA
HARRY W. CARLSON
Langley Research Center, NASA
INTRODUCTION
The Langley Research Center of the National Aeronautics and Space Administration has been engaged in research dealing spe- cifically with sonic boom generation since 1958. This review describes some of that research and summarizes the more signif- icant findings. First, the nature of the sonic boom phenomena is described, and then the analysis methods employed are outlined in brief. Examples of the correlation of sonic boom predictions with data from wind-tunnel and flight tests are given, and finally, minimization concepts are discussed and illustrated.
SYMBOLS
incremental pressure due to flow field of airplane or model effective area distribution of airplane or model equivalent
Mach number distance measured along longitudinal axis from airplane
or model nose distance measured parallel to airplane or model longitudi-
nal axis from bow-shock position to point on pressure signature
body, including effect of lift as well as volume
Mach angle, sin-] (1/M) angle of attack, deg lift coefficient time, sec airplane or model length airplane altitude or lateral distance from model
9

10 SONIC BOOM RESEARCH
DISCUSSION
The nature of the problem may be illustrated with the aid of figure 1. The problem is: given an airplane in straight and level supersonic flight, define the surrounding pressure field. The pres-
L
FIGURE 1.-Sonic boom pressure field.
sure distribution as represented by the signatures must cover both the near field and the fa r field. Near the airplane the pressure signature is complex and both its shape and magnitude depend on the shape of the airplane. At a sufficiently large distance where the characteristic far-field N wave was formed, only the magni- tude is dependent on the airplane shape. Since the extent of the near-field region is not usually known beforehand, the general or near-field analysis is now employed as a matter of course.
One key step in arriving a t a workable solution has been the application of the equivalent body principle developed by Hayes, Whitcomb, Jones, and others. For moderate or large distances from the airplane, little error will result if disturbances from all parts of the airplane are assumed to be concentrated on the longitudinal axis (provided that the disturbances are properly superimposed and that all disturbances, including those asso- ciated with lift, are taken into account). Use of supersonic area- rule concepts satisfies these requirements.
SONIC BOOM GENERATION 11
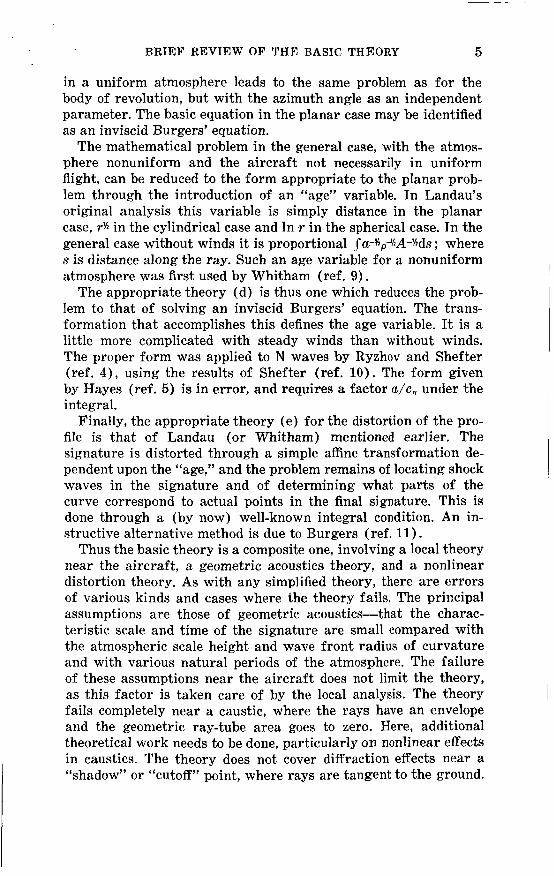
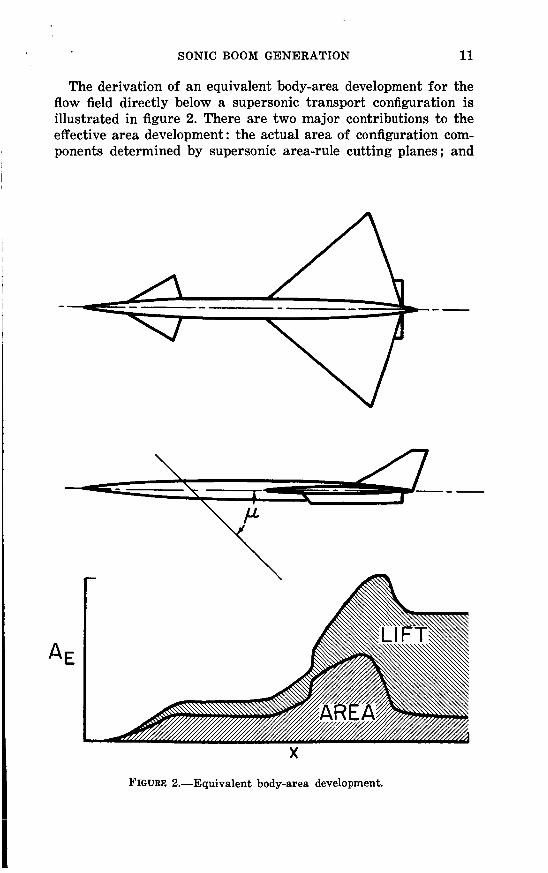
The derivation of an equivalent body-area development for the flow field directly below a supersonic transport configuration is illustrated in figure 2. There are two major contributions to the effective area development : the actual area of configuration com- ponents determined by supersonic area-rule cutting planes ; and
\
Y
x FIGURE 2.-Equivalent body-area development.

12 SONIC BOOM RESEARCH
the equivalent cross-sectional area due to the distribution of lift, also determined from supersonic area-rule concepts. The effective area distribution should take into consideration the airplane boundary layer, the engine airflow, and control deflections. Shocks will be formed where there are rapid changes in the rate of growth of the total effective area development, such as a t the nose, the wing-body juncture, and the body closure. It should be noted that although the equivalent body shown here applies only for positions directly below the airplane, the analysis methods are applicable to all regions of the flow field.
The second major element (perhaps the major element) in the development of sonic boom prediction techniques is due to the work of Whitham. After a body or an equivalent body is defined, his method, which is illustrated in figure 3, permits the definition
A,
F FUNCTION
PRESSURE
DISTANCE FIGURE 3.-Theoretical pressure signature.
of the pressure field at any distance from the body. The F func- tion, which is of paramount importance in the subsequent pres-

SONIC BOOM GENERATION 13
WAVE DRAG
X
sure signature determination, is found from certain mathematical relationships dealing with the rate of growth of the effective area development. The F function may be thought of as representing the pressure signature very close to the body. Whitham showed how the signature becomes distorted at larger distances because of the dependence of propagation speed on qi'sturbance strength. A distorted signature for some given radius from the body is shown at the bottom of the figure. Note that the unmodified sig- nature (the dashed line) has inadmissible multiple values. Whitham solved that problem by means of an area-balancing technique which at the same time preserves the area under the original curve (the impulse) and provides for the shocks known to exist in the real flow. The calculation steps in determining the F function and the pressure signatures have now been imple- mented by use of numerical methods programed for use on high- speed digital computers. Machine programs have also proved useful in the preparation of the effective area curves.
Figure 4 illustrates a complex of computing programs liow in use at Langley. The programs shown across the top of the figure were designed primarily for the analysis of configuration aero-
WING LIFT INTERFERENCE
ILL L
FIGURE 4.-Computer program interrelationship.

14 SONIC BOOM RESEARCH
dynamics (lift and drag) but also provide useful boom program input data. The area development of the airplane components is obtained from the zero-lift wave-drag program shown at the left. The development of wing lift is found by use of the wing program a t the center, and incremental interference lift due to nacelle interference is obtained from the third program. With these input data, the sonic boom program may then be employed to determine a theoretical pressure signature at any distance from a given configuration for a given set of flight conditions (Mach number, altitude, lift coefficient, etc.). It is seen that a detailed prediction of sonic boom characteristics can be a complex undertaking. The programs shown in this figure have been made available to the aircraft industry and are in widespread use. A more complete treatment of sonic boom prediction techniques is given in refer- ence 1.
Now, having outlined current estimation techniques, it is ap- propriate to examine the experimental wind-tunnel program used in verifying the methods. Figure 5 displays data from tests of a
LA, %-
\ \
TEST APPARATUS
MODEL
0 EXPERIMENT - THEORY
Ax
FIGURE 5.-Tunnel correlation of theory and experiment for a parabolic body. M = 2.01; h/l = 4.
SONIC BOOM GENERATION 15
simple parabolic body of revolution. The tests were conducted for a Mach number of 2.01 in the Langley 4- by 4-foot supersonic pressure tunnel. The model was mounted on a remotely controlled actuator which permitted the model and its flow field to be moved relative to an orifice in a boundary-layer bypass plate (slender probes have been used for later tests). The pressure signature at the bottom of the 'figure shows quite good correlation of experi- ment and theory for the forward portion of the trace. The discrepancies at the tail shock may be due to separated flow over the aft part of the model.
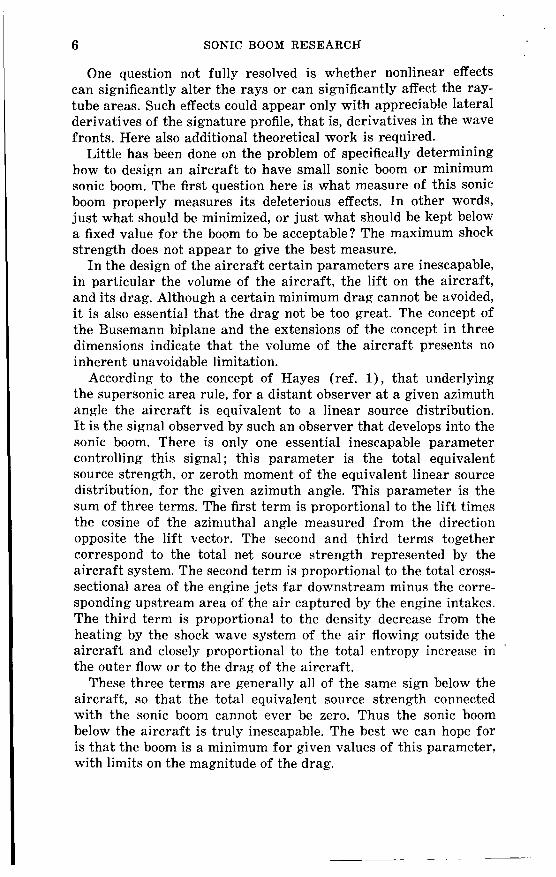
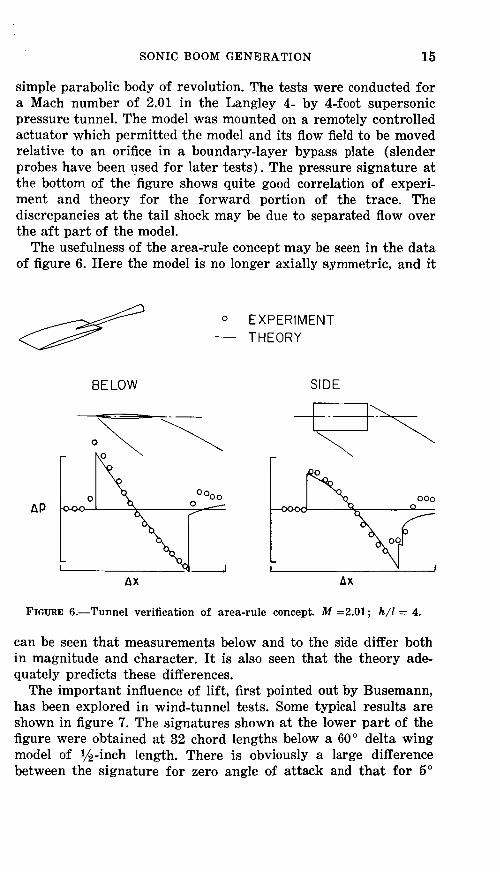
The usefulness of the area-rule concept may be seen in the data of figure 6. Here the model is no longer axially symmetric, and it
P P
BELOW
0 EXPERIMENT THEORY -
SIDE
A X A X
FIGURE 6.-Tunnel verification of area-rule concept. M =2.01; h/l = 4.
can be seen that measurements below and to the side differ both in magnitude and character. It is also seen that the theory ade- quately predicts these differences.
The important influence of lift, first pointed out by Busemann, has been explored in wind-tunnel tests. Some typical results are shown in figure 7. The signatures shown at the lower part of the figure were obtained at 32 chord lengths below a 60" delta wing model of Ih-inch length. There is obviously a large difference between the signature for zero angle of attack and that for 5"

16 SONIC BOOM RESEARCH
a =O”
0 EXPERIMENT THEORY -
a =5”
c I I I u-
AX Ax
FIGURE ‘I.-Tunnel verification of lift influence. M = 2.01; h/l = 32.
angle of attack. For the bow-shock portion of the signatures a good correlation of experiment and theory is evident. The data show some of the rounding of the pressure peak commonly ob- served in wind-tunnel tests of small models, which is believed to be due primarily to model and measuring-probe vibration.
Local lift can be generated by component interference, and this lift also influences the boom as shown in figure 8. Here data are shown for a wing-wedge configuration, first in the upright and then the inverted position. The experimental data represent the bow-shock pressure rise after an adjustment has been made to compensate for the effect of vibration. When overpressure is plotted against angle of attack as a t the left of the figure, large differences are noted. However, when lift coefficient becomes the basis of comparison, the differences are much reduced and, in fact, a reversal of curves has taken place. Since the proper com- parison is for a given lift coefficient or weight as shown a t the right, it is seen that there is no advantage in having a fuselage “hidden” totally above the wing plane. The high wing configura- tion, in fact, is seen to offer advantages for reasonable lift- coefficient ranges. The important consideration is that proper use of the theory accounts for these interference effects.
A complete airplane model requires consideration of all the fac-

SONIC BOOM GENERATION
-
17
EXPERIMENT THEORY
----- 0 0
I
0 I
CL FIGURE 8.-Tunnel study of interference effects. M = 2.01; h/l = 32.
tors previously discussed. An example of the correlation of theory with experiment for a l-inch-long SST model is shown in figure 9.
0 EXPERIMENT THEORY -
C, = 0.03 C, = 0. I8 C, 0.33
X FIGURE 9.-Tunnel correlation of theory and experiment for a complete air-
plane model. M = 1.4; h/Z = 25.
18 SONIC BOOM RESEARCH
The three signatures show the large influence of lift and indicate a reasonably good agreement of experiment and theory. Again there is noticeable rounding of the signature due to vibration of the small model. Use of the small models in the past was dictated by the necessity to obtain an approach to an N wave in the limited confines of the tunnel so that the simplified far-field theory could be used as a means of extrapolation. Development of near-field signature-prediction techniques has permitted the use of some- what larger models (and improved precision of data) in more recent tests. An example is shown later. A summary of results from a number of wind-tunnel tests as well as a description of testing techniques is given in reference 2.
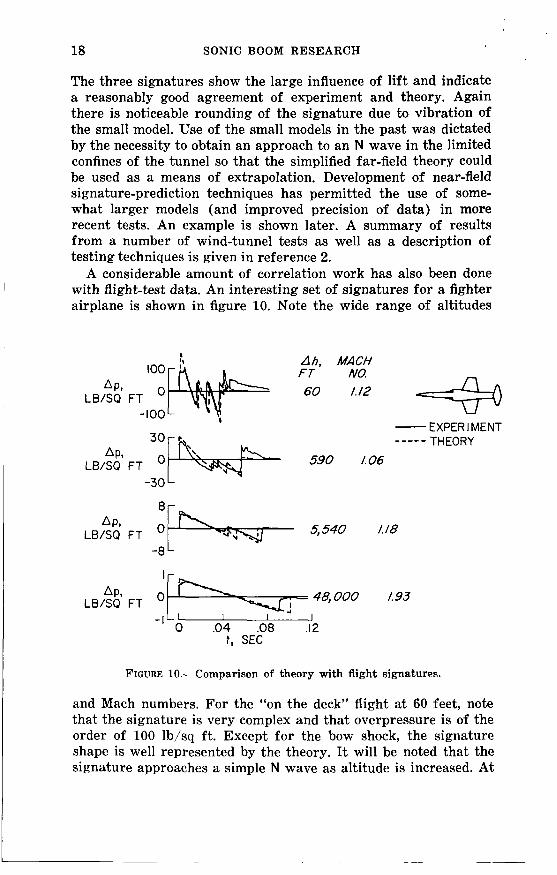
A considerable amount of correlation work has also been done with flight-test data. An interesting set of signatures for a fighter airplane is shown in figure 10. Note the wide range of altitudes
1 Ah, MACH FT No. 60 1.12
- EXPER I MENT ----- THEORY
590 1.06 LB/SQ FT -30
5,540 1.18 LB/SQ FT -8
48,000 1.93 LBISQ FT
t , SEC
FIGURE 10.-Comparison of theory with flight signatures.
and Mach numbers. For the “on the deck” flight at 60 feet, note that the signature is very complex and that overpressure is of the order of 100 lb/sq f t . Except for the bow shock, the signature shape is well represented by the theory. It will be noted that the signature approaches a simple N wave as altitude is increased. At

SONIC BOOM GENERATION 19
48 000 feet an N wave has formed and the overpressure is less than 1 lb/sq ft. The agreement of theory and experiment is good ex- cept in the vicinity of the tail wave. In obtaining the predictions, the signature is first computed for a uniform atmosphere, and then an atmospheric correction factor derived from the work of Kane (ref. 3), Friedman, and Sigalla is applied to the over- pressure.
A summary comparison of theory and flight-test data for three military airplane types is shown in figure 11. Bow-shock pressure
THEORY FLIGHT 0
0
0
OVERPRESSURE
L- O 20 40 60 80X1O3
ALTITUDE, h, FT
FIGURE 11.-Sonic boom characteristics of current supersonic airplanes.
rise is plotted as a function of altitude. The measurements have been averaged to minimize the scatter effect of the atmosphere. The theory is shown in the form of a band in order to account for variations in weight and Mach number at a given altitude. The shaded area for the larger bomber indicates the presence of near-field signatures. It is seen that the boom characteristics of

20 SONIC BOOM RESEARCH
the three airplanes are quite different and that the theory agrees well with the measurements, except for the lower altitude data for the fighter. The cause of that discrepancy is not known a t present. Flight-test programs are discussed a t some length by D. J. Maglieri in the next chapter of the proceedings.
Having explored the problem of the estimation of sonic boom, some attention will now be given to the problem of minimizing it. Figure 12 illustrates minimization concepts which fit within
FAR FIELD NEAR FIELD FINITE AEp, ,> , R F ,
FIGURE 12.-Minimization concepts.
the framework of the estimation techniques just discussed. It has been seen that for estimation purposes the airplane is replaced by an equivalent body ; thus, simplified equivalent body shapes may be employed to explore desirable characteristics. The rather blunt equivalent body shape shown at the left has been found to yield the minimum far-field overpressure and the minimum impulse at all distances. However, because of the large shock losses near the body, the drag is high and the shape is not practical for application to an airplane. When impulse minimization is the goal, a com- promise with drag must be made.
The area development curve at the middle of figure 12 yields a minimum or near minimum of positive overpressure in the near field and the midfield. In this case the area varies as the three- halves power of the distance along the axis and a flat-top signature results. The airplane design modifications suggested by this mini- mization approach may have practical application since, as pointed
SONIC BOOM GENERATION 21
out by McLean (ref. 4) , existing supersonic transport designs are now long enough and slender enough for near-field effects to extend to the ground under some flight conditions. The required modifications, moreover, do not necessarily result in drag penal- ties. Note that in the true fa r field this shape has a higher over- pressure than the more blunt shape.
With even longer airplanes, the shape shown at the right would offer advantages. That sharp pointed body has a near-field sig- nature with a finite time rise (a sine-wave type of pressure sig- nature) which could virtually eliminate the associated noise. The airplane modification suggested by this example, however. would find practical application only with extremely long airplanes, fa r beyond anything currently contemplated. Only an extremely slender configuration would permit near-field effects to extend to the ground from normal flight altitudes.
The above minimization concepts have not considered the tail shock. If the tail wave becomes the important consideration, similar modification at the aft portion of the airplane may be em- ployed to effect minimization.
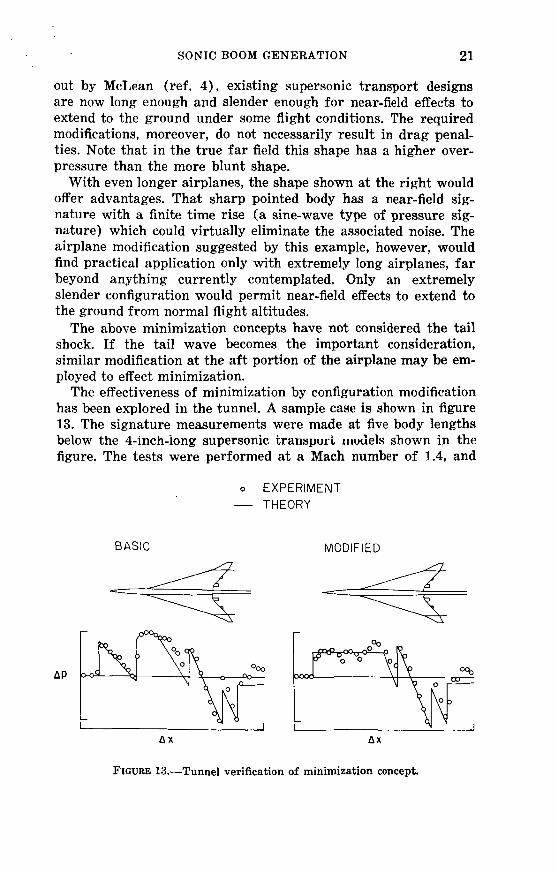
The effectiveness of minimization by configuration modification has been explored in the tunnel. A sample case is shown in figure 13. The signature measurements were made at five body lengths below the 4-inch-iong supersonic tranvpori IIlUdels shown in the figure. The tests were performed at a Mach number of 1.4, and
o EXPERIMENT - THEORY
BASIC MODIFIED
AP
A X Ax
FIGURE 13.-Tunnel verification of minimization concept.
22 SONIC BOOM RESEARCH
these particular signatures were obtained for a lift coefficient of 0.1. Although the signature for the basic model is quite complex, there is seen to be excellent agreement with the theoretical pre- diction. The signature shown a t the right was obtained for a model with a fuselage modification designed to produce a flat-top signature. The desired result was not quite attained, but a good approach has been made, and the extreme sensitivity of the signa- ture shape to small changes in model shape is clearly shown. The same theory applied to an airplane of 400000 pounds flying at 40000 feet and M = 1.4 indicates a maximum positive overpres- sure of 2.2 psf for the design at the left and a value of 1.3 psf for the modified design. Tail wave shock strength in both cases is less than 1.3 psf. A summary discussion of minimization tech- niques is given in reference 4.
CONCLUSIONS
The more important contributions made by the NASA research on sonic boom generation in steady level flight may be summar- ized as follows:
(1) The basic theory has been verified in wind-tunnel tests of simple wings and bodies.
(2) The theory has been extended to cover real airplane shapes by the development of numerical methods programed for use on high-speed digital computers.
(3) The sonic boom program and related programs have been made available to the airframe industry and are in widespread use.
(4) The general applicability of the prediction methods to air- plane steady level flight has been shown to be in correlation with tunnel and flight-test data.
( 5 ) Minimization concepts have been developed and have been verified in wind-tunnel tests.
REFERENCES
1. CARLSON, HARRY W.; MACK, ROBERT J.; AND MORRIS, ODELL A.: Sonic Boom Pressure-Field Estimation Techniques. Proceedings of the Sonic Boom Symposium, The Acoustical Society of America, St. Louis, Mo., November 3, 1965, pp. 510-518.
2. CARLSON, HARRY W.: Correlation of Sonic-Boom Theory With Wind- Tunnel and Flight Measurements. NASA TR R-213, 1964.
3. KANE, E. J.: Some Effects of the Nonuniform Atmosphere on the Propa- gation of Sonic Boom. Proceedings of the Sonic Boom Symposium, The Acoustical Society of America, St. Louis, Mo., November 3, 1965, PP. 526-530.

SONIC BOOM GENERATION 23
4. MCLEAN, F. EDWARD; AND SHROUT, BARRETT L.: Design Methods for Minimization of Sonic Boom Pressure-Field Disturbances. Proceedings of the Acoustical Society of America, St. Louis, Mo., November 3, 1965, pp. 519-525.
Sonic Boom Flight Research-Some Effects of Airplane Operations and the Atmosphere on Sonic Boom Signatures
DOMENIC J. MAGLIERI
Langley Research Center, NASA
INTRODUCTION
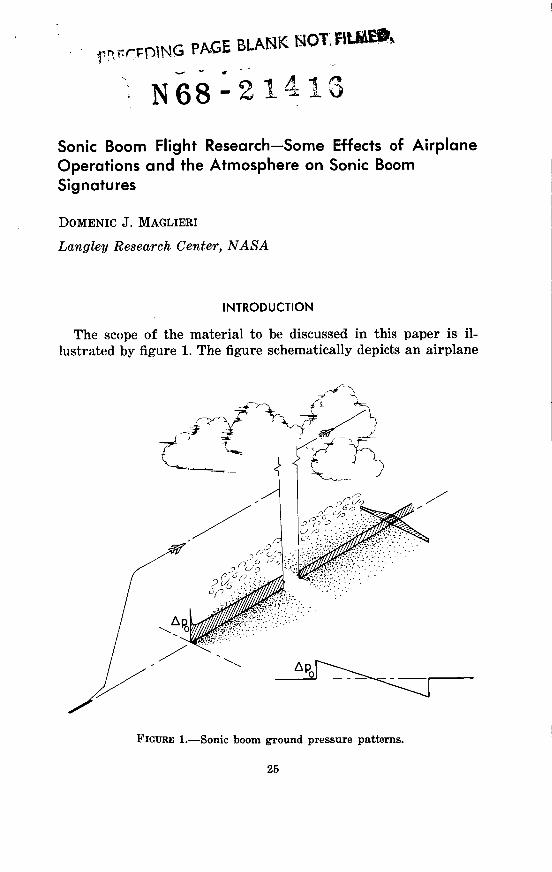
The scope of the material to be discussed in this paper is il- lustrated by figure l. The figure schematically depicts an airplane
FIGURE 1.-Sonic boom ground pressure patterns.
25

26 SONIC BOOM RESEARCH
flight track extending from subsonic to supersonic speeds. Be- neath the flight track are shown sketches of the shock-wave im- pingement patterns and the associated distributi6ns of N wave pressures, both along the track and perpendicular to it. The in- formation contained in the paper is presented in the form of a re- port on the state of knowledge of sonic boom phenomena, dealing first with the pressure buildups in the transonic speed range (see refs. 1 to 11) and with the lateral extent of the pattern in steady flight for quiescent atmospheric conditions (see refs. 11 to 14). In addition, there are discussions of data from flight-test studies relating to atmospheric dynamic effects on the sonic boom signa- tures (refs. 9 to 11 and 15 to 22).
EFFECTS OF ACCELERATED FLIGHT
Certain maneuvers of an aircraft in which longitudinal, lateral, or normal accelerations occur can result in pressure buildups on
FIGURE 2.-Areas on the ground exposed to superbooms resulting from three different aircraft maneuvers.

SONIC BOOM FLIGHT RESEARCH 27
the ground that are commonly referred to as “superbooms.” One important consideration is the shape and size of these superboom areas on the ground. Such areas are shown in figure 2 for some common flight maneuvers. It should be pointed out that although the aircraft and shock waves are moving, these superboom areas are fixed and do not move with the aircraft. The longitudinal accel- eration case is illustrated at the top of the figure. As indicated in the sketch by the thin shaded areas, superbooms occur over rela- tively small expanses on the ground. The dimensions are such that total superboom area (area of shading only) is approximately 1 square mile. The pressure buildups in these shaded areas are be- lieved to be a function of the rate of acceleration of the aircraft, but for a practical operating range they are approximately two times the corresponding steady-flight values. Also of possible con- cern in the operation of supersonic aircraft are such maneuvers as horizontal turns and pushovers that might occur during changes in course and airplane attitude. In these latter instances the ground patterns of pressure buildups are different in shape as in- dicated in figure 2, and because of the higher accelerations in- volved, the buildup factors may tend to be higher (values up to 4.0 have been measured (see refs. 1 and 3) ) and the areas smaller than for the case of longitudinal acceleration.
8 1 1 exteiiaive aeries ul” gruu~~&preaaure iiieaaureiiieiita Lau bee11 made (ref. 11) for longitudinal aircraft accelerations from Mach
DISTANCE ALONG GROUND TRACK, STATUTE MILES
FIGURE 3.-Sonic boom overpressure measurements along the ground track for an aircraft in accelerated flight.

28 SONIC BOOM RESEARCH
effects of the atmosphere. The highest overpressures are measured in a very localized re-
gion. These values are as high as 2.5 times the maximum value observed in the multiple-boom region and are thus in general agreement with the measured results for other lower altitude tests of reference 9. The main multiple-boom overpressure values are of the same order of magnitude as those predicted for com- parable steady-state flight conditions. Available overpressure pre- diction methods (see refs. 2, 3, and 16) give good agreement in the multiple-boom region, but are not considered reliable in the superboom (cusp) region.
The locations of the superboom and multiple-boom regions are readily predictable (see refs. 3 and 16) , provided such informa- tion as flight path, altitude, and acceleration rate of the aircraft is available. Based on experience, it is believed that the superboom can be placed a t a position on the ground to within about -t5 miles of the desired location. The prediction of the location of the super- boom can be improved if more detailed weather information is available.
L

SONIC BOOM FLIGHT RESEARCH 29
M = 2.0 AT 52 200 FT
In ! I I I L -
LATERAL-SPREAD PATTERNS
With regard to the steady-flight conditions, some recent experi- ments (ref. 11) have also been conducted in an effort to define more exactly the pressure distribution near the extremity of the shock-wave pattern on the ground. Some sample data are shown in figure 4. Particular emphasis was placed on the region where
Apo, LB/SQ FT
2 .o
I .o
30 20 IO 0 IO 20 30 LATERAL DISTANCE FROM TRACK, STATUTE MILES
0 40
FIGURE 4.-Measured lateral spread patterns for a fighter aircraft at two different altitudes.
a grazing condition exists because of atmospheric refraction, as suggested by the ray-path sketch at the top of the figure. Flights were made at altitudes of 52 200 and 37 200 feet and Mach num- bers of 2.0 and 1.5, respectively, during quiescent atmospheric conditions, and the results are compared with theory in the data plots at the bottom. The results from the flight at 52 200 feet and a Mach number of 2.0 show that the pressures are generally high- est on the track, as predicted by theory (ref. 14), and decrease generally as distance increases. (Solid symbols indicate that no boom was observed.) The fact that measurements were obtained beyond the theoretically predicted cutoff distance by the method of reference 14 led to more difinitive studies at 37 200 feet and a
30 SONIC BOOM RESEARCH
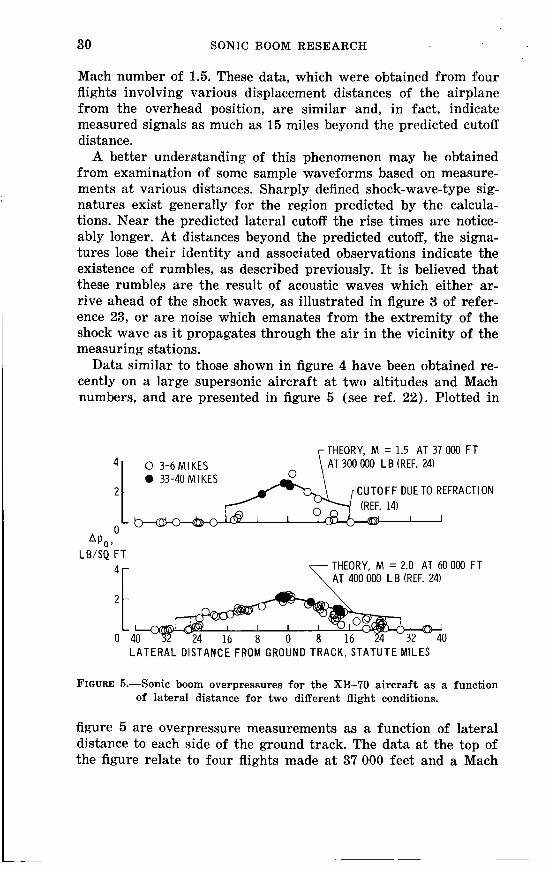
Mach number of 1.5. These data, which were obtained from four flights involving various displacement distances of the airplane from the overhead position, are similar and, in fact, indicate measured signals as much as 15 miles beyond the predicted cutoff distance.
A better understanding of this phenomenon may be obtained from examination of some sample waveforms based on measure- ments at various distances. Sharply defined shock-wave-type sig- natures exist generally for the region predicted by the calcula- tions. Near the predicted lateral cutoff the rise times are notice- ably longer. At distances beyond the predicted cutoff, the signa- tures lose their identity and associated observations indicate the existence of rumbles, as described previously. It is believed that these rumbles are the result of acoustic waves which either ar- rive ahead of the shock waves, as illustrated in figure 3 of refer- ence 23, or are noise which emanates from the extremity of the shock wave as it propagates through the air in the vicinity of the measuring stations.
Data similar to those shown in figure 4 have been obtained re- cently on a large supersonic aircraft at two altitudes and Mach numbers, and are presented in figure 5 (see ref. 22). Plotted in
THEORY, M = 1.5 AT 37 000 F T AT 300 000 L B (REF. 24)
0 33-40 MIKES CUTOFF DUE TO REFRACTION
I I
LB/SQ FT
4r THEORY, M = 2.0 AT 60 000 F T \ AT 400 000 L B (REF. 24)
2l 0 0 L A T E R A L DISTANCE FROM GROUND TRACK, STATUTE MILES
FIGURE 5.-Sonic boom overpressures for the XB-70 aircraft as a function of lateral distance for two different flight conditions.
figure 5 are overpressure measurements as a function of lateral distance to each side of the ground track. The data at the top of the figure relate to four flights made at 37 000 feet and a Mach

SONIC BOOM FLIGHT RESEARCH 31
number of 1.5. The data at the bottom relate to 13 flights at an altitude of 60000 feet and a Mach number range of 1.8 to 2.5. The data points are coded to represent the averages of from 3 to 40 microphones as indicated on the figure. Also shown are calcu- lated curves using the generalized theory of reference 24 corrected to a standard atmosphere using figure 13 of reference 25. The cut- off points due to atmospheric refractions, as calculated by the method of reference 14, are shown as vertical dashed lines. It can be seen that the overpressures are a maximum on the track and decrease with increasing lateral distance as predicted gen- erally by theory. The measured and calculated values of over- pressure are in good agreement with the exception of the region near the lateral cutoff where the measured data are seen to fall below the theory. This discrepancy may be due in part to the fact that only the Mach cutting plane corresponding to locations di- rectly below the aircraft was applied in the theory.
Since each record of the measuring stations was synchronized in time with the airplane positions, the relative arrival times of the shock waves could be determined. With the use of these ar-
DISTANCE PERPE?! n ! CU LA !? TO TRACK, d, ft
0
-18
1 I 2 1’8 2b $0 36A104 DISTANCE ALONG TRACK, s, ft
6; o%.s
-c- BASED ON MEASUREMENTS
--- CALCULATED, HOMOGENEOUS ATMOSPHERE
- _- ---__- CALCULATED, ACTUAL ATMOSPHERE (REF. 16)
m CALCULATED LATERAL CUTOFF (REF. 16)
FIGURE 6.-Comparison of measured and calculated bow shock wave ground intersection patterns for fighter aircraft in steady-level flight at 52 200 feet and M =2.00. Solid symbol indicates no disturbances observed or mea- sured.

32 SONIC BOOM RESEARCH
rival times as measured at each station, the measured ground speed of the airplane from radar tracking and the shock wave propagation speed across each measuring station, the shape of the shock front was estimated. The results are pkesented in figure 6 for the steady flight of the fighter airplane a t an altitude of 52 200 feet and a Mach number of 2.0 for the data shown in figure 4. Also shown are the theoretical intersections assuming a homo- geneous atmosphere (no winds and uniform temperature) and also for the atmospheric conditions existing at the times of the tests. These calculations were obtained by the method of reference 16. The intersection of the ordinate and abscissa scales represents the overhead position of the airplane. The shock wave intersects the ground some 75 000 feet behind the airplane and the pattern is nearly symmetrical about the ground-track line. In addition, a difference of the order of 1.5 to 5.0 miles exists between the meas- ured wave-front ground intersection and the calculated values using the actual and homogeneous atmosphere, respectively. These results are in agreement with similar results presented in ref- erence 13.
OTHER EFFECTS OF THE ATMOSPHERE
The propagation of shock waves through the atmosphere may involve the dynamics of the atmosphere as well as the gross re- fraction effects just described. The data of figure 7 were derived from an accurately calibrated and oriented array of matched mi- crophones along the ground track of the aircraft (ref. 19). The variations in the wave shapes measured during one steady flight of a fighter aircraft are sketched in for the appropriate measure- ment locations. A wide variation in wave shape occurs even over a distance on the ground of a few hundred feet. This variation in wave shape, which is associated with changes in atmospheric and aircraft operating conditions, resulted in substantial variations in the peak ground overpressure, the larger values being associated with the sharply peaked waves and the lower values with the rounded-off waves. It is believed that atmospheric effects dominate in this case. Analytical studies have suggested that the effects of the higher altitude disturbances are much less important than those of the lower altitudes (refs. 10, 15, 16, and 18).
Flight experiments have pointed to the fact that disturbances in the first few thousand feet of the atmosphere may be most sig- nificant in affecting the shapes of the sonic boom signatures meas- ured at the ground. The results are illustrated by the data of figure

SONIC BOOM FLIGHT RESEARCH
/
ALTITUDE, FT
IO 000: 8000- 6000-
4000-
33
.& 00
-
-
FIGURE 7.-Measured sonic boom pressure signatures at several points on the ground track of a fighter aircraft in steady-level flight at a Mach number of 1.7 and an altitude of 28 000 feet.
@ QO t 20 ooot
0 MORNING 0 AFTERNOON
0

34 SONIC BOOM RESEARCH
8 (see ref. 17). Temperature is plotted against altitude as de- termined from wiresonde and rawinsonde soundings taken during the times of the flights. The filled symbols represent the type of temperature profile existing for the morning flights whereas the open symbols apply to the afternoon flight. I t may be seen that the temperature conditions of the upper atmosphere do not vary appreciably during the morning and afternoon. On the other hand, in the first few hundred feet of the lower atmosphere, the temper- ature profile varies markedly. In the morning, a temperature in- version exists, during which time the surface layer of the atmos- phere is quiescent. Later in the day, as the surface temperature in- creases, the temperature profile may change to the extent that a superadiabatic lapse rate condition can exist as indicated. For such a temperature profile, the surface layer of the atmosphere is in- herently unstable and severe thermal-induced turbulence may be generated. There is a strong correlation between the type of sig- nature measured and the existing temperature profile in the lower atmosphere. Consistent N wave types of signatures were meas- ured when the lower atmosphere was quiescent, whereas large
--Q--
SHOCK \ \ 0 DENOTES MICROPHONES FRONT \ \
TRAY PATH \ \ \ \
\ Q \
\
\ \
G7 \
/ \ / I \ \
LEVEL 1 \, , / ~ ~ o - F T TOWER \- ,
FIGURE 9.-Schematic diagram of test setup at the NASA Wallops Station, Virginia, for evaluating atmospheric effects on sonic boom wave propaga- tion in the surface layer (250-ft depth) of the atmosphere. Generating aircraft was an F-106 at 40 000-foot altitude and a Mach number of 1.5.
SONIC BOOM FLIGHT RESEARCH 35
variations in the shape of the signatures were measured when the lower atmosphere was considered to be unstable.
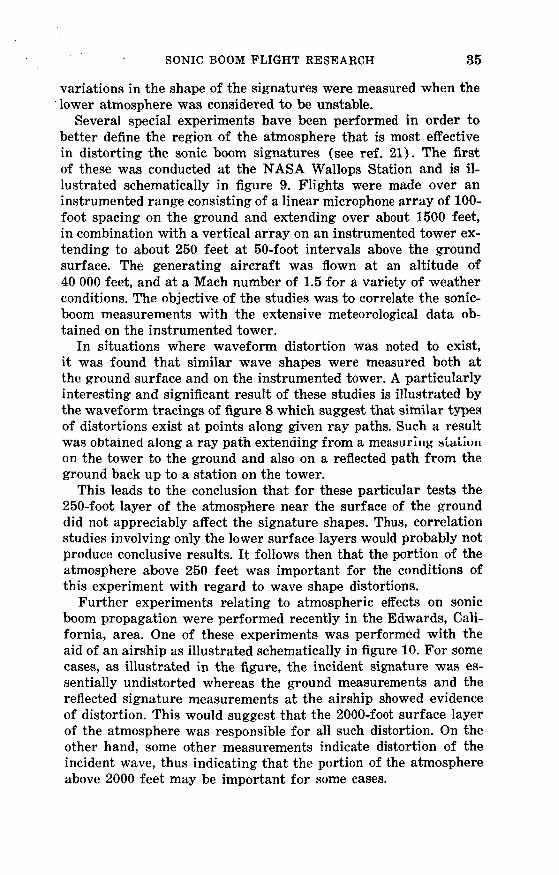
Several special experiments have been performed in order to better define the region of the atmosphere that is most effective in distorting the sonic boom signatures (see ref. 21). The first of these was conducted at the NASA Wallops Station and is il- lustrated schematically in figure 9. Flights were made over an instrumented range consisting of a linear microphone array of 100- foot spacing on the ground and extending over about 1500 feet, in combination with a vertical array on an instrumented tower ex- tending to about 250 feet at 50-foot intervals above the .ground surface. The generating aircraft was flown at an altitude of 40 000 feet, and at a Mach number of 1.5 for a variety of weather conditions. The objective of the studies was to correlate the sonic- boom measurements with the extensive meteorological data ob- tained on the instrumented tower.
In situations where waveform distortion was noted to exist, it was found that similar wave shapes were measured both at the ground surface and on the instrumented tower. A particularly interesting and significant result of these studies is illustrated by the waveform tracings of figure 8 which suggest that similar types of distortions exist at points along given ray paths. Such a result was obtained along a ray path extending from a meawrhig aiaiiuu on the tower to the ground and also on a reflected path from the ground back up to a station on the tower.
This leads to the conclusion that for these particular tests the 250-foot layer of the atmosphere near the surface of the ground did not appreciably affect the signature shapes. Thus, correlation studies involving only the lower surface layers would probably not produce conclusive results. It follows then that the portion of the atmosphere above 250 feet was important for the conditions of this experiment with regard to wave shape distortions.
Further experiments relating to atmospheric effects on sonic boom propagation were performed recently in the Edwards, Cali- fornia, area. One of these experiments was performed with the aid of an airship as illustrated schematically in figure 10. For some cases, as illustrated in the figure, the incident signature was es- sentially undistorted whereas the ground measurements and the reflected signature measurements at the airship showed evidence of distortion. This would suggest that the 2000-foot surface layer of the atmosphere was responsible for all such distortion. On the other hand, some other measurements indicate distortion of the incident wave, thus indicating that the portion of the atmosphere above 2000 feet may be important for some cases.

36 SONIC BOOM RESEARCH
I T t is recognized that measurements of sonic boom signatures on
F-106 AT M = 1.5
I An Mn C T \ \ REFLECTED SHOCKS
FIGURE 10.-Schematic diagram of test arrangements at Edwards, California, for evaluating atmospheric effects on sonic boom wave propagation in the lower layer (2000-ft depth) of the atmosphere. Generating aircraft was an F-106 at 40 000-foot altitude and a Mach number of 1.5.
As a follow-up to the ray-path experiments of figure 9, another experiment was performed to investigate the effects of time with regard to atmospheric distortion effects. This experiment was performed with the aid of two airplanes of the same type which were flown at the same altitude and Mach number, on the same nominal flight track, and about 5 seconds apart. By means of the 1500-foot ground microphone array i t was possible to measure sonic boom signatures which traveled along essentially the same ray path from high altitude to the ground for a distance of ap- proximately 15 miles along the ray path but a t slightly different times. One of the results of the experiment is illustrated by the signature tracings a t the bottom of figure 11. It can be seen that quite different wave shapes are associated with measurements at times a few seconds apart. Such a result suggests that the inte- grated effects of changes in the atmospheric conditions along a given ray path may be significant even for such a small difference in time. None of the above experiments produced evidence of di- rect correlation between signature distortion and identifiable local disturbances in the atmosphere.
EVALUATION OF AIRCRAFT MOTION EFFECTS

SONIC BOOM FLIGHT RESEARCH 37
(a) SCHEMATIC OF SHOCK FRONT AND RAY PATH
7500 FT -’v-d (b) SONIC BOOM GROUND PRESSURE SIGNATURES
FIGURE 11.-Variations in measured sonic boom pressure signatures for two aircraft of the same type operating under the same flight conditions but at approximately a 5-second time interval. I
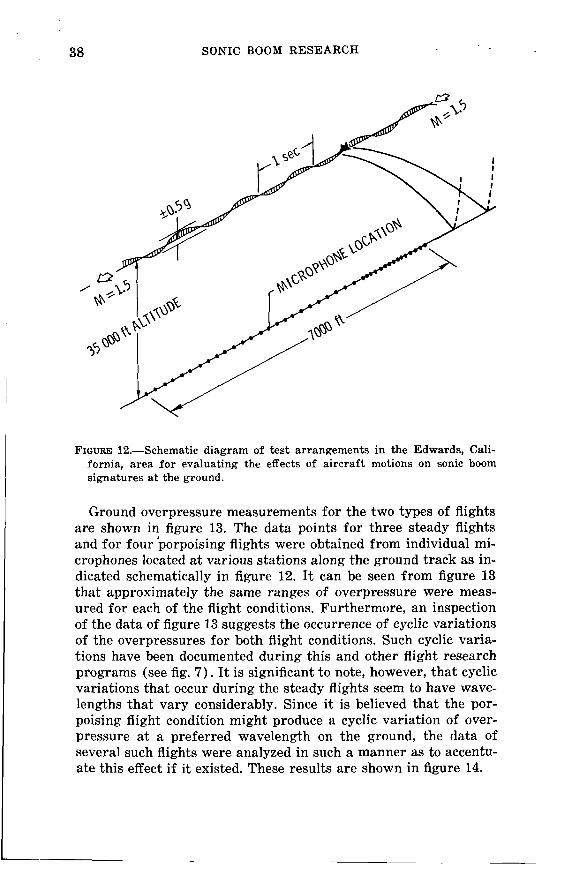
the ground may be affected by variations in the aircraft operating conditions as well as by the atmosphere. An experiment has thus been performed in an attempt to evaluate the effects on measured signatures of perturbations of the aircraft about its nominal flight path. In order to accomplish this study, the test setup of figure 12 was employed. The aircraft was flown a t a given altitude and Mach number and on a given heading directly over and along a 7000-foot-long array of 40 microphones. The aircraft, which was specially instrumented to record its motions, was flown both in steady level flight and in “porpoising” flight. All flights were made at an altitude of 35 000 feet and a Mach number of 1.5 with an F- 106 aircraft. For the porpoising flight, the pilot caused the airplane
produce a k0.5g normal acceleration a t the center of gravity of
ond and thus the wavelengths of the motion were about 1500 feet for these particular flight conditions.
t I
I to deviate from the nominal flight track by cycling the controls to
the aircraft. These induced motions have a period of about 1 sec- I
~
1
38 SONIC BOOM RESEARCH
FIGURE 12.-Schematic diagram of test arrangements in the Edwards, Cali- fornia, area for evaluating the effects of aircraft motions on sonic boom signatures at the ground.
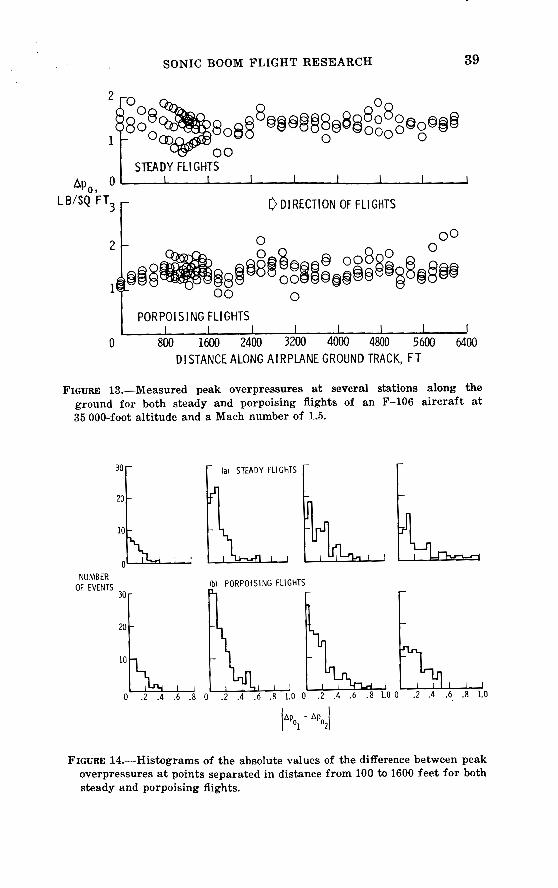
Ground overpressure measurements for the two types of flights are shown in figure 13. The data points for three steady flights and for four porpoising flights were obtained from individual mi- crophones located at various stations along the ground track as in- dicated schematically in figure 12. It can be seen from figure 13 that approximately the same ranges of overpressure were meas- ured for each of the flight conditions. Furthermore, an inspection of the data of figure 13 suggests the occurrence of cyclic variations of the overpressures for both flight conditions. Such cyclic varia- tions have been documented during this and other flight research programs (see fig. 7 ) . It is significant t o note, however, that cyclic variations that occur during the steady flights seem to have wave- lengths that vary considerably. Since it is believed that the por- poising flight condition might produce a cyclic variation of over- pressure at a preferred wavelength on the ground, the data of several such flights were analyzed in such a manner as to accentu- ate this effect if it existed. These results are shown in figure 14.
39 SONIC BOOM FLIGHT RESEARCH
n
I STEADY FLIGHTS % 9 0 I I I I I I I I
0 DIRECTION OF FLIGHTS LWSQ FT3
I P O R P O I S I N G FLIGHTS I I I I I I I I I
0 800 1600 2400 3200 4000 4800 5600 6400 DISTANCE ALONG A IRPLANE GROUND TRACK, FT
FIGURE 13.-Measured peak overpressures at several stations along the ground for both steady and porpoising flights of an F-106 aircraft at 35 000-foot altitude and a Mach number of 1.5.
l:k I , L'i F:IG:H k,, , 10
0 NUMBER
OF EVENTS (b) PORPOlS lNG FLIGHTS
10
FIGURE 14.--Histograms of the absolute values of the difference between peak overpressures a t points separated in distance from 100 to 1600 feet for both steady and porpoising flights.
40 SONIC BOOM RESEARCH
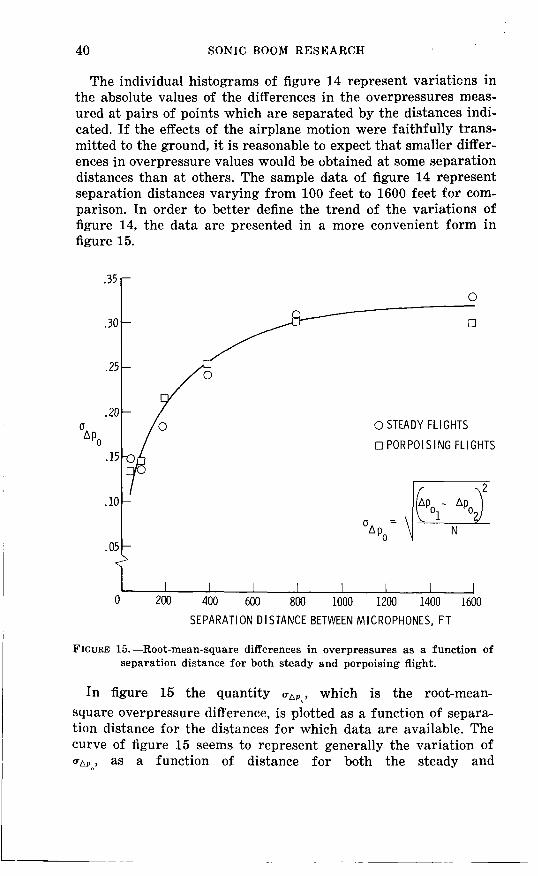
The individual histograms of figure 14 represent variaticns in the absolute values of the differences in the overpressures meas- ured at pairs of points which are separated by the distances indi- cated. If the effects of the airplane motion were faithfully trans- mitted to the ground, it is reasonable to expect that smaller differ- ences in overpressure values would be obtained at some separation distances than at others. The sample data of figure 14 represent separation distances varying from 100 feet to 1600 feet for com- parison. In order to better define the trend of the variations of figure 14, the data are presented in a more convenient form in figure 15.
.35 r 0
u
0
.20 0 0 STEADY FLIGHTS
0 PORPOIS ING FLIGHTS .15
I 1 I I I I I I 0 200 400 600 800 1000 1200 1400 1600
SEPARATION DISTANCE BETWEEN MICROPHONES, FT
FIGURE 15.-Root-mean-square differences in overpressures as a function of separation distance for both steady and porpoising flight.
In figure 15 the quantity uAPG, which is the root-mean- square overpressure difference, is plotted as a function of separa- tion distance for the distances for which data are available. The curve of figure 15 seems to represent generally the variation of uAP,,, as a function of distance for both the steady and

SONIC BOOM FLIGHT RESEARCH 41
porpoising flight cases. Both sets of data are seen to increase monotonically as a function of separation distance. Such a result strongly suggests that perturbations about the flight track of the order of those illustrated in figure 12 do not propagate faithfully to the ground from high altitude. It is therefore believed that the variations discussed previously in this paper are due mainly to atmospheric effects rather than to effects of aircraft motion.
PROBABILITY DISTRIBUTIONS
Variations in sonic boom signature shapes, similar to those shown in figures 7 to 11, have been observed to occur for specific flights at different ground measuring stations and for various flights at specific measuring stations. These data have also been obtained for various aircraft types at different altitude and Mach number conditions of steady level flight. Samples of the types of variations observed in the measured signatures are shown in figure 16. Sonic boom signatures for a small aircraft are shown at
F-104
PEAKED
&T N O R M A L
+ ROUNDED
B-58 XB-70
h
FIGURE 16.-Variation of measured sonic boom pressure signatures at ground level for small, medium, and large aircraft in steady-level flight.
the left (see ref. 19). These signatures vary widely from sharply peaked waves at the top to rounded-off waves of sinusoidal appearance a t the bottom. Such results are very similar to those shown in figures 7 to 11 fo r conditions of highly turbulent air in the lower atmosphere. The signatures in the center of the figure have been obtained fo r bomber aircraft (ref. 20) and have

42 SONIC BOOM RESEARCH
a noticeably longer wavelength or time duration, as do the signatures on the right-hand side which were recently obtained on a very large aircraft (ref. 22). The main distortions of the waves in each case are associated with the rapid compression phases, and these distortions are of the same general nature for both short and long wavelengths.
Because of the large number of data points available for a range of flight conditions, it was possible to make statistical anal- yses of the variations of overpressure. Samples of the overpres- sure variation data are given in figure 17 as relative cumulative
F-104
LATERAL DISTANCE
FROM TRACK, MILES
I I I I I I .I .2 .5 I 2 5
CALC MAX APo/APo
FIGURE 17.-Probability of equaling or exceeding a given value of the ratio of measured to calculated overpressure for fighter and bomber aircraft.
frequency distributions and histograms showing the probability of occurrence. Overpressure distributions for a small aircraft (see ref. 19) are shown in the left-hand plot of the figure, and similar data for a medium-size aircraft are given in the right- hand plot (see ref. 20). The probability of equaling or exceeding a given ratio of the measured overpressure value to the maximum predicted value for the respective steady flight conditions (which occur on the ground track) is shown. All the data have been plotted on log normal scales, and straight lines have been faired through the data points as an aid in interpretation. For this type of presentation, all the data points would fall on a straight

SONIC BOOM FLIGHT RESEARCH 43
line if the logarithms of the data fitted a normal distribution. For the small aircraft, data were obtained on the ground track and at distances up to 10 miles from it; a wider variation in the over- pressures occurred for the more remote stations. The variation in overpressures for the medium-size aircraft data on the right, which have markedly longer wavelengths, is noted to be only slightly less than that for the small aircraft.
Figures 18 to 20 present similar data for the large aircraft at higher Mach numbers and altitudes. Figure 18 shows probability
0.999
.99
.9
PR0BP.B ! L! TV
.5
.1
.01
. 00:
0 OVERPRESSURE 0 IMPULSE
o o m 0
%
124 DATA POINTS
FIGURE 18.-Probability of equaling or exceeding given values of the ratios of measured to calculated overpressures and positive impulses for the XB-70 aircraft. Data are for the June 1966 time period.

44 SONIC BOOM RESEARCH
0.999
.990
.90
TY
.50
.20
.10
.02 .01
plots for the overpressure and impulse (area under positive por- tion of the N wave) data obtained in the three flights of June 1966, at the on-track (0 t o about 4 miles) measurement stations. These flights were conducted a t M = 1.38 at 31 850 feet, M = 1.81 a t 52920 feet, and M = 2.94 a t 72000 feet. In each case the probability of equaling or exceeding a given value of the ratio of measured to calculated quantities is plotted. It can be seen that the impulse data have generally less variability than the over- pressure data. This finding is consistent with those of references 19 and 20. It should be noted that the ordinate is a cumulative function, and hence care should be taken in interpretation of the significance of the multiple data points a t the extremes. Data points plotted in 0.05-psf increments represent the cumulative probability of all events having values equal to or exceeding the value at which the point is plotted.
- -
- -
-
- - - - -
- -
- -
PROBA B l L l
0 JUNE66
17 NOV. 6 6 - JAN. 67
0 124 DATA POINTS
0 447 DATA POINTS
. 0 0 2 4 0.2 .5 1.0 2.0 5.0
0 MEAS
FIGURE lg.-Probability of equaling or exceeding given values of the ratios of measured to calculated ground overpressures for the XB-70 aircraft for the two different time periods.

SONIC BOOM FLIGHT RESEARCH 45
During the flight tests it was noted that the amount of varia- bility of the data differed depending on the time of year of the measurements. This is illustrated for the on-track locations (0 to about 2 miles) in figure 19 for the overpressures. The circle data points relate to the June 1966 time period, whereas the square data points relate to the November 1966 to January 1967 time period. The latter data relate to 4 flights at M = 1.5 a t 37 000 feet and 13 flights in the Mach number range of 1.8 t o 2.5 at 60 000 feet. It is obvious that the latter data have markedly less varia- bility. It is believed that this results from the more stable atmosphere during this latter time period due at least in part to the reduced convective heating in the lower layers.
The opportunity was also taken to document the variability of the overpressures for a given set of flight conditions, but for locations at some distance from the flight track as well as for those on the flight track, and these results are given in figure 20. Data for measurement locations about 13 miles o b the flight track
I
1 1 1
STANCE
PROBAB I LI TY
"0 MEAS lAp0 CALC
FIGURE ZO.-Probability of equaling or exceeding given values of the ratios of measured to calculated ground overpressures for the XB-70 aircraft for measuring stations on the track and at a lateral distance of 13 miles.
I
46 SONIC BOOM RESEARCH
(diamond symbols) are compared with those on the track (circle symbols) a t an altitude of 60 000 feet and Mach numbers of 1.8 to 2.5 and for the November 1966 to January 1967 time period. It should be noted that the h p values used in this figure refer
to the values calculated for the specific lateral station location rather than using the h p which occurs on the ground
track, as was used for the small aircraft data of figure 17. In ad- dition to the probability curves, histograms are also included. It can be seen that the probability distribution for the measure- ments obtained at distances out to 13 miles shows larger varia- bility. This is consistent with the results of figure 17 (see ref. 19) and is believed to be due to the longer ray paths traveled by the waves in the lower layers of the atmosphere in order to reach the lateral stations.
calc
cak max
CONCLUDING REMARKS
Flight-test results obtained with the aid of small, medium, and large aircraft have been presented in an attempt to show the significance of the atmosphere and aircraft operation on sonic boom exposures. The acceleration and lateral-spread phenomena appear to be fairly well understood and predictable for current and future aircraft. Variations in the sonic boom signature as a result of the effects of the atmosphere can be ex- pected during routine operations. From the data evaluated to date, very similar variations in pressure signatures are noted for small, medium, and large aircraft. That portion of the atmosphere below about 2000 feet is shown to be most influential, although in some cases the higher portions may also be important. Aircraft motions, in the form of perturbations about the normal flight track, are shown not to contribute significantly to observed sonic boom signature variations. For cases where a large number of overpressure data points are available, the average measured values correlate well with current theoretical predictions.
REFERENCES
1. MAGLIERI, DOMENIC J.; AND LANSING, DONALD L.: Sonic Booms From Aircraft in Maneuvers. NASA TN D-2370, 1964.
2. LANSING, DONALD L.: Application of Acoustic Theory to Prediction of Sonic Boom Ground Patterns From Maneuvering Aircraft. NASA
3. LANSING, DONALD L.; AND MAGLIERI, DOMENIC J.: Comparison of Mea- TN D-1860, 1964.

SONIC BOOR! FLIGHT RESEARCH 47
sured and Calculated Sonic Boom Ground Patterns 3ue to Several Different Aircraft Maneuvers. NASA TN D-2730, 1965.
4. LINA, LINDSAY J.; AND MAGLIERI DOMENIC J.: Ground Measurements of Airplane Shock-Wave Noise at Mach Numbers to 2.0 and at Alti- tudes to 60,000 Feet. NASA TN D-235, 1960.
5. WARREN, C. H. E.: The Propagation of Sonic Bangs in a Nonhomogene- ous Still Atmosphere. Paper No. 64-547, Intern. Council Aeron. Sci., Aug. 1964.
6. LILLEY, G. M.; WESTLEY, R.; YATES, A. H.; AND BUSING, J. R.: Some Aspects of Noise From Supersonic Aircraft. J. Roy. Aeron. SOC., vol. 57, 1953, pp. 396-414.
Part 1. pt. I, Feb. 1956, pp. 21-44. Part 2. pt. 11, May 1956, pp. 135-155.
8. KERR, T. H.: Experience of Supersonic Flying Over Land in the United Kingdom. Rept. 250, AGARD, North Atlantic Treaty Organization (Paris) , Sept. 1959.
TON, DAVID A.: Ground Measurements of Sonic Boom Pressures for the Altitude Range of 10,000 to 75,000 Feet. NASA TR R-198, 1964.
10. ANON. : Proceedings of the NASA Conference on Supersonic-Transport Feasibility Studies and Supporting Research-September 17-19, 1963.
11. MAGLIERI, DOMENIC J.; HILTON, DAVID A.; AND MCLEOD, NORMAN J.: Experiments on the Effects of Atmosphere Refraction and Airplane Accelerations on Sonic Boom Ground-Pressure Patterns. NASA TN
12. LINA, LINDSAY J.; MAGLIERI, DOMENIC J.; AND HUBBARD, HARVEY H.: Supersonic Transpor t eNoi se Aspects with Emphasis on Sonic Boom. 2nd Supersonic Transports (Proceedings). S.M.F. Fund Paper NO. FF-26, Inst. Aeron. Sci., Jan. 25-27, 1960, pp. 2-12.
13. MAGLIERI, DOMENIC J.; PARROTT, TONY L.; HILTON, DAVID A.; AND COPELAND, WILLIAM L. : Lateral-Spread Sonic Boom Ground-Pressure Measurements From Airplanes at Altitudes to 75,000 Feet and a t Mach Numbers to 2.0. NASA TN D-2021, 1963.
14. RANDALL, D. G.: Methods for Estimating Distributions and Intensities of Sonic Bangs. R. & M. No. 3113, British A.R.C., 1959.
15. KANE, EDWARD J.; AND PALMER, THOMAS Y.: Meteorological Aspects of the Sonic Boom. SRDS Rept. No. RD64-160 (AD 610 463), FAA, Sept. 1964.
16. FRIEDMAN, MANFRED P.: A Description of a Computer Program for the Study of Atmospheric Effects on Sonic Booms. NASA CR-157. 1965.
17. MAGLIERI, DOMENIC J.; AND PARROTT, TONY L.: Atmospheric Effects on Sonic Boom Pressure Signatures. Sound, vol. 2, 1963, pp. 11-14.
18. HUBBARD, HARVEY H.; AND MAGLIERI, DOMENIC J.: Noise and Sonic Boom Considerations in the Operation of Supersonic Aircraft. Paper NO. 64-548, Fourth Congress of the International Council of Aeronautical Sciences, Paris, France, August 1964.
DOMENIC J. : Sonic Boom Exposures During FAA Community-Re-
7. RAO, P. SAMBASIVA: Supersonic Bangs. Aeron. Quart., vol. VII.
9. HUBBARD, HARVEY H.; MAGLIERI, DOMENIC J.; HUCKEL, VERA; AND HIL-
NASA TM X-905, 1963.
D-3520, 1966.
19. HILTON, DAVID A.; HUCKEL, VERA; STEINER, ROY; AND MAGLIERI,
48 SONIC BOOM R E ~ A R C ~ X
L
sponse Studies Over a Six-Month Period in the Oklahoma City Area. NASA T N D-2539, 1964.
20. HILTON, DAVID A.; HUCKEL, VERA; AND MAGLIERI, DOMENIC J.: Sonic Boom Measurements During Bomber Training Operations in the Chicago Area. NASA TN D-3655, 1966.
21. MAGLIERI, DOMENIC J.; HILTON, DAVID A.; AND MCLEOD, NORMAN J.: Summary Variations of Sonic Boom Signatures Resulting From At- mospheric Effects. Presented as a Discussion Document at the 5th Meeting of the (FAUSST) French-Anglo-Saxon-United States Supersonic Transport Committee, Washington, D.C., February 1967.
22. MAGLIERI, D. J.; HUCKEL, V.; HENDERSON, H. R.; AND PUTMAN, TERRY: Preliminary Results of XB-70 Sonic Boom Field Tests During Na- tional Sonic Boom Evaluation Program. LWP No. 382, March 1967.
23. FRIEDMAN, MANFRED P.; AND CHOU, DAVID c.: Behavior of the Sonic Boom Shock Wave Near the Sonic Cutoff Altitude. NASA CR-358, 1965.
24. MIDDLETON, WILBUR D.; AND CARLSON, HARRY W.: A Numerical Method for Calculating Near-Field Sonic Boom Pressure Signatures. NASA
25. ANON.: Proceedings of the Sonic Boom Symposium. J. Acoust. SOC. Am., TN D-3082, 1965.
vol. 39, 1966-Part 2, pp. S43-S80.
Some Effects of the Atmosphere on Sonic Boom
EDWARD J. KANE
The Boeing Company
INTRODUCTION
Shock waves generated by a supersonic airplane travel through the atmosphere to reach the ground. The varying properties of the atmosphere influence the path and strength of these shock waves. Specifically, wind and temperature variations influence the path while a combination of pressure, temperature, and wind variations influence the strength. On the ground, the influence of the atmosphere is reflected by variations in the following:
(1) Sonic boom overpressure directly beneath the airplane (2) Lateral distribution of overpressure (3) Location of lateral cutoff
These effects are illustrated in figure 1. This paper contains a brief summary of current knowledge of
the atmospheric influence on sonic boom. Phenomena which war- rant additional investigation are also discussed.
REVIEW OF ATMOSPHERIC INFLUENCES
Extensive theoretical and experimental investigations of the atmospheric influences on sonic boom have been carried out. Re- sults of these investigations are reviewed in this section. Some theoretical investigations based on the method of geometric acoustics are contained in references 1 to 5. More extensive treat- ments are contained in references 6 to 8. The theory developed in reference 8 is in fairly wide use in this country, and is reviewed in the appendix of this paper. This theory has been used in the investigation of atmospheric effects on sonic boom (ref. 9) spon- ' sored by the Federal Aviation Administration. The material pre- sented in this paper is drawn from reference 9, additional
49

50 SONIC BOOM RESEARCH
PATH OF SHOCK WAVE REFRACTED ey ATMOSPHERE
SONIC BOOM OVERPRESSURE, a p
MAXIMUM OVERPRESSURE LATERAL CUTOFF
ATMOSPHERIC REFRACTION
CAUSED e y
I I I I I
LATERAL DISTANCE
FIGURE 1.-Effect of atmosphere on sonic boom.
computations using the theory of reference 8, and extensive test data measured by NASA.
Overpressure
A method for calculating the shock wave strength in a homoge- neous atmosphere was developed by Whithanl (ref. 10). The in- fluence of the varying properties of the atmosphere (pressure. temperature, and winds) on shock-wave strength can be com- puted by the theory of reference 8. A comparison of calculated overpressure in the homogeneous and the real atmosphere illus- trates the effect of the atmosphere. This is shown in figure 2 as a function of distance from an airplane flying at a Mach number of 2.7 and an altitude of 60 000 feet. In general, the effect of the atmosphere is to increase the overpressure.
The theory of reference 8 has been used to compute an over- pressure scaling factor ( K , ) for the U.S. Standard Atmosphere, 1962. This factor is shown in figure 3 and can be used to scale overpressure calculated in the homogeneous atmosphere. It is a function of airplane Mach number and flight altitude and has
' been used in correlating test data. The cross-hatched area shows the range of present sonic boom test data. The potential flight profile range of the US. SST is also shown. It may be noted that there is lack of test data for possible flight conditions at low supersonic Mach numbers and high altitudes.

’ EFFECTS OF THE ATMOSPHERE ON SONIC BOOM 51
AIRPLANE AT 60 000 FT. AND MACH 2.70
\
ACTUAL ATMOSPHERE
c
UNIFORM ATMOSPHERE
4 0 IO 20 30 40 5 0 60
DISTANCE BELOW AIRPLANE - 1000 FT.
FIGURE 2.-Eff ect of atmosphere on sonic boom overpressure.
The effect of variations from standard day conditions on sonic boom overpressure has been studied theoretically. Both extreme and average variations of wind, temperature, and pressure have been considered and the results are reported in detail in reference 9. A summary of the calculated variations in overpressure from that for the standard day is shown in figure 4. Specific results for a combination of extreme wind and temperature conditions are shown. The maximum variation in predicted overpressure ( AP) from the standard day values is about +5 percent for steady flight at Mach numbers above 1.3. For flight Mach numbers be- tween 1.0 and 1.3, larger variations are predicted. However, the shock waves are approaching a “grazing” condition in this Mach number range which appears to offset the variation shown. This will be discussed more extensively. Similar, but larger, variations were shown by Dressler and Fredholm (ref. 5 ) for shock waves near grazing. However, the results reported by them were cal- culated by using geometric acoustics theory, which results in a focus in the theoretical solution for grazing shock waves. The

52
20 W
3 u) u)
a
w 10 a a LL W > 0 0 - z W 0
I V
+ z w - 2 0 V a W
5 -10
a -30
16
15
14
N - - a= I 3 . 0 a
* 1.2 . Y
I I
10
0
-
-
-
-
-
SONIC BOOM RESEARCH
U S STANDARD ATMOSPHERE, 1962 NO WIND GROUND AT MEAN SEA LEVEL Pg =AMBIENT PRESSURE AT GROUND Ph 'AMBIENT PRESSURE AT A IRPLANE
PROEAELE U.S S S FLIGHT PROFILE R
REGION OF AVAILABLE
I I I I I I I I I I 10 20 30 40 50 60 70 80 90 100
AIRPLANE HEIGHT ABOVE GROUND - 1000 FT.
FIGURE 3.-Atmospheric correction factor.
T E M P WINDSPEED
10 I .5 2 a 2.5 MACH NUMBER
3.0
FIGURE 4.-Effect of nonstandard day condition.
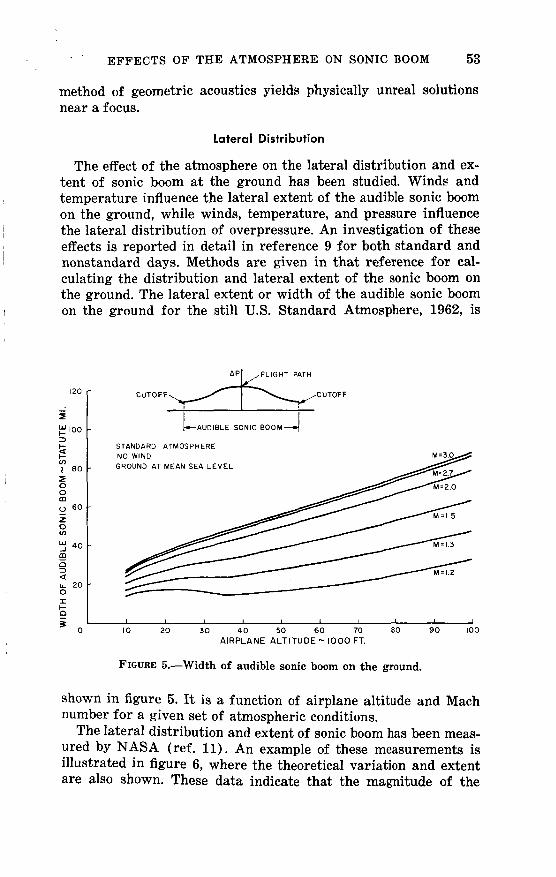
EFFECTS OF THE ATMOSPHERE ON SONIC BOOM 53
method of geometric acoustics yields physically unreal solutions near a focus.
Lateral Distribution
The effect of the atmosphere on the lateral distribution and ex- tent of sonic boom at the ground has been studied. Winds and temperature influence the lateral extent of the audible sonic boom on the ground, while winds, temperature, and pressure influence the lateral distribution of overpressure. An investigation of these effects is reported in detail in reference 9 for both standard and nonstandard days. Methods are given in that reference for cal- culating the distribution and lateral extent of the sonic boom on the ground. The lateral extent or width of the audible sonic boom on the ground for the still U.S. Standard Atmosphere, 1962, is
I20
- I 2 100 3
W J 4o m a 3 d LA 20 0 I I- D s o
ACUTOFI CUTOFF
STANDARD ATMOSPHERE NO WIND GROUND AT MEAN SEA LEVEL
M = I 5
I I I I I I I I 30 40 50 60 70 80 90 100 10 20
AIRPLANE ALTITUDE ,.. 1000 FT.
FIGURE 5.-Width of audible sonic boom on the ground.
shown in figure 5. It is a function of airplane altitude and Mach number for a given set of atmospheric conditions.
The lateral distribution and extent of sonic boom has been meas- ured by NASA (ref. 11). An example of these measurements is illustrated in figure 6, where the theoretical variation and extent are also shown. These data indicate that the magnitude of the

54
4.0 r-
SONIC BOOM RESEARCH
F- 104 MACH N 0 . 2 . 0 ALTITUDE 52 000 F T
w 3 v)
E 3.0
a
a n
NASA TEST DATA I/ -30 - 20 -I 0 0 10 2 0 30
LATERAL DISTANCE- MILES
FIGURE 6.-Lateral distribution of sonic boom - comparison of test and theory.
overpressure drops rapidly to zero beyond the location of the lateral cutoff. In additioh, the maximum overpressure is recorded under the airplane and decreases with increasing lateral distance.
Grazing Shock Waves
Variations in temperature and winds between the airplane and the ground refract the paths of the shock waves as they travel from the airplane. This distortion of the paths of propagation may prevent the shock waves from reaching the ground for flight at Mach numbers slightly greater than 1.0. At some Mach number the shock waves will just reach or “graze” the ground under the airplane. This value has been called the “threshold” Mach number. A method for computing the threshold Mach number for various atmospheric conditions is given in reference 9. (In that reference the threshold Mach number has been called the “cutoff” Mach number.)
The overpressure in free air at a fixed distance below the air- plane has been calculated as a function of steady flight Mach number (refs. 9 and 12). The calculations for steady flight very near the threshold Mach number indicate increased but finite shock strength at the previously established distance where the shock waves are approaching the grazing condition. The strength
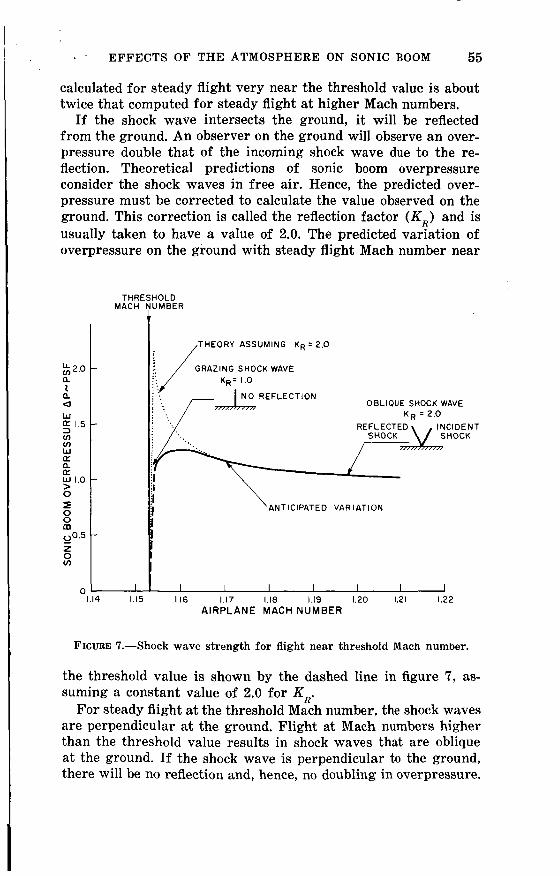
~. . . EFFECTS O F THE ATMOSPHERE ON SONIC BOOM 55
calculated for steady flight very near the threshold value is about twice that computed for steady flight at higher Mach numbers.
If the shock wave intersects the ground, it will be reflected from the ground. An observer on the ground will observe an over- pressure double that of the incoming shock wave due to the re- flection. Theoretical predictions of sonic boom overpressure consider the shock waves in free air. Hence, the predicted over- pressure must be corrected to calculate the value observed on the ground. This correction is called the reflection factor ( K , ) and is usually taken to have a value of 2.0. The predicted variation of overpressure on the ground with steady flight Mach number near
& 2.0 a 1 a a W 5 1.5 v) v) W [L a [L w 1.0 > 0 5: 0 0 m "0.5 Z - SI
0
THRE MACH
I I 1.15
3LD MBER
THEORY ASSUMING KR = 2.0
/ GRAZING SHOCK WAVE
OBLIOUE SHOCK WAVE K R = 2.0
1.16 1.17 1.18 1.19 1.20 1.21 1.22 AIRPLANE MACH NUMBER
FIGURE 7.-Shock wave strength for flight near threshold Mach number.
the threshold value is shown by the dashed line in figure 7, as- suming a constant value of 2.0 for KR.
For steady flight at the threshold Mach number, the shock waves are perpendicular at the ground. Flight at Mach numbers higher than the threshold value results in shock waves that are oblique at the ground. If the shock wave is perpendicular to the ground, there will be no reflection and, hence, no doubling in overpressure.

56 SONIC BOOM RESEARCH
Thus, it would be expected that K , should be 1.0 for flight very near the threshold Mach number and should increase to 2.0 for steady flight a t higher Mach numbers. Applicatian of the hypothe- sis of a variable K , for steady flight near the'threshold value is illustrated by the solid line in figure 7, where the maximum over- pressure indicated by the dashed line (assuming K , = 2.0) has been halved. The results of the above reasoning would indicate that no significant increase in observed overpressure would be expected for grazing shock waves.
Test data (ref. 11) have been obtained for steady flight near the threshold Mach number. Theoretical predictions with and without assumption of ground reflection are compared to these data in figure 8. These data do not indicate any appreciable increase (or
ALT = 33 500 FT. ALT = 37 SOOFT.
THRESHOLD NASA TEST DATA 3.0 r MACH NUMBER
SHOCK
12 13 14 15 I1 12 I 3 14 15 I I MACH NUMBER
FIGURE 8.-Comparison of theory and test for flight near threshold Mach number.
focus) in observed overpressure for flight near the threshold Mach number. Indeed, they indicate that the pressure jump across the grazing shock wave is appreciably lower than that predicted by the theory with K , = 1.0. At the present time, there is no com- plete theoretical method for predicting the effect of these off- setting influences for grazing shock waves.
Distorted Pressure Signatures
Pressure signatures produced by a variety of airplanes have been measured by NASA. Some examples of these measurements are shown in figure 9, where, for comparison, the theoretical signatures are superimposed. The resemblance between the pre- dicted and measured signatures is very close. However, on numer- ous occasions pressure signatures have been measured which bear
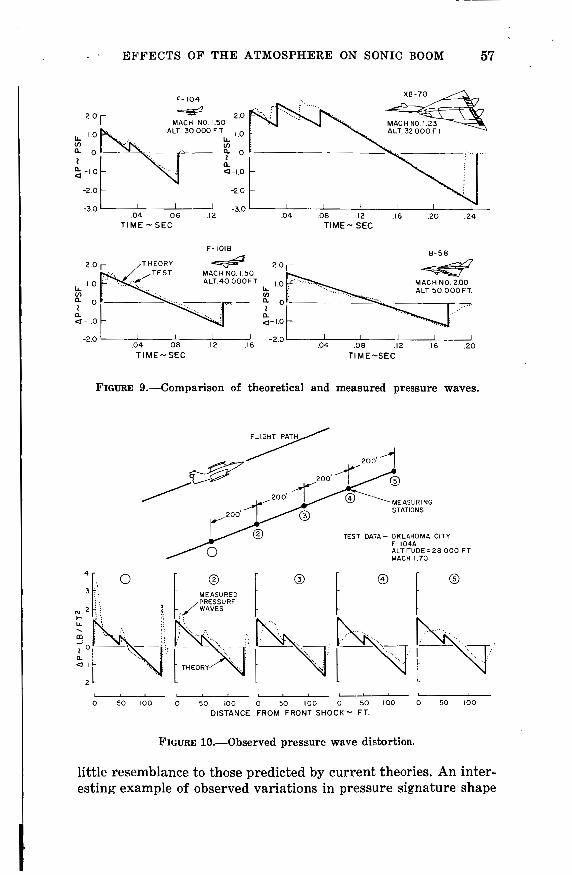
57 EFFECTS OF THE ATMOSPHERE ON SONIC BOOM
F- 104
-d 2 0 MACH NO 150
ALT 3 0 0 0 0 F T lL
a a - i o
-20L-- -3 0 04 06 t i ! 1: T I M E - SEC
.04 08 .I2 .I6 .20 24 TIME- SEC
F-1018
THEORY
A L T 4 0 O O O F T
ul - a
2.0 r MACH NO. 2 0 0 ALT 50 OOOFT. ..._ ...,
- v)
,... a 0 2 a 4-10
-20 I I I I I - 2 0 1 I I I I I 12 16 2 0 04 08 12 16 04 0 8
TIME-SEC TI ME-SEC
FIGURE 9.-Comparison of theoretical and measured pressure waves.
MEASURING STATIONS
TEST DATA - OKLAHOMA CITY F-1046 ALTITUDE = 2 8 000 F T MACH 1.70
0
200’ 1 w’ .rr’
/ TEST DATA - OKLAHOMA CITY
F-1046 ALTITUDE = 2 8 000 F T MACH 1.70
I -1, I
0 50 100 0 50 100 0 50 100 0 50 100 0 50 100 DISTANCE FROM FRONT SHOCK - FT.
FIGURE 10.-Observed pressure wave distortion.
little resemblance to those predicted by current theories. An inter- esting example of observed variations in pressure signature shape
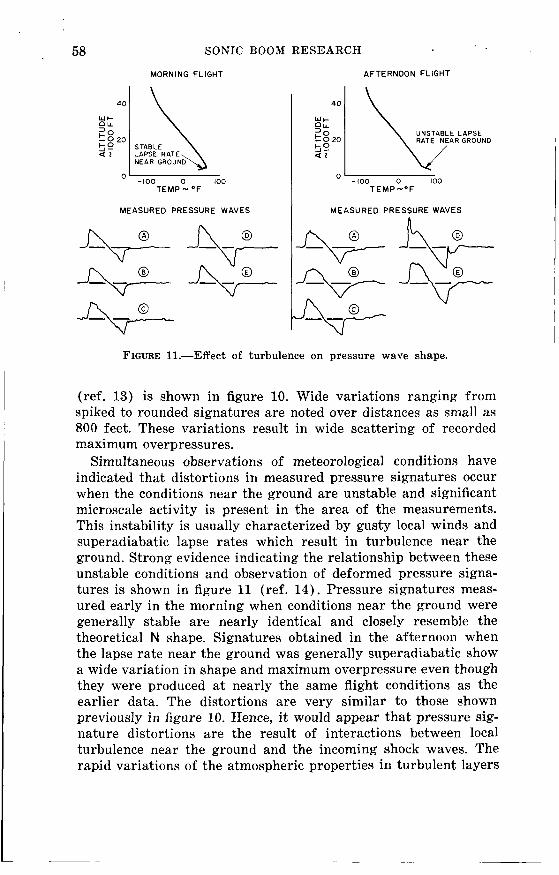
58 SONIC BOOM RESEARCH
MORNING FLIGHT AFTERNOON FLIGHT
bo STABLE d y LAPSE RATE
NEAR GROUND
0- 100 TEMP - OF
0- 100 TEMP-OF
MEASURED PRESSURE WAVES I MEASURED PRESSURE WAVES
FIGURE 11.-Effect of turbulence on pressure wave shape.
(ref. 13) is shown in figure 10. Wide variations ranging from spiked to rounded signatures are noted over distances as small as 800 feet. These variations result in wide scattering of recorded maximum overpressures.
Simultaneous observations of meteorological conditions have indicated that distortions in measured pressure signatures occur when the conditions near the ground are unstable and significant microscale activity is present in the area of the measurements. This instability is usually characterized by gusty local winds and superadiabatic lapse rates which result in turbulence near the ground. Strong evidence indicating the relationship between these unstable conditions and observation of deformed pressure signa- tures is shown in figure 11 (ref. 14). Pressure signatures meas- ured early in the morning when conditions near the ground were generally stable are nearly identical and closely resemble the theoretical N shape. Signatures obtained in the afternoon when the lapse rate near the ground was generally superadiabatic show a wide variation in shape and maximum overpressure even though they were produced a t nearly the same flight conditions as the earlier data. The distortions are very similar to those shown previously in figure 10. Hence, it would appear that pressure sig- nature distortions are the result of interactions between local turbulence near the ground and the incoming shock waves. The rapid variations of the atmospheric properties in turbulent layers
. . EFFECTS O F THE ATMOSPHERE ON SONIC BOOM 59
over small distances seem to influence significantly the shock wave and the particle velocities behind it, thus leading to a redistribu- tion of strength. Extensive statistical analyses of measured over- pressure data have been prepared by NASA. Contour plots of maximum overpressure prepared by ESSA from the recent sonic boom tests at Edwards Air Force Base indicate that the spatial distribution of spiked and rounded signatures is cyclic in nature, but it has no preferred orientation or wavelength and varies ran- domly with time.
At the present time, no analytical description of this phenome- non is available. It appears that, although the mechanism may eventually be described, there is little hope of predicting the exact time and place of specific distortions such as large increases in overpressure (spikes) because the distribution of turbulence is random in both time and space and can be described only in statistical terms.
SUGGESTED INVESTIGATIONS
Several aspects of the influence of the atmospheric conditions on sonic boom warrant further study. They include the following:
(1) Measurement and analysis of high-altitude, low supersonic Mach number flight-test data.
(2) Analytical description of the overpressure at the ground for flight near the threshold Mach number.
(3) Investigation of the relationship between local turbulence and pressure wave deformations.
CONCLUSIONS
Extensive theoretical and experimental investigations on the influence of the atmosphere on sonic boom have been made. A theoretical method has been developed to predict the influence of stratified nonhomogeneous atmospheres on shock wave propaga- tion. This method has been used to investigate the influence of average and extreme meteorological conditions. Aspects that re- quire additional study include collection and analysis of high- altitude, low supersonic Mach number test data, an analytical description of the strength of grazing shock waves, and an in- vestigation of the causes and effects of shock wave-turbulence interactions.

60 SONIC BOOM RESEARCH
APPENDIX-BRIEF REVIEW OF THE THEORY AND ITS APPLICATION
The method of geometric acoustics has been used by a number of investigators (refs. 1 to 4) to calculate shock surface-ground intersections. While this method is adequate for this purpose (ref. 15), by itself it will yield no information about the shock wave strength. Some indication of the effect of the atmosphere on shock wave strength can be obtained by assuming that the shock wave energy is inversely proportional to the distance between adjacent paths of propagation (ref. 5 ) . However, this method yields in- determinate solutions where the distance between the adjacent paths goes to zero (such as for grazing shock waves).
Randall (ref. 6 ) , Guiraud (ref. 7), and Friedman, Kane, and Sigalla (ref. 8) have derived more general theories for the effect of the atmosphere on sonic boom using the concept of propagation through isolated tubes. The theory of reference 8 is in relatively wide use in this country and was used in an FAA-sponsored in- vestigation of the atmospheric effects on sonic boom (ref. 9) . This theory parallels earlier work done by Whitham (ref. 16) to de- scribe the development of weak shock surfaces in a uniform at- mosphere.
The theory of reference 8 was developed by considering the propagation of weak shock waves through a tube of varying area. This tube follows the path of propagation of the shock wave and is called a “ray” tube. (The path of propagation is called a ray.) Particle velocities behind the shock wave are parallel to the ray, so it was assumed that there was no convection of momentum, energy, or mass between adjacent tubes. In addition, the growth of the shock surface as it propagates has been accounted for by assuming that the area of the ray tube was a function of the propagation distance. On the basis of these assumptions, the pro- pagation through each ray tube could be studied separately, and the problem was formulated in terms of two independent vari- ables, Le., distance along the ray tube and time.
The equations for conservation of energy, mass, and momentum along the ray tube were written and then linearized. Solution of the linearized equations and application of the initial conditions resulted in an integral for the shock strength which is given as equation (11-7) in reference 9. The integrand is a function of distance along the ray tube. To evaluate the integral, the ray-tube area and the atmospheric conditions must be derived as functions of distance along the ray tube.
A modified form of the method of geometric acoustics was used to determine the ray tube area as a function of distance. The
8

EFFECTS O F THE ATMOSPHERE ON SONIC BOOM 61
acoustic ray tracing equations developed by Milne (ref. 17) have been used to determine the propagation path, but the speed of propagation was taken as that determined from the shock wave strength. A set of adjacent rays has been used to define the geo- metric boundaries of the ray tube. Hence, because the path of propagation is related to the shock strength, the ray tube area is also a function of the shock wave strength. The resulting expres- sion is given as equation (11-6) of reference 9.
In the development of the integral for the shock strength, the atmospheric properties (pressure, temperature, and wind) were assumed to be a function of distance along the ray tube and in- variant with time. In general, these properties vary in both space and time, but for a nonturbulent atmosphere, dependence on time can be neglected because the time scale of the variation of at- mospheric properties is much larger than the time taken for a shock wave to travel from the airplane to the ground (e.g., 12 hours as compared with 60 seconds).
For the purposes of numerical computation, the properties are specified as a function of vertical distance, so that they are con- stant in the horizontal direction but vary vertically (i.e., hori- zontally stratified atmospheres). This is consistent with current methods of measuring meteorological data. The equations for the propagation path have been used to relate vertical distance to distance along the ray tube. This relationship was used to obtain the atmospheric properties as a function of distance along the ray tube.
Because the ray tube area is a function of the shock wave strength, an iteration method has been used t o obtain numerical results. The distance between the airplane and the ground is divided into a number of intervals for computation. In calculating from one interval to the next, the first solution is obtained as- suming propagation at the local sound speed. The shock strength is recalculated using the strength from the first solution to deter- mine the propagation speed. The iterations continue until con- vergence of the shock strength is achieved between the previous and last iteration. Convergence is very rapid, generally requiring only a single iteration, except when the ray tube area approaches zero. This occurs near cusps in the shock surface (for instance, grazing shock waves), and numerous iterations are required be- cause the shock strength varies rapidly with distance along the ray tube. In these cases, the interval size f o r calculation is reduced to improve numerical accuracy.
For any set of atmospheric properties and initial conditions, the shock wave strength can be computed at any point below the
I
62 SONIC BOOM RESEARCH
airplane. Numerical computations have indicated that for super- sonic airplane configurations, scaling of the shock strength is independent of the initial conditions. In addition, because the strength of the shock wave is small, the cha'nge in propagation speed from the local sound speed is correspondingly small. For example, a 10-psf shock wave at the ground propagates a t a speed that is only about 0.2 percent greater than the local sound speed. Hence, all portions of the pressure signature would propagate a t speeds very close to the local sound speed, and there would be no appreciable longitudinal distortion from that predicted in the homogeneous atmosphere due to propagation through the non- homogeneous atmosphere.
REFERENCES
1. RANDALL, D. G.; Methods for Estimating Distributions and Intensities of Sonic Bangs. R. & M. No. 3113, British A.R.C., 1959.
2. WARREN, C. H. E.: The Propagation of Sonic Bangs in a Nonhomogene- ous Still Atmosphere. AIAA Preprint No. 64-547, 1964.
3. LANSING, D. L.: Application of Acoustic Theory to Prediction of Sonic Boom Ground Patterns for Maneuvering Aircraft. NASA TN D-1860, 1964.
4. BARGER, R. L.: Some Effects of Flight Path and Atmospheric Variations on the Sonic Boom Propagated from a Supersonic Aircraft. NASA TR R-191, Feb. 1964.
5. DRESSLER, R.; AND FREDHOLM, N. : Statistical Magnifications of Sonic Booms by the Atmosphere. F F A Report 105, June 1966.
6. RANDALL, D. G.: Sonic Bang Intensities in a Stratified Still Atmosphere. RAE Technical Report No. 66002, Jan. 1966.
7. GUIRAUD, J. P.: Theoretical Study of the Propagation of Sound. Ap- plication to Anticipation of the Sonic Boom Produced by Supersonic Flight. NASA TT F-387, Dee. 1965. (Also available as ONERA rep. T P 104, 1964.)
8. FRIEDMAN, M. P.; KANE, E. J.; AND SIGALLA, A.: Effects of Atmosphere and Aircraft Motion on the Location and Intensity of a Sonic Boom. AIAA Journal, vol. 1, June 1963, pp. 1327-1335.
9. KANE, E. J.; AND PALMER, T. Y.: Meteorological Aspects of the Sonic Boom. FAA SRDS Report RD 64-160, Sept. 1964.
10. WHITHAM, G. M.: The Flow Pattern of a Supersonic Projectile. Com- munications on Pure and Applied Mathematics, vol. 5, 1952, pp. 301- 348.
11. MAGLIERI, D. J.; HILTON, D. A.; AND MCLEOD, N. J.: Experiments on the Effects of Atmospheric Refraction and Airplane Accelerations on Sonic Boom Ground Pressure Patterns. NASA TN D-3520, July 1966.
12. FRIEDMAN, M. P.; AND CHOW, D. C.: Behavior of the Sonic Boom Shock Wave Near the Sonic Cutoff Altitude. NASA CR-358, Dee. 1965.

* EFFECTS OF THE ATMOSPHERE ON SONIC BOOM 63
13. MAGLIERI, D. J.: Some Effects of Airplane Operation and Atmosphere on Sonic Boom Signatures. Journal of the Acoustical Society of America, vol. 39, par t 2, 1966, pp. 536-542.
14. MAGLIERI, D. J.; AND PARROTT, T. L.: Atmospheric Effects on Sonic Boom Pressure Signatures. Paper presented at the 63rd Meeting of the Acoustical Society of America, May 1962.
15. LANSING, D. L.; AND MAGLIERI, D. J.: Comparison of Measured and Calculated Sonic Boom Ground Patterns due to Several Different Aircraft Maneuvers. NASA TN D-2730, April 1965.
16. WHITHAM, G. B.: On the Propagation of Weak Shock Waves. aournal of Fluid Mechanics, vol. 1, Sept. 1956, pp. 290-318.
17. MILNE, E. A.: Sound Waves in the Atmosphere. Phil. Mag., series 6, vol. 42, no. 247, July 1921.

Sonic Boom Effects on People and Structures
HARVEY H. HUBBARD AND WILLIAM H. MAYES Langley Research Center, NASA
INTRODUCTION
Sonic boom waves from proposed supersonic transport opera- tions will sweep over large areas of the Earth’s surface and may have significant effects on people within these exposed areas. There is considerable concern about the manner in which people and structures respond to sonic booms and how such responses will affect community acceptance of overland flights of the super- sonic transport. The nature of the response problem is illustrated by figure 1. The sketch at the top of the figure suggests two different exposure situations for people. In one case the person is
FIGURE 1.-Factors involved in sonic boom exposures.
65
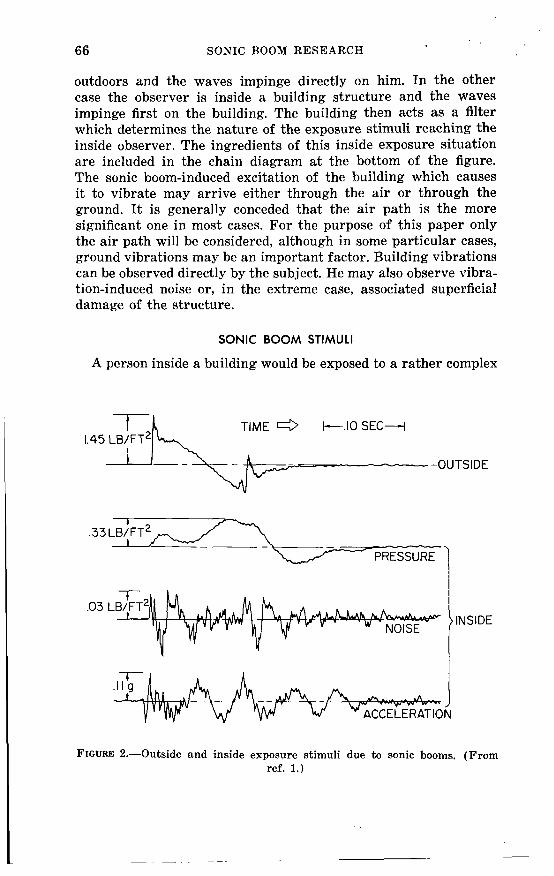
66 SONIC BOOM RESEARCH
outdoors and the waves impinge directly cn him. In the other case the observer is inside a building structure and the waves impinge first on the building. The building then acts as a filter which determines the nature of the exposure stimuli reaching the inside observer. The ingredients of this inside exposure situation are included in the chain diagram at the bottom of the figure. The sonic boom-induced excitation of the building which causes it to vibrate may arrive either through the air or through the ground. It is generally conceded that the air path is the more significant one in most cases. For the purpose of this paper only the air path will be considered, although in some particular cases, ground vibrations may be an important factor. Building vibrations can be observed directly by the subject. He may also observe vibra- tion-induced noise or, in the extreme case, associated superficial damage of the structure.
SONIC BOOM STIMULI
A person inside a building would be exposed to a rather complex
TIME +.IOSEC--l 1.45 l=yb--- L B / F T ~
-0" TS I DE
}INSIDE
FIGURE 2.-Outside and inside exposure stimuli due to sonic booms. (From ref. 1.)
. SONIC BOOM EFFECTS ON PEOPLE AND STRUCTURES 67
series of stimuli, including auditory, visual, and vibratory inputs. The nature of the acoustic and vibratory inputs is illustrated in figure 2 from reference 1. The top trace is a sample outside pres- sure exposure as measured for one particular case. It can be seen that this wave is of the N wave type, but it differs from an N wave in some of its details as do many of the waves measured in the field. The three bottom traces represent corresponding in- side-exposure stimuli. The topmost of these represents the pres- sure variation inside the building owing to vibratory motions of the building and the cavity resonances. Although this is a pres- sure disturbance, it generally occurs in a frequency range that is not audible to humans. The audible portion of this signal, as measured with a separate microphone system, has the character- istic shape of the next lower trace and is seen to be an order of magnitude lower in amplitude. It is believed that this audible portion of the pressure signal is associated with the rattling of the building structure and furnishings because of the primary mode responses in the building. Finally, the bottom trace represents the vibration of the floor that would be sensed by a person either directly or through the furniture. At the present time, the inside exposure situation is not well enough understood to permit the relative importance of each of these stimuli to be determined, although it is believed that in certain situations each one is sig- nificant.
Of particular interest are the features of the N wave type ex- posure that are significant in the response problem. Some indica- tion of those features which are important are illustrated in figures 3 and 4, which deal with the energy spectra of the waves. The energy spectra of figure 3 are presented for two different N waves which differ markedly in time duration (see ref. 2). Relative amplitudes of the component frequencies are shown by means of the spectrum envelope curves. Data for the short-dura- tion wave are given by the curve of short dashes and those for the long-duration wave by the solid curve. Each of these consists of several cycles or convolutions which, although not shown in the figure, extend on to higher frequencies. I t is important to note that in each case the curves are tangent to a 6 dB per octave line which serves as a spectrum envelope for both waves. It can be seen from the figure that the relative amplitudes of the high- frequency components are approximately the same for waves which vary markedly in time duration. It is thus suggested that the audibility responses for outside exposure would be approxi- mately the same regardless of time duration. On the other hand, the low-frequency components of the waves vary markedly as a
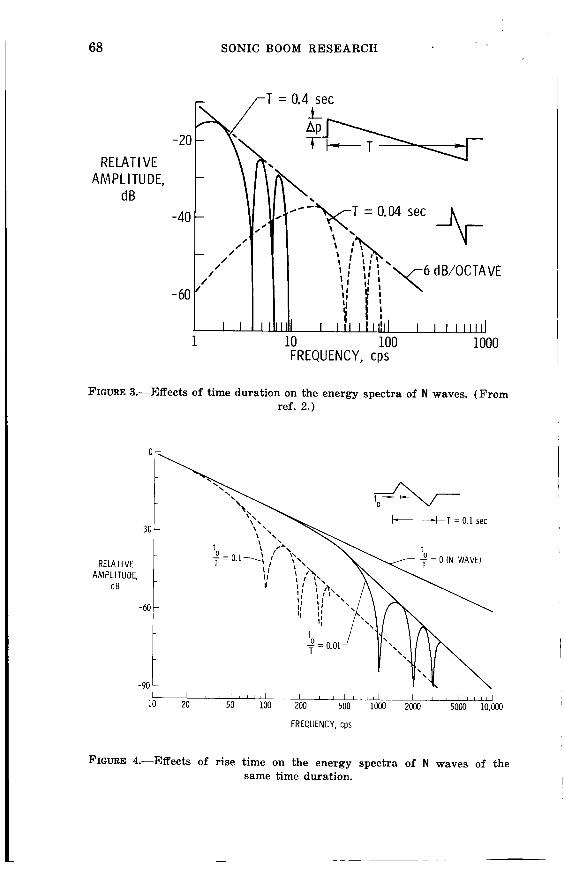
68
RElATl VE AMPLITUDE,
dB
SONIC BOOM RESEARCH
7 r T = 0.4 sec
0 , /
-40 - 0. . / * - X , T = 0.04 sec
/ 6 d B/OCTAVE - /
/
/
-60
I I I11111 I I I I11111 1 10 100 1000
FREQUENCY, cps
FIGURE 3.-Effects of time duration on the energy spectra of N waves. (From ref. 2.)
I I , , I , , , , I I I I I 1 1 1 1 1 I I I I I , , , I 10 20 50 100 200 500 1000 2Mx) 5000 10,ooO
FREQUENCY, cps
FIGURE 4.-Effects of rise time on the energy spectra of N waves of the same time duration.
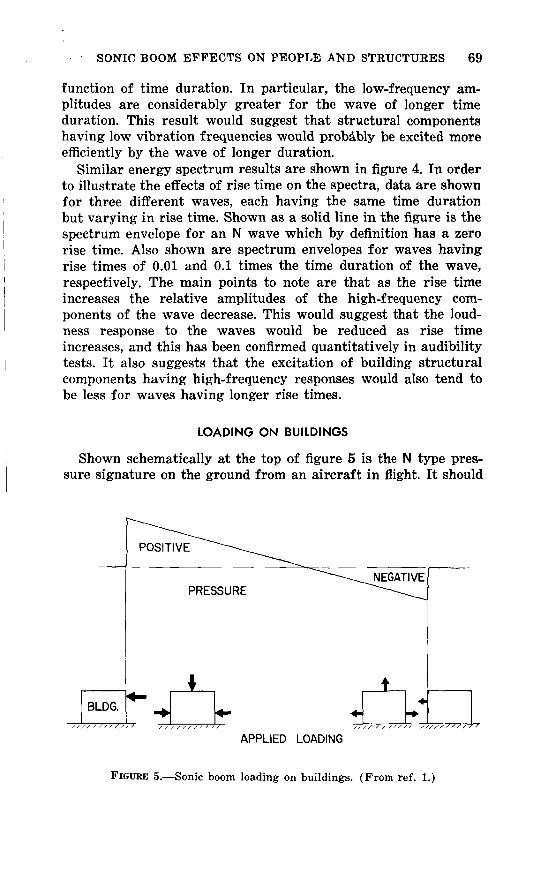
SONIC BOOM EFFECTS ON PEOPLE AND STRUCTURES 69
function of time duration. In particular, the low-frequency am- plitudes are considerably greater for the wave of longer time duration. This result would suggest that structural components having low vibration frequencies would probdbly be excited more efficiently by the wave of longer duration.
Similar energy spectrum results are shown in figure 4. In order to illustrate the effects of rise time on the spectra, data are shown for three different waves, each having the same time duration but varying in rise time. Shown as a solid line in the figure is the spectrum envelope for an N wave which by definition has a zero rise time. Also shown are spectrum envelopes for waves having rise times of 0.01 and 0.1 times the time duration of the wave, respectively. The main points to note are that as the rise time increases the relative amplitudes of the high-f requency com- ponents of the wave decrease. This would suggest that the loud- ness response to the waves would be reduced as rise time increases, and this has been confirmed quantitatively in audibility tests. It also suggests that the excitation of building structural components having high-f requency responses would also tend to be less for waves having longer rise times.
I
LOADING ON BUILDINGS
Shown schematically at the top of figure 5 is the N type pres- I sure signature on the ground from an aircraft in flight. It should
POSITIVE -
PRESSURE
I I I
APPLIED LOADING
FIGURE 5.-Sonic boom loading on buildings. (From ref. 1.)
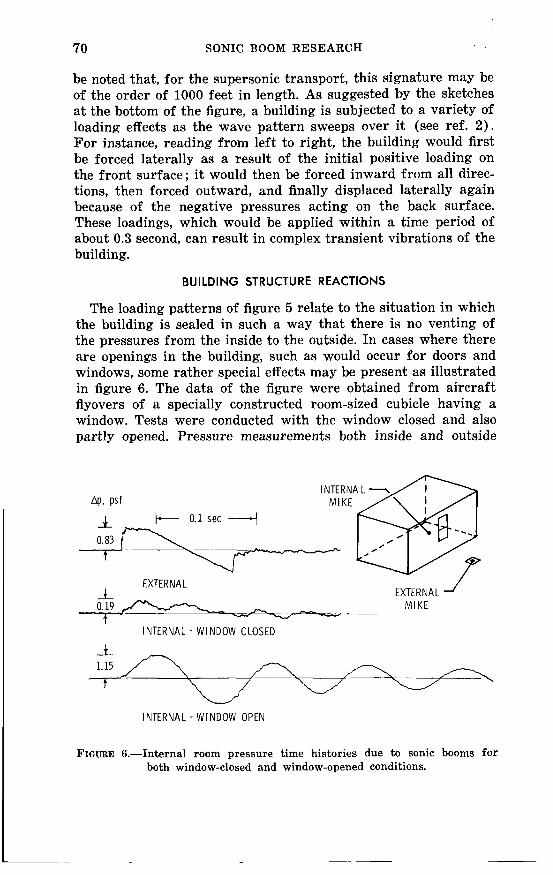
70 SONIC BOOM RESEARCH
be noted that, for the supersonic transport, this signature may be of the order of 1000 feet in length. As suggested by the sketches at the bottom of the figure, a building is subjected to a variety of loading effects as the wave pattern sweeps over it (see ref. 2) . For instance, reading from left to right, the building would first be forced laterally as a result of the initial positive loading on the front surface; it would then be forced inward from all direc- tions, then forced outward, and finally displaced laterally again because of the negative pressures acting on the back surface. These loadings, which would be applied within a time period of about 0.3 second, can result in complex transient vibrations of the building.
BUI LDlNG STRUCTURE REACTIONS
The loading patterns of figure 5 relate to the situation in which the building is sealed in such a way that there is no venting of the pressures from the inside to the outside. In cases where there are openings in the building, such as would occur for doors and windows, some rather special effects may be present as illustrated in figure 6. The data of the figure were obtained from aircraft flyovers of a specially constructed room-sized cubicle having a window. Tests were conducted with the window closed and also partly opened. Pressure measurements both inside and outside
&, P S f
L 0.83 t
4 EXTERNAL
MIKE 0.19 t -- 7-A
INTERNAL -WINDOW CLOSED
1 1.15 t
INTERNAL - WINDOW OPEN
FIGURE 6.-Internal room pressure time histories due to sonic booms for both window-closed and window-opened conditions.
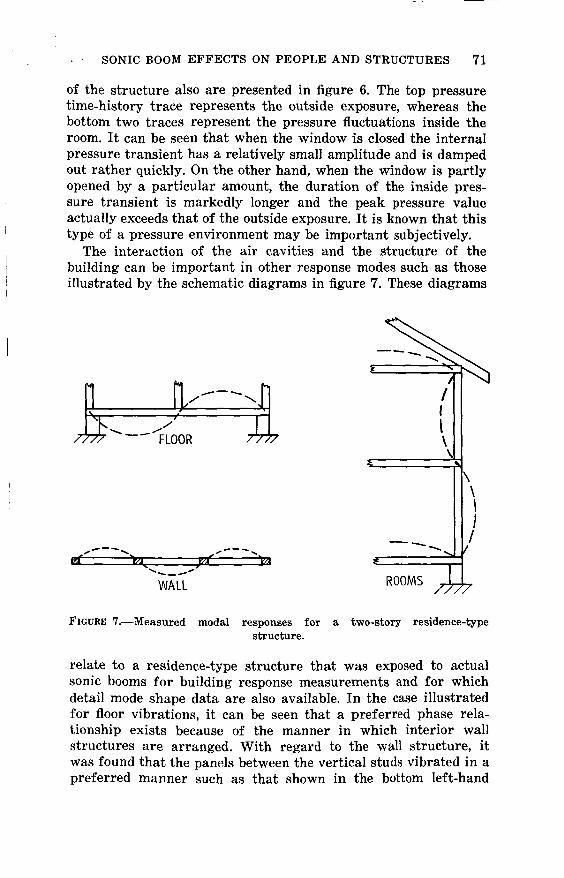
. . SONIC BOOM EFFECTS ON PEOPLE AND STRUCTURES 71
of the structure also are presented in figure 6. The top pressure time-history trace represents the outside exposure, whereas the bottom two traces represent the pressure fluctuations inside the room. It can be seen that when the window is closed the internal pressure transient has a relatively small amplitude and is damped out rather quickly. On the other hand, when the window is partly opened by a particular amount, the duration of the inside pres- sure transient is markedly longer and the peak pressure value actually exceeds that of the outside exposure. It is known that this type of a pressure environment may be important subjectively.
The interaction of the air cavities and the structure of the building can be important in other response modes such as those illustrated by the schematic diagrams in figure 7. These diagrams
i
\ I I
I I\
ROOMS &, FIGURE '7.--Measured modal responses for a two-story residence-type
structure.
relate to a residence-type structure that was exposed to actual sonic booms for building response measurements and for which detail mode shape data are also available. In the case illustrated for floor vibrations, it can be seen that a preferred phase rela- tionship exists because of the manner in which interior wall structures are arranged. With regard to the wall structure, it was found that the panels between the vertical studs vibrated in a preferred manner such as that shown in the bottom left-hand

72 SONIC BOOM RESEARCH
sketch. Higher panel mode frequencies were also noted to exist and to be important. The sketch on the right-hand side of the figure suggests an interaction of the structure of the building and the enclosed air cavities. During actual sonic boom runs, and for engine noise from low-altitude flyovers, acceleration time histories were measured for residence-type structures ; these results are shown in figures 8 and 9.
A sample pair of response records are shown for purposes of illustration in figure 8 (from ref. 3) . Figure 8(a) represents
8-58 SONIC BOOM
KC-135 ENGINE NOISE
FIGURE 8.-Sample acceleration time histories for a residence-type structure as a result of exposure to a sonic boom and to engine noise. (Data from
i ref. 3.)
the tracing of a B-58 sonic boom-induced two-story building vibration response. The tracing of figure 8 (b) , on the other hand, represents the same transducer at the same gain setting for an engine noise exposure during aircraft flyover. It can be seen in the sonic boom case that high-frequency responses are superposed on lower frequency response modes. In the engine-noise case, the low-frequency modes are not excited and the high-frequency re- sponses dominate. It should be noted that the response to the sonic boom is a transient having about 0.5- to 1.0-second time duration, whereas the engine-noise-induced vibrations are detectable for a time interval from 10 to 20 seconds. The dominant engine-noise-
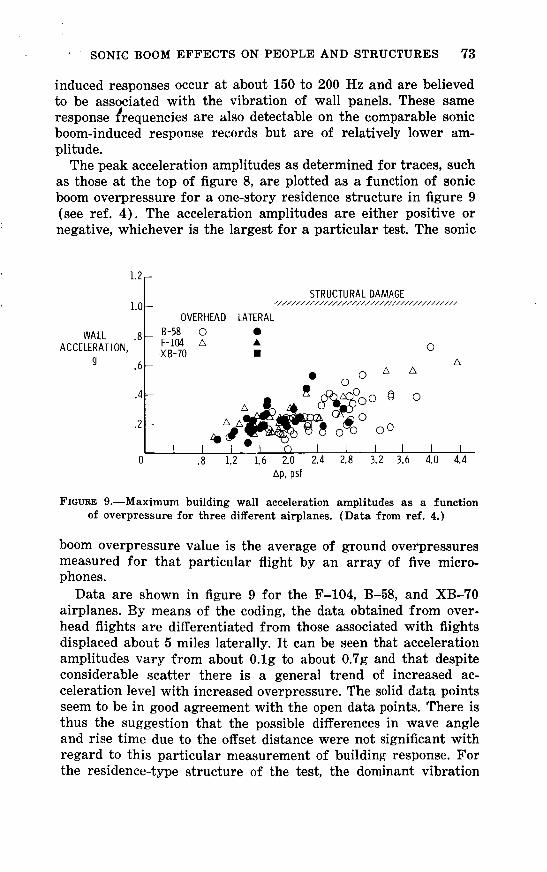
. SONIC BOOM EFFECTS ON PEOPLE AND STRUCTURES 73
induced responses occur at about 150 to 200 Hz and are believed to be associated with the vibration of wall panels. These same response frequencies are also detectable on the comparable sonic boom-induced response records but are of relatively lower am- plitude.
The peak acceleration amplitudes as determined for traces, such as those at the top of figure 8, are plotted as a function of sonic boom overpressure for a one-story residence structure in figure 9 (see ref. 4) . The acceleration amplitudes are either positive or negative, whichever is the largest for a particular test. The sonic
I 1.2,
STRUCTURAL DAMAGE ,//////////////////////////////////////// c OVERHEAD LATERAL
1.0
I 0 A rn 0
9
.4
.2
0 .8 1.2 1.6 2.0 2.4 2.8 3.2 3.6 4.0 4.4
FIGURE 9.-Maximum building wall acceleration amplitudes as a function of overpressure for three different airplanes. (Data from ref. 4.)
boom overpressure value is the average of ground overpressures measured for that particular flight by an array of five micro- phones.
Data are shown in figure 9 for the F-104, B-58, and XB-70 airplanes. By means of the coding, the data obtained from over- head flights are differentiated from those associated with flights displaced about 5 miles laterally. It can be seen that acceleration amplitudes vary from about 0.lg to about 0.7g and that despite considerable scatter there is a general trend of increased ac- celeration level with increased overpressure. The solid data points seem to be in good agreement with the open data points. There is thus the suggestion that the possible differences in wave angle and rise time due to the offset distance were not significant with regard to this particular measurement of building response. For the residence-type structure of the test, the dominant vibration

74 SONIC BOOM RESEARCH
responses were in a frequency range such that similar accelera- tion amplitudes were measured for both small and large aircraft.
SONIC BOOM-INDUCED DAMAGE
One of the more complex aspects of the sonic boom problem is that of reported damage to buildings. It is significant that the majority of such reports refer to superficial-type damage involv- ing the secondary structures of buildings, and thus safety con- siderations are not important except for the special case of falling objects and glass fragments. Engineering evaluations were made for a series of damage reports in the St. Louis, Missouri, area in
DAMAGE I NC I DENTS PER FLIGHT PER
M I L L I O N PEOPLE
0 1.0 2.0 3.0 AP, P S f
FIGURE 10.-Sonic boom-induced incidents per flight per million people for various overpressure ranges. (Data from ref. 5.)
an attempt to determine their validity, and these results are given in figure 10 (see ref. 5 ) .
The overpressure range is indicated on the horizontal scale and the number of “valid” damage incidents per flight per million people is shown on the vertical scale. The four bars of the figure indicate the number of damage incidents associated with four different exposure areas for which the ranges of overpressure are indicated. It is obvious that the higher frequency rate of oc-

1 SONIC BOOM EFFECTS ON PEOPLE AND STRUCTURES 75
currence was associated with the higher range of overpressures. It may be significant that no damage incidents occurred for pres- sure exposures below about 0.8 psf, although i t should be noted that a smaller number of data samples were available in this
I range. I The nature of the sonic boom-induced damage problem can be
illustrated by means of the summary plot of figure 11. The dis-
NO. OF I NC I DENTS
NOM I NAL VALUE I
I
DISTRIBUTION OF A DS ,’ /- DAMAGE
/ I
AP, Psf
I FIGURE 11.-Nature of sonic boom-induced damage problem.
cussion is first directed toward the damage curve which follows from the data of figure 10. The number of damage incidents for a given type of structure increases as the overpressure increases, and this is particularly evident at the higher overpressure values. Also shown in the figure is a schematic illustration of the ampli- tude distribution of the overpressures. It is seen that even though the nominal or predicted overpressure has a value which is gen- erally lower than that at which building damage might be ex- pected, there is a distribution of pressure amplitudes such that a small percentage of the total amplitude values occurs in the rela- tively high overpressure range. These high values which occur only occasionally may be sufficient to trigger incipient damage in existing structures. Two points can be made from this figure. It is obvious that a lower nominal value is desirable because of the reduced probability of building damage. Even though the nominal overpressure is set at a relatively low value, no assurance can be given that the triggering of damage can be completely avoided.
I
I
CONCLUDING REMARKS
Outside exposures involve direct impingement of the sonic boom waves on the observer. Here rise time is noted to be a signif-

76 SONIC BOOM RESEARCH
icant factor. If the observer is inside a building, the time dura- tions of the waves may be more important and the exposure stimuli are largely determined by the structural properties of the building. Such geometric factors as door and window configura- tions and framing, sheathing, and internal wall arrangement details are noted to be significant also. Valid damage incidents reported to date have been limited to secondary components of buildings, and the rates of occurrence are lower for lower over- pressures.
REFER ENC ES
1. HUBBARD, HARVEY H.: Nature of the Sonic Boom Problem: J. Acoust. SOC. Am., vol. 39, par t 2, May 1966, up. Sl-S6.
2. VON GIERKE, HENNINC E.: Effects of Sonic Boom on People: Review and Outlook. J. Acoust. SOC. Am., vol. 39, par t 2, May 1966, pp. S43-S50.
3. FINDLEY, DONALD s.; HUCKEL, VERA; AND HUBBARD, HARVEY H.: Vibra- tion Responses of Test Structure No. 2 During the Edwards Air Force Base Phase of the National Sonic Boom Program. LWP No. 259, August 1966.
bration Responses of Test Structure No. 1 During the Edwards Air Force Base Phase of the National Sonic Boom Program. LWP No. 288, September 1966.
5. NIXON, CHARLES w . ; AND HUBBARD, HARVEY H.: Results of USAF-NASA- FAA Flight Program to Study Community Responses to Sonic Booms in the Greater St. Louis Area. NASA TN D-2705, May 1965.
4. FINDLEY, DONALD s.; HUCKEL, VERA; AND HENDERSON, HERBERT R.: vi-

CONTRIBUTED REMARKS
77
Sonic Boom Reduction
ADOLF BUSEMANN
University o f Colorado
INTRODUCTION
Since people are not satisfied with the sonic boom reduction which the reasonable altitude fo r supersonic flights provides naturally, further means for reductions must either be found or proved to be impossible. However, t o call something impossible is dangerous. Our time is full of innovations in physics and tech- nology, and although we have certain laws of conservation which we accept as being invariably valid, many scientists who declared that desirable effects were impossible have been proved wrong. A study to find either holes in our present ideas about the sonic boom o r to prove these ideas as being perfect cannot be taken lightly. We should start with some hope of improving the situa- tion. Perhaps this can be achieved by placing our hands in the field on the crucial points and then trying to remove these artificial aids gradually until the airplane can accomplish the rest. In such an approach we find at the end whether we gained a new insight or simply supported the validity of the known methods.
Since my talk in New York in 1955 during the Brooklyn Techni- cal Symposium, I have wondered about the completeness of the set of our two basic singularities employed: the single poles (sinks and sources) along the body axis for volume and the dipoles (source and sink in pairs perpendicular to the body axis) for lift. The single poles create an axially symmetric field. The dipoles by their nature have exactly the inverse effect toward the sky as they have toward the ground, when we arrange them vertically. The lift produced in this fashion consists of one-half a pressure directed toward the ground and the other half a suction toward the sky. Doubling the reaction on the ground by reflection seems to be nature’s way of disposing the lifting force received by the air-
79
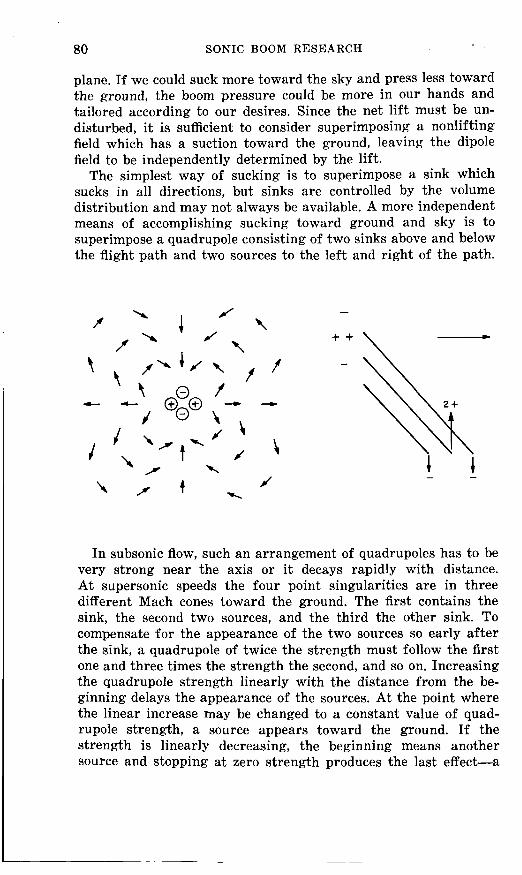
80 SONIC BOOM RESEARCH
plane. If we could suck more toward the sky and press less toward the ground, the boom pressure could be more in our hands and tailored according to our desires. Since the net lift must be un- disturbed, it is sufficient to consider superimposing a nonlifting field which has a suction toward the ground, leaving the dipole field to be independently determined by the lift.
The simplest way of sucking is to superimpose a sink which sucks in all directions, but sinks are controlled by the volume distribution and may not always be available. A more independent means of accomplishing sucking toward ground and sky is to superimpose a quadrupole consisting of two sinks above and below the flight path and two sources to the left and right of the path.
J \ - - + J
f \ f
f t
- + + \
In subsonic flow, such an arrangement of quadrupoles has to be very strong near the axis or it decays rapidly with distance. At supersonic speeds the four point singularities are in three different Mach cones toward the ground. The first contains the sink, the second two sources, and the third the other sink. To compensate for the appearance of the two sources so early after the sink, a quadrupole of twice the strength must follow the first one and three times the strength the second, and so on. Increasing the quadrupole strength linearly with the distance from the be- ginning delays the appearance of the sources. At the point where the linear increase may be changed to a constant value of quad- rupole strength, a source appears toward the ground. If the strength is linearly decreasing, the beginning means another source and stopping at zero strength produces the last effect-a

SONIC BOOM REDUCTION 81
further sink toward the ground. Thus, the application of quad- rupoles requires a strength distribution along the center of the airplane, the second derivative of which is the sink effect toward the ground. It is, however, permissible to release a constant quad- rupole strength a t the tail of the plane represented by four vor- tices similar to the two vortices required for a lifting array of dipoles. The completeness of such a multipole arrangement is therefore a very important and possibly very restricting property. Quadrupoles have to be at least one positive plus an equal amount of negative sink strength toward the ground very similar to the sources and sinks of a closed body.
REPRESENTATION OF QUADRUPOLES
Since the application of quadrupoles appears to be helpful as a step to give the total field of supersonic disturbances on lifting bodies a more flexible shape, similar to the beaming of radio and sound waves in communication, the question of their realization becomes dominant. Changes of the body cross-section from cylin- drical to flat ellipses, or from high ellipses through circular to flat ones comes to mind first, but this is not very effective for the fa r field. In order to have controllable conditions in linearized disturbances from the near to the far field, conical shapes were investigated. The quadrupole effect is represented there by a pair of delta wings with common tip pushing the air, one to the right and the other one to the left, horizontally. The free space opening between them is supposed to suck in air vertically. A pair of triangles arrangement has the bad feature that the flow trying to go around their edges will cause separation and will reduce the sucking motion. Rounded edges must be used as long as the deltas have to stay inside the Mach cone. As a substitute with simpler shapes, a pair of circular cones touching on their tips and yawing, one cone toward the right, the other toward the left, were used in calculations and experiments, although their increasing cross sections add an arrangement of sources to the quadrupole effect. The criterion was to find a zero pressure a t the Mach cone in the vertical direction and a high pressure created by the yawing pair of cones on the horizontal plane. The theoretical result furnished such a distribution, but the experi- mental check did not sufficiently support this result.

82
RING WINGS
The relationship between a strong near field and a weaker field farther out always appears as a stumbling block when looking for effects in the far field by shaping bodies near the axis. The ring wing is a device to reverse the situation. Being already fur- ther out, the small angle of attack of such a wing can be set locally according to any periodic distribution around the circle. A quad- rupole is the second term of a Fourier series around the circle. Besides the outgoing waves already near the outgoing Mach cone,
toward the center. The ring can be corrected in position to make all the incoming waves focus on the same line element on the axis.
compensating disturbances create a not very simple combination to determine the reflections of the whole disturbance after “cross- ing the center line.” This second outgoing effect has to be checked for its surviving intensities to obtain a realistic estimate of the achieved quadrupole beaming with respect to sonic boom noises.
I do not know the outcome, but I wanted to show that there is still hope or at least some further variation possible in the produc- tion of the boom noises. These variations must be understood before a sound judgment concerning the possibilities of reductions can be given.
I the ring wing has to send the other half of the disturbance waves
Here the higher order effects and the addition of algebraically I
SONIC BOOM RESEARCH
H OR1 ZO NTAL PLAN E

The Possibilities for Reducing Sonic Boom by Lateral Redistribution*
A. R. GEORGE
Cornell University
INTRODUCTION
The possibility of reducing the sonic boom overpressure on the ground is analyzed from the point of view of laterally redistributing an aircraft disturbance pressure field. It is shown that “multipole” contributions can be important even in the fa r field and i t is indicated how these multipoles can be excited efficiently and used to reduce the boom due to volume. Unfor- tunately, the boom due to lift cannot be reduced in this manner.
Lateral redistribution of disturbances can be used to reduce the boom on the ground because, as discussed earlier in the conference, disturbances in other than vertical planes travel a longer distance and are thus attenuated more before reaching the ground. In addition, some portions of the disturbances are totally reflected by the sound speed gradient in the atmosphere and only affect the ground indirectly. As the sonic boom theory merely corrects the ordinary linearized theory independently in each 0 plane, the 0 dependence of the boom can be analyzed with linearized theory. If a specific configuration is given, a useful approach is to use Lomax’s development of Hayes’ theorem in which the linear- ized perturbation potential near the Mach cone is related to projected “areas” and “forces” in oblique Mach planes (refs. 1 and 2) . However, for a discussion of the possibilities of arbi- trary 0 variations and the associated boom, lift, and drag, the
*This written version of the comments given at the Sonic Boom Research Conference has been updated to include additional results from the analysis of the “closure” conditions which were only mentioned at the conference. These closure conditions were worked out following discussions after the conference.
83
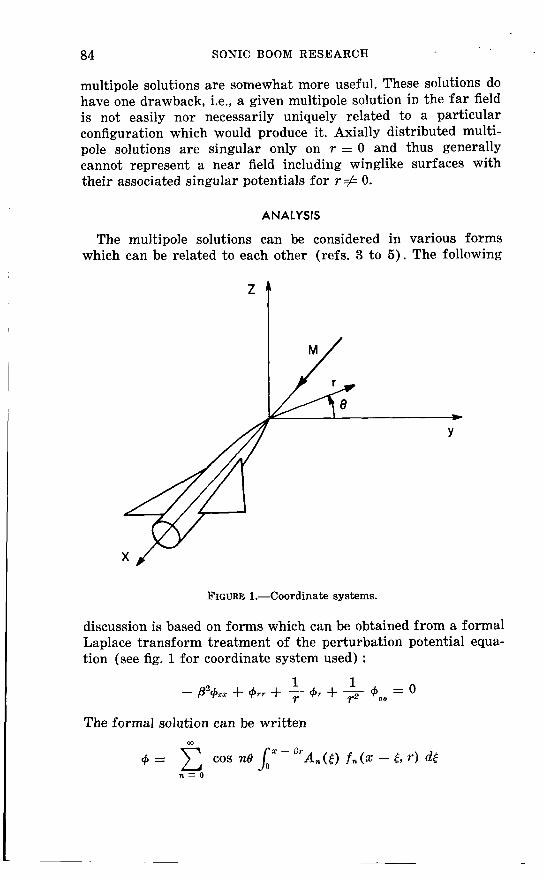
84 SONIC BOOM RESEARCH
multipole solutions are somewhat more useful. These solutions do have one drawback, i.e., a given multipole solution in the far field is not easily nor necessarily uniquely related to a particular configuration which would produce it. Axially distributed multi- pole solutions are singular only on r = 0 and thus generally cannot represent a near field including winglike surfaces with their associated singular potentials for r f 0.
ANALYSIS
The multipole solutions can be considered in various forms which can be related to each other (refs. 3 to 5 ) . The following
FIGURE 1.-Coordinate systems.
discussion is based on forms which can be obtained from a formal Laplace transform treatment of the perturbation potential equa- tion (see fig. l for coordinate system used) :
The formal solution can be written
n = O
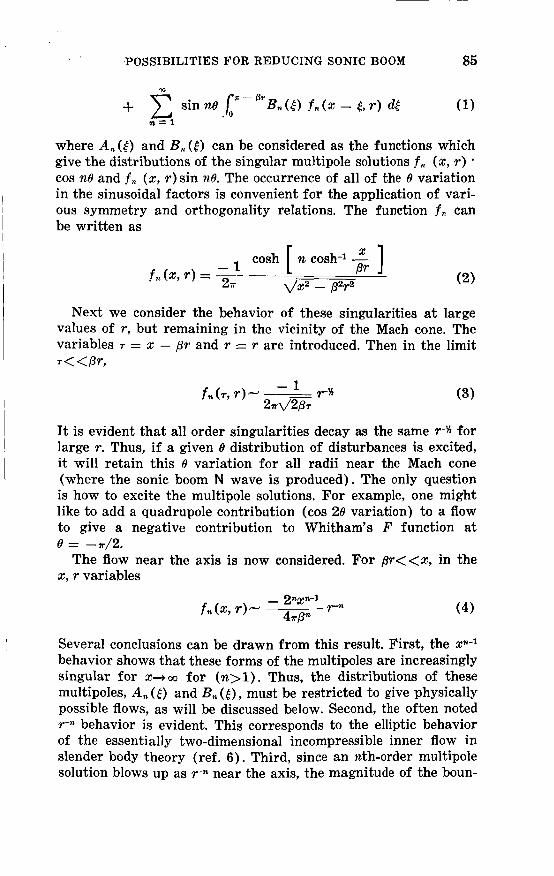
.POSSIBILITIES FOR REDUCING SONIC BOOM 85
in the sinusoidal factors is convenient for the application of vari- ous symmetry and orthogonality relations. The function f n can
I be written as
cosh [ n cosh-1 - fa (x, r ) = __- - 1 Pr " I
2a d x 2 - p2r2
Next we consider the behavior of these singularities at large values of r, but remaining in the vicinity of the Mach cone. The variables T = x - pr and r = r are introduced. Then in the limit T< <pr,
It is evident that all order singularities decay as the same r-# for large r. Thus, if a given 0 distribution of disturbances is excited, it will retain this e variation for all radii near the Mach cone (where the sonic boom N wave is produced). The only question is how to excite the multipole solutions. For example, one might like to add a quadrupole contribution (cos 28 variation) to a flow to give a negative contribution to Whitham's F function at
The flow near the axis is now considered. For p r < < x , in the e = -n/2.
x, r variables
Several conclusions can be drawn from this result. First, the xn-l behavior shows that these forms of the multipoles are increasingly singular for X+CO for (n>l) . Thus, the distributions of these multipoles, A , ( 6 ) and B, ( 6 ) , must be restricted to give physically possible flows, as will be discussed below. Second, the often noted r-, behavior is evident. This corresponds to the elliptic behavior of the essentially two-dimensional incompressible inner flow in slender body theory (ref. 6 ) . Third, since an nth-order multipole solution blows up as r-n near the axis, the magnitude of the boun-

86 SONIC BOOM RESEARCH
dary condition which would be necessary to excite this multipole must be extremely large if applied near the axis. As pointed out by Ward, Whitham, and Lighthill (refs. 7 to 9), the application of a finite boundary condition at a slender body's surface r = R im- plies that the coefficients A , and B , will be of order Rw. Then, since R < < 1 for a slender body, the higher order multipoles will make a negligible contribution to the potential. On the basis of this argument, the higher order multipoles have been neglected per se in sonic boom calculations, except that the full contribution of the wing to the 8 variation has been generally retained. How- ever, it can be seen that if the boundary conditions are applied at other than small values of R, the higher order multipoles can indeed easily be excited. For example, a flat non-slender surface, such as a wing at a small angle of attack, efficiently excites a significant dipole contribution (and therefore lift), although a slender body a t angle of attack does not. Thus, for example, i t might be possible to use multiple wing-like surfaces to excite a quadrupole distribution which could be added to the basic flow to
SOURCE
t DIPOLE QUADRUPOLE
FIGURE 2.-Configurations giving significant multipole contributions.
cancel partially the boom in the direction below the aircraft, This concept is sketched in a simplified manner in figure 2. The idea of exciting a quadrupole contribution was suggested by Busemann some time ago, and a wind tunnel test of a tetrahedron-shaped

POSSIBILITIES FOR REDUCING SONIC BOOM 87
model has been reported (ref. 10). A configuration of two slender cones joined at their apexes has also been tested. These experi- ments did not show significant 8 variation for large values of r. However, in the light of the preceding discussion it is evident that these models would not be expected to excite significant quad- rupole moment. An X-shaped configuration of opposing lifting surfaces is suggested as one possibility for a more efficient ap- proach.
The physical restrictions on the multipole distributions are now derived. It is required that + have a finite limit for X+OO corre- sponding to constant energy in the wake. Then equations (1) and (4) immediately give the physical restrictions in moment form
where A , ( t ) is zero outside of the interval O<t<L, and a similar relation holds for B, ( 6 ) . By integrating by parts, this can be put in terms of a series of "closure conditions" on A , and successive integrals of A, where (n>l) :
For a source (n=O) , the limit x+ao does not restrict A,,. How- ever, a source distribution which represents a closed body will satisfy
(7) p o (6) dt = 0
S,LBl( t )d t = C l < W (8)
For lift ( r a = l ) it is required that
A nonzero net lift gives a nonzero C,. For a quadrupole, the re- quirements become :
and
88 SONIC BOOM RESEARCH
Equations (7) and (9) show that for a given 0 quadrupoles can be used to cancel out the effect of a source distribution correspond- ing to a closed body. However, a finite net lift'giving C, # 0 in equation (8) cannot be compensated due to the restriction of equation (9). The conclusion that the disturbance due to a net lift cannot be escaped except in a direction normal to the lift can also be obtained from the form of the lift contribution to the potential in the Hayes and Lomax results (refs. 1 and 2).
For n>2, the requirements on the multipole distributions be- come progressively more restrictive. For 7223, for example, the additional condition
demonstrates that A,, cannot be used to compensate for a physical volume (everywhere positive) which will have
It might be mentioned at this point that an additional dipole distribution B1* ( 6 ) with
J L B1* (8 d t = 0
(which will leave the net lift unchanged) can also be used to com- pensate for a closed volume a t a given 0. However, the pitching moments associated with this BI* would probably make this ap- proach impractical.
LIFT AND WAVE DRAG
The forces in inviscid supersonic flow can be calculated either directly from the pressures on the configuration or by applying the momentum theorem to the fa r field. Since the present multi- pole analysis is applicable only for large r, the momentum-balance point of view must be taken.
The lift is most conveniently found from an integration in the Trefftz plane far behind the body. It can be expressed as
L = pmUP j- & d.S S
where S is a (y, x ) -plane interior to the leading Mach cone from the body. However, the multipole treatment is not sufficient to give $I accurately near r = 0 (the inviscid wake). The variation of

POSSIBILITIES FOR REDUCING SONIC BOOM 89
4 near the x-axis depends on the details of the lateral arrangement of the forces and volume of the configuration. In order to treat the wake region accurately for a given configuration, a lateral dis- tribution of sources and of elemental lifting elements such as those introduced by Hayes (ref. 1) would be more useful than the present multipoles. However, considering the multipoles, one can see that by symmetry only the sin 6 and cos 6 (dipole) terms can possibly contribute to the lift and side force. Thus, if higher order multipoles are used to tailor the 6 distribution of the field, they will leave the lateral forces unchanged.
In considering the inviscid drag it will be useful to consider it to be broken up into wave and vortex drag. The wave drag is associated with the portion of the disturbances near the Mach cone and the vortex drag is associated with the disturbances near the axis. The momentum theorem is applied t o a cylindrical sur- face of large radius to determine the wave drag
As shown by Hayes (ref. 1) , the contribution from the rearward part of this cylinder is negligible, allowing the approximation
x - pr = T << pr
Then, with the use of equation (3) , equation (1) can be written as
where m co
~ ( h 6 ) = A,(,$) cosn6 + Bn(O sinno (13)
For each value of 6, g ([, 6 ) can be considered as the rate of change with 6 of the area distribution of the equivalent slender body. It can be related to obliquely cut and projected “areas” and “forces” using Lomax’s results (ref. 2). In the present approximation, T<<pr, the derivatives of 4 are substituted into equation (ll), giving
n = o n z l
where F, the Whitman function, is given by
90 SONIC BOOM RESEARCH
As discussed above, the upper limit T, ,~ on the r integration in equation (14) is unimportant as long as it falls in the range L << rm << pr, where L is the length of the configuration. Equation (14) was obtained in a different manner by Whitham who considered the energy dissipated by the shock system (ref. 11). This result may also be put into the form
where
and similarly for D,(B). Since the values of D, are positive, i t is seen that any higher order multipole contributions added to a basic source and a dipole distribution will increase the wave drag. If, however, a given configuration already has multipole contributions in its potential, the drag can be reduced by intro- ducing cancellation multipoles as discussed by Lomax and Heaslet (ref. 5 ) .
The vortex drag cannot be treated because the inviscid wake is given inaccurately by axially distributed multipoles. These con- centrate all the singularities on the x-axis giving an infinite vortex drag.
Although these ideas are in a preliminary stage and the op- timum use of these multipoles has not yet been determined, it is possible to give an indication of the order of magnitude of the additional wave drag which would be associated with a decrease in boom due to volume below an aircraft. A non-lifting axisym- metric body is described by a source distribution A,, ( 6 ) . The far field boom is proportional to the square root of the maximum of the integral of the F function given by
The subscript 0 denotes the basic source distribution alone. The

.POSSIBILITIES FOR REDUCING SONIC BOOM 91
quantity Fo is independent of 6. With the addition of a quadrupole distribution A2 ( t ) ,
If A, is chosen so that
then below the aircraft A, = <A0
Thus, the boom overpressure below the aircraft is
A p = Aopd1 - E
D, = D, (1 + 2/2)
(17)
(18)
However, it can be seen from equation (15) that
0
and consequently % %
ap AOP = ( 1 4 2 ( * - 1 ) ] ) (19)
for Dw/Dw0 _< 3/2. This is plotted in figure 3. It can be seen, for example, that a 17-percent reduction in the boom due to volume can be obtained at the expense of a 5-percent increase in the wave drag due to that volume, while complete elimination of the boom due to volume would require a 50-percent increase in wave drag.
In order to obtain an indication of what can be done with a configuration including lift, the very crude assumption is made that the lift contributes a constant amount, equal to that of the basic volume, to the drag and to the maximum of the integral of F. It can then be shown that
for D,/Dw 2 5/4. Thus, in this crude nonoptimized case, the drag increment for a given ~p reduction is a factor of 2 greater than that for the volume example treated above.
The dependence of the overpressure change on the drag change shows that a t least a small amount of quadrupole contribution

92 SONIC BOOM RESEARCH
could be added to any basic design. The usable boom reduction will depend on how much additional drag can be tolerated. Ideally, one would excite the quadrupole contribution by deflecting some movable portion of the aircraft only during portions of the flight when boom reductions were necessary. Thus, one could minimize the overall drag penalty on the mission.
100 I IO I20 130 140 I50 PERCENTAGE OF BASIC DRAG
FIGURE 3.-Example of a boom-drag relation for volume.
Much further work remains to be carried out on optimization of added quadrupole distributions, on what actual configurations will produce these distributions, and on their vortex and skin friction drag.
REFERENCES
1. HAYES, W. D.: Linearized Supersonic Flow. North American Aviation Report No. AL-222, 1947.
2. LOMAX, H.: The Wave Drag of Arbitrary Configurations in Linearized Flow as Determined by Areas and Forces in Oblique Planes. NACA RM A55A18, 1955.
3. LAMB, H.: Hydrodynamics. Dover Publishing Co., 1945, p. 527. 4 HAYES, W. D.: Linearized Supersonic Flows with Axial Symmetry.
Quart. Appl. Math., vol. 4, 1946, pp. 255-261. 5. LOMAX, H.; AND HEASLET, M. A.: A Special Method for Finding Body
Distortions tha t Reduce the Wave Drag of Wing and Body Combina- tions a t Supersonic Speeds. NACA Rept. 1282, 1956.
6. ASHLEY, H.; AND LANDAHL, M.: Aerodynamics of Wings and Bodies. Ch. 6, Addison-Wesley Press (Reading, Massachusetts), 1965.
7. WARD, G. N.: Supersonic Flow Past Slender Pointed Bodies. Quart. J. Mech. Appl. Math., vol. 2, 1949, pp. 75-97.
POSSIBILITIES FOR REDUCING SONIC BOOM 93
8. WHITHAM, G. B.: The Flow Pattern of a Supersonic Projectile. Commun. Pure Appl. Math., vol. 6, 1962, pp. 301-348.
9. LIGHTHILL, M. J.: Higher Approximations in Aerodynamic Theory. Princeton University Press, 1960; also in General Theory of High Speed Aerodynamics, sec. E., W. R. Sears (Ed.) ,* lrinceton University Press, 1964.
10. CARLSON, H. W.: Correlation of Sonic Boom Theory with Wind-Tunnel and Flight Measurements. NASA TR R-213, 1964.
11. WHITHAM, G. B.: On the Propagation of Weak Shock Waves. J. Fluid Mech., vol. 1, 1966, pp. 290-318.

Possible Means of Reducing Sonic Booms and Effects Through Shock Decay Phenomena and Some Comments on Aural Response
RICHARD K. KOEGLER Cornell Aeronautical Laboratory, Inc.
Engineers, who are required to obtain correct answers for specific physical problems under constraints on levels of effort and available theory, spend much of their lives solving nonlinear problems with linear methods. They must be careful to employ these methods over the ranges of the variables where they are valid and be alert to circumstances where special corrections are necessary. Examining the sonic boom problem in this light, I was impressed by the existence of energy decay phenomena of significant magnitude when sonic booms propagate long dis- tances, and by the consequences of the comparatively high sen- sitivity of the ear to sound waves in the 900 to 9000 cps range.
With regard to the first point, consider Whitham’s method (refs. 1 to 3 ) . Starting with the velocity potential function for isentropic linear supersonic theory, Whitham introduces the adiabatic Bernoulli’s equation into the expressions for the velocity perturbations caused by slender bodies. After some simplification and introduction of the property that the shocks bisect the Mach directions ahead of and behind them, he shows that the correct magnitudes and location of the characteristics and the shocks
linear theory. This solution results in a jump in entropy at the shocks proportional to ( A p ) 3 . This is a very good approximation for weak shocks.
Some possibility of alleviating the SST boom may be th., * con- sequence of this energy dissipation as computed by Whitham’s modified linear theory. For example, the wave drag of a complete body is correctly predicted by integrating the energy in the
95
I can be found to good accuracy for slender bodies by a modified 1
~ I

96 SONIC BOOM RESEARCH
surrounding flow and shock field, as well as by integrating the pressure distribution around the body. Of more specific interest
to SST boom reduction is that the overpressure ratio,-- ,
of the bow and stern shocks varies as r x at large radial distances, r, and the wave energy per unit frontal area (computed in terms appropriate a t all altitudes and using the corresponding “far- field” variation in N wave length) varies as r-%. Without energy dissipation (by entropy or viscosity), this relation would be r-l. Flight measurements of a number of reasonably well developed N waves at several altitudes below a B-58 in supersonic flight indicate confirmation of the r-5 behavior.
In addition, a theoretical development by Lighthill (ref. 4) from exact equations for reversible sound waves of finite ampli- tude, plus an added linearized viscosity term, yields the Whitham theory as the first-order approximation. Thus, there is no doubt that appreciable energy losses occur for long-distance travel of shock waves, even though isentropic relations hold to a very close approximation along and between nearby streamlines.
In applying the Whitham theory to find SST configurations with reduced sonic booms, one is interested in the ability of this theory to provide a first-order solution for the entire process of the development of the flow field from a generally smooth velocity variation at the body to the fully developed N wave at long distances. Whitham has added to the linear characteristic expression, x = y + pr (where x is the longitudinal coordinate of the characteristic at r , y can be thought of as the coordinate of the characteristic at the body axis, and p = VM2 - l), the term - kF (y) r ‘ h , where k is constant for a given M , and F (y) is the leading term in an approximation for the linear expression for the u velocity perturbation when p r / y is large. With this relation, the patterns of the shocks and characteristics can be determined from the properties of F ( y ) prescribed by the body surface.
For example, in figure 1 the displacement distance by which a characteristic at A lies ahead of the linear theory location is found for each r by constructing a line of slope l / k r x through F ( y ) at A . Also, the x distance by which an initially attached bow shock lies ahead of its linear theory location is found for each r by constructing a chord of slope l / k + such that as much area is added under the chord ahead of the F(Y) curve as is removed between the intercepts of the chord and the F (y) curve. For very large values of r, the displacement distances of the
AP P,

REDUCING SONIC BOOM EFFECTS 97
C H A R AC T E R IS T IC 01 SPLACE ME NT DlST
FIGURE 1.-Shock pattern and characteristics determined from properties of F ( y ) at the body surface.
bow and stern shocks from their linear theory locations are proportional to r%.
A single line that satisfies both of these conditions is used in this figure to illustrate that the characteristic originating a t A, which is also that point at which the line last crossed this front lobe of the F ( y ) curve, just meets the bow shock at the radial distance which corresponds t o the same slope bow shock construction line. Thus, the rate of bow shock reinforcement by intersecting characteristics is also a function of the F ( y ) curve shape.
Extending Whitham’s remarks about the possibility of the existence of intermediate shocks at large r, it can be seen that a more powerful way to dissipate wave energy is via the decay of the intermediate shocks. If, as in figure 2, the lobes of the F ( Y ) curves associated with C and D had been such that the area between the y-axis and the C lobe loop below the axis had been equal to the area above the y-axis for the D lobe loop, the cutoff chord for the intermediate shock associated with C and D would never merge with the cutoff chord for the bow shock. Signif- icantly, a t large values of r the net area under the portion of the F ( y ) curve, to which the intermediate (C-23) shock strength is proportional, would approach zero. In contrast, Whitham shows that the bow shock strength ultimately is proportional to the net area under the F ( y ) curve from y = 0 to y = yo. Consequently, if area D were initially larger than C, shape changes to equalize C and D without changing B will reduce the ultimate boom bow shock strength. Any reduction made simultaneously in B will further reduce the strength of the bow shock at large values of T.
Similar relations hold for the stern shock. Examination of the

98 SONIC BOOM RESEARCH
way in which the F ( y ) curve of an SST is formed by the volume and lift distributions of the several elements of the aircraft indicates that such modifications of the F ( y ) curve are feasible.
A question is often raised over the feasibility of keeping such loops nearly equal when the effects of variations in Mach number, level-flight lift coefficient, and trim forces for different flight speeds and altitudes are taken into account. However, an exami- nation of the computed F ( y ) curves for typical SST vehicles, flying a t Mach numbers as far apart as 1.5 and 2.7, showed that the differences between them are less severe than antici- pated. Therefore, this approach is believed to be feasible and its ultimate capability for boom reduction is worth exploring.
t CONSTR UCTl ON
LINE SLOPES F ( y )
.~ I
I 1/2 I / -bc b
FIGURE 2.-Dissipation of wave energy through decay of intermediate shocks.
In the “far field,” the decay of the intermediate shocks is re- ported by Whitham to be r-% instead of the ?-% relation which holds for bow and stern waves. The origin of this relation is not clear to the writer, but it appears noteworthy that it is derived in Whitham’s earlier paper in which he explored higher-order terms in his development of expressions for the true locations of the characteristics and the shock field. The physical significance of this result to the sonic boom is uncertain because the area under the F ( y ) curve becomes zero for an asymptotic “far-field” intermediate shock. A better understanding of this high decay rate may provide clues to other design techniques for dissipating shock wave energy.
A study by the writer of further reduction of the bow shock strength indicates that incorporation of a reversal in the rate of change of fuselage area in the nose region, forward of its gen- erally cylindrical portion, reduces the initial positive F (y) lobe, inserts an intermediate shock pair of lobe loops, and reduces the following negative loop, thus displacing some of the bow shock

REDUCING SONIC BOOM EFFECTS 99
energy into a more rapidly decaying intermediate shock. The desired changes in the shock pattern appeared attainable, but a bow wave drag increase resulted in the few trials made in the brief study. Since the resulting configuration also could accom- modate a windshield and nose shape which might not require nose droop for visibility in landing approaches, further efforts to examine this concept are thought desirable.
At low supersonic Mach numbers (as in the transition speed regime), all of the foregoing effects would be less pronounced because the characteristics then merge less rapidly into shocks with increasing r.
In their analysis of projectile test data, DuMond, Cohen, Panof- sky, and Deeds (ref. 5) found overpressure decay rates to
be higher than r-5 when - was greater than 0.01 and that the N wave had developed before a large r approximation would be valid. Examination of the forward portion of the F ( y ) curve from which the bow shock was formed in supersonic cruise on an early SST design revealed that an intermediate shock would meet the initial bow shock at a radial distance r of only about 2000 feet. This results from the rapid merging of characteristics and shocks at SST supersonic cruise Mach numbers. The cor-
AP responding shock strength resulted in a value of - less than Po
0.01, and it first appeared that a higher decay rate was indicated. Later, it became clear that the phenomenon was simply a conse- quence of the fact that the exponent in the exponential expression of the solution of the wave energy decay equation depends on the
overpressure ratio - and the N wave length. Therefore, if the bow (or stern) shock of an SST is substantially
fully developed at a relatively small value of r , shape changes could increase the proportion of the energy lost via the higher
AP decay rates and thus decrease the - a t the ground. Because Po
the ultimate bow shock results from the area under the entire F ( y ) curve lobe (or lobes) to which it is related, while the wave drag is proportional to the area under the corresponding F2(y) curve, this phenomenon could be exploited for some nose shapes with no increase in nose wave drag.
At the lower Mach numbers, where the characteristics meet the shocks at a much larger value of r , the effect would be much less pronounced. But even in this case, if a larger amplitude two- shock N wave has been replaced by smaller bow and stern shocks
AP PO
AP Po

100 SONIC BOOM RESEARCH
and a series of smaller and more rapidly decaying intermediate shocks, the resulting shock pattern should be less disturbing to buildings and humans, even after the cumulative response to closely spaced pulses is taken into account.
Reduced sensations in the human ear will also result from the lower amplitudes at cruise Mach numbers attained by the methods discussed. In addition, at transonic speeds the supplemental use of the near-field effect to flatten slightly the worst peaks (over some small range of transonic speeds) appears potentially useful. A study of N wave harmonic content and peak shape shows that an extremely small amount of peak rounding or initial pressure gradi- ent decrease would eliminate all of the harmonics of the N wave above about 600 cps. To go further and reduce the slopes to less than 100 psf/sec, which Warren indicates would make booms in- audible, would be desirable, but its achievement would necessitate drastic changes in the F ( y ) curve shapes and extremely long and
The threshold-of-hearing sound pressure level in the neigh- borhood of 3000 cps is 60 dB or more below those at 20 cps and 20000 cps (the approximate limits of the human ear). Also, examination of the harmonic contents of SST N waves show that they generally have fundamental frequencies of about 3 cps, cut- off frequencies near 40 000 cps, relatively small amplitude har- monics in the 900 to 9000 cps frequency range over which the ear is most sensitive, and even smaller harmonics at frequencies above 9000 cps. This indicates that treatment of the N wave to reduce its harmonic content in the 900 to 9000 cps range could be quite effective, even if the amplitudes near the fundamental and the cutoff frequency associated with the shock shape were untouched. An examination of the effects on the harmonic content of an N wave indicates that a flattening of the peaks over about one-fifth of their lengths would operate most heavily on this in- termediate range of frequencies. It appears that such a change in the N wave shape could be achieved by having a slope change (or bump) on the rear of the F ( y ) curve loop near the points where the cutting chords which correspond to low supersonic Mach num- bers intersect the F ( y) curve.
Initially, the writer was uncertain whether or not a PNdB-type of harmonic analysis of the aural response to a sonic boom wave would be meaningful. A study of the work of von Bekesy (ref. 6) on the mechanism of the ear, Zwicker’s reasoning behind the PNdB analysis of random noise (ref. 7), Carter’s efforts to correlate sensitivity of the ear to short pulses
I gently tapered fuselage noses.

REDUCING SONIC BOOM EFFECTS 101
by means of harmonic analysis (ref. 8 ) , and the studies of Zwislocki (ref. 9) on the effects of short bursts of tone and short time intervals between pulses, led to the conviction that such an analysis could be evolved successfully if allowqnce were made fo r tone burst durations and for repeated pulses with short time intervals between them. In addition, realization that the lowest frequencies that the ear can hear are above the fifth harmonic of the 3-cps fundamental of an SST sonic boom and that at 20000 cps the 6000th harmonic is involved, so that the tone bursts of interest would contain 5 to 6000 or more cycles, increased the feeling of confidence that such an analysis could be successful. A very crude analysis, using data from Kryter and Pearsons’ “an- noyance” adaptation of Zwicker’s PNdB analysis (ref. l o ) , in- dicated that complete removal of the harmonic content in the most sensitive 900 to 9000 cycle range of frequencies would reduce the PNdB of a sonic boom by about 10 to 12 dB. Unfortunately, no laboratory tests of aural reactions t o the boom known to the writer include harmonics above about 500 cps, so it was not posai- ble to check this conclusion. Very careful examination of records of flight booms and subjective reactions would appear to be ex- tremely useful in this regard.
Finally, a study of the F ( y ) curves of representative SST de- signs and the contributions to the F ( y ) curves of the various aircraft components indicates that the F (y) curves involve several axis crossings, which results in several positive and nega- tive lobes of the F (y) curves, and therefore several intermediate shocks in the vicinity of the aircraft. Consequently, modification of the F ( y ) curve to equalize the positive and negative lobe areas so that the extent of the intermediate shocks would be increased to exploit the higher rate at which they dissipate wave kinetic
energy could result in a net decrease of F* (y) dy, and hence, wave drag. A brief but basic examination of required changes in airframe volume and lift distributions resulted in a tentative conclusion that such modifications would be practicable.
In this regard, it is important to observe that lift, as Whitham, Walkden (ref. ll), and L. B. Jones (ref. 12) indicate, is an integral heavily weighted by the forward end of the lift distribu-
tion curve. Thus, F(y)dy for lift alone could conceivably be
made zero or even negative in the region 0 - L (with Jo, F (Y) dy = 0) and still provide the needed lift. This greatly eases the con- straints on the possibilities for desirable cancellation, although
m
L

102 SONIC BOOM RESEARCH
aircraft arrangements for aerodynamic balance about the center of gravity would still strongly constrain the allowable changes.
In summary, there is a significant decay mechanism in shock wave propagation as i t applies to sonic booms. SST configurations currently have such complicated F ( y ) curves that changes to enhance this decay appear feasible and might even reduce wave drag. A more useful nose shape appears to be possible and helpful. By careful attention to aural and building responses and the use of irregularly spaced intermediate shocks a t all speeds, and near-field effects at low supersonic speeds, these responses probably can be reduced. The F ( y ) curves at Mach numbers between about 1.5 and 2.7 do not vary so extremely as to preclude use of these concepts. If the boom can be lowered enough to allow lower flight operating altitudes, weight reductions and fur- ther performance gains may be possible.
REFERENCES
1. WHITHAM, G. B.: The Flow Pattern of a Supersonic Projectile. Com- munications on Pure and Applied Mathematics, vol. 5, 1952, pp. 301- 348.
2. WHITHAM, G. B.: The Behavior of Supersonic Flow Past a Body of Revolution F a r From the Axis. Proc. Royal SOC. A, vol. 201, 1950, pp.
3. WHITHAM, G. B.: On the Propagation of Weak Shock Waves. J. Fluid Mech., vol. 1, 1956, pp. 290-318.
4. LIGHTHILL, M. J.: Viscosity Effects in Sound Waves in Finite Ampli- tude. Surveys in Mechanics, Cambridge University Press, 1956.
5. DUMOND, JESSE W. M.; COHEN, E. RICHARD; PANOFSKY, W. K. H.; AND DEEDS, EDWARD: A determination of the Wave Forms and Laws of Propagation and Dissipation of Ballistic Shock Waves. Journal of
6. VON BEKESY, GEORGE: Experiments in Hearing. McGraw-Hill Book Co., Inc., 1960.
7. ZWICKER, E.: Subdivision of the Audible Frequency Range into Critical Bands (Frequenzgruppen), L. E., Journal of the Acoustical Society of America, vol. 33, 1961, p. 248.
8. CARTER, N. L.: Loudness of Triangular Transients. Journal of Auditory Research, vol. 3, 1963, pp. 255-289.
9. ZWISLOCKI, J.: Theory of Temporal Auditory Summation. Journal of the Acoustical Society of America, vol. 32, 1960, pp. 1046-1060.
10. KRYTER, KARL D.; AND PEARSONS, KARL S.: Some Effects of Spectral Content and Duration of Perceived Noise Level. Journal of the Acoustical Society of America, vol. 35, 1963, pp. 866-883.
11. WALKDEN, F.: The Shock Pattern of a Wing-Body Combination Far From the Flight Path. Aeronautical Quarterly, vol. 9, 1958, pp. 164- 194.
12. JONES, L. B.: Lower Bounds for Sonic Bands. Journal of the Royal Aeronautical Society, vol. 65, 1961, pp. 433-436.
89-109.
the AcousticaJ Society of America, vol. 18, 1946 pp. 97-118.
WALTON L. HOWES
Lewis Research Center, NASA
Human response to sonic booms is a serious problem which ap- pears unlikely to fade away with repeated exposure (refs. 1 and 2) . Moreover, the problem of human response appears to be more serious than that of structural response. These considerations have led to a search for supersonic body shapes which might produce booms yielding minimum human response.
G . B. Whitham’s theory (ref. 3) has been utilized in inverting the usual process : specifically, rather than selecting the body and computing the boom, the boom is selected and the body is computed from it. This is possible because Whitham’s equation, namely
which relates the effective body cross-sectional area S ( x ) to the “boom function” F (y) , possesses the form of Abel’s integral equation. This equation can be inverted, yielding
Thus, if F ( y ) is chosen, S ( x ) can be computed, or vice versa. Of course, F ( y ) must be deformed to yield the observed pressure signature. This produces some complication in that one cannot work backward from the observed signature to the body, but rather one must start with F ( y ) to compute the body shape as well as the observed pressure signature.
For humans the primary initial response to sonic booms is auditory. One way of eliminating the auditory response would be to produce an infrasonic sine wave signature of infinite dura-
103

104 SONIC BOOM RESEARCH
tion. The spectrum of such a wave is a Dirac delta function, the frequency of which could be kept below the lower cutoff frequency of the human ear. (The frequency domain viewpoint presented here is alternative to the time domain viewpoint since the two are related by a Fourier transform.) An infinite duration sine wave is not a possible signature because the boom is momentary. Alter- natively, an acceptable signature should resemble one cycle of a sine wave of the lowest possible frequency. This corresponds to the longest possible smooth, slender body. The spectrum of this signature (fig. 1) is not a Dirac delta function, but rather, resem- bles the spectrum of a N wave and falls off much faster than the N wave spectrum at frequencies greater than the spectrum peak frequency. Thus, the spectrum is audible, but most of the energy may be restricted to the infrasonic frequency range. Unfortunately the single-cycle sine wave is not a possible signature because the real signature is bounded by shock waves (fig. 2) . Thus, the shock-bounded sine-like signature is the best that can be achieved.
1 10 Frequency, cps
100
FIGURE 1.-Power spectrum of one-cycle sinusoid.
FIGURE 2.-One-cycle sinusoid with bounding shocks.
An alternative (ref. 4), here rejected, is to reduce the peak overpressure by introducing shocks subsidiary to the bounding shocks. I t is proposed that repeated shock waves are auditorially undesirable for the following reasons. First, if the shocks are

SUPERSONIC VEHICLE SHADES 105
separated in time greater than the integration time of the human ear, they will sound like repeated, o r multiple, booms. On the other hand, if the shocks are separated in time less than the integration time, the response will build up so that the boom will tend to sound as loud as the corresponding continuous sound. (Note that human response to a single shock is considerably less than might be expected on the basis of its overpressure and re- sponse to continuous sounds (ref. 5 ) . )
The problem, then, is to select a boom function F ( y ) which will lead to a single-cycle, sine-like signature. According to Whitham’s theory the selected function F (y) should satisfy the conditions
F’(O)= 00 F ( a ) = O
and,
The first condition assures a noncusped pointed body and may be relaxed. The other two conditions assure a body of finite radius. These conditions greatly limit the acceptable functions F (y) .
FIGURE 3.-“Acceptable” boom function F ( y) . The function F (y) has been represented by the product of a
polynominal and an exponential (fig. 3) . Analytical solutions for S (x) have been obtained in the form of degenerate hypergeometric functions. The shapes represented by S (x) resemble those for low wave drag bodies (fig. 4). Preliminary results for the selected F (y) and a nominal sea level overpressure of 1 pound per square foot for a body at 70 000 feet altitude indicate that a near-field signature is not obtained beyond 20 000 feet from the craft even
These were not available at the time of the original talk.
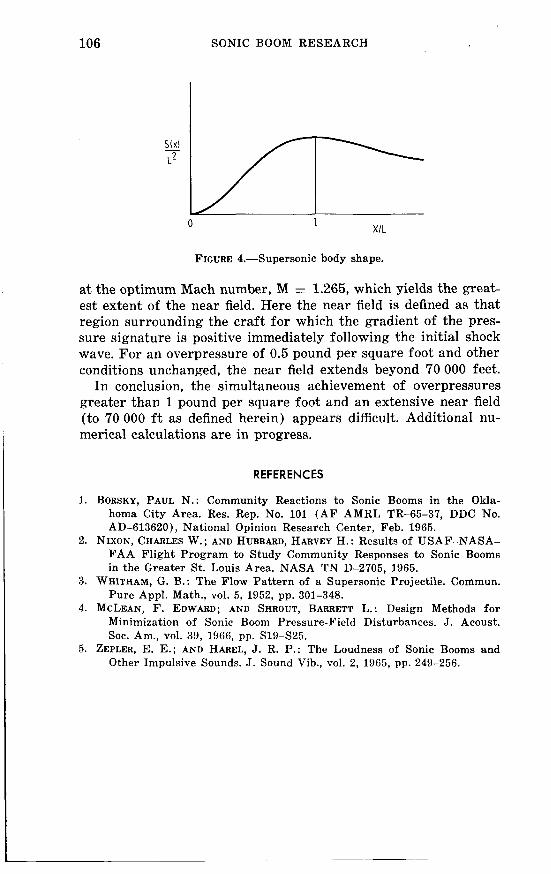
106 SONIC BOOM RESEARCH
0 X I1 1
FIGURE 4.-Supersonic body shape.
a t the optimum Mach number, M = 1.265, which yields the great- est extent of the near field. Here the near field is defined as that region surrounding the craft for which the gradient of the pres- sure signature is positive immediately following the initial shock wave. For an overpressure of 0.5 pound per square foot and other conditions unchanged, the near field extends beyond 70 000 feet.
In conclusion, the simultaneous achievement of overpressures greater than 1 pound per square foot and an extensive near field (to 70 000 f t as defined herein) appears difficult. Additional nu- merical calculations are in progress.
REFERENCES
1. BORSKY, PAUL N.: Community Reactions to Sonic Booms in the Okla- homa City Area. Res. Rep. No. 101 ( A F AMRL TR-65-37, DDC No. AD-613620), National Opinion Research Center, Feb. 1965.
2. NIXON, CHARLES W. ; AND HUBBARD, HARVEY H. : Results of USAF-NASA- FAA Flight Program to Study Community Responses to Sonic Booms in the Greater St. Louis Area. NASA TN D-2705, 1965.
3. WHITHAM, G. B.: The Flow Pattern of a Supersonic Projectile. Commun. Pure Appl. Math., vol. 5, 1952, pp. 301-348.
4. MCLEAN, F. EDWARD; AND SHROUT, BARRETT L.: Design Methods for Minimization of Sonic Boom Pressure-Field Disturbances. J. Acoust. SOC. Am., vol. 39, 1966, pp. S19-S25.
5. ZEPLER, E. E.; AND HAREL, J. R. P.: The Loudness of Sonic Booms and Other Impulsive Sounds. J. Sound Vib., vol. 2, 1965, pp. 249-256.
Brief Remarks on Sonic Boom Reduction
ANTONIO FERRI
New York University
The production of sonic boom is dependent on two character- istics of the airplane, that is, volume and lift. In principle, the effect of volume can be reduced to zero by the Busemann biplane criteria generalized to three-dimensional flow. In this field the engine can be utilized to reduce sonic boom. The effect of the engine depends on the engine cycle and Mach number. Some cycles can be effective in reducing sonic boom due to volume, especially at high Mach numbers.
The effect of lift can be reduced by distributing lift in a large area. This possibility depends on the length of the airplane. An additional parameter must be considered, i.e., the height of the airplane. Multiplane configurations where the negative leg of the N wave is used to reduce the positive leg of the N wave produced by following the wing can in principle reduce the sonic boom of large airplanes to values below 1 pound per square foot.
107
PRECEDING PAGE BLANK NOT FILMED.
A Boomless Wing Configuration*
E. L. RESLER, JR.
Cornel 1 Univ emit y
INTRODUCTION
Because of the objectionable ground booms of proposed super- sonic aircraft, it seems appropriate to examine whether or not the boom signature is inevitable. A proposed scheme is examined in this paper. While this scheme does not solve the boom problem, it is hoped that readers will find the approach and discussion in- structive.
DEVELOPMENT
Consider for simplicity a flat plate in a uniform supersonic flow at an angle of attack (Y. For purposes of discussion at the moment, consider the two-dimensional case only so that there are waves which do not decay moving upward and down toward the ground (fig. 1).
If the control volume indicated by the dotted rectangle in figure 1 is used for a momentum balance, note that the lift of the plate is balanced by a downward momentum in the regions between the two waves labeled A and B. In the linear theory, half of the lift is balanced by each wave pattern. The wave pattern labeled A is responsible for the boom. Ideally, if a wing could be designed that generated the wave pattern B, but not A, the boom difficulties would be greatly relieved. In this case the wing derives its lift by pulling air above it down. To be a useful wing it must also have a reasonable lift-to-drag ratio; however, that is not our concern here.
*This work was partially supported by the U.S. Air Force Office of Scien- tific Research under contract AF 49 (638) -1346.
109

110 SONIC BOOM RESEARCH
FIGURE 1.-Flat plate at angle of attack in a supersonic stream and wave patterns A and B.
Consider now the rather simple circumstance that wave A is reflected upwards by a plate at zero angle of attack to the free stream giving the wave pattern in figure 2.
Referring to the dashed lines in figure 2, note than tan p = D / L where p is the Mach angle and tan p = 1 /dM2 -1. The wave drag of the configuration is the same as for the flat plate alone, or
c =-III 4 2
d M 2 - 1
Thus, for this configuration C' = 4nZ and L j D = d M 2 - 1. Note that the lift is second-order in angle of attack, although we have used first-order theory to estimate the parameters. It seems that to derive a reasonable lift coefficient this wing would be operated with the top plate a t a high angle of attack, in which case a more appropriate theory would have to be evolved. The more accurate theory is discussed subsequently. Note that except for edge effects the three-dimensional counterpart of the above configuration, a boxlike biplane according to the usual theories for sonic boom, would not give a boom on the ground directly under the configura- tion since the first-order forces along Mach planes intersecting
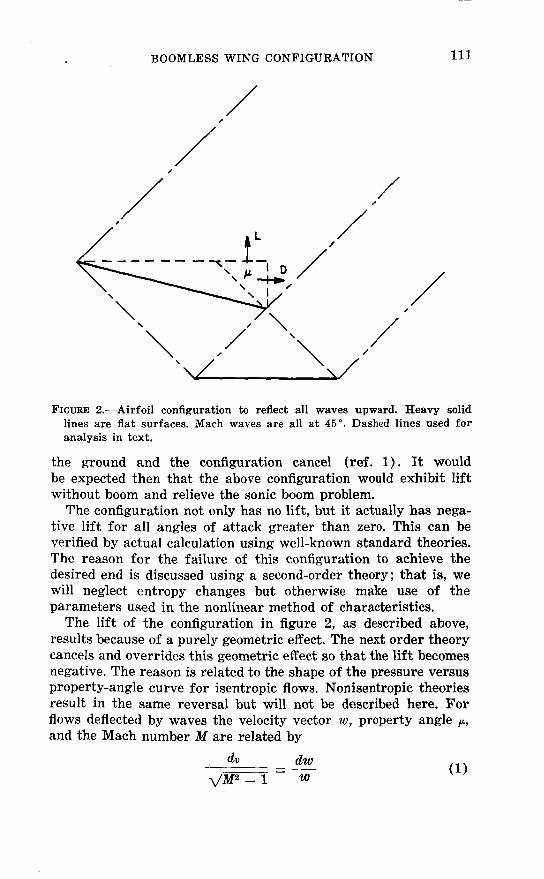
BOOMLESS WING CONFIGURATION 113
/
FIGURE 2.-Airfoil configuration to reflect all waves upward. Heavy solid lines are flat surfaces. Mach waves are all at 45". Dashed lines used for analysis in text.
the ground and the configuration cancel (ref. 1). It would be expected then that the above configuration would exhibit lift without boom and relieve the sonic boom problem.
The configuration not only has no lift, but it actually has nega- tive lift for all angles of attack greater than zero. This can be verified by actual calculation using well-known standard theories. The reason for the failure of this configuration to achieve the desired end is discussed using a second-order theory; that is, we will neglect entropy changes but otherwise make use of the parameters used in the nonlinear method of characteristics.
The lift of the configuration in figure 2, as described above, results because of a purely geometric effect. The next order theory cancels and overrides this geometric effect so that the lift becomes negative. The reason is related to the shape of the pressure versus property-angle curve for isentropic flows. Nonisentropic theories result in the same reversal but will not be described here. For flows deflected by waves the velocity vector w, property angle p, and the Mach number M are related by

112 SONIC BOOM RESEARCH
The energy equation ( y = 1.4) in the form of equation (2) can be used to eliminate w. If a is the sound speed and a, is the stagnation sound speed, then
5a2 + w2 = 5a; (2)
Because M = w/a, the property angle can be found to be related to the changes in Mach number by
To obtain equation (3) we have conserved mass, momentum, and energy. For isentropic flows the stagnation pressure is constant, where the stagnation pressure is related to the static pressure and the Mach number as follows:
The introduction of dp , = 0 and the elimination of d M 2 from equation ( 3 ) in favor of d p results in the following:
.- I . " dv ( 5 )
For a given isentropic flow, p,, as stated above, is constant. AS is evident from equation ( 5 ) , d p / d v is negative and becomes less as M increases. The property angle v is a monatonic function of M and increases with M . Thus, if a generated wave is a compression wave, M and decrease, and in the new flow behind the wave the pressure change for a given flow direction change across the wave is greater than in the flow ahead of the wave. The reverse is true if the wave is an expansion wave. Now consider the configuration in figure 2. The wave that is canceled by the lower plate at zero angle of attack is a compression wave; thus, the pressure rise across the reflected wave, in the flow behind the initial compres- sion, is greater than that across the initial wave. Although the angle change across both waves is the same, the pressure differ- ence across the second wave is greater. This larger pressure dif- ference across the reflected wave is such as to decrease the lift of the configuration and more than cancels the geometric effect con- sidered in the first part of this paper. Note that the proposed configuration always has two compressions as opposed to one ex- pansion. The linear theory uses the same average slope (M evalu- ated in the free stream) for all the waves. However, if the real
BOOMLESS WING CONFIGURATION 113
curve is used, i t becomes apparent that the scheme does not in fact give any lift. The asymmetry of the curve for pressure p versus property angle u combined with the asymmetry of the configura- tion, a compression followed by a compression and a single expan- sion, is such as to cancel the geometric effect.
I CONCLUSIONS
An aerodynamic configuration designed to achieve lift with no boom by affecting only air above the configuration was found to give a second-order lift using a first-order theory. The configura- tion does not result in lift using any higher order theory and the reason is shown to be due to the asymmetry of the curve for pres- sure versus property angle for isentropic flows.
REFERENCE
1. LOMAX, H.: The Wave Drag of Arbitrary Configurations in Linearized Flow as Determined in Areas and Forces in Oblique Plane. NACA RM-A55A18, 1955.

Comments on Focusing Due to the Atmosphere
M. B. FRIEDMAN Columbia University
In a recent report the writers derived a method and actually obtained numerical results for focusing effects with uniform sup- ersonic flight in a linearly varying atmosphere. The details are available in reference 1.
While the matter has not been specifically discussed in refer- ence 1, the results obtained there shed 'light on the limitations of the numerical techniques employed at present to determine the flow field from a nonlinear theory in a variable atmosphere. These techniques have been developed and programmed utilizing the method of Whitham. The results obtained fail to exhibit the focusing effect in the region of cutoff. The theory utilizes methods of geometric acoustics by following the curved rays for a variable atmosphere, changing the shock strength according to the Whith- am (nonlinear) theory for a uniform atmosphere. This leads to a certain asymptotic law for the decay of the shock strength. The Whitham approach is an approximation based on linear theory in a uniform atmosphere. However, in an inhomogeneous atmos- phere the above approximation is not necessarily valid for all points in the field. Reference 1 shows that the asymptotic law of decay in a nonuniform atmosphere must have two different forms. Moving away from the body, the law is at first very close to that in a uniform atmosphere, but when focal points are approached, the law changes radically within short distances in a manner similar to a boundary-layer effect. (The necessity of using refined techniques has its analogy in optics, where the geometric approach cannot explain the diffraction phenomenon resulting in Airy rings.) This matter should be stressed and studied in order to develop numerical techniques that are also appropriate in regions were focusing occurs (see ref. 2).
115

116 SONIC BOOM RESEARCH
REFERENCES
1. MYERS, M. K.; AND FRIEDMAN, M. B.: Focusing of Supersonic Disturb- ances Generated by a Slender Body in a Nonhomogeneous Medium. Tech. Rept. No. 40, Institute of Flight Structures, Columbia Uni- versity, June 1966.
2. GUIRAUD, J. P. : Acoustique geometrique, bruit ballistique des avions supersoniques e t focalisation. Journal de Mecanique, vol. 4, no. 2, June 1965, pp. 215-267.

Participants
University Attendees
DR. LEE ARNOLD New York University DR. RAYMOND L. BISPLINGHOFF Massachusetts Inst. of Tech. DR. ADOLF BUSEMANN University of Colorado DR. ANTONIO FERRI New York University DR. MORTON B. FRIEDMAN Columbia University DR. I. MILLAR FYFE University of Washington DR. ALBERT R. GEORGE, I11 Cornell University DR. WALLACE D. HAYES Princeton University DR. MARTEN T. LANDAHL Massachusetts Inst. of Tech. DR. FRANKLIN K. MOORE Cornell University
DR. MICHAEL K. MYERS Columbia University DR. ADRIAN J. PALLONE New York University DR. ROBERT W. PORTER Illinois Inst. of Tech. DR. EDWIN L. RESLER, JR. Cornell University DR. HERBERT S. RIBNER University of Toronto DR. LEON H. SCHINDEL Massachusetts Inst. of Tech. DR. WILLIAM R. SEARS Cornell University DR. C. RICHARD SODERBERC Massachusetts Inst. of Tech. DR. ROBERTO VAGLIO-LAURIN New York University DR. MILTON D. VAN DYKE Stanford University
Industry Attendees
DR. ARNOLD GOLDBURC Boeing Scientific Research Labs DR. DONALD R. GRINE Stanford Research Institute MR. CLARENCE S. HOWELL Boeing Company MR. ROBERT T. JONES Avco-Everett Research Laboratory
MR. EDWARD J. KANE Boeing Company MR. RICHARD K. KOECLER Cornell Aeronautical Lab., Inc. DR. SCOTT RHETHORST Vehicle Research Corporation MR. JIM R. THOMPSON Lockheed California Company
Government Attendees
MR. WILLIAM S. AIKEN, JR. NASA Headquarters
MR. DONALD D. BAALS NASA Langley Research Center
117

118 SONIC BOOM RESEARCH
MR. HARRY W. CARLSON NASA Langley Research Center DR. JAMES E. DANBERG NASA Headquarters DR. JOHN C. EWARD NASA Lewis Research Center MR. I. EDWARD GARRICK NASA Langley Research Center MR. ALFRED GESSOW NASA Headquarters MR. GLEN GOODWIN NASA Ames Research Center MR. CHARLES W. HARPER NASA Headquarters MR. WILLIAM A. HASS Environmental Science Services
MR. GARY C. HERBERT Environmental Science Services
MR. WALTON L. HOWES NASA Lewis Research Center MR. HARVEY H. HUBBARD NASA Langley Research Center MR. LYNN W. HUNTON NASA Ames Research Center DR. HERMANN H. KURZWEG NASA Headquarters MR. JOHN L. LANKFORD Naval Ordnance Laboratory
Administration
Administration
MR. LAURENCE K. LOFTIN, JR. NASA Langley Research Center MR. HARVARD LOMAX NASA Ames Research Center MR. DOMENIC J. MAGLIERI NASA Langley Research Center MR. FRANCIS E. MCLEAN NASA Langley Research Center MR. STANLEY K. OLESON Federal Aviation Administration
Wright Patterson AFB MR. J. KENNETH POWER Federal Aviation Administration DR. JOHN 0. POWERS Federal Aviation Administration MR. MILTON ROGERS Air Force Office of Scientific
MR. HARRY L. RUNYAN, JR. NASA Langley Research Center MR. IRA R. SCHWARTZ NASA Headquarters DR. A. RICHARD SEEBASS NASA Headquarters COL. JOHN P. TAYLOR, USAF
National Academy of Sciences
C R . JAMES s. PETTY
Research
(RET.)
* US. GOVERNMENT PRINTING OFFICE: 1968 0-282-910