"something hidden. go and find it. go and look behind the ranges – something lost behind the...
TRANSCRIPT

"Something hidden.
Go and find it.
Go and look behind the Ranges –
Something lost behind the Ranges.
Lost and waiting for you. Go!"
Rudyard Kipling - The Explorer

Using Buckles Plots to Aid Log Analysis
By Kenneth Chaivre
Wednesday June 25, 2008

PROBLEMS WITH ROUTINE LOG ANALYSIS
• High Sw wells may produce gas with very little or no water
• Low Sw wells produce water or fail to produce.• Similar looking wells produce differently.• Leads to Changing “m” and “n”

Review of R. S. Buckles Paper - 1965
• Part of Volumetric Calculation is Ø * (1-SW)• Ø * (1-SW) = Ø – Ø*SW• Buckles showed that Ø * SW irr is a constant
(Ø * SW is the Buckles Number
or Bulk Volume Water)• For Hand Calculations Ø – Constant is a quick and
easy way to calculate Ø * (1-SW)
• Showed that Ø * SW is related to grain size.

BUCKLES PLOT
Transition
SWirrTransition
Low Perm
High Perm
Coarse Grain
Fine Grain

Parameters for Plot
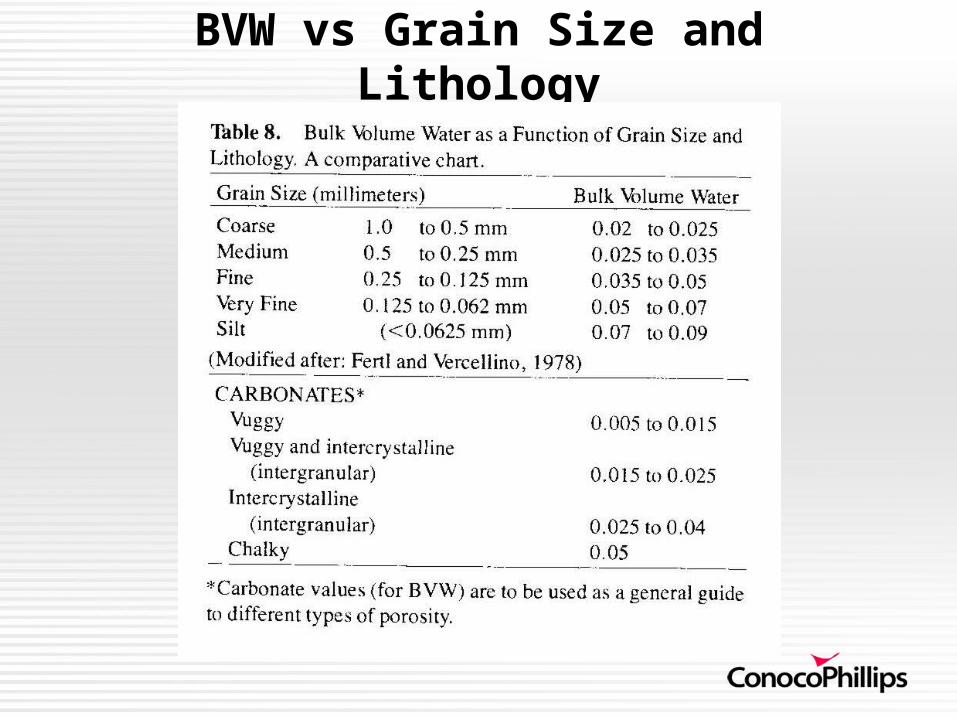
BVW vs Grain Size and Lithology

Uses of the Buckles Plot
• Identify Swirr Zones for Analysis
i.e. Calculate Capillary Pressure • Identify One Type of Low Resistivity Pay• Identify Stratigraphic Flow Units
Environments of Deposition

Calculations with Swirr• If Swirr is Known and • If Permeability (k) can be estimated then
Capillary Pressure (Pc) can be estimated• Pc= (19.5*Swirr^-1.7)*(k/100*Phie)^-0.45
Height Above Free Water (H) can be calculated• H= (.35 for gas)*(Pc)• H= (.7 for medium oil) * (Pc)

Capillary Pressure
Pore Throat Radius (r) can be calculated• r = (108.1) / Pc
• Winland r35 Values – delineate commercial hydrocarbon reservoirs
R35 = 5.395 * ((K^0.588)/(100*PHIE^0.864))
R35 < 0.5μm (microns) – Tight
R35 > 0.5μm (microns) – Will Flow

BUCKLES IN PRACTICE
DEPTH TO FREE WATER
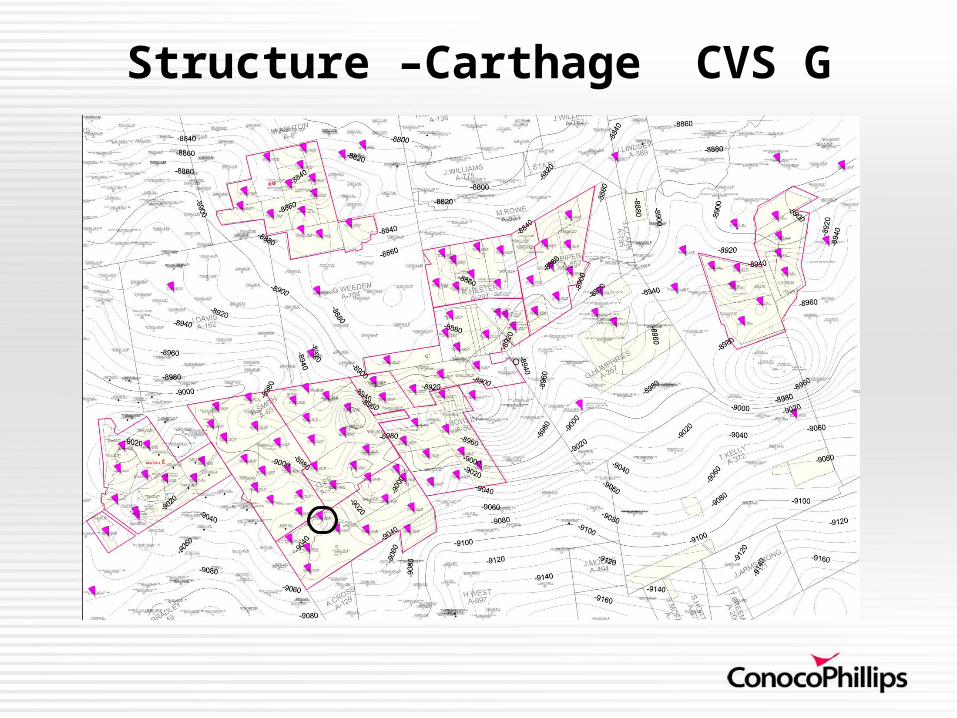
Structure –Carthage CVS G

ZONES SELECTED FOR H free water

MAUDE #13 ZONES FOR DEPTH TO FREE WATER

RESULTS OF DEPTH TO FREE WATER

FREE WATER - CVS G 200 – 400 FT DOWNDIP

Low Resistivity Pay Zones
very fined grained rocks have high bound water

ASHTON 2 UNIT #10 CVS F

ASHTON 2 UNIT #10 CVS F BUCKLES
BVW 0.049

RESULTS - 677mcf & 8.6 bw

STARR CO - FROST FIELD

STARR CO-VXBG

STARR CO - VXBG

STARR CO – VXBG - NOT PERFD
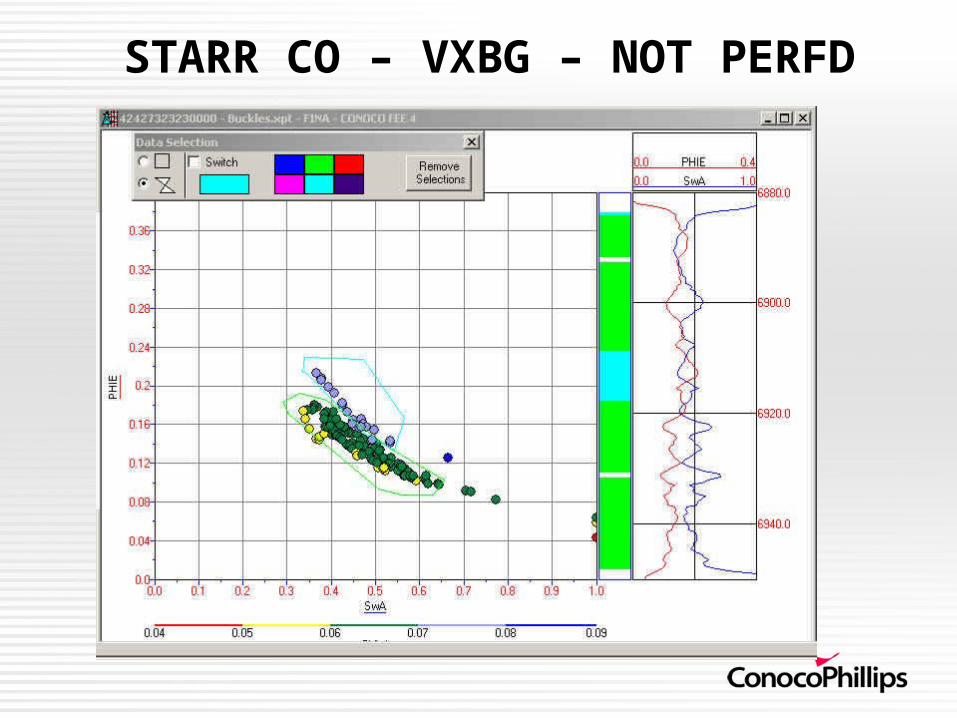
STARR CO – VXBG – NOT PERFD

IDENTIFY FLOW UNITS

PETER 2 UNIT #10 CVS F

PETER 2 UNIT #10 – CVS F

COTTON VALLEY FIELDWebster Parish, Louisiana

FIRST BANK OF PD - S Sarepta Field

FIRST BANK OF PD
17 BCF

CLEMONS – UTZ GRAY
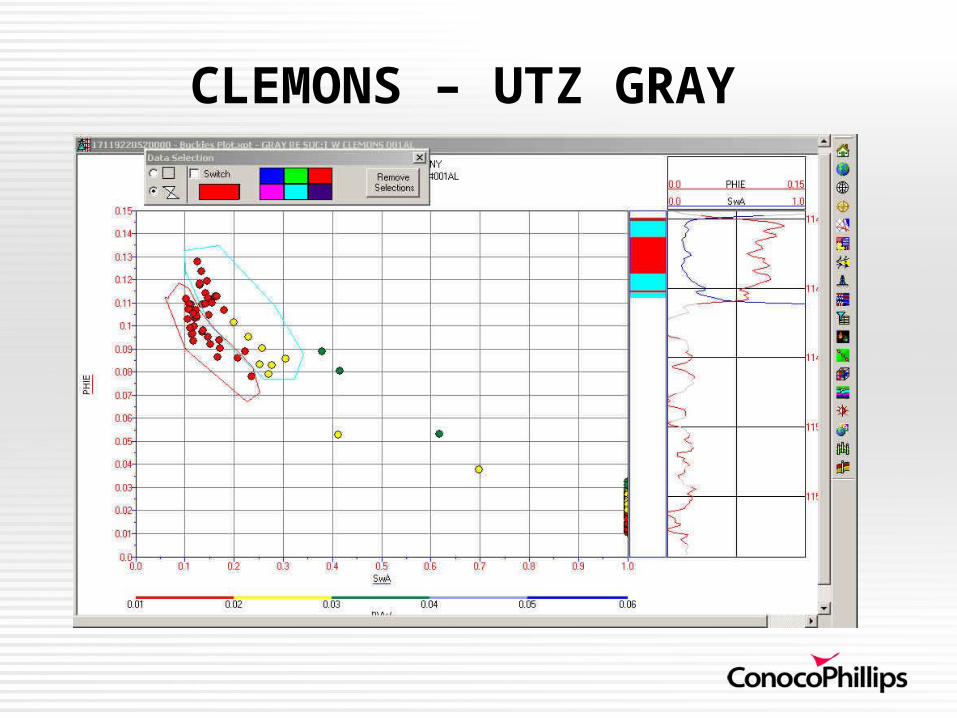
CLEMONS – UTZ GRAY

CLEMONS – 1ST GRAY

CLEMONS – 1ST GRAY

CLEMONS - UTZ VS 1ST GRAY
UTZ 1ST GRAY

CLEMONS – 3RD GRAY
Thin Beds

CARTHAGE FIELDENVIRONMENTS OF DEPOSITION

CARTHAGE - TYPE LOG

Porosity PHI vs. Water Saturation Sw - Cotton Valley Sand Zone C,D,F,G
5%
6%
7%
8%
9%
10%
11%
30% 35% 40% 45% 50% 55% 60% 65% 70% 75%Pay Avg Water Saturation Sw, %
Pay
Avg
Por
osit
y P
HI,
%
PHI vs. Sw -CVC PHI vs. Sw - CVG
PHI vs. Sw - CVF PHI vs. Sw - CVD
From Xindi Wang

CARTHAGE – CVS G Structure

CARTHAGE BVW G with Structure
Blue – 0.02 Red – 0.04

Late Cotton Valley Time
• Cotton Valley Sand
Wave reworked deltaic shoreline.
Fine grained argillaceous sandstones

CARTHAGE BVW G with Structure
Blue – 0.02 Red – 0.04

MAUDE #4 LOG

MAUDE #4

CALLOW #9 LOG

CALLOW #9

MAUDE #4 – CALLOW #9

CVS G Qgas vs BVW
BVW
Qgas – from Production LogsFewer points
Channel? In area of poorer production.

RESULTS IN CARTHAGE FIELD
• Perf’ing more and better zones
• Better Frac and completion techniques

Qgas vs Time

Qwtr vs Time

TIME VS BW/MCF

CONCLUSIONS
• Useful in Establishing Capillary Pressureo Use several equations to find depth to free water
• Differentiate Between Zones that Look Alike on Logs but Produce Differently.o Help Establish Sw Cutoffso Different Rocks need Different Cutoffs
• Suggests Environment of Deposition• Makes You Ask Questions
REFERENCES• Buckles, R. S., 1965, Correlating and Averaging Connate Water Saturation Data:
The Journal of Canadian Petroleum Technology, v. 5, p.42 -252
• Aguilera, R., 2002, Incorporating capillary pressure, pore throat aperture radii, height above free-water table and Winland r35 values on Pickett plots: AAPG Bulletin V86 No. 4 p. 605-624
• Doveton, J. H., 1994, Graphical Techniques for the Analysis and display of Logging Information: Chapter 2 Vol CA 2: p 23-46 Geologic Log Analysis Using Computer Methods
• Doveton, J. H., 1999, Integrated Petrophysical Methods for the Analysis of Reservoir Microarchitechure – a Kansas Chester Sandstone Case Study: AAPG 1999 Midcontinent Section, Transactions, Geoscience for the 21st Century
• PfEFFEER Concepts: http://www.kgs.ku.edu/Gemini/Help/Pfeffer-theory
• Asquith, G. and Gibson C., 1983, Basic Well Log Analysis for Geologists: p.98

THANKS
• Xindi Wang• Christy Demel• Pat Noon• Matt Pickrel• Randy Nesvold

QUESTIONS