some studies on machining characteristics of wire …
TRANSCRIPT

SOME STUDIES ON MACHINING CHARACTERISTICS
OF WIRE ELECTRO DISCHARGE MACHINING OF
Ti50Ni50-XCoX (X=1, 5 AND 10 AT. %) SHAPE MEMORY
ALLOYS
Thesis
Submitted in partial fulfillment of the requirements for the degree of
DOCTOR OF PHILOSOPHY
By
HARGOVIND SONI
DEPARTMENT OF MECHANICAL ENGINEERING
NATIONAL INSTITUTE OF TECHNOLOGY KARNATAKA
SURATHKAL, P.O. SRINIVASNAGAR, MANGALORE-575 025
SEPTEMBER, 2018

D E C L A R A T I O N
I hereby declare that the Research Thesis entitled “SOME STUDIES ON
MACHINING CHARACTERISTICS OF WIRE ELECTRO DISCHARGE
MACHINING OF Ti50Ni50-XCoX (X=1, 5 AND 10 AT. %) SHAPE MEMORY
ALLOYS” which is being submitted to the National Institute of Technology
Karnataka, Surathkal in partial fulfillment of the requirements for the award of
the Degree of Doctor of Philosophy in Department of Mechanical Engineering
is a bonafide report of the research work carried out by me. The material contained
in this Research Thesis has not been submitted to any University or Institution for
the award of any degree.
Register Number : 148057ME14F16
Name of the Research Scholar: Hargovind Soni
Signature of the Research Scholar:
Department of Mechanical Engineering, National Institute of Technology Karnataka,
Surathkal
Place: NITK, Surathkal
Date: 17/09/2018
C E R T I F I C A T E
This is to certify that the Research Thesis entitled “SOME STUDIES ON
MACHINING CHARACTERISTICS OF WIRE ELECTRO DISCHARGE
MACHINING OF Ti50Ni50-XCoX (X=1, 5 AND 10 AT. %) SHAPE MEMORY
ALLOYS” submitted by Mr. Hargovind Soni (Register Number:
148057ME14F16) as the record of the research work carried out by him, is accepted
as the Research Thesis submission in partial fulfilment of the requirements for the
award of degree of Doctor of Philosophy.
Research Guides
Dr. Narendranath S. Dr. Ramesh M R Professor & Head Associate Professor
Dept. of Mech. Engg. Dept. of Mech. Engg.
Chairman - DRPC
Date:

Dedicated to …….

ACKNOWLEGEMENT
The author has great privilege and pride to express his immense sense of gratitude to
Dr. Narendranath S. (Professor and Head) and Dr. Ramesh M R (Associate
Professor) Department of Mechanical Engineering, National Institute of Technology
Karnataka for their patient guidance, inspiration, unwavering moral support,
constructive criticism and painstaking efforts during the course of this work. They
provide me much more than just an education.
Author would like to express immense gratitude to Department of Science and
Technology, Science and Engineering Research Board, India for partially supporting
this research work under grant number SB/S3/MMER/0067/2013.
The author is highly thankful to Dr. Mrityunjay Doddamani, Assistant Professor
Department of Mechanical Engineering, National Institute of Technology Karnataka,
Dr. Ravishankar K.S., Assistant Professor, Department of Metallurgical and
Materials Engineering, National Institute of Technology Karnataka and Dr. D.
Chakradhar Assistant Professor of Department of Mechanical Engineering, Indian
Institute of Technology Palakkad for their valuable inputs and feedback regarding the
research as being the members of the Research Program Assessment Committee
(RPAC).
Author would like to express sincere thanks to all Teaching and Non-teaching staff
members of Department of Mechanical Engineering, National Institute of Technology
Karnataka, Surathkal for their continuous support and assistance during his research
tenure.
The author would like to acknowledge Dr. I Samajhdar (Professor), Department of
Metallurgical Engineering and Materials, IIT Bombay for providing the facility for
measurement of residual stresses.
The author would like to thank Dr. Muralidhar Avvari, Dr. Manjaiah M., Dr.
Priyaranjan Sharma, Dr. Gangadhar N., Dr. Gopi K. R., Jaideep Dutta, Gajanan M

Naik, Abhinaba Roy, Sachin B., Gopal D. Gote, Manoj I. V., Prithvirajan, Kishan,
Anil Ramkishanrao Kadam, Mahantayya Mathapati, Mallikarjuna, Nithin H. S.,
Anusha Poddar, Pinakesh Banerjee, Rashmi L. Malghan, Harsha, Susheel Kumar N.,
Sunil Shankar Waddar, Veeresh Nayak C., Vipin Allien J, Kiran H. Shahapurkar,
Sanjay Kumar Majhi, Abha Shrivastava, Prakash Pawar, Uday Patil, Anoop Shirkol,
Bheemappa Halavar, Arun Kumar Yadav, Nagaraj P. Y., Uttam Chakraborty,
Manjunath G. K., Mohammed Khalifa, Abishek Kumar Tripathi, and Madagonda
Biradar for extending their constant help and support.
Finally, the Author would like to thank his Parents, Brothers and Sisters for their
inspiration and love that accompanies him all the time.
(HARGOVIND SONI)
i
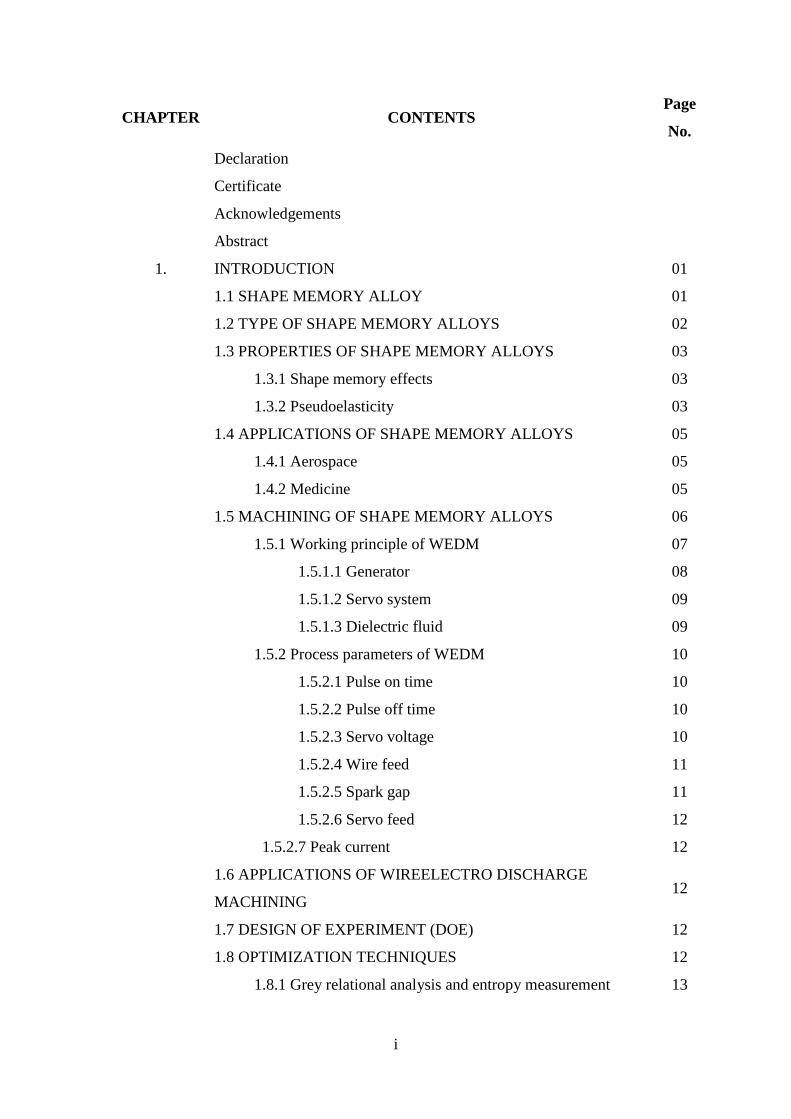
CHAPTER CONTENTS Page
No.
Declaration
Certificate
Acknowledgements
Abstract
1. INTRODUCTION 01
1.1 SHAPE MEMORY ALLOY 01
1.2 TYPE OF SHAPE MEMORY ALLOYS 02
1.3 PROPERTIES OF SHAPE MEMORY ALLOYS 03
1.3.1 Shape memory effects 03
1.3.2 Pseudoelasticity 03
1.4 APPLICATIONS OF SHAPE MEMORY ALLOYS 05
1.4.1 Aerospace 05
1.4.2 Medicine 05
1.5 MACHINING OF SHAPE MEMORY ALLOYS 06
1.5.1 Working principle of WEDM 07
1.5.1.1 Generator 08
1.5.1.2 Servo system 09
1.5.1.3 Dielectric fluid 09
1.5.2 Process parameters of WEDM 10
1.5.2.1 Pulse on time 10
1.5.2.2 Pulse off time 10
1.5.2.3 Servo voltage 10
1.5.2.4 Wire feed 11
1.5.2.5 Spark gap 11
1.5.2.6 Servo feed 12
1.5.2.7 Peak current 12
1.6 APPLICATIONS OF WIREELECTRO DISCHARGE
MACHINING 12
1.7 DESIGN OF EXPERIMENT (DOE) 12
1.8 OPTIMIZATION TECHNIQUES 12
1.8.1 Grey relational analysis and entropy measurement 13
ii
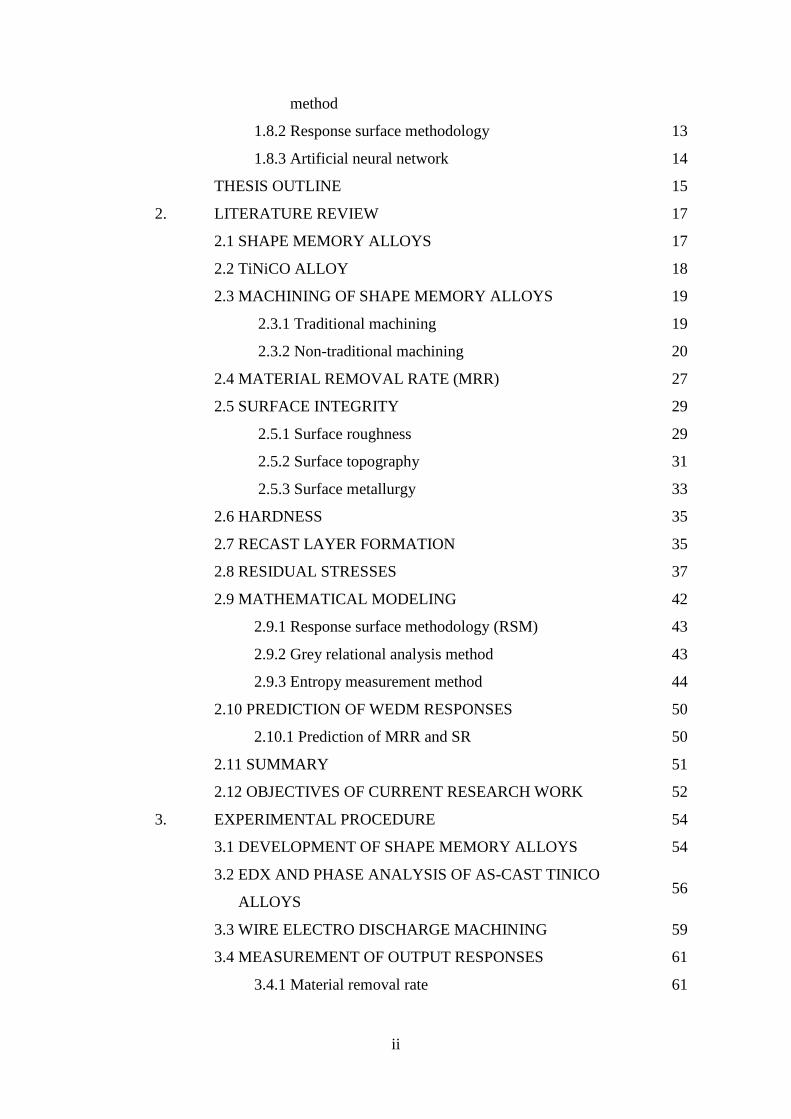
method
1.8.2 Response surface methodology 13
1.8.3 Artificial neural network 14
THESIS OUTLINE 15
2. LITERATURE REVIEW 17
2.1 SHAPE MEMORY ALLOYS 17
2.2 TiNiCO ALLOY 18
2.3 MACHINING OF SHAPE MEMORY ALLOYS 19
2.3.1 Traditional machining 19
2.3.2 Non-traditional machining 20
2.4 MATERIAL REMOVAL RATE (MRR) 27
2.5 SURFACE INTEGRITY 29
2.5.1 Surface roughness 29
2.5.2 Surface topography 31
2.5.3 Surface metallurgy 33
2.6 HARDNESS 35
2.7 RECAST LAYER FORMATION 35
2.8 RESIDUAL STRESSES 37
2.9 MATHEMATICAL MODELING 42
2.9.1 Response surface methodology (RSM) 43
2.9.2 Grey relational analysis method 43
2.9.3 Entropy measurement method 44
2.10 PREDICTION OF WEDM RESPONSES 50
2.10.1 Prediction of MRR and SR 50
2.11 SUMMARY 51
2.12 OBJECTIVES OF CURRENT RESEARCH WORK 52
3. EXPERIMENTAL PROCEDURE 54
3.1 DEVELOPMENT OF SHAPE MEMORY ALLOYS 54
3.2 EDX AND PHASE ANALYSIS OF AS-CAST TINICO
ALLOYS 56
3.3 WIRE ELECTRO DISCHARGE MACHINING 59
3.4 MEASUREMENT OF OUTPUT RESPONSES 61
3.4.1 Material removal rate 61
iii
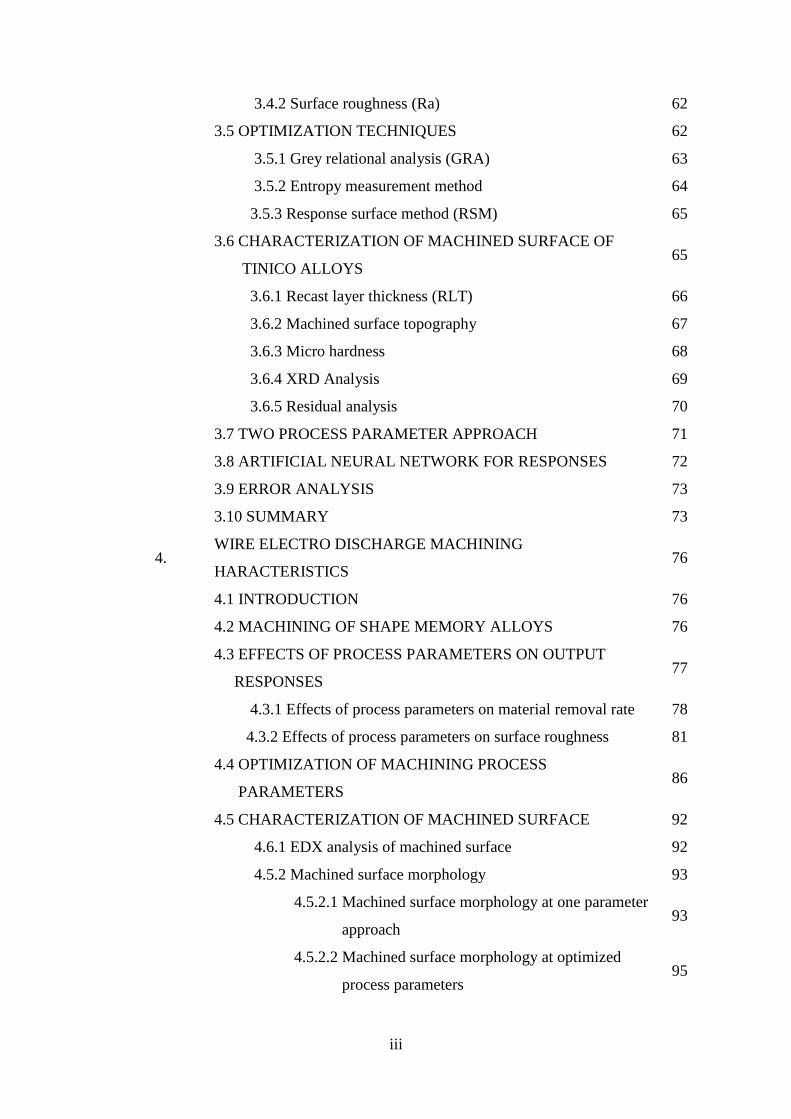
3.4.2 Surface roughness (Ra) 62
3.5 OPTIMIZATION TECHNIQUES 62
3.5.1 Grey relational analysis (GRA) 63
3.5.2 Entropy measurement method 64
3.5.3 Response surface method (RSM) 65
3.6 CHARACTERIZATION OF MACHINED SURFACE OF
TINICO ALLOYS 65
3.6.1 Recast layer thickness (RLT) 66
3.6.2 Machined surface topography 67
3.6.3 Micro hardness 68
3.6.4 XRD Analysis 69
3.6.5 Residual analysis 70
3.7 TWO PROCESS PARAMETER APPROACH 71
3.8 ARTIFICIAL NEURAL NETWORK FOR RESPONSES 72
3.9 ERROR ANALYSIS 73
3.10 SUMMARY 73
4. WIRE ELECTRO DISCHARGE MACHINING
HARACTERISTICS 76
4.1 INTRODUCTION 76
4.2 MACHINING OF SHAPE MEMORY ALLOYS 76
4.3 EFFECTS OF PROCESS PARAMETERS ON OUTPUT
RESPONSES 77
4.3.1 Effects of process parameters on material removal rate 78
4.3.2 Effects of process parameters on surface roughness 81
4.4 OPTIMIZATION OF MACHINING PROCESS
PARAMETERS 86
4.5 CHARACTERIZATION OF MACHINED SURFACE 92
4.6.1 EDX analysis of machined surface 92
4.5.2 Machined surface morphology 93
4.5.2.1 Machined surface morphology at one parameter
approach 93
4.5.2.2 Machined surface morphology at optimized
process parameters 95

iv
4.5.3 Machined surface topography 97
4.5.4 Residual stress analysis 98
4.5.5 Recast layer thickness 100
4.5.5.1 Recast layer thickness at one process parameter
approach 101
4.5.5.2 Recast layer thickness at optimized process
parameter 103
4.5.6 Machined surface microhardness 103
4.5.6.1 Machined surface microhardness at one process
parameters approach 104
4.5.6.2 Machined surface microhardness at optimized
process parameters 104
4.5.7 Phase analysis of machined surface 106
4.6 SUMMARY 107
5.
PARAMETRIC STUDY OF PULSE ON TIME AND SERVO
VOLTAGE DURING MACHINING OF TINICO SHAPE
MEMORY ALLOYS
109
5.1 INTRODUCTION 109
5.2 VARIATION OF MRR WITH EXPERIMENTAL RUN FOR
EACH ALLOY 112
5.3 VARIATION OF SR WITH EXPERIMENTAL RUN FOR
EACH ALLOY 112
5.4 INDIVIDUAL EFFECTS OF INPUT PROCESS
PARAMETERS ON MRR AND SR 114
5.4.1 Effects of pulse on time on material removal rate under
constant servo voltage 116
5.4.2 Effects of pulse on time on surface roughness under
constant servo voltage 118
5.4.3 Effects of servo voltage on material removal rate under
constant pulse on time 119
5.4.4 Effects of servo voltage on surface roughness under
constant pulse on time 121
5.5 MORPHOLOGY OF MACHINED SURFACE 122

v
5.6 SURFACE TOPOGRAPHY 124
5.7 MICRO HARDNESS ANALYSIS 127
5.8 RECAST LAYER THICKNESS 129
5.9 RESIDUAL STRESS ANALYSIS 131
5.10 ARTIFICIAL NEURAL NETWORK 133
5.11 EFFECTS OF EACH EXPERIMENTAL RUN ON
MATERIAL REMOVAL RATE 137
5.12 EFFECTS OF THE EACH EXPERIMENTAL RUN ON
SURFACE ROUGHNESS 138
5.13 PERCENTAGE ERROR 142
5.14 SUMMARY 143
6. CONCLUSION AND SCOPE FOR FUTURE WORK 145
6.1 CONCLUSION 145
6.2 SCOPE FOR FUTURE WORK 147
6.3 KEY CONTRIBUTIONS 147
REFERENCES 149
LIST OF PUBLICATIONS
BIODATA

vi
LIST OF FIGURES
Figure No. Description Page
No.
Figure 1.1 SMA orthodontic wires (a and b), Palatal arches (c) and Orthodontic
distracters (d)
6
Figure 1.2 Classifications of wire electro discharge machining 7
Figure 1.3 Working principle of WEDM 8
Figure 1.4 Schematic view of discharge gap 11
Figure 2.1 Surface Damages in Machining of Nickel-Titanium Alloys: (a)
Metallographic microstructure after turning process (b) Lay pattern
after dry milling process (c) Metal debris after turning process and (d)
Smeared material and feed marks after turning process
20
Figure 2.2 MRR versus the pulse duration τp at various pulse currents IP for the
Ti49Ni51alloy
27
Figure 2.3 Effect of WEDM process parameters on MRR 29
Figure 2.4 (a) SEM image of machined surface: Pulse-on time =0.75µ s, Pulse-off
time=10.2 µ s, Wire feed rate=2 (b) SEM image of machined surface:
Pulse-on time=0.5µ s, Pulse-off time=17µ s, Wire feed rate=3
30
Figure 2.5 Development of the surface roughness depending on the working
current and the frequency
31
Figure 2.6 SEM photographs of electro discharge machined surface of D2 and
H13 tool steel (a) D2 surface topography (4 A/15 μs); (b) D2 surface
topography (16 A/15 μs); (c) D2 surface topography (16 A/6 μs); (d)
H13 surface topography (4 A/15 μs); (e) H13 surface topography (16
A/15 μs); (f) H13 surface topography (16A /6 μs)
32
Figure 2.7 3D surface profile of Ti50Ni40Cu10 machined surface for higher and
lower servo voltage (a and b) brass; (c and d) Zinc coated brass wire
33
Figure 2.8 The XRD patterns of the EDMed surface layer for: (a) Ti35.5Ni48.5Zr16
alloy and (b) Ni60Al24.5Fe15.5 alloy
34
Figure 2.9 Hardness at various distances from the WEDM surface 35
Figure 2.10 SEM photographs of (a) D2 tool steel white layer (12 A/15 μs) and (b)
H13 tool steel white layer (4 A/12 μs)
36
Figure 2.11 Variation of residual stress on the machined specimens 38

vii
Figure 2.12 Flow chart for optimization techniques 45
Figure 3.1 Setup of vacuum arc melting furnace 54
Figure 3.2 Vacuum arc melting chamber (a) raw material placed in the copper
crucible, (b) Melted buttons and (c) Rectangular block of as-cast alloy
55
Figure 3.3. Scanning electron microscope with EDAX attachment 56
Figure 3.4 EDAX analysis of as cast alloys (a) for Ti50Ni49Co1 alloy (b)
Ti50Ni45Co5 alloy and (c) Ti50Ni40Co10 alloy
57
Figure 3.5 XRD analysis of as cast Ti50Ni49Co1 alloy 57
Figure 3.6 XRD analysis of as cast Ti50Ni45Co5 alloy 58
Figure 3.7 XRD analysis of as cast Ti50Ni40Co10 alloy 58
Figure 3.8 Wire EDM 61
Figure 3.9 Flowchart showing hybrid combinations of optimization techniques 62
Figure 3.10 Scanning electron microscopy for machines surface morphology 66
Figure 3.11 Cross-sectioned SEI micrographs of WED-machined Ti50Ni40Cu10
SMA
67
Figure 3.12 Captured image during the surface topographical analysis 67
Figure 3.13 Schematic diagram of three kinds of layers on machined component 68
Figure 3.14 Setup of Microhardness testers 69
Figure 3.15 Setup for residual stress analysis 70
Figure 3.16 Developed ANN Model 73
Figure 3.17 Regression plots of ANN model 74
Figure 3.18 Flow Chart of Experimental Plan 75
Figure 4.1 Effects of process parameters on MRR for Ti50Ni49Co1 alloy 79
Figure 4.2 Effects of process parameters on MRR for Ti50Ni45Co5 alloy 80
Figure 4.3 Effects of process parameters on MRR for Ti50Ni40Co10 alloy 81
Figure 4.4 Effects of process parameters on SR for Ti50Ni49Co1 alloy 83
Figure 4.5 Effects of process parameters on SR for Ti50Ni45Co5 alloy 84
Figure 4.6 Effects of process parameters on SR for Ti50Ni40Co10 alloy 85
Figure 4.7 EDX analyses of machined surface (a) Ti50Ni49Co1, (b) Ti50Ni45Co5
and (c) Ti50Ni40Co10
93
Figure 4.8 SEM microstructures of one process parameters approach machined
surface: (a) At high pulse on time (125µs), (b) Low pulse on time
(105µs), (c) Low servo voltage (20V), (d) High servo voltage, (e) Low
95
viii
pulse off time (28µs) and (f) High pulse off time (56µs)
Figure 4.9 Machined surface morphology at optimized process parameters (a)
Ti50Ni49Co1, (b) Ti50Ni45Co5 and (c) Ti50Ni40Co10
96
Figure 4.10 Surface topography of machined surface of (a) Ti50Ni49Co1, (b)
Ti50Ni45Co5 and (c) Ti50Ni40Co10.
97
Figure 4.11 Residual stress measurement of machined surface for each alloy 99
Figure 4.12 Cross section morphology showing recast layer at various process
parameters (a) at low servo voltage (20V) (b) at high servo voltage
(60V) (c) at lower pulse on time (105µs) and (d) at higher pulse on
time (120µs)
101
Figure 4.13 Recast layer thickness of machined surface at optimized process
parameters of (a) Ti50Ni49Co1, (b) Ti50Ni45Co5 and (c) Ti50Ni40Co10.
102
Figure 4.14 Micro hardness analyses of the Ti50Ni40Co10 alloy after machining 104
Figure 4.15 Microhardness profiles of machined surface of shape memory alloys 106
Figure 4.16 XRD analysis of machined surface at optimized process parameters for
each alloy
107
Figure 5.1 Material removal rate with respect to experimental run 113
Figure 5.2 Surface roughness with respect to experimental run 114
Figure 5.3 Effects of pulse on time on material removal rate under constant servo
voltage of (a) 20V, (b)30 V, (c) 40V, (d) 50V and (e) 60V
118
Figure 5.4 Effects of pulse on time on surface roughness under constant servo
voltage (a) 20V, (b)30 V, (c) 40V, (d) 50V and (e) 60V
119
Figure 5.5 Effects of servo voltage and constant pulse on time on material
removal rate (a) 105 µs, (b) 110 µs, (c) 115 µs, (d) 120 µs and (e) 125
µs.
120
Figure 5.6 Effects of servo voltage and constant pulse on time on surface
roughness (a) 105 µs, (b) 110 µs, (c) 115 µs, (d) 120 µs and (e) 125 µs.
122
Figure 5.7 Machined surface morphology at higher value of outputs (a)
Ti50Ni49Co1 alloy, (c) Ti50Ni45Co5 alloy, and (e) Ti50Ni40Co10 alloy)
and lower values of outputs (b) Ti50Ni49Co1 alloy, (d) Ti50Ni45Co5
alloy, and (f) Ti50Ni40Co10 alloy)
124
Figure 5.8 Surface topography analysis of machined surface at lower values of
outputs (a) Ti50Ni49Co1 alloy, (c) Ti50Ni45Co5 alloy and (e)
128
ix
Ti50Ni40Co10 alloy and higher values of outputs (b) Ti50Ni49Co1 alloy,
(d) Ti50Ni40Co5 alloy and (f) Ti50Ni40Co10 alloy
Figure 5.9 Variation of micro hardness along the cross section at the lower values
of outputs
128
Figure 5.10 Variation of micro hardness along the cross section at the higher
values of outputs
129
Figure 5.11 Recast layer thickness at lower values of outputs (a) Ti50Ni49Co1 alloy,
(b) Ti50Ni45Co5 alloy and (c) Ti50Ni40Co10 alloy
130
Figure 5.12 Recast layer thickness at higher values of outputs (a) Ti50Ni49Co1
alloy, (b) Ti50Ni40Co5 alloy and (c) Ti50Ni40Co10 alloy
131
Figure 5.13 Residual stresses of machined surface 133
Figure 5.14 Experimental and predicted values of MRR for Ti50Ni49Co1 alloy 139
Figure 5.15 Experimental and predicted values of SR for Ti50Ni49Co1 alloy 139
Figure 5.16 Experimental and predicted values of MRR for Ti50Ni45Co5 alloy 140
Figure 5.17 Experimental and predicted values of SR for Ti50Ni45Co5 alloy. 140
Figure 5.18 Experimental and predicted values of MRR for Ti50Ni40Co10 alloy 141
Figure 5.19 Experimental and predicted values of SR for Ti50Ni40Co10 alloy 141
Figure 5.20 Error in % for MRR at all experimental run 142
Figure 5.21 Error in % for SR at all experimental run 143

x
LIST OF TABLES
Table No. Description Page
No.
Table 1.1 Types of shape memory alloys 02
Table 1.2 Shape memory alloy properties and their effects 04
Table 1.3 Medical application of Shape memory alloys 05
Table 2.1 Literature survey based on Wire electro discharge machining process
applied to different material 23
Table 2.2 Literature survey based on the process parameters of WEDM process 39
Table 2.3 Literature survey on optimization techniques 46
Table 3.1 Composition (at. %) of TiNiCo alloys 56
Table 3.2 Input process parameters and their levels 59
Table 3.3 L-33 Orthogonal array 59
Table 3.4 Conditions of normalization 63
Table 3.5 Basic steps for calculating grey relational grade (GRG) 64
Table 3.6 L-25 orthogonal array for two process parameters approach 71
Table 3.7 Training parameters 73
Table 4.1 Measured output responses of MRR and surface roughness 76
Table 4.2 Calculation of GRG for Ti50Ni49Co1 alloy 88
Table 4.3 Calculation of GRG for Ti50Ni45Co5 alloy 89
Table 4.4 Calculation of GRG for Ti50Ni40Co10 alloy 90
Table 4.5 Output response of surface roughness and MRR with GRG 91
Table 4.6 Optimized process parameters for each alloy 92
Table 4.7 Average microhardness in the different zones of the machined surface 105
Table 5.1 Input process parameters and their levels 109
Table 5.2 Orthogonal array adopted for machining 110
Table 5.3 Machining performances measured for each alloy 111
Table 5.4 Effect of pulse on time under constant servo voltage 114
Table 5.5 Effect of servo voltage under constant pulse on time 115
Table 5.6 Experimental and predicted values of responses for Ti50Ni49Co1 alloy 134
Table 5.7 Experimental and predicted values of responses for Ti50Ni45Co5 alloy 135
Table 5.8 Experimental and predicted values of responses for Ti50Ni40Co10 alloy 136
Table 5.9 Maximum error for all three alloys 142

xi
ABBREVIATIONS
Symbols Definitions
SMAs Shape memory alloys
WEDM Wire electro discharge machining
EDM Electro discharge machining
VAM Vacuum arc melting
Ton Pulse on time
Toff Pulse off time
SV Servo voltage
WS Wire speed
SF Servo Feed
GRA Grey relational analysis
RSM Response surface methodology
MRR Material removal rate
SR Surface roughness
DOE Design of Experiments
ANN Artificial Neural Network
µs Micro Second
SV Servo voltage
Mu Machine Unit
M/min Meter /minute
µm Microns
Mm3/min Millimetre
3/minute

1
CHAPTER 1
INTRODUCTION
In this Chapter, introduction of shape memory alloys, conventional machining, non-
conventional machining of shape memory alloys, machining process parameters,
machining responses, optimization techniques, characterization and prediction
techniques are presented.
1.1 SHAPE MEMORY ALLOY
Materials capable to regain their original shape when temperature or load is increased
or decreased are called shape memory alloys (SMAs). These materials are attractive
for many applications in several fields due to their excellent properties such as shape
memory effect and pseudo elasticity (Wei et al. 1998). TiNi based shape memory
alloys are most popular shape memory alloys because they are having two way shape
memory effect and exhibit more corrosion resistance (Jiang et al. 2014; Liu et al.
2005). Shape memory alloys materials exhibit a thermomechanical behavior induced
by the occurrence of phase transformations. They are having two types of phase
transformation one is austenite phase with cubic crystal structure and second is
martensitic phase with monoclinic crystal structure (Ibrahim, Elbagoury, and Fouad
2011; Kong et al. 2011; Wang et al. 2005). Phase transformation from the austenite
phase to martensitic phase in these alloys does not occur by diffusion of the atom but
rather by shear lattice distortion, such kind of transformation called as martensitic
transformation. Each martensitic crystal formed can have a different orientation
direction called a variant. The assembly of martensitic variants can exist in two forms:
twined martensite (Mt), which is formed by a combination of self-accommodated
martensitic variants, and de-twinned or reoriented martensite with a specific variant
(Md). Shape memory alloys are widely used in aircraft applications, robotics
applications and medicine applications etc.

2
1.2 TYPE OF SHAPE MEMORY ALLOYS
There are three types of shape memory alloys namely TiNi based, Copper-based and
Iron-based shape memory alloys. Table 1.1 exhibits the Introduction of all three
alloys.
Table 1.1 Types of shape memory alloys (Wei et al. 1998).
Shape
memory
alloys
Introduction
TiNi
based
TiNi shape memory alloys developed by Buehler and his staff in
1960. TiNi based shape memory alloys are most popular for
various applications such as biomedical, robotics, aerospace etc.
because these alloys show strong shape memory effect, two-way
shape memory effect, pseudoelastic behavior, corrosion
resistance and biocompatibility under the right situations.
Copper-
based
Cu- based alloys are a good alternative to TiNi based alloy due to
their excellent thermal and electrical conductivity. Cu based
alloys create less hysteresis than TiNi, with the transformation
temperatures in Cu-based alloys highly dependent on the
composition. Cu- based shape memory alloys are relatively
economical than TiNi based shape memory alloys
Iron-
based
Iron-based shape memory alloys (FeNiCoTi and FemnSi) are
purely ferrous alloys. These alloys having great potential in civil
engineering structures and exhibit shape memory effect after the
specific thermomechanical treatment. Fe–Mn–Si alloys have a
temperature transformation hysteresis (~ 150°C) and a higher
elastic stiffness than TiNi based alloys. They also exhibit a good
workability, corrosion resistance and weldability (A.Cladera,
B.Weber, C.Leinenbach, C.Czaderski, M.Shahverdi 2014).

3
1.3 PROPERTIES OF SHAPE MEMORY ALLOYS
Shape memory alloys having excellent properties such as shape memory effect,
pseudo elasticity and cyclic behaviour. Table 1.2 indicates the properties and their
effects.
1.3.1 Shape memory effects
Shape memory alloys exhibit the shape memory effects when it is deformed while in
the twinned martensite phase and then unloaded while at a temperature below
austenite start. When it is subsequently heated above austenite finish, the shape
memory alloy will regain its original shape by transforming back into the parent
austenite phase. Sometime these alloys exhibit the two-way shape memory effects.
Moreover, these alloys show repeatable shape changes without applied mechanical
load when subjected to a cyclic thermal load; this behavior is called two-way shape
memory effects (Lagoudlas 2008).
1.3.2 Pseudoelasticity
Pseudo elasticity is from the reversible motion of domain boundaries during the phase
transformation, rather than just bond stretching or the introduction of defects in the
crystal lattice (thus it is not true super elasticity but rather pseudo elasticity). Even if
the domain boundaries do become pinned, they may be reversed through heating.
Thus, a pseudo elastic material may return to its previous shape (hence, shape
memory) after the removal of even relatively high applied strains. One special case of
pseudo elasticity is called the Bain Correspondence. This involves the
austenite/martensite phase transformation between a face-centered crystal lattice
(FCC) and a body-centered tetragonal crystal structure (BCT). Superelastic alloys
belong to the larger family of shape-memory alloys. When mechanically loaded, a
superplastic alloy deforms reversibly to very high strains (up to 10%) by the creation
of a stress-induced phase. When the load is removed, the new phase becomes unstable
and the material regains its original shape. Unlike shape-memory alloys, no change in
temperature is needed for the alloy to recover its initial shape.. Initially, the material is
in the austenitic phase. The simultaneous transformation and de-twinning of the
martensitic variants start at a point and results in fully transformed and de-twinned

4
martensite. Upon unloading, the reverse transformation starts. Finally, at the end of
the loading path the material is again in the austenitic phase.
Table 1.2 Shape memory alloy properties and their effects (Goryczka et al. 2005).
S.
No. Properties Effects
1 Shape memory effect The material can be used as an actuator, providing
force during shape recovery
2 Pseudoelasticity
The material can be stressed to provide large,
recoverable deformations at relatively constant stress
levels
3 Hysteresis Allows for dissipation of energy during a
pseudoelastic response
4 High actuation stress
(400–700 MPa)
Small component cross-sections can provide
substantial forces
5 High actuation strain
(8%)
Small component lengths can provide large
displacements
6 High energy density
(~1200 J/kg)
A small amount of material required to provide
substantial actuation work
7 Three-dimensional
actuation
Polycrystalline SMA components fabricated in a
variety of shapes, providing a variety of useful
geometric configuration
8 Actuation frequency The difficulty of quickly cooling components limits
use in high frequency applications
9 Energy efficiency (10–
15%)
Amount of thermal energy required or actuation is
much larger than mechanical work output
10 Transformation-
induced plasticity
Plastic accumulation during cyclic response
eventually degrades material and leads to failure

5
1.4 APPLICATIONS OF SHAPE MEMORY ALLOYS
1.4.1 Aerospace
Due to increase demand for multi-functionality and reliability in the aerospace
industry, shape memory alloys are attractive material for scientist across the world in
this area for aerospace applications. Shape memory effect and pseudo elasticity
properties are attractive these materials in wing aircraft, spacecraft, and rotorcraft
areas (Jani et al. 2014).
1.4.2 Medicine
Shape memory alloys are used in medical applications due to pseudoelasticity; shape
memory effects, biocompatibility, and corrosion resistance (Petrini and Migliavacca
2011). Table 1.3 indicates the applications of shape memory alloys for biomedical
applications due to pseudoelasticity and shape memory effects. Fig. 1.1 exhibit
medical application where Fig. 1.1 a and Fig. 1.1b SMA orthodontic wires, Fig. 1.1c
Palatal arches and Fig. 1.1d Orthodontic distracters.
Table 1.3 Medical application of Shape memory alloys (Petrini and
Migliavacca 2011).
Application Pseudoelasticity Shape memory effects
Orthodontic
field
Wires, distractors, palatal arches,
endodontic files. Wires
Vascular field
Venous filters, devices for closing
ventricular septal defects, self-
expandable vascular stents, stent-
graft, percutaneous devices to treat
valvular diseases
Venous filters, devices for
closing ventricular septal
defects
Neurosurgical
Field Surgical
field
Coils, stents, micro guidewires. Mini-invasive surgical
instruments
Orthopaedic
field
Intraspinal implants,
intramedullary nails
Staples or plates, devices for
correcting scoliosis, spinal

6
vertebrae spacer,
intramedullary nails, devices
for physiotherapy
Figure 1.1 SMA orthodontic wires (a and b), Palatal arches (c) and
Orthodontic distracters (d) (Petrini and Migliavacca 2011).
1.5 MACHINING OF SHAPE MEMORY ALLOYS
Machining of shape memory alloys is very difficult through conventional machining
because they may affect the internal properties of shape memory alloys. Therefore
non-conventional machining can be used for machining of such kind of alloys such as
wire electro-discharge machining, electrochemical machining, laser beam machining
and water jet machining etc. Wire electro-discharge machining achieving high

7
precision and quality of cut of surface and, therefore, this method is a most suitable
process to be machined for all conductive machining (Ablyaz and Muratov 2017). To
achieve high precision and surface quality through any machining process their input
process parameters play a very important role during the machining. Moreover, wire
electro discharge machining has been classified into various physical characteristics
which can be seen in Fig 1.2. However they have divided into different types of
machine features affecting the performance measures, machining capacity and
auxiliary facilities (Ho et al. 2004).
Figure 1.2 Classifications of wire electro discharge machining (Ho et al. 2004).
1.5.1 Working principle of WEDM
Wire electro-discharge machining is a thermoelectric process, which removes the
materials from the workpiece surface through spark erosion in machining zone. In
wire electro-discharge machining wire is used as a tool electrode and workpiece make
anode, mostly deionized water used as a dielectric fluid which continuously flows in
the machining area through the nozzle. Wire and workpiece both are connected by
DC power supply maintaining constant gap. The size of this gap may be the half of
the wire diameter and also this gap called spark gap. During the WEDM process wire

8
such as brass wire, zinc coated brass are used as a tool and workpiece materials
should be conductive. Fig. 1.3 exhibits the working principle of WEDM process.
There are three important parts of WEDM which are as follows.
Generator
Servo system
Dielectric system
Figure 1.3 Working principle of WEDM (Ghodsiyeh et al. 2013).
1.5.1.1 Generator
In the EDM process, electrical energy in the form of short duration impulses is
required to be supplied to the machining gap. For this purpose, specially designed
generators are employed. The generators for spark erosion are distinguished according
to the way in which the voltage is transformed and the purpose is controlled and also

9
on the basis of the characteristics of discharge. Modern EDM machines employ
controlled pulse generators which enable easy variation of spark frequency and
intensity of the discharge. The pulse generators are invariably provided with an
electronic interrupter which could switch high current flows.
1.5.1.2 Servo system
The servo system controls the gap between the tool and workpiece in EDM. The servo
gets its input signal from the difference between a selected reference voltage and the
actual voltage across the gap. The signal is amplified and the tool, as it wears a little,
is advanced by the hydraulic control. A short circuit across the gap causes the servo to
reverse the motion of the tool until the correct gap is established. The essential
requirements of a servo system for use in EDM is (a) to locate the tool accurately in
relation to the work surface, (b) high sensitivity to change in gap conditions, (c) low
inertia, (d) quick response and (e) maintenance of constant gap (Liao et al. 1997).
1.5.1.3 Dielectric fluid
Deionized water used as dielectric fluid mostly during wire electro-discharge
machining because of its desirable thermal properties such as low viscosity and
pollution free working for WEDM and deionized water has no fire hazard, high
cooling rate result in higher material removal rate. Low viscosity helps in efficient
flow with high cooling rate yields very thin recast layer, therefore, deionized water is
used to as dielectric fluid. Other than deionized water kerosene also used as dielectric
fluid during wire electro-discharge machining. The important requirements of a
dielectric fluid to be used in WEDM process- are mentioned below.
Remain electrically non-conducting until the required breakdown
voltage has been reached.
Should have high dielectric strength.
Rapidly quench the spark or demonize the spark or spark gap after the
discharges have occurred.
Have a good degree of fluidity.

10
1.5.2 Process parameters of WEDM
Process parameters of WEDM play important role in controlling the machining
process and to achieve higher material removal rate with better surface roughness.
Since WEDM process parameters influence machining characteristics, this section is
dedicated to detailed explanation of influence of process parameters on machining
responses. Some important process parameters are follows:
1.5.2.1 Pulse on time
Pulse on time is the time interval of spark allowed per cycle. Pulse on time is most
important parameters for wire electro-discharge machining. Higher values of pulse on
time give higher material removal rate (Soni et al. 2017) but more frequent wire
breakage seems at the higher values of this parameter hence the range 100-129 µs of
this parameter will be different for different materials. This parameter should be
optimized for a particular material.
1.5.2.2 Pulse off time
Pulse off time (Toff) indicates the duration of time in microsecond (µs), between two
simultaneous sparks. The range of this parameter is 0-63 µs during wire electro-
discharge machining which is applied in steps of 1 unit, moreover, the voltage is
absent during this part of the cycle. Material removal rate and surface roughness are
decreased with increase in pulse off time, which is due to decrease in spark intensity
as more time is required for flowing dielectric fluid leading to low MRR. At high
pulse off time, most of the molten metal is flushed away from the machined surface
and reduce the formation of craters and micro globules hence leading to low surface
roughness (Manjaiah et al. 2015).
1.5.2.3 Servo voltage
Servo voltage is another important process parameter for wire electro discharge
machine which sends signals to servo system through gap voltage sensor to control a
predetermined gap between tool and workpiece. The range of the servo voltage is 1-
100 V in wire EDM. The increase in servo voltage, results in decrease of materials
removal rate and surface roughness because increase in servo voltage results in larger
11
spark gap thereby reducing the spark intensity and eventually lesser amount of
material is removed from the surface of the workpiece which leads to lower MRR
(Kumar et al. 2017).
1.5.2.4 Wire feed
Wire feed indicate the speed at which the wire-electrode travels along the wire guide
path and is fed continuously for sparking. The range of this parameter is 1-15 m/min
as perused WEDM for present work. For better machining performance and stability
wire feed should be set to the maximum.
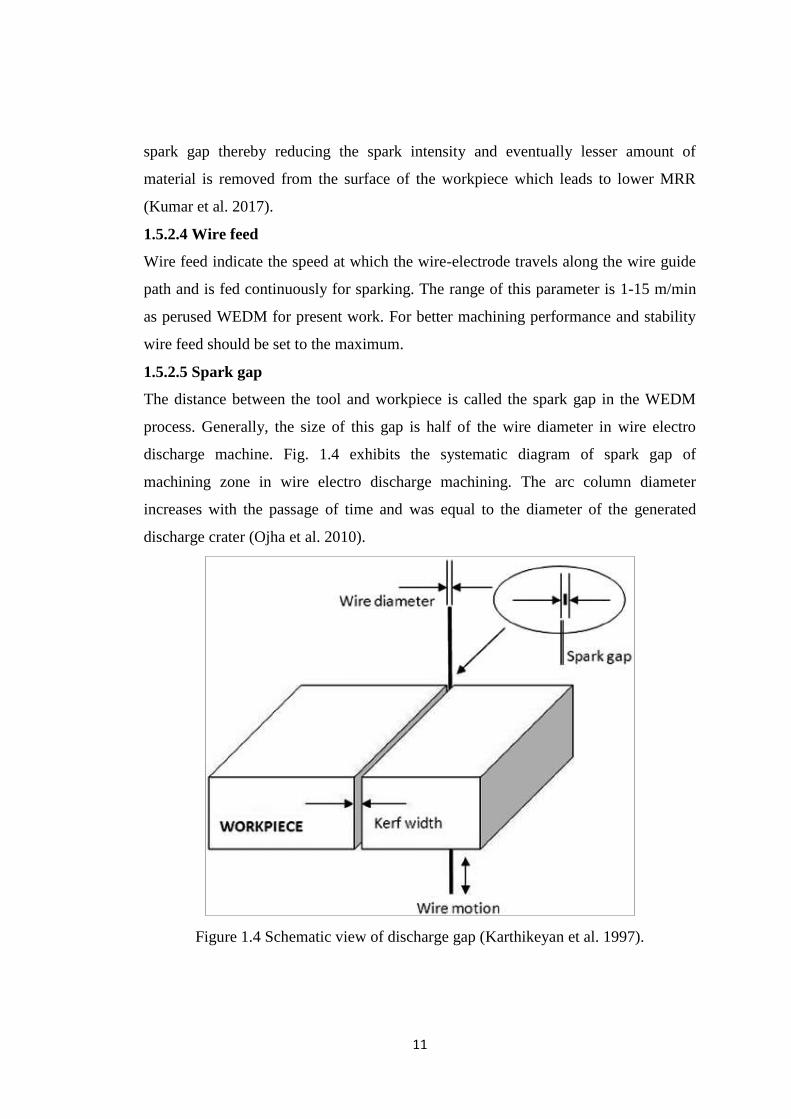
1.5.2.5 Spark gap
The distance between the tool and workpiece is called the spark gap in the WEDM
process. Generally, the size of this gap is half of the wire diameter in wire electro
discharge machine. Fig. 1.4 exhibits the systematic diagram of spark gap of
machining zone in wire electro discharge machining. The arc column diameter
increases with the passage of time and was equal to the diameter of the generated
discharge crater (Ojha et al. 2010).
Figure 1.4 Schematic view of discharge gap (Karthikeyan et al. 1997).

12
1.5.2.6 Servo feed
Servo feed setting decides the servo speed. The servo speed, at the set value of servo
feed, can vary in proportion to the gap voltage (normal feed mode) or can be held
constant while machining (with constant feed mode).
1.5.2.7 Peak current
The peak current (IP) exhibit the maximum value of the current passing through the
electrodes for the given pulse. Machining at higher values of peak current leads to the
generation of higher heat energy.
1.6 APPLICATIONS OF WIRE ELECTRO DISCHARGE MACHINING
Wire electro discharge machining is used for machining of all conductive and semi
conductive materials in many areas which are following-
Semiconductor applications, Aerospace, Electronics and Medical
Die & Tool making industries.
For cutting the hard Extrusion Dies
In making Fixtures, Gauges & Cams
Cutting of Gears, Strippers, Punches and Dies
Manufacturing hard Electrodes.
Manufacturing micro-tooling for Micro-EDM, Micro-USM and such other
micromachining applications.
1.7 DESIGN OF EXPERIMENT (DOE)
Design of experiment plays an important role in Design for Reliability (DFR)
programs, allowing the simultaneous investigation of the effects of various factors and
thereby facilitating design optimization. Some important DOE methods are response
surface design, Taguchi design, and full factorial, but in the present study response
surface design method is used to create an experimental plan.
1.8 OPTIMIZATION TECHNIQUES
Optimization techniques are important to obtain a combination of process parameters
for the expected outputs. There are two types of optimization techniques first is single
objective optimization techniques and another is multi-objective optimization
techniques. When objectives are two and more, multi-objective optimization
13
techniques are used for optimization of process parameters. There are many multi-
objective optimization techniques available such as Grey relational analysis, entropy
measurement, generate algorithm response surface method, teaching-learning
optimizations techniques etc. But in the present study hybrid combination of multi-
objective optimization techniques such as grey relational analysis, entropy
measurement and response surface methodology is used to find the best combination
of process parameters.
1.8.1 Grey relational analysis and entropy measurement method
Grey relational analysis (GRA) is developed by Julong Deng (1989) therefore it is
also known as Deng’s Grey model. GRA is a most popular grey system which uses a
specific concept of information. In GRA there are two systems one is black and
another is a white system where black system indicates no information data in the
system while white shows the perfect information data in the system. However, GRA
is a practical analytical optimization method which provides suitable tools for
examining a rank of order of multiple objects with resemblance from an objective.
GRA requires limited information to estimate the behavior of an uncertain system and
discrete data problem. If the sequence range is large, the factors are effaceable
therefore data pre-processing is an important step to manage the factors of GRA. The
range of data pre-processing is from zero to one. For the data pre-processing, there are
three conditions of normalization namely higher the best, lower the best and nominal
the best, user can choose any conditions according to their requirement during the
study. In the present study higher the better is used in the normalization of MRR and
another one is lower the better for normalization of SR. In GRA, the weights of each
quality characteristics are determined. Entropy measurement method is an objective
weighting method. Discrete type of entropy is used in grey entropy measurement for
properly conduct weighting analysis and calculating grey relational grade.
1.8.2 Response surface methodology
Response surface methodology (RSM) investigates the communication between many
illustrative variables and one or more response variables. The most essential
application of this approach is to utilize a series of designed experiments to get best

14
response. Commonly a second-degree polynomial model is used in this approach.
Even though these models are just a prediction, such a model is easy to estimate and
apply. RSM is used in the present work as a design of experiment method for design
the experimental plan and analysis of grey relational grade in the optimization
technique.
1.8.3 Artificial neural network
An artificial neural network (ANN) is an information-processing system that has
certain performance characteristics in common with biological neural networks.
Generally, an ANN is made up of some neurons connected together via links. Among
various neural network models, the feed-forward neural network based on back-
propagation is the best general-purpose model (Pant et al. 2014). An artificial neural
network approach is an effective tool to predict process parameters; it can generate
the outputs for a set of inputs that are within the range of the original inputs during the
training phase. ANN will be used for prediction the material removal rate and surface
roughness in the present study.

15
THESIS OUTLINE
The thesis consists of six chapters.
CHAPTER -1
In this Chapter, introduction of shape memory alloys, machining of shape memory
alloys, conventional machining, non-conventional machining of these alloys,
machining process parameters, machining responses, optimization techniques,
characterization and prediction techniques are presented.
CHAPTER -2
This chapter presents critical review of the published literature relevant to the present
study. Comprehensive review of the existing literature on TiNiCo shape memory
alloy, machining of shape memory alloys, machining performances and machined
surface characterization. Major focus of literature is on advanced machining (Wire
electro discharge machining) of shape memory alloys, parametric optimization of
process parameters and error analysis during the machining was also debated.
CHAPTER -3
This chapter contains description of experimental equipments and procedures adopted
for development of TiNiCo shape memory alloy, WEDM machining at optimized
process parameters and characterization of machined surface.
CHAPTER -4
This chapter describes the WEDM machining characteristics. Results are discussed
critically in view of the existing literature. Machining has been carried out as per L-33
orthogonal array and measured the responses such as material removal rate and
surface roughness for all three alloys (Ti50Ni49Co1, Ti50Ni45Co5, and Ti50Ni40Co10
shape memory alloys). Multi objective optimization technique (grey relational
analysis) was adopted for optimization of process parameters, and machined surface
characterization was performed on machined surface at optimized process parameters.
CHAPTER -5
It is observed that pulses on time and servo voltage are most influential process
parameters for machining of TiNiCo shape memory alloys. Therefore in the present

16
chapter two parameter approach has been adopted to observe deeply the effect of
pulses on time and servo voltage on the machining of different compositions of
TiNiCo shape memory alloys. The machined surface characterization is carried out at
lower and higher values of responses. Machining as per L-25 orthogonal array has
been carried out and machining performance MRR and SR are measured. Moreover,
in this chapter error analysis has been carried out considering two parameter approach
during the machining of all three alloys. This chapter presents the comparison
between experimental and predicted values. Prediction was done using artificial
neural network approach.
CHAPTER -6
This chapter summarizes the conclusions from the results found within the present
research. Also the scope for future work in the area of TiNiCo alloy and key
contributions of present study are presented in this chapter.

17
CHAPTER 2
LITERATURE REVIEW
This chapter contains a comprehensive review of the literature with a special
reference to TiNiCo shape memory alloy, WEDM machining, machining
performances, parametric optimization to obtain the best optimization of process
parameters and machined surface characterization. The objectives of the present work
have been formulated after critical analysis of the literature towards the end of this
chapter.
2.1 SHAPE MEMORY ALLOYS
NiTi-based shape memory alloys (SMAs) are unique class of shape memory material
which recover their original shape when temperature and load are varied. Due to their
excellent properties, SMAs are being used in many biomedical and engineering
applications (Lekston et al. 2012; Nam et al. 1990). SMA shows outstanding
properties such as super elasticity, shape memory effect, corrosion resistance, high
specific strength, biocompatibility, greater ductility and elastic modulus (Manjaiah et
al. 2015). Due to excellent biocompatibility, TiNi based shape memory alloys are
used for biomedical applications such as bone staple, stone extraction baskets,
cardiovascular stents, catheter guide wires and other biomedical devices (Dadbakhsh
et al. 2016). The properties of SMAs can be increased by adding a third element in
TiNi replacing Ni with Co, Cu, Ag, Au, Hf, Zr and Cr etc. Substitution of Cu for Ni in
TiNi alloys is known to produce a stable shape memory effect, reduce the
transformation stresses, narrow temperature hysteresis, and composition insensitivity
compared with the TiNi binary alloys. Moreover the addition of Cu (Up to 10 at. %),
the transformation hysteresis is much smaller than for binary alloy at the expense of
the total transformation strain which is reduced to nearly 4.0% in NiTi (Lekston et al.
2012). By adding Hf in TiNi high temperature shape memory alloys can be developed
which are referred to as materials with a phase transformation temperature higher than
100°C, have increasingly gained interest in the robotic, automotive and aerospace
fields (Kim et al. 2016). Zr is another element which can be suitable in developing
high temperature shape memory alloys. McCluskey et al.(2014) reported that
18
martensitic start (Ms) temperature of ternary alloy films found to increase with
increasing Zr content when it is higher than 10 at%. The highest Ms temperature
attained was ∼170°C for films containing 19.5 at% Zr. Moreover Critical stress
against plastic deformation increases with increasing Zr content up to 10 at%.
Although further increase in Zr content resulted in embrittlement of the alloy films,
Ti32.3Ni48.2Zr19.5 film showed a shape memory effect with recoverable strain of
∼1.3% under a constant stress of 250 MPa. This suggests that the TiNiZr alloy film
can be a candidate for cantilever type micro-actuators. Similarly addition of Ag in to
TiNi can improve antibacterial properties (Zheng et al. 2011). It is reported that
adding certain noble elements such as Pd, Pt and Au can slightly decrease the SMA’s
hysteresis at certain precise concentrations (Shi et al. 2014). The addition of Cr has
attracted much attention because it not only adjusts the transformation temperatures
but also results in improvement of mechanical properties, such as yield stress,
stiffness and workability fatigue life (Tong et al. 2014).
2.2 TiNiCo ALLOY
In 1971, elastic properties of TiNiCo shape memory alloy wires were evaluated by
Andreasen to develop TiNi-based shape memory alloys for medical application (Y.J
Huang et al. 2014). JING Rui-rui et al. (2007) studied on the influences of Co-
addition on phase transformation behaviour and mechanical properties, they were
reported that a substitute for Ni, with Co in to NiTi alloys can marginally decrease
the martensite transformation temperature and R Phase transformation are
accordingly separated. Ti50Ni48Co2 alloy exhibits good ductility with a lower stress
plateau caused by stress-induced martensite, martensite reorientation and also the
addition of Co resulted in higher yield strength. A fracture elongation of more than
20% was obtained for Ti50Ni48Co2 (Zheng et. al. 2004). It is shown (Drugacz et al.
1995 and J. Rui- rui et al. 2004) that when compared to binary alloys, the addition of
Co in NiTi alloy increases the loading plateaus and workability. It is observed that
Ti50Ni50-xCox (x=1-2) alloys exhibit about 30 % higher modulus, loading plateau,
and unloading plateau as compared to the binary alloy. Drugacz et al. (2002)
evaluated the biocompatibility performance of TiNiCo alloys and reported that no
reactivity occurred during cytotoxicity and hemolysis test. The application of TiNiCo

19
alloy, clamps for surgical treatment of mandible fractures facilitates treatment while
ensuring stable fixation of the bone fragments. No pathologic tissue reactions to the
implants were observed in either humans or animals.
2.3 MACHINING OF SHAPE MEMORY ALLOYS
The high ductility, severe work hardening and unique pseudoelastic behaviour in TiNi
SMAs cause their machining to be quite complicated (Weinert et al. 2004) and it is
difficult to machine TiNi alloy using traditional machining such as mechanical
drilling, cutting and shaping. Non-traditional machining processes exhibit an excellent
ability for machining of shape memory alloys. The machining of SMAs is relatively
important and integral part in the production of components for utilization in
engineering applications.
2.3.1 Traditional machining
The machining of shape memory alloys through conventional machining such as
milling, turning, drilling is very difficult due to their poor performance such as poor
surface finish, dimensional accuracy and also affects the internal properties
(pseudoelasticity, shape memory behaviour etc.) of shape memory alloys. Due to high
reactivity of titanium alloy with the cutting tools, low heat conductivity, high strength
at elevated temperatures and low elastic modulus result in increased temperatures at
the tool-chip interface there by workpiece distortions and rapid tool wear are likely to
occur (Zailania et al. 2016). The high tool wear rate and poor surface quality during
the traditional machining of TiNi shape memory alloy which reduce the applications
of shape memory alloys (Kaynak et al. 2013). Kowalczyk et al. (2017) and
Markopoulos et al. (2015) observed the difficulties of conventional machining of TiNi
shape memory alloys and reported that traditional machining affect internal properties
such as pseudoelastic behaviour and ductility. Hassan et al. (2014) reported the
presence of surface defects in Ni-Ti alloy during traditional machining processes in
the forms of feed marks, surface drag, debris of microchips, surface plucking, tearing
surface, material cracking, surface cavities, adhered material particles, chip layer
formation, deformed grains, slip zones, laps (material folded onto the surface), and lay
patterns few of them has shown in Figure 2.1.

20
2.3.2 Non-traditional machining
Non-traditional machining process are advanced machining processes which remove
the material from surface of workpiece without contact between tool and workpiece
therefore tool wear can be minimized. The difficulties in conventional machining of
TiNi alloys can be overcome by effectively machining through non-conventional
machining process such as laser machining, water jet machining (WJM),
Electro discharge machining (EDM) and Wire Electro discharge machining (WEDM).
WEDM is an advanced method that has revolutionized in the field of cutting tool, die
and mould making industries. Some WEDM machining based literature is reported in
Table 2.1.
Figure 2.1 Surface Damages in Machining of Nickel-Titanium Alloys: (a)
Metallographic microstructure after turning process (b) Lay pattern after dry milling
process (c) Metal debris after turning process and (d) Smeared material and feed
marks after turning process (Hassan et al. 2014).

21
WEDM is an essential machine in several manufacturing processes in industries,
which gives importance to precision and accuracy. Several researchers have attempted
to improve the performance characteristics namely the surface roughness, cutting
speed, dimensional accuracy and material removal rate. But the full potential
utilization of this process is not completely solved because of its complex and
stochastic nature and more number of variables involved in this operation (Spedding
and Wang, 1997). Scott et al. (1991) developed mathematical models to predict
material removal rate and surface finish while machining D-2 tool steel at different
machining conditions. It was found that there is no single combination of levels of the
different factors that can be optimal under all circumstances. Tarng et al. (1995)
formulated a neural network model and simulated annealing algorithm in order to
predict and optimize the surface roughness and cutting velocity of the WEDM process
in machining of SUS-304 stainless steel materials. Spedding and Wang (1997)
attempted to model the cutting speed and surface roughness of EDM process through
the response-surface methodology and artificial neural networks (ANNs). A feed-
forward back-propagation neural network based on a central composite rotatable
experimental design is developed to model the machining process. Liao et al. (1997)
performed an WEDM machining study using SKD11 alloy steel and established
mathematical models relating the machine performance like MRR, SR and gap width
with various machining parameters and then determined the optimal parametric
settings for WEDM process applying feasible-direction method of non-linear
programming. Bitonto et al. (1989) presented a simple cathode erosion model for
EDM process. This point heat-source model accepts power rather than temperature as
the boundary condition at the plasma/cathode interface. A constant fraction of the
total power supplied to the gap is transferred to the cathode over a wide range of
currents. The model identifies the key parameters of optimum pulse time factor and
erodibility in terms of thermo-physical properties of cathode material. Shankar Singh
et al. (2004) reported the results of an experimental investigation carried out to study
the effects of machining parameters such as pulse current on material removal rate,
radial over cut, electrode wear, and surface roughness in electric discharge machining
of EN-31 tool steel hardened and tempered to 55 HRC. The work material was
EDMed with copper, copper tungsten, brass and aluminium electrodes by varying the

22
pulsed current at reverse polarity. Investigations indicate that the output parameters of
EDM increase with the increase in pulsed current and the best machining rates are
achieved with copper and aluminium electrodes. Copper is comparatively a better
electrode material as it gives better surface finish, low diametric over cut, high MRR
and less electrode wear for EN-31 work material. The periodic component of the
surface texture is identified and an auto regressive (AR) model is used to describe its
stochastic component. Huang et al. (1999) investigated experimentally the effect of
various machining parameters on the gap width, SR and the depth of white layer on
the machined work piece (SKD11 alloy steel) surface. Anish Kumar et al. (2013)
presented WEDM as an adequate process to machine high strength temperature
resistant pure titanium (grade-2) with good surface finish and dimensional accuracy.

23
Table 2.1 Literature survey based on Wire electro discharge machining process applied to different material.
No. Authors Material Brief Contribution
1
(Hsieh et al.
2009)
Ti35.5Ni49.5Zr15 and
Ti50Ni49.5Cr0.5 alloys Machined alloys exhibited a good shape recovery.
2
(Geng & Zhong
2010) 45 steel
The result shows that topography of the WEDM surface exhibits strong fractal
characteristics within a certain scale.
3
(Antar et al.
2011)
720 nickel based super alloy
and Ti-6Al-2Sn- 4Zr-6Mo
titanium alloy
Reported surface finish ~ 0.6µm (Ra), with near neutral residual stresses and
almost zero recast were produced following two trim passes.
4
(Dhobe et al.
2013) Tool steel
Microstructural changes and the droplets forming recast layer are found to
influence the surface roughness, hardness, and white layer thickness of the wire
electro-discharge machined surface of the tool steel.
5 (Guo et al. 2013) Ni50.8Ti49.2
It is reported that very high strength and specific heat are responsible for large
flank wear and fast tribo-chemical crater wear. The austenitic white layer in
cutting is caused by deformation, while the twinned martensitic white layer is
caused by quenching in EDM.

24
6
(Manjaiah et al.
2015) TiNiCu
Harder surface has been noticed near the machined surface which was about
59% increase with respect to the base material for longer pulse on time due to
the recast layer thickness and the formation of oxides.
7 (Pramanik et al.
2015) 6061 aluminium alloy
It is observed that the higher wire tension
facilitates steady machining process, which generates low wear in wire
electrode and better surface finish
8 (Tian et al. 2015) Stainless steel based It was noted that WEDM can be used to generate a recast layer on stainless
steel surface.
9
(Sharma et al.
2015) Inconel 706
Observed the reduction in micro voids and micro globules at lower value of
pulse on time and higher values of servo voltage. Thicker recast layer was
noticed at higher value of pulse on time and lower value of servo voltage.
10
(Manjaiah et al.
2015) Ti50Ni45Cu5
The globule of appendages formed around the craters and the intensity of the
crater was evident for the higher surface roughness with an increase in peak
current and pulse-on time during WEDM
11 (Pramanik et al.
2016)
Al-based metal matrix
composites
It was found that initial circular shaped wire deformed during the machining
process as curved front and rear edges and two straight side edges irrespective
of cutting conditions and workpiece materials.
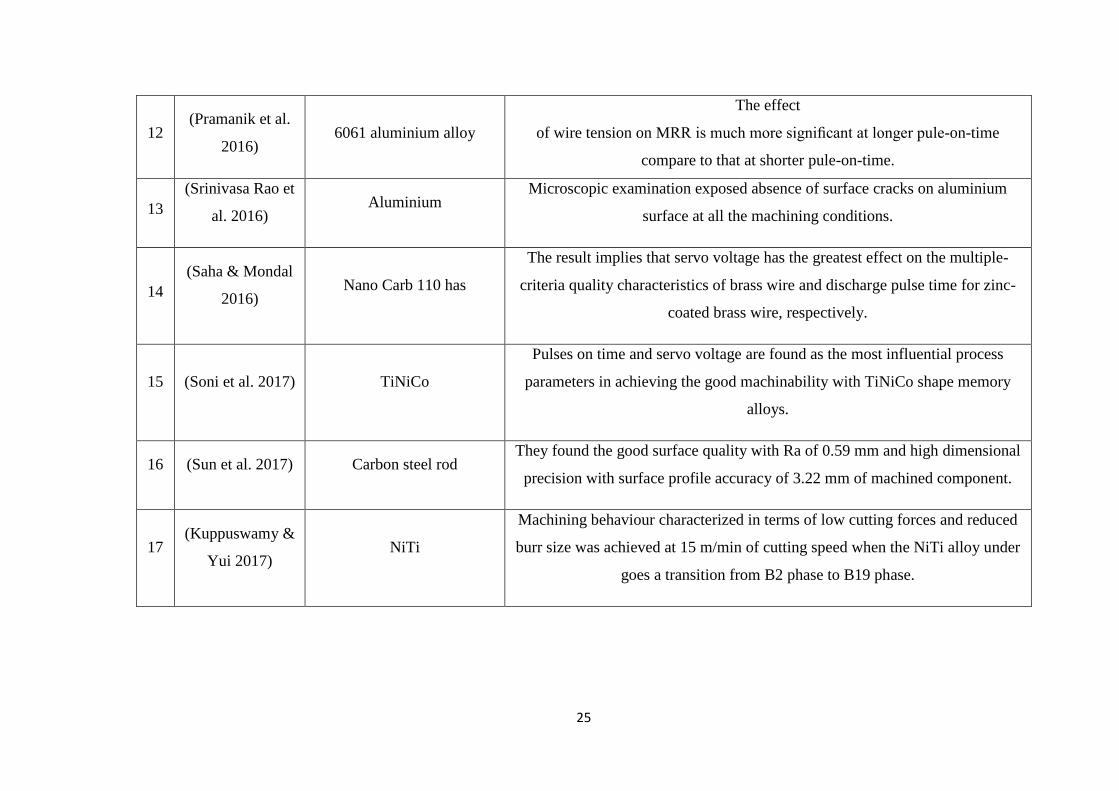
25
12 (Pramanik et al.
2016) 6061 aluminium alloy
The effect
of wire tension on MRR is much more significant at longer pule-on-time
compare to that at shorter pule-on-time.
13
(Srinivasa Rao et
al. 2016) Aluminium
Microscopic examination exposed absence of surface cracks on aluminium
surface at all the machining conditions.
14
(Saha & Mondal
2016) Nano Carb 110 has
The result implies that servo voltage has the greatest effect on the multiple-
criteria quality characteristics of brass wire and discharge pulse time for zinc-
coated brass wire, respectively.
15 (Soni et al. 2017) TiNiCo
Pulses on time and servo voltage are found as the most influential process
parameters in achieving the good machinability with TiNiCo shape memory
alloys.
16 (Sun et al. 2017) Carbon steel rod They found the good surface quality with Ra of 0.59 mm and high dimensional
precision with surface profile accuracy of 3.22 mm of machined component.
17 (Kuppuswamy &
Yui 2017) NiTi
Machining behaviour characterized in terms of low cutting forces and reduced
burr size was achieved at 15 m/min of cutting speed when the NiTi alloy under
goes a transition from B2 phase to B19 phase.

26
18 (Arikatla et al.
2017) Ti-6Al-4V
The WEDMed surface topography shows dominant micro voids, thick white
layer, heat affected zone and micro cracks at high pulse on time and pulse
current and these are low at low pulse on time and pulse current during trim
cuts.
19 (Kumar et al.
2017) Nimonic-90
Topography of machined surface suggests that high discharge energy results in
overlapped and deep craters of large size diameters and high thickness of recast
layer whereas low discharge energy results into fine surface with minimum
recast layer.
20 (Daneshmand et
al. 2017) NiTi-60
The increase in the material removal rate is observed through the use of Al2O3
powder and tool rotation along with increasing current intensity, pulse on time
and voltage.
(Roy et al. 2017) TiNiCu Thicker recast layer has been found with higher MRR and SR at higher pulse
on time.
21 (Mouralova et al.
2018) Ti- 6Al-4V alloy
The analysis of the surface morphology has shown that the surface of all
investigated samples bears traces typical of material to have been completely
molten and subsequently rapidly cooled; as a result, numerous fine surface
micro fissures and cracks got created.

27
2.4 MATERIAL REMOVAL RATE (MRR)
The material removal rate, is an important process factor in manufacturing,
approximately increases in linear proportion with the discharge energy in EDM-
process, and achieves commercially interesting values by using an electrode made of
copper and tungsten (W. Theisen, and A. Schuermann 2004). H C Lin et al. (2001)
investigated the effect of input parameters on MRR during the machining of TiNi
based SMAs through EDM and they found that MRR significantly relates to the
electro discharge energy mode. It increases monotonically with increasing pulse
current, but appears an optimal pulse duration, saying τp= 6-12 μs at Ip=12A to have a
maximum value. Besides, it has a reverse relationship to the product of melting
temperature and thermal conductivity of TiNi SMAs, therefore a longer pulse duration
τp and a lower pulse current Ip should be selected to have a precise EDM machining.
It has been reported that increased the pulse current Ip will increase the current
density. Figure 2.2 shows the MRR versus the pulse duration τp at various pulse
currents Ip for the Ti49Ni51 alloy.
Figure 2.2 MRR versus the pulse duration τp at various pulse currents IP for the
Ti49Ni51alloy (H C Lin et al 2001).
Manish Kumar et al. (2014) investigated that Pulse on Time (Ton) and Pulse off Time
(Toff) are the most significant machining parameter for controlling the MRR. During

28
WEDM, MRR depends on the electrode material, melting temperature of the
electrode and electrode wear rate. The discharge energy increases with growing pulse
duration. The MRR varies with dielectric fluid. The MRR increases linearly with
pulse on duration and when kerosene is used as dielectric fluid, MRR increases till the
optimum point and further reduce. Moreover electrode wear rate (EWR) also
increases with the pulse on time duration, but when using deionized water the EWR is
relatively less compared with kerosene (Chen et al. 1999). Yilmaz et al. (2010)
investigated the effect of single and multi- channel electrodes made of copper and
brass material on MRR. The single channel copper electrode has higher MRR
compared to multichannel copper and brass electrode. Manjaiah et al. (2017) reported
during the WEDM of TiNiCu shape memory alloys that MRR is increases with
increasing in pulse on time while MRR is decreases with increasing servo voltage and
pulse off time. The reason behind the increasing of MRR is that spark intensity is high
at higher pulse on time. Fig. 2.3 exhibits the effects of important process parameters
of WEDM on MRR during the machining of Inconel 706 alloy. It is observed from
the graph that MRR is increases with increased pulse on time while decreases with
increased pulse off time (Fig. 2.3b) and servo voltage (2.3c). The spark intensity is
reduce in both cases when servo voltage and pulse off time are increased and at the
same time spark intensity will be high at higher pulse on time. The trend of MRR was
not constant with respect to wire feed (Fig. 2.3d) and flushing pressure (2.3f) because
of machining error. The servo feed (Fig. 2.3e) do not have much effect on MRR
during the WEDM process (Sharma et al. 2015).

29
Figure 2.3 Effect of WEDM process parameters on MRR (Sharma et al. 2015).
2.5 SURFACE INTEGRITY
Surface integrity is another parameter which is influenced by the machining situations
and indicates the machined surface and subsurface (D.K. Aspinwall 2008). It is a
major contributing factor in processing and performance of the part. The surface
integrity constitutes surface roughness, surface morphology, hardness, residual
stresses and recast or white layer formation. During the non-conventional machining,
the MRR is less compare to the conventional machining. The surface quality obtained
with the non-conventional machining is high compare to the conventional
machining and surface is comparatively less affected by phenomena such as defects,
plastic deformation, phase transformation, micro cracks, work hardened layer and
residual stress (F. Nourbakhsh et al.2013).
2.5.1 Surface roughness
Surface roughness in the machining process which is depends on the machining
process parameters, type of machining tool, fraction and deformation between tool
and workpiece. The selection of process parameters play important role for producing
surface quality through any machining process. Sharma et al. (2015) found that pulse
on time and servo voltage are most influential process parameters during WED

30
machining of Inconel 706 for turbine disk application. Manjaiah et al. (2015) found
that surface roughness increase with increase in pulse on time while surface roughness
decrease with increase in servo voltage. Kumar et al. (2012) reported that increase in
the pulse duration increases the feed rate of wire electrode and extending the pulse
duration to allow greater discharge energy, melt and penetrate into the surface of
work-piece forms the deeper craters. Raj. D et al. (2015) investigated that pulse on
time and pulse off time are the important parameters that influences the surface
roughness while servo feed is found to be almost ineffective. Surface roughness is
also influenced by the wire speed. When the wire speed is lower, the melting of
material is more due to higher energy and higher MRR causes the higher surface
roughness. Spark gap is also important parameter for surface roughness, which is
directly proportional to pulse on time. When the pulse on time increase from 20 µs to
25 µs, spark gap increases (K. Basil, and J. Paul 2013). The order of the importance
for the controllable factors to the average surface roughness mentioned in sequence, i
e. pulse off time, pulse on time, spark gap, and finally the current (N.Z. Khan et al.
2014). In the fig. 2.4, it can be clearly seen that large number of craters or voids has
been created due to high pulse-on time. But as the pulse on time decreases the
numbers of voids are less. As the pulse-off time increases the height of the crater gets
decreased which is the main reason behind the lower surface roughness.
Figure 2.4 (a) SEM image of machined surface: Pulse-on time =0.75µ s, Pulse-off
time=10.2 µ s, Wire feed rate=2 (b) SEM image of machined surface: Pulse-on
time=0.5µ s, Pulse-off time=17µ s, Wire feed rate=3 (Amrish Raj.D et al. 2015)

31
Fig. 2.5 shows that the roughness of the machined surface under increasing current
intensity becomes more and more significant, due to enlarged craters and cracks
formed on the machined surface. This is because at high current intensity more
amount of spark has been produced in the machining zone results in some of the
melted material has been removed through dielectric fluid rest of the melted material
deposited in the form of craters and cracks on the machined surface. (W. Theisen. et
al. 2004).
Figure 2.5 Development of the surface roughness depending on the working current
and the frequency (W. Theisen. et al. 2004).
2.5.2 Surface topography
Surface topography controls friction and transfer layer formation during machining. It
can be either isotropic or anisotropic which is communally measured by the diamond
stylus profile meter. Puri et al. (2005) observed during the WEDM, the surface
topography of the machined surface mainly influenced by the sparking frequency and
the crater size determined by the electrical discharge energy contained in a pulse. The
work piece material which gets melted is not completely removing during the process.
The surface topography presented in Fig. 2.6 reveals that the surface roughness of D2
(air-hardening, high carbon, high chromium tool steel) and H13 materials
(chromium- molybdenum-vanadium alloyed steel) is caused by an uneven structure or

32
surface, globules of debris, shallow craters, pockmarks, voids and cracks. These
effects become more pronounced as the pulse current and pulse-on duration increase
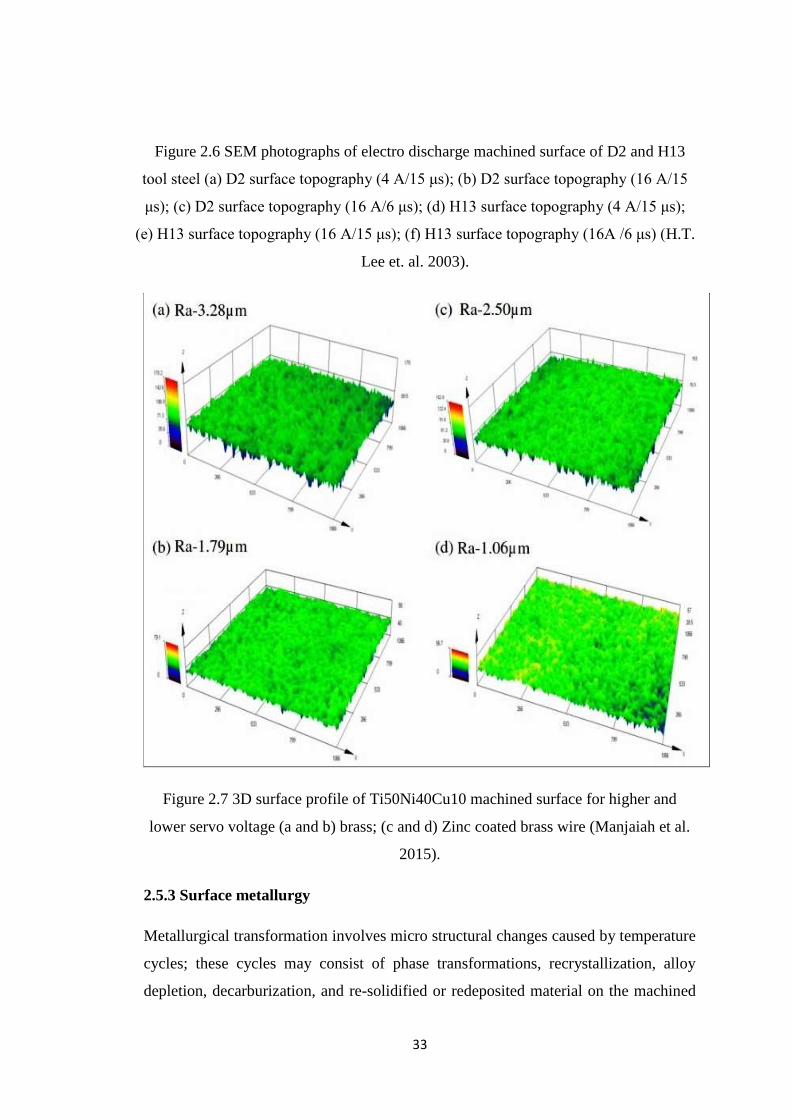
(H.T. Lee et. al. 2003). Similarly Manjaiah et al. (2015) found that servo voltage and
pulse on time are influential parameters. Figure 2.7 reflect the machined surface
topography at higher pulse on time and lower values of servo voltage. Fig. 2.7a and
Fig. 2.7c exhibit the surface topography at 120µs pulse on time and 20V servo voltage
while Fig. 2.7b and Fig. 2.7d reveals the surface topography at 120µs pulse on time
and 80V servo voltage. These figure it is inferred that, surface roughness was high in
both wires (brass and zinc coated) at higher values of pulse on time while at higher
servo voltage roughness of machined surface is low with both wire condition (brass
and zinc coated).
33
Figure 2.6 SEM photographs of electro discharge machined surface of D2 and H13
tool steel (a) D2 surface topography (4 A/15 μs); (b) D2 surface topography (16 A/15
μs); (c) D2 surface topography (16 A/6 μs); (d) H13 surface topography (4 A/15 μs);
(e) H13 surface topography (16 A/15 μs); (f) H13 surface topography (16A /6 μs) (H.T.
Lee et. al. 2003).
Figure 2.7 3D surface profile of Ti50Ni40Cu10 machined surface for higher and
lower servo voltage (a and b) brass; (c and d) Zinc coated brass wire (Manjaiah et al.
2015).
2.5.3 Surface metallurgy
Metallurgical transformation involves micro structural changes caused by temperature
cycles; these cycles may consist of phase transformations, recrystallization, alloy
depletion, decarburization, and re-solidified or redeposited material on the machined

34
surface (Suffi et al. 2010). Surface metallurgy of a wire-cut electro-discharge
machined surface is concerned with the subsurface characteristics, which are usually
termed as altered material zones (AMZ). These alterations, caused by the thermal
energy of spark discharges, are generally in the form of micro cracks, spalling, and
change in hardness, residual stresses, and metallurgical transformations and of course,
heat affected zone (Puri et al. 2005). Machined surface of the work piece always
undergoes various kinds of metallurgical alterations (Ekmeckci et al. 2011). Hsieh
et al. (2013) studied on the machined surface and they found that the XRD patterns of
the EDMed surface for the Ti35.5Ni48.5Zr16 and Ni60Al24.5Fe15.5 alloys are shown in Fig.
2.8, the formation of TiO, NiO and ZrO2 oxides is ascribed to the high activity of Ti,
Ni and Zr atoms with dielectric fluid during the machining. These oxides are
responsible for forming harder surface on the machined surface.
Figure 2.8 The XRD patterns of the EDMed surface layer for: (a) Ti35.5Ni48.5Zr16 alloy
and (b) Ni60Al24.5Fe15.5 alloy (Hsieh et al. 2013).
35
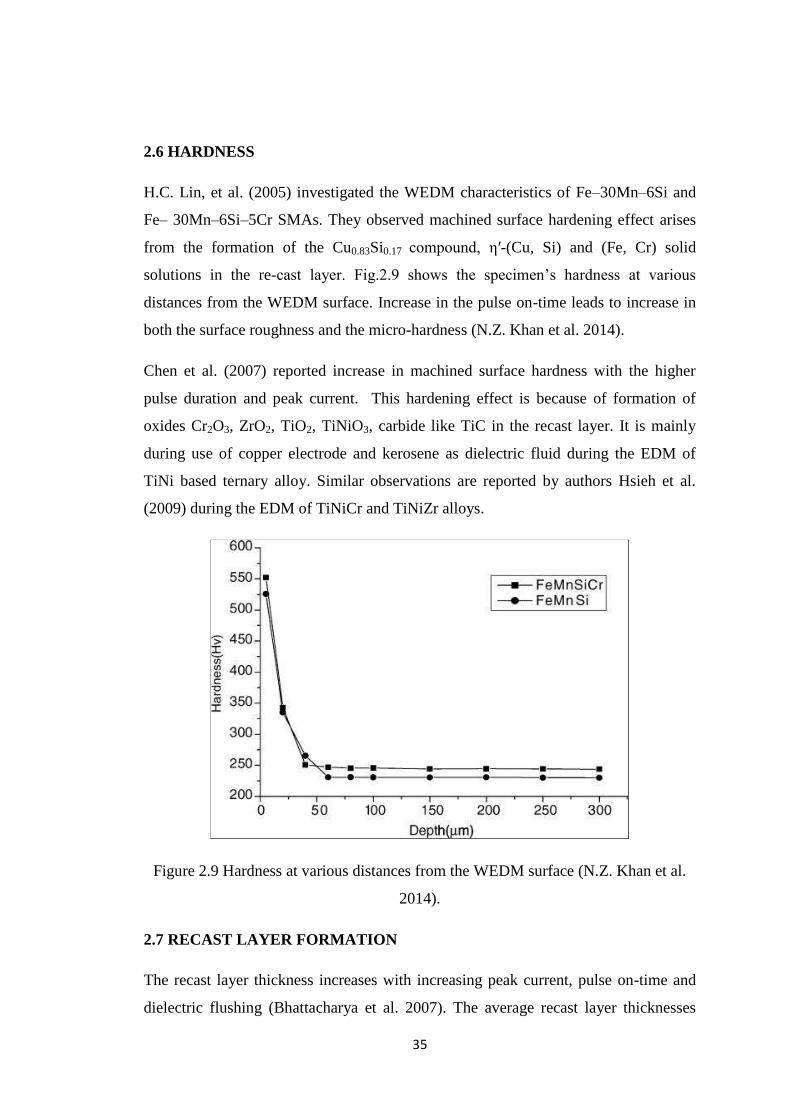
2.6 HARDNESS
H.C. Lin, et al. (2005) investigated the WEDM characteristics of Fe–30Mn–6Si and
Fe– 30Mn–6Si–5Cr SMAs. They observed machined surface hardening effect arises
from the formation of the Cu0.83Si0.17 compound, η′-(Cu, Si) and (Fe, Cr) solid
solutions in the re-cast layer. Fig.2.9 shows the specimen’s hardness at various
distances from the WEDM surface. Increase in the pulse on-time leads to increase in
both the surface roughness and the micro-hardness (N.Z. Khan et al. 2014).
Chen et al. (2007) reported increase in machined surface hardness with the higher
pulse duration and peak current. This hardening effect is because of formation of
oxides Cr2O3, ZrO2, TiO2, TiNiO3, carbide like TiC in the recast layer. It is mainly
during use of copper electrode and kerosene as dielectric fluid during the EDM of
TiNi based ternary alloy. Similar observations are reported by authors Hsieh et al.
(2009) during the EDM of TiNiCr and TiNiZr alloys.
Figure 2.9 Hardness at various distances from the WEDM surface (N.Z. Khan et al.
2014).
2.7 RECAST LAYER FORMATION
The recast layer thickness increases with increasing peak current, pulse on-time and
dielectric flushing (Bhattacharya et al. 2007). The average recast layer thicknesses

36
increases with increase in pulse energy, higher discharge current and longer duration
of pulse-on. The changes in pulse on-time durations is more significant factor than
changes in the peak current for variation in the recast layer thickness and it is
observed that the majority of cracks terminated with in the recast layer or at the
interface of the recast layer without affecting sub surface (Lee H.T. et al. 2003). The
use hydrocarbon-based dielectric fluid leading to micro cracks on recast layers due to
presence of excessive amount of carbon (Ekmekci, et al. 2007). The effect of process
parameters on metal removal rate, re-cast layer and surface finish was studied with
statistical models of the EDM process and the pulse current is critical factor affect the
surface finish (Hung N.P. 1994). The white layer is composed mainly of martensite
and retained austenite, with some dissolved carbide (R. Bormann et al. 1991). The
white layer formed on D2 tool steel and H13 tool steel is presented in Figs 2.10 (a)
and (b) respectively.
Figure 2.10 SEM photographs of (a) D2 tool steel white layer (12 A/15 μs) and (b)
H13 tool steel white layer (4 A/12 μs) (H.T. Lee et. al. 2003).
To increase the life of the tool or product, the recast layer is generally removed,
particularly for applications in which the part is subjected to cyclical stress (aero
engine components) or fluctuating loads (forging and punching tools/dies). This is
achieved either by hand polishing, etching or heat treatment. Alternatively, burnishing
or shot peening is employed in order to impose a compressive residual stress regime.
However, such processes are supplementary and may increase cost and time. With
operations in which repeated high levels of mechanical impact are not a factor,
the EDM recast layer can be beneficial in providing increased abrasion and

37
corrosion resistance. Lin et al. (2005) reported that the re-cast layer of Fe–30Mn–6Si
is much thicker than that of Fe–30Mn–6Si–5Cr SMAs after WEDM. The re-cast layer
consists of the γ-austenite, Cu0.83Si0.17 compound, η′-(Cu, Si) and (Fe, Cr) solid
solutions, and Zn phase. The WEDM Fe–30Mn–6Si and Fe–30Mn–6Si–5Cr SMAs
still exhibit a good shape recovery, but a slight degradation of shape recovery occurs
due to the depression of the re-cast layer. The degradation of shape recovery is more
obvious for the WEDM Fe–30Mn–6Si SMA due to its thicker re-cast layer.
2.8 RESIDUAL STRESSES
Residual stresses are those stresses that remain once a body is at rest and at
equilibrium with its surroundings without mechanical loading (Withers 2001). EDM
generates residual stresses; this is mainly due to the non-homogeneity of heat flow
and metallurgical transformations (Dijcket et al. 1974). An increase of their
magnitude is observed at the surface layer with increasing pulse energy. Since the
integrity of the EDM surface is degraded by the unstable arcing which always occurs
during the machining process, the quality of an EDM product is evaluated in terms of
surface integrity, which is characterized by the surface roughness, presence of surface
cracks, and the residual stresses. The residual material re-solidifies on the machined
surface to form a hard skin on the work piece. Thus, an extreme fast heating, melting
and vaporization is followed by a fast cooling of the work piece material in the
sparking zone during the process of material removal. This causes a massive change
in both on the surface topography as well as in the surface metallurgy of the work
piece (Puri, et al. 2005). It has been observed that WEDM process creates generally
tensile residual stress on the machined surface. Figure 2.11 that the machine surface
stress is in tensile nature but compressive residual stress has been noticed after the
150µm distance from the machined surface (Ghanem et al. 2011).

38
Figure 2.11 Variation of residual stress on the machined specimens (Ghanem et al.
2002)
Literature survey based on the process parameters of WEDM process are presented in
Table 2.2. Effects of process parameters on machining responses such as MRR and
SR have been discussed in the above literature survey. However machined surface
characterization based literature survey were also discussed. Further literature survey
reveals the mathematical modelling and optimization techniques.

39
Table 2.2 Literature survey based on the process parameters of WEDM process
No. Authors Work material Process parameters Dielectric
Fluid
Tool
material
Tool
diameter
1 (Kuriakose &
Shunmugam 2004) Ti6Al4V
Time between two pulses, Pulse duration, Servo
control reference voltage, Maximum servo-speed
variation, Wire speed, Wire tension and Injection
pressure
Deionized
water
Zinc-coated
brass 0.25 mm
2
(Ramakrishnan &
Karunamoorthy
2006)
Tool steel Pulse on time, wire tension, delay time, wire feed
speed and Ignition current intensity
Deionized
water of
Zinc coated
brass 0.25mm
3 (Aspinwall et al.
2008) Ti–6Al–4V Current, Voltage, On/Off time and Frequency
Deionised
water
zinc coated
brass 200 mm
4 (Singh & Garg
2009)
Hot die steel
(H-11)
Pulse on time , Pulse off time, Gap voltage, Peak
current, Wire feed and Wire tension
De-ionized
water Brass wire 0.25 mm
5 (Hsieh et al. 2009)
Ti35.5Ni49.5Zr15
and
Ti50Ni49.5Cr0.5
Wire electrode, Pulse duration, Pause duration,
Duty factor, Gap voltage, and Flushing pressure.
De-ionized
water
Brass 0.25mm
6 (Antar et al. 2011)
Ti-6Al-2Sn-
4Zr-6Mo
(hereafter
Voltage, Ignition current, On-time, Off-time,
Flushing pressure, Wire speed, Wire tension and
Wire offset
De-ionised
water Brass wire 0.25 mm
7 (Jangra et al. 2012) Cemented Peak current, Pulse-on time, Micro-second, Pulse- Distilled water Zinc coated 0.25mm

40
tungsten
carbides (WC)
off time, Micro- second, Wire speed, Wire tension,
Servo voltage and Dielectric flow.
brass wire
8 (Sivaprakasam et
al. 2013)
Aluminium
Matrix
Composite
(A413-9% B4C)
Voltage, Capacitance, Feed rate and Symbol Commercial
grade EDM oil
Zinc coated
copper wire 70µm
9 (Shandilya et al.
2013)
SiCp/6061 Al
MMC
Servo Voltage, Pulse-on time, Pulse-off time and
Wire feed rate
Deionized
water
Diffused
brass wire 0.25 mm
10 (Kumar et al. 2013) Pure titanium Pulse on time, pulse off time, peak current, spark
gap voltage, wire feed and wire tension were
Deionized
water Brass wire 0.25 mm
11 (Goswami &
Kumar 2014) Nimonic 80A
Pulse-on time, pulse-off time, spark gap set
voltage, peak current, wire feed and wire tension.
De-ionized
water Brass wire 0.25 mm
12 (Shivade & Shinde
2014) D3 tool steel
Pulse-on time, Pulse-off time, Peak current and
Wire speed
De-ionized
water Brass wire 0.25 mm
13 (Azhiri et al. 2014)
Al/SiC metal
matrix
composite
Pulse on time, pulse off time, gap voltage,
discharge current
Mineral oil-
based
dielectric
Copper and
brass 0.1 mm
14 (Luo et al. 2014) YG15 steel
Pulse-on time, Pulse-off time, Cutting feed rate,
Wire tension, Wire speed and Water pressure
De-ionised
water
Brass wire
Brass wire 0.25 mm
15 (Saha & Mondal
2016) Nano Carb 110
Discharge pulse time, Discharge stop time, Servo
voltage, Wire tension and Wire feed rate
Deionized
water
Brass and
zinc-coated 0.25 mm

41
brass
16 (Kumar et al. 2016) Pure titanium
Pulse on time, Pulse off time, Peak current, Spark
gap voltage, Wire feed and Wire tension
Deionised
water Brass 0.25 mm
17 (Ayesta et al. 2016) Inconel 718 Intensity, Pulse off time, Voltage and
Servo voltage
Deionized
water Brass wire 0.25mm
18 (Soundararajan et
al. 2016) A413 alloy
Dielectric medium, wire feed, wire tension, servo
voltage, flushing pressure, servo feed, peak voltage
Pulse on time, Pulse off time and Peak Current.
De-
mineralized
water
Zinc coated
brass wire 0.25 mm
19 (Chalisgaonkar &
Kumar 2016) Pure titanium
Pulse on time, Pulse off time, peak current, wire
feed rate, wire tension and Servo voltage.
De-ionized
water
Zinc-coated
and uncoated
brass wire
0.25 mm
20 (Sharma et al.
2016) Inconel 706
Polarity, Discharge current, Discharge voltage,
Servo feed, Flushing pressure, Current speed,
Dwell time and Corner control factor
De-ionized
water Brass wire 0.25 mm
21 (Mouralová et al.
2016)
Tool steel
X155CrVMo12-
1
Grinding wheel ,Wheel speed, Table speed Cross
feed, Down feed and Number of pass
deionized
water Brass wire 0.25 mm
22 (Chen et al. 2017) SKD-11 Pulse on time, pulse off time, reference voltage,
wire speed and Magnetic induction intensity.
Deionized
water Copper wire 0.25 mm

42
2.9 MATHEMATICAL MODELING
Optimization techniques play important role in the achieving the best result for a
given problem under given circumstances. Any optimization is possible through exact
algorithms to find an optimal solution. The model exhibits the relationship among
decisions, constraints and objectives. Some researchers correlating their experimental
results with modelling techniques, and they developing equations for the output
responses from the input parameters. In this section literature survey discussed
based on the modelling and optimization techniques to optimize the WEDM process
parameters. However to investigate the experimental error, based on the error analysis
literatures have been included.
Chakravorty et al. (2012) investigated different principal component analysis (PCA)
based techniques using L18 orthogonal array to optimize EDM processes and it was
observed that PCA based proportion of quality loss reduction (PQLR) method yielded
best results . Sahaet al. (2013) reported that Neuro-Genetic technique has potential in
finding several optimal input machining conditions which can satisfy wide
requirements of a process engineer and help in efficient utilization of WEDM in
industry. Nayak et al. (2015) presented a multi response optimization approach to
determine the optimal process parameters in wire electrical discharge machining
process during taper cutting operation using new metaheuristic algorithm, called as
Harmonic search algorithm. Vundavilli et al. (2012) studied on the optimization
techniques to obtain the best process parameters of WEDM, They used genetic
algorithm (GA) and Particle swarm optimization (PSO) and found that both the
optimization approaches show similar trend in pareto optimal fronts but PSO produce
optimal front in less time compared to GA. Pradhan (2013) studied the effect of
process parameters on MRR, tool wear ratio (TWR) and overcut (OC) of EDM with
AISI D2 tool steel. The experimental results obtained were optimized using grey
relational analysis (GRA), and the weights of the responses were determined using
PCA. Gauriand Chakraborty (2009) discussed about some modifications in the PCA-
based approach and two sets of experimental data published by the past researchers
were analysed using this modified approach. It was observed that the PCA based grey

43
relation analysis has been successfully used for multi-objective optimization (Khan et
al. 2010 and Lu et al. 2009).
2.9.1 Response surface methodology (RSM)
BOX and Wilson Suggested RSM in 1951 to explore the relationship between several
explanatory variables and one or more response variables. The most essential
application of this approach is to utilize a series of designed experiments to get best
response. Commonly a second-degree polynomial model is used in this approach.
Even though these models are just a prediction, such a model is easy to estimate and
apply, even when little is known about the process (Hewidy et al. 2005). Kumar et al.
(2017) developed empirical models for material removal rate and wire wear ratio, in
terms of six prominent WEDM process parameters for the machining of pure titanium
by using response surface methodology. They noticed that optimum setting of process
parameters can be adjusted in order to minimize the wire wear ratio, Palani et al.
(2013) optimized the Micro WEDM process parameters such as voltage, capacitance,
and feed rate on machining for the better material removal rate (MRR), kerf width
(KW), and surface roughness (SR) by using response surface methodology for the
machining of Aluminum Matrix Composite (A413-9% B4C. The better MRR, KW
and SR have been found at the optimized process parameters.
2.9.2 Grey relational analysis (GRA) method
Deng (1989) proposed a Grey relational analysis approach. Grey relational analysis is
a multi-objective optimizations technique which helps in decision-making process and
guides the selection of best combination of process parameters to rank the materials
with respect to several criteria (Joseph et al. 2006). Lin et al. (2002) adopted the
grey relational analysis and the Fuzzy-based Taguchi method for optimising the EDM
process. They optimized EDM process parameters such as pulse on time, duty factor,
and discharge current to find the best machining responses (electrode wear ratio,
material removal rate, and surface roughness). Grey relational analysis method was
found more straightforward than Fuzzy-based Taguchi method. However grey
relational grade indicate the best combination of process parameters based on the rank
of process parameters (Lin et al. 2004). Similarly Anand et al. (2014) examined

44
WEDM process parameters (pulse-on time, pulse-off time, peak current and wire
speed) to fine best machining time, MRR, gap current and dimensional deviation by
using grey relational analysis method. Taguchi Design of experiment method was
used for experimental plan to conduct the machining on D3 tool steel. During their
study they have been proved that the potential of GRA to optimized process
parameters successfully for multi-objective characteristics.
2.9.3 Entropy measurement method
Entropy measurement method is an objective weighting method. Discrete type of
entropy is used in grey entropy measurement for properly conduct weighting analysis
(Mineta et al. 2011). Pradhan (2013) have been optimized the EDM process
parameters (pulse current, pulse duration & pulse off time) for maximum MRR and
minimum SR and tool wear ratio during the machining of D2 steel. He has used a
combination of multi-objective optimization techniques such as grey relational
analysis, response surface methodology and entropy measurement methods. Where
the entropy measurement method used for determined the percentage weightage of the
grey relational coefficients and finally Grey relational grades. Similarly Rao et al.
(2008) the process parameters of laser cutting process which minimized the kerf
width, kerf taper, and kerf deviation together during laser cutting of a thin sheet of
SUPERNI 718 nickel-based super alloy.
The review of literature based on optimization techniques are given in Table 2.3. It
has been observed from the literature that the combination of RSM & GRA with
entropy measurement method is rarely used and these combinations of optimization
techniques give good setting of process parameters. Therefore in the present study
will be used the combination of these three optimization techniques for optimal
setting of WEDM process parameters. The roll of each optimization technique can be
seen in Fig. 2.12. Further literature is based on the error analysis has been discussed.

45
Figure 2.12 Flow chart for optimization techniques (Pradhan 2013).

46
Table 2.3 Literature survey on optimization techniques
No. Authors Material Modelling/Optimization
techniques
Type of
optimum
results
Process Machining
responses
1 (Hewidy et al.
2005) Inconel 601
Response surface methodology
(RSM).
Multi
Response WEDM SR and MRR
2
(Ramakrishnan &
Karunamoorthy
2006)
Tool steel Taguchi’s robust design Multi
Response WEDM
Wire wear ratio,
MRR and SR
3 (Rao & Yadava
2009)
Nickel-based super
alloy (SUPERNI 718)
Grey relational analysis with
entropy measurement
Multi
Response WEDM MRR and SR
4 (Çaydas et al.
2009) AISI D5 tool steel
Principal component analysis
(PCA), Adaptive neuro-fuzzy
inference system (ANFIS)
Multi
Response WEDM
White layer
thickness (WLT)
and the average
surface roughness
5 (Datta &
Mahapatra 2010) ROBOFIL 100 high
Response surface methodology
and Grey relational analysis
theory
Multi
Response WEDM
MRR, SR and Kerf
width
6 (Singh et al. 2010) Tungsten carbide-cobalt
composite Grey relational analysis
Multi
Response
Conventional
grinding and
EDM
MRR, wheel
wear rate and
average surface
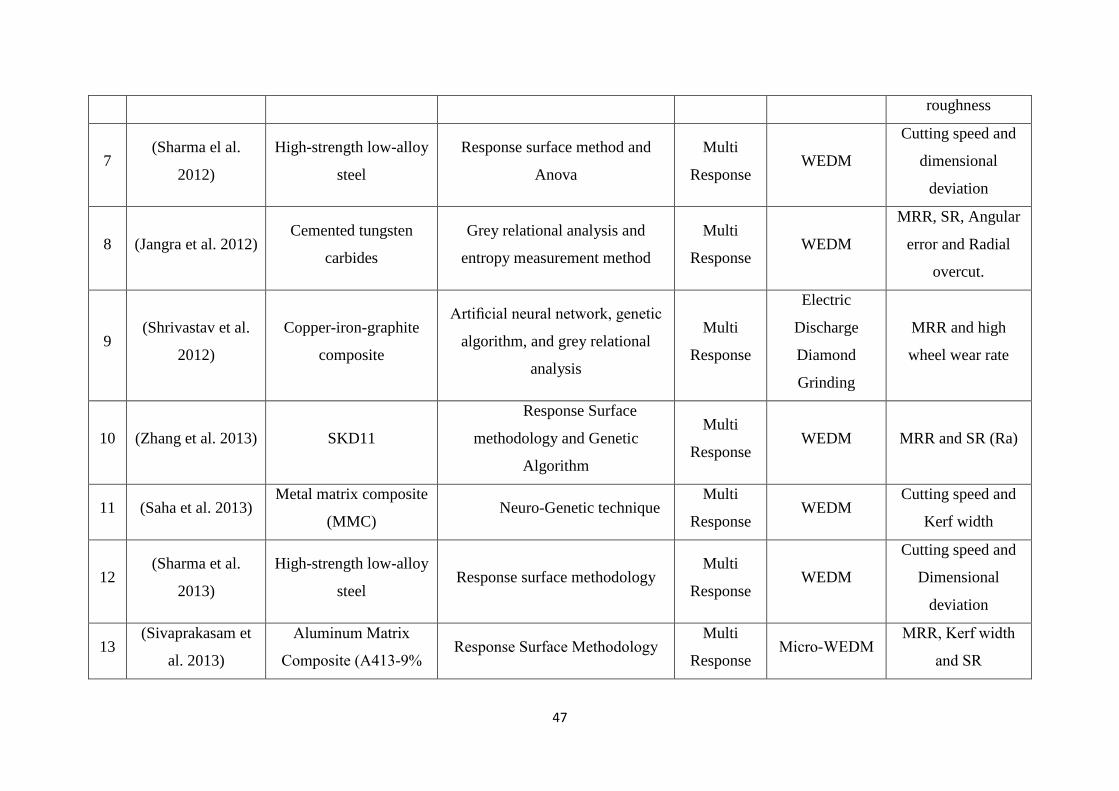
47
roughness
7 (Sharma el al.
2012)
High-strength low-alloy
steel
Response surface method and
Anova
Multi
Response WEDM
Cutting speed and
dimensional
deviation
8 (Jangra et al. 2012) Cemented tungsten
carbides
Grey relational analysis and
entropy measurement method
Multi
Response WEDM
MRR, SR, Angular
error and Radial
overcut.
9 (Shrivastav et al.
2012)
Copper-iron-graphite
composite
Artificial neural network, genetic
algorithm, and grey relational
analysis
Multi
Response
Electric
Discharge
Diamond
Grinding
MRR and high
wheel wear rate
10 (Zhang et al. 2013) SKD11
Response Surface
methodology and Genetic
Algorithm
Multi
Response WEDM MRR and SR (Ra)
11 (Saha et al. 2013) Metal matrix composite
(MMC) Neuro-Genetic technique
Multi
Response WEDM
Cutting speed and
Kerf width
12 (Sharma et al.
2013)
High-strength low-alloy
steel Response surface methodology
Multi
Response WEDM
Cutting speed and
Dimensional
deviation
13 (Sivaprakasam et
al. 2013)
Aluminum Matrix
Composite (A413-9% Response Surface Methodology
Multi
Response Micro-WEDM
MRR, Kerf width
and SR

48
B4C)
14 (Kumar et al.
2013) Pure titanium
Response surface methodology
and Box–Behnken design
Multi
Response WEDM
Machining rate, SR,
Dimensional
deviation and Wire
wear ratio
15 (Pradhan 2013) AISI D2 tool steel
Response surface methodology,
grey relational analysis and
entropy measurement
Multi
Response WEDM MRR and SR
16 (Goswami &
Kumar 2014) TiNi Grey relational analysis
Multi
Response WEDM
MRR and Wire
wear ratio
17 (Azhiri et al. 2014) Al/SiC metal matrix
composite (MMC)
Adaptive neuro-fuzzy inference
system, Grey relational analysis
Multi
Response WEDM
Cutting velocity and
SR
18
(Sivaprakasam et
al. 2014) Ti6Al4V Genetic Algorithm
Multi
Response Micro WEDM
MRR, Kerf width
and SR
19 (Shivade & Shinde
2014) AISI D3 tool steel Grey relational analysis method
Multi
Response WEDM
MRR, Dimensional
deviation, Gap
current and
Machining time
20 (Saedon et al.
2014) Titanium alloy ANOVA; Grey relational analysis
Multi
Response WEDM
SR, Cutting rate and
MRR
(Varun et al. 2014) EN 353 work Grey relational analysis with Multi WEDM MRR, SR, and

49
genetic algorithm Response cutting width
21 (Kumar et al.
2015)
Metal matrix
composites Grey relational analysis
Multi
Response WEDM Kerf and Roughness
22 (Bijeta et al. 2015) TiNi Harmonic search algorithm Multi
Response WEDM
MRR and
Roughness
23 (Adalarasan et al.
2015) Al6061/SiCp/Al2O3
Grey based response surface
method
Multi
Response WEDM
kerf
width, surface finish
and cut edge slope
24 (Bhuyan et al.
2015)
Al-18wt.%SiCp metal
matrix composite
VIKOR and Entropy Weight
method
Multi
Response EDM
MRR, TWR, Radial
over cut and SR
25 (Soundararajan et
al. 2016) A413 alloy Response surface methodology
Multi
Response WEDM
Cutting velocity,
Kerf width , MRR
and SR
26 (Saha & Mondal
2016) NanoCarb 110
Taguchi · Principle Component
Analysis and Response surface
methodology
Multi
Response WEDM
MRR, Machining
time and Ra (µm)
27 (Dhuria et al.2016) Ti–6Al–4V Entropy‑based grey relational
analysis
Multi
Response
Ultrasonic
machining
MRR and Tool
wear rate
28 (Chen et al. 2017) SKD-11 Support vector regression and
Particle swarm optimization
Multi-
Objective
WEDM MRR and Surface
quality

50
2.10 PREDICTION OF WEDM RESPONSES
The various techniques used for prediction of WEDM responses such as artificial
neural network (ANN), response surface methodology (RSM), grey prediction,
adaptive neuro-fuzzy inference system, feed forward back propagation neural
network, multiple regression analysis , group method data handling technique, box–
behnken design etc. Lee & Liao (2007) used Grey prediction technique to predict the
cutting speed of WEDM process. Present literature shows the prediction of main
WEDM performances such as material removal rate and surface roughness by using
various prediction techniques.
2.10.1 Prediction of MRR and SR
Ramakrishnan & Karunamoorthy (2008) predicted WEDM responses such as material
removal rate and surface roughness by using artificial neural network (ANN) as a
prediction tool for the machining of Inconel 718 alloy. Similarly others are adopted
artificial neural network method for prediction of WEDM responses such as Rao et al.
(2010) predicted material removal rate during the machining of Aluminium BIS-
24345 alloy, Ugrasen et al. (2014) predicted dimensional accuracy, surface roughness
and material removal rate for machining of Stavax material and Surya et al. (2017)
predicted surface roughness and material removal during the machining of Aluminum
7075. However some other prediction techniques were implemented for WEDM
responses, ANN-linear regression mathematical model was used for prediction of
surface roughness, waviness and material removal rates of WEDM on Udimet- L605
(Singh Nain et al. 2017). In this order Akkurt (2013) adaptive neuro-fazzy inference
system method for prediction surface roughness during the machining of Tool steel.
While Pant et al. (2014) used feed forward back propagation neural network method
for surface roughness for the machining of DC 53 die steel.
Some researchers they have adopted more than one prediction techniques to predict
WEDM responses are follows. Rao et al. (2017) predicted surface roughness by using
artificial neural network and supporting vector machines (SVM). Material removal
rate and surface roughness were predicted by adopted network-based fuzzy inference
system and modified genetic algorithm (Sarkheyli et al. 2015). Box–Behnken design

51
and response surface methodology was used for prediction surface roughness by Das
et al. (2017). Ugrasen et al. (2014) adopted ANN, Group Method Data Handling
Technique (GMDH) and Multiple Regression Analysis (MRA) for the prediction of
WEDM performances and found that the ANN was more accurate. Similarly
Shandilya et al. (2013) compared ANN and RSM predicted with experimental values.
Moreover they also found that ANN prediction technique gives more accurate than
RSM prediction technique.
It is observed from the above literature that ANN prediction technique is more
suitable than other prediction techniques because it predicts more accurately.
Therefore, in the present study ANN prediction technique will be considered to
predict the WEDM responses.
2.11 SUMMARY
Based on the above literature survey it can be inferred that during the conventional
machining of SMA materials, higher tool wear and lower surface quality are
commonly observed phenomenon, due to their high stain hardening effect, pseudo
elastic behaviour and high toughness. Thus, SMA’s can be effectively machined by
non- conventional machining processes. Hence, there is scope for exploring the
possibilities of applying WEDM process on TiNi based materials. Based on the
literature survey research gaps has been found which are follows-
From the literature it is understood that addition of third element to TiNi result
in improvement of specific properties. The addition of cobalt as alloying
element to TiNi binary shape memory alloy results in changes in
transformation energy and mechanical strength (stiffness and yield strength).
Hence there is scope for understanding the machining characteristics of
TiNiCo systems with different percent addition of cobalt. In this regards, the
proposed study shall be extended to explore the machinability aspect of
ternary TiNiCo shape memory alloys.

52
Machining performance such as material removal rate and surface roughness
found the most significant performances of WEDM process. Hence there is
scope to measure these responses after the machining of TiNiCo alloy.
Also the machining performance evaluation depends on the microstructures,
surface topography, recast layer thickness, microhardness and residual
stresses. Therefore there is scope to study of these characterizations on
machined surface.
Various optimizations techniques are adopted by researchers to optimize the
best combination of process parameters such as GRA and RSM. But the
combinations of optimizations techniques are rarely used. Hence there is lot of
scope of combination of multi-objective optimization techniques for getting
optimal setting of WEDM process parameters.
Analysis has been carried out rarely after the machining to examine the error
between experimental and predicted WEDM responses. Therefore scope is
there to find the error in between experimental and predicted WEDM
responses.
2.12 OBJECTIVES OF CURRENT RESEARCH WORK
The following specific objectives have been derived from literature survey.
1. Development of Ti50Ni49Co1, Ti50Ni45Co5, and Ti50Ni40Co10, shape memory
alloys through vacuum arc melting.
2. Wire electro discharge machining of developed alloys by using L-33
orthogonal array which is created by response surface design method. To find
the optimal setting of process parameters for better MRR and SR a
combination of multi-objective optimization techniques will be used.
3. Machined surface characterization with respect to machined surface
morphology, machined surface topography, recast layer thickness, micro
hardness and residual stresses.
4. For further study two process parameters will be considered for machining of
selected alloys. Detailed characterization of machined surface obtained at
higher and lower values of MRR and SR.

53
5. ANN will be used as a prediction technique for the error analysis WEDM
responses such as material removal rate and surface roughness.

54
CHAPTER 3
EXPERIMENTAL PROCEDURE
This chapter contains description of experimental equipment’s and procedures
adopted for development of Ti50 Ni50-xCox (x=1, 5 and 10 at. %) shape memory alloy,
WEDM machining at optimized process parameters and characterization of machined
surface.
3.1 DEVELOPMENT OF SHAPE MEMORY ALLOYS
Commercially available Titanium (99.3% purity), Nickel (99.90%) and cobalt
(99.5%) were charged in to copper crucible in vacuum arc melting furnace to melt
SMA of composition Ti50Ni50-xCox (1, 5 and 10 at. %). Tungsten electrode was used
for sparking and melting in an inert argon atmosphere. Fig. 3.1 depicts the setup of
vacuum arc melting furnace. TiNi based alloys are very reactive to oxygen, nitrogen
and carbon to form oxides and nitrides. Slight variation in the composition affects the
transformation properties as these alloys are extreme sensitivity to impurities. In order
to avoid these contaminations from the atmosphere and to ensure high purity of the
ingot, melting was carried out in vacuum atmosphere. Fig. 3.2 shows the Vacuum arc
melting chamber (a) raw material placed in the copper crucible, (b) Melted buttons
and (c) Rectangular block of as-cast alloy.
Figure 3.1 Setup of vacuum arc melting furnace

55
Figure 3.2 Vacuum arc melting chamber (a) raw material placed in the copper
crucible, (b) Melted buttons and (c) Rectangular block of as-cast alloy.
Vacuum is created using the standard procedure, later the air present inside the
chamber is flushed out of the system by rough pumping and the vacuum of 10-5
mbar
was maintained and followed by backfilling of the argon gas. This is required in order
to remove impurities present in the chamber and easy movement for TIG melting rod.
The arc melting is carried out in argon purged environment to melt the material in the
form of buttons. The melting and re-melting of buttons is six times in order to achieve
homogeneity of the alloy. The materials were melted into button shape followed by
further melting into rectangular blocks of size 50mm x 12mm x 10mm.The similar
procedure is followed for different composition, and composition of the developed
alloys is shown in Table 3.1.

56
Table 3.1 Composition (at. %) of TiNiCo alloys.
Alloys Ti (at. %) Ni (at. %) Co (at. %)
1 50 49 1
2 50 45 5
3 50 40 10
3.2 EDX AND PHASE ANALYSIS OF AS-CAST TiNiCo ALLOYS
Energy dispersive X-ray (EDX) analysis was performed for as-cast materials using
“ZEISS, SEMV018 EDX spectrometer” shown in Fig. 3.3 for the confirmation of the
presence of alloying elements in developed alloys. Fig. 3.4 a, Fig. 3.4 b and Fig. 3.4 c
clearly indicate the percentage of alloying elements of Ti, Ni, and Co alloy for each
developed alloy. The phase analysis was carried out of as-cast alloy by using Bruker
D8 advance using CuKα radiation and 2θ scanning rate was 2°/min. B2 austenite
phase is present in the as cast alloy with the weak appearance of peaks belongs to B
19’ martensite, which can be seen in Fig. 3.5 for Ti50Ni49Co1 alloy, Fig.3.6 for
Ti50Ni45Co5 alloy and Fig. 3.7 for Ti50Ni40Co10 alloy. Similar kind of phases has been
observed in TiNiCo alloy by Mohammad et al. (2014).
Figure 3.3 Scanning electron microscope with EDAX attachment.

57
Figure 3.4 EDAX analysis of as cast alloys (a) for Ti50Ni49Co1 alloy (b) Ti50Ni45Co5
alloy and (c) Ti50Ni40Co10 alloy.
Figure 3.5 XRD analysis of as cast Ti50Ni49Co1 alloy.

58
Figure 3.6 XRD analysis of as cast Ti50Ni45Co5 alloy.
Figure 3.7 XRD analysis of as cast Ti50Ni40Co10 alloy (Soni et al. 2017).

59
3.3 WIRE ELECTRO DISCHARGE MACHINING
WED machine (Model Electronica ELPULS15 CNC) was used for machining of
shape memory alloys and is shown in Fig. 3.8. Pulse on time (Ton), Pulse off time
(Toff), Servo voltage (SV), Servo feed (SF) and Wire speed (WS) were selected as
input process parameters. Based on the trial experiments, parameters were selected at
different levels and are shown in Table 3.2. Brass wire of diameter 0.25mm was used
as the tool electrode (cathode) and workpiece as anode for electrical discharge and
distilled water was used as dielectric fluid in the machining process. WEDM
machining of TiNiCo shape memory alloys were carried out with respect to L-33
orthogonal array shown in Table 3.3 which is created by response surface design
(DOE) by using Minitab 17 Software. Material removal rate and surface roughness
were considered as output responses of wire electro discharge machining process.
Table 3.2 Input process parameters and their levels.
Input parameters Levels
1 2 3 4 5
Pulse on time (µs) 105 110 115 120 125
Pulse off time (µs) 28 35 42 49 56
Servo voltage (V) 20 30 40 50 60
Servo feed (mu) 2160 2170 2180 2190 2200
Wire speed (m/min) 2 3 4 5 6
Table 3.3 L-33 Orthogonal array.
Run
Input process parameters
Ton Toff SV SF WS
1 120 35 50 2170 5
2 110 49 50 2190 3
3 115 42 40 2180 6
4 115 42 40 2160 2
5 110 35 50 2190 5

60
6 110 49 30 2170 3
7 110 35 50 2170 3
8 120 49 50 2170 3
9 120 49 30 2170 5
10 120 49 50 2190 5
11 115 42 40 2180 4
12 110 49 50 2170 5
13 110 49 30 2190 5
14 120 35 30 2190 5
15 125 42 40 2180 6
16 120 35 30 2170 3
17 120 42 40 2180 4
18 115 42 40 2180 4
19 110 35 30 2170 5
20 120 49 30 2190 3
21 110 35 30 2190 3
22 120 35 50 2190 3
23 115 42 40 2180 2
24 115 42 60 2180 4
25 105 42 40 2180 4
26 115 42 30 2180 4
27 115 42 20 2180 4
28 120 42 40 2180 6
29 115 56 40 2180 4
30 115 42 40 2180 3
31 115 42 40 2200 4
32 115 28 40 2180 4
33 125 42 40 2180 4

61
3.4 MEASUREMENT OF OUTPUT RESPONSES
From the literature survey it has been observed that material removal rate and surface
roughness are most important output responses of WEDM process. Therefore these
two responses were considered for the present study. Measurement of WEDM
responses such as material removal rate and surface roughness was carried out.
Further the process parameters are optimized to obtain low surface roughness with
high material removal rate.
Figure 3.8 Wire EDM
3.4.1 Material removal rate
Material removal rate is a significant response for production of any product in the
manufacturing industries. In the current investigation MRR was calculated using
equation 1 (Manjaiah et al. 2015).
MRR (mm3/min) = Cutting speed x Kerf width x height of work piece ---------- (1)
Where average cutting speed (mm/min) of each experimental run was considered for
measurement of material removal rate.
Kerf width (mm) = 2 x spark gap (0.125mm) + diameter of wire (0.250 mm)

62
Workpiece height was 10mm during the machining.
3.4.2 Surface roughness (Ra)
The “surface roughness tester SJ-301 (Mitutoyo) was used to record the surface
roughness of the machined surface. The roughness of each machined surface was
measured at three different locations and the average surface roughness (Ra) was
reported in the present study. The cut off length of 0.8 mm, evaluation length of 3
mm, and the stylus speed of 0.25 mm/s was used to record the surface roughness.
3.5 OPTIMIZATION TECHNIQUES
The best combinations of process parameters are obtained through hybrid
combination of optimization techniques namely grey relational analysis, entropy
measurement method and response surface design methodology. Fig.3.9 indicates the
relation between combinations of these optimization techniques.
Figure 3.9 Flowchart showing hybrid combinations of optimization techniques.
Measurement of output responses (MRR and SR)
Normalization of results
Calculate the deviation sequence
Calculation of grey relational coefficient
Analysis of grey relational grade using Entropy measurement method
Analysis of grey relational grade using RSM
Finding optimal process parameters

63
3.5.1 Grey relational analysis (GRA)
GRA is one of the most practical analytical optimization methods. GRA provides
suitable tools for examining a rank of order of multiple objects with resemblance from
an objective (Majhi et al. 2013). GRA requires limited information to estimate the
behavior of an uncertain system and discrete data problem. If the sequence range is
large, the factors are effaceable therefore data pre-processing is an important steps to
manage the factors of GRA (Pandey et al. 2014). The range of data pre-processing is
from zero to one (Raju et al. 2016). For the data pre-processing, there are two
conditions of normalization in the present study namely higher the better which will
be used in the normalization of MRR and another one is lower the better for
normalization of SR values. Table 3.4 indicates the two conditions of normalization.
Table 3.4 Conditions of normalization.
S. No. Conditions Equations
1 Lower is better ……..(2)
2 Higher is better …….(3)
where i = 1, 2n, k = 1, 2, y, p; 𝑋𝑖∗ (k) is the normalized value of the k
th element in the
ith
sequence, max Xi (k) is the largest value of Xi (k), and min Xi (k) is the smallest
value of Xi(k), n is the number of experiments and p is the number quality
characteristics.
After the normalization, grey relational co-efficient (γ) are calculated, this shows the
interaction between optimal and actual normalized experimental results.
.......... (4)
i=1; . . . ; n; k= 1; . . . ; p
Where Δ0,i (k) = |x0(k)−xi(k)| is the difference of the absolute value called deviation
sequence of the reference sequence x0(k) and comparability xi(k). The ξ is
distinguishing coefficient or identification coefficient. In general, it is set to 0.5. The
Grey relational grade (GRG) is a weighting-sum of the grey relational coefficients
and it is defined as
)(min)(max
)(min)()(*
kXkX
kXkXkX
ii
iii
)(min)(max
)()(max)(*
kXkX
kXkXkX
ii
iii
max)(
maxmin))(()(
,0
0
kkxk
i
i

64
…….. (5)
Where βk represents the weighting value of the kth
.
Performance characteristic, and .
3.5.2 Entropy measurement method
Entropy measurement method is an objective weighting method. Discrete type of
entropy is used in grey entropy measurement for properly conduct weighting analysis.
Table 3.5 exhibits basic steps of entropy measurement method which is used for
calculating grey relational grade. There are six stages for calculating weights of each
characteristic (Mineta, et al. 2011). Grey relational grades are calculated by
multiplying grey relational co-efficient with corresponding weight of each
characteristic, and the values are given in Table 3.5 for each alloy.
Table 3.5 Basic steps for calculating grey relational grade (GRG).
S.
No. Stages Formulas
1 Summation of each attribute’s value for all
sequences (Dk) …..(6)
2 Calculate the normalization coefficient (K)
Where m is the number of attributes. …...(7)
3 Find the entropy for the specific attribute (ek) …..(8)
4 Calculate the total entropy value (E)
…..(9)
5 Determine the relative weighting factor (λk)
......(10)
6 Normalized weight of each attribute is
calculated (βk) ….(11)
1
,0,0 )()(k
n
iki xxxx
1
1k
n k
n
i
ik kxD1
)(
meK
)1(
15.0
))(
(1
1
n
i k
ik
D
kxf
Ke
n
k
keE1
En
ekk
)1(
n
k i
kk
1

65
3.5.3 Response surface method (RSM)
Response surface methodology investigates the communication between many
illustrative variables and one or more response variables (Hewidy et al. 2005). The
most essential application of this approach is to utilize a series of designed
experiments to get best response. Commonly a second-degree polynomial model is
used in this approach. Even though these models are just a prediction, such a model is
easy to estimate and apply, even when little is known about the process. In order to
study the effect of WEDM process parameters of TiNiCo alloys on the volumetric
surface roughness and metal removal rate, a second-order polynomial response can be
fitted into the equation 12 (Layard et al. 2009).
……… (12)
Where ε is the noise or error observed in the response Y. Xi is the linear input
variables and 𝑋𝑖2 and Xi, Xj are the squares and interaction terms respectively, of these
input variables. The unknown second order regression coefficients are βo, βi, βij and
βii, which should be determined in the second-order model are obtained by the least
square method.
Response surface methodology used in the present study includes designing of a
series of experiments for sufficient and reliable measurement of the output responses
and development of mathematical model of second order response surface with the
best fittings. The optimal set of experimental parameters, thus produce a maximum or
minimum value of the response (Helth et al. 2013).
3.6 CHARACTERIZATION OF MACHINED SURFACE OF TiNiCo ALLOYS
Machined surface characterization has been carried out for optimized process
parameters with respect to recast layer thickness, surface topography, microhardness,
XRD analysis and residual stresses.
jiij
k
jiji
k
i
iiii
k
i
i XXXXY,1,
1
2
1
0

66
3.6.1 Recast layer thickness (RLT)
Machined Surface morphology has been carried out through scanning electron
microscopy (JEOL JSM-638OLA) and can be seen in Fig. 3.10. However During wire
electro discharge machining rapid heating and quenching of the molten material by
the dielectric fluid causes the formation of a solidified layer and gets deposited on the
machined surface called recast layer (Soni et al. 2017). The thickness of recast layer
was determine by the polishing the cross section of the machined surface by using SiC
paper, diamond polishing with an etchant HNO3+HF+H2O. Similar measurement has
been carried out by Manjaiah et al.( 2015) and can be seen in Fig. 3.11.
Figure 3.10 Scanning electron microscopy for machines surface morphology.

67
Figure 3.11 Cross-sectioned SEI micrographs of WED-machined Ti50Ni40Cu10 SMA.
(Manjaiah et al. 2015)
3.6.2 Machined surface topography
The machined surface 3D topography has been measured through Confocal
microscope LEST OLS4100’ 3D. During the topographical analysis 1067 µm x 1067
µm area was selected to evaluation of machined surface and Cutoff (λc) =80µm was
considered during the measurement. Figure 3.12 shows the captured image during the
surface topographical analysis.
Figure 3.12 Captured image during the surface topographical analysis.

68
3.6.3 Micro hardness
The formation of layers from the machined surface toward the base material is
presented in the Fig 3.13. Near the cutting edge was considered as a starting point
(0µm) and measure the microhardness towards the base material till depth of 150µm.
Where five times measured the hardness values for particular place of specimen and
average microhardness values were considered for present study. Omni Tech Model:
MVH-S-AUTO, microhardness tester was used for measurement of hardness values
along the cross section, from machined surface to inner depth surface using 300 gram
load and 15Sec. dwell time. Figure 3.14 shows the setup of Microhardness tester.
Figure 3.13 Schematic diagram of three kinds of layers on machined component (Soni
et al. 2017).

69
Figure 3.14 Setup of Microhardness testers.
3.6.4 XRD analysis
XRD analysis is carried out to understand the formation of oxides and other phase
changes on the machined surface. Diffraction patterns were obtained by Bruker AXS
D-8 Advance Diffractometer (Germany) with CuKα radiation and nickel filter at 20
mA under a voltage of 35 kV. The specimens were scanned with a scanning speed of
1 Kcps in 2θ range of 20 to 95° and the intensities were recorded at a chart speed of 1
cm/min with 1°/min as Goniometer speed. The setup of XRD analysis is given in
Figure 3.15. The relative intensities of all the peaks have been observed by assuming
height of the most prominent peak as 100%. The diffractometer being interfaced with
Bruker DIFFRAC plus X-Ray diffraction software provides‘d’ values directly on the
diffraction pattern. These‘d’ values were then used for identification of various phases
with the help of inorganic ASTM X-Ray diffraction data cards.

70
Figure 3.15 Setup for residual stress analysis.
3.6.5 Residual analysis
During machining, residual stresses will be generating on nonhomogeneous,
plastically deformed machined surface causing metallurgical transformation. The
degree of residual stress induced in the machined surface during Wire Electro
discharge machining will be evaluating using X-ray diffraction technique. Before the
residual stress measurement samples were prepared as per the equipment requirement
(size of 3 x 3 x 5 mm) through WEDM process at optimized process parameters and
polished through electro chemical polishing. Through electro chemical polishing of
machined surface can be remove the recast layer on the machined component (Navas
et al. 2008). And also, residual stresses have been measured without electro chemical
polishing on machined surface i e. with recast layer for two process parameter
approach.
During the optimization of WEDM process parameters it has been found that pulse on
time and servo voltage were varying at optimized process parameters while rest of the
process parameters were found constant in the best combination of process parameters
for machining of Ti50Co49Co1, Ti50Co45Co5 and Ti50Co40Co10 alloy. Therefore, further

71
study has been carried out at based on these two process parameters to see the detailed
effects during the machining of Ti50Co49Co1, Ti50Co45Co5 and Ti50Co40Co10 alloys.
3.7 TWO PROCESS PARAMETER APPROACH
During the two process parameters approach pulse on time and servo voltage were
considered as process parameters with their five levels. L-25 orthogonal array (Table
3.6) has been created by using Taguchi DOE through Minitab 17 Software. The
responses of MRR and SR have been measured. Further characterization has been
carried out for machined surface at the lower and higher values of outputs with
respect to microstructure, surface topography, recast layer thickness, micro hardness
and residual stresses.
Table 3.6 L-25 orthogonal array for two process parameters approach.
Run Pulse on time Servo voltage
1 105 20
2 105 30
3 105 40
4 105 50
5 105 60
6 110 20
7 110 30
8 110 40
9 110 50
10 110 60
11 115 20
12 115 30
13 115 40
14 115 50
15 115 60
16 120 20
17 120 30

72
18 120 40
19 120 50
20 120 60
21 125 20
22 125 30
23 125 40
24 125 50
25 125 60
3.8 ARTIFICIAL NEURAL NETWORK FOR RESPONSES
ANN is an artificial illustration of human brain that tries to simulate its learning
approach which is an interconnected pairs of artificial neurons that uses a
mathematical model for information processing based on a connectionist method to
computation. Neural networks are non-linear mapping systems that consist of simple
processors which are called neurons, linked by weighed connections. Each neuron has
inputs and generates an output that can be seen as the reflection of local information
that is stored in connections. Among ANN models, the feed forward neural network
based on back-propagation is the best general-purpose model. The ANN network had
two inputs such as pulse on time and servo voltage because these two process
parameters were found as most influential process parameters for machining of
Ti50Co49Co1, Ti50Co45Co5 and Ti50Co40Co10 alloys with respect to two outputs
material removal rate and surface roughness. Matlab software was used for predicting
the responses. As per the literature survey for the perfection of WEDM responses
through ANN, experimental results has been divided in two kinds of data namely test
data and training data. To getting best prediction values of responses training data
should be consider 70% of experimental results and rest of the data should be test data
(Ugrasen et al. 2014). For present study 70% data was kept in training and rest of the
data was test data during the prediction. To get the best regression plots which give
accurate prediction 15 hidden layers were adopted during the training of the data.
Developed ANN model can be seen in Fig. 3.16 and Fig. 3.17 is presented regression

73
plots. Same procedure implemented for prediction of WEDM responses for
Ti50Co49Co1, Ti50Co45Co5 and Ti50Co40Co10 alloy. Further study has been carried out
for error analysis to find the error between of experimental and predicted values.
Table 3.7 shows training parameters during the ANN.
Figure 3.16 Developed ANN Model.
Table 3.7 Training parameters.
Input Weight (W) Biases (b) Output
(1) Pulse on time
(2) Servo voltage Randomly between -1 and +1
(1) Material removal rate
(2) Surface roughness
3.9 ERROR ANALYSIS
Error analysis has been carried out through the comparison between experimental and
predicted values. Artificial neural network (ANN) is used as predictor for the
prediction of wire electro discharge machining (WEDM) responses such as the
material removal rate (MRR) and surface roughness (SR) during the machining of
Ti50Ni49Co1, Ti50Ni45Co5 and Ti50Ni40Co10 shape memory alloy. L-25 orthogonal
array has been created by using Taguchi design of experiment (DOE) for
experimental plan.
3.9 SUMMARY
In this chapter machining of developed Ti50Ni50-xCox (x=1, 5 and 10 at. %) shape
memory alloys by using wire electro discharge machining have been discussed. For
further study MRR and SR measured as per L-33 orthogonal array and optimized

74
process parameters. However machined surface characterization has been carried out
at optimized parameters conditions for all three alloys. Moreover two process
parameters approach was adopted for further machining and measured the machining
responses. Detailed characterization of machined surface obtained at higher and lower
values of MRR and SR. ANN was used for prediction of WEDM responses and
compared with the experimental values of responses to found the error .The adopted
methodology and details of used equipment for current research work were also
discussed. The experimental plan of present work is shown in the flow chart (Figure
3.18).
Figure 3.17 Regression plots of ANN model.
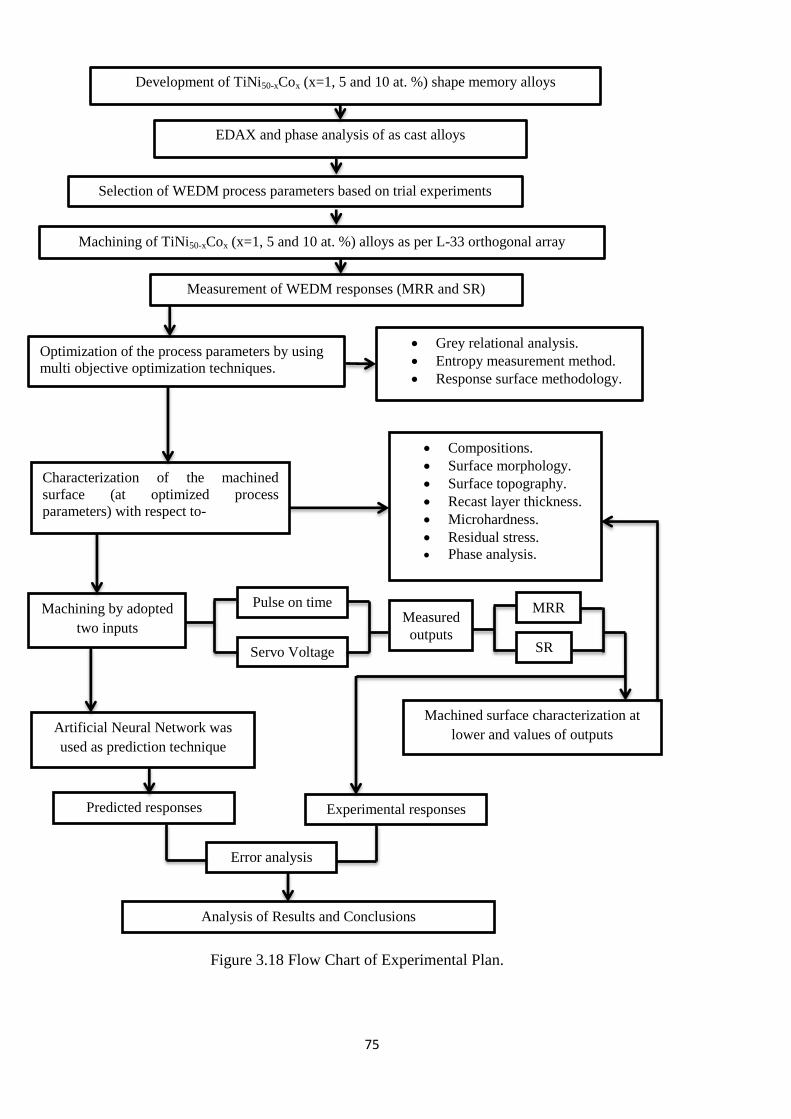
75
Development of TiNi50-xCox (x=1, 5 and 10 at. %) shape memory alloys
EDAX and phase analysis of as cast alloys
Selection of WEDM process parameters based on trial experiments
Machining of TiNi50-xCox (x=1, 5 and 10 at. %) alloys as per L-33 orthogonal array
Measurement of WEDM responses (MRR and SR)
Optimization of the process parameters by using
multi objective optimization techniques.
Characterization of the machined
surface (at optimized process
parameters) with respect to-
Artificial Neural Network was
used as prediction technique
Analysis of Results and Conclusions
Figure 3.18 Flow Chart of Experimental Plan.
Grey relational analysis.
Entropy measurement method.
Response surface methodology.
Compositions.
Surface morphology.
Surface topography.
Recast layer thickness.
Microhardness.
Residual stress.
Phase analysis.
Machined surface characterization at
lower and values of outputs
Predicted responses Experimental responses
Error analysis
Pulse on time
Servo Voltage
MRR
SR
Machining by adopted
two inputs Measured
outputs

76
CHAPTER 4
WIRE ELECTRO DISCHARGE MACHINING
CHARACTERISTICS
4.1 INTRODUCTION
This chapter describes the WEDM machining characteristics of developed TiNiCo
alloys. Machining has been carried out as per L-33 orthogonal array and effect of
process parameters on responses of material removal rate and surface roughness for
the shape memory alloys Ti50Ni49Co1, Ti50Ni45Co5, and Ti50Ni40Co10 are studied. Grey
relational analysis was adopted for optimization of process parameters. The machined
surfaces are characterised with respect to microstructure, surface topography,
hardness and residual stress and phases present in the machined surface.
4.2 MACHINING OF SHAPE MEMORY ALLOYS
The machining of Ti50Ni49Co1, Ti50Ni45Co5 and Ti50Ni40Co10 shape memory alloys is
carried out through wire electro discharge machining as per L-33 orthogonal array
created by response surface design. L-33 orthogonal array has been used for initially
experiments and to see the effect of all selected process parameters on Wire EDM
output responses. Material removal rate and surface roughness are measured as output
responses. Details about the machining and machining process parameters have been
presented in the section of 3.3 and Table 3.3. Table 4.1 indicates the machining
responses for each alloy.
Table 4.1 Measured output responses of MRR and surface roughness.
Run
Number
Ti50Ni49Co1 Ti50Ni45Co5 Ti50Ni40Co10
MRR
(mm3/min)
SR
(Ra)
MRR
(mm3/min)
SR
(Ra)
MRR
(mm3/min)
SR
(Ra)
1 1.26 3.36 1.720 3.47 4.556 3.09
2 1.97 3.29 0.720 2.65 1.472 2.27
3 3.25 2.74 2.221 3.45 4.08 2.89
4 3.68 3.5 2.074 2.95 3.948 2.58
5 2.07 2.29 1.457 2.72 2.04 2.69
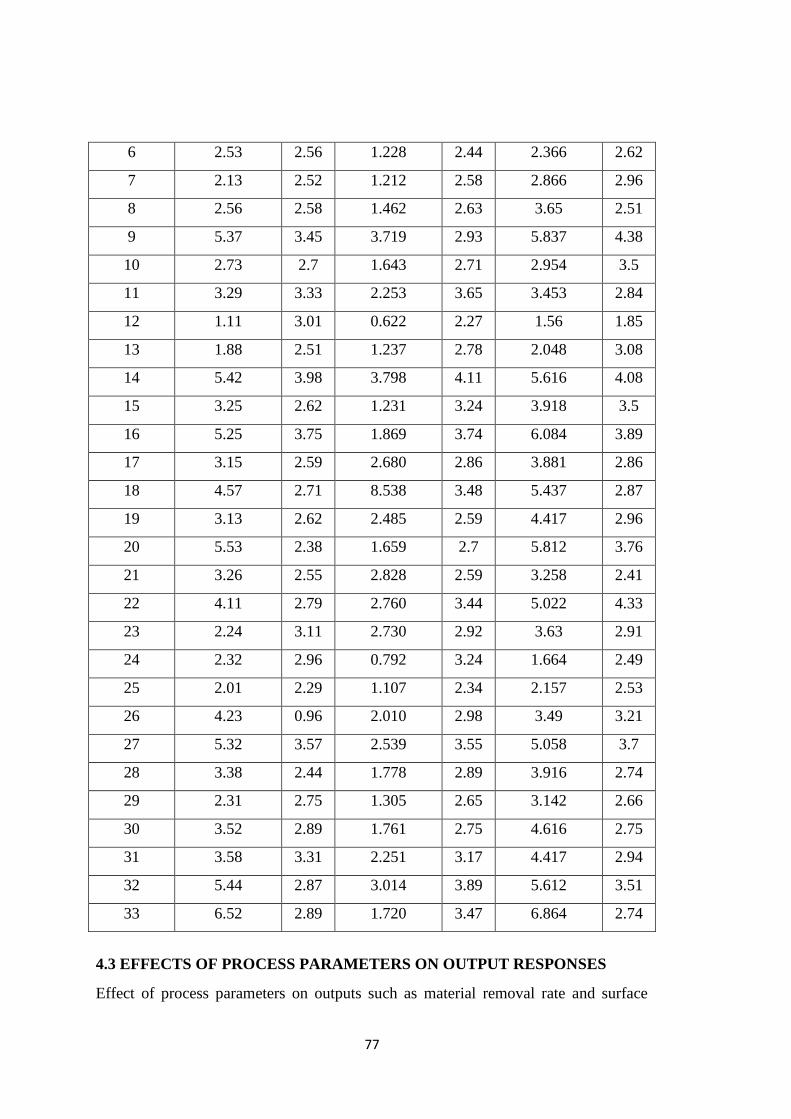
77
6 2.53 2.56 1.228 2.44 2.366 2.62
7 2.13 2.52 1.212 2.58 2.866 2.96
8 2.56 2.58 1.462 2.63 3.65 2.51
9 5.37 3.45 3.719 2.93 5.837 4.38
10 2.73 2.7 1.643 2.71 2.954 3.5
11 3.29 3.33 2.253 3.65 3.453 2.84
12 1.11 3.01 0.622 2.27 1.56 1.85
13 1.88 2.51 1.237 2.78 2.048 3.08
14 5.42 3.98 3.798 4.11 5.616 4.08
15 3.25 2.62 1.231 3.24 3.918 3.5
16 5.25 3.75 1.869 3.74 6.084 3.89
17 3.15 2.59 2.680 2.86 3.881 2.86
18 4.57 2.71 8.538 3.48 5.437 2.87
19 3.13 2.62 2.485 2.59 4.417 2.96
20 5.53 2.38 1.659 2.7 5.812 3.76
21 3.26 2.55 2.828 2.59 3.258 2.41
22 4.11 2.79 2.760 3.44 5.022 4.33
23 2.24 3.11 2.730 2.92 3.63 2.91
24 2.32 2.96 0.792 3.24 1.664 2.49
25 2.01 2.29 1.107 2.34 2.157 2.53
26 4.23 0.96 2.010 2.98 3.49 3.21
27 5.32 3.57 2.539 3.55 5.058 3.7
28 3.38 2.44 1.778 2.89 3.916 2.74
29 2.31 2.75 1.305 2.65 3.142 2.66
30 3.52 2.89 1.761 2.75 4.616 2.75
31 3.58 3.31 2.251 3.17 4.417 2.94
32 5.44 2.87 3.014 3.89 5.612 3.51
33 6.52 2.89 1.720 3.47 6.864 2.74
4.3 EFFECTS OF PROCESS PARAMETERS ON OUTPUT RESPONSES
Effect of process parameters on outputs such as material removal rate and surface

78
roughness are given in Fig. 4.1 a to e, Fig. 4.2 a to e, Fig. 4.3 a to e, Fig. 4.4 a to e,
Fig. 4.5 a to e and Fig. 4.6 a to e. A best combination of input process parameters are
obtained through optimisation.
4.3.1 Effects of process parameters on material removal rate
MRR increases with increased pulse on time (Ton) as can be seen in Fig 4.1a for
Ti50Ni49Co1, Fig. 4.2a for Ti50Ni45Co5, and Fig. 4.3a for Ti50Ni40Co10 alloys. Further
small reduction was noticed in MRR with increased pulse on time, for Ti50Ni45Co5
alloy which can be attributed to poor flushing in the machining zone. MRR increases
with increased pulse on time because at high pulse on time, spark intensity is high;
due to this more thermal energy is available to remove the material from the work
surface which results in less time required for removal of material from the work
piece surface, hence leading to high MRR. Similar work presented by Roy et al.
(2017) during the machining of TiNiCu shape memory alloy. From the Fig 4.1b for
Ti50Ni49Co1, Fig. 4.2b for Ti50Ni45Co5, and Fig. 4.3b for Ti50Ni40Co10 alloys it is
observed that MRR decreases with increase in pulse off time. The decrease in MRR
with high pulse off time is due to decrease in spark intensity as more time is required
for flowing dielectric fluid leading to low MRR. But MRR increase at 42 µs pulse off
time in Fig. 4.2b and Fig. 4.3b, which is may be due to the wire vibration in the
machining zone. Same as reported by kumar et al. (2017) during the WEDM of pure
titanium. It is noticed from Fig. 4.1c, Fig. 4.2c and Fig. 4.3c that MRR decrease with
increase servo voltage because increase in servo voltage results in larger spark gap
thereby reducing the spark intensity and eventually lesser amount of material is
removed from the surface of the workpiece. Similar trend has been seen in Fig. 4.2c,
but in this case MRR increase with initial increment in servo voltage till 30V. Fig.
4.3c shows that MRR decreases with increased servo voltage (SV) up to 50 V, further
it is observed as constant, because sometime improper clamping during holding the
workpiece on the working table affect the machining responses. Similar observation
reported by Goswami et al. (2014) during the machining of Nimonic 80A (77.05% Ni,
18.39% Cr, 1.92% Ti, 1.05% Al, 0.63% Fe, 0.2% Mn, and 0.19% Si). Servo feed is
not an effective process parameter with respect to MRR and the effect of servo feed
was not unique for any alloy which can be seen in the Fig 4.1d for Ti50Ni49Co1, Fig.
4.2d for Ti50Ni45Co5, and Fig. 4.3d for Ti50Ni40Co10 alloys. Similar results are

79
reported by other researchers in their study on machining of nanostructured hard
facing materials using WEDM (Saha et al. 2016). From Fig. 4.1e and Fig. 4.3e it is
noticed that MRR increases with increased wire speed (WS) up to 4 m/min, but
further increase in wire speed up to 5 m/min resulting in decreased MRR. Small
improvement is noticed in MRR with increased wire speed from 5 m/min to 6 m/min
for Ti50Ni49Co1 alloy and Ti50Ni40Co10 alloy. It is seen from Fig 4.2e that MRR
increases with increase in wire speed up to 4 m/min because more melted material
splashed through the machining zone and hence leads to high MRR. If the wire speed
is more than 4 m/min, wire vibration reduces the dynamic stability of the wire and
causes unfavourable sparking condition and hence leads to lower MRR. Similar
results have been noticed for Inconel 706 by using WEDM (Sharma et al. 2015).

80
Figure 4.1 Effects of process parameters on MRR for Ti50Ni49Co1 alloy.
Figure 4.2 Effects of process parameters on MRR for Ti50Ni45Co5 alloy.

81
Figure 4.3 Effects of process parameters on MRR for Ti50Ni40Co10 alloy.
4.3.2 Effects of process parameters on surface roughness
During surface roughness analysis (Fig 4.4, Fig. 4.5 and Fig. 4.6), it is observed that
surface roughness increase with pulse one time. Fig. 4.4a and Fig. 4.6a exhibit that
surface roughness increases with increased pulse on time up to 115 (µs) and further it
slightly reduces for Ti50Ni49Co1 alloy and Ti50Ni40Co10 alloy. This may be due to the
poor sparking during the machining process. Surface roughness increases with
increased pulse on time because when it removes more amount of material, some of
the molten material are flushed off by dielectric fluid and remaining molten metal

82
solidify on machined surface and it forms craters and micro globules leading to higher
surface roughness. Similar work presented by other researcher after the machining of
low-carbon steel G21Mn5 (Mordyuk et al. 2017). It is clearly seen form Fig. 4.4b and
Fig 4.5b that surface roughness decreases with increase pulse off time for Ti50Ni49Co1
alloy and Ti50Ni45Co05 alloy while Fig.4.6b indicates that surface roughness slightly
increased with increase in pulse off time (Toff) up to 35 (µs) which is negligible and
further surface roughness decreases with all specific levels of servo voltage for
Ti50Ni40Co10 alloy. Surface roughness decreases with increase pulse off time (Toff),
this may be ascribed to, at high pulse off time most of the molten metal is flushed
away from the machined surface and reduce the formation of craters and micro
globules hence leading to low surface roughness. Same as reported by Azhiri et al.
(2013) during the WEDM of Al/SiC metal matrix composite. It is noticed from Fig.
4.4c.for Ti50Ni49Co1 alloy that surface roughness decrease with increase in servo
voltage, whereas Fig. 4.5c and Fig. 4.6c shows that surface roughness (SR) decreases
with increased servo voltage (SV) up to 50 V, further surface roughness slightly
increases up to 60 V for both for Ti50Ni45Co5 alloy and Ti50Ni40Co10 alloy. Reduction
in surface roughness with improvement in servo voltage is due to, at high servo
voltage less amount of material are melted on machined surface; this can be easily
flushed away from the machined surface through dielectric fluid leading to low
surface roughness. Same as observed by Pramanik (2016) during the machining of
6061 aluminum alloy by using lector discharge machining. Fig. 4.4d depicts that
surface roughness decrease with increase in servo feed up to 2180mu further it
increase up to 2190 mu then again it decrease for Ti50Ni49Co1 alloy. Similar trend in
variation of SF with respect to servo feed is observed in Fig. 4.6d for Ti50Ni40Co10
alloy. Usually, the spark rate will be in the range of 10-100 kHz which is very high,
hence servo feed control is limited for proper control of WEDM because it may result
in loss of stability. This may cause server instabilities in the controlled feed rate
leading to high surface roughness for Ti50Ni49Co1 alloy and Ti50Ni40Co10 alloys. On
the other hand it can be seen in Fig. 4.5d that there is not much effects of surface
roughness on servo feed for the machining of Ti50Ni45Co5 alloy. Similar results of
servo feed variation while WED machining of Ti50Ni40Cu10 alloy has been reported by
Manjaiah et al. (2015). Fig. 4.4e indicates that surface roughness was low at 2 m/min

83
wire speed (WS) but latter it increases with the increased wire speed up to 3 m/min
further it decrease up to 4 m/min then again increase up to 5 m/min and again it
decrease up to 6 m/min for Ti50Ni49Co1 alloy. But in the Fig.4.5e it is seen that
surface roughness decreases with wire speed up to 3 m/min, and when wire speed
raised to 4 m/min, reduction is noted in surface roughness for the machining of
Ti50Ni45Co5 alloy. Fig.4.6e indicates that initially surface roughness was low at 2
m/min wire speed but latter it decreases with the increased wire speed up to 6 m/min
for the machining of Ti50Ni40Co10 alloy. At higher wire speed up to 6 m/min, surface
roughness reduces due to enhanced splashing of molten material. However due to
wire instability irregular craters and also uneven spark generation occurs on the work
surface. Similar work presented by Wang et al. (2017) during the wire electro
discharge machining of Inconel 718.
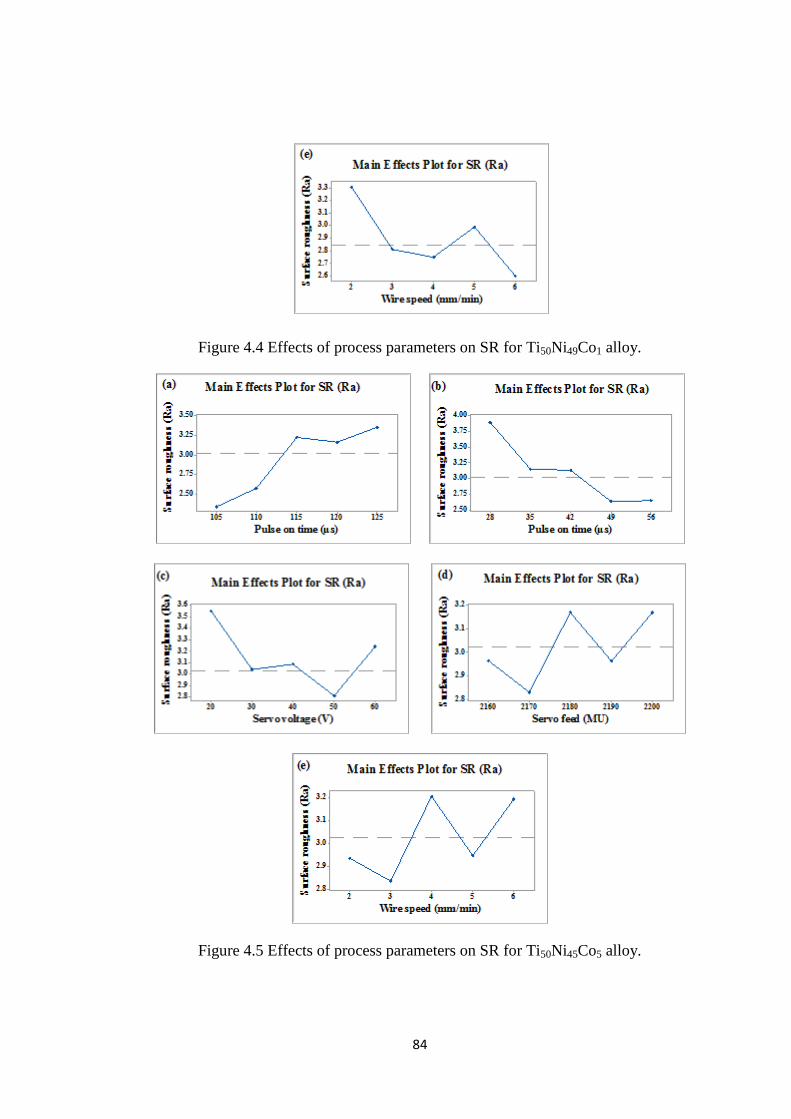
84
Figure 4.4 Effects of process parameters on SR for Ti50Ni49Co1 alloy.
Figure 4.5 Effects of process parameters on SR for Ti50Ni45Co5 alloy.
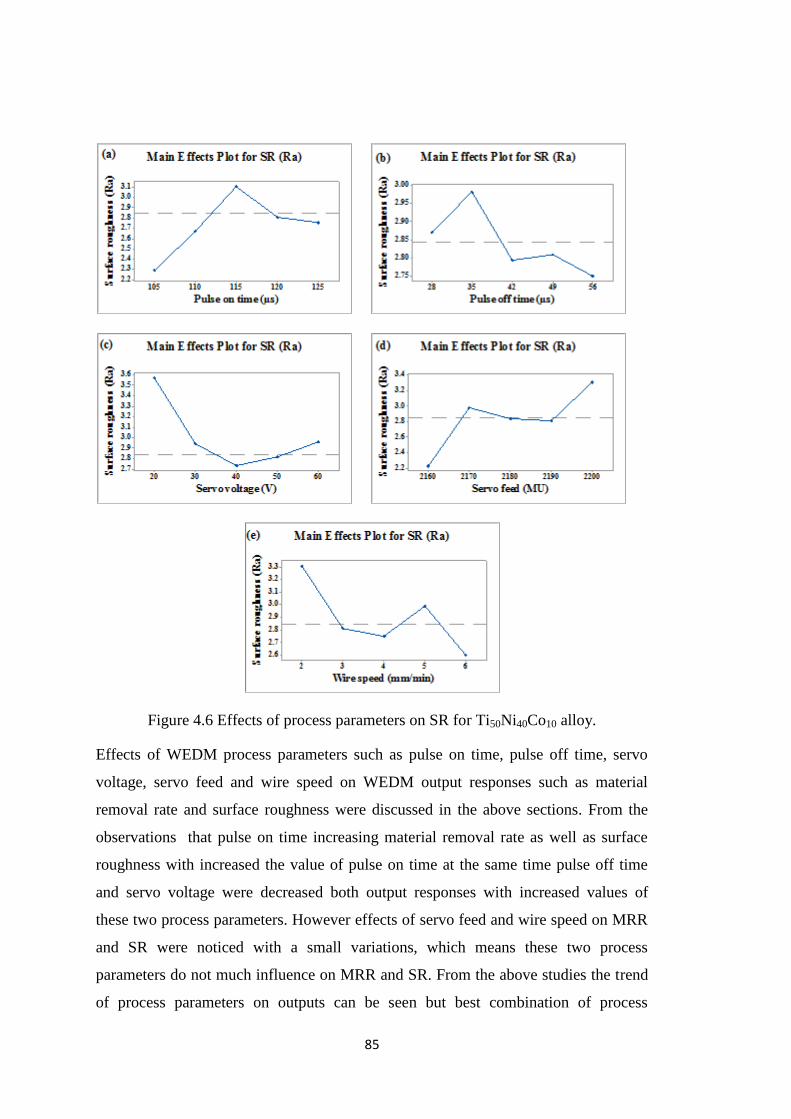
85
Figure 4.6 Effects of process parameters on SR for Ti50Ni40Co10 alloy.
Effects of WEDM process parameters such as pulse on time, pulse off time, servo
voltage, servo feed and wire speed on WEDM output responses such as material
removal rate and surface roughness were discussed in the above sections. From the
observations that pulse on time increasing material removal rate as well as surface
roughness with increased the value of pulse on time at the same time pulse off time
and servo voltage were decreased both output responses with increased values of
these two process parameters. However effects of servo feed and wire speed on MRR
and SR were noticed with a small variations, which means these two process
parameters do not much influence on MRR and SR. From the above studies the trend
of process parameters on outputs can be seen but best combination of process

86
parameters to get higher MRR with better surface roughness is difficult; therefore to
find the best combination of process parameters for machining of each alloy multi
objective optimization techniques were adopted. The detailed about the adopted
optimization techniques have been presented in section of 3.5. Calculation of
optimization techniques for each alloy further discussed in section of 4.5.
4.4 OPTIMIZATION OF MACHINING PROCESS PARAMETERS
The combinations of grey relational analysis, entropy measurement method and
response surface methodology were implemented to obtain the best combination of
process parameters for each alloy. If the sequence range is large, the factors are
effaceable therefore data pre-processing is an important steps to manage the factors of
GRA. For the data pre-processing, there are two conditions of normalization in the
present study namely higher the better which were used in the normalization of MRR
and another one is lower the better for normalization of SR values. Values of
normalizations and further steps of optimization techniques are provided in Table 4.2,
Table 4.3 and Table 4.4 for alloys Ti50Ni49Co1, Ti50Ni45Co5 and Ti50Ni40Co10
respectively. From the Table 4.2, Table 4.3 and Table 4.4 the GRG values calculated
for each alloy and presented Table 4.5. Table 4.5 exhibits the output responses MRR
and surface roughness with GRG for each alloy where maximum value of GRG
shows the best combination of process parameters. Based on the maximum value of
GRG Run no. 26 found the best combination of process parameters for Ti50Ni49Co1
alloy. Similarly Run no. 18 for Ti50Ni45Co5 alloy and Run no. 33 for Ti50Ni40Co10
alloy were optimized the as the best combination of process parameters. The values of
optimized process parameters has presented in the Table 4.6. From the Table 4.6 it
has been found that pulse on time and servo voltage were varying for each alloy at the
same time rest of the process parameters were found constant for each alloy.
Machined surface characterization has been carried out at these optimized process
parameters for each Ti50Ni49Co1, Ti50Ni45Co5 and Ti50Ni40Co10 alloys. However,
machined surface marphology, recast layer thickness and microhardness analyis of
Ti50Ni40Co10 alloy adoting one process parameters approcah was first discussed.
Thereafter analyis of all machined surface chracterizations of Ti50Ni49Co1,

87
Ti50Ni45Co5 and Ti50Ni40Co10 alloys machined under optimized process parameters
has been carried out.
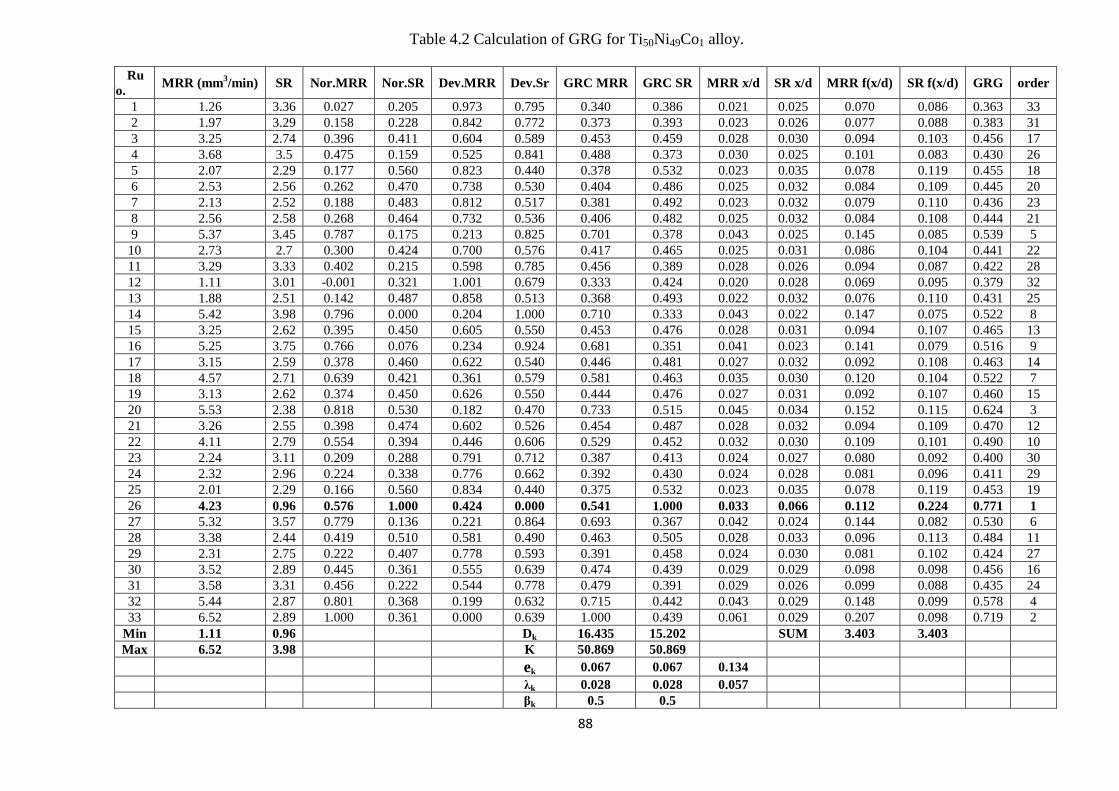
88
Table 4.2 Calculation of GRG for Ti50Ni49Co1 alloy.
Ru
n No. MRR (mm
3/min) SR Nor.MRR Nor.SR Dev.MRR Dev.Sr GRC MRR GRC SR MRR x/d SR x/d MRR f(x/d) SR f(x/d) GRG order
1 1.26 3.36 0.027 0.205 0.973 0.795 0.340 0.386 0.021 0.025 0.070 0.086 0.363 33
2 1.97 3.29 0.158 0.228 0.842 0.772 0.373 0.393 0.023 0.026 0.077 0.088 0.383 31
3 3.25 2.74 0.396 0.411 0.604 0.589 0.453 0.459 0.028 0.030 0.094 0.103 0.456 17
4 3.68 3.5 0.475 0.159 0.525 0.841 0.488 0.373 0.030 0.025 0.101 0.083 0.430 26
5 2.07 2.29 0.177 0.560 0.823 0.440 0.378 0.532 0.023 0.035 0.078 0.119 0.455 18
6 2.53 2.56 0.262 0.470 0.738 0.530 0.404 0.486 0.025 0.032 0.084 0.109 0.445 20
7 2.13 2.52 0.188 0.483 0.812 0.517 0.381 0.492 0.023 0.032 0.079 0.110 0.436 23
8 2.56 2.58 0.268 0.464 0.732 0.536 0.406 0.482 0.025 0.032 0.084 0.108 0.444 21
9 5.37 3.45 0.787 0.175 0.213 0.825 0.701 0.378 0.043 0.025 0.145 0.085 0.539 5
10 2.73 2.7 0.300 0.424 0.700 0.576 0.417 0.465 0.025 0.031 0.086 0.104 0.441 22
11 3.29 3.33 0.402 0.215 0.598 0.785 0.456 0.389 0.028 0.026 0.094 0.087 0.422 28
12 1.11 3.01 -0.001 0.321 1.001 0.679 0.333 0.424 0.020 0.028 0.069 0.095 0.379 32
13 1.88 2.51 0.142 0.487 0.858 0.513 0.368 0.493 0.022 0.032 0.076 0.110 0.431 25
14 5.42 3.98 0.796 0.000 0.204 1.000 0.710 0.333 0.043 0.022 0.147 0.075 0.522 8
15 3.25 2.62 0.395 0.450 0.605 0.550 0.453 0.476 0.028 0.031 0.094 0.107 0.465 13
16 5.25 3.75 0.766 0.076 0.234 0.924 0.681 0.351 0.041 0.023 0.141 0.079 0.516 9
17 3.15 2.59 0.378 0.460 0.622 0.540 0.446 0.481 0.027 0.032 0.092 0.108 0.463 14
18 4.57 2.71 0.639 0.421 0.361 0.579 0.581 0.463 0.035 0.030 0.120 0.104 0.522 7
19 3.13 2.62 0.374 0.450 0.626 0.550 0.444 0.476 0.027 0.031 0.092 0.107 0.460 15
20 5.53 2.38 0.818 0.530 0.182 0.470 0.733 0.515 0.045 0.034 0.152 0.115 0.624 3
21 3.26 2.55 0.398 0.474 0.602 0.526 0.454 0.487 0.028 0.032 0.094 0.109 0.470 12
22 4.11 2.79 0.554 0.394 0.446 0.606 0.529 0.452 0.032 0.030 0.109 0.101 0.490 10
23 2.24 3.11 0.209 0.288 0.791 0.712 0.387 0.413 0.024 0.027 0.080 0.092 0.400 30
24 2.32 2.96 0.224 0.338 0.776 0.662 0.392 0.430 0.024 0.028 0.081 0.096 0.411 29
25 2.01 2.29 0.166 0.560 0.834 0.440 0.375 0.532 0.023 0.035 0.078 0.119 0.453 19
26 4.23 0.96 0.576 1.000 0.424 0.000 0.541 1.000 0.033 0.066 0.112 0.224 0.771 1
27 5.32 3.57 0.779 0.136 0.221 0.864 0.693 0.367 0.042 0.024 0.144 0.082 0.530 6
28 3.38 2.44 0.419 0.510 0.581 0.490 0.463 0.505 0.028 0.033 0.096 0.113 0.484 11
29 2.31 2.75 0.222 0.407 0.778 0.593 0.391 0.458 0.024 0.030 0.081 0.102 0.424 27
30 3.52 2.89 0.445 0.361 0.555 0.639 0.474 0.439 0.029 0.029 0.098 0.098 0.456 16
31 3.58 3.31 0.456 0.222 0.544 0.778 0.479 0.391 0.029 0.026 0.099 0.088 0.435 24
32 5.44 2.87 0.801 0.368 0.199 0.632 0.715 0.442 0.043 0.029 0.148 0.099 0.578 4
33 6.52 2.89 1.000 0.361 0.000 0.639 1.000 0.439 0.061 0.029 0.207 0.098 0.719 2
Min 1.11 0.96 Dk 16.435 15.202 SUM 3.403 3.403
Max 6.52 3.98 K 50.869 50.869
ek 0.067 0.067 0.134
λk 0.028 0.028 0.057
βk 0.5 0.5

89
Table 4.3 Calculation of GRG for Ti50Ni45Co5 alloy.
Run MRR (mm3/min) SR (Ra) Nor.MRR Nor.SR Dev.MRR Dev.Sr GRC MRR GRC SR MRR x/d SR x/d MRR f(x/d) SR f(x/d) GRG order
1 1.72 3.47 0.139 0.491 0.861 0.509 0.367 0.496 0.028 0.024 0.095 0.080 0.431 28
2 0.72 2.65 0.013 0.835 0.987 0.165 0.336 0.752 0.026 0.036 0.087 0.122 0.544 13
3 2.22 3.45 0.202 0.499 0.798 0.501 0.385 0.500 0.029 0.024 0.100 0.081 0.442 26
4 2.07 2.95 0.184 0.709 0.816 0.291 0.380 0.632 0.029 0.030 0.098 0.102 0.506 20
5 1.46 2.72 0.106 0.806 0.894 0.194 0.359 0.720 0.027 0.034 0.093 0.117 0.539 14
6 1.23 2.44 0.077 0.923 0.923 0.077 0.351 0.867 0.027 0.041 0.091 0.140 0.609 4
7 1.21 2.58 0.075 0.864 0.925 0.136 0.351 0.787 0.027 0.037 0.091 0.127 0.569 7
8 1.46 2.63 0.106 0.843 0.894 0.157 0.359 0.762 0.027 0.036 0.093 0.123 0.560 8
9 3.72 2.93 0.391 0.718 0.609 0.282 0.451 0.639 0.034 0.030 0.117 0.103 0.545 11
10 1.64 2.71 0.129 0.810 0.871 0.190 0.365 0.725 0.028 0.034 0.095 0.117 0.545 12
11 2.25 3.65 0.206 0.415 0.794 0.585 0.386 0.461 0.029 0.022 0.100 0.075 0.424 29
12 0.62 2.27 0.000 0.995 1.000 0.005 0.333 0.989 0.025 0.047 0.086 0.160 0.661 2
13 1.24 2.78 0.078 0.781 0.922 0.219 0.352 0.695 0.027 0.033 0.091 0.113 0.523 18
14 3.80 4.11 0.401 0.222 0.599 0.778 0.455 0.391 0.035 0.019 0.118 0.063 0.423 30
15 1.23 3.24 0.077 0.587 0.923 0.413 0.351 0.548 0.027 0.026 0.091 0.089 0.450 24
16 1.87 3.74 0.158 0.378 0.842 0.622 0.373 0.446 0.028 0.021 0.097 0.072 0.409 32
17 2.68 2.86 0.260 0.747 0.740 0.253 0.403 0.664 0.031 0.032 0.105 0.107 0.534 16
18 8.54 3.48 1.000 0.487 0.000 0.513 0.999 0.493 0.076 0.023 0.259 0.080 0.746 1
19 2.48 2.59 0.235 0.860 0.765 0.140 0.395 0.782 0.030 0.037 0.103 0.127 0.588 6
20 1.66 2.7 0.131 0.814 0.869 0.186 0.365 0.729 0.028 0.035 0.095 0.118 0.547 10
21 2.83 2.59 0.279 0.860 0.721 0.140 0.409 0.782 0.031 0.037 0.106 0.127 0.596 5
22 2.76 3.44 0.270 0.504 0.730 0.496 0.407 0.502 0.031 0.024 0.105 0.081 0.454 23
23 2.73 2.92 0.266 0.722 0.734 0.278 0.405 0.642 0.031 0.031 0.105 0.104 0.524 17
24 0.79 3.24 0.022 0.587 0.978 0.413 0.338 0.548 0.026 0.026 0.088 0.089 0.443 25
25 1.11 2.34 0.062 0.965 0.938 0.035 0.348 0.935 0.026 0.044 0.090 0.151 0.641 3
26 2.01 2.98 0.175 0.697 0.825 0.303 0.377 0.622 0.029 0.030 0.098 0.101 0.500 21
27 2.54 3.55 0.242 0.457 0.758 0.543 0.398 0.480 0.030 0.023 0.103 0.078 0.439 27
28 1.78 2.89 0.146 0.734 0.854 0.266 0.369 0.653 0.028 0.031 0.096 0.106 0.511 19
29 1.31 2.65 0.087 0.835 0.913 0.165 0.354 0.752 0.027 0.036 0.092 0.122 0.553 9
30 1.76 2.75 0.144 0.793 0.856 0.207 0.369 0.707 0.028 0.034 0.096 0.115 0.538 15
31 2.25 3.17 0.206 0.617 0.794 0.383 0.386 0.566 0.029 0.027 0.100 0.092 0.476 22
32 3.01 3.89 0.302 0.315 0.698 0.685 0.417 0.422 0.032 0.020 0.108 0.068 0.420 31
33 3.24 4.64 0.331 0.000 0.669 1.000 0.428 0.333 0.033 0.016 0.111 0.054 0.381 33
Min 0.62 2.27 Dk 13.123 21.021 SUM 3.402 3.403
Max 8.54 4.64 K 50.869 50.869
ek 0.0669 0.0669 0.1338
λk 0.0284 0.0284 0.0568
βk 0.5000 0.5000
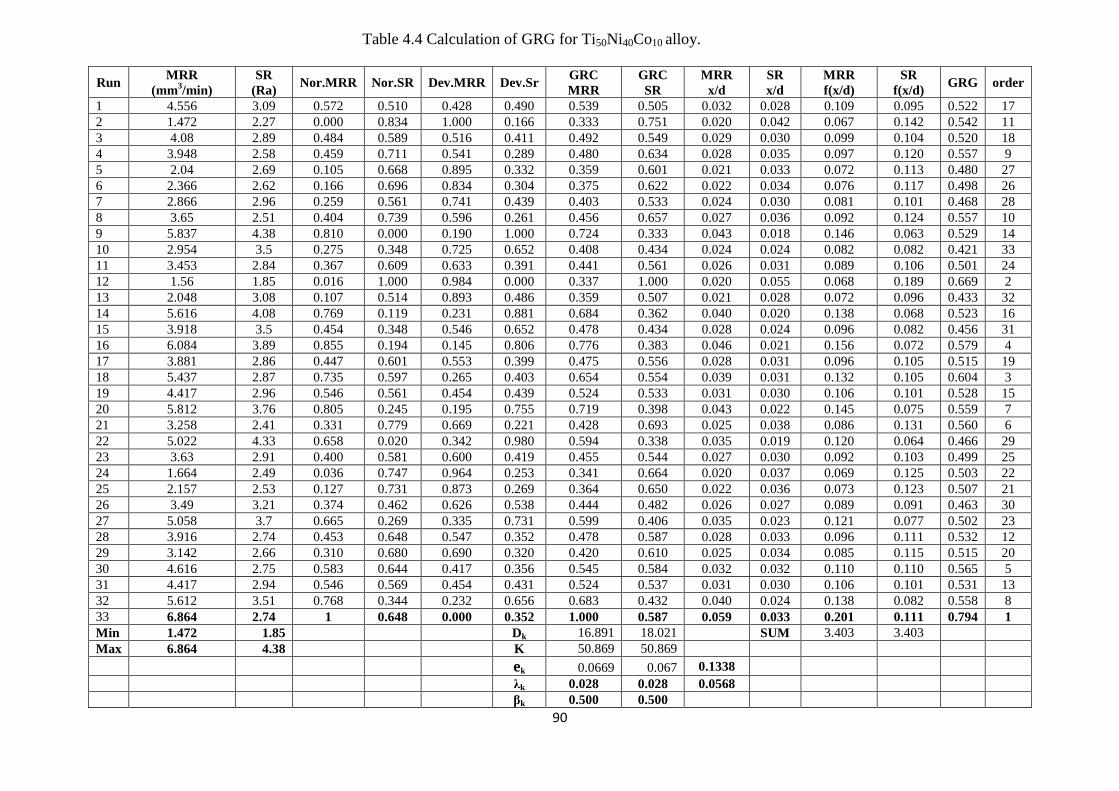
90
Table 4.4 Calculation of GRG for Ti50Ni40Co10 alloy.
Run MRR
(mm3/min)
SR
(Ra) Nor.MRR Nor.SR Dev.MRR Dev.Sr
GRC
MRR
GRC
SR
MRR
x/d
SR
x/d
MRR
f(x/d)
SR
f(x/d) GRG order
1 4.556 3.09 0.572 0.510 0.428 0.490 0.539 0.505 0.032 0.028 0.109 0.095 0.522 17
2 1.472 2.27 0.000 0.834 1.000 0.166 0.333 0.751 0.020 0.042 0.067 0.142 0.542 11
3 4.08 2.89 0.484 0.589 0.516 0.411 0.492 0.549 0.029 0.030 0.099 0.104 0.520 18
4 3.948 2.58 0.459 0.711 0.541 0.289 0.480 0.634 0.028 0.035 0.097 0.120 0.557 9
5 2.04 2.69 0.105 0.668 0.895 0.332 0.359 0.601 0.021 0.033 0.072 0.113 0.480 27
6 2.366 2.62 0.166 0.696 0.834 0.304 0.375 0.622 0.022 0.034 0.076 0.117 0.498 26
7 2.866 2.96 0.259 0.561 0.741 0.439 0.403 0.533 0.024 0.030 0.081 0.101 0.468 28
8 3.65 2.51 0.404 0.739 0.596 0.261 0.456 0.657 0.027 0.036 0.092 0.124 0.557 10
9 5.837 4.38 0.810 0.000 0.190 1.000 0.724 0.333 0.043 0.018 0.146 0.063 0.529 14
10 2.954 3.5 0.275 0.348 0.725 0.652 0.408 0.434 0.024 0.024 0.082 0.082 0.421 33
11 3.453 2.84 0.367 0.609 0.633 0.391 0.441 0.561 0.026 0.031 0.089 0.106 0.501 24
12 1.56 1.85 0.016 1.000 0.984 0.000 0.337 1.000 0.020 0.055 0.068 0.189 0.669 2
13 2.048 3.08 0.107 0.514 0.893 0.486 0.359 0.507 0.021 0.028 0.072 0.096 0.433 32
14 5.616 4.08 0.769 0.119 0.231 0.881 0.684 0.362 0.040 0.020 0.138 0.068 0.523 16
15 3.918 3.5 0.454 0.348 0.546 0.652 0.478 0.434 0.028 0.024 0.096 0.082 0.456 31
16 6.084 3.89 0.855 0.194 0.145 0.806 0.776 0.383 0.046 0.021 0.156 0.072 0.579 4
17 3.881 2.86 0.447 0.601 0.553 0.399 0.475 0.556 0.028 0.031 0.096 0.105 0.515 19
18 5.437 2.87 0.735 0.597 0.265 0.403 0.654 0.554 0.039 0.031 0.132 0.105 0.604 3
19 4.417 2.96 0.546 0.561 0.454 0.439 0.524 0.533 0.031 0.030 0.106 0.101 0.528 15
20 5.812 3.76 0.805 0.245 0.195 0.755 0.719 0.398 0.043 0.022 0.145 0.075 0.559 7
21 3.258 2.41 0.331 0.779 0.669 0.221 0.428 0.693 0.025 0.038 0.086 0.131 0.560 6
22 5.022 4.33 0.658 0.020 0.342 0.980 0.594 0.338 0.035 0.019 0.120 0.064 0.466 29
23 3.63 2.91 0.400 0.581 0.600 0.419 0.455 0.544 0.027 0.030 0.092 0.103 0.499 25
24 1.664 2.49 0.036 0.747 0.964 0.253 0.341 0.664 0.020 0.037 0.069 0.125 0.503 22
25 2.157 2.53 0.127 0.731 0.873 0.269 0.364 0.650 0.022 0.036 0.073 0.123 0.507 21
26 3.49 3.21 0.374 0.462 0.626 0.538 0.444 0.482 0.026 0.027 0.089 0.091 0.463 30
27 5.058 3.7 0.665 0.269 0.335 0.731 0.599 0.406 0.035 0.023 0.121 0.077 0.502 23
28 3.916 2.74 0.453 0.648 0.547 0.352 0.478 0.587 0.028 0.033 0.096 0.111 0.532 12
29 3.142 2.66 0.310 0.680 0.690 0.320 0.420 0.610 0.025 0.034 0.085 0.115 0.515 20
30 4.616 2.75 0.583 0.644 0.417 0.356 0.545 0.584 0.032 0.032 0.110 0.110 0.565 5
31 4.417 2.94 0.546 0.569 0.454 0.431 0.524 0.537 0.031 0.030 0.106 0.101 0.531 13
32 5.612 3.51 0.768 0.344 0.232 0.656 0.683 0.432 0.040 0.024 0.138 0.082 0.558 8
33 6.864 2.74 1 0.648 0.000 0.352 1.000 0.587 0.059 0.033 0.201 0.111 0.794 1
Min 1.472 1.85 Dk 16.891 18.021 SUM 3.403 3.403
Max 6.864 4.38 K 50.869 50.869
ek 0.0669 0.067 0.1338
λk 0.028 0.028 0.0568
βk 0.500 0.500

91
Table 4.5 Output response of surface roughness and MRR with GRG.
Run
No.
Ti50Ni49Co1 Ti50Ni45Co5 Ti50Ni40Co10
MRR
(mm3/min)
SR
(Ra) GRG
MRR
(mm3/min)
SR
(Ra) GRG
MRR
(mm3/min)
SR
(Ra) GRG
1 1.26 3.36 0.363 1.720 3.47 0.431 4.556 3.09 0.522
2 1.97 3.29 0.383 0.720 2.65 0.544 1.472 2.27 0.542
3 3.25 2.74 0.456 2.221 3.45 0.442 4.08 2.89 0.520
4 3.68 3.5 0.430 2.074 2.95 0.506 3.948 2.58 0.557
5 2.07 2.29 0.455 1.457 2.72 0.539 2.04 2.69 0.480
6 2.53 2.56 0.445 1.228 2.44 0.609 2.366 2.62 0.498
7 2.13 2.52 0.436 1.212 2.58 0.569 2.866 2.96 0.468
8 2.56 2.58 0.444 1.462 2.63 0.560 3.65 2.51 0.557
9 5.37 3.45 0.539 3.719 2.93 0.545 5.837 4.38 0.529
10 2.73 2.7 0.441 1.643 2.71 0.545 2.954 3.5 0.421
11 3.29 3.33 0.422 2.253 3.65 0.424 3.453 2.84 0.501
12 1.11 3.01 0.379 0.622 2.27 0.661 1.56 1.85 0.669
13 1.88 2.51 0.431 1.237 2.78 0.523 2.048 3.08 0.433
14 5.42 3.98 0.522 3.798 4.11 0.423 5.616 4.08 0.523
15 3.25 2.62 0.465 1.231 3.24 0.450 3.918 3.5 0.456
16 5.25 3.75 0.516 1.869 3.74 0.409 6.084 3.89 0.579
17 3.15 2.59 0.463 2.680 2.86 0.534 3.881 2.86 0.515
18 4.57 2.71 0.522 8.538 3.48 0.746 5.437 2.87 0.604
19 3.13 2.62 0.460 2.485 2.59 0.588 4.417 2.96 0.528
20 5.53 2.38 0.624 1.659 2.7 0.547 5.812 3.76 0.559
21 3.26 2.55 0.470 2.828 2.59 0.596 3.258 2.41 0.560
22 4.11 2.79 0.490 2.760 3.44 0.454 5.022 4.33 0.466
23 2.24 3.11 0.400 2.730 2.92 0.524 3.63 2.91 0.499
24 2.32 2.96 0.411 0.792 3.24 0.443 1.664 2.49 0.503
25 2.01 2.29 0.453 1.107 2.34 0.641 2.157 2.53 0.507
26 4.23 0.96 0.771 2.010 2.98 0.500 3.49 3.21 0.463
27 5.32 3.57 0.530 2.539 3.55 0.439 5.058 3.7 0.502

92
28 3.38 2.44 0.484 1.778 2.89 0.511 3.916 2.74 0.532
29 2.31 2.75 0.424 1.305 2.65 0.553 3.142 2.66 0.515
30 3.52 2.89 0.456 1.761 2.75 0.538 4.616 2.75 0.565
31 3.58 3.31 0.435 2.251 3.17 0.476 4.417 2.94 0.531
32 5.44 2.87 0.578 3.014 3.89 0.420 5.612 3.51 0.558
33 6.52 2.89 0.719 1.720 3.47 0.381 6.864 2.74 0.794
Table 4.6 Optimized process parameters for each alloy.
S. No. Alloys Ton Toff SV SF WS
1 Ti50Ni49Co1 115 42 30 2180 4
2 Ti50Ni45Co5 115 42 40 2180 4
3 Ti50Ni40Co10 125 42 40 2180 4
4.5 CHARACTERIZATION OF MACHINED SURFACE
Characterization of machined surface of each shape memory alloy is carried out with
respect to microsructure, surface topography, recast layer thickness, microhardness,
residual stress, composition and phase constituents. All these alloys were machined at
optimized process paramters mentioned Table 4.6.
4.5.1 EDX analysis of machined surface
Fig. 4.7 a to c exhibit the EDX analysis of machined surface of Ti50Ni49Co1,
Ti50Ni45Co5 and Ti50Ni40Co10 alloys. The results indicate the presence of Ti, Ni and
Co on the machined surface of all three alloys. The residuals of copper (Cu) and Zinc
(Zn) were recognized in all three alloys. This might be because of the melting and re-
solidification of the wire material during spark erosion in WEDM process. The
presence of oxygen in these alloys was observed because of oxidation as a result of
high temperature involved in the WEDM process. Although EDX results showed that
carbon (C) and oxygen (O) exists in all three alloys; these elements were observed
due to the fact that dielectric fluid normally contains carbon (C) from minute minerals
present and oxygen (O) from water molecules. Similar finding were presented by
Sharma et al. (2017) during WEDM of nickel based aerospace alloy.
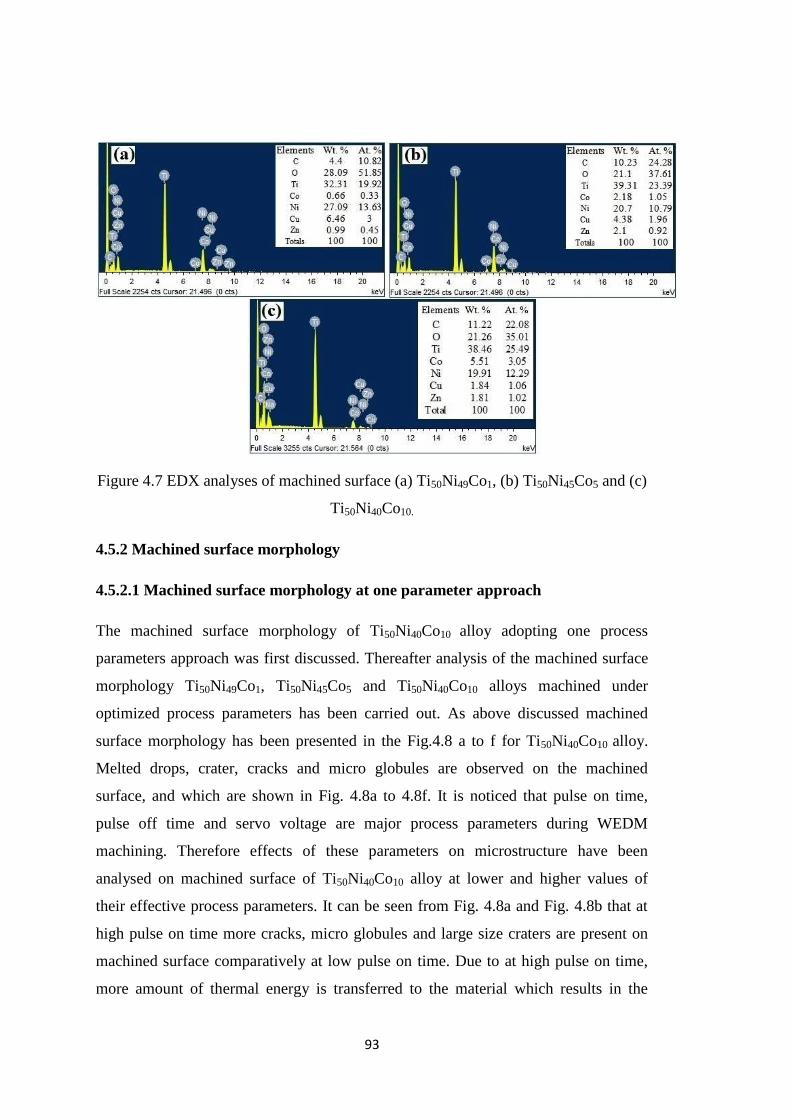
93
Figure 4.7 EDX analyses of machined surface (a) Ti50Ni49Co1, (b) Ti50Ni45Co5 and (c)
Ti50Ni40Co10.
4.5.2 Machined surface morphology
4.5.2.1 Machined surface morphology at one parameter approach
The machined surface morphology of Ti50Ni40Co10 alloy adopting one process
parameters approach was first discussed. Thereafter analysis of the machined surface
morphology Ti50Ni49Co1, Ti50Ni45Co5 and Ti50Ni40Co10 alloys machined under
optimized process parameters has been carried out. As above discussed machined
surface morphology has been presented in the Fig.4.8 a to f for Ti50Ni40Co10 alloy.
Melted drops, crater, cracks and micro globules are observed on the machined
surface, and which are shown in Fig. 4.8a to 4.8f. It is noticed that pulse on time,
pulse off time and servo voltage are major process parameters during WEDM
machining. Therefore effects of these parameters on microstructure have been
analysed on machined surface of Ti50Ni40Co10 alloy at lower and higher values of
their effective process parameters. It can be seen from Fig. 4.8a and Fig. 4.8b that at
high pulse on time more cracks, micro globules and large size craters are present on
machined surface comparatively at low pulse on time. Due to at high pulse on time,
more amount of thermal energy is transferred to the material which results in the

94
melting of more amount of material from the work piece. This, in turn, contributes to
the increase in size of the craters formed on the machined surface and consequently
produces a rough surface on the machined components, from Fig. 4.6a indicates
clearly the rough surface on the machined surface at high pulse on time. Fig. 4.8c and
4.8d represented the microstructures at high and low servo voltage. It can be seen
from Fig. 4.8c that at low servo voltage of 20 V, cracks appeared on the machined
surface are more when compared to samples machined at higher servo voltage. At low
servo voltage, surface roughness will be higher due to more intense spark discharge
on the machining surface that leads to formation of larger and abrupt crater along with
faster resolidification of molten material by dielectric quenching. The entire process is
largely complicated during the electrical discharge, the dielectric barrier is broken due
to formation of plasma channel which have a temperature of around 10,000°C that is
more than enough to melt, vaporize and disintegrate the material from its bulk core
(Soni et al. 2017). However this is not sufficient enough to produce the required
localised pressure which can splash all the molten material from the machining zone
which is to be washed away due to flushing pressure. But some of the molten
materials remain attached with the machined surface which tend to entrap some air
bubbles and thus produces micro voids and micro globules on the machined surface.
The effects of pulse off time on microstructures of machined surface are given in Fig.
4.8e and 4.8f. It is evident from microstructures that at high pulse off time
comparatively less surface cracks, micro globules, craters, micro void, melted drops
and blow holes are observed. Because at higher pulse off time more time is allowed
for flushing in the machining zone that results in more amount of material removal
per unit time from the machined surface. Hence, less re-solidified molten material is
found on the machined surface (Choudhary et al. 2010).

95
Figure 4.8 SEM microstructures of one process parameters approach machined
surface: (a) At high pulse on time (125µs), (b) Low pulse on time (105µs), (c) Low
servo voltage (20V), (d) High servo voltage, (e) Low pulse off time (28µs) and (f)
High pulse off time (56µs).
4.5.2.2 Machined surface morphology at optimized process parameters
Surface morphology of shape memory alloys machined at optimized process
parameters is shown in Figure 4.9. Melted drops, crater, cracks and micro globules are
observed on the machined surface. Greater crater, more melting drops and micro

96
globules were observed on machined surface of Ti50Ni49Co1 alloy (Fig. 4.9a). This
may be due to the lower servo voltage where surface roughness will be higher due to
more intense spark discharge on the machining surface that leads to formation of
larger and abrupt crater along with faster resolidification of molten material by
dielectric quenching. The machined surface quality is better for Ti50Ni45Co5 as seen in
Fig 4.9b where cracks size, crater, melted drops and micro globules are lower,
because the adopted pulse on time and servo voltage are average which improve the
surface quality. While machined surface of Ti50Ni40Co10 alloy as observed in Fig. 4.9
c exhibit more melted drops and crater because high pulse on time of 125µs is
adopted for machining which resulting in more amount of thermal energy is
transferred to the material and the melting of more amount of material from the work
piece occur. This, in turn, contributes to the increase in size of the craters and melted
drops formed on the machined surface and consequently produce a rougher surface on
the machined components. Similar kind of results is observed by Kumar et al. (2016)
during WEDM of pure titanium.
Figure 4.9 Machined surface morphology at optimized process parameters (a)
Ti50Ni49Co1, (b) Ti50Ni45Co5 and (c) Ti50Ni40Co10.

97
4.5.3 Machined surface topography
Fig. 4.10 exhibit surface topography of Ti50Ni49C01, Ti50Ni45C05 and Ti50Ni40C010
shape memory alloys machined at optimised parameters. The surface topography
exposed that servo voltage and pulse on time are major effective parameters for the
machining of these alloys. The machined surface of Ti50Ni49C01 alloy exhibit a
surface roughness of 2.05µm (Ra) and topography is shown in Fig. 4.10 a. Roughness
value was noticed higher comparatively for Ti50Ni49C01 alloy because lower servo
voltage 30V was optimized for the machining of Ti50Ni49C01 alloy. However lower
servo voltage increases spark intensity and less time is there for removing the molten
material from the machined surface during the machining hence some of melted
material is remove from the machined surface rest of the material get deposited in the
form of recast layer and it creates rougher surface. Similar trend was noticed and
presented by Wang et al. (2017) during the WEDM of Inconel 718 alloy. The surface
roughness (Ra) of the machined surface was achieved for Ti50Ni45C05 and
Ti50Ni40C010 alloys are 1.05µm and 2.01µm respectively which can be seen in Fig.
4.10a and Fig. 4.10c. The lower surface roughness of Ti50Ni45C05 alloy is because of
machining at higher servo which increases the surface quality. Fig. 4.10c exhibits
poor surface quality due to higher pulse on time of 125µs because more amount of
thermal energy will be transferred to material at higher pulse on time which as
discussed in the section of 4.6.2.1 and can be seen in Fig. 4.8a.

98
Figure 4.10 Surface topography of machined surface of (a) Ti50Ni49Co1, (b)
Ti50Ni45Co5 and (c) Ti50Ni40Co10.
4.5.4 Residual stress analysis
Residual stress that exists on the machined surface is either tensile or compressive in
nature. The residual stresses exist on the WED machined surface, due to non-
homogeneity of heat flow and metallurgical transformations in the machining surface
and plastic deformation (Ekmekci et al. 2005; Newton et al. 2009). Plastic
deformation induces the compressive residual stresses by mechanical load and tensile
residual stress by thermal load (Rao et al. 2016). The phase transformations led to the
change in volume of surface and subsurface layers, so the decrease or increase of its
volume was hindered by bulk material resulting in generation of tensile or
compressive residual stresses respectively. Generally, WEDM induced tensile
residual stresses on the machined surface or in the recast layer zone further decreases
from the heat affected zone because of high spark energy involved in the machining
zone (Ekmekci et al. 2005). Fig. 4.11 indicates the compressive residual stress on
machined surface at optimized process parameters which are given in Table 4.6.
Compressive residual stress was noticed during wire electro discharge machining
process for all three alloys. However, compressive residual stresses improve fatigue
life of material, while tensile stresses are destructive in nature (Guu and Hocheng
2001). Due to compressive residual stress on machined surface harder surface has
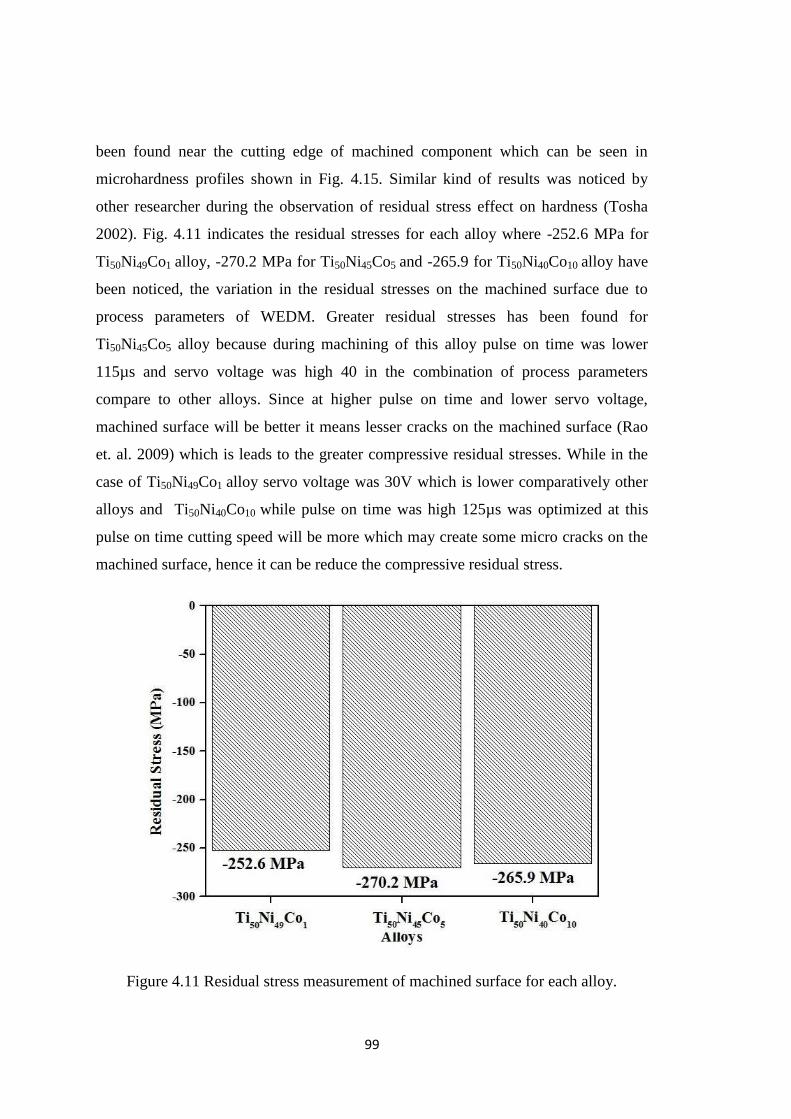
99
been found near the cutting edge of machined component which can be seen in
microhardness profiles shown in Fig. 4.15. Similar kind of results was noticed by
other researcher during the observation of residual stress effect on hardness (Tosha
2002). Fig. 4.11 indicates the residual stresses for each alloy where -252.6 MPa for
Ti50Ni49Co1 alloy, -270.2 MPa for Ti50Ni45Co5 and -265.9 for Ti50Ni40Co10 alloy have
been noticed, the variation in the residual stresses on the machined surface due to
process parameters of WEDM. Greater residual stresses has been found for
Ti50Ni45Co5 alloy because during machining of this alloy pulse on time was lower
115µs and servo voltage was high 40 in the combination of process parameters
compare to other alloys. Since at higher pulse on time and lower servo voltage,
machined surface will be better it means lesser cracks on the machined surface (Rao
et. al. 2009) which is leads to the greater compressive residual stresses. While in the
case of Ti50Ni49Co1 alloy servo voltage was 30V which is lower comparatively other
alloys and Ti50Ni40Co10 while pulse on time was high 125µs was optimized at this
pulse on time cutting speed will be more which may create some micro cracks on the
machined surface, hence it can be reduce the compressive residual stress.
Figure 4.11 Residual stress measurement of machined surface for each alloy.

100
4.5.5 Recast layer thickness
4.5.5.1 Recast layer thickness at one process parameter approach
Recast layer thickness measurement has been carried out of Ti50Ni40Co10 alloy
adopting one process parameters approach was first discussed. Thereafter analysis of
the machined Recast layer thickness of Ti50Ni49Co1, Ti50Ni45Co5 and Ti50Ni40Co10
alloys machined under optimized process parameters has been carried out. During
wire electro discharge machining rapid heating and quenching of the molten material
by the dielectric fluid causes the formation of a solidified layer and gets deposited on
the machined surface. It is observed from Fig. 4.12 a-d that high pulse on time and
low servo voltage are major affecting parameters, hence a thicker recast layer deposits
has been observed and this can be seen in Fig. 4.12a and 4.12d. At higher pulse on
time and low servo voltage, more thermal energy is transferred to the workpiece that
results in more amount of molten material re-solidify on the surface of workpiece in
the machining zone, leading to thicker recast layer on the machined surface. On the
other hand, thin recast layer was noticed from the Fig. 4.12b and 4.12c and is
influenced due to lower pulse on time 105 µs and higher servo voltage 60V. Similar
results have been reported by Newton et al. (20009) during WED machining of
Inconel 718. As observed from Fig. 4.12a recast layer thickness was in the range of
34µm to 44µm for machining with lower servo voltage 20V, whereas at high servo
voltage as evident from Fig. 4.12b minimum and maximum recast layer thickness of
5µm and 10µm was observed respectively. Similarly at low pulse on time 105µs,
average recast layer thickness of 4.21µm was noticed while at high pulse on time
125µs, average recast layer thickness of 35.4µm was observed. This is because at high
pulse on time workpiece receives more spark discharge of higher intensity which
leads to thicker recast layer formation. Longer pulse duration generally leads to higher
discharge energy per unit cycle that melts more material and re-solidifies them as well
due to rapid quenching by constantly flowing de-ionized water on the machined
surface (Hsieh et al. 2013). During our observation thicker recast layer was found at
high pulse on time 125µs and lower servo voltage 20V while it was thin
comparatively at lower pulse on time 105µs and higher servo voltage 60V which can
be seen in Fig. 4.12.
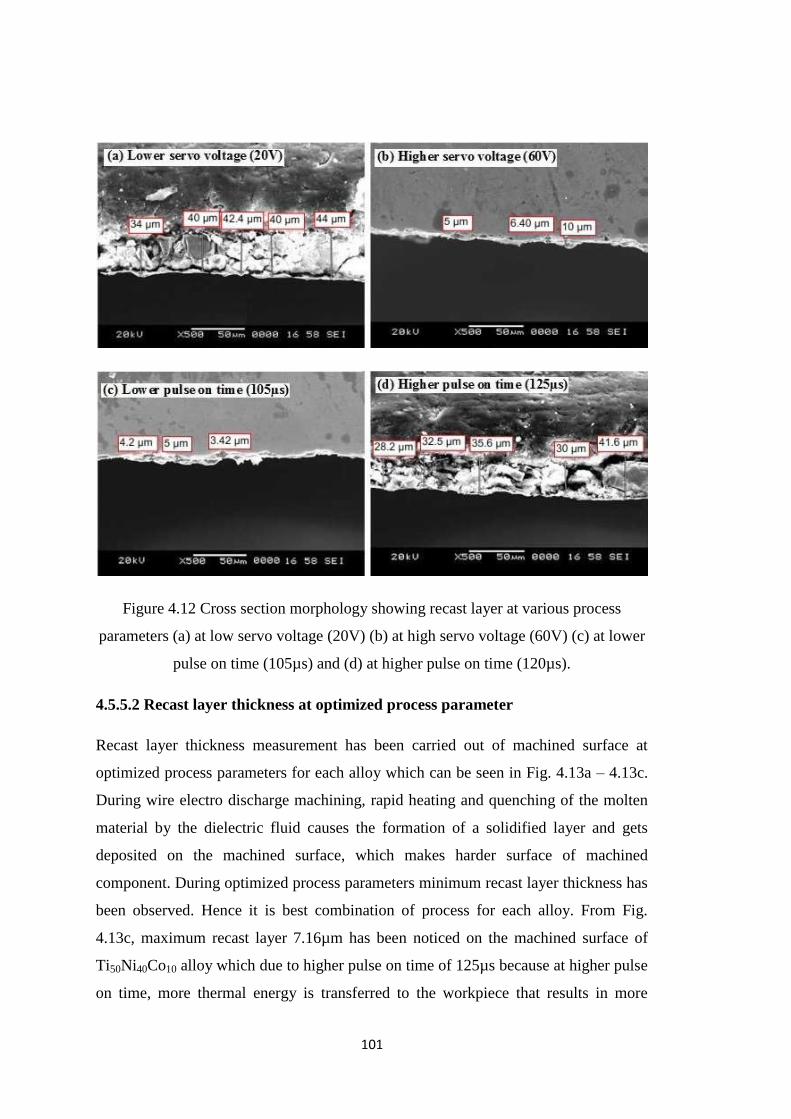
101
Figure 4.12 Cross section morphology showing recast layer at various process
parameters (a) at low servo voltage (20V) (b) at high servo voltage (60V) (c) at lower
pulse on time (105µs) and (d) at higher pulse on time (120µs).
4.5.5.2 Recast layer thickness at optimized process parameter
Recast layer thickness measurement has been carried out of machined surface at
optimized process parameters for each alloy which can be seen in Fig. 4.13a – 4.13c.
During wire electro discharge machining, rapid heating and quenching of the molten
material by the dielectric fluid causes the formation of a solidified layer and gets
deposited on the machined surface, which makes harder surface of machined
component. During optimized process parameters minimum recast layer thickness has
been observed. Hence it is best combination of process for each alloy. From Fig.
4.13c, maximum recast layer 7.16µm has been noticed on the machined surface of
Ti50Ni40Co10 alloy which due to higher pulse on time of 125µs because at higher pulse
on time, more thermal energy is transferred to the workpiece that results in more

102
amount of molten material that re-solidify on the surface of workpiece in the
machining zone, leading to thicker recast layer on the machined surface. While Fig.
4.13a and Fig. 4.13b exhibit recast layer 3.04 µm and 5.00 µm respectively on
machined surface for Ti50Ni49Co1 and Ti50Ni45Co5 alloys due to lower pulse on time
115µs. Similar results has been reported by (Prakash et al. 2017) during WED
machining of Inconel 706. During our observation average recast layer were 2 µm for
Ti50Ni49Co1 alloy, 2.8 µm for Ti50Ni45Co5 alloy and 4 µm for Ti50Ni40Co10 alloy were
noticed. Average value of recast layer was noticed minimum on the machined surface
for each alloy which is the negligible.
Figure 4.13 Recast layer thickness of machined surface at optimized process
parameters of (a) Ti50Ni49Co1, (b) Ti50Ni45Co5 and (c) Ti50Ni40Co10.
103
4.5.6 Machined surface microhardness
4.5.6.1 Machined surface microhardness at one process parameters approach
Machined surface microhardness measurement has been carried out of Ti50Ni40Co10
alloy adopting one process parameters approach was first discussed. Thereafter
analysis of the machined surface hardness of Ti50Ni49Co1, Ti50Ni45Co5 and
Ti50Ni40Co10 alloys machined under optimized process parameters has been carried
out. Microhardness has been studied on the machined surface of Ti50Ni40Co10 shape
memory alloy at low servo voltage 20V, high servo voltage 60V, low pulse on time
105µs and higher pulse on time 125µs. During the machining process three kinds of
layers are generated on the machined surface such as recast layer, heat affected zone
and converted layer (Choudhary et al. 2010). Recast layer near the cutting edge was
considered as a starting point 0µm and measure the microhardness towards the base
material, microhardness results are shown in Fig. 4.14. Recast layer formed on the
machined surface was about 3.5 - 45µm which was hard and 442 HV average
microhardness is noticed in this zone. This high hardness on the machined surface is
due to formation of surface oxides of TiO2, NiTiO3 and NiO. Below the recast layer
heat affected zone gives 375 HV average hardness, this is may be due to phase
transformation in the TiNiCo alloy which can be seen in Fig.4.16. Beneath the heat
affected zone converted layer shows hardness of 343 HV. Converted layer is not
much affected during WEDM process hence hardness was almost constant in this
zone. Such kind of variation in hardness were noticed by Hsieh et al. (2009 and 2013)
during the electro discharge machining of TiNiZr and TiAlfe alloys.

104
Figure 4.14 Micro hardness analyses of the Ti50Ni40Co10 alloy after machining.
4.5.6.2 Machined surface microhardness at optimized process parameters
The variation in the microhardness along the cross section of the machined surface is
studied. During the WEDM process three kinds of zones are generated on the
machined surface Choudhary et al. (2010). For hardness measurement, cutting edge
was considered as the starting point in the recast layer zone and continued until the
base material where uniform hardness was observed. Microhardness results are shown
in Fig. 4.15 and Table 4.7 which clearly indicates the average microhardness for all
three alloys. The recast layer of Ti50Ni40Co10 alloy is found harder comparatively
because pulse on time adopted for machining is 125µs which is high in combination
of process parameters. Moreover at the high pulse on time, spark intensity is high
which creates the more discharge energy result in formation of oxides on the
machined surface in the form of recast layer which makes harder surface of machined
component. The average recast layer thickness is higher for Ti50Ni40Co10 alloy
compared to Ti50Ni45Co5 and Ti50Ni45Co1 alloys. Phase transformation is responsible
for change in the microhardness of machined component toward the base material.
Beneath the heat affected zone converted layer comes in the picture which has lower

105
microhardness than both recast layer and heat affected zone. This converted layer is
not much affected during WEDM process; hence no change was noticed in this zone.
Hardness of this zone is almost closer to hardness of base material. Such kind of
variation in hardness was also noticed by Hsieh et al. (2013) during the electro
discharge machining of TiNiZr and TiAlFe alloys. Moreover harder surface near
cutting edge was observed due to lesser micro cracks on the machined surface noticed
at optimized process parameters and can be seen in Fig. 4.9. Densities of surface
cracks are negligible which imply compressive residual stress on the machined
surface which can be seen in Fig. 4.10. Similar result has been reported by other
researchers that microhardness is influenced by the residual stress, hardness decreases
due to tensile stress while it increases due to compressive stress (Tosha 2002).
Table 4.7 Average microhardness in the different zones of the machined surface.
Material Recast layer
(HV)
Heat affected zone
(HV)
Converted layer
(HV)
Ti50Ni49Co1 426 331 304
Ti50Ni45Co5 473 413 391
Ti50Ni40Co10 523 469 429

106
Figure 4.15 Microhardness profiles of machined surface of shape memory alloys.
4.5.7 Phase analysis of machined surface
The assessment of the XRD patterns to identify the phases which are present on the
surface of machined component, phases were analysed by using X’Pert high score
plus software. Generally XRD analyses are performed on specific surfaces that are
subjected to high temperature which may lead to transformation to different phases.
Since wire electro discharge machining involves melting of surface material caused
due to electrical discharge, XRD analysis has been carried out for at optimized
process parameters which can be seen in Fig. 4.16. XRD graph indicates the presence
of B19’ martensite phase, β’ phase and TiNiCo peaks of the shape memory alloy.
Other peaks of NiO2, TiO2, and TiNi were also noticed on the machined surface.
However the formation of NiO2, and TiO2, oxides are credited to the high reactivity of
Ti, and Ni with demineralised water used as the dielectric fluid during machining. The
formation of oxides are responsible for recast layer on the machined surface that
results in increment of net increase in hardness of the machined surface which is
evident from Fig.4.15. Similar trend have been observed by Hsieh et al. 2013 during
the wire electro discharge machining of TiNi based ternary alloys.

107
Figure 4.16 XRD analysis of machined surface at optimized process parameters for
each alloy.
4.6 SUMMARY
Machininig of Ti50Ni49Co1, Ti50Ni45Co5, and Ti50Ni40Co10 shape memory alloys has
been carried out by using wire electro discharge machining as per L-33 orthogonal
array and measured the WEDM responses (MRR and SR). To find the best
combination of process parameters multi-objective optimization techniques were
used. Further machined surface characterizations were studied at the optimized
process parameters. Based on the above studies the following highlights are listed
below-
It was found that MRR and SR increases upto 5 mm3/min and 3.46 µm
respectively with increment in pulse on time. Similarly increase in pulse off
time and servo voltage decreases MRR on an average upto 1 mm3/min and SR
1.46 µm. Trend of servo feed and wire speed were not uniform on these output
responses.
108
Formation of micro cracks, micro globules, micro voids are more consistent at
high pulse on time 125µs and at low servo voltage 20V and hence the
machined surface offers poor surface quality.
Compressive residual stress has been noticed at the optimized process
parameters for all three alloys. Compressive residual stress of 252.6 Mpa for
Ti50Ni49Co1 alloy, 270.2 Mpa for Ti50Ni45Co5 alloy and 265.9 Mpa for
Ti50Ni40Co10 alloy were found at optimized process parameters.
The cross sectional microstructure of the machined surface revealed that recast
layer surface is 35.4µm at pulse on time of 125 μs and low servo voltage of 20
V. Moreover, minimum RLT (4.21µm) was obtained at low pulse on time and
high servo voltage.
Harder surface was noticed near the machined surface due to NiO2 and TiO2
oxides formation which is confirmed by XRD analysis.
From the above observations it has been found that levels of pulse on time and servo
voltage for each alloy were different and rest of the process parameters were constant
for each alloys. Hence to understand deeply the effect of these two process
parameters, further study of these two process parameters will be considered for
machining and consequent WEDM responses will be measured. Detailed
characterization will be carried out at lower and higher values of MRR and SR.

109
CHAPTER 5
PARAMETRIC STUDY OF PULSE ON TIME AND SERVO
VOLTAGE DURING MACHINING OF TiNiCo SHAPE MEMORY
ALLOYS
5.1 INTRODUCTION
It is observed from chapter-4 that pulse on time and servo voltage are most influential
process parameters for machining of TiNiCo shape memory alloys. Therefore in the
present chapter two parameter approach has been adopted to observe deeply the effect
of pulse on time and servo voltage on the machining of different compositions of
TiNiCo shape memory alloys. Moreover, error analysis has been carried out
considering two parameter approach during the machining of all three alloys. Pulse on
time and servo voltage is considered as two influential parameters. This chapter
presents the comparison between experimental and predicted values. Artificial neural
network (ANN) is used as a predictor for the prediction of wire electro-discharge
machining (WEDM) responses such as the material removal rate (MRR) and surface
roughness (SR) during the machining of Ti50Ni49Co1, Ti50Ni45Co5 and Ti50Ni40Co10
shape memory alloy. Table 5.1 indicates input process parameters and their levels.
Pulse on time and servo voltage were varied and the other machining parameters of
Pulse off time, wire speed and servo feed are kept constant. To see the deeply effects
of pulse on time and servo voltage on MRR and SR L-25 orthogonal array was
adopted hence machining has been carried out as per L-25 orthogonal array created
using Taguchi design of experiment method and is as given in Table 5.2. The
machining performance MRR and SR are measured and the same is tabulated in Table
5.3.
Table 5.1 Input process parameters and their levels.
Input process parameters Levels
Pulse on time (µs) 105, 110, 115, 120, 125
Servo voltage (V) 20, 30, 40, 50, 60
Pulse off time (µs) 42

110
Wire speed (m/min) 4
Servo feed (mu) 2180
Table 5.2 L-25 Orthogonal array adopted for machining.
Run No. Pulse on time
(µs)
Servo voltage
(V)
1 105 20
2 105 30
3 105 40
4 105 50
5 105 60
6 110 20
7 110 30
8 110 40
9 110 50
10 110 60
11 115 20
12 115 30
13 115 40
14 115 50
15 115 60
16 120 20
17 120 30
18 120 40
19 120 50
20 120 60
21 125 20
22 125 30
23 125 40

111
24 125 50
25 125 60
Table 5.3 Machining performances measured for each alloy.
Run
Ti50Ni49Co1 Ti50Ni45Co5 Ti50Ni40Co10
SR
(µm)
MRR
(mm3/min)
SR
(µm)
MRR
(mm3/min)
SR
(µm)
MRR
(mm3/min)
1 1.68 4.62 1.51 3.71 1.44 3.51
2 1.61 3.64 1.46 3.12 1.22 3.06
3 1.48 2.99 1.33 2.28 1.18 2.11
4 1.37 2.6 1.19 1.89 1.06 1.69
5 1.29 1.8 1.11 1.5 1.04 1.36
6 2.49 5.27 2.29 4.42 1.98 3.17
7 2.07 5.14 2.2 3.19 1.84 3.06
8 1.89 3.58 2.03 2.21 1.67 2.28
9 1.65 2.73 1.76 2.19 1.59 2.01
10 1.71 2.01 1.67 1.84 1.2 1.51
11 115 3.1 7.8 2.72 6.18 2.45
12 2.51 6.18 2.26 5.01 2.31 4.81
13 2.43 4.16 2.25 3.71 2.16 3.51
14 2.5 2.99 2.41 2.86 2.15 2.41
15 2.01 2.94 2.15 2.51 1.98 2.15
16 3.9 9.23 3.85 8.32 3.41 8.08
17 2.76 7.15 2.57 6.31 2.41 6.17
18 2.51 5.97 2.43 5.58 2.2 5.14
19 2.65 3.97 2.35 3.58 2.2 3.84
20 2.57 2.9 2.32 2.81 2.17 2.47
21 4.51 11.51 4.01 9.43 3.63 9.06
22 3.63 9.04 3.2 8.65 3.01 6.55

112
23 3.25 8.13 3.07 8.06 2.45 5.6
24 2.98 5.27 2.41 5.2 2.26 4.9
25 2.81 3.85 2.39 3.38 2.2 2.99
5.2 VARIATION OF MRR WITH EXPERIMENTAL RUN FOR EACH
ALLOY
Fig. 5.1 exhibits variation in material removal rate with respect to different
experimental run for each alloy. From Fig. 5.1 observed that material removal rate
decreases up to experiment no 5; this can be attributed to increase in servo voltage
from experiment run 1 to 5 under constant pulse on time. When comes to the
experiment no. 6 again material removal rate increases then further it decreases till
experiment run 10 because of increase in servo voltage. Similar trend has been
noticed after each five experiments. Material removal rate decrease with increase in
servo voltage, because increase in servo voltage results in larger spark gap thereby
reducing the spark intensity and eventually lesser amount of material is removed from
the workpiece. Sharma et al. (2013) observed similar kind of result during wire
electro discharge machining of High- strength low-alloy steel (HSLA).
5.3 VARIATION OF SR WITH EXPERIMENTAL RUN FOR EACH ALLOY
The variation of surface roughness with respect to experimental run is given in the
Fig. 5.2. It has been found that surface roughness decreasing from experiment run 1 to
5. This can be attributed to increase in servo voltage from experiment run 1 to 5 under
constant pulse on time. Similar trend in SR is observed for experimental run 6 to 10,
11 to 15, 16 to 20 and 21 to 25. Surface roughness decrease with increase in servo
voltage because at the higher servo voltage less amount of material is melted on
machined surface, this can be easily flushed away from the machined surface by
dielectric fluid leading to low surface roughness. Khanna & Singh (2016) reported

113
similar variation of in SR with respect to servo voltage during wire electro discharge
machining of high carbon high chromium cold alloy tool (D-3) steel.
Figure 5.1 Material removal rate with respect to experimental run.
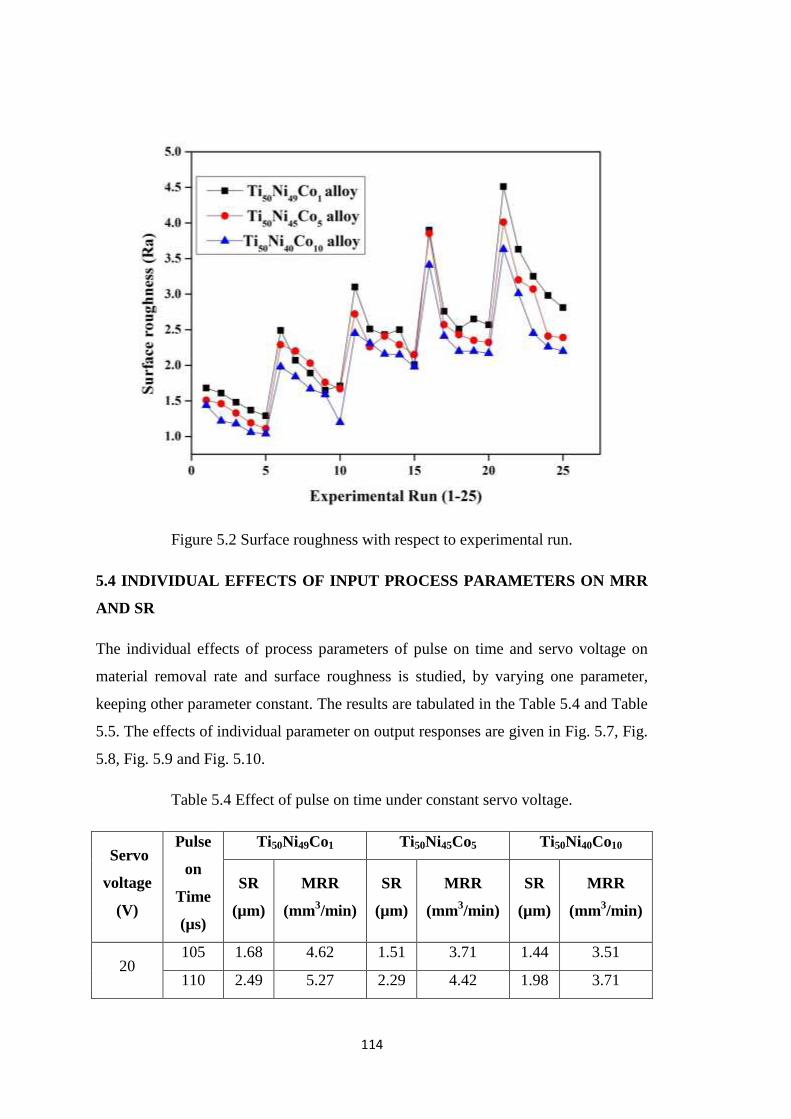
114
Figure 5.2 Surface roughness with respect to experimental run.
5.4 INDIVIDUAL EFFECTS OF INPUT PROCESS PARAMETERS ON MRR
AND SR
The individual effects of process parameters of pulse on time and servo voltage on
material removal rate and surface roughness is studied, by varying one parameter,
keeping other parameter constant. The results are tabulated in the Table 5.4 and Table
5.5. The effects of individual parameter on output responses are given in Fig. 5.7, Fig.
5.8, Fig. 5.9 and Fig. 5.10.
Table 5.4 Effect of pulse on time under constant servo voltage.
Servo
voltage
(V)
Pulse
on
Time
(µs)
Ti50Ni49Co1 Ti50Ni45Co5 Ti50Ni40Co10
SR
(µm)
MRR
(mm3/min)
SR
(µm)
MRR
(mm3/min)
SR
(µm)
MRR
(mm3/min)
20 105 1.68 4.62 1.51 3.71 1.44 3.51
110 2.49 5.27 2.29 4.42 1.98 3.71

115
115 3.1 7.8 2.72 6.18 2.45 5.92
120 3.9 9.23 3.85 8.32 3.41 8.08
125 4.51 11.51 4.01 9.43 3.63 9.06
30
105 1.61 3.64 1.46 3.12 1.22 3.06
110 2.07 5.14 2.2 3.19 1.84 3.06
115 2.51 6.18 2.26 5.01 2.31 4.81
120 2.76 7.15 2.57 6.31 2.41 6.17
125 3.63 9.04 3.2 8.65 3.01 6.55
40
105 1.48 2.99 1.33 2.28 1.18 2.11
110 1.89 3.58 2.03 2.21 1.67 2.28
115 2.43 4.16 2.25 3.71 2.16 3.51
120 2.51 5.97 2.43 5.58 2.2 5.14
125 3.25 8.13 3.07 8.06 2.45 5.6
50
105 1.37 2.6 1.19 1.89 1.06 1.69
110 1.65 2.73 1.76 2.19 1.59 2.01
115 2.5 2.99 2.41 2.86 2.15 2.41
120 2.65 3.97 2.35 3.58 2.2 3.84
125 2.98 5.27 2.41 5.2 2.26 4.9
60
105 1.29 1.8 1.11 1.5 1.04 1.36
110 1.71 2.01 1.67 1.84 1.2 1.51
115 2.01 2.94 2.15 2.51 1.98 2.15
120 2.57 2.9 2.32 2.81 2.17 2.47
125 2.81 3.85 2.39 3.38 2.2 2.99
Table 5.5 Effect of servo voltage under constant pulse on time.
Pulse
on
Time
(µs)
Servo
voltage
(V)
Ti50Ni49Co1 Ti50Ni45Co5 Ti50Ni40Co10
SR
(µm)
MRR
(mm3/min)
SR
(µm)
MRR
(mm3/min)
SR
(µm)
MRR
(mm3/min)
105 20 1.68 4.62 1.51 3.71 1.44 3.51

116
30 1.61 3.64 1.46 3.12 1.22 3.06
40 1.48 2.99 1.33 2.28 1.18 2.11
50 1.37 2.6 1.19 1.89 1.06 1.69
60 1.29 1.8 1.11 1.5 1.04 1.36
110
20 2.49 5.27 2.29 4.42 1.98 3.71
30 2.07 5.14 2.2 3.19 1.84 3.06
40 1.89 3.58 2.03 2.21 1.67 2.28
50 1.65 2.73 1.76 2.19 1.59 2.01
60 1.71 2.01 1.67 1.84 1.2 1.51
115
20 3.1 7.8 2.72 6.18 2.45 5.92
30 2.51 6.18 2.26 5.01 2.31 4.81
40 2.43 4.16 2.41 3.71 2.16 3.51
50 2.5 2.99 2.29 2.86 2.15 2.41
60 2.01 2.94 2.15 2.51 1.98 2.15
120
20 3.9 9.23 3.85 8.32 3.41 8.08
30 2.76 7.15 2.57 6.31 2.41 6.17
40 2.51 5.97 2.43 5.58 2.2 5.14
50 2.65 3.97 2.35 3.58 2.2 3.84
60 2.57 2.9 2.32 2.81 2.17 2.47
125
20 4.51 11.51 4.01 9.43 3.63 9.06
30 3.63 9.04 3.2 8.65 3.01 6.55
40 3.25 8.13 3.07 8.06 2.45 5.6
50 2.98 5.27 2.41 5.2 2.26 4.9
60 2.81 3.85 2.39 3.38 2.2 2.99
5.4.1 Effects of pulse on time on material removal rate under constant servo
voltage
Fig. 5.3 (a-e) shows the effects of pulse on time under constant servo voltage on
material removal rate. It is observed that material removal rate increase with increase
in pulse on time. Also the increase in servo voltage results in lower material removal

117
rate. At higher pulse on time more amount of spark create in the machining zone
which are responsible for removal of more amount of material from the surface of
work piece. At the same time if servo voltage is increased during machining, the
average spark gap increases, consecutively decreasing the spark intensity and leading
to lower material removal rate. Similar results have been reported by Timur et al.
(2016) during the wire electro discharge machining of titanium alloy (BT5). When all
the three alloys are machined at the same process parameters, material removal rate is
decreasing with increase in the percentage of cobalt in TiNi shape memory alloy. This
is due to increasing in the hardness with increase in percent of Co in TiNi alloy.
Similarly Bagoury (2014) observed that hardness is affected by addition of Co in
TiNi.

118
Figure 5.3 Effects of pulse on time on material removal rate under constant servo
voltage of (a) 20V, (b)30 V, (c) 40V, (d) 50V and (e) 60V.
5.4.2 Effects of pulse on time on surface roughness under constant servo voltage
Effects of pulse on time on surface roughness with constant servo voltage have been
presented in the Fig. 5.4 (a-e). It is observed that surface roughness is increasing with
increase in pulse on time with constant servo voltage. Also increase in servo voltage
resulting in decrease of surface roughness at the same values of pulse on time. At
higher pulse on time less time is available for flushing to remove the molten material
from the machined surface which is resolidify on the surface of machined components
in the form of melted drops and micro globules as seen in the Fig. 5.7. Hence higher
surface roughness observed at higher values of pulse on time. When servo voltage is
increased, surface roughness is decreased this is due to increase in servo voltage
results in larger spark gap thereby reducing the spark intensity and eventually lesser
amount of material is removed from the surface of the workpiece. Comparatively
higher surface roughness is observed for Ti50Ni49Co1 alloy, while lower surface
roughness is noticed during the machining of Ti50Ni40Co10 alloy at the same levels of
process parameters.

119
Figure 5.4 Effects of pulse on time on surface roughness under constant servo voltage
(a) 20V, (b)30 V, (c) 40V, (d) 50V and (e) 60V.
5.4.3 Effects of servo voltage on material removal rate under constant pulse on
time
Fig. 5.5 (a-e) indicates effect of servo voltage with constant pulse on time. It is
observed that material removal rate decrease with the increase in servo voltage and at
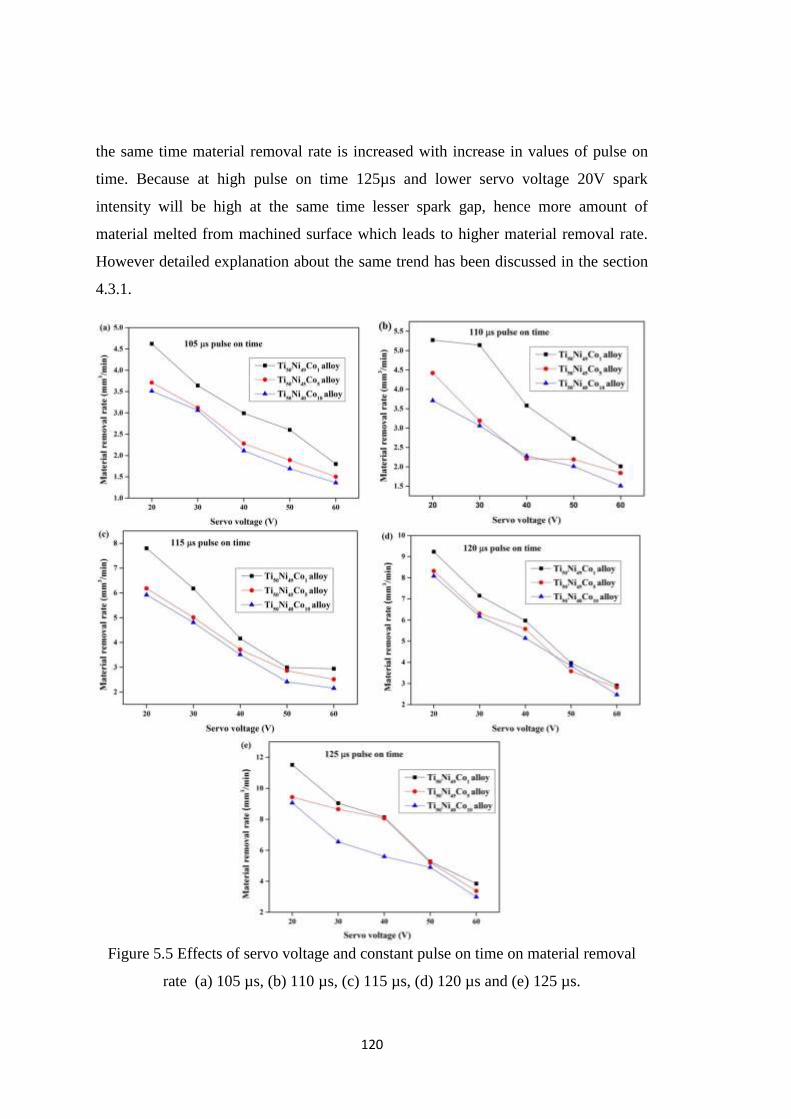
120
the same time material removal rate is increased with increase in values of pulse on
time. Because at high pulse on time 125µs and lower servo voltage 20V spark
intensity will be high at the same time lesser spark gap, hence more amount of
material melted from machined surface which leads to higher material removal rate.
However detailed explanation about the same trend has been discussed in the section
4.3.1.
Figure 5.5 Effects of servo voltage and constant pulse on time on material removal
rate (a) 105 µs, (b) 110 µs, (c) 115 µs, (d) 120 µs and (e) 125 µs.

121
5.4.4 Effects of servo voltage on surface roughness under constant pulse on time
Fig. 5.6 (a-e) represents the effect of servo voltage on surface roughness with constant
pulse on time. Reduction in the surface roughness is noticed with the increase in servo
voltage. When pulse on time is increased at the same values of servo voltage,
increment in surface roughness is noticed. More sparks produce at higher pulse on
time which is responsible to melt more amount of material from the surface of
workpiece, some of melted material is taken away by dielectric fluid, leftover molten
material deposited on the surface of workpiece in the form of melted drops and micro
globules and leads to higher surface roughness. Same as explained with detail in the
section of 4.3.2. Lower values of surface roughness have been observed for
machining under pulse on time of 105µs and higher surface roughness was measured
at 125 µs pulse on time.

122
Figure 5.6 Effects of servo voltage and constant pulse on time on surface roughness
(a) 105 µs, (b) 110 µs, (c) 115 µs, (d) 120 µs and (e) 125 µs.
5.5 MORPHOLOGY OF MACHINED SURFACE
Microstructural analysis has been carried out at the lower and higher values of
materials removal rate and surface roughness which is shown in the Fig. 5.7 (a-f).
Lower values of outputs found the at run number 5 (pulse on time 105µs and servo
voltage 60V) and higher values of outputs are found at the run number 21 (pulse on
time 125µs and servo voltage 20V) for all three alloys.1.8 mm3/min MRR for
Ti50Ni49Co1, 1.5 mm3/min MRR for Ti50Ni45Co5 and 1.36 mm
3/min MRR for
Ti50Ni40Co10 have been noticed as lower values of material removal rate. 1.29 µm SR
for Ti50Ni49Co1, 1.11 µm SR for Ti50Ni45Co5 and 1.04 µm SR for Ti50Ni40Co10 have
been noticed as lower values of surface roughness. 11.51 mm3/min MRR for
Ti50Ni49Co1, 9.43 mm3/min MRR for Ti50Ni45Co5 and 9.06 mm
3/min MRR for
Ti50Ni40Co10 have been noticed as higher values of material removal rate. 4.51 µm SR
for Ti50Ni49Co1, 4.01 µm SR for Ti50Ni45Co5 and 3.63 µm SR for Ti50Ni40Co10 have
been noticed as higher values of surface roughness. The trend of variation in material
removal rate and surface roughness are similar with the same process parameters for
all three alloys, but the values of these outputs are reduced with increase in the
percentage of Co in TiNi shape memory alloy. Comparatively Ti50Ni40Co10 alloy
exhibit better surface roughness at higher material removal rate, whereas rougher
surface was observed for Ti50Ni49Co1 alloy as can be seen in the Fig. 5.4. The
microstructure exhibit the presence of few micro globules, melted drops and micro

123
cracks due to lower pulse on time (105µs) and higher servo voltage (60V) during the
machining, because at the lower pulse on time spark intensity is low and this results in
lower amount of spark created in the machining zone and lesser amount of material is
removed from the surface of workpiece which can be easily removed through flushing
with help of dielectric fluid from the machined surface. This reduces the formation of
machining defects on the machined surface such as micro cracks, micro globules and
melted drops. At the same time, when the servo voltage is high, the spark gap is
increased; hence more time is available for flushing the melted material from the
machined surface therefore most of the melted material is remove from the machined
surface results in only few micro cracks, micro globules and melted drops. The
microstructures 5.7b for Ti50Ni49Co1 alloy, Fig. 5.7d for Ti50Ni45Co5 alloy, and Fig.
5.7f for Ti50Ni40Co10 alloy exhibit higher values of material removal rate and surface
roughness. The microstructures, shows the presence of higher amount of microcracks,
melted drops, microglobules on the machined surface during machining under higher
pulse on time 125µs and lower servo voltage 20V. At high pulse on time, spark
intensity is high and hence less time is available to remove the melted material form
the machined surface. Hence less amount of melted material are removed, rest of the
melted material are resolidify on the machined surface in the form of microcracks,
melted drops, microglobules on the machined surface, this leads to the higher surface
roughness (Fig. 5.5e). Moreover, high temperature experienced by the material due to
continuous sparking in the machining zone along with dielectric breakdown results in
formation of microglobules as seen from the micrographs depicted in Fig. 5.7. On the
other hand more cracks appeared on the machined surface at the lower servo voltage
when compared to samples machined at higher servo voltage. At low servo voltage,
surface roughness will be higher due to more intense spark discharge on the
machining surface that leads to formation of larger and abrupt crater along with faster
resolidification of molten material by dielectric quenching. Similar results have been
reported by Chen et al. (2007) during the electro discharge machining of TiNiCr and
TiNiZr shape memory alloys.

124
Figure 5.7 Machined surface morphology at higher value of outputs (a) Ti50Ni49Co1
alloy, (c) Ti50Ni45Co5 alloy, and (e) Ti50Ni40Co10 alloy) and lower values of outputs
(b) Ti50Ni49Co1 alloy, (d) Ti50Ni45Co5 alloy, and (f) Ti50Ni40Co10 alloy).
5.6 SURFACE TOPOGRAPHY
Surface topography analysis has been carried out at lower and higher values of MRR
and SR for all the three alloys. 1.8 mm3/min MRR for Ti50Ni49Co1, 1.5 mm
3/min
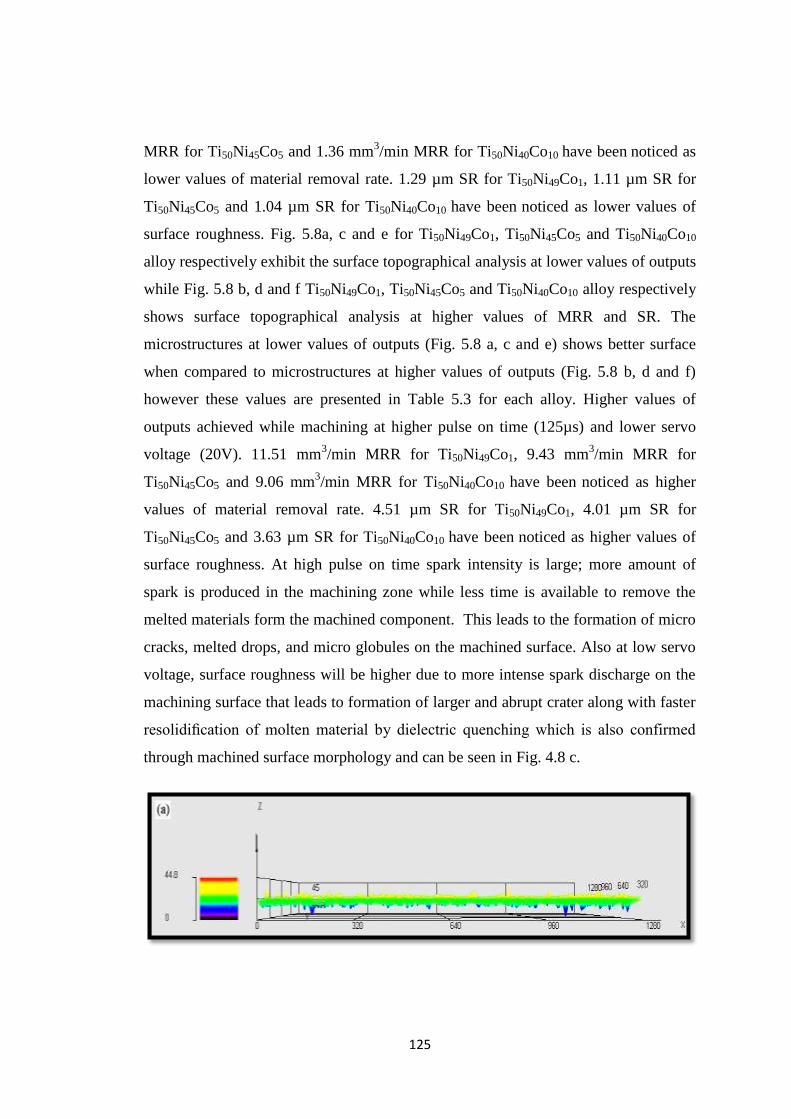
125
MRR for Ti50Ni45Co5 and 1.36 mm3/min MRR for Ti50Ni40Co10 have been noticed as
lower values of material removal rate. 1.29 µm SR for Ti50Ni49Co1, 1.11 µm SR for
Ti50Ni45Co5 and 1.04 µm SR for Ti50Ni40Co10 have been noticed as lower values of
surface roughness. Fig. 5.8a, c and e for Ti50Ni49Co1, Ti50Ni45Co5 and Ti50Ni40Co10
alloy respectively exhibit the surface topographical analysis at lower values of outputs
while Fig. 5.8 b, d and f Ti50Ni49Co1, Ti50Ni45Co5 and Ti50Ni40Co10 alloy respectively
shows surface topographical analysis at higher values of MRR and SR. The
microstructures at lower values of outputs (Fig. 5.8 a, c and e) shows better surface
when compared to microstructures at higher values of outputs (Fig. 5.8 b, d and f)
however these values are presented in Table 5.3 for each alloy. Higher values of
outputs achieved while machining at higher pulse on time (125µs) and lower servo
voltage (20V). 11.51 mm3/min MRR for Ti50Ni49Co1, 9.43 mm
3/min MRR for
Ti50Ni45Co5 and 9.06 mm3/min MRR for Ti50Ni40Co10 have been noticed as higher
values of material removal rate. 4.51 µm SR for Ti50Ni49Co1, 4.01 µm SR for
Ti50Ni45Co5 and 3.63 µm SR for Ti50Ni40Co10 have been noticed as higher values of
surface roughness. At high pulse on time spark intensity is large; more amount of
spark is produced in the machining zone while less time is available to remove the
melted materials form the machined component. This leads to the formation of micro
cracks, melted drops, and micro globules on the machined surface. Also at low servo
voltage, surface roughness will be higher due to more intense spark discharge on the
machining surface that leads to formation of larger and abrupt crater along with faster
resolidification of molten material by dielectric quenching which is also confirmed
through machined surface morphology and can be seen in Fig. 4.8 c.

126

127
Figure 5.8 Surface topography analysis of machined surface at lower values of
outputs (a) Ti50Ni49Co1 alloy, (c) Ti50Ni45Co5 alloy and (e) Ti50Ni40Co10 alloy and
higher values of outputs (b) Ti50Ni49Co1 alloy, (d) Ti50Ni40Co5 alloy and (f)
Ti50Ni40Co10 alloy.
5.7 MICRO HARDNESS ANALYSIS
Microhardness analysis has been carried out at lower (1.8 mm3/min MRR for
Ti50Ni49Co1, 1.5 mm3/min MRR for Ti50Ni45Co5 and 1.36 mm
3/min MRR for
Ti50Ni40Co10 have been noticed as lower values of material removal rate. 1.29 µm SR
for Ti50Ni49Co1, 1.11 µm SR for Ti50Ni45Co5 and 1.04 µm SR for Ti50Ni40Co10 alloy)
and higher values of outputs (11.51 mm3/min MRR for Ti50Ni49Co1, 9.43 mm
3/min
MRR for Ti50Ni45Co5 and 9.06 mm3/min MRR for Ti50Ni40Co10 have been noticed as
higher values of material removal rate. 4.51 µm SR for Ti50Ni49Co1, 4.01 µm SR for
Ti50Ni45Co5 and 3.63 µm SR for Ti50Ni40Co10 alloy). Fig. 5.9 indicates the micro
hardness at lower values of outputs and Fig. 5.10 shows the microhardness at higher
values of outputs. During the WEDM process three different zones are forming from
the machined surface namely recast layer zone, heat affected zone and converted layer
zone (Choudhary et al. 2010). Generally microhardness of converted layer zone is not
affected during the WEDM process while recast layer and heat affected zone affects
the microhardness of machined component. While measuring microhardness, recast
layer near the cutting edge was considered as a starting point (0µm) and
microhardness was measured towards the base material. From Fig. 5.9 and Fig. 5.10 it
can be observed that hardness noted along the cross section of the machined surface
follows a decreasing trend starting from recast layer to heat affected zone. The micro
hardness of converted layer is almost equal to the hardness of base material because

128
converted layer is not much affected of by WEDM. The average value of micro
hardness at the lower values of outputs in recast layer zone is 624 HV for
Ti50Ni49Co10, 602 HV for Ti50Ni45Co5 and 580 HV for Ti50Ni40Co1 alloy while
average values of microhardness in heat affected zone is 544 HV for Ti50Ni49Co10,
518 HV for Ti50Ni45Co5 and 510 HV for Ti50Ni40Co1 alloy. Similarly at higher values
of output microhardness in recast layer zone is 601 HV for Ti50Ni49Co10, 590 HV for
Ti50Ni45Co5 and 570 HV for Ti50Ni40Co1 alloy, while micro hardness reported in heat
affected zone is 519 HV for Ti50Ni49Co10 500 HV for Ti50Ni45Co5 and 488 HV for
Ti50Ni40Co1 alloy. Moreover it is observed that by increasing percentage of Co in
TiNi, resulting in decrease of micro hardness. High hardness on the machined surface
is due to formation of surface oxides of TiO2, NiTiO3 and NiO Fig.4.16. The micro
hardness in the heat affected zone is less than at recast layer; this may be due to phase
transformation in the TiNiCo alloy which can be seen in Fig. 4.16. Similar results
were reported by Hsieh et al. (2009 and 2013) during the EDM of TiNiZr and TiAlFe
alloys.
Figure 5.9 Variation of micro hardness along the cross section at the lower values of
outputs.

129
Figure 5.10 Variation of micro hardness along the cross section at the higher values of
outputs.
5.8 RECAST LAYER THICKNESS
Recast layer thickness measurement has been carried out at lower and higher values
of output. 1.8 mm3/min MRR for Ti50Ni49Co1, 1.5 mm
3/min MRR for Ti50Ni45Co5 and
1.36 mm3/min MRR for Ti50Ni40Co10 have been noticed as lower values of material
removal rate. 1.29 µm SR for Ti50Ni49Co1, 1.11 µm SR for Ti50Ni45Co5 and 1.04 µm
SR for Ti50Ni40Co10 have been noticed as lower values of surface roughness. 11.51
mm3/min MRR for Ti50Ni49Co1, 9.43 mm
3/min MRR for Ti50Ni45Co5 and 9.06
mm3/min MRR for Ti50Ni40Co10 have been noticed as higher values of material
removal rate. 4.51 µm SR for Ti50Ni49Co1, 4.01 µm SR for Ti50Ni45Co5 and 3.63 µm
SR for Ti50Ni40Co10 have been noticed as higher values of surface roughness. Fig. 5.11
and Fig. 5.12 indicate the recast layer thickness of machined surface. During wire
electro discharge machining, rapid heating and quenching of the molten material by
the dielectric fluid causes the formation of a solidified layer and gets deposited on the
machined surface, which makes harder surface of machined component. The

130
measured values of recast layer thickness at lower values of output is 4.2 µm for
Ti50Ni49Co1, 4.6 µm for Ti50Ni45Co5 and 4.9 µm for Ti50Ni40Co10 alloy, while recast
layer thickness at higher values of outputs is 30 µm for Ti50Ni49Co1, 32 µm for
Ti50Ni45Co5 and 35 µm for Ti50Ni40Co10 alloy. Thicker recast layer has been observed
at the higher values of output or at input process parameters of 125µs Ton and 20V
SV. At high pulse on time workpiece receives more spark discharge of higher
intensity which leads to thicker recast layer formation. Longer pulse duration
generally leads to higher discharge energy per unit cycle that melts more material and
re-solidifies due to rapid quenching by constantly flowing de-ionized water on the
machined surface. On the other hand, thin film of recast layer was noticed from the
Fig. 5.11, Fig. 5.11b and 5.11c due to lower 105 µs pulse on time and higher servo
voltage 60V. Similar results have been reported by Sharma et al. (2015) during WED
machining of Inconel 706.

131
Figure 5.11 Recast layer thickness at lower values of outputs (a) Ti50Ni49Co1 alloy, (b)
Ti50Ni45Co5 alloy and (c) Ti50Ni40Co10 alloy.
Figure 5.12 Recast layer thickness at higher values of outputs (a) Ti50Ni49Co1 alloy,
(b) Ti50Ni40Co5 alloy and (c) Ti50Ni40Co10 alloy.
5.9 RESIDUAL STRESS ANALYSIS
Residual stress exists on the machined surface is either tensile or compressive in
nature. The residual stresses exist on the WED machined surface, due to non-
homogeneity of heat flow, metallurgical transformations in the machining zone and
plastic deformation (Ekmekci et al. 2005 and Newton et al. 2009). Plastic deformation
induces the compressive residual stresses by mechanical load and tensile residual
stress by thermal load (Srinivasa Rao et al. 2016). The phase transformations led to
the change in volume of surface and subsurface layers, so the decrease or increase of
its volume was hindered by bulk material resulting in generation of tensile or
compressive residual stresses respectively. Generally, wire electro discharge

132
machining induced tensile residual stresses on the machined surface or in the recast
layer zone further it decrease to the heat affected zone because of high spark energy
involved in the machining zone. In the present study, recast layer formed on the
machined surface is removed by means of polishing and residual stress measurement
is made on the machined surface without recast layer. The measured values of
residual stress on the machined surface at lower (1.8 mm3/min MRR for Ti50Ni49Co1,
1.5 mm3/min MRR for Ti50Ni45Co5 and 1.36 mm
3/min MRR for Ti50Ni40Co10 have
been noticed as lower values of material removal rate. 1.29 µm SR for Ti50Ni49Co1,
1.11 µm SR for Ti50Ni45Co5 and 1.04 µm SR for Ti50Ni40Co10 alloy) and higher
values of outputs (11.51 mm3/min MRR for Ti50Ni49Co1, 9.43 mm
3/min MRR for
Ti50Ni45Co5 and 9.06 mm3/min MRR for Ti50Ni40Co10 have been noticed as higher
values of material removal rate. 4.51 µm SR for Ti50Ni49Co1, 4.01 µm SR for
Ti50Ni45Co5 and 3.63 µm SR for Ti50Ni40Co10 alloy) are shown in the Fig. 5.13.
Tensile residual has been found on the machined surface of all three alloys. 15 Mpa
for Ti50Ni49Co1, 10Mpa for Ti50Ni45Co5 and 6 Mpa for Ti50Ni40Co10 alloy residual
stresses have been found at lower values of outputs. Mpa for 255 Ti50Ni49Co1, 244
Mpa for Ti50Ni45Co5 and 235 Mpa for Ti50Ni40Co10 alloy residual stresses have been
found at higher values of outputs. Minimum residual stress has been observed on the
machined surface of Ti50Ni49Co10 alloy while maximum stress has seen on the
machined surface of Ti50Ni40Co1 alloy. Also residual stresses measured at lower
values of surface roughness and material removal rate is less than residual stress at the
higher values of these outputs. The increase in residual stress observed at higher
values of output responses is due to machining of surface under higher values of pulse
on time and lower values of the servo voltage. At the higher value of pulse on time
more energy of spark has been produced and at the same time lower values of servo
voltage implies less spark gap, these two effects result in more melting and
solidification of melted material on machined surface. Hence melting and
solidification leads to higher tensile residual stresses on the machined surface. The
surface morphology of machined surface is presented in Fig. 5.7 with micro cracks
and thinner recast layer, formation of recast layer can be seen in Fig. 5.11 and 5.12,
implies the presence of tensile residual stresses.

133
Figure 5.13 Residual stresses of machined surface.
From the above observation it has been confirmed that pulse on time and servo
voltage were major affected process parameters of wire electro discharge machining
process. To find the error of experimental responses and predicted responses, error
analysis will be carried out in further study.
5.10 ARTIFICIAL NEURAL NETWORK
ANN is an artificial illustration of the human brain that tries to simulate its learning
approach which is an interconnected pair of artificial neurons that uses a mathematical
model for information processing based on a connectionist method to computation.
Neural networks are non-linear mapping systems that consist of simple processors
which are called neurons, linked by weighted connections. Each neuron has inputs
and generates an output that can be seen as the reflection of local information that is
stored in connections. Among ANN models, the feed-forward neural network based
on back-propagation is the well proved general-purpose model. Hence in the present
work, the network has two inputs of Ton and SV and two outputs of MRR and SR.
Matlab software is used for predicting the responses. To prediction of MRR and SR
70% data was kept in training and rest of the data was test data during the prediction.
To get the best regression plots which give accurate prediction 15 hidden layers were
adopted during the training of the data. Developed ANN model can be seen in Fig.
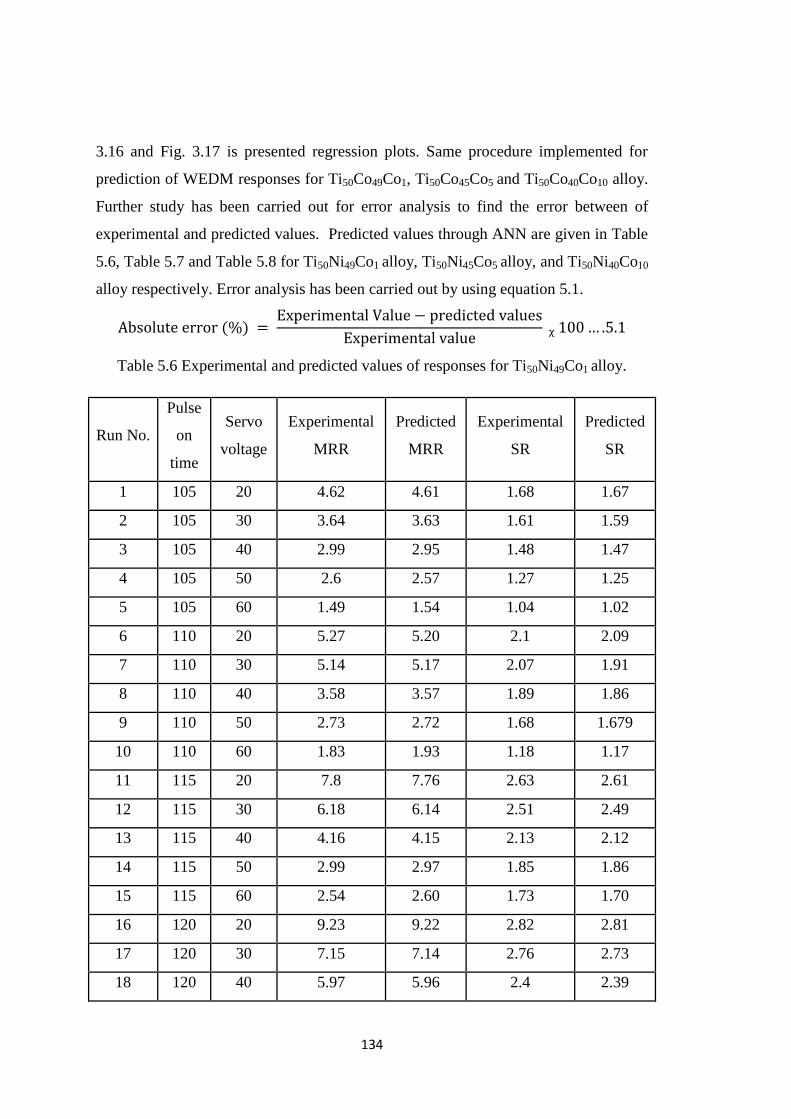
134
3.16 and Fig. 3.17 is presented regression plots. Same procedure implemented for
prediction of WEDM responses for Ti50Co49Co1, Ti50Co45Co5 and Ti50Co40Co10 alloy.
Further study has been carried out for error analysis to find the error between of
experimental and predicted values. Predicted values through ANN are given in Table
5.6, Table 5.7 and Table 5.8 for Ti50Ni49Co1 alloy, Ti50Ni45Co5 alloy, and Ti50Ni40Co10
alloy respectively. Error analysis has been carried out by using equation 5.1.
Absolute error (%) = Experimental Value − predicted values
Experimental value ᵪ 100 … .5.1
Table 5.6 Experimental and predicted values of responses for Ti50Ni49Co1 alloy.
Run No.
Pulse
on
time
Servo
voltage
Experimental
MRR
Predicted
MRR
Experimental
SR
Predicted
SR
1 105 20 4.62 4.61 1.68 1.67
2 105 30 3.64 3.63 1.61 1.59
3 105 40 2.99 2.95 1.48 1.47
4 105 50 2.6 2.57 1.27 1.25
5 105 60 1.49 1.54 1.04 1.02
6 110 20 5.27 5.20 2.1 2.09
7 110 30 5.14 5.17 2.07 1.91
8 110 40 3.58 3.57 1.89 1.86
9 110 50 2.73 2.72 1.68 1.679
10 110 60 1.83 1.93 1.18 1.17
11 115 20 7.8 7.76 2.63 2.61
12 115 30 6.18 6.14 2.51 2.49
13 115 40 4.16 4.15 2.13 2.12
14 115 50 2.99 2.97 1.85 1.86
15 115 60 2.54 2.60 1.73 1.70
16 120 20 9.23 9.22 2.82 2.81
17 120 30 7.15 7.14 2.76 2.73
18 120 40 5.97 5.96 2.4 2.39

135
19 120 50 3.97 3.96 2.4 2.35
20 120 60 2.8 2.74 2.27 2.14
21 125 20 11.51 11.51 3.87 3.77
22 125 30 9.04 9.5 3.63 3.59
23 125 40 8.13 8.12 3.25 3.24
24 125 50 5.27 5.26 2.66 2.65
25 125 60 3.45 3.50 2.31 2.14
Table 5.7 Experimental and predicted values of responses for Ti50Ni45Co5 alloy.
Run No.
Pulse
on
time
Servo
voltage
Experimental
MRR
Predicted
MRR
Experimental
SR
Predicted
SR
1 105 20 3.71 3.40 1.51 1.60
2 105 30 3.12 3.10 1.46 1.43
3 105 40 2.28 2.27 1.33 1.36
4 105 50 1.69 1.68 1.3 1.29
5 105 60 1.11 1.10 1.02 1.02
6 110 20 4.42 4.64 2.29 2.52
7 110 30 3.19 3.18 2.2 2.19
8 110 40 2.21 2.31 2.03 2.16
9 110 50 1.69 1.67 1.96 1.94
10 110 60 1.24 1.25 1.67 1.74
11 115 20 6.18 6.14 2.72 1.64
12 115 30 5.01 5.01 2.26 2.26
13 115 40 3.71 4.19 2.15 2.18
14 115 50 2.86 2.91 2.1 2.21
15 115 60 1.82 1.74 2.05 2.10
16 120 20 8.32 8.18 2.99 3.05
17 120 30 6.31 6.30 2.77 2.76

136
18 120 40 5.58 5.57 2.53 2.55
19 120 50 3.58 3.43 2.53 2.18
20 120 60 2.34 2.41 2.32 2.20
21 125 20 9.43 8.65 3.42 3.2
22 125 30 8.65 8.649 3.2 3.1999
23 125 40 8.06 8.0563 3.07 3.0884
24 125 50 5.2 5.3072 2.41 2.4475
25 125 60 3.38 3.3534 2.17 2.2198
Table 5.8 Experimental and predicted values of responses for Ti50Ni40Co10 alloy.
Run No.
Pulse
on
time
Servo
voltage
Experimental
MRR Predicted
MRR
Experimental
SR Predicted
SR
1 105 20 3.51 3.5 1.84 1.84
2 105 30 3.06 3.24 1.72 1.57
3 105 40 2.41 2.32 1.58 1.48
4 105 50 1.69 1.69 1.26 1.26
5 105 60 1.04 1.04 1.18 1.18
6 110 20 3.71 3.66 1.98 2.05
7 110 30 3.06 3.21 1.84 1.97
8 110 40 2.28 2.40 1.67 1.80
9 110 50 1.63 1.62 1.49 1.48
10 110 60 1.11 1.10 1.2 1.20
11 115 20 5.92 5.91 2.45 2.44
12 115 30 4.81 4.75 2.31 2.49
13 115 40 3.51 3.51 2.26 2.39
14 115 50 2.41 2.40 2.15 2.15
15 115 60 1.63 1.60 1.78 1.82
16 120 20 8.78 8.77 3.41 3.40

137
17 120 30 6.31 6.30 3.12 3.11
18 120 40 5.04 5.20 2.2 2.33
19 120 50 3.84 3.83 2.2 2.20
20 120 60 2.47 2.47 2.17 2.1698
21 125 20 9.68 9.5049 3.63 3.6018
22 125 30 6.55 6.5514 3.3 3.3002
23 125 40 5.6 2.6704 2.45 2.7634
24 125 50 4.9 4.8999 2.26 2.2601
25 125 60 2.99 2.99 2.13 2.1298
5.11 EFFECTS OF EACH EXPERIMENTAL RUN ON MATERIAL
REMOVAL RATE
An artificial neural network (ANN) approach is an effective tool to predict process
parameters and can generate the outputs for a set of inputs that are within the range of
the original inputs during the training phase. Shandilya et al. (2013) made an attempt
to predict the WEDM response such as cutting speed. They considered response
surface design and artificial neural network method to predict the cutting speed during
the wire electro discharge machining of SiCp/6061 Al metal matrix composite
(MMC) and found that artificial neural network method gives more accurate value
than response surface method. Similarly Surya et al. (2017) also compared
experimental material removal rate of wire electro discharge machining of Al7075-
TiB2 in-situ composite and artificial neural network based predicated material
removal rate, they found 1.31% error during their observation. The effect of each
experimental run on MRR is given in the Fig. 5.14 for Ti50Ni49Co1 alloy, Fig. 5.16 for
Ti50Ni45Co5 alloy and Fig. 5.18 for Ti50Ni40Co10 alloy. It is observed from these
figures that ANN based predicted values are closer to experimental values for MRR.
The material removal rate decreases up to experiment no 5 because of increase in the
servo voltage with a constant pulse on time. A similar trend has been noticed after
every five experiments that MRR decrease with an increase in servo voltage for
different values of a pulse on time. Material removal rate decreases with increase in

138
servo voltage because the increase in servo voltage results in larger spark gap thereby
reducing the spark intensity and eventually lesser amount of material is removed from
the surface of the workpiece. Sharma et al. (2013) also observed similar kind of result
during the wire electro-discharge machining of High- strength low-alloy steel
(HSLA). The about the effects of process parameters on material removal rate have
been discussed in the section of 4.3.1.
5.12 EFFECTS OF THE EACH EXPERIMENTAL RUN ON SURFACE
ROUGHNESS
As above discussed that artificial neural network prediction tool is appropriate
prediction tool for prediction the output responses. Similar behaviour was observed by
Karthikkeyan et al. (1999) that artificial neural network is suitable tool for better and
have a higher predictive capability of surface roughness values. The values of surface
roughness are predicted by artificial neural network in the present study during the
wire electro discharge machining of Ti50Ni49Co1, Ti50Ni45Co5 and Ti50Ni40Co10 alloy.
Details about the developed model of artificial neural network are presented in section
3.8. The effect of each experimental run on surface roughness is given in the Fig. 5.15
for Ti50Ni49Co1 alloy, Fig. 5.17 for Ti50Ni45Co5 alloy and Fig. 5.19 for Ti50Ni40Co10
alloy. It is observed from these figures that ANN based predicted values are more
close to experimental values for SR. The surface roughness decreasing from an
experiment run 1 through experiment run 5, due to increase in servo voltage with a
constant pulse on time. A similar trend has been noticed after every five experiments.
Surface roughness decrease with increase in servo voltage because at the higher servo
voltage less amount of material is melted on the machined surface; this can be easily
flushed away from the machined surface through dielectric fluid leading to low
surface roughness. Details about the effect of process parameters on surface
roughness have been discussed in the section of 4.3.2.
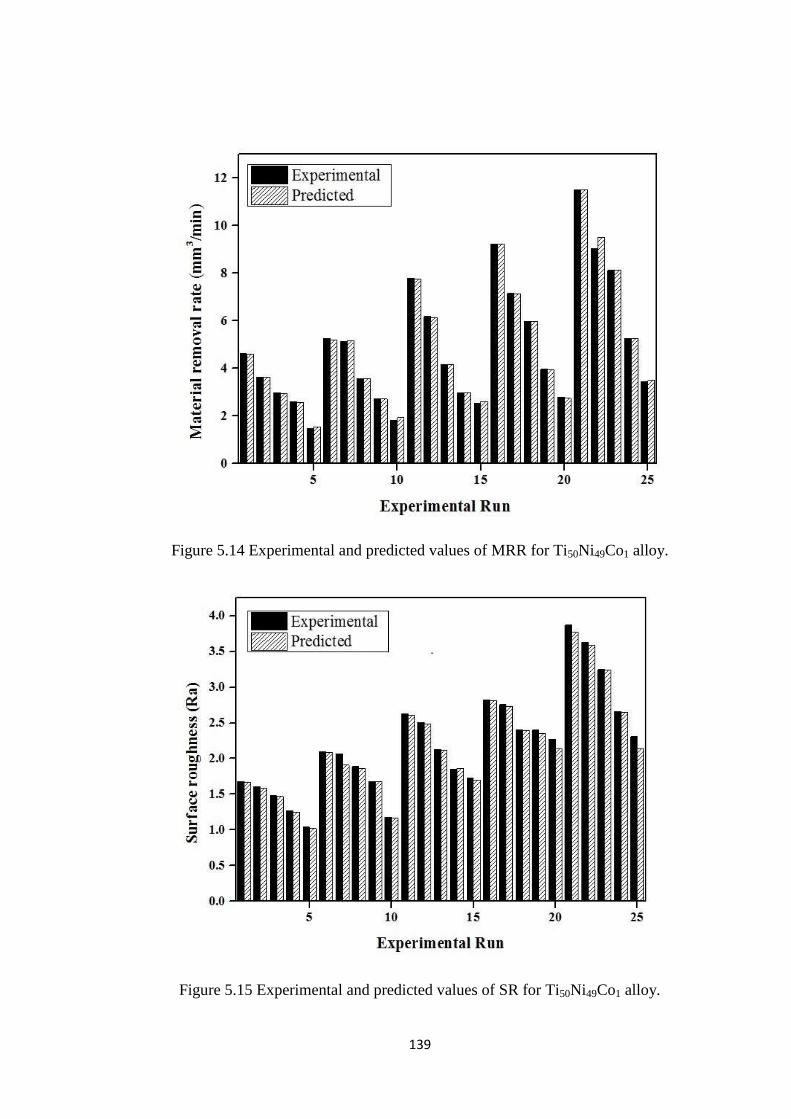
139
Figure 5.14 Experimental and predicted values of MRR for Ti50Ni49Co1 alloy.
Figure 5.15 Experimental and predicted values of SR for Ti50Ni49Co1 alloy.
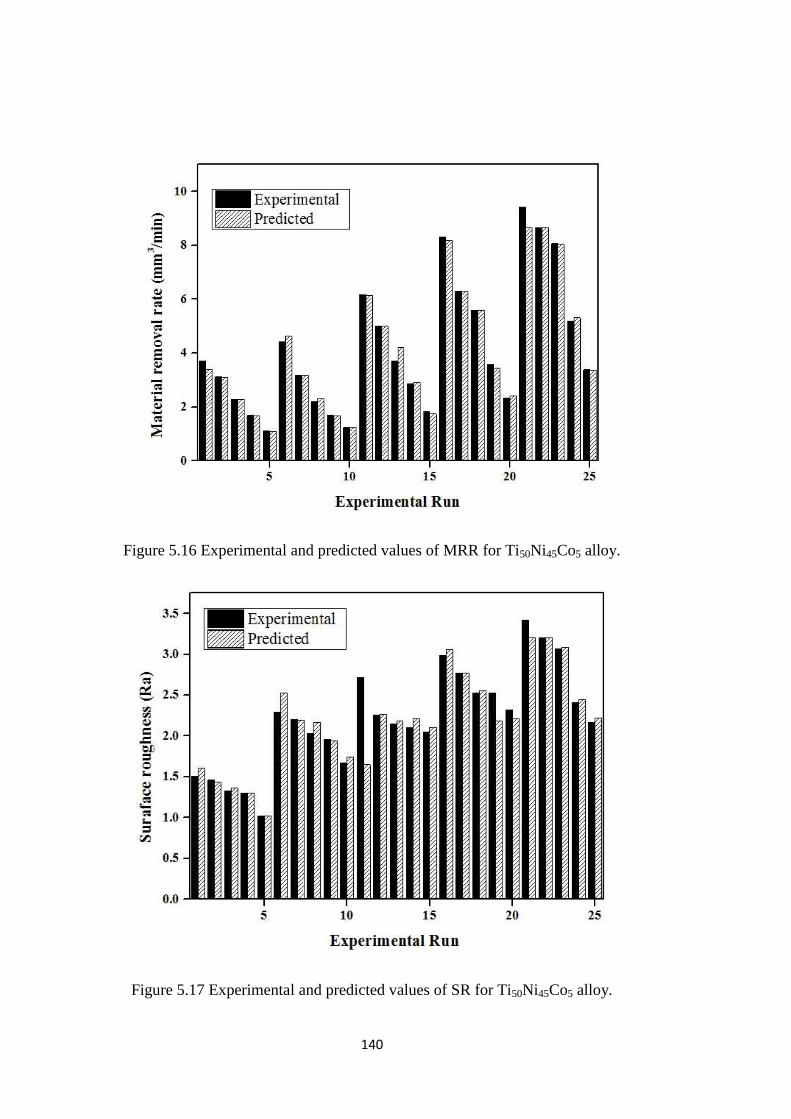
140
Figure 5.16 Experimental and predicted values of MRR for Ti50Ni45Co5 alloy.
Figure 5.17 Experimental and predicted values of SR for Ti50Ni45Co5 alloy.

141
Figure 5.18 Experimental and predicted values of MRR for Ti50Ni40Co10 alloy.
Figure 5.19 Experimental and predicted values of SR for Ti50Ni40Co10 alloy.

142
5.13 PERCENTAGE ERROR
Fig.5.20 and Fig. 5.21 shows the percentage error for MRR and SR evaluated through
ANN for all the alloys. Table 5.9 presents the maximum percentage error. It is found
that the maximum percentage error is 8 percent and ANN gives accurate values. The
error observed between experimental data and predicted data is small. Similar work
has been reported by shandilya et al. (2013) during their comparative study on RSM
and ANN based predicted values of cutting speed while machining SiCp/6061 Al
metal matrix composite using wire electro-discharge machine.
Table 5.9 Maximum error for all three alloys.
Alloy Maximum Error obtained through ANN
MRR SR
Ti50Ni49Co1 6 % 8%
Ti50Ni45Co5 5% 7%
Ti50Ni40Co10 6% 8%

143
Figure 5.20 Error in % for MRR at all experimental run.
Figure 5.21 Error in % for SR at all experimental run.
5.14 SUMMARY
The effects of pulse on time and servo voltage on material removal rate and surface
roughness were discussed based on the above studies following highlights are listed
below-
Lower values of material removal rate 1.8 mm3/min for Ti50Ni49Co1, 1.5
mm3/min for Ti50Ni45Co5 and 1.36 mm
3/min for Ti50Ni40Co10 and surface
roughness 1.29 µm for Ti50Ni49Co1, 1.11 µm for Ti50Ni45Co5, 1.04 µm for
Ti50Ni40Co10 were noticed at 60V servo voltage and 105µs pulse on time.
Higher values of material removal rate 11.51 mm3/min for Ti50Ni49Co1, 9.43
mm3/min for Ti50Ni45Co5 and 9.06 mm
3/min for Ti50Ni40Co10 and surface
roughness 4.51 µm for Ti50Ni49Co1, 4.01 µm for Ti50Ni45Co5, 3.63 µm for
Ti50Ni40Co10 were noticed at 20V servo voltage and 125µs pulse on time.

144
Formation of micro cracks, micro globules, micro voids are more consistent at
high pulse on time 125µs and at low servo voltage 20V and therefore the
machined surface offers poor surface quality.
624 HV for Ti50Ni49Co10, 602 HV for Ti50Ni45Co5 and 580 HV for Ti50Ni40Co1
alloy harder surface have been found at lower values of outputs responses of
WEDM.
The recast layer thickness at lower values of outputs is 4.2 µm for Ti50Ni49Co1,
4.6 µm for Ti50Ni45Co5 and 4.9 µm for Ti50Ni40Co10 alloy while recast layer
thickness at higher values of outputs is 30 µm for Ti50Ni49Co1, 32 µm for
Ti50Ni45Co5 and 35 µm for Ti50Ni40Co10 alloy were noticed.
At lower values of outputs responses less than 20Mpa and at higher values of
outputs more than 200 Mpa residual stress have been noticed on the machined
surface. Therefore the trend of residual stress is increasing with increasing the
values of outputs responses; same trend has been noticed for all three alloys.
Artificial neural network (ANN) approach was adopted to predict WEDM responses
after machining of Ti50Ni49Co1, Ti50Ni45Co5 and Ti50Ni40Co10 shape memory alloys.
6% maximum error was obtained for material removal rate and 8% maximum was
noticed for surface roughness.
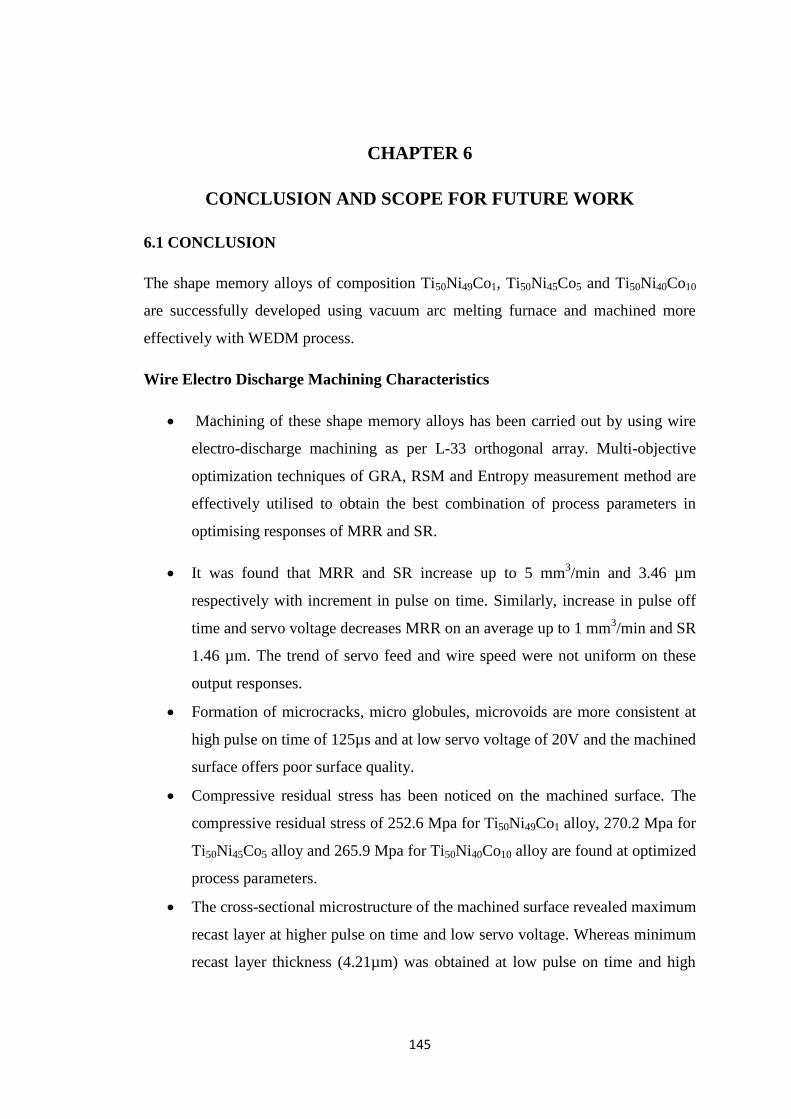
145
CHAPTER 6
CONCLUSION AND SCOPE FOR FUTURE WORK
6.1 CONCLUSION
The shape memory alloys of composition Ti50Ni49Co1, Ti50Ni45Co5 and Ti50Ni40Co10
are successfully developed using vacuum arc melting furnace and machined more
effectively with WEDM process.
Wire Electro Discharge Machining Characteristics
Machining of these shape memory alloys has been carried out by using wire
electro-discharge machining as per L-33 orthogonal array. Multi-objective
optimization techniques of GRA, RSM and Entropy measurement method are
effectively utilised to obtain the best combination of process parameters in
optimising responses of MRR and SR.
It was found that MRR and SR increase up to 5 mm3/min and 3.46 µm
respectively with increment in pulse on time. Similarly, increase in pulse off
time and servo voltage decreases MRR on an average up to 1 mm3/min and SR
1.46 µm. The trend of servo feed and wire speed were not uniform on these
output responses.
Formation of microcracks, micro globules, microvoids are more consistent at
high pulse on time of 125µs and at low servo voltage of 20V and the machined
surface offers poor surface quality.
Compressive residual stress has been noticed on the machined surface. The
compressive residual stress of 252.6 Mpa for Ti50Ni49Co1 alloy, 270.2 Mpa for
Ti50Ni45Co5 alloy and 265.9 Mpa for Ti50Ni40Co10 alloy are found at optimized
process parameters.
The cross-sectional microstructure of the machined surface revealed maximum
recast layer at higher pulse on time and low servo voltage. Whereas minimum
recast layer thickness (4.21µm) was obtained at low pulse on time and high

146
servo voltage, which can be remove easily form the machined surface without
affecting size of machined component.
The harder surface is noticed near the machined surface due to formation of
oxides of NiO2 and TiO2 which is confirmed by XRD analysis.
Parametric Study of Pulse on Time and Servo Voltage
Pulse on time and servo voltages are identified as most influential process
parameters and their effect on MRR and SR are studied using two process
parameters approach. Machining as per L-25 orthogonal array has been carried
out and machining performance MRR and SR are measured.
Lower values of material removal rate and surface roughness are observed
during WEDM of Ti50Ni49Co1, Ti50Ni45Co5 and Ti50Ni40Co10 alloys at 60V
servo voltage and 105µs pulse on time. Higher values of material removal rate
and surface roughness are noticed at 20V servo voltage and 125µs pulse on
time.
It is observed that hardness is decreasing along the cross section from the
machined surface along recast layer and heat affected zone. The micro
hardness of converted layer is almost equal to the hardness of base material
because converted layer is not much affected of by WEDM. The harder
surface is noticed during machining of Ti50Ni49Co10 alloy (624 HV) at lower
values of outputs responses.
Thin film of recast layer is noticed during machining at lower (105 µs) pulse
on time and higher servo voltage (60V).The recast layer thickness at lower
values of outputs is 4.2 µm for Ti50Ni49Co1, 4.6 µm for Ti50Ni45Co5 and 4.9
µm for Ti50Ni40Co10 alloy while recast layer thickness at higher values of
outputs is 30 µm for Ti50Ni49Co1, 32 µm for Ti50Ni45Co5 and 35 µm for
Ti50Ni40Co10 alloy.
Minimum residual stress has been observed on the machined surface of
Ti50Ni49Co1 alloy while maximum stress has seen on the machined surface of
Ti50Ni40Co10 alloy. Also residual stresses measured at lower values of surface

147
roughness and material removal rate is less than residual stress at the higher
values of these outputs.
Artificial neural network (ANN) approach is adopted to predict WEDM
responses of MRR and SR. The error observed between experimental data and
predicted data is small and it is found that the maximum percentage error is 8
percent.
6.2 SCOPE FOR FUTURE WORK
Although the wire electro discharge machining of developed Ti50Ni49Co1, Ti50Ni45Co5
and Ti50Ni40Co10 shape memory alloys and machined surface characterization have
been carried out in the present study, still there is much scope for research in this area.
The following suggestions might be consider for future work-
Physical and mechanical properties can be improved of TiNi based shape
memory alloys by adding different alloying elements such as Ag, Au etc.
Different ternary shape memory alloys can be machined for particular
applications through wire electro discharge machining at optimized process
parameters.
Physical properties can be investigate after the machining of shape memory
alloys such as pseudoelastic behaviour, phase transformation temperature etc.
6.3 KEY CONTRIBUTIONS
The main contributions of present study are following -
Ti50Ni49Co1, Ti50Ni45Co5 and Ti50Ni40Co10 shape memory alloys developed
through vacuum arc meting furnace.
The machining of all three alloys has been carried out through wire electro
discharge machining and found the optimal process parameters for higher
material removal rate with better surface finish.
Hybrid combination of optimization techniques were used to optimized the
process parameters and machined surface characterization has been carried out

148
at optimized process parameters with respect to machined surface
morphology, surface topography, recast layer thickness, microhardness, phase
analysis and residual stress.
Two process parameters approach adopted for further machining of all three
alloys and detailed characterization have been carried out at the lower and
higher values of material removal rate and surface roughness. Moreover
Artificial neural network was implemented for prediction the WEDM
responses such as material removal rate and surface roughness.
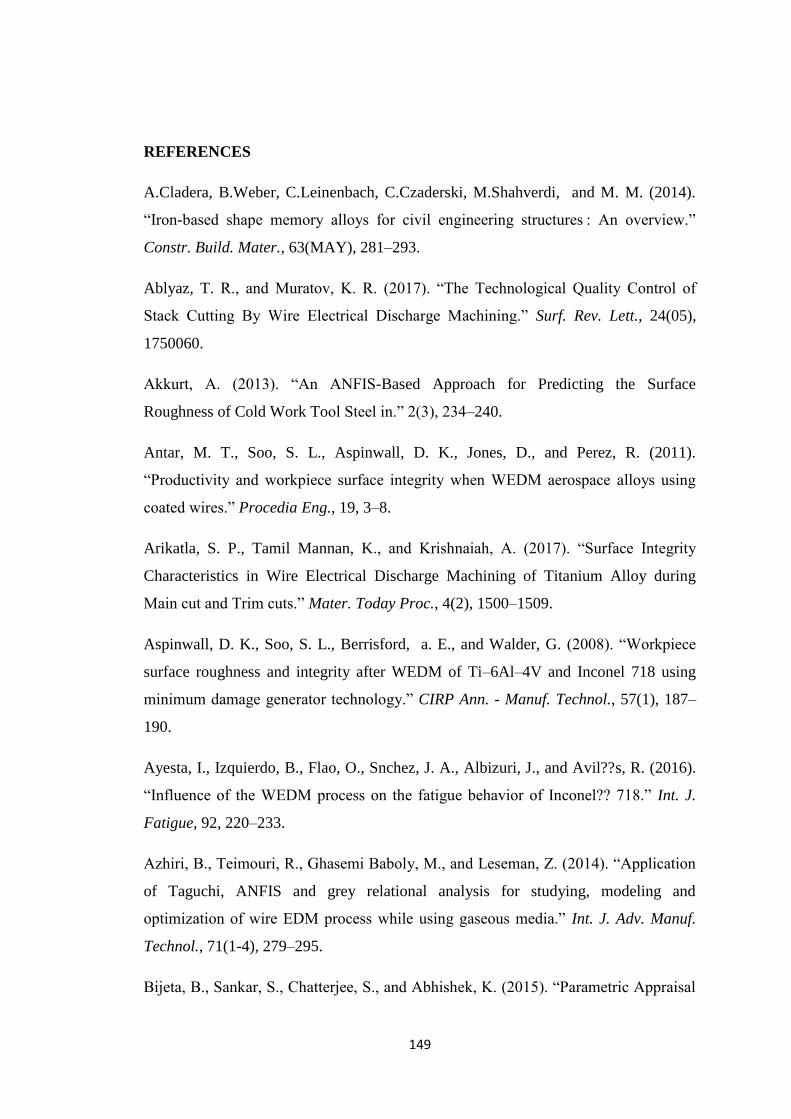
149
REFERENCES
A.Cladera, B.Weber, C.Leinenbach, C.Czaderski, M.Shahverdi, and M. M. (2014).
“Iron-based shape memory alloys for civil engineering structures : An overview.”
Constr. Build. Mater., 63(MAY), 281–293.
Ablyaz, T. R., and Muratov, K. R. (2017). “The Technological Quality Control of
Stack Cutting By Wire Electrical Discharge Machining.” Surf. Rev. Lett., 24(05),
1750060.
Akkurt, A. (2013). “An ANFIS-Based Approach for Predicting the Surface
Roughness of Cold Work Tool Steel in.” 2(3), 234–240.
Antar, M. T., Soo, S. L., Aspinwall, D. K., Jones, D., and Perez, R. (2011).
“Productivity and workpiece surface integrity when WEDM aerospace alloys using
coated wires.” Procedia Eng., 19, 3–8.
Arikatla, S. P., Tamil Mannan, K., and Krishnaiah, A. (2017). “Surface Integrity
Characteristics in Wire Electrical Discharge Machining of Titanium Alloy during
Main cut and Trim cuts.” Mater. Today Proc., 4(2), 1500–1509.
Aspinwall, D. K., Soo, S. L., Berrisford, a. E., and Walder, G. (2008). “Workpiece
surface roughness and integrity after WEDM of Ti–6Al–4V and Inconel 718 using
minimum damage generator technology.” CIRP Ann. - Manuf. Technol., 57(1), 187–
190.
Ayesta, I., Izquierdo, B., Flao, O., Snchez, J. A., Albizuri, J., and Avil??s, R. (2016).
“Influence of the WEDM process on the fatigue behavior of Inconel?? 718.” Int. J.
Fatigue, 92, 220–233.
Azhiri, B., Teimouri, R., Ghasemi Baboly, M., and Leseman, Z. (2014). “Application
of Taguchi, ANFIS and grey relational analysis for studying, modeling and
optimization of wire EDM process while using gaseous media.” Int. J. Adv. Manuf.
Technol., 71(1-4), 279–295.
Bijeta, B., Sankar, S., Chatterjee, S., and Abhishek, K. (2015). “Parametric Appraisal

150
of WEDM using Harmony Search Algorithm.” Mater. Today Proc., 2(4-5), 2562–
2568.
Chalisgaonkar, R., and Kumar, J. (2016). “Investigation of the machining parameters
and integrity of the work and wire surfaces after finish cut WEDM of commercially
pure titanium.” J. Brazilian Soc. Mech. Sci. Eng., 38(3), 883–911.
Chen, S. L., Hsieh, S. F., Lin, H. C., Lin, M. H., and Huang, J. S. (2007). “Electrical
discharge machining of TiNiCr and TiNiZr ternary shape memory alloys.” Mater. Sci.
Eng. A, 445-446, 486–492.
Chen, Z., Zhang, Y., Zhang, G., Huang, Y., and Liu, C. (2017). “Theoretical and
experimental study of magnetic-assisted finish cutting ferromagnetic material in
WEDM.” Int. J. Mach. Tools Manuf., 123(932), 36–47.
Choudhary, R., Kumar, H., and Garg, R. K. (2010). “Analysis and evaluation of heat
affected zones in electric discharge machining of EN-31 die steel.” Indian J. Eng.
Mater. Sci., 17(2), 91–98.
Dadbakhsh, S., Speirs, M., Humbeeck, J. Van, and Kruth, J.-P. (2016). “Laser
additive manufacturing of bulk and porous shape-memory NiTi alloys: From
processes to potential biomedical applications.” MRS Bull., 41(10), 765–774.
Daneshmand, S., Monfared, V., and Lotfi Neyestanak, A. A. (2017). “Effect of Tool
Rotational and Al2O3 Powder in Electro Discharge Machining Characteristics of
NiTi-60 Shape Memory Alloy.” Silicon, 9(2), 273–283.
Das, A., Sarkar, S., Karanjai, M., and Sutradhar, G. (2017). “Application of Box–
Behnken Design and Response Surface Methodology for Surface Roughness
Prediction Model of CP-Ti Powder Metallurgy Components Through WEDM.” J.
Inst. Eng. Ser. D.
Datta, S., and Mahapatra, S. S. (2010). “Modeling, simulation and parametric
optimization of wire EDM process using response surface methodology coupled with
grey-Taguchi technique.” Multicr. Int. J. Eng. Sci. Technol. Ext., 2(5), 162–183.

151
Dhobe, M. M., Chopde, I. K., and Gogte, C. L. (2013). “Investigations on Surface
Characteristics of Heat Treated Tool Steel after Wire Electro-Discharge Machining.”
Mater. Manuf. Process., 28(10), 1143–1146.
El-Bagoury, N. (2014). “Microstructure and martensitic transformation and
mechanical properties of cast Ni rich NiTiCo shape memory alloys.” Mater. Sci.
Technol., 30(14), 1795–1800.
Geng, L., and Zhong, H. Y. (2010). “Evaluation of WEDM Surface Quality.” Adv.
Mater. Res., 97-101, 4080–4083.
Ghanem, F., Fredj, N. Ben, Sidhom, H., and Braham, C. (2011). “Effects of finishing
processes on the fatigue life improvements of electro-machined surfaces of tool steel.”
Int. J. Adv. Manuf. Technol., 52(5-8), 583–595.
Ghodsiyeh, D., Golshan, A., and Shirvanehdeh, J. A. (2013). “Review on Current
Research Trends in Wire Electrical Discharge Machining ( WEDM ).” 3(February),
154–168.
Goryczka, T., and Ochin, P. (2005). “Characterization of a Ni50Ti50 shape memory
strip produced by twin roll casting technique.” J. Mater. Process. Technol., 162-
163(SPEC. ISS.), 178–183.
Goswami, A., and Kumar, J. (2014). “Engineering Science and Technology , an
International Journal Investigation of surface integrity , material removal rate and
wire wear ratio for WEDM of Nimonic 80A alloy using GRA and Taguchi method.”
Eng. Sci. Technol. an Int. J., 17(4), 173–184.
Guo, Y., Klink, A., Fu, C., and Snyder, J. (2013). “Machinability and surface integrity
of Nitinol shape memory alloy.” CIRP Ann. - Manuf. Technol., 62(1), 83–86.
Hartl, D. J., and Lagoudas, D. C. (2007). “Aerospace applications of shape memory
alloys.” Proc. Inst. Mech. Eng. Part G J. Aerosp. Eng., 221(4), 535–552.
Hewidy, M. S., El-Taweel, T. A., and El-Safty, M. F. (2005). “Modelling the
machining parameters of wire electrical discharge machining of Inconel 601 using

152
RSM.” J. Mater. Process. Technol., 169(2), 328–336.
Ho, K. H., Newman, S. T. Ã., Rahimifard, S., and Allen, R. D. (2004). “State of the
art in wire electrical discharge machining ( WEDM ).” 44, 1247–1259.
Hsieh, S. F., Chen, S. L., Lin, H. C., Lin, M. H., and Chiou, S. Y. (2009). “The
machining characteristics and shape recovery ability of Ti-Ni-X (X=Zr, Cr) ternary
shape memory alloys using the wire electro-discharge machining.” Int. J. Mach. Tools
Manuf., 49(6), 509–514.
Hsieh, S. F., Hsue, A. W. J., Chen, S. L., Lin, M. H., Ou, K. L., and Mao, P. L.
(2013). “EDM surface characteristics and shape recovery ability of Ti35.5Ni48.5Zr16
and Ni60Al24.5Fe15.5 ternary shape memory alloys.” J. Alloys Compd., 571, 63–68.
Ibrahim, K. M., Elbagoury, N., and Fouad, Y. (2011). “Microstructure and martensitic
transformation of cast TiNiSi shape memory alloys.” J. Alloys Compd., 509(9), 3913–
3916.
Jangra, K., Grover, S., and Aggarwal, A. (2012). “Optimization of multi machining
characteristics in WEDM of WC-5.3%Co composite using integrated approach of
Taguchi, GRA and entropy method.” Front. Mech. Eng., 7(3), 288–299.
Jiang, P. C., Zheng, Y. F., Tong, Y. X., Chen, F., Tian, B., Li, L., Gunderov, D. V.,
and Valiev, R. Z. (2014). “Transformation hysteresis and shape memory effect of an
ultrafine-grained TiNiNb shape memory alloy.” Intermetallics, 54, 133–135.
Karayel, D. (2009). “Prediction and control of surface roughness in CNC lathe using
artificial neural network.” J. Mater. Process. Technol., 209(7), 3125–3137.
Karthikeyan, R., Lakshmi Narayanan, P. ., and Naagarazan, R. . (1999).
“Mathematical modelling for electric discharge machining of aluminium–silicon
carbide particulate composites.” J. Mater. Process. Technol., 87(1-3), 59–63.
Khanna, R., and Singh, H. (2016). “Comparison of optimized settings for cryogenic-
treated and normal D-3 steel on WEDM using grey relational theory.” Proc. Inst.
Mech. Eng. Part L J. Mater. Des. Appl., 230(1), 219–232.

153
Kim, S. W., Jo, J. W., Park, C. H., Hong, J. K., Yeom, J. T., and Kim, H. G. (2016).
“Fracture toughness of TiNiHf alloys: A hybrid study using in-situ transmission
electron microscopy experiments and finite element analyses.” Mater. Sci. Eng. A,
655, 363–372.
Kong, M. C., Axinte, D., and Voice, W. (2011). “Challenges in using waterjet
machining of NiTi shape memory alloys: An analysis of controlled-depth milling.” J.
Mater. Process. Technol., 211(6), 959–971.
Kumar, A., Kumar, V., and Kumar, J. (2013). “Multi-response optimization of
process parameters based on response surface methodology for pure titanium using
WEDM process.” Int. J. Adv. Manuf. Technol., 68(9-12), 2645–2668.
Kumar, A., Kumar, V., and Kumar, J. (2016). “Surface crack density and recast layer
thickness analysis in WEDM process through response surface methodology.” Mach.
Sci. Technol., 20(2), 201–230.
Kumar, S. S., Uthayakumar, M., Kumaran, S. T., Parameswaran, P., Mohandas, E.,
Kempulraj, G., Babu, B. S. R., and Natarajan, S. A. (2015). “Parametric optimization
of wire electrical discharge machining on aluminium based composites through grey
relational analysis.” J. Manuf. Process., 20, 33–39.
Kumar, V., Jangra, K. K., Kumar, V., and Sharma, N. (2017). “WEDM of nickel
based aerospace alloy: optimization of process parameters and modelling.” Int. J.
Interact. Des. Manuf., 11(4), 917–929.
Kuppuswamy, R., and Yui, A. (2017). “High-speed micromachining characteristics
for the NiTi shape memory alloys.” Int. J. Adv. Manuf. Technol., 93(1-4), 11–21.
Kuriakose, S., and Shunmugam, M. S. (2004). “Characteristics of wire-electro
discharge machined Ti6Al4V surface.” Mater. Lett., 58(17-18), 2231–2237.
Lagoudlas, D. C. (2008). Shape Memory Alloys: Moding and Engineering
Applications, Springer, ISBN 978-0-387-47685-8.
Lal, S., Kumar, S., Khan, Z., and Siddiquee, A. (2015). “Multi-response optimization

154
of wire electrical discharge machining process parameters for Al7075/Al 2 O 3 /SiC
hybrid composite using Taguchi-based grey relational analysis.” Proc. Inst. Mech.
Eng. Part B J. Eng. Manuf., 229(2), 229–237.
Lee, W. M., and Liao, Y. S. (2007). “Adaptive control of the WEDM process using a
self-tuning fuzzy logic algorithm with grey prediction.” Int. J. Adv. Manuf. Technol.,
34(5-6), 527–537.
Lekston, Z., Stroz, D., and Drusik-Pawlowska, M. J. (2012). “Preparation and
characterization of nitinol bone staples for cranio-maxillofacial surgery.” J. Mater.
Eng. Perform., 21(12), 2650–2656.
Liao, Y. S., Chu, Y. Y., and Yan, M. T. (1997). “Study of wire breaking process and
monitoring of WEDM.” Int. J. Mach. Tools Manuf., 37(4), 555–567.
Liu, F., Ding, Z., Li, Y., and Xu, H. (2005). “Phase transformation behaviors and
mechanical properties of TiNiMo shape memory alloys.” Intermetallics, 13(3-4),
357–360.
Luo, G., Ming, W., Zhang, Z., Liu, M., Li, H., Li, Y., and Yin, L. (2014).
“Investigating the effect of WEDM process parameters on 3D micron-scale surface
topography related to fractal dimension.” Int. J. Adv. Manuf. Technol., 75(9-12),
1773–1786.
Manjaiah, M., Narendranath, S., and Basavarajappa, S. (2014). “Review on non-
conventional machining of shape memory alloys.” Trans. Nonferrous Met. Soc. China
(English Ed., 24(1), 12–21.
Manjaiah, M., Narendranath, S., Basavarajappa, S., and Gaitonde, V. N. (2015).
“Effect of electrode material in wire electro discharge machining characteristics of
Ti50Ni50−xCux shape memory alloy.” Precis. Eng., 41, 68–77.
McCluskey, P. J., Xiao, K., Gregoire, J. M., Dale, D., and Vlassak, J. J. (2014).
“Application of in-situ nano-scanning calorimetry and X-ray diffraction to
characterize Ni-Ti-Hf high-temperature shape memory alloys.” Thermochim. Acta.

155
Mohd Jani, J., Leary, M., Subic, A., and Gibson, M. a. (2014). “A review of shape
memory alloy research, applications and opportunities.” Mater. Des., 56, 1078–1113.
Mordyuk, B. N., Prokopenko, G. I., Grinkevych, K. E., Piskun, N. A., and Popova, T.
V. (2017). “Effects of ultrasonic impact treatment combined with the electric
discharge surface alloying by molybdenum on the surface related properties of low-
carbon steel G21Mn5.” Surf. Coatings Technol., 309, 969–979.
Mouralova, K., Kovar, J., Klakurkova, L., Blazik, P., Kalivoda, M., and Kousal, P.
(2018). “Analysis of surface and subsurface layers after WEDM for Ti-6Al-4V with
heat treatment.” Measurement, 116(April 2017), 556–564.
Mouralová, K., Kovář, J., Zahradníček, R., and Man, O. (2016). “Characterisation of
3D Topography of the Surface Machined by Finishing Technologies of WEDM and
Grinding.” Mechatronika 2016, 445–449.
Nam, T., Saburi, T., and Shimizu, K. (1990). “Cu-Content Dependence of Shape
Memory Characteristics in Ti-Ni-Cu Alloys.” Mater. Trans. JIM.
Newton, T. R., Melkote, S. N., Watkins, T. R., Trejo, R. M., and Reister, L. (2009).
“Investigation of the effect of process parameters on the formation and characteristics
of recast layer in wire-EDM of Inconel 718.” Mater. Sci. Eng. A, 513-514(C), 208–
215.
Ojha, K., Garg, R. K., and Singh, K. K. (2010). “MRR Improvement in Sinking
Electrical Discharge Machining: A Review.” J. Miner. Mater. Charact. Eng., 09(08),
709–739.
Pant, P., Pandey, N., Rajesha, S., and Jain, G. (2014). “Prediction of Surface
Roughness in WEDM Process Using Feed Forward Back Propagation Neural
Network.” 4(6), 667–674.
Petrini, L., and Migliavacca, F. (2011). “Biomedical Applications of Shape Memory
Alloys.” J. Metall., 2011(Figure 1), 1–15.
Portillo Perez, E., Marcos, M., Cabanes, I., Zubizarreta, A., and Sánchez, J. A. (2008).

156
“ANN for interpolating instability trends in WEDM.” IFAC Proc. Vol., 17(1 PART
1), 2230–2235.
Pradhan, M. K. (2013). “Optimization of MRR, TWR and surface roughness of
EDMed D2 Steel using an integrated approach of RSM, GRA and Entropy
measutement method.” 2013 Int. Conf. Energy Effic. Technol. Sustain. ICEETS 2013,
865–869.
Prakash, C., Kansal, H. K., Pabla, B. S., and Puri, S. (2017). “Experimental
investigations in powder mixed electric discharge machining of Ti–35Nb–7Ta–5Zrβ-
titanium alloy.” Mater. Manuf. Process., 32(3), 274–285.
Pramanik, A. (2016). “Electrical Discharge Machining of MMCs Reinforced with
Very Small Particles.” Mater. Manuf. Process., 31(4), 397–404.
Pramanik, A., and Basak, A. K. (2016). “Degradation of wire electrode during
electrical discharge machining of metal matrix composites.” Wear, 346-347, 124–131.
PRAMANIK, A., BASAK, A. K., ISLAM, M. N., and LITTLEFAIR, G. (2015).
“Electrical discharge machining of 6061 aluminium alloy.” Trans. Nonferrous Met.
Soc. China, 25(9), 2866–2874.
Price, A. D., Jnifene, A., and Naguib, H. E. (2007). “Design and control of a shape
memory alloy based dexterous robot hand.” Smart Mater. Struct., 16(4), 1401–1414.
Ramakrishnan, R., and Karunamoorthy, L. (2006). “Multi response optimization of
wire EDM operations using robust design of experiments.” Int. J. Adv. Manuf.
Technol., 29(1-2), 105–112.
Ramakrishnan, R., and Karunamoorthy, L. (2008). “Modeling and multi-response
optimization of Inconel 718 on machining of CNC WEDM process.” J. Mater.
Process. Technol., 207(1-3), 343–349.
Rao, P. S., Ramji, K., and Satyanarayana, B. (2010). “Prediction of Material removal
rate for Aluminum BIS-24345 Alloy in wire-cut EDM.” Int. Eng. Sci. Technol., 2(12),
7729–7739.
157
Rao, R., and Ã, V. Y. (2009). “Optics & Laser Technology Multi-objective
optimization of Nd : YAG laser cutting of thin superalloy sheet using grey relational
analysis with entropy measurement.” 41, 922–930.
Rao, R., and Yadava, V. (2009). “Multi-objective optimization of Nd:YAG laser
cutting of thin superalloy sheet using grey relational analysis with entropy
measurement.” Opt. Laser Technol., 41(8), 922–930.
Rao, S. S. M., Rao, K. V., Reddy, K. H., Ch, V., and Rao, S. P. (2017). “Prediction
and optimization of process parameters in wire cut electric discharge machining for
High- speed steel ( HSS ).” Int. J. Comput. Appl., 7074(October), 1–8.
Roy, A., Narendra Nath, S., and Nedelcu, D. (2017). “Experimental investigation on
variation of output responses of as cast TiNiCu shape memory alloys using wire
EDM.” Int. J. Mod. Manuf. Technol., 9(1).
Saedon, J. B., Jaafar, N., and Azman, M. (2014). “Multi-objective optimization of
titanium alloy through orthogonal array and grey relational analysis in WEDM.”
Procedia Technol., 15, 832–840.
Saha, A., and Mondal, S. C. (2017). “Experimental investigation and modelling of
WEDM process for machining nano-structured hardfacing material.” J. Brazilian Soc.
Mech. Sci. Eng., 39(9), 3439–3455.
Saha, P., Tarafdar, D., Pal, S. K., Saha, P., Srivastava, A. K., and Das, K. (2013).
“Multi-objective optimization in wire-electro-discharge machining of TiC reinforced
composite through Neuro-Genetic technique.” Appl. Soft Comput. J., 13(4), 2065–
2074.
Sarkheyli, A., Zain, A. M., and Sharif, S. (2015). “A multi-performance prediction
model based on ANFIS and new modified-GA for machining processes.” J. Intell.
Manuf., 26(4), 703–716.
Shandilya, P., Jain, P. K., and Jain, N. K. (2013). “RSM and ANN modeling
approaches for predicting average cutting speed during WEDM of SiCp/6061 Al
MMC.” Procedia Eng., 64, 767–774.
158
Sharma, A., Garg, M. P., and Goyal, K. K. (2014). “Prediction of Optimal Conditions
for WEDM of Al 6063/ ZrSiO4(p) MMC.” Procedia Mater. Sci., 6(Icmpc), 1024–
1033.
Sharma, N., Khanna, R., Gupta, R. D., and Sharma, R. (2013). “Modeling and
multiresponse optimization on WEDM for HSLA by RSM.” Int. J. Adv. Manuf.
Technol., 67(9-12), 2269–2281.
Sharma, P., Chakradhar, D., and Narendranath, S. (2015). “Evaluation of WEDM
performance characteristics of Inconel 706 for turbine disk application.” Mater. Des.,
88, 558–566.
Sharma, P., Chakradhar, D., and Narendranath, S. (2016). “Effect of Wire Material on
Productivity and Surface Integrity of WEDM-Processed Inconel 706 for Aircraft
Application.” J. Mater. Eng. Perform., 25(9), 3672–3681.
Shi, H., Delville, R., Srivastava, V., James, R. D., and Schryvers, D. (2014).
“Microstructural dependence on middle eigenvalue in Ti–Ni–Au.” J. Alloys Compd.,
582, 703–707.
Shivade, A. S., and Shinde, V. D. (2014). “Multi-objective optimization in WEDM of
D3 tool steel using integrated approach of Taguchi method & Grey relational
analysis.” J Ind Eng Int, 10, 149–162.
Singh Nain, S., Garg, D., and Kumar, S. (2017). “Prediction of the Performance
Characteristics of WEDM on Udimet-L605 Using Different Modelling Techniques.”
Mater. Today Proc., 4(2), 546–556.
Singh, H., and Garg, R. (2009). “Effects of process parameters on material removal
rate in WEDM.” 32(1), 70–74.
Sivaprakasam, P., Hariharan, P., and Gowri, S. (2013). “Optimization of Micro-
WEDM Process of Aluminum Matrix Composite (A413-B 4 C): A Response Surface
Approach.” Mater. Manuf. Process., 28(12), 1340–1347.
Sivaprakasam, P., Hariharan, P., and Gowri, S. (2014). “Engineering Science and

159
Technology , an International Journal Modeling and analysis of micro-WEDM
process of titanium alloy ( Ti e 6Al e 4V ) using response surface approach.” Eng. Sci.
Technol. an Int. J., 17(4), 227–235.
Soni, H., Sannayellappa, N., and Motagondanahalli Rangarasaiah, R. (2017). “An
experimental study of influence of wire electro discharge machining parameters on
surface integrity of TiNiCo shape memory alloy.” J. Mater. Res., 1–9.
Soundararajan, R., Ramesh, A., Mohanraj, N., and Parthasarathi, N. (2016). “An
investigation of material removal rate and surface roughness of squeeze casted A413
alloy on WEDM by multi response optimization using RSM.” J. Alloys Compd., 685,
533–545.
Srinivasa Rao, P., Ramji, K., and Satyanarayana, B. (2016). “Effect of wire EDM
conditions on generation of residual stresses in machining of aluminum 2014 T6
alloy.” Alexandria Eng. J., 55(2), 1077–1084.
Sun, Y., Gong, Y., Liu, Y., Li, Q., and Zhou, Y. (2017). “Experimental study on
surface characteristics and improvement of microelectrode machined by low speed
wire electrical discharge turning.” Arch. Civ. Mech. Eng., 17(4), 964–977.
Surya, V. R., Kumar, K. M. V., Keshavamurthy, R., Ugrasen, G., and Ravindra, H. V.
(2017). “Prediction of Machining Characteristics using Artificial Neural Network in
Wire EDM of Al7075 based In-situ Composite.” Mater. Today Proc., 4(2), 203–212.
Tian, Y., Liu, X., and Qi, H. (2015). “Generation of stainless steel superhydrophobic
surfaces using WEDM technique.” Proc. SPIE - Int. Soc. Opt. Eng., 9446, 94464G.
Tong, Y., Liu, J., Chen, F., Liang, C., Tian, B., Li, L., and Zheng, Y. (2014). “Effect
of aging on martensitic transformation and superelasticity of TiNiCr shape memory
alloy.” Trans. Nonferrous Met. Soc. China, 24(8), 2598–2605.
Ugrasen, G., Ravindra, H. V., Prakash, G. V. N., and Keshavamurthy, R. (2014).
“Estimation of Machining Performances Using MRA, GMDH and Artificial Neural
Network in Wire EDM of EN-31.” Procedia Mater. Sci., 6(Icmpc), 1788–1797.

160
Wang, J. J., Omori, T., Sutou, Y., Kainuma, R., and Ishida, K. (2005). “Two-way
shape memory effect induced by cold-rolling in Ti–Ni and Ti–Ni–Fe alloys.” Scr.
Mater., 52(4), 311–316.
Wei, Z. G., Sandstrom, R., and Miyazaki, S. (1998). “Shape-memory materials and
hybrid composites for smart systems - Part I Shape-memory materials.” J. Mater. Sci.,
33(15), 3743–3762.
Zheng, Y. F., Zhang, B. B., Wang, B. L., Wang, Y. B., Li, L., Yang, Q. B., and Cui,
L. S. (2011). “Introduction of antibacterial function into biomedical TiNi shape
memory alloy by the addition of element Ag.” Acta Biomater., 7(6), 2758–67.

LIST OF PUBLICATIONS
Sl.
No.Title of the paper Authors
Name of the Journal/
Conference
Month, Year of
Publication
Category
*
1
An experimental study of influence of wire
electro discharge machining parameters on
surface integrity of TiNiCo shape memory
alloy
Hargovind Soni,
Narendranath S.,
Ramesh M. R.
Journal of Material
Research
2017
Vol.32 Issue 16
p-3100-3108
1
2
Effects of WEDM performances on
microstructure, surface topography,
microhardness, XRD and residual stresses
on the machined surface of Ti50Ni45Co5
shape memory alloys.
Hargovind Soni,
Narendranath S.,
Ramesh M. R.Silicon Journal 2018 1
3
Effects of Wire electro discharge machining
process parameters on machined surface of
Ti50Ni49Co1 shape memory alloy.
Hargovind Soni,
Narendranath S.,
Ramesh M. R.
Silicon journal Springer 2017 1
4
ANN and RSM modeling methods for
predicting material removal rate and surface
roughness during WEDM of Ti50Ni40Co10
shape memory alloy
Hargovind Soni,
Narendranath S.,
Ramesh M. R.
Advances in Modelling and
Analysis A2018 1

Sl.
No.Title of the paper Authors
Name of the Journal/
Conference
Month, Year of
Publication
Category
*
5
Effect of machining process parameters on
productivity rate and surface roughness of
machined TiNiCo alloy
Hargovind Soni,
Narendranath S.,
Ramesh M. R
Accepted in Material
Today Journal Elsevier)2018 1
6
Effect of Machining Parameters on Wire
Electro Discharge Machining of Shape
Memory Alloys Analyzed using Grey
Entropy Method
Hargovind Soni,
Narendranath S.,
Ramesh M. R.
Journal of Material Science
and Mechanical
Engineering
Volume 2,
Issue13; Oct.-
Dec., 2015 pp.
50-54.
1
7Advanced machining of TiNiCo shape
memory alloy for biomedical application.
Hargovind Soni,
Narendranath S.,
Ramesh M. R.
Emerging Material
Research2017
Answer to
the
reviewer
comments
submitted
awaiting
for
decision
8
Investigation of input process parameters of
wire electro discharge machining of
Ti50Ni50-xCox, (x=1 and 5) alloys using
Hargovind Soni,
Narendranath S.,
Measurement Journal
Elsevier2017
Answer to
the

Sl.
No.Title of the paper Authors
Name of the Journal/
Conference
Month, Year of
Publication
Category
*
hybrid combinations of multi objective
optimization techniques.
Ramesh M. R.,
Dumitru Nedelcu.
reviewer
comments
submitted
awaiting
for
decision
9
Machining of Ti50Ni49Co1, Ti50Ni45Co5 and
Ti50Ni40Co10 shape memory alloys for Bone
staple application.
Hargovind Soni,
Narendranath S.,
Ramesh M. R
Advances in Manufacturing 2018Communic
ated
10
Investigations on Surface Characteristics of
Developed TiNiCo Ternary Shape memory
alloy after Wire Electro-Discharge
Machining
Hargovind Soni,
Narendranath S.,
Ramesh M. R.
Applied Surface Science 2018Communic
ated
11
Evaluation Of Wedm Performance
Characteristics Of Ti50Ni45Co5 Shape
Memory Alloys" has been
Hargovind Soni,
Narendranath S.,
Ramesh M. R.
10th International
Conference on Precision,
Meso, Micro and Nano
Engineering at IIT Madras,
Chennai.
2017 3

Sl.
No.Title of the paper Authors
Name of the Journal/
Conference
Month, Year of
Publication
Category
*
12
Effect of Machining Parameters on Wire
Electro Discharge Machining of Shape
Memory Alloys Analyzed using Grey
Entropy Method
Hargovind Soni,
Narendranath S.,
Ramesh M. R.
“Advances in Mechanical,
Material Science,
Manufacturing,
Automobile, Aerospace
Engineering and Applied
Physics”
2015 3
*Category: 1: Journal paper, full paper reviewed 2: Journal paper, Abstract reviews 3: Conference/Symposium paper, full paper reviewed4: Conference/Symposium paper, abstract reviewed 5: Others (including papers in Workshops, NITK Research Bulletins, Short notes etc.)
Hargovind Soni Prof. Narendranath S. Dr. Ramesh M RResearch Scholar Research Guide Research Guide
Name & Signature, with Date Name & Signature, with Date Name & Signature, with Date
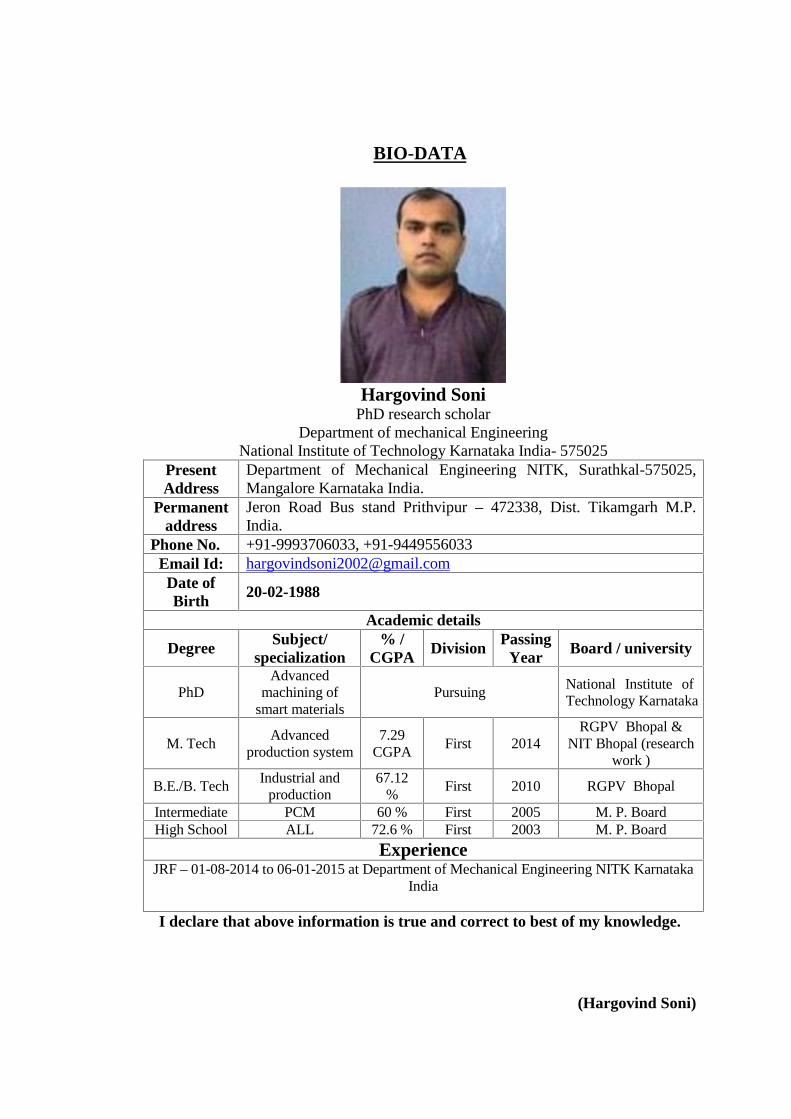
BIO-DATA
Hargovind SoniPhD research scholar
Department of mechanical EngineeringNational Institute of Technology Karnataka India- 575025
PresentAddress
Department of Mechanical Engineering NITK, Surathkal-575025,Mangalore Karnataka India.
Permanentaddress
Jeron Road Bus stand Prithvipur – 472338, Dist. Tikamgarh M.P.India.
Phone No. +91-9993706033, +91-9449556033Email Id: [email protected] ofBirth
20-02-1988
Academic details
Degree Subject/specialization
% /CGPA
Division PassingYear
Board / university
PhDAdvanced
machining ofsmart materials
PursuingNational Institute of ofTechnology Karnataka
M. TechAdvanced
production system7.29
CGPAFirst 2014
RGPV Bhopal &NIT Bhopal (research
work )
B.E./B. TechIndustrial and
production67.12
%First 2010 RGPV Bhopal
Intermediate PCM 60 % First 2005 M. P. BoardHigh School ALL 72.6 % First 2003 M. P. Board
ExperienceJRF – 01-08-2014 to 06-01-2015 at Department of Mechanical Engineering NITK Karnataka
India
I declare that above information is true and correct to best of my knowledge.
(Hargovind Soni)