some statistical studies on h
DESCRIPTION
Some statistical studies on H . Presented by: Nansi ANDARI Undergraduate student - LAL Orsay- Directed by: F.Polci, L.Fayard. Discussions : M.Escalier, M.Kado, Y.Fang, L.Roos. February 2009. Preliminary study of systematics on mass resolution - PowerPoint PPT PresentationTRANSCRIPT
Nansi Andari 27-2-2009 1
Presented by:
Nansi ANDARIUndergraduate student
- LAL Orsay-
Directed by:
F.Polci, L.Fayard
Discussions : M.Escalier, M.Kado, Y.Fang, L.Roos
February 2009
Nansi Andari 27-2-2009 2
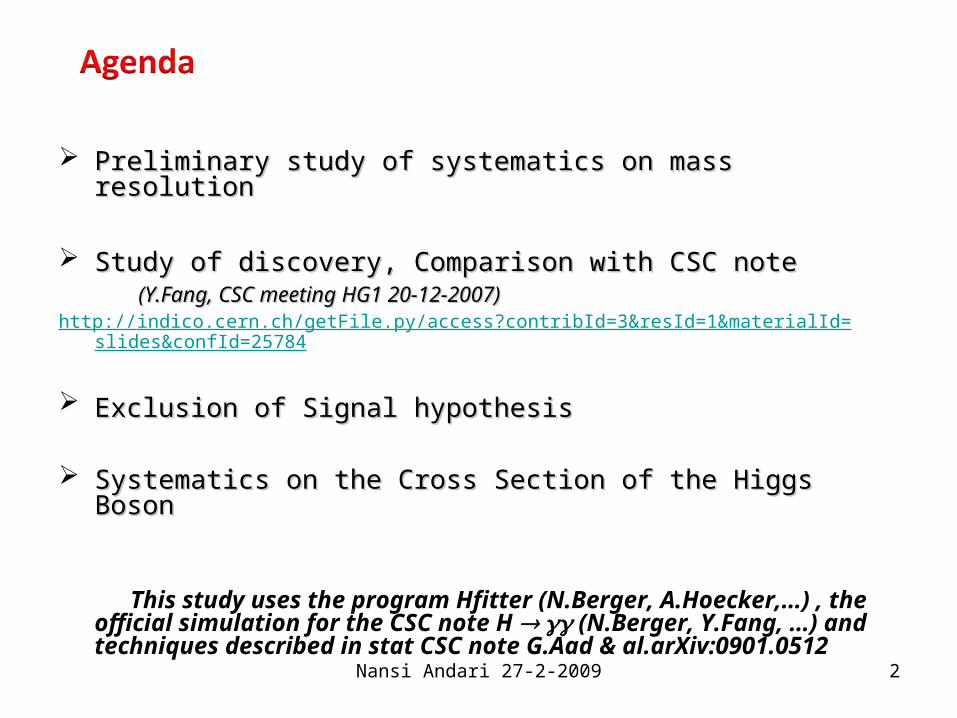
Preliminary study of systematics on mass resolutionPreliminary study of systematics on mass resolution
Study of discovery, Comparison with CSC noteStudy of discovery, Comparison with CSC note (Y.Fang, CSC meeting HG1 20-12-2007)(Y.Fang, CSC meeting HG1 20-12-2007)http://indico.cern.ch/getFile.py/access?contribId=3&resId=1&materialId=slides&confId=25784
Exclusion of Signal hypothesisExclusion of Signal hypothesis
Systematics on the Cross Section of the Higgs BosonSystematics on the Cross Section of the Higgs Boson
This study uses the program Hfitter (N.Berger, A.Hoecker,…) , the official simulation for the CSC note H (N.Berger, Y.Fang, …) and techniques described in stat CSC note G.Aad & al.arXiv:0901.0512
Nansi Andari 27-2-2009 3
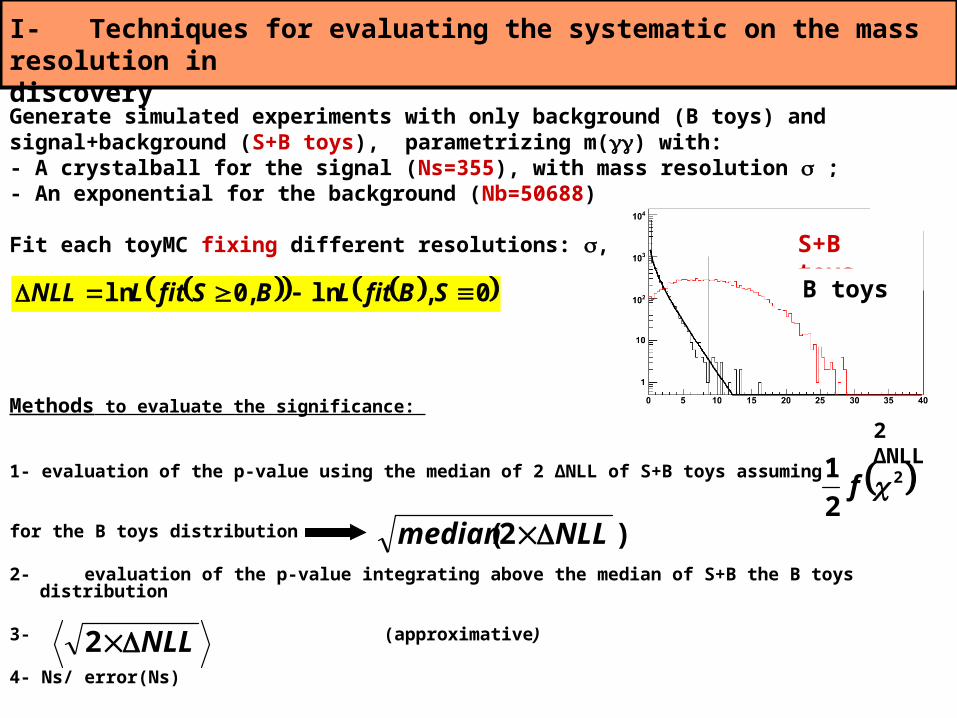
Methods to evaluate the significance:
1- evaluation of the p-value using the median of 2 ΔNLL of S+B toys assuming
for the B toys distribution
2- evaluation of the p-value integrating above the median of S+B the B toys distribution
3- (approximative)
4- Ns/ error(Ns)
2 ΔNLL
NLL2
)2( NLLmedian
22
1 f
0,ln,0ln SBfitLBSfitLNLL
Generate simulated experiments with only background (B toys) and signal+background (S+B toys), parametrizing m() with:- A crystalball for the signal (Ns=355), with mass resolution ; - An exponential for the background (Nb=50688) .
Fit each toyMC fixing different resolutions: , +15%, -15%
I- Techniques for evaluating the systematic on the mass resolution in discovery
S+B toys
B toys
Nansi Andari 27-2-2009 4
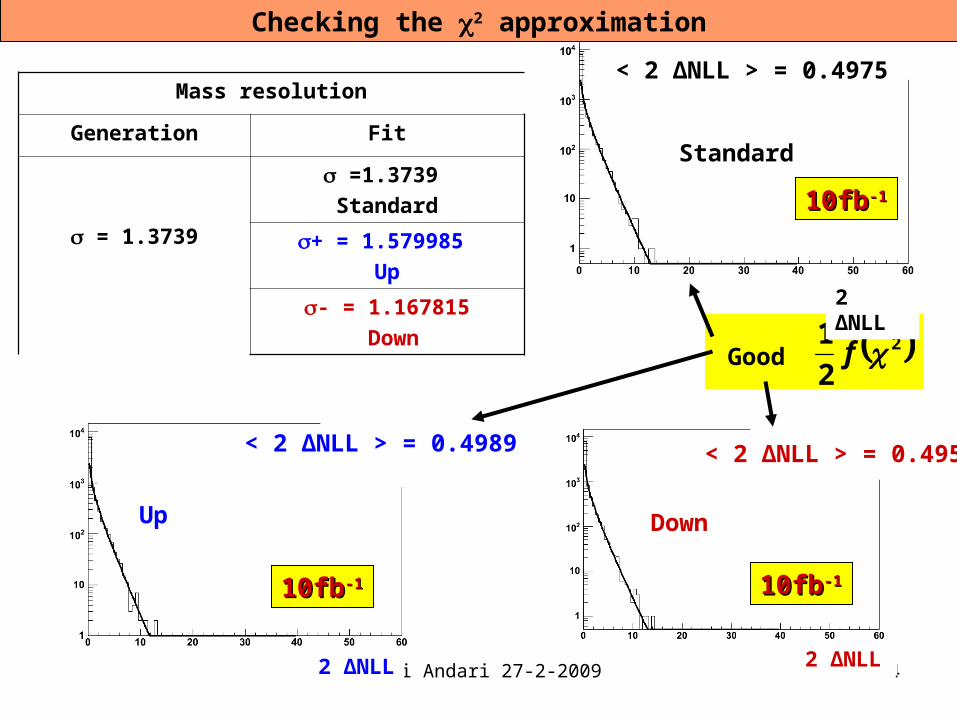
Good
Mass resolution
Generation Fit
= 1.3739
=1.3739
Standard
+ = 1.579985
Up
- = 1.167815
Down
< 2 ΔNLL > = 0.4989 < 2 ΔNLL > = 0.4959
DownUp
< 2 ΔNLL > = 0.4975
Standard
22
1 f
2 ΔNLL
2 ΔNLL 2 ΔNLL
10fb10fb-1-1
10fb10fb-1-110fb10fb-1-1
Checking the 2 approximation

Nansi Andari 27-2-2009 5
Mass resolution Significance
Generation Fit
2.937+/-0.01
+ 2.931+/-0.01
- 2.922+/-0.01
( +) – () ( -) – ()
Method 3: NLL2
NLLNLL 22
We are fitting the same datasets => the significances are correlated => the error on the difference of the
significance is even smaller!
NLLNLL 22
Δ = -(1.0 +/- 0.1)*10-2
Δ/significance= -0.34%
Δ = -(1.7 +/- 0.1)*10-2
Δ /significance= -0.57%
Nansi Andari 27-2-2009 6
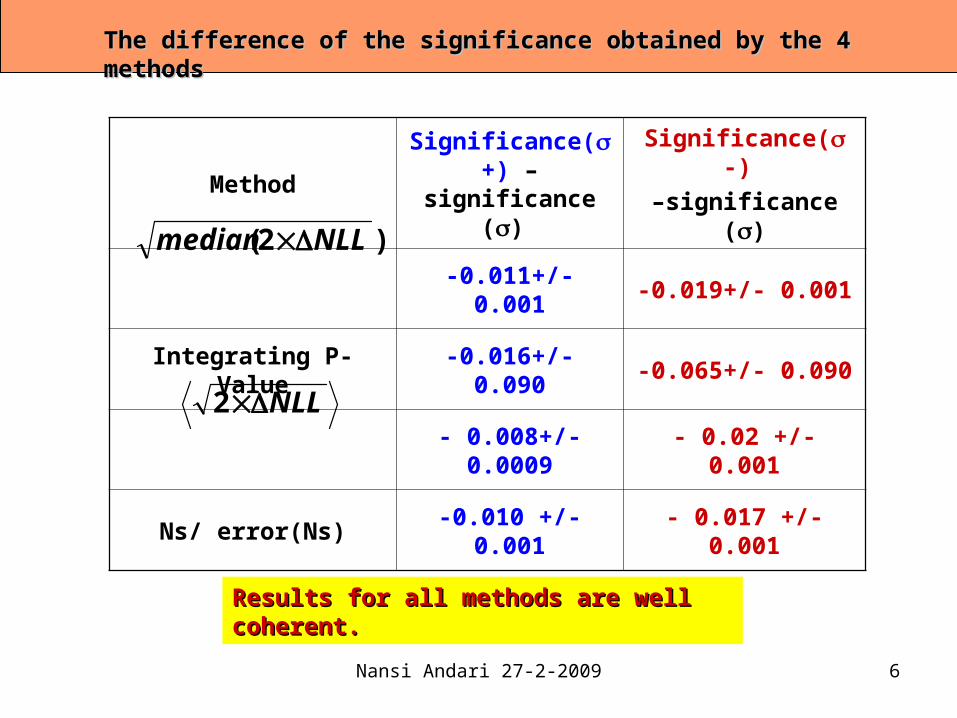
MethodSignificance( +) –significance ()
Significance( -)
–significance ()
-0.011+/- 0.001 -0.019+/- 0.001
Integrating P-Value -0.016+/- 0.090 -0.065+/- 0.090
- 0.008+/- 0.0009 - 0.02 +/- 0.001
Ns/ error(Ns) -0.010 +/- 0.001 - 0.017 +/- 0.001
The difference of the significance obtained by the 4 methods The difference of the significance obtained by the 4 methods
Results for all methods are well coherent.Results for all methods are well coherent.
)2( NLLmedian
NLL2

Nansi Andari 27-2-2009 7
Comparison with CSC Numbers Comparison with CSC Numbers
<>= - 0.01527 0.003
1000 toys
Similar to what was shown on previous page
Difference of significances as result of fitting Toys (1.58) with
1.58 and 1.36
This is different from what namely expected ( -[1.3739/1.58] = - 6.75%) for a gaussian. Is this due to the use
of crystalball?
Resolution Significance
Toy 1.3739
Fit 1.3739
2.937 0.01
Toy 1.58
Fit 1.58
2.653 0.03
Toy 1.58
Fit 1.36
2.643 0.03
-(9.7 1) %
Y.Fang
Small difference:
Much higher in the CSC note!
NLLNLL 22
-4.2%
- 0.6%+/- 0.3%
Nansi Andari 27-2-2009 8
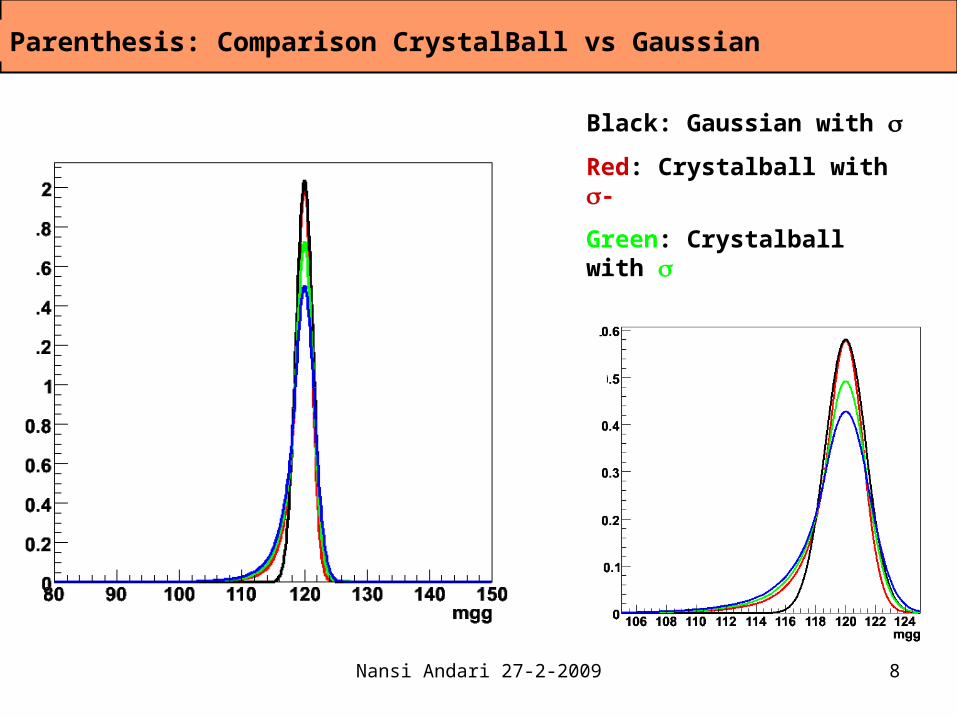
Parenthesis: Comparison CrystalBall vs Gaussian
Black: Gaussian with
Red: Crystalball with -
Green: Crystalball with
Blue: Crystalball with +
Nansi Andari 27-2-2009 9
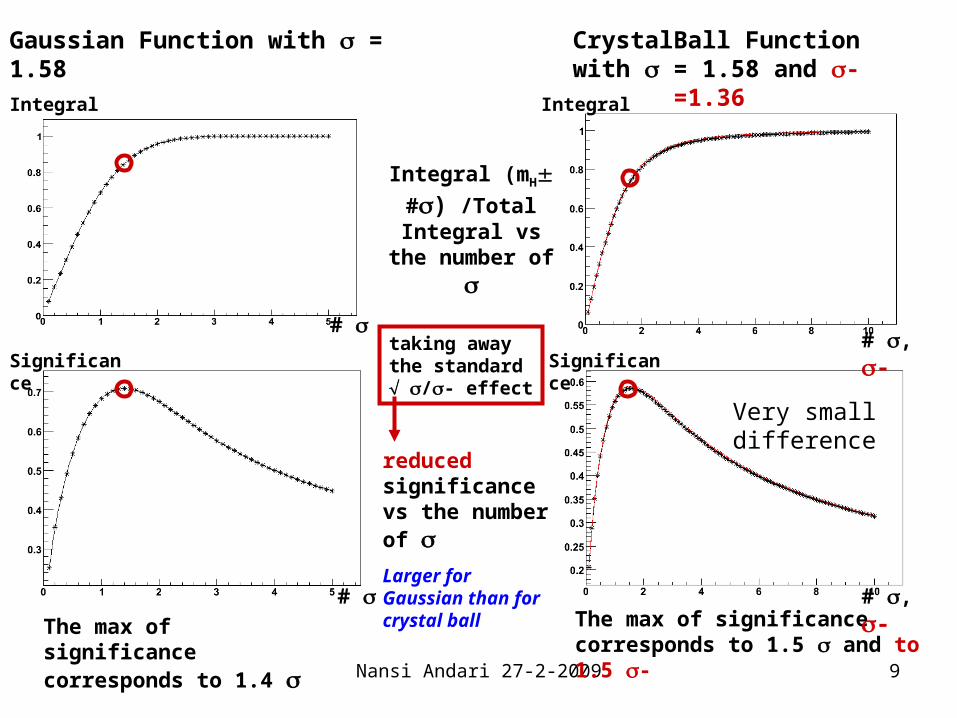
CrystalBall Function with = 1.58 and - =1.36
Gaussian Function with = 1.58
reduced significance vs the number of Larger for Gaussian than for crystal ball
Integral (mH #) /Total Integral vs the number of
The max of significance corresponds to 1.4
The max of significance corresponds to 1.5 and to 1.5 -
Very small difference
taking awaythe standard /- effect
#
# # , -
# , -
Integral Integral
Significance Significance
Nansi Andari 27-2-2009 10
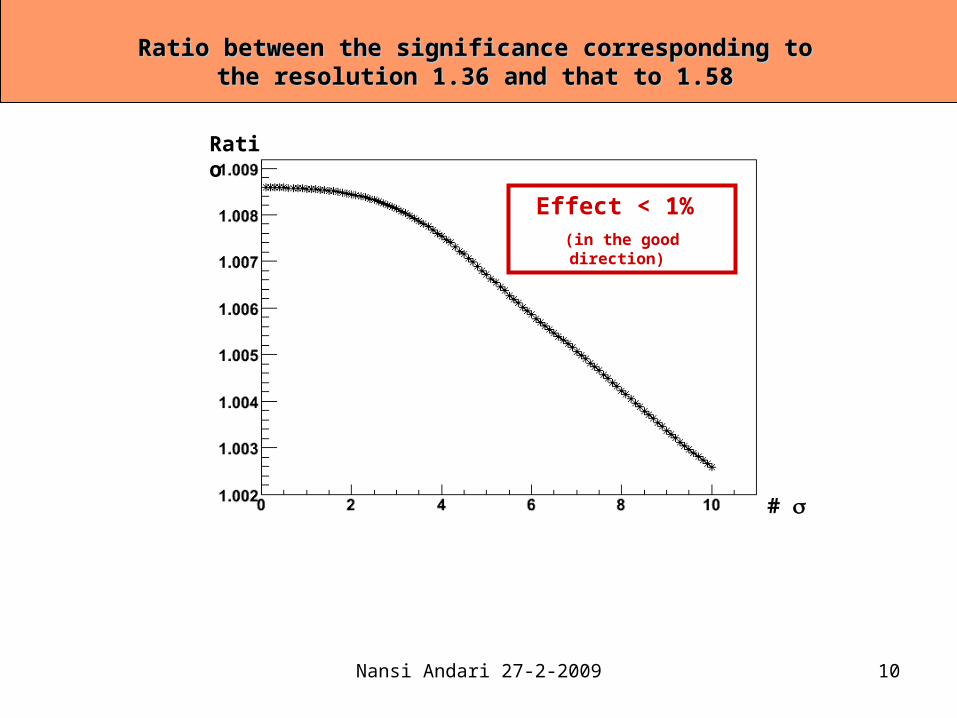
Ratio between the significance corresponding to the resolution Ratio between the significance corresponding to the resolution 1.36 and that to 1.581.36 and that to 1.58
Effect < 1% (in the good direction)
#
Ratio
Nansi Andari 27-2-2009 11
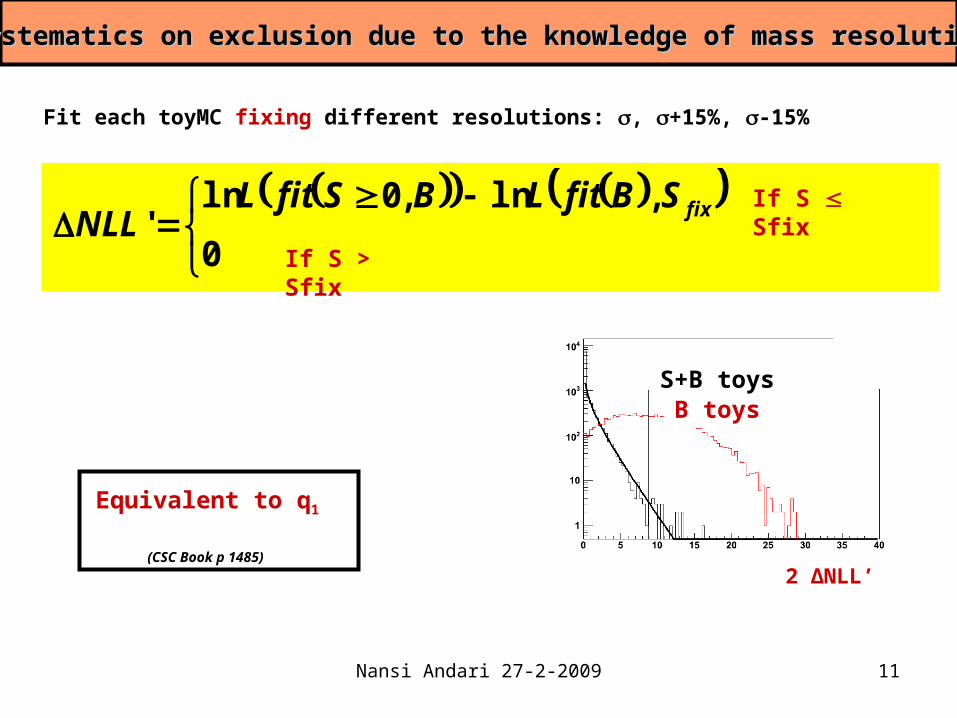
III- Systematics on exclusion due to the knowledge of mass resolution III- Systematics on exclusion due to the knowledge of mass resolution
B toys S+B toys
Equivalent to q1
(CSC Book p 1485)
2 ΔNLL’
0
,ln,0ln'
fixSBfitLBSfitLNLL
If S > Sfix
If S Sfix
Fit each toyMC fixing different resolutions: , +15%, -15%
Nansi Andari 27-2-2009 12
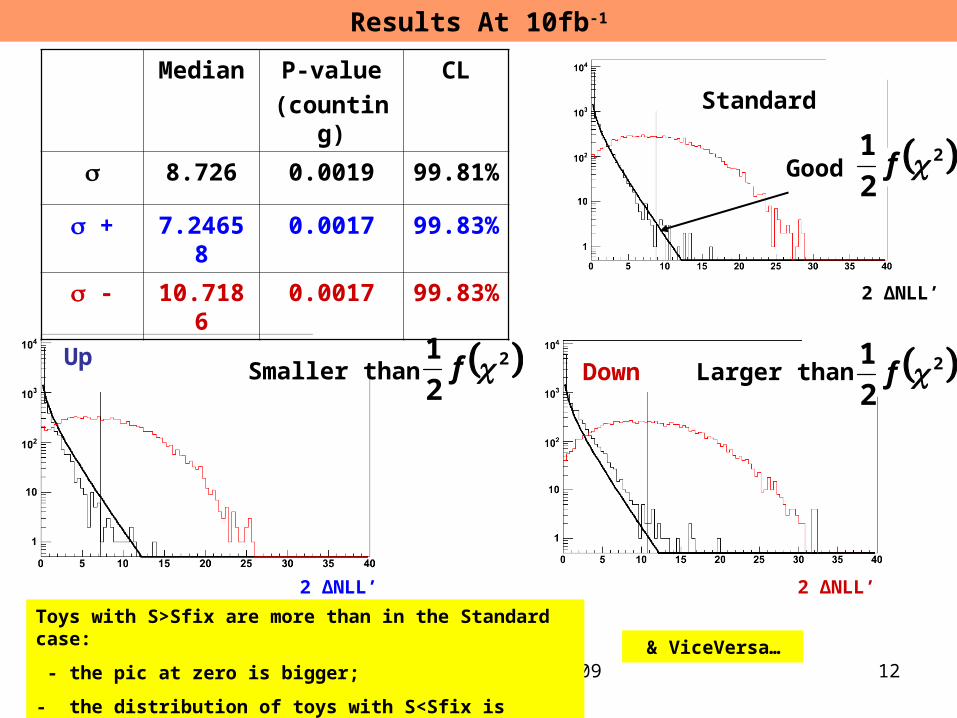
Up Down
StandardMedian P-value
(counting)
CL
8.726 0.0019 99.81%
+ 7.24658 0.0017 99.83%
- 10.7186 0.0017 99.83%
Good
Smaller than Larger than
Toys with S>Sfix are more than in the Standard case:
- the pic at zero is bigger;
- the distribution of toys with S<Sfix is smaller than 1/22
& ViceVersa…
22
1 f
22
1 f 22
1 f
2 ΔNLL’2 ΔNLL’
2 ΔNLL’
Results At 10fb-1

Nansi Andari 27-2-2009 13
Results At 0.5fb-1
Median CL
(2)
CL
(counting)
0.434293 74.5% 74.88%
+ 0.3556058 72.5% 74.75%
- 0.536504 76.8% 74.62%
Standard
Up Down
The 2 gives a very similar result
2 ΔNLL’
2 ΔNLL’
2 ΔNLL’
Nansi Andari 27-2-2009 14
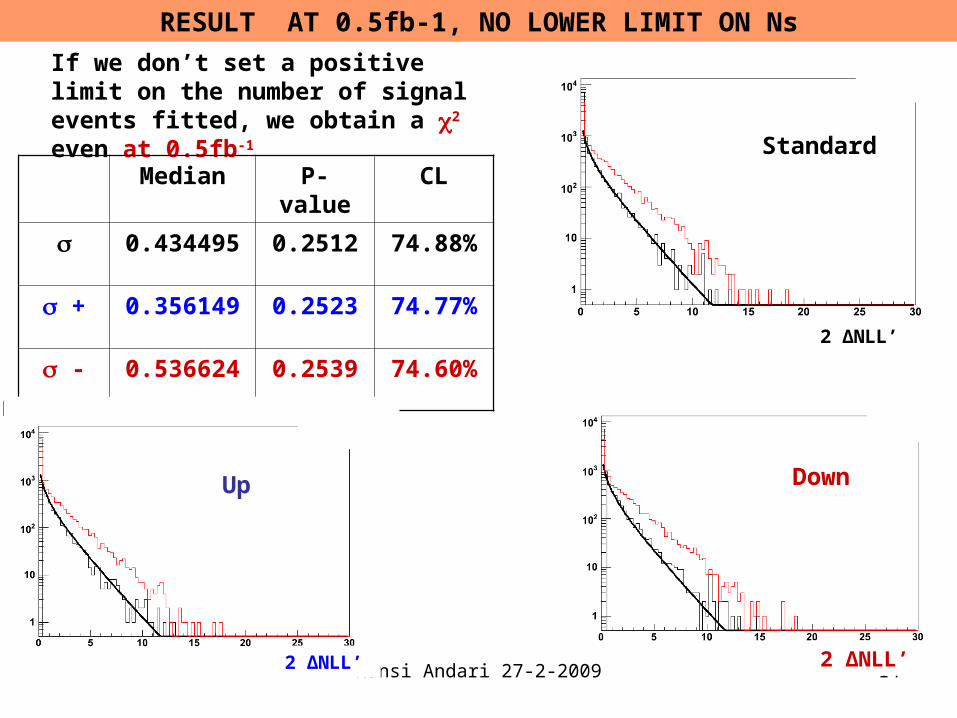
If we don’t set a positive limit on the number of signal events fitted, we obtain a 2 even at 0.5fb-1
Median P-value CL
0.434495 0.2512 74.88%
+ 0.356149 0.2523 74.77%
- 0.536624 0.2539 74.60%
Up Down
Standard
2 ΔNLL’2 ΔNLL’
2 ΔNLL’
RESULT AT 0.5fb-1, NO LOWER LIMIT ON Ns
Nansi Andari 27-2-2009 15
Standard Up
Down
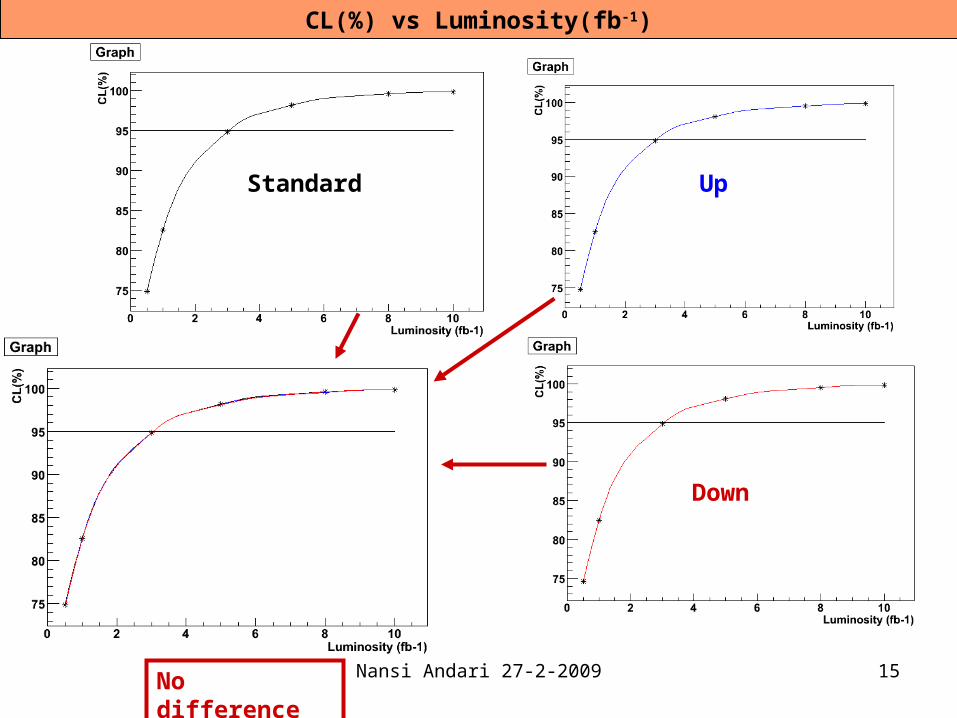
CL(%) vs Luminosity(fb-1)
No difference

Nansi Andari 27-2-2009 16
IV- Systematics on the signal Cross SectionIV- Systematics on the signal Cross Section for the exclusion
Generated signal
(10000 Toys) Fit configuration
S=355 Sfix=355
S+=426 Sfix+=426
S-=284 Sfix-=284
Background=50688
What happens if the cross section is different by 20%?
Generate and fit toy MC assuming a theoretical uncertainty of 20% on the number of signal events.

Nansi Andari 27-2-2009 17
Standard
Up Down
Good
Fit Median CL
(counting)
CL
(2)
S 8.726 99.81% 99.84%
S+ 12.4909 99.84% 99.98%
S- 5.62352 99.20% 99.11%
22
1 f
2 ΔNLL’2 ΔNLL’
2 ΔNLL’

Nansi Andari 27-2-2009 18
Generation
(10000 Toys) Fit
S=355
Sfix=355S+=426
S-=284
Background=50688Study of the exclusion
What happens if the cross section is different by 20% but we always make the same hypothesis?
Generate and fit toy MC assuming a theoretical uncertainty of 20% on the signal cross section in the generation and fitting always with the SM hypothesis:

Nansi Andari 27-2-2009 19
Standard
Up Down
Generation Median CL
(counting)
S 8.726 99.81%
S+ 8.726 99.96%
S- 8.726 99.2%
Not a 2
Fit with S
2 ΔNLL’
2 ΔNLL’
2 ΔNLL’
Nansi Andari 27-2-2009 20
V- Conclusion
• Preliminary study of the systematic error due to the fixed mass resolution has been Preliminary study of the systematic error due to the fixed mass resolution has been performed both for observation and exclusion of a signal. performed both for observation and exclusion of a signal.
• For the observation different methods and significance estimators have been For the observation different methods and significance estimators have been compared: results are coherent.compared: results are coherent.
• A variation of 15% on the mass resolution implies a systematic error of (9.7+/- 1)% A variation of 15% on the mass resolution implies a systematic error of (9.7+/- 1)% (coherent with CSC note value 8.4%).(coherent with CSC note value 8.4%).
The systematic error due to a fixed value different by 15% from the truth is (0.6+/-The systematic error due to a fixed value different by 15% from the truth is (0.6+/-0.3)% , not coherent with the CSC value (4.2%)0.3)% , not coherent with the CSC value (4.2%)
• We evaluated the exclusion (CL) as a function of the integrated luminosity: to exclude We evaluated the exclusion (CL) as a function of the integrated luminosity: to exclude the Standard Model at 95%CL we need 3fb-1.the Standard Model at 95%CL we need 3fb-1.
• A first look at the impact of the Standard Model cross section uncertainty on the A first look at the impact of the Standard Model cross section uncertainty on the exclusion (CL) has been given: no big effects observed. exclusion (CL) has been given: no big effects observed. (To be complete…) (To be complete…)

Nansi Andari 27-2-2009 21
BACKUP
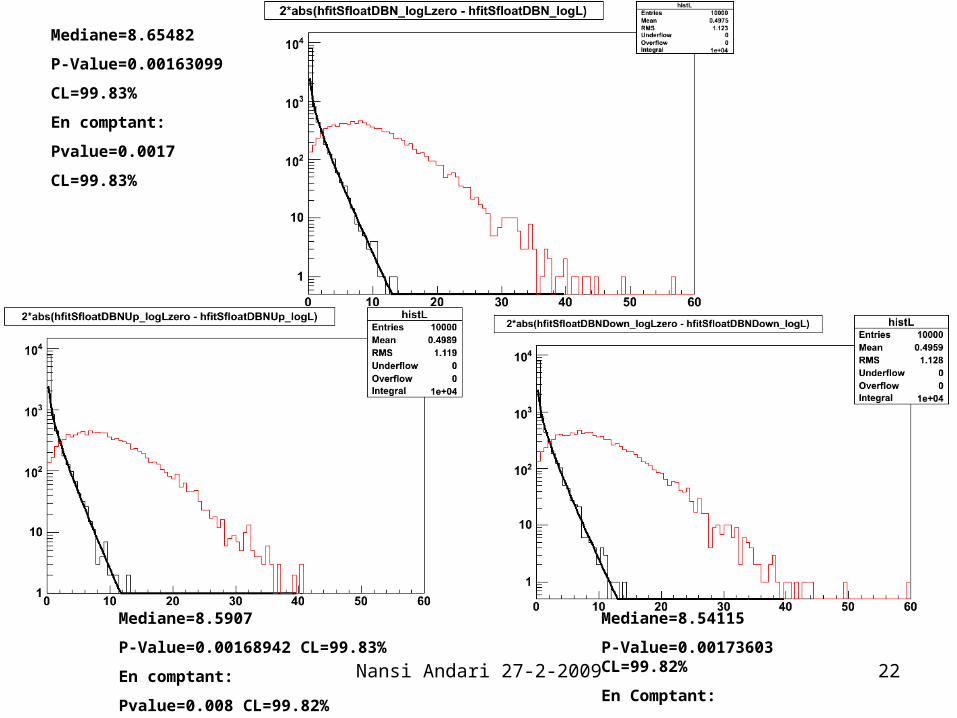
Nansi Andari 27-2-2009 22
Mediane=8.65482
P-Value=0.00163099
CL=99.83%
En comptant:
Pvalue=0.0017
CL=99.83%
Mediane=8.5907
P-Value=0.00168942 CL=99.83%
En comptant:
Pvalue=0.008 CL=99.82%
Mediane=8.54115
P-Value=0.00173603 CL=99.82%
En Comptant:
Pvalue=0.0021 CL=99.79%

Nansi Andari 27-2-2009 23
Difference of the total events number
Up-Standard
Down-Standard
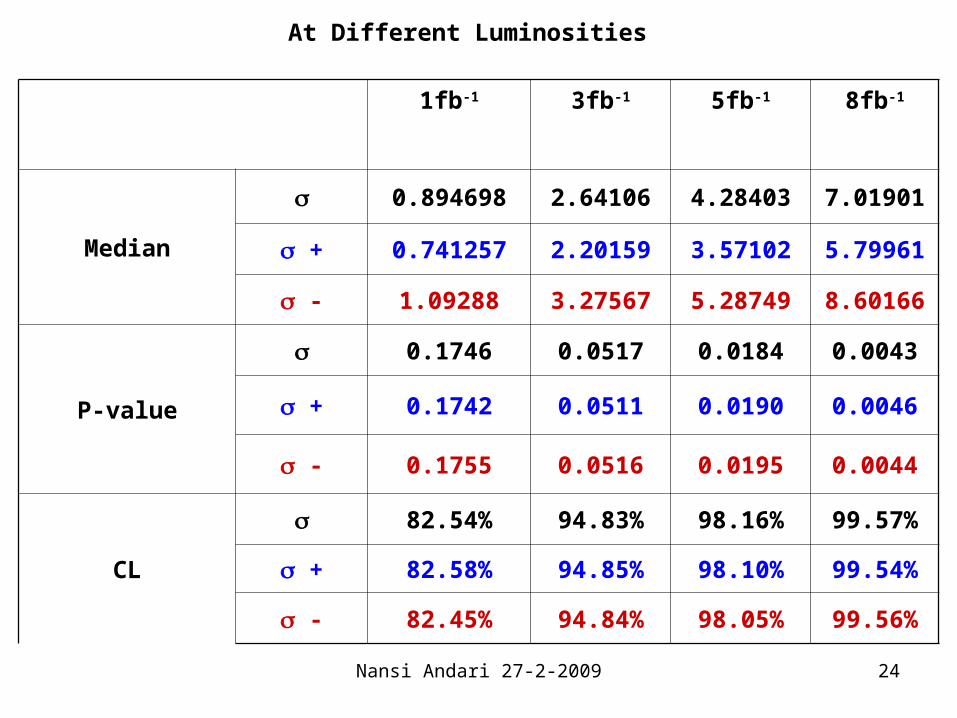
Nansi Andari 27-2-2009 24
1fb-1 3fb-1 5fb-1 8fb-1
Median
0.894698 2.64106 4.28403 7.01901
+ 0.741257 2.20159 3.57102 5.79961
- 1.09288 3.27567 5.28749 8.60166
P-value
0.1746 0.0517 0.0184 0.0043
+ 0.1742 0.0511 0.0190 0.0046
- 0.1755 0.0516 0.0195 0.0044
CL
82.54% 94.83% 98.16% 99.57%
+ 82.58% 94.85% 98.10% 99.54%
- 82.45% 94.84% 98.05% 99.56%
At Different Luminosities
Nansi Andari 27-2-2009 25
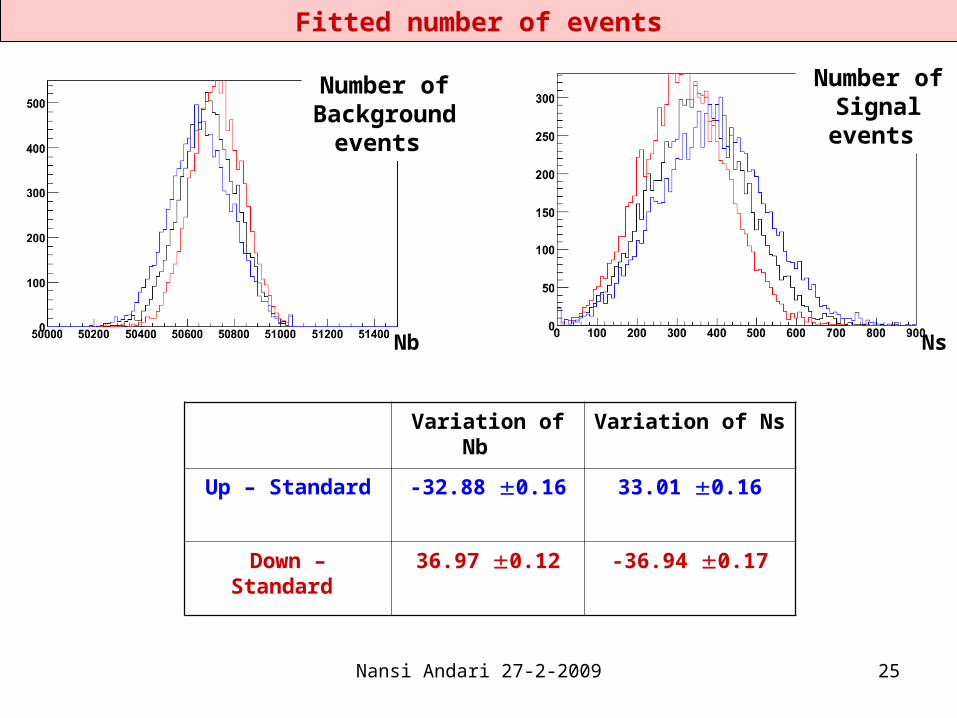
Variation of Nb Variation of Ns
Up – Standard -32.88 0.16 33.01 0.16
Down – Standard 36.97 0.12 -36.94 0.17
Number of Background
events
Number of Signal events
Nb Ns
Fitted number of events
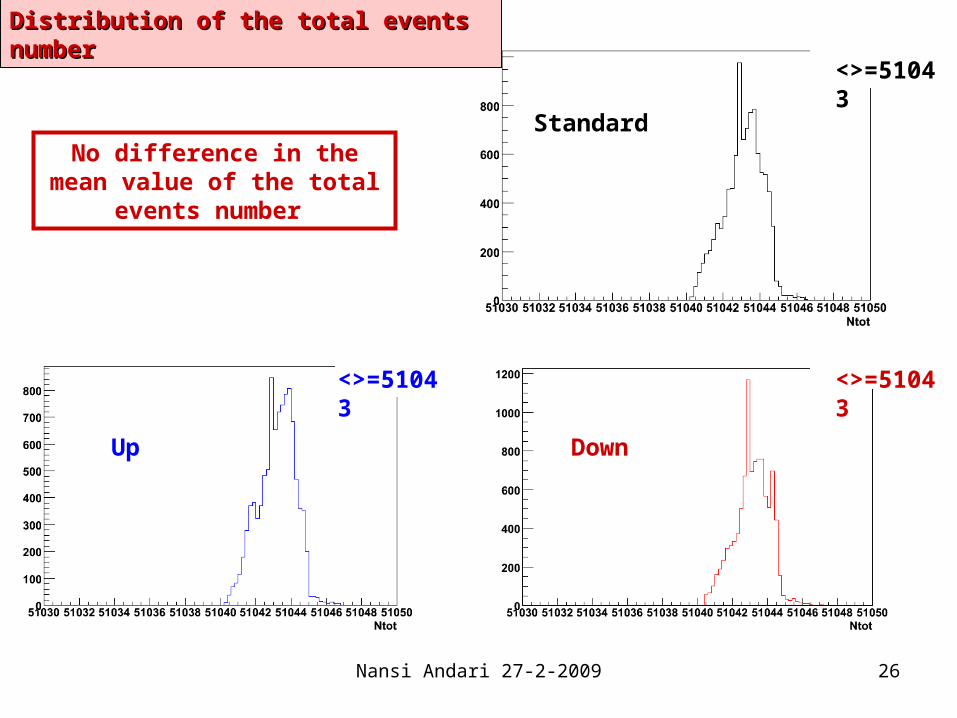
Nansi Andari 27-2-2009 26
<>=51043
<>=51043
Standard
Down
Distribution of the total events numberDistribution of the total events number
No difference in the mean value of the total events
number
<>=51043
Up