some potential economic benefits of eliminating mortality...
TRANSCRIPT

Soc. Sci. & Mrd.. Vol. 8, pp. 383 to 398 Pergamon Press 1974. Printed in Great Britain.
SOME POTENTIAL ECONOMIC BENEFITS OF ELIMINATING MORTALITY ATTRIBUTED TO SCHISTOSOMIASIS
IN ZANZIBAR
JOEL E. COHEN Department of Biology and School of Public Health, Harvard University. Cambridge, Mass., U.S.A.
Abstract-Previous studies of the economic impact of schistosomiasis have attempted to measure the costs of treating the disease and the reduction in the productivity of labor due to morbidity from the dis- ease. Where control of schistosomiasis commands few funds or where infection impairs the productivity of labor in ways that are difficult to measure, these approaches may overlook a major economic benefit of eliminating the disease: the increase in productivity due to the extension of working life.
Based on published, but inadequate, epidemiological, demographic, and economic data, this study esti- mates the potential economic benefits to males in Zanzibar in 1960 of eliminating mortality due to urinary schistosomiasis for the remainder of their lives. The per capita benefit was of the same order of magnitude as the p r r capita expenditures on health of the Government of Zanzibar in 1960. According to the data in conjunction with substantial assumptions, the elimination of mortality due to schistosomiasis would have increased the expectation of life a t birth of Zanzibar males in 1960 by approx. 1.8 yr, and would have extended the life of the average male in Zanzibar in 1960 by 2.3 yr. The procedures of estimation are described in enough detail so that they may be applied to other places and times. An important pur- pose of the paper is to stimulate the collection of data better than those available, so that the results of using the estimation procedures may be more credible.
INTRODUCTION If no one does interesting calculations based on data The struggle to control diseases requires answers to which could be collected, there is no motivation to two related questions: What should be controlled! make the observations necessary for the proper statis- How should it be controlled ? tics. This paper tries to take the best observations
The first question requires measurement of the available and to show one interesting use which could potential benefits of controlling each disease or com- be made of better observations. bination of diseases. These potential benefits may be Weisbrod et al. 121 have classified the potential crudely classified as economic (having to do with the economic benefits of disease control as direct and in- production and consumption of goods and services), direct. Among the direct are: increased output due to demographic (having to do with birth, death, and decreased absenteeism; increased output due to in- migration) and others. creased efficiency during work; and increased output
A major purpose of this paper is to apply some due to the extension of working lives. Among the in- newly developed measures (Cohen [I]) to estimate one direct are: the expenditure of fewer resources to care part of the potential economic benefits and one part of for the sick; and the expenditure of fewer resources to the potential demographic benefits of eliminating mor- prevent the healthy from getting sick. Though classify- tality due to schistosomiasis in Zanzibar. Another ing these benefits differently as direct or indirect, Rice major purpose of this paper is to emphasize the limita- [>5] has estimated some of these benefits for the tions and shortcomings of the measures and data used. United States, using measures previously developed. with the hope of stimulating the development of better This paper will estimate just one of these benefits, replacements. the increase in output due to the extension of working
This paper will repeatedly insist on the inconclusive lives. The measures used estimate the present value and inadequate nature of the data used in it and on the (over a range of discount rates) of the increase in out- frequent lack of empirical support for the assumptions put which would result from the elimination of morta- which become necessary because the data are so unsa- lity due to schistosomiasis for the remainder of the tisfactory. The only excuse for using such data at all is lives of the male population of Zanzibar as estimated the hope that the conclusions, justified only if the data ca. 1960. are credible, are of suflicient interest to motivate the Among the potential demographic benefits of dis- preparation of more credible data. If no one collects ease control are: an increase or a decrease in fertility satisfactory data. it is not possible to d o credible calcu- (since both are possible consequences and both are lations based on them. regarded as benefits by some people); an increased
S.S.M. 817-4 383

expectation of life; and an alteration of patterns of migration to or from formerly disease-ridden areas.
This paper will estimate only the increase in expected years of life of Zanzibar males ca. 1960 which would result from the elimination of mortality due to schistosomiasis.
Among the other potential benefits of disease con- trol, which will be neglected here. are: changes in social and political organization due to the better health of the population; and other improvements in the "qua- lity of life" not traditionally subject to economic measurement. (Dowie [6] has debated the appropri- ateness of counting some of these potential benefits separately from the economic benefits).
One reason that this paper focuses on the potential increase in output as a result of the extension of work- ing lives is to counteract the inclination, which will be noted in some studies to be reviewed below, to focus exclusively on what is already being spent to control or treat a disease or on the reduction in work due to mor- bidity from the disease. Such an inclination can lead to a serious underestimate of the potential economic benefits of reducing a cause of deaths.
A second reason for focusing on the potential in- crease in output resulting from the extension of work- ing lives is that this benefit alone is nonnegligible, according to available mortality data from Zanzibar. Before action can follow from this observation, how- ever, much additional information is required (Feld- stein [?I), as the conclusion of this paper will empha- size.
A third reason for focusing on the extension of working lives is to illustrate in detail how incomplete and fragmentary data can be pieced together to yield an admittedly approx. estimate of at least one potential economic benefit of disease control. Given such a pro- cedure, the data required to make estimates for other times and places can be anticipated and supplied by appropriate epidemiological, demographic, and econo- mic observations.
Before the calculations, the following two sections review, first, previous attempts to estimate economic costs of schistosomiasis and, second, studies of morta- lity due to schistosomiasis other than the study which will be used here.
PREVIOUS ESTIMATES OF ECONOMIC COSTS OF SCHISTOSOMIASIS
Weisbrod et al. [2] offer a broad review of early and recent studies of the economic and cultural impact of diseases, including other infectious diseases, such as malaria, in both rich and developing countries. The following review focuses on studies of schistosomiasis, only one of which was reviewed by Weisbrod et al. [2].
The earliest published quantitative estimates known to me of some economic costs of schistosomiasis, other than those cited by Farooq [8], are due to Watson [9]. These estimates considered the direct costs of treat- ment and control programs and the indirect costs of
time lost from work for hospital visits due to schistoso- miasis hematobium in Iraq. Accepting an unpublished estimate by Ansari that in Egypt an individual with schistosomiasis hematobium "would lose from 4 to 20 per cent of his energy and working power" (Watson [9], p. 209) Watson estimated the agricultural produc- tivity foregone due to the prevalence of the disease in Iraq.
Farooq ([8], p. 323) indicated that the authors of an earlier study "were unable to obtain reliable evidence for or against any marked loss of manpower attribu- table to schistosomiasis in the Sudan", and concluded that mortality 'data would be preferable. Unfortun- ately, autopsies were not performed in the rural areas of the Philippines which he studied. Farooq [8] assumed that when individuals infected with Schistoma japoni- cum said they were sick but not disabled, they lost 25 per cent of their working capacity. He estimated an equivalent of 5.4 days of total disability per person in- fected with S. japonicum in the Philippines. Nearly half of this total is due to his assumption about nondis- abling sickness. Removing the impact of other helmin- thic infections left a net loss of 4.7 man-days per person with schistosomiasis per year. Farooq ([8], p. 328) estimated the economic value of the productivity fore- gone by assuming that half the persons infected were breadwinners earning the Philippine legal minimum wage. His estimate of total economic impact combined this estimate of labor loss with the costs of treatment. In reviewing this work, Weisbrod et a/. ([2], p. 22) observed several serious limitations of its assumptions and procedures, and hence of its conclusions.
Foster [lo] studied the effects of primarily asympto- matic infections with Schistoma mansoni on health and working habits of cane cutters and irrigators on a sugar plantation in Tanzania. When men came to work, there was no significant difference in output between those with schistosomal infections and those without. Absenteeism from work for no discernible cause was significantly more frequent among infected individuals than among uninfected, and the difference was greater among irrigators, frequently exposed to water, than among cane cutters (Foster [lo], pp. 19@ 191). This absenteeism was costly to the company operating the estate because extra men had to be employed in order to guarantee enough irrigators at any given time to perform scheduled work. Foster showed that the cost to the company of a control pro- gram to reduce the number of cases was less than the savings in costs of direct treatment and absenteeism.
D. J. Bradley (personal communication, 1972) observes that in this study, individuals with schistoso- miasis also suffered more from malaria, so that the morbidity attributed to schistosomiasis could actually be due to malaria.
A fourth report (Cheng [I I], p. 45), without further detail or documentation, commented that "according to (mainland) Chinese estimates, the disease (S. japoni- cuvn) causes an average loss of 40 per cent of a patient's capacity to work. . .".

Benefits of eliminating mortality attributed to schistosomiasis 385
The four studies just cited attempt to examine the Scott [15] noted the difficulty of obtaining accurate economic costs of direct treatment or of loss of work morbidity and mortality rates for schistosomiasis and due to morbidity from the disease. None treats the suggested ([15], p. 127) a special statistical system to economic consequences of mortality due to the disease. avoid gross errors in assigning causes of death. "In any
Weisbrod et al. [2] studied the impact of parasitic case it is certain that little reliance can be placed on . . . diseases in St. Lucia, West Indies, on death rates and, rates" produced by the then current system. His results for adult women, on fertility rates; on the reading abi- may be summarized thus:
Ratio of deaths from schistosomiasis to
deaths from all Concurrent Percentage infected with causes for ages
Region infection S. haematobium S. mansoni 5 6 5
I Ascaris common 60 60 2 Ascaris common 60 6 3 Ascaris rare 60 0 4 Ascaris rare 5 0
lity, class rank, height, weight, and absenteeism of school children; and on the daily output and number of days worked of adults working in agriculture and light industries. Their "findings are that, on the whole, infection by schistosomiasis and also by any of the other parasitic diseases studied appears to cause few statistically significant adverse effects on these variab- les". These findings surprised even the authors of the study, which is the most massive and comprehensive investigation of the socio-economic impact of schisto- somiasis yet undertaken. The authors consider poss- ible explanations why the absence of disease effects may be an artifact and why the absence may be real. The findings on mortality will be reviewed critically in more detail below.
Finally, Fenwick et al. [12] have announced a study of a schistosomiasis control program on a sugar estate in Tanzania. According to their abstracts, all the aims of their study have been achieved except these two: 'To evaluate the effect of snail control plus mass treat- ment on the prevalence of S. mansoni" and ' T o investi- gate the relevant economic aspects of the programme".
MORTALITY DUE TO SCHISTOSOMIASIS: A SURVEY
The earliest estimate of mortality due to schistoso- miasis known to me is by Kan and Kung ('141. p. 451). "On account of the lack of an accurate census, birth and death rates cannot (sic) be stated accurately. According to our limited statistical investigation of 28 villages including 1704 people, the crude death rate was in 1933, 21.8/mille and in 1934, 35.2Imille. . . . The death rate due to Schistosomiasis japonica (sic) alone was in 1933, 11.2/mille and in 1934, 164/milIe. The. severe drought in 1934 may account for the increased death rate from Schistosomiasis japonica, because muscular exertion under unfavorable conditions tends to aggravate the disease". Kan and Kung do not state on what grounds they attributed deaths to schistoso- miasis. The death rates they attribute to schistoso- miasis are the highest ever reported.
Gaud ([16], p. 225) in a survey of schistosomiasis in west and central Africa commented:
"Doctors asked (about deaths due to schistosomiasis) recognize the difficulty of determining the exact responsi- bility of bilharzia for the death of individuals who almost always present, on the one hand, a multiple intestinal par- asitemia and, on the other, a deficient nutrition, whose very relation to the parasites is difficult to establish (my transla- tion).
He then attributed 2.33 per cent of general hospital mortality to S. mansoni and 0.08 per cent to Schistoma haematobium.
In surveying Madagascar, Gaud ([17], p. 262) reported that in 1950 2.7 out of 1000 deaths were due to schistosomal infection of unspecified species. He did not say whether these were hospital deaths nor where he got his figures.
Edington ([18], p. 48) summarized his scrupulous observations at the Medical Research Institute of Accra as follows:
"During 1955, therefore, in all autopsies in which disease of the genito-urinary system was the primary cause of death, the bladder or ureter was examined histologically for the presence of ova. In 24 post-mortems renal conditions were the primary cause of death and in nine of these schistoso- miasis was considered to be directly responsible for the resulting pathological condition. In this year 604 post-mor- tems were performed (177 being due to unnatural causes). Schistosomiasis therefore was responsible for 2.1 per cent of deaths in the post-mortem material excluding deaths from unnatural causes, a much higher figure than was expected when it is remembered that schistosomiasis is rare in Accra".
The relation between deaths in the post-mortem material and deaths in the general population is un- known.
A review by Odei (1191, p. 94) attributed mortality figures to Gaud [I61 which I could not confirm in the original publication.

In patients over 2 yr old who died at University Col- lege Hospital, Ibadan, Edington et al. [20] found eggs of S. haematobium in 135 out of 673 cadavers. From measurements of the concentration of eggs in tissue, they concluded that the schistosomal infection may have been the cause of death in only one of these 135 cases (Edington et al. [20], p. 991).
Forsyth et al. [21] and Lehman et al. [22] reported briefly on deaths attributed to kidney failure in, re- spectively, Tanzanian and Egyptian communities with endemic urinary schistosomiasis. In a 6-yr follow-up of seven patients who had a nonfunctioning kidney in 1963. Forsyth et al. [21] found that three had died. All three wereeither over 60 yr or "very o l d . It is doubtful that these observations justify an inference of excess mortality due to schistosomiasis. Lehman et al. [22] found 11 male farmers. aged 9-52 yr, with radiographic nonfunctioning of one or both kidneys in a hospital population of 175 male farmers with urinary schistoso- miasis. These 11 suffered a very elevated mortality, which Lehman et al. [22] attributed importantly to iatrogenic urinary tract infections.
Weisbrod et al. [2] investigated the consequences of schistosomiasis for mortality in two valleys of St. Lucia by a method commonly known as "ecological correla- tion". Instead of determining whether infection in- creases an individual's probability of death, they deter- mined rates of infection, by field survey, and rates of death, from official records over 5 yr, in 11 areas in Cul-de-sac Valley and six areas in Roseau Valley. Considering only infection and death among indivi- duals aged 5 yr or older, they estimated the regression of death rate on the schistosomal infection rate, while adjusting for each area's mean age, sex ratio, and rates of infection with hookworm, Ascaris, Trichuris. and Stl-oi~gyloides. They found that increased schistosomal infection appeared to decrease the death rate, although the effect was not statistically significant. In fact, they concluded (p. 68):
"(n) one of the independent variables (age, sex, disease prevalence) exerted a significant impact on death rates. re- glirdless of which regression form was used. . . . A seriously constraining factor in the statistical analysis is the limited number of subgroup observations (due to the use of ecologi- cal correlation rather than the study of individuals) and, hence. degrees of freedom. For this reason, our findings are certainly not a definitive rejection of the hypothesis that death rates in St. Lucia are substantially affected by para- sitic infections".
Ongom and Bradley [23] and Ongom et al. [24] reported a coordinated study in field and hospital of a community in the West Nile. Uganda, chosen expressly as a community heavily infected with S. man- soi~i. They have established demographic and epide- miologic baselines for further prospective study. In their first 2 yr of investigation they observed a crude death rate of 26 per 1000, higher than that observed in an equal interval in Zanzibar by Forsyth [13] but con- siderably lower than that estimated (Table 5) for For-
Table 1. Prevalence of infection with Schistosoma haemato- hium among males by age in rural Zanzibar (Forsyth [13],
p. 772)
Ages Number % Infected
syth's area by fitting a stable population. The reported deaths were associated primarily with dysentery and ascites. Ongom and Bradley ([23], p. 850) conclude that "In conjunction with our hospital observations it appears that 25 per cent and quite probably more of the mortality observed at Panyagoro over 2 yr was of schistosomal origin". As long-term follow-up proceeds, this community may offer the most reliable evidence of the potential impact of one of the schistosomiases on health and mortality in the field.
While this information accumulates, we turn to a study (Forsyth [13]) which appears to be far from satisfactory and still the best available.
MORTALITY FROM SCHISTOSOMIASIS IN ZANZIBAR
Forsyth [13] examined stool and urine specimens of 1004 people (93.5 per cent) in a community of 1074 people in rural Zanzibar. The distribution of the males he examined, by broad age class, and the percentage positive in each age class, are given in Table 1 (from Forsyth [13]. p. 772). At the beginning of the 2-yr period of observation, the prevalence of eggs in urine for both sexes was 65.1 per cent. At the end of 2 yr, after an attempt to eradicate urinary schistosomiasis, the prevalence was 45.0 per cent. Of 794 satisfactory urograms made, Forsyth ([13], p. 775) classified 35.4 per cent as pathological. Just as the males had a higher prevalence (72.1 per cent) of apparent infection, they also had a higher prevalence (45.8 per cent) of radio- logically apparent pathology.
During the 2 yr from June 1965 to June 1967, 22 people in the study area died. Of these, two men and a woman aged 20 yr or more had "radiological non- function of one or both kidneys" and one man had "very severe bilateral hydronephrosis". Forsyth ([13], p. 781) concluded that these figures "show quite clearly that endemic urinary schistosomiasis kills people and was probably responsible for about two deaths annually in the community of 1000".
Forsyth ([13], p. 782) estimated a crude death rate of 11 per 1000 for this community, excluding neonatal death. He estimated the fraction of all adult (people aged 20 yr or over) deaths due to schistosomiasis as 2 per 11. In fact, three of the 22 deaths Forsyth reported were of individuals less than 20 yr, and only 19 were

Benefits of eliminating mortalit) I attributed to schistosomiasis 387
of individuals over 20 yr. Thus 4 per 19 of the deaths of individuals 20 yr or more were attributed to schisto- somiasis, and taking 4 per 22 = 2 per 11 or roughly 18 per cent as the fraction of adult (aged 20 or more) mor- tality due to schistosomiasis is an understatement.
The conclusion that 18 per cent of mortality of indivi- duals over 20 yr may be attributed to schistosomiasis is subject to several serious limitations.
Forsyth [I31 nowhere cross-tabulates his data on in- fection with S. haemutohium and on kidney function. He offers no direct demonstration that present or prior schistosomiasis is in fact associated with kidney failure among the living. While 78 per cent of adult males and 59 per cent of adult females were infected with S. hae- matobium, 11 per cent of adult males had non-function- ing kidney while less than 1 per cent of adult females had a non-functioning kidney. The ratio of odds of kid- ney non-function for males as compared to females (0.126 divided by 0.008) far exceeds the ratio of odds of infection for males as compared to females (3.525 divided by 1.433). So it is not implausible that factors other than schistosomiasis contribute to kidney failure.
Further, "none of the deaths occurred in hospitals and there were no post-mortem examinations" (For- syth [13], p. 777). Hence there is no direct evidence that the adults or eggs of S. haematobiurn were even partly, let alone entirely, responsible for the pathology leading to death in the four cases Forsyth attributed to schistosomiasis. Forsyth does not even say whether those four individuals were passing eggs at the begin- ning of the study. As mentioned above, Edington [18] attributed only nine out of 24 deaths due to renal con- ditions in Ghana to urinary schistosomiasis. It is there- fore plausible that some of the urinary disorders attri- buted by Forsyth to schistosomiasis had other causes.
On the other hand, during the parasitological survey before Forsyth's 2 yr observation, "two persons died, eight joined the army and 56 others left the area" (For- syth [13], p. 773). Since soldiers and migrants are likely to be males in the years of peak risk of mortality from schistosorniasis, and some may have emigrated specifi- cally for medical attention not available in the study area, an unknown number of individuals possibly at increased risk of mortality due to schistosomiasis were removed from the study population.
The epidemiological generality of Forsyth's study is also open to question. Forsyth [13] does not describe how he chose the villages he studied, except to say that the school children of the community had been studied previously. Since the community was probably not drawn by random sampling, it is u priori doubtful that epidemiological statistics from this community are un- biased estimators of the characteristic~ of all of Zanzi- bar. D. J. Bradley (personal communication, 1972) asserts that the community was not, and was not in- tended to be, representative of Zanzibar, but was rather exceptionally heavily infected. Unfortunately, since there are no comparable studies of other parts of Zanzibar, it is not possible to know to what extent Forsyth's community deviates from the average.
In private criticism of Forsyth's study. others have noted that the death rates were lowest in the fraction of the population with the highest infection, and were highest in the fraction of the population with the low- est infection. This is a consequence of the age distribu- tion of infection: the most heavily infected individuals, 6 2 0 yr, suffered least mortality from all causes, as they do in almost all human populations, while the least heavily infected, over 45 yr, suffered, as they do generally, the highest mortality. This demographic artifact, and the possibility that renal pathology may be only a long-term consequence of schistosomal infec- tion, render invalid this epidemiological criticism of Forsyth.
Aside from the above epidemiological criticisms, Forsyth's study is open to a demographic comment. In the 2 yr of the study, only one male and no females 5 yr or less died, in an initial population of 104 such males and 80 such females. Such a childhood death rate (three per 1000 per year) is exceptionally low for any African population. Even allowing for sampling fluctuations due to the limited number of children in the population, this low figure raises serious questions about the completeness of the reporting of deaths. For- syth's method of keeping track of deaths is not reported.
Systematic biases of an epidemiological or demographic nature aside, Forsyth's figures provide no statistically significant evidence (at any reasonable level of significance) for a difference in death rates between the infected and uninfected subpopulations, even if all four of the claimed cases did die primarily from schistosomiasis (N. Keyfitz, personal communi- cation. 1 May 1973). The need for enough observations to justify conclusions should not be overlooked in future studies.
For lack of better information. Forsyth's figures will be accepted as estimates with large but unknown mar- gins of uncertainty. Calculation of the statistical uncer- tainties due to sampling errors would give a false im- pression of precision, since systematic uncertainties in determination of cause or in selective emigration are of unknown magnitude.
ESTIMATING A LIFE TABLE FOR RURAL ZANZIBAR
Estimating the benefits of eliminating a cause of mortality requires a life table. No life table for Zanzi- bar is available from standard sources (Brass et al. [25]; Keyfitz and Flieger [26]). Hence a life table has been estimated using the theory of stable populations. Stable populations were first fitted to available census information for Zanzibar, following Brass et al. [25]. Then the distributions into age categories predicted by these stable populations were compared with the age distribution recorded by Forsyth 1131. In this way the stable age distributions were checked by consistency with both the official figures on the aggregated popula- tion of Zanzibar and the research data on the popula- tion from which Forsyth drew his mortality estimates.

Table 2. Censused population of Zanzibar Protectorate and estimated intercensal intrinsic rates of natural increase per
year
Total Zanzibar Year (both islands) lOOO?$
*According to Blacker ([27], p. 258). "The 1921 Census covered only Europeans and Asians other than Arabs; the 1924 Census covered the indigenous inhabitants and main- land Africans, Arabs and other small groups. . .".
t Blacker ([27], p. 259). $ United Nations ([28], p. 10). According to the prelimi-
nary results of the 1967 census, the Zanzibar population was 354,360 (United Republic of Tanzania [29]).
5 i = l og (later population1earlier population)/(years between censuses).
Before applying models of stable populations to the Zanzibar data, it must be noted that the appropriate- ness of these models for this situation is open to argu- ment. Comparison of the age distributions of males in 1948 and 1958 ([25], pp. 17-20) shows that a t each of the ages 5, 10, 15 and 20 yr the cumulative percentage of males less than that age in 1958 was larger than the cumulative percentage of males less than that age in 1948. This surge at the base of the population pyramid, or decline in average age of the population, suggests a growing rate of natural increase. The most plausible explanation is that mortality has been declining. For- tunately, the demographic parameters estimated from stable populations can be corrected for this decline.
The same suggestion follows from the available total census figures for Zanzibar (Table 2). The estimated annual intrinsic rates of natural increase for the last
three intercensal periods show an increasing trend (from 0.007 to 0.012 to 0.019).
The fractions of the reported population which are temporary migrants is unknown in each instance, although migration has probably declined recently, according to the data of Selwyn and Watson (1301, p. 19): "There is, however, no evidence to suggest that im- migration has been an important element in popula- tion growth in recent years". The extent to which migration in earlier years has left an enduring effect on the shape of the age distribution is unknown.
The extent to which the apparently accelerating growth in Table 2 is a consequence of improving census coverage is also unknown. The United Nations (1281, p. 10) evaluated the most recent census as "pnre- liable", meaning that it had less than 90 per cent cover- age.
These caveats about the appropriateness of the model and the uncertainty of the basic data should emphasize that the following estimates are not a sub- stitute for a reliable demographic and economic statis- tical system. Final figures based on the following approximations must be regarded as order-of-magni- tude estimates.
To estimate intercensal rates of increase, the aggre- gate census figures compiled in Table 2 could be used. But a more detailed analysis of the rates of increase between 1948 and 1958 based on 1271. p. 260 and 1311, p. 61 shows that the two main islands of the then pro- tectorate differed substantially, and that the ethnic groups within islands varied substantially. Although Forsyth 1131 gives no information on the ethnic com- position of the rural villages he studied, they were most probably Afro-Arab, since all but 352 of the male Asians on Zanzibar Island in 1958 lived in Zanzibar Town (Zanzibar Protectorate 1321, p. 84). Hence the intrinsic rate of natural increase for the population Forsyth studied is probably somewhere between 9.97 per 1000 (that for Zanzibar Island) and 9.42 per 1000 (that for Afro-Arabs only on Zanzibar Island). In the following, the figure 9.9 per 1000 was used; the esti- mate 9.42 was tried, as will be shown. and found to make little difference.
'Stable age distributions were fitted using life tables of the Model West family, which Brass et al. 1251
Table 3. Cumulative male age distributions for Zanzibar Protectorate and rural Zanzibar Island and five fitted stable age distributions: per cent of population less than given age
1958 Zanzibar Protectorate 1958 Rural Zanzibar Island Fit 1: r = 0,099; 514 /5+ = 0.248; N Fit 2: r = 0.099; 42.05% < age 20; N Fit 3: r = 0.099; 27.31% < age 10; N Fit 4: r = 0.099; 27.31°/, < age 10; W Fit 5: r = 0.0942; 27.31% < age 10; N
Explanation of symbols: r, intrinsic rate of natural increase; 5-1415 +, ratio of the population aged 5 1 4 to the population aged 5 or more; N, Model North life table [34]; W, Model West life table.

Benefits of eliminating mortality attributed to schistosomiasis
Table 4. Observed numbers of males in age categories, according to Forsyth [13], in rural Zan- zibar Island, and expected numbers according to five fitted stable age distributions
Forsyth [I 31 104 47 57 40 109 181 Fit 1 84.6 59.1 43.7 50.7 96.3 203.6 17.46 Fit 2 78.3 56.5 42.2 49.2 94.7 217.0 25.12 Fit 3 95.8 63.1 46.0 52.8 97.9 182.3 11.78 Fit 4 94.8 64.5 47.9 55.2 101.6 173.9 12.35 Fit 5 96.0 62.9 46.0 52.8 98.0 182.4 11.72
* With 5' freedom, the 9 5 9 8 and 99 percentiles of x2 are 11.070, 13,388. 15,086. In this appli- cation. these nominal percentiles exceed the actual (Chase 1331).
found to be most widely applicable, and of the Model North family, which they recommended as best suited to African schedules of mortality. The ultimate choice of a Model North life table for this study rested on its better fit to Forsyth's study population.
The 5 stable populations fitted to the 1958 censused male age distribution are summarized in Table 3. Using Sprague multipliers, the numbers of individuals in the orderly 5-yr categories of the Zanzibar census were redistributed into the categories Forsyth used for reporting, as shown in Table 4. As a measure of good- ness of fit, Pearson's zZ was calculated. I have assigned 5 degrees of freedom, since the two fitted parameters r and the age-ratio are based on the Zanzibar census, not Forsyth's population. Because the parameters of the stable population are not known with certainty but are estimated (in this case by a method that is less than fully efficient, in the statistical seqse), the probability that the null hypothesis will be rejected when it is true is greater than the desired level of significance [33]. Fortunately, the z2 test is being used here to find a stable population for which the null hypothesis above is rlot $ejected. Hence when an acceptable fit is found, one may be sure that it is acceptable at a level which exceeds that obtained by assuming that the parameters are known without error.
Table 4 shows that the third, fourth and fifth fitted populations provide agreement with Forsyth's obser- vations that is acceptable at the 2 per cent level at least. The following calculations are based on the model stable population obtained from Fit 3 because the in- trinsic rate r for that model was closer to the intrinsic rate r = 0.0997 for the entire Zanzibar Island than r of Fit 5, and because x 2 of Fit 3 was smaller than z2 of Fit 4. The life table underlying the model population was obtained by interpolating between the Model North male life tables of levels 5 and 6 ([34], pp. 224- 225) for both the survivorship function [l(s)] and number of years lived [L(x)]. Expectations of life at ages 5 and above were then calculated from the result- ing l(x) and L(x) rather than interpolated from [34]. The results appear in Table 5.
The stable age distribution in Fit 3 (Table 5) was based on the census figures for the entire Zanzibar Protectorate, whereas Forsyth's study population was
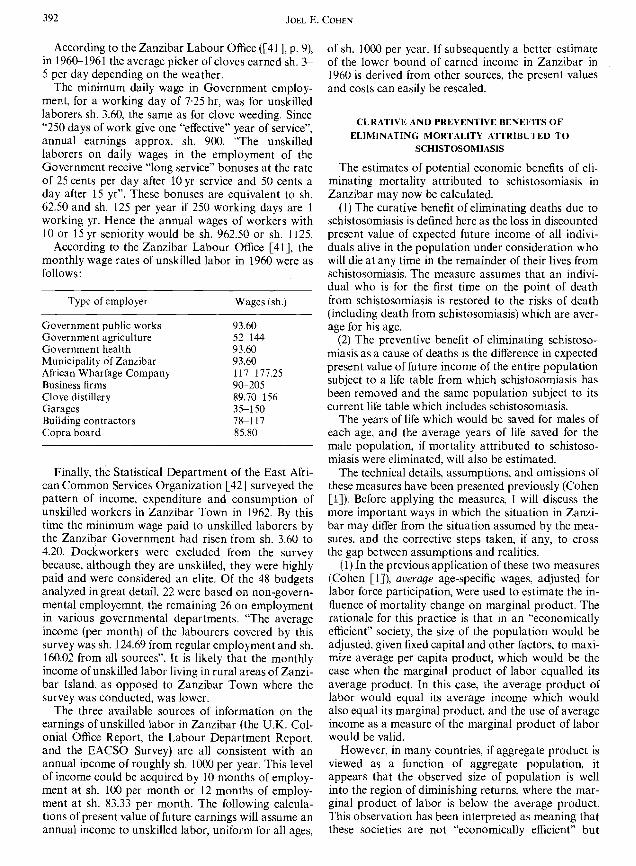
in the rural area of Zanzibar Island. A cumulative per cent age distribution for rural Zanzibar Island (Table 6) differs very little from that of the total Zanzibar Pro- tectorate. Hence the aggregate age distribution for Zanzibar Protectorate is appropriate for studying For- syth's population in rural Zanzibar Island.
Coale and Demeny [35] recommend and illustrate a slightly different procedure for fitting a stable popu- lation to a censused age distribution and an intercensal rate of increase. Nevertheless. examination of Table 3 shows that the sets of stable populations generated by the two different procedures are almost identical. Thus the same stable populations as recommended by Coale and Demeny [35] were considered but additional in- formation from Forsyth was used to select among them.
The principal weakness of this analysis is the likeli- hood that the population of Zanzibar has had declin- ing, rather than constant, mortality over recent decades. If fertility has been steady, then the popula- tion is quasi-stable, and would be expected to show a rising rate of natural increase. Coale and Demeny [35] show how to correct estimates of the intrinsic birth and death rates b and d obtained from the fit of a stable population when the population is actually quasi- stable. The correction requires an estimate of the in- trinsic rate of natural increase r when the population was stable and an estimate of the number of years prior to the present when the decline in mortality began.
T o exaggerate the possible correction which might be required, I took the final value of r as 001243, the 1948-1958 intercensal rate of increase, rather than the value (0.0099) actually used in fitting the stable popula- tions. I then carried out the correction under three possible assumptions, namely, that the Zanzibar popu- lation had been stable before, and quasi-stable after, 1924, 1931, or 1948. The largest correction to the in- trinsic birth and death rates given in Table 5 was required by the assumption that the decline of morta- lity began in 1924. The resulting corrected estimate of h was 43.95 per 1000 (instead of 44.4), and of d was 34.05 per 1000 (instead of 34.5). Assuming that this cor- rection is itself accurate and appropriate permits one to conclude with some confidence that, in spite of the recent decline in mortality, the birth rate of Zanzibar
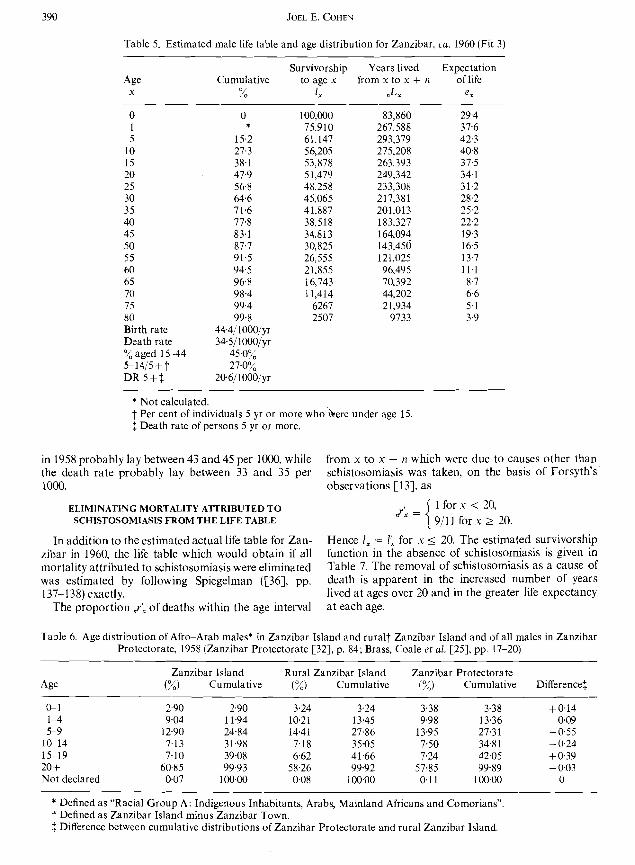
Table 5. Estimated male life table and age distribution for Zanzibar, ca. 1960 (Fit 3)
Age Cumulative x %
0 1 5
10 15 20 25 30 3 5 40 45 50 5 5 60 65 70 75 80 Birth rate Death rate
aged 15-44 5-1415 + f DR 5+:
Survivorship Years lived to age x from x to x + 11
1, .Lx
100,000 83,860 75,910 267,588 61.147 293,379 56,205 275,208 53,878 263.393 51,479 249,342 48,258 233,308 45.065 217,381 41,887 201,013 38,518 183,327 34.813 164,094 30,825 143,450 26,555 121,025 21.855 96,495 16,743 70,392 11,414 44,202
6267 21,934 2507 9733
Expectation of life
ex
* Not calculated. f Per cent of individuals 5 yr or more who 'here under age 15, f Death rate of persons 5 yr or more.
in 1958 probably lay between 43 and 45 per 1000. while from x to x + n which were due to causes other than the death rate probably lay between 33 and 35 per schistosomiasis was taken, on the basis of Forsyth's 1000. observations [13]. as
ELIMINATING MORTALITY ATTRIBUTED TO SCHISTOSOMIASIS FROM THE LIFE TABLE
,,r: = 1 for .u < 20, 911 1 for x 2 20.
In addition to the estimated actual life table for Zan- Hence I , = I: for x 5 20. The estimated survivorship zibar in 1960, the life table which would obtain if all function in the absence of schistosomiasis is given in mortality attributed to schistosomiasis were eliminated Table 7. The removal of schistosomiasis as a cause of was estimated by following Spiegelman ([%I, pp. death is apparent in the increased number of years 137-138) exactly. lived at ages over 20 and in the greater life expectancy
The proportion ,,rk of deaths within the age interval at each age.
Table 6. Age distribution of Afro-Arab males* in Zanzibar Island and rural? Zanzibar Island and of all males in Zanzibar Protectorate, 1958 (Zanzibar Protectorate [32], p. 84; Brass, Coale et al. [25], pp. 17-20)
Zanzibar Island Rural Zanzibar Island Zanzibar Protectorate (%) Cumulative (%) Cumulative (%) Cumulative Difference1
GI 2.90 2.90 3.24 3.24 3.38 3.38 +@I4 1-4 9.04 1 1.94 10.2 1 13.45 9.98 13.36 - 0.09 5-9 12.90 24.84 14.41 27.86 13.95 27.31 -0.55
1G14 7.13 31.98 7.18 35.05 7.50 34.81 - 0.24 15-19 7.10 39.08 6.62 41.66 7.24 42.05 + 0.39 20 + 60.85 99.93 58.26 99.92 57.85 99.89 - 0.03 Not declared 0.07 100.00 0.08 100~00 0.11 100.00 0
* Defined as "Racial Group A: Indigenous Inhabitants, Arabs, Mainland Africans and Comorians". f Defined as Zanzibar Island minus Zanzibar Town. f Difference between cumulative distributions of Zanzibar Protectorate and rural Zanzibar Island.

Benefits of eliminating mortality attributed to schistosomiasis
Table 7. Estimated male life table for Zanzibar, ca. 1960, after eliminating schistosomiasis as a cause of death
Survivorship Years lived Expectation Age to age x from x to x + n of life
Y I: .L; e:
EMPLOYMENT AND WAGES 1N ZANZlBAR
Economic statistics for Zanzibar are even scarcer than demographic statistics. Qualitative descriptions of the conditions of labor may be found in Interna- tional Labour Office ([37], pp. 79, 245 passim). Scat- tered sources published while Zanzibar was still a pro- tectorate offer the following picture of rates of employ- ment and earnings.
On Zanzibar Island and Pemba, in 1948, excluding persons in transit, the fraction of the entire population which was economically active (according to the "la- bor supply" definition) was 59.2 per cent overall; 74.7 per cent of the males were economically active and 42.2 per cent of the females were economically active (United Nations [38], p. 366).
The population which is economically active according to the "labor supply" definition "represents the number of people actually at work (or seeking work) during some particular short period" (Barclay [39], p. 264).
Now according to the 1948 census of Zanzibar, 31.96 per cent of the male population was under 15 yr. Hence the least some males under 15 yr in 1948 must have been economically active.
In the 1958 census 34.81 per cent of the male popula- tion was under 15 yr (Brass et ul. [25], pp. 17-20, their Table 2.3). In the estimated male stable population of
Fit 3, 38.1 per cent of the males are less than 15 yr. If the economically active fraction of the male popula- tion did not decline from 74.7 per cent to much below 65 per cent by the early 1960's, then every male must have entered and remained in the labor force by the age of 15 yr. I assume that 100 per cent of males 15- 64 yr were economically active and received at least the annual income estimated below. Even if this assump- tion has some foundation for Zanzibar ca. 1960. it can- not be generalized in time or in space without re-exa- mination.
The minimal annual earnings of an unskilled laborer will now be estimated in several ways. In each of the categories of employment from which the following wage rates are drawn, the wages of unskilled labor were lowest. Hence the figures given may be taken as a rough lower bound on annual earnings of employed men. The monetary system of East Africa at the time these figures were published (ca. 1960) was: 100 cents = 1 shilling; 20 shillings = £1. All figures will be expressed in shillings (sh.) and cents.
According to the United Kingdom Colonial Office (1401, pp. 6 7 ) . the approx. daily wages for agricultural labor were sh. 3.60 for weeding of an area planted with 16 clove trees, or for ring weeding of 45 trees, each task representing about 4 hr work. For coconut picking daily wages were (in shillings/cents):
Government Private undertakings
For climbing 100 palms 12 For gathering I000 coconuts 12 For husking 1000 coconuts 5 For breaking 1000 coconuts 6
According to the Zanzibar Labour Office ([41], p. 9), in 1960-1961 the average picker of cloves earned sh. > 5 per day depending on the weather.
The minimum daily wage in Government employ- ment, for a working day of 7.25 hr, was for unskilled laborers sh. 3.60, the same as for clove weeding. Since "250 days of work give one "effective" year of service", annual earnings approx. sh. 900. "The unskilled laborers on daily wages in the employment of the Government receive "long service" bonuses at the rate of 25 cents per day after 10 yr service and 50 cents a day after 15 yr". These bonuses are equivalent to sh. 62.50 and sh. 125 per year if 250 working days are 1 working yr. Hence the annual wages of workers with 10 or 15 yr seniority would be sh. 962.50 or sh. 1125.
According to the Zanzibar Labour Office [41], the monthly wage rates of unskilled labor in 1960 were as follows:
Type of employer Wages (sh.)
Government public works Government agriculture Government health Municipality of Zanzibar African Wharfage Company Business firms Clove distillery Garages Building contractors Copra board
Finally, thk Statistical Department of the East Afri- can Common Services Organization [42] surveyed the pattern of income, expenditure and consumption of unskilled workers in Zanzibar Town in 1962. By this time the minimum wage paid to unskilled laborers by the Zanzibar Government had risen from sh. 3.60 to 4.20. Dockworkers were excluded from the survey because, although they are unskilled, they were highly paid and were considered an elite. Of the 48 budgets analyzed ingreat detail, 22 were based on non-govern- mental employemnt, the remaining 26 on employment in various governmental departments. "The average income (per month) of the labourers covered by this survey was sh. 124.69 from regular employment and sh. 160.02 from all sources". It is likely that the monthly income of unskilled labor living in rural areas of Zanzi- bar Island. as opposed to Zanzibar Town where the survey was conducted, was lower.
The three available sources of information on the earnings of unskilled labor in Zanzibar (the U.K. Col- onial Office Report, the Labour Department Report, and the EACSO Survey) are all consistent with an annual income of roughly sh. 1000 per year. This level of income could be acquired by 10 months of employ- ment at sh. 100 per month or 12 months of employ- ment at sh. 83.33 per month. The following calcula- tions of present value of future earnings will assume an annual income to unskilled labor, uniform for all ages,
of sh. 1000 per year. If subsequently a better estimate of the lower bound of earned income in Zanzibar in 1960 is derived from other sources, the present values and costs can easily be rescaled.
CURATIVE AND PREVENTIVE BENEFITS OF ELIMINATING MORTALITY ATTRIBUTED TO
SCHISTOSOMIASIS
The estimates of potential economic benefits of eli- minating mortality attributed to schistosomiasis in Zanzibar may now be calculated.
(1) The curative benefit of eliminating deaths due to schistosomiasis is defined here as the loss in discounted present value of expected future income of all indivi- duals alive in the population under consideration who will die at any time in the remainder of their lives from schistosomiasis. The measure assumes that an indivi- dual who is for the first time on the point of death from schistosomiasis is restored to the risks of death (including death from schistosomiasis) which are aver- age for his age.
(2) The preventive benefit of eliminating schistoso- miasis as a cause of deaths is the difference in expected present value of future income of the entire population subject to a life table from which schistosomiasis has been removed and the same population subject to its current life table which includes schistosomiasis.
The years of life which would be saved for males of each age, and the average years of life saved for the male population, if mortality attributed to schistoso- miasis were eliminated, will also be estimated.
The technical details, assumptions, and omissions of these measures have been presented previously (Cohen [I]). Before applying the measures, I will discuss the more important ways in which the situation in Zanzi- bar may differ from the situation assumed by the mea- sures, and the corrective steps taken, if any, to cross the gap between assumptions and realities.
(1) In the previous application of these two measures (Cohen [I]), average age-specific wages, adjusted for labor force participation, were used to estimate the in- fluence of mortality change on marginal product. The rationale for this practice is that in an "economically efficient" society, the size of the population would be adjusted, given fixed capital and other factors, to maxi- mize average per capita product, which would be the case when the marginal product of labor equalled its average product. In this case, the average product of labor would equal its average income which would also equal its marginal product. and the use of average income as a measure of the marginal product of labor would be valid.
However, in many countries, if aggregate product is viewed as a function of aggregate population, it appears that the observed size of population is well into the region of diminishing returns, where the mar- ginal product of labor is below the average product. This observation has been interpreted as meaning that these societies are not "economically efficient" but

Benefits of eliminating mortality attributed to schistosomiasis 393
have a preference for people per se which makes them willing to forsake economic optimality. The marginal product of labor is below the average product particu- larly often in economically under-developed countries.
In view of this difficulty, I have chosen, as shown above, not an average wage, but an approx. minimal wage for unskilled labor. This wage, too, may be more of a social convention than an economic estimate of the marginal product of labor. Until a better measure of this marginal product is found, this estimated mini- mal wage will have to suffice.
My use of the minimal wage in estimating economic benefits lies between two extremes both of which are defended by economists: "Some economists would assert that the marginal product of labor is zero in many underdeveloped countries and that there are, therefore, no economic benefits (of improved health). The current calculations (of Feldstein) go to the oppo- site extreme and assume that the marginal product of males aged 15 to 64 equals the average labor income of persons in the labor force" (Feldstein [7], p. 148).
In recognition of the importance attached to life per se, beyond its economic productivity, I have calculated the years of life saved under both the curative and pre- ventive assumptions about the elimination of schisto- somiasis as a cause of death.
(2) The measures assume that the marginal product of labor now, with mortality due to schistosomiasis, approximates or is equal to the marginal product of labor after the elimination of mortality due to schisto- somiasis. Weisbrod et al. [2] pointed out that if eli- mination of a widespread disease caused a large short- term increase in the supply of labor, then the ratios of capital to labor and of land to labor would decline in the short term, and hence the marginal product of labor would also drop.
On the assumption (supported by the evidence reviewed above) that males 15 yr and over are already in the labor force, elimination of mortality due to schistosomiasis could affect recruitment into the labor force only as it affects male fertility. If increased sur- vival of males presently alive resulted in increased births of males; the effects would not be felt for another 15 yr (when today's newborn reached working age). In the range of discount rates considered here, these effects can reasonably be neglected.
Elimination of mortality due to schistosomiasis would decrease the rate of departure (through death) from the labor force immediately at all ages from 20 yr up. Hence the mean duration of stay and size of the labor force would increase, starting immediately. The size of this increase is minimized by the coincidence that, with increasing age. the proportion of the male population in each age group declines while the force of mortality increases. The elimination of mortality due to schistosomiasis would affect more the smaller age groups. Though the resulting increase in the size of the labor force might lower the average product of labor to some unknown extent, one may still hope to set a floor under the average product of labor after the
change in mortality by using the present minimal wage.
(3) The measures assume that elimination of schisto- somiasis mortality will not affect the net rate of dis- counting of future income, which is the difference (using instantaneous rates) between the social rate of time preference and the rate of growth of income. If the elimination of schistosomiasis mortality substantially changes the fertility of the population or its intrinsic rate of natural increase even with constant fertility, the net rate of discounting may well also change. The only excuse for omitting the analysis of this possible conse- quence is that it requires the construction of a model based on even more imponderables than the present tentative explorations.
(4) The measures are ex ante, in that they consider the welfare of the individuals currently alive in the population and neglect the welfare of individuals not yet born. They are thus appropriate to a population changing by death only. By contrast, the measures of Coale and Hoover [43] depend on a complete demographic projection, coupled with macroeconomic models fitted to the populations being studied. The data necessary to provide a foundation for models of the sort studied by Coale and Hoover [43] simply do not exist for Zanzibar. Hence there is no way to know, for example, what the reduction in mortality due to the elimination of schistosomiasis would do to the depen- dency burden 15 or 30 yr after 1960.
(5) As applied here, the measures assume that the average risk, for the population, of death from schisto- somiasis applies equally to individuals earning the minimal wage as well as to individuals earning higher wages. When income and occupation are correlated with exposure to infection with schistosomiasis, this assumption may be false. For example. fishermen on the West Nile, Uganda, who immersed themselves in water as part of their fishing (Ongom and Bradley [23] and irrigators on a sugar cane estate in East Africa (Foster [lo]) probably received more exposure than the population average and suffered higher mortality. Lower income (rural) people in Zanzibar may be more exposed to schistosomiasis than higher income (urban) people, but no information on this point is available from Forsyth [13].
If this correlation is actually the case, the above measures, using minimal wages, will still underestimate the economic losses, because the average risks which they assume apply to the marginally productive worker are less than the actual. Only if those who earn the minimal wage also suffer less exposure to schisto- somiasis (which seems unlikely) will the measures, as applied, exaggerate the actual economic loss.
(6) The measures assume that the estimates of mor- tality due to schistosomiasis are estimates of the popu- lation average. No information is available to demon- strate that the community Forsyth [I31 studied was typical of Zanzibar with respect to mortality from schistosomiasis. If Forsyth's community was unusually heavily infected, then the extrapolation of the local

mortality rates to the entire male population of Zanzi- bar may or may not overstate the economic loss due to schistosomiasis mortality, depending on the joint distribution of income and the risk of death from the disease. Not enough information is available to evalu- ate this possibility, but it is important enough to require further epidemiological investigation before the conclusions drawn from these measures can be treated with any confidence.
(7) The measures assume that elimination of deaths from the specific cause does not radically restructure the risks of death from all other causes. If schistoso- miasis were eliminated by the establishment of pro- perly purified drinking water supplies, separate sewage systems, and facilities for washing and bathing throughout Zanzibar, then not only schistosomiasis but a whole syndrome of diseases associated with poverty would disappear. It would be nonsensical to attribute the resulting economic benefits to the cure of schistosomiasis. The measures assume a change in the life table which is linked in a reasonably specific way to schistosomiasis.
I now proceed to apply the measures to the available data from Zanzibar. All the numerical values needed for computation have been previously described except for the values of SIZE, the estimated 1960 total popu- lation of Zanzibar to which these calculations apply, and of MALE, the fraction of the population which was male then.
The value of 300,000 was chosen for SIZE as a rough midpoint of four values calculated as follows. The total censused population of Zanzibar in 1958 was 299,111. If this population grew at the 1958-1967 intercensal rate of increase for 2 yr, until 1960, then it would have numbered 299,ll 1e2(0'019) = 310,696. If this same population had grown at the 1948-1958 intercensal rate of increase, then it would have numbered 299,ll le2'P'0'24' = 306,622 in 1960. The Afro-Arabs in Zanzibar numbered 279,935 in 1958 ([27]> p. 260) and corresponding to the two intercensal rates of increase they would have numbered 290,777 or 286,964 in 1960. As a rough estimate of the size of population to which the following calculations are relevant, 300,000 was chosen.
To estimate MALE, the number of males per 100 females in 1960 was estimated by interpolating linearly between the 111.2 males per 100 females observed in 1958 and the 102.3 males per 100 females observed in 1967 (United Republic of Tanzania [29]:). The esti- mated number of 109.2 males per 100 females in 1960 corresponds to a male fraction of 0.52199.
The notations, methods of calculation, and values of parameters may now be summarized:
n: Duration of the age interval starting at age x; dimension: years; values: n = 1 when x = 0: n = 4 when z = 1, n = 5 when x = 5, 10, . . . .
n': Duration of the age interval starting at age y; dimension: years ; values: same as n.
100,000 surviving to exact age x, under current condi- tions; dimension: people; values: Table 5.
,,L,: Years lived by life-table cohort between ages x and x + n under current conditions; dimension: people-years; values: Table 5.
/": Same as I , in the absence of mortality attributed to schistosomiasis; dimension: people; values: Table 7.
,,L'': Same as ,,Lx in the absence of mortality attri- buted to schistosomiasis; dimension: people-years; values: Table 7.
r: Intrinsic rate of natural increase of the stable population model for Zanzibar; dimension: fraction/ year ; value : 0.0099.
SIZE: Estimated total population of Zanzibar in 1960; dimension: people; value: 300,000.
MALE: Fraction of the entire population of Zanzi- bar which is male; dimension: fraction; value: 0.52199.
,,Kx: Number of males aged x to x + n in the current population ; dimension : people ; value : Table 5.
For the stable population, , L , ~ - r (X + n!Z)
,,Kx = SIZE .MALE. & L ~ ~ - ~ ( X + n!2)
D: Rate of discounting future income to the present; dimension: fractionlyear; values: 0.10, 0.15, 0.20, 0.25.
u,: Five-year income of unskilled labor in Zanzibar circa 1960, average for men aged x to x + 4; dimen- sion: Shillings; values: 0 for x = 0. 5, 10, 65, 70, 75, 80; 5000 for x = 15, 20, . . . 60.
P,: Per capita preventive benefit of eliminating mor- tality attributed to schistosomiasis. for males aged s; dimension: Shillings: values: Table 8.
80 px = 1 (1 + ~)-[v-x+(n -n)/21 tiy. ",Ly. n . PX,,I(,Lx. n')
y = x
where P,,, = .,L;. .LJ(,L:. ,,Ly) - 1
P : Aggregate preventive benefit of eliminating mortality attributed to schistosomiasis; dimension: Shillings; values: Table 8.
80
C,: Per capita curative benefit of eliminating mortality attributed to schistosomiasis, for males aged x ; dimension: Shillings; values: Table 8.
where C,,, = log (1 + P,,,)
C: Aggregate curative benefit of eliminating mortality attributed to schistosomiasis; dimension: Shillings; values: Table 8.
x = o
Table 8 gives the age-specific, aggregate, and per capita curative and preventive benefits, and the ratios of ~reventive to curative benefits. for discount rates
I,: Number of individuals in a birth cohort of 1, = 1 +' D of 1.10, 1.15, 1.20 and 1.25.

Benefits of eliminating mortality attributed to schistosomiasis 395
Table 8. Potential age-specific, aggregate, and per capita curative and preventive benefits (in shillings) to the estimated male population of Zanzibar ra. 1960 from eliminating mortality attributed to schistosomiasis, for various discount rates
- - - - - - - - - - - - -
Discount factor 1.1 Discount factor 1.2 Curative Preventive Curative Preventive
Age benefit (sh.) benefit (sh.) Prev./Cur. benefit (sh.) benefit (sh.) Prev./Cur.
0 1 5
10 15 20 25 30 3 5 40 45 50 55 Total Per capita
Discount factor 1.15 Discount factor 1.25 Curative Preventive Curative ,Preventive
Age benefit (sh.) benefit (sh.) Prev.,/Cur. benefit (sh.) henefit (sh.) Prev./Cur
0 1 5
10 15 20 25 30 3 5 40 45 50 55 Total Per capita
The estimated aggregate benefit of eliminating future mortality attributed to schistosomiasis for the males alive in Zanzibar in 1960 ranges from sh. 4 million (at a 25 per cent discount rate) to sh. 21 million (at a 10 per cent discount rate). (The curative and preventive benefits differ by less than sh. 1 -million at each dis- count rate, so I state only one figure for each rate.) The per capita curative benefit (per male) ranged from sh. 27-132. The per capita preventive benefits were 2-3 per cent higher.
For comparison, in 1960 the Zanzibar Health Department spent sh. 6,100,356, or 12.1 per cent of total government expenditures for that year (Zanzibar Accountant General [44]). For some reason, this amount was less than the 1960allocation to the Health Department of sh. 6,432,400, of which 58 per cent was for "personal emoluments", or salaries (Zanzibar Health Department [45]). For a population of roughly
300,000, the annual expenditures on health of the cen- tral government were thus slightly over sh. 20 or £ 1 per person per year. Hence under the range of assumptions considered here. the ~otent ial benefit to males of eli- , L
minating mortality attributed to schistosomiasis was of the same magnitude in 1960 as the annual per capita expenditures on health by the Government of Zanzi- bar.
These calculations ignore any economic costs of mortality to females from schistosomiasis and the other economic aspects of schistosomiasis, the costs of morbidity and of direct treatment.
If the estimated age-specific incomes u, are replaced by t ~ , the number of years lived in the age interval from x to x + n, then the curative and preventive benefits measure years of life saved (Table 9). The expectation of life at birth is increased by 1.7 (curative benefit) or 1.8 (preventive benefit) years. This benefit increases up

Table 9. Potential age-specific, aggregate. and per capita curative and preventive expected years of life saved for the estimated male population of Zanzibar ca. 1960, as a result
of eliminating mortality attributed to schistosomiasis
(Years of life saved) Age Curative Preventive Prev./Cur.
0 1.7 1.8 1.0969 I 2.1 2.3 1.0969 5 2.4 2.6 1,0969
10 2.5 2.8 1,0969 15 2.7 2.9 1,0969 20 2.6 2.9 1.0979 25 2.4 2.6 1.0995 30 2.2 7.4 1.1012 35 2.0 2.2 1.1030 40 1.8 2.0 1.1049 45 1.6 1.8 1.1067 50 1.4 1.6 1.1084 55 1.2 1.3 1,1095 60 I .O 1.1 1.1091 65 0.8 0.9 1.1052 70 0.6 0.6 I .0927 75 0.3 0.3 1,0604 Total 332,092 365,056 1.0993 Per capita 2.1 2.3 1.0993
to the age at which mortality from schistosomiasis actually begins, as the male's chance improves of sur- viving to the ages during which he benefits from the eli- mination of mortality due to schistosomiasis. After the age of 20 yr, the age-specific saving of years of life de- clines steadily as fewer years of life remain to enjoy the benefit. The average benefit, weighted by the estimated 1960 age distribution of the male population. is 2.1 (curative) or 2.3 (preventive) years.
WHAT GENERALIZATIONS OFTHESE RESULTS ARE POSSIBLE?
The preceding calculations suggest that in Zanzibar in 1960 the foregone present value of expected future income per capita of those men who would die at some time in their lives from schistosomiasis was of the same order of magnitude as the annual per capita expendi- tures on health of the Government of Zanzibar in 1960.
This conclusion cannot be immediately generalized to Zanzibar more than a decade later, nor to other countries, including those of West Africa, in which schistosomiasis is prevalent. What can be applied to other times and places are the methods of analysis and the techniques of exploiting fragmentary data.
A clue that the demographic and perhaps employ- ment and health situations of Zanzibar are likely to have changed substantially over the past decade is pro- vided by the 50 per cent rise in the intercensal rate of increase from 1948-1958 to 1958-1967 (Table 2). In 1957, as part of its world campaign to eradicate malaria, the World Health Organization started a malaria program in Zanzibar. The number of cases of malaria treated in government facilities declined from
23,548 in 1958 to 12,609 in 1959 to 7823 in 1960 (Zanzi- bar Health Department [45], p. 25). The parasite rate among children aged one to five dropped from 56 to 14 per cent in the 3 yr up to 1960, while the parasite rate among children aged 6 to 10 dropped from 47 to 13 per cent in the same period.
The Zanzibar Labour Office ([41], pp. 8-9) reported that malaria was absent from the labor force in 1 9 6 s 1961 due to the World Health Organization program. In 1961, migratory labor from Tanganyika dropped sharply, and indigenous labor was prepared to do "weeding" around clove trees previously left to the mainlanders, according to the report. Clearly it was then too soon after the malaria eradication program for increased survivorship of children to have had any effect on the size of the labor force, but the report's observations suggest that the demand in Zanzibar for labor in excess of what the population of Zanzibar could supply might be disappearing.
In 1962, Selwyn and Watson [30] estimated that, as a result of malaria control, "Zanzibar may well be on the threshold of a population explosion" (Selwyn and Watson '301, p. 18). from which would follow pressure on the primary schools in S l O y r and inadequate opportunities for employment in 15-20 yr. They noted that the gross capital formation was then &7 per cent of gross domestic product (compared with 20 per cent in Kenya and 17 per cent in Tanganyika), leaving a net rate of capital formation of only 1 per cent per year ('301, p. 21). While production of the principal crop, cloves, had been static for the iast 20 yr (:[30], p. 30), the recurrent costs of health care had risen 5 per cent a year since 1957 ("301, p. 90).
Since Zanzibar and Tanganyika combined in 1964 to form the United Republic of Tanzania, statistical in- formation on Zanzibar has become more difficult to find. For example, United Republic of Tanzania ('511, p. 30) gives the gross and net budgets of the Ministry of Health. but not the separate amounts for the main- land and Zanzibar. Hunter's monograph [46] on employment and education in rural Tanzania makes no explicit mention of Zanzibar. Ray [47] makes no explicit reference to Zanzibar either in the description of sampling procedures or in the tabulations of results.
One news item relevant to the prevalence of schisto- somiasis is the report (Africa Research Bulletin ('481, p. 715b) of a plan to resettle one hundred thousand Zanzibaris from "infertile" to "fertile" areas, to impose a 3 per cent levy on the wages of all Zanzibaris and to require for rural develoment 1 day's labor per week of all ablebodied town dwellers. Such a redistribution of population may substantially increase the number of people in contact with rural small streams, which were noted in 1960 as "frequently a source of bilharzia" (Zanzibar Health Department [45], p. 32).
The quantitative results obtained in the previous section do not immediately generalize to other coun- tries suffering from schistosomiasis because these countries may have different species and strains of schistosomes present, these species may interact with

Benefits of eliminating mortality attributed to schistosomiasis 397
a different set of other diseases and nutritional pro- blems, and the patterns of prevalence of schistoso- miasis, health services and employment may all differ.
In particular, the results of this paper do not contra- dict those of Weisbrod et al. [2]. They pointed out that their data do not rule out the possibility of an effect of schistosomal infection on mortality. I have been at pains to emphasize that the data of Forsyth [13], though perhaps better than any other available, are far from a conclusive demonstration that schistosomal in- fection does measurably increase mortality rates. Not only may the effect of schistosomal infection on morta- lity differ between St. Lucia and Zanzibar, but that effect, and consequently its economic impact, remains in both places substantially uncertain. This paper attempts to suggest the importance of removing that uncertainty.
WHAT CONCLUSIONS FOLLOW FROM THE CALCULATIONS?
Before recommendations for action can be drawn from calculations of the type presented here, even assuming credible data, a very substantial amount of additional information and calculation is necessary (Feldstein 171). One false conclusion must be eli- minated from the start. Because the potential benefit of eliminating mortality attributed to schistosomiasis in Zanzibar approximated the annual government health budget in 1960, it does not follow that the entire annual health budget should have been allocated to the curing or prevention of schistosomiasis.
Before economically optimal decisions about the expenditure of the health budget can be made, the benefits of reducing mortality due to schistosomiasis, estimated here, need to be supplemented by the costs of treatment and morbidity due to schistosomiasis. The same economic costs need to be calculated for the other (at least major) diseases prevalent. It is not suffi- cient to examine the effectiveness of control programs for one disease at a time. Sewage treatment which might not be economically justifiable by the reduction in cholera it leads to may be well justified by how much it interrupts transmission of schistosomiasis.
The economic costs and benefits do not include the demographic, social, cultural, and emotional costs and benefits. These must be weighed by evaluations which may lie beyond the realm of medicine and public health.
The problems of allocating the health budget are compounded in allocating national resources among competing programs such as welfare, transportation, and education, all of which aim to promote the public good, economically and otherwise. Again the interac- tions between sectors must not be neglected by indulg- ing in a simple comparison of benefit-cost ratios from one sector to another. Health may contribute to the educability of children and improve the quality of the labor force. Hughes and Hunter [49] have reviewed extensively attempts at economic development which, ill informed of the ecology of local diseases, led to the
spread of trypanosomiasis, schistosomiasis, malaria, tuberculosis, and malnutrition.
Throughout all of these analyses, to whatever extent they are quantitative, runs the problem of deciding how much a good in the future is to be valued in terms of a good now. As in tuberculosis, the choice of a rate at which to discount the future can switch the optimal control program from one of case-finding and treat- ment to one of BCG vaccination (Waaler and Piot [50]). Although no equally explicit analysis is yet avail- able for schistosomiasis, a society's (or a planner's) pre- ference for immediate reductions in prevalence over long-term reductions in the future might well lead to programs for mollusciding and chemotherapy rather than to programs of environmental alteration or research on permanent immunizations.
What can be concluded from the rough calculations and estimates presented here is that, even in countries which do not spend much for the treatment of schisto- somiasis, if schistosomiasis causes measurable morta- lity among those who would otherwise be working productively, the disease may well deserve a place in the sun of economic analysis. This place should not be shaded by the indirect nature of the benefits of eli- minating schistosomiasis.
Aekt~owledgements-I thank R. E. Berry, D. J. Bradley, E. Chernin, A. J. Coale, J. J. Feldman, M. S. Feldstein, N. Key- fitz, J. S. Lehman, R. H. Morrow, D. P. Rice, H. A. Thomas, T. H. Weller and J. B. Wyon for helpful criticisms of pre- vious drafts. This work was supported in part by the Popu- lation Council of New York and the U.S. National Science Foundation.
REFERENCES
1. Cohen J. E. Economic evaluation of small changes in the life table. Paper presented at the August 1973 con- gress of the International Union for the Scientific Study of Population, Litge, Belgium, 1973..
2. Weisbrod B. A,, Andreano R. L.. Baldwin R. E., Epstein E. H. and Kelley A. C. Disease and economic develop- ment; the impact of parasitic diseases in St. Lucia. 254 pp. The University of Wisconsin, Wisconsin, 1973.
3. Rice D. P. Estimating the Cost of Illness. Washington, D. C., United States Department of Health, Education and Welfare (Public Health Service Publication 947-6). 1966.
4. Rice D. P. The direct and indirect cost of illness. In Federal Programs for the Development of Human Resources, Health Care and Improvement (Subcommit- tee on Economic Progress, Joint Economic Committee, Congress of the United States) Vol. 2, Part 4, pp. 469- 490. Government Printing Office, Washington, D.C., 1968.
5. Rice D. P. Measurement and application of illness costs, Puhl. Hltk Rep. 84,95-101, 1969.
6. Dowie J. A. Valuing the benefits of health improvement. A~ts t . Econ Papers, 9, 21-41, 1970.
7. Feldstein M. S. Health sector planning in developing countries. Economica 37, 139-163, 1970.
8. Farooq M. A possible approach to the evaluation of the economic burden imposed on a community by schisto- somiasis. Ann. Trop. Med. Parasitol. 57, 323-331, 1963.
9. Watson J. M. Schistosomiasis in the Tigris-Euphr-

ates Valley, with special reference to its economic conse- quences. Proc. Sixth Int. Corlg. Trop. Med. and Malario- log): Lisbon, 2, 203-210. 1959.
10. Foster R. Schistosomiasis on an irrigated estate in East Africa-111. Effects of asymptomatic infection on health and industrial efficiency. J . Trop. Med. Hyg. 70, 1 8 s 195, 1967.
11. ChengT.-H. Schistosomiasis in mainland China. Am. J. Trop. Med. Hyg. 20, 26-53, 1971.
12. Fenwick A,, Jorgensen T. A. and Temu E. A. A pro- gramme for the control of schistosomiasis mansoni on a 10,000 acre irrigated sugar estate in Tanzania combin- ing snail control, mass diagnosis and mass treatment in a population of almost 6000. Proc. Secor7d Int. Coi7grrss ofParasitology, Part 4, 48-51 (Abstracts 945, 946, 949), 1970.
13. Forsyth D. M. A longitudinal study of endemic urinary schistosomiasis in a small East African community. Bull. [.I.: H. 0 . 4 0 , 771-783. 1969.
14. Kan H.-C. and Kung J.-C. Incidence of Schistosomiasis japonica in an endemic area in Chekiang. Chinese Med. J . Supplement 1,449-456, 1936.
15. Scott J. A. Observations on mortality and morbidity from schistosomiasis in Egypt. J . Trop. Med. Hyg. 40, 125-132, 1937.
16. Gaud J. Les bilharzioses en Afrique occidentale et en Afrique centrale. Bull. Ii! H . 0.: 13, 209-258, 1955.
17. Gaud J. Les bilharzioses a Madagascar et aux iles Mas- careignes. Bull. kt: H. O., 13, 259-288, 1955.
18. Edington G. M. Schistosomiasis in Ghana with special reference to its pathology. West African Med. J . 6, 4 s 47, 1957.
19. Odei M. A. A review of the distribution and snail hosts of bilharziasis in West Africa. J. Trop. Med. Hyg., 64, 27-41. 6468, 88-97, 1961.
30. Edington G. M., von Lichtenberg F., Nwabuebo I., Tay- lor J. R. and Smith J. H. Pathologic effects of schistoso- miasis in Ibadan, Western State of Nigeria-I. Inci- dence and intensity of infection; distribution and sever- ity of lesions. Am. J . Trop. Med. Hyg. 19, 982-995. 1970.
21. Forsyth D. M., Bradley D. J. and McMahon J. Deaths attributed to kidney failure in communities with ende- mic urinary schistosomiasis. T h e Lancet 472-473, 1970.
22. Lehman J. S.. Farid Z. and Bassily S. Mortality in uri- nary schistosomiasis. T h e Lancet 822-823. 1970.
23. Ongom V. L. and Bradley D. J. The epidemiology and consequences of Schistosoma mansoni infection in West Nile, Uganda-I. Field studies of a community at Panyagoro. Trans. Roy. Soc. Trop. Med. Hyg. 66(6), 83S851. 1972.
24. Ongom V. L., Owor R.. Grundy R., and Bradley D. J. The epidemiology and consequences of Schistosoma mansoni infection in West Nile. Uganda-11. Hospital investigation of a sample from the Panyagoro com- munity. Trans. Roy. Soc. Trop. Med. Hyg. 66(6), 852- 863, 1972.
25. Brass W., Coale A. J., Demeny P., Heisel D. F., Lorimer F.. Romaniuk A. and van de Walle E. T h e Denzography o f Tropicrll Africa. Princeton University Press. Prince- ton, 1968.
26. Keyfitz N. and Flieger W. World Population: An Anuly- sis of Vital Data. University of Chicago Press, Chicago, 1968.
27. Blacker J. G. C. Population growth and differential fer- tility in Zanzibar protectorate. Pop. Stud. 15, 258-266, 1962.
28. United Nations. Population and Vital Statistics Report. Statistical Papers Series A, 22, 10, 1970.
29. United Republic of Tanzania. Preliminary Results of the Populatioil Census Taken on the Night o f 2 6 2 7 August 1967. Central Statistical Bureau, Dar-es-Salaam, 1967.
30. Selwyn P. and Watson T. Y. Report or1 the Economic De- velopment o f the Zanzibar Protectorate. Zanzibar, 1962.
31. Martin C. J. Estimates of population growth in East Africa. with special reference to Tanganyika and Zanzi- bar. In Essays on Africcln Population (edited by Barbour K. M. and Prothero R. M.). Praeger, New York, 1962.
32. Zanzibar Protectorate. Report on the Census of' the Population ofZanzibar Protectorate, March, 1958. Zan- zibar, 1960.
33. Chase G. R. On the )I' test when the parameters are esti- mated independently of the sample. J . Am. Statist. Ass. 67,609-611, 1972.
34. Coale A. J. and Demeny P. Regional Model Life Tables and Stable Populations. Princeton University Press, Prince ton, 1966.
35. Coale A. J. and Demeny P. Methods of estimating basic demographic measures from incomplete data. United Nations Manual IV on Methods of Estimating Popula- tion, STISOAISer.AI42. New York, United Nations, 1969.
36. Spiegelman M. Introd~tction to Demography. rev. ed., Harvard University Press, Cambridge, 1968.
37. International Labour Office. Africun Labour Survey. Geneva, (Studies and Reports, N.S. 48), 1958.
38. United Nations. Compendium of Social Statistics. New York. 1963.
39. Barclay G. W. Techniques of'Population Analysis, John Wiley, New York, 1958.
40. United Kingdom Colonial Office. Report on Zanzibar for the Years 1959 and 1960. Her Majesty's Stationery Office, London, 1962.
41. Zanzibar Labour Office. Labour Report ,for 196& 1961. Zanzibar, 1963.
42. East African Common Services Organization. The Pat- tern of Income Expenditure and Consumption in Zanzi- bar, Report on a Survey Carried Our in April 1962, n.p., East African Statistical Department, 1963.
43. Coale A. J. and Hoover E. M. Population Growth and Economic Developmerlt in Low Income Courltries, Prin- ceton University Press, Princeton, N.J.. 1958.
44. Zanzibar Accountant General. Report on the Accounts of the Zanzibar Protectorate. Zanzibar, 1961.
45. Zanzibar Health Department. Annual Report for 1960. Zanzibar, 196 1.
46. Hunter G. Manpower, Employme11t and Education in the Rural Economy o f Tanzania. Paris, UNESCO Interna- tional Institute for Educational Planning (African Research Monograph 9). 1966.
47. Ray R. S. Labour Force Survey of Tanzania. Dar-es- Salaam (mimeo), 1966.
48. Anonymous. Africa Research Bulletin, 715B, 1967. 49. Hughes C. C. and Hunter J. M. Disease and develop-
ment in Africa. Soc. Sci. & Mrd. 3, 44S493, 1970. 50. Waaler H. T. and Piot M. A. Use of an epidemiological
model for estimating the effectiveness of tuberculosis control measures. Bull. W H . 0 .43, 1-16, 1970.
51. United Republic of Tanzania. Estiniares of the Expendi- ture o f t h e United Republic of Tanzania and Zanzibar: Supply-Votes. Appendix for the Year from 1 July, 1964 to 30 June, 1965. As Submitted to National Assembly. n.p.. 1965.