some key methods for a more efficient cleaning validation
TRANSCRIPT

www.pharmaquality.com
Volume 11 Number 3JUNE 2009
PLUSMAKE PAPER A
THING OF THE PASTCONTROLLED
RELEASEQUALITY CONTROL
IMAGINGRAPID
MICROBIO ROI
PFQ june09:FQfmpgs1-16 1 8/25/09 7:56 PM Page 1

harmaceutical manufacturing equipmentmust be properly cleaned to ensure theremoval of product residue, cleaning chem-ical residue, and microbes prior to manu-facturing. Because cleaning methods aredeveloped and validated to prevent therisk of producing contaminated productsby confirming that the cleaning process is
sufficient, it’s important to establish method limits and selectthe proper cleaning techniques and detection methods.
Step One: Set LimitsOne of the first steps in the development of an effective cleaningvalidation method is the determination of the necessary, non-
regulated limits. Often, this can be the most daunting step forpharmaceutical manufacturing facilities throughout the clean-ing validation process simply because of how specific each limitmust be for every product produced. Pharmaceutical compa-nies have several details to consider when setting their limits.
The regulation agencies approach cleaning validation lim-its with the idea that because of the vast variety of materialsand equipment used to manufacture products throughout theindustry, it would be impractical to try to set general limits.1
Most of them give examples of where limits should be set basedon general criteria, however.
The Food and Drug Administration (FDA) Guide to Inspec-tions Validation of Cleaning Processes, for example, states, “Thefirm’s rationale for the residue limits established should be logi-
PFQ www.pharmaquality.com
PSome key methods for a more efficient cleaning validation process
Cover Story By Eric A. Lingenfelter, Henry L. Evans,Wesley B. Atkins, and Harolyn M. Clow, MS
Editor’s Note: This article is the first in a two-part series about cleaning validation methodology. Part two, which will focus onvalidation challenges and practices, will appear in our July/August issue.
PFQ june09:FQfmpgs1-16 1 8/25/09 7:56 PM Page 2

PFQ june09:FQfmpgs1-16 1 8/25/09 7:56 PM Page 3

PFQ www.pharmaquality.com
cal based on the manufacturer’s knowledge of the materials in-volved and be practical, achievable, and verifiable.” The FDAgives examples of analytical detection levels such as 10 parts permillion (ppm), biological activity levels such as 1/1000 (0.1%) ofthe normal therapeutic dose, and organoleptic levels such as novisible residue.2 One can easily apply these examples to deter-mine the amount of allowable carryover of product residues:
• No more than 10 ppm of any product should appear in an-other product;
• No more than 0.1% of the normal therapeutic dose of anyproduct will appear in the maximum daily dose of the follow-ing product; and
• No amount of product residue should bevisible on the surface of the equipmentafter the cleaning procedure has beenperformed.
Step Two: Inspect VisuallyThe FDA states, “When the cleaning processis used only between batches of the sameproduct (or different lots of the same inter-mediate in a bulk process), the firm needonly meet a criteria of ‘visibly clean’ for theequipment.” One way to enhance visual de-tection is to set up spiking studies, in whichcoupons of the same type of surface that isgoing through the cleaning procedure arespiked with known amounts of residue. Thecoupons are then observed by trained per-sonnel to determine at which level they ap-pear clean. The coupon with the highestlevel of residue that appears to be clean bythe personnel is considered the acceptancelimit for that particular residue.3
The problem with visual inspection isthat there are too many variables that caninfluence the results. The coupons must beobserved in the exact same viewing condi-tions as the equipment in the field. Not allequipment can be inspected under condi-tions similar to a coupon sitting on a labbench. The lighting, viewing angle, and eventhe distance of the observer from the surfaceshould all be the same. If any of these circum-stances is altered, the results may be skewed.
Issues may also arise when trying tosimulate end-point residues on surfaces after the cleaningprocess. The question most commonly asked when viewing aspiked surface is, “Is the viewer seeing the actual residuestain, or are they just seeing the edge of the stain?”1 Most vi-sual spiking studies include spiking a solution of dissolvedproduct onto the surface and allowing it to dry. Sometimes astream of nitrogen is used to speed up the drying process andto discourage product degradation. It is much easier to see theedge of a stain at low levels than it is to see the body of thestain itself. Under visual inspection, a stain of uniform thick-ness that covers the entire surface of a piece of equipment may
be falsely mistaken for a clean surface. In this situation, amore sensitive means of detection would greatly improverecognition of a dirty surface.
Even though visual cleanliness is widely accepted as ameans of evaluating product carryover, manufacturers shouldtake their detection abilities one step further and develop avalidated and quantitative method. This type of method is re-quired when there is a change in the type of product beingmanufactured. The forms of detection generally use sample-based cleaning procedures involving collection of either swabor rinse samples. A quantitative method provides greaterspecificity, accuracy, and sensitivity than the visual approach.
Step 3: Swabbing Versus RinsingThe selection of an appropriate extraction solution is an im-portant step in establishing a swab or rinse procedure. Yourdecision should be based on the solubility of the cleaning detergent residue or pharmaceutical product residue in the selected solution. Various alcohols, water, buffers, or combi-nations of the three are common extraction solutions used forcleaning procedures. Once an extraction solution is chosen,equipment surfaces may be extracted using a swabbing orrinse method.
Rinsing is suitable for small surface areas where traditional
H O W T O I M P R O V E C L E A N I N G P R O C E S S E S
The stainless steelcoupon below leftshows a 10 µgLiquinox stain (edge)while the coupon onthe right shows a200 µg Liquinoxstain (body).
ALL
PH
OTO
S C
OU
RTE
SY O
F LA
NC
AST
ER L
AB
OR
ATO
RIE
S IN
C.
PFQ june09:FQfmpgs1-16 1 8/25/09 7:56 PM Page 4

June 2009
swabbing procedures may be difficult. The specified areashould be rinsed long enough to ensure complete coverage ofthe entire surface and sufficient removal of the target residue.Rinsing methods provide a more simplistic sampling approachbecause they avoid possible swab interference in the detectionmethod or extraction issues in removing the residue from theswab surface.
Swabbing is ideal for hard-to-clean areas and can physi-cally remove insoluble residues. Swabs are selected for theirability to recover the monitored residue from a given surfaceand their ability to release the residue to an extraction solutionfor analysis. The selected swab should not contribute excessiveinterference or background during analysis. Another consider-ation in swab selection is whether the area being swabbed iseasily accessible or hard to reach. Swabs that are long withsmall heads are excellent for general purposes and hard-to-reach areas. Other swabs with larger heads are better suited forcleaning broad, flat areas.
Swabbing patterns can vary and are dependent on the surfaceor equipment being swabbed. Surface areas are defined andswabbed with the chosen solvent, which is usually the same asthe extraction solution. Prior to swabbing, swabs are soaked for afew minutes in a vial of the extraction solution. Excess solution isremoved from the swab head by gently pressing the head on theinside of the vial.
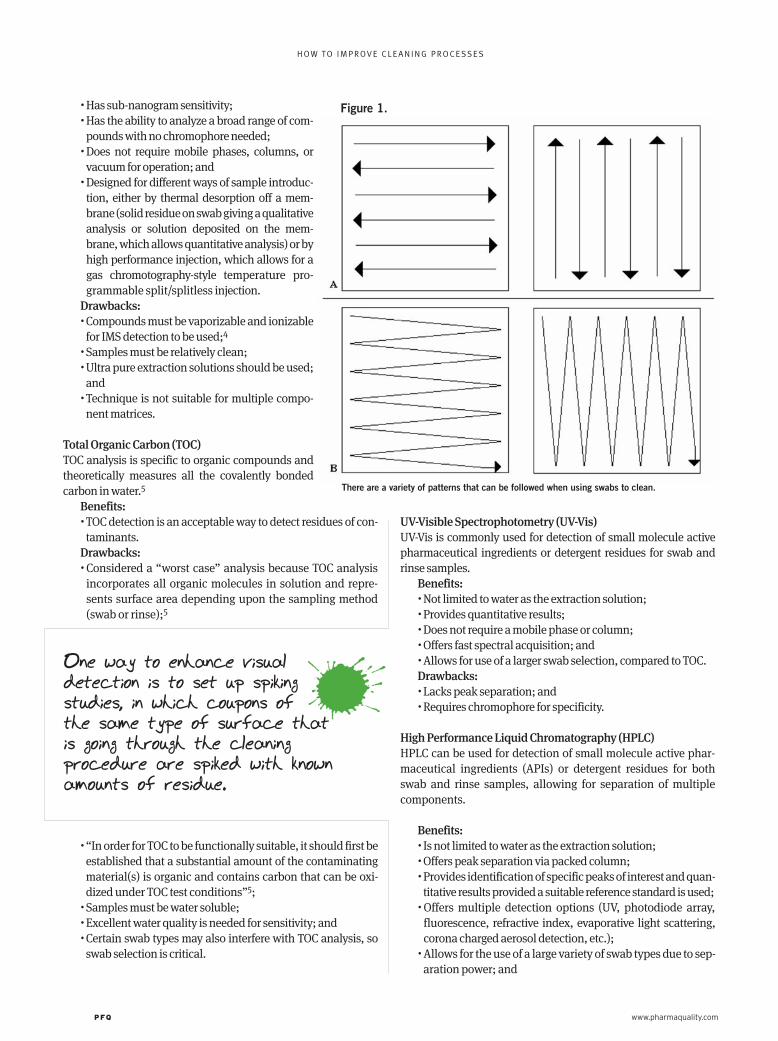
The prepared swabs are used to swab the appropriate area,which can be accomplished using various swabbing patterns.Common patterns use partially overlapping parallel strokes inone direction or back-and-forth strokes. Whichever you
choose, it is important that you flip the swab head to the otherside and repeat the same pattern at right angles to the first pat-tern (see Figure 1.A). Another variation involves overlappingzigzag strokes in opposite directions, making sure that theswab head never leaves the surface being evaluated. An easyway to look at this is first, horizontally, and second, vertically(see Figure 1.B).
The swab head is placed back into the vial after clipping thehandle above the head with a clean cutting tool. One swab maybe sufficient to remove residue, but a second or even a third swabcan be used to repeat the swabbing pattern, increasing residuerecovery.
Depending on the extraction solution, using a dry swab afterthe wet swab may be advantageous, helping to ensure that any re-maining solution on the coupon is collected. Other swabbing pat-terns can be adapted for special surfaces or pieces of equipment.
Step 4 : Choose Your Detection MethodsThere are multiple detection options available for cleaning vali-dation.
Ion Mobility Spectrometry (IMS)IMS characterizes chemical substances based on their gas-phaseion mobilities, provides detection and quantitation of trace ana-lytes, and offers atmospheric pressure chemical ionization (APCI),a soft ionization technique that produces molecular weight in-formation.
Benefits:•Offers ultra-fast quantitative analysis (~30 seconds per sample);
A variety of swabs canbe used in cleaning. Onekey in selecting a swabis to ensure that theswab does not contributeexcessive interference orbackground duringanalysis.
PFQ june09:FQfmpgs1-16 1 8/25/09 7:56 PM Page 5
PFQ www.pharmaquality.com
•Has sub-nanogram sensitivity;•Has the ability to analyze a broad range of com-
pounds with no chromophore needed;•Does not require mobile phases, columns, or
vacuum for operation; and•Designed for different ways of sample introduc-
tion, either by thermal desorption off a mem-brane (solid residue on swab giving a qualitativeanalysis or solution deposited on the mem-brane, which allows quantitative analysis) or byhigh performance injection, which allows for agas chromotography-style temperature pro-grammable split/splitless injection.
Drawbacks:•Compounds must be vaporizable and ionizable
for IMS detection to be used;4
•Samples must be relatively clean;•Ultra pure extraction solutions should be used;
and•Technique is not suitable for multiple compo-
nent matrices.
Total Organic Carbon (TOC)TOC analysis is specific to organic compounds andtheoretically measures all the covalently bondedcarbon in water.5
Benefits:•TOC detection is an acceptable way to detect residues of con-
taminants.Drawbacks:• Considered a “worst case” analysis because TOC analysis
incorporates all organic molecules in solution and repre-sents surface area depending upon the sampling method(swab or rinse);5
•“In order for TOC to be functionally suitable, it should first beestablished that a substantial amount of the contaminatingmaterial(s) is organic and contains carbon that can be oxi-dized under TOC test conditions”5;
•Samples must be water soluble;•Excellent water quality is needed for sensitivity; and•Certain swab types may also interfere with TOC analysis, so
swab selection is critical.
UV-Visible Spectrophotometry (UV-Vis)UV-Vis is commonly used for detection of small molecule activepharmaceutical ingredients or detergent residues for swab andrinse samples.
Benefits:•Not limited to water as the extraction solution;•Provides quantitative results;•Does not require a mobile phase or column;•Offers fast spectral acquisition; and•Allows for use of a larger swab selection, compared to TOC.Drawbacks:•Lacks peak separation; and•Requires chromophore for specificity.
High Performance Liquid Chromatography (HPLC)HPLC can be used for detection of small molecule active phar-maceutical ingredients (APIs) or detergent residues for bothswab and rinse samples, allowing for separation of multiplecomponents.
Benefits:• Is not limited to water as the extraction solution;•Offers peak separation via packed column;•Provides identification of specific peaks of interest and quan-
titative results provided a suitable reference standard is used;• Offers multiple detection options (UV, photodiode array,
fluorescence, refractive index, evaporative light scattering,corona charged aerosol detection, etc.);
•Allows for the use of a large variety of swab types due to sep-aration power; and
H O W T O I M P R O V E C L E A N I N G P R O C E S S E S
Figure 1.
One way to enhance visualdetection is to set up spikingstudies, in which coupons ofthe same type of surface thatis going through the cleaningprocedure are spiked with knownamounts of residue.
There are a variety of patterns that can be followed when using swabs to clean.
PFQ june09:FQfmpgs1-16 1 8/25/09 7:56 PM Page 6

•HPLC in tandem with mass spectroscopy (MS) offers selec-tivity while separating the API from its degradates based offmass-to-charge ratio of the compound of interest.6
Drawbacks:•May require more development and validation time in com-
parison to other forms of detection, depending on currentinformation about the API and excipients being used in theformulation; and
•HPLC/MS analysis is more expensive.
GC and MSGas chromatography (GC) and GC/MS are mainly used for detec-tion of detergent residue. These cleaning agents typically containvarious solvents or compounds required to effec-tively clean equipment that may not be cleanablewith typical detergents. Most solvent cleaners arevolatile and will evaporate from equipment sur-faces, but some residue may remain from lessvolatile compounds.
Benefits:•Offers improved peak shape over HPLC due to
capillary column usage; and•Provides separation, identification, and quan-
titation of results when an acceptable refer-ence standard is used.
Drawbacks:•Samples require vaporization.
Step 5: Microbial TestingA microbial cleaning validation can also be performed for equip-ment subsequent to or as part of the chemical cleaning validation.This is sometimes overlooked during the initial planning of the val-idation program, yet it provides additional data to support the ef-fectiveness of the cleaning process by establishing thepost-cleaning bioburden. As with chemical cleaning validations,the suitability and qualification of the recovery method should beconsidered when selecting methods.
Sample collection must be performed using an aseptic tech-nique. The microorganisms captured on the swab or in the rinsecan then be enumerated using direct plating, a pour plate tech-nique, or membrane filtration.
For enumeration of swab samples, the swab is typically ex-tracted in a buffered diluent or neutralizing broth (usually a 10 mlvolume) to release organisms. A portion of the diluent can then beaseptically plated using a standard microbiological pour platemethod by placing separate 1 ml aliquots into duplicate petridishes. Tempered nutrient agar is added to these petri dishes, andthe plates are swirled to mix.
After the agar solidifies, the plates are inverted and placed intoan incubator at the desired temperature for a determined period oftime to allow any microorganisms present to grow and become vis-ible on the agar plates. An average count of the plates is obtained todetermine the number of colonies (colony forming units or CFU)per milliliter of the original dilution. Plates having no growth arereported as < 1 CFU/ml. The bioburden of the swabbed area is cal-culated from that result by multiplying the resulting number ofCFU recovered by the dilution factor of the swab (i.e., the volume ofdilution used).
If more sensitive testing is required due to low bioburden re-quirements for the equipment or to enhance recovery of bioburdenfrom very clean equipment, a membrane filtration method can beused. In this type of testing, the entire volume of diluent or anequipment rinse sample is filtered through one membranefilter. The filter, usually a 0.45 micron filter, is then aseptically trans-ferred to a prepared, solidified nutrient agar plate and incubated inthe same manner as a standard pour plate. Visible colonies arecounted at the end of the incubation period, and the CFU per swabor rinsed surface area is obtained. Filter plates having no visiblegrowth are reported in the same manner as above, < 1 CFU, but thesensitivity of the test is increased because the volume sampled (i.e.,the entire diluent volume from the swab or an equipment rinse of
100 ml) is greater.The potential of any remaining chemical residues to inhibit
microbial growth must be considered for a valid evaluation of thebioburden. For agents with inhibitory residuals, neutralizationmethods must be established using the maximum levels antici-pated to be recovered in samples submitted for microbial testing.
The determination of appropriate residue limits and selectionof appropriate cleaning and analytical techniques described aretypically explored during the method development phase. ■Lingenfelter, Evans, and Atkins are senior chemists in the method development and val-idation group, and Clow is a manager of the pharmaceutical microbiology group at Lan-caster Laboratories Inc. For more information, reach Lingenfelter at (717) 656-2300, ext.1449, or at [email protected].
REFERENCES1. Brewer R. Establishing Residue Limits for Cleaning Validation: In-Depth
Examination of the Factors and Calculation that Comprise a Limit. Instituteof Validation Technology Cleaning Validation and Critical Cleaning ProcessesConference; July 24-27, 2007; Chicago.
2. United States Food and Drug Administration. Guide to Inspections Valida-tion of Cleaning Processes. FDA. Available at:http://www.fda.gov/ora/Inspect_ ref/igs/valid.html. Accessed May 6, 2009.
3. LeBlanc DA. Establishing scientifically justified acceptance criteria for cleaningvalidation of finished drug products. Pharm Technol. 1998;19(5):136-148.
4. Gugliotta T. Smiths Detection – Scientific: Ion Mobility Spectrometry (IMS)for Cleaning Validation. Institute of Validation Technology Cleaning Validationand Critical Cleaning Processes Conference; July 24-27, 2007; Chicago.
5. Yourkin J. TOC applications in pharmaceutical cleaning validation. GE Ana-lytical Instruments. Institute of Validation Technology Cleaning Validationand Critical Cleaning Processes Conference; July 24-27, 2007; Chicago.
6. Forsyth RJ, Van Nostrand V. Using visible residue limits for introducing newcompounds into a pharmaceutical research facility. Pharm Technol.2005;29(4):134-140.
7. Siegerman H, Hollands W, Strauss M. Optimum swabbing techniques forcleaning validation. How to succeed in the search for nothing: effectiveswabbing techniques for cleaning validation. 2006; Vol. 1.
8. Verghese G. Selection of cleaning agents and parameters for cGMPprocesses. Paper presented at: Interphex Conference; March 17-19, 1998;Philadelphia.
H O W T O I M P R O V E C L E A N I N G P R O C E S S E S
Sample collection must be performedusing an aseptic technique. Themicroorganisms captured on the swabor in the rinse can then be enumeratedusing direct plating , a pour plate technique,or membrane filtration.
Reprinted with permission from Pharmaceutical Formulation & Quality magazine, June 2009.
PFQ june09:FQfmpgs1-16 1 8/25/09 7:56 PM Page 7

28 PFQ www.pharmaquality.com
Method limits, selection of cleaning techniques, and selection of methoddetection were addressed in the first part of this article. Part two willaddress method validation, the importance of stability for cleaningvalidation samples, when revalidation of a cleaning method is neces-
sary, the use of correction factors, and how to handle failing results.Once the basic cleaning procedure elements have been established (establish-
ment of limits, cleaning procedures, master plan, cleaning protocols, development ofanalytical method), the method is ready to be validated.1 This section outlines typicalcomponents utilized to validate the analytical method. The validation componentspresented below are based upon International Conference on Harmonisation (ICH)and United States Pharmacopeia (USP) guidelines.
Accuracy/Precision: The accuracy ofan analytical procedure expresses thecloseness of agreement between the valuethat is accepted either as a conventionaltrue value or an accepted reference valueand the value found. The precision of ananalytical procedure expresses the close-ness of agreement (degree of scatter) be-tween a series of measurements obtainedfrom multiple sampling of the same ho-mogeneous sample under the prescribedconditions.2
Accuracy/precision should be as-sessed using a minimum of three concen-tration levels, each prepared in triplicate.Accuracy/precision is typically performedwith concentrations ranging from 80 to120% of the final theoretical sample con-centration (based upon the maximumcontamination limit or MCL), although awider range may be more appropriate incertain instances.
It’s Clean, but Can YouProve It?Validation and revalidation are key when establishing cleaningmethods | BY ERIC L INGENFELTER, WES ATKINS, AND HENRY EVANS
ALL
IMA
GES
CO
UR
TESY
OF
LAN
CA
STER
LA
BO
RAT
OR
IES
INC
.
CLEANING VALIDATION PROCEDURES
Editor’s Note: This article is the second in a two-part series on cleaning validation methodol-ogy. Part one, “How to Improve Cleaning Processes,” appeared on pages 16-21 of our June issue.
Contamination Control
PFQ 46 PFQ 6pg:FQfmpgs1-16 1 9/2/09 9:14 PM Page 2

30 PFQ www.pharmaquality.com
There are various cate-gories of accuracy/precisionthat need to be established aspart of the method validation.
• Solution accuracy is themeasurement of the com-pound of interest addeddirectly to the extractionsolution. Reference stan-dard solution is spiked di-rectly into the diluent toprepare the three levels ofconcentration. Solution ac-curacy is performed as acontrol—usually in tripli-cate—to prove recovery ofthe analyte from the extrac-tion solution. This recoverycan then be compared toboth swab and surface ac-curacy recoveries. If rin-seates are being analyzed,this test is the only oneneeded to prove accuracy/precision.
• Swab accuracy determinesthe method’s ability to re-cover the compound of in-terest directly from theswab head. These studiesare performed by directlyadding standard materialto the swab head and thenextracting as per the ana-lytical method. Typically,three replicate-spiked swabsare prepared at the highand low concentrations,while six replicates are pre-pared at the 100% level.
• Surface accuracy deter-mines the method’s abilityto recover the compoundof interest directly from adefined surface. Couponsof the defined surface ma-terial are spiked with reference stan-dard at the three concentration levelsmentioned above. The area of thecoupon spiked with standard is de-pendent on the actual cleaning pro-cedure and the surface area typicallysampled after manufacturing. Typicalsurface areas sampled are 25 to 100cm2. Acceptance criteria should be evalu-
ated and determined during the develop-
ment of the analytical methods. Many fac-tors influence the establishment of appro-priate criteria, including the surface beingswabbed, MCL, type of swab, and instru-mentation. Intermediate accuracy/preci-sion should be performed by a secondanalyst repeating the accuracy/ precisiontests listed above. If multiple surfaces areinvolved in the validation, the second ana-lyst can perform accuracy/precision on se-lect surfaces (worst case) if appropriate.
Linearity: The linearity of an analyti-cal procedure is its ability, within a givenrange, to obtain test results that are di-rectly proportional to the concentration(amount) of analyte in the sample.2
A minimum of five concentration lev-els are typically evaluated, with duplicateinjections at each level. Concentrationsranging from the limit of quantitation to200% of the MCL are typically evaluatedduring validation. Acceptance criteria are
CONTAMINATION CONTROL Cleaning Validation Procedures
Swab accuracydetermines amethod’s abilityto recover thecompound ofinterest directlyfrom the swabhead.
PFQ 46 PFQ 6pg:FQfmpgs1-16 1 9/2/09 9:14 PM Page 4

32 PFQ www.pharmaquality.com
generally based upon either the correla-tion coefficient or the coefficient of deter-mination of the linear plot. In addition,criteria can be established around boththe slope and Y-intercept of the plot.
Specificity: Specificity is the ability toassess the analyte unequivocally in thepresence of components that may be ex-pected to be present.2
Swab type and surface type are typi-cally evaluated to determine if interfer-ences are present in the method. Althougheach of these components is typicallyexamined during method development,they should be included in the validationprocess and shown, under protocol, tohave little or no interference. Swabs andsurfaces are prepared as per the methodwithout the introduction of the analyte ofinterest. Interference from either the swabor surface should be less than 10% of theMCL. Lower limits for specificity may beappropriate depending on the methodconditions.
Limits of Detection and Quantita-tion: The limit of detection (LOD) of anindividual analytical procedure is thelowest amount of analyte in a samplethat can be detected but not necessarilyquantitated as an exact value. The limit ofquantitation (LOQ) of an individual ana-lytical procedure is the lowest amount ofanalyte in a sample that can be quantita-tively determined with suitable precisionand accuracy.2
Both the LOD and LOQ should be veri-fied by a suitable number of preparationsknown to be prepared near the respectivelimit being evaluated.4 LOD and LOQ canbe estimated using a signal-to-noise ap-proach with typical values of three-to-onefor LOD and 10-to-one for LOQ.
During method validation, standardsolutions are prepared at the estimatedLOD and LOQ (three preparations for LODand three preparations with duplicateanalyses for LOQ). Typical acceptancecriteria for LOD require that the analytebe detected in each analysis. For LOQ, thepercent recovery is determined for eachof the six measurements and should fallbetween 75% and 125% recovery. Therelative standard deviation is also deter-mined for the six measurements andshould be less than 25%.
Robustness–Chromatographic Con-ditions: The robustness of an analytical
CONTAMINATION CONTROL Cleaning Validation Procedures
VALIDATIONCOMPONENT
TYPICALACCEPTANCE
CRITERIADESCRIPTION
Accuracy The accuracy of an analytical procedureexpresses the closeness of agreementbetween the value that is acceptedeither as a conventional true value or anaccepted reference value and the valuefound.2
Swab recovery: meanrecovery of 90% - 110%theoretical. %RSD(relative standard devia-tion) ≤ 10% Surfacerecovery: mean recoveryof 85% - 115% theoreti-cal. %RSD ≤ 15%.
Precision The precision of an analytical proce-dure expresses the closeness of agree-ment (degree of scatter) between aseries of measurements obtained frommultiple sampling of the same homoge-neous sample under the prescribedconditions.2
All system suitabilitymeets method criteria.Intermediate precisiondata and precision data(combined) must havean RSD of ≤ 15%.
Linearity The linearity of an analytical procedureis its ability (within a given range) toobtain test results that are directly pro-portional to the concentration (amount)of analyte in the sample.2
Correlation coefficient(r) ≥ 0.995 or coeffi-cient of determination(r2) ≥ 0.99.
Specificity Specificity is the ability to assess,unequivocally, the analyte in thepresence of components that may beexpected to be present.2
Detected analyte ofinterest must notexceed 10% of themean maximum con-tamination limit orhave an S/N ≥ 10.
LOD The LOD of an individual analyticalprocedure is the lowest amount ofanalyte in a sample that can bedetected but not necessarily quantitatedas an exact value.2
Analyte of interestmust be detected inall injections and bein the retention timeregion of the peak ofinterest (~ S/N of 3).
LOQ The LOQ of an individual analyticalprocedure is the lowest amount ofanalyte in a sample that can bequantitatively determined with suitableprecision and accuracy.2
Analyte of interestmust be detected inall injections and bein the retention timeregion of the peak ofinterest (~ S/N of 10).
Robustness The robustness of an analytical proce-dure is a measure of its capacity toremain unaffected by small but deliber-ate variations in method parametersand provides an indication of itsreliability during normal usage.2
The varied conditionmust meet the systemsuitability require-ments outlined in theanalytical method.
Stability The ability of a standard or samplepreparation solution to meet methodspecifications over time.
Recovery value of98% - 102% whencompared to freshstandard solutions.
Table 1. Summary of Typical Validation Components
PFQ 46 PFQ 6pg:FQfmpgs1-16 1 9/2/09 9:14 PM Page 6

July/August 2009 33
procedure is a measure of its capacity toremain unaffected by small but deliberatevariations in method parameters and pro-vides an indication of its reliability duringnormal usage.2
Instrument and reagent variations, forexample, may be examined as part of ro-bustness to ensure that the method pro-vides reliable data under varyingconditions. Robustness is not a critical val-
idation component according to ICHguidelines, but should be considered on acase-by-case basis. Robustness may be de-termined during development of the ana-lytical procedure, and if measurements aresusceptible to variations in analytical con-ditions, these should be suitably con-trolled, or a precautionary statementshould be included in the procedure.3
Stability–Stock Standard, WorkingStandard, Working Swab: Stability ofstock standards, working standards,and working swab or rinseate samplesare evaluated as part of the validation.Stability can be evaluated under variousconditions such as refrigeration or pro-tection from light, but ambient condi-tions are preferred. This stability periodis necessary to ensure that cleaning vali-dation samples can be collected,shipped to the testing facility, and ana-lyzed. The length of stability is particu-larly important for cleaning validationsample solutions and should be at leastone week old, preferably two weeks.
Table 1 (see previous page) lists a sum-mary of the validation components in-volved in a typical cleaning validation,along with examples of typical accept-ance criteria that can be set for those tests.Please note that the acceptance criteriaare listed for informational examples onlyand that the actual acceptance criteriamust be determined on a case-by-case ba-sis, depending on validation specifics.
RevalidationCleaning validation procedures should berevalidated when the equipment train of
the manufacturing process is changed.Possible changes in the equipment traininclude the surface type utilized and/orsurface area, which can lead to the estab-lishment of a new MCL. A full validationcan usually be avoided, and only certainelements of the cleaning validation needto be revalidated. If the new limit is withinthe previously established linear range,only surface recoveries (bracketing the
new limit) and surface residue specificityneed to be revalidated. These same twoelements must be revalidated if a surfacetype is changed.
If the new limit is outside the previ-ously established linear range, linearitymust be extended above or below the newlimit, and swab recovery, surface recov-ery, and surface residue specificity needto be revalidated. For a new limit belowthe established linear range, a new stan-dard concentration at this level may be
recommended. If the method is not linearthrough the new level, however, a newstandard concentration is necessary. Anew standard concentration requires afull revalidation.
Other possible but less likely reasonsto revalidate swab recovery, surface re-covery, and surface specificity include a
change in the type of swab or swabbingpattern. For a change in swab type, swabspecificity also needs to be revalidated.For any of the previously listed changes,elements that do not require revalidationare LOD and LOQ.
The prior revalidation discussion as-sumes that the validated method was forswab samples and not for rinse samples.For rinse samples, validation elements in-volving swabs and surfaces do not need tobe conducted. Additionally, any changesin the synthesis of the drug substance,changes in the composition of the finishedproduct, or changes in the analytical pro-cedure require revalidation according toICH guidance.2
Correction FactorsSometimes in cleaning validation studies,it is determined that not all the residue ona surface can be fully recovered, thus pro-ducing lower recoveries. In these instances,it may be necessary to apply a recoveryfactor. If a recovery factor is deemed ap-propriate, several issues must be consid-ered before it is set:
• Recovery factors are usually not ap-plied if recovery results are above 70%;however, there is no standard limit.
• Recovery factors must be set undersound scientific justification.
• Recovery factors should not be used ifrecoveries are too low. (For example, ifrecoveries are consistently around10%, a 10X factor would not be appro-priate.)
• Recovery factors need to be set prior to
Cleaning validation procedures should berevalidated when the equipment train of themanufacturing process is changed.
There are a variety of swabs to pick from, but when a change in swab type takes place, swab specificityalso needs to be revalidated.
PFQ 46 PFQ 6pg:FQfmpgs1-16 1 9/2/09 9:14 PM Page 7

or during validation, not during rou-tine monitoring.
• All results used to determine the re-covery factor need to be consistentand reproducible.Recovery factors are often seen as a
last resort to salvage a mediocre method.Recovery method optimization should al-ways be explored as an alternative prior tousing recovery factors.
Failing DataNo matter which scientific field you are in,the question of how to handle failing dataduring routine sample testing will arise;the world of cleaning validation is no dif-ferent. The best way to approach this issueis to address it before it becomes a prob-
lem. When developing the cleaning vali-dation master plan or protocol, dedicate asection to appropriate handling of failingresults. Here, a step-by-step investigationof the results can be laid out in advance, sothat decisions won’t be made based on in-stance-by-instance circumstances. Whenreviewing data, regulatory agencies liketo see that failing results were handled ina consistent and systematic manner.
All data that do not meet protocol ormaster plan acceptance criteria need tobe treated as a deviation. They must behandled by first being verified, resolved,and approved. This may require thatsamples be retested. Sometimes moresamples may need to be collected to ver-ify outlying results. If results indicate
that a criterion or limit is not attainableunder set conditions, modifications tothe method, protocol, standard operatingprocedure, or master plan may be enter-tained. Again, all of these scenariosshould be investigated during the feasibil-ity/method development/validation stageof the cleaning validation study. nLingenfelter, Atkins, and Evans are senior chemists inthe method development and validation group at LancasterLaboratories Inc. For more information, reach Lingenfelterat (717)656-2300, ext. 1449, or at [email protected].
REFERENCES
1. Active Pharmaceutical Ingredients Committee(APIC). Cleaning validation in active pharma-ceutical ingredient manufacturing plants.Washington, DC: APIC; 1999. Available at:http://apic.cefic.org/pub/4CleaningVal9909.pdf.Accessed July 10, 2009.
2. International Conference on Harmonisation(ICH). Harmonised tripartite guideline: valida-tion of analytical procedures: text and method-ology Q2(R1). Geneva, Switzerland: ICH; 2005.Available at: http://www.ich.org/LOB/media/MEDIA417.pdf. Accessed July 10, 2009.
3. United States Pharmacopeia/National Formulary.USP 32/NF 27, General Chapters: <1225>Validation of Compendial Procedures. Rockville,Md.: United States Pharmacopeial Convention;2009.
CONTAMINATION CONTROL Cleaning Validation Procedures
No matter which scientific field you are in, thequestion of how to handle failing data duringroutine sample testing will arise; the worldof cleaning validation is no different.
Reprinted with permission from Pharmaceutical Formulation & Quality magazine, July/August 2009.
PFQ 46 PFQ 6pg:FQfmpgs1-16 1 9/24/09 12:10 PM Page 8