some considerations for developing wireless (radio) and wireline harmonisation presentation to...
TRANSCRIPT

Some considerations for developing wireless (radio) and wireline harmonisation
Presentation to CENELEC 205a Working Group 10 at Rome on 11/10/99
by
Professor Paul A Brown
Communications Research Centre
Lancaster University, UK.
PAB/slide 1

Harmonising wireless (radio) and wireline networks
Introduction
In order to harmonise HF wireless and wireline networks we
need to consider a number of key issues including:• Spectrum efficiency of wireless and wireline systems• The physical distribution and location of HF radio links• The primary function of such links (e.g. broadcast, commercial,
government, military, civil aviation, maritime, amateur etc)• Proximity factors for wireless and wireline systems (e.g. link power
budget, antenna factor, service, receiver characteristics, radiation efficiency of cables etc)
N.B. DPL= Digital Power Line System
PAB/slide 2

HF point to point wireless links…
(In 1MHz of spectrum)
2400 Baud (Bit/s)
x 400Node A Node B
Assumes, 2.5 kHz channels, no guard bands and uniform distribution
PAB/slide 3
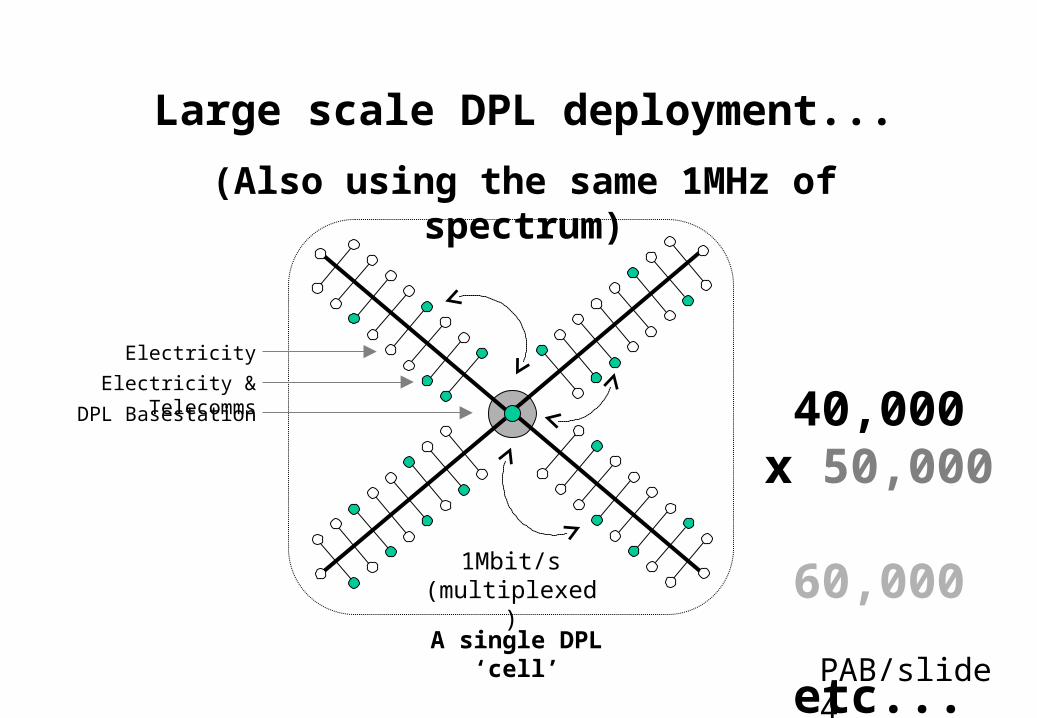
Large scale DPL deployment...
(Also using the same 1MHz of spectrum)
40,000x 50,000 60,000 etc...
1Mbit/s (multiplexed)
A single DPL ‘cell’
Electricity & Telecomms
Electricity
DPL Basestation
PAB/slide 4

Wireline enhances spectrum utilisation• Figure 1 attached illustrates ‘ideal’ HF communications range (shown in white, field
strength > 30 dBuV/m) for a 1 kW transmitter located at Kendal assuming signal propagation via the ionosphere to any locations in the UK on a frequency of 6.1 MHz at 1200 UT and for a sunspot number of 100.
• If we assume say a I MHz frequency slot (6.1 MHz+/-500 kHz) consisting of 400 x 2.5 kHz radio channels (without guard bands) running continuously 24 hours per day at 2400 bit/s we have an overall maximum HF radio data transmission capability of ~ 10 Gigabytes per day.
• If we assume 20,000,000 house holds in UK, 200 houses per substation and 10% service penetration. Then the instantaneous DPL data capacity = 5 Gbit/s. Then over 24 hour period we have ~ 100,000 Gigabytes per day.
• It follows that by cellular re-use of a 1 MHz element of HF spectrum a DPL solution is ~ 10,000 times more effective than a conventional radio solution, per unit time, per Hz of spectrum.
PAB/slide 5

10W 0E
10E
50N
60N
10W 0E 10E
50N
60N
20W
20W
0 200 400 600 800 1000 1200 1400 1600 1800 2000KM
KENDAL [ISOTROPE ] 1kW -1deg 12ut 6.100MHz JUN 100ssn 0.0Q
Transmitter location to grid of ReceiversDBU
Default/default.I11
ICEPACField Strength
Median[dBu]
> 35 > 30
> 25
> 20
> 15
> 10
< 10
Min= -15.10
Max= 37.20
USRI coefficients
Version 981015W
NTIA/ITS
PAB/slide 6Figure 1

Developing proximity factors
• In our example we have 400 HF radio channels, without guard bands, operating over 1 MHz of continuous spectrum. We now consider the issues of the physical distribution of such HF radio links in relation to wireline systems.
• Earlier work indicates a 100 to 200m clearance zone required for 20 dB carriers/noise ratio at each HF link receiver for a 100 Watt link transmitter power [1].
• Assuming an ‘average’ distribution of such link sites, i.e. 800 link terminals in UK (including Northern Ireland). This gives one link site per 303.64 square km [2]. Assuming a protection zone of radius 200 m around each HF terminal site leaves 242,809 square km [3] for cellular powerline deployment.
• We now require to develop more realistic criteria for the number of HF link terminals, their relative distributions and the potential number and relative distribution of powerline systems per unit area.
PAB/slide 7

Summary
• We have illustrated, albeit simplistically, that with a 100% utilisation of a given frequency slot (1 MHz) by conventional HF wireless (radio) communications it is possible to further enhance the utilisation of the same element of HF spectrum within 99.96% of the same geographic area by a factor of 10,000 whilst maintaining coexistence between the wireless and wireline solutions. More detailed co-existence algorithms now require to be developed
• Efficient spectrum management should enable wireless and wireline communications to develop and coexist for the benefit of all.
PAB/slide 8

References and calculations
References
[1] Paul Brown, ‘Near field/far field radiated emission
benchmarking’, German Regulatory Working Group, 25th
January 1999
[2] UK Government Statistical Service
(www.statistics.gov.uk)
Calculations
UK land area = 242,910 sq km; therefore we have 303.64 sq
km for each of 800 HF link terminals. Total protection zone
(area) for 800 HF link terminals = 100.53 sq km. Therefore
we have 242809 sq km for powerline deployment.
PAB/slide 9

Presentation to CENELEC SC205a WG 10
Brussels, 16th November 1999
Near field/far field radiated emission benchmarking
by
Professor Paul A Brown
CRC, Lancaster University, UK
Page 1 of 13

210 metres
Assessing the near-field effects of high frequency power line signals
On-going research and development
Metropolitan / campus area environment
Page 2 of 13
CRC, Lancaster University, UK

HF Wide Band Dipole Antenna at Lancaster University Communications Research Centre (CRC)
FWB/2530 from SMC CommunicationsPage 3 of 13

FWB/2530 Wideband HF antenna from SMC Communications - Specification
Freq. Range : 2.5 - 30 MHzPower Rating : 1 kW AveMax VSWR : 2.5:1 Gain : Up to 3 dBi Input Impedance : 50 Ohms unbalancedConstruction : Heavy duty cadmium copper, with galvanised steel and
stainless steel fittings
1.0
1.5
2.0
2.5
3.0
3.5
28.826.824.822.820.818.816.814.812.810.88.86.84.82.8
Page 4 of 13

FWB/2530 Wideband HF antenna from SMC Communications - Radiating Patterns
Page 5 of 13

+20 dBm
Signal Generator
13A Sockets
50 Coaxial Cable
IEC Mains Lead
HF Coupling Unit (With 13A by-pass socket)
Transient Suppresser
50 Coaxial Connector
HF signal injection equipment configuration
Page 6 of 13

Free space path loss from Bowland Tower to HF Antenna CRC
Resolution bandwidth 300 Hz
Video bandwidth 30 Hz
Page 7 of 13

Path loss measurements and calculations
• Calculated 210m free space path loss at 5 MHz (wavelength = 60 metres) = 33 dB
• Calculated 210m free space path loss at 7.082 MHz (wavelength = 42.36m) = 36 dB
• Measured 210m path loss at 5 MHz = (+ 20 dBm - 80 dBm) = 100 dB
• Measured radiation efficiency of building internal wiring, with powerline signal
injected via power socket in line/phase to earth mode = (100 - 33) = - 67 dB
• Field strength anticipated at antenna for 1 mW signal injected into building wiring
= -9dBuV/m
N.B. No allowance for dipole as opposed to isotropic antenna Page 8 of 13

Assessing the far-field effects of high frequency power line signals
Lancaster Hitchin
288 Kilometers
300 KilometersSingle HopSignal Path
333 Kilometers 333 Kilometers
D Layer
E/F Layer
Page 9 of 13

Ionospheric properties on 13/10/98 between 14:06 and 14:08
Page 10 of 13

Consider effects on nearby HF link receiver
• Consider voice (single side-band SSB) link on 7.082 MHz
• Transmitter power 100 Watts, antennas 2 x dipoles, path length direct = 288 km (Lancaster to Hitchin), height of reflective (E/F) layer = 300 km, received signal levels (S 9 + 10 to 15dB) = - 70 dBm
• Calculated HF link receive power level at (50 ohm) receiver antenna port = - 56 dBm
• Difference between measured and calculated values (14 dB) possibly due to ionospheric attenuation (D layer), measurement inaccuracy etc
• Calculated field strength at receiving antennas = 38dBuV/m
Page 11 of 13

Effect of near field ‘jammer’ on HF link performance
• HF link receiver antenna subject to 38 dBuV/m field strength (calculated) from far-end link transmitter (wanted signal). Input power level to local link receiver measured at - 70 dBm
• Powerline jammer (1 mW) located 210 metres from local HF link antenna produces an interfering signal (calculated) of -9dBuv/m at the local receiver antenna. Input power to receiver measured (extrapolated) at - 100 dBm
• Therefore measured signal to noise at local victim receiver (wanted signal + noise to jammer ratio ) = 30 dB
• Calculated difference in field strengths = 47 dB
Page 12 of 13

Conclusions
• Radiation efficiency of mains wiring (in-building injection, line to earth) ~ - 67dB reference isotropic source
• Measured signal to noise (jammer) ratio at victim receiver = 30 dB for 100 watt, HF link, power budget
• A 100 watt, HF, SSB (voice), link has been observed to operate with a 30 dB S+N/N ratio (measured) in close proximity (210 metres) to a powerline jammer
• The link noise floor (local) was measured at -100dBm in a 300 Hz resolution bandwidth. If the injected powerline signal power level was < 1 mW then it would not be detectable above the noise floor by the victim receiver
• The near field, far field and cumulative effects of such deployments
now require to be further modeled and measured Page 13 of 13