some consequences of long-term human impacts on · pdf filesome consequences of long-term...
TRANSCRIPT

Revista Chilena de Historia Natural 64: 597-614, 1991
Some consequences of long-term human impacts on ecosystems
Algunas consecuencias a largo plazo del impacto humano en los ecosistemas
GENE E. LIKENS
Institute of Ecosystem Studies The New York Botanical Garden
Mary Flager Cary Arboretum Box AB
Millbrook, New York 12545 USA
ABSTRACT
Regional- and global-scale environmental problems potentially can affect North and South Temperate Zone ecosystems differently because of regional differences in population density and growth, and use of resources. Consideration is given to global climate change and various components of global and regional, environmental change, including atmo-spheric ozone, acid rain, toxic metals and pesticides, eutrophication, and erosion.
Acid rain is a serious environmental problem in industrialized and urbanized regions of the Northern Hemisphere. Long-term data from the Hubbard Brook Experimental Forest in New Hampshire, USA, provide a temporal dimension for this problem. Currently atmospheric deposition of sulfur in the northeastern United States exceeds by three to six times limits established to protect sensitive ecological systems, whereas in southern Chile current atmospheric deposition of sulfur is less than these acceptable limits. Developed, and particularly developing, countries throughout the world face serious questions of resource management as human populations increase, and if regional- and global-scale pol-lution were to increase accordingly.
Key words: global climate change, acid rain, ozone, Hubbard Brook, Chile.
RESUMEN
Los problemas ambientales a escala global y regional pueden afectar potencialmente los ecosistemas templados de Norte y Sudamérica en forma diferente, a causa de los contrastes en densidad y crecirniento poblacional y en el uso de recur-sos. Se consideran en este trabajo el cambia de clima global, y sus varios componentes tanto a escala global como regio-nal, incluyendo el ozono atmosferico, la lluvia acida, metales toxicos y pesticidas, eutroficacion y erosion.
La lluvia ácida es un problema ambiental serio en las regiones industrializadas y urbanizadas del hemisferio Norte. Un estudio a largo plazo en el Bosque Experimental de Hubbard Brook, en New Hampshire, USA, demuestra Ia dimen-sión temporal de este problema. Actualmente, Ia deposicion atmosferica de sulfuro en el noreste de Estados Unidos ex-cede en tres a seis veces los Hmites establecidos para proteger ecosistemas sensibles, mientras que en el sur de Chile Ia deposicion atmosferica actual es menor que estos Hmites aceptables. Los paises desarrollados, y particularmente las naciones en desarrollo, en todo el planeta enfrentan serios problemas de manejo de recursos, al crecer la poblacion, con-siderando el concomitante aumento en los niveles de polucion a escala regional y global.
Palabras claves: Cambia climatico global, Chile, Hubbard Brook, lluvia acida, ozono.
INTRODUCTION
Human societies throughout the world face many regional-scale and global-scale environmental problems, many of which are quite familiar to scientists and to lay-persons because of widespread coverage by the news media. I shall briefly review some of these environmental problems in relation to Northern and Southern
(Received 15 August 1990.)
Temperate ecosystems, but first, however, I want to begin with a quote that typifies the classic conflict between various societal concerns, as well as the naivete about environmental issues.
This quote was reprinted in the Aus-tralian Society of Limnology Newsletter (1989) from the National Parks Journal of New South Wales. Mr. Jim Ramsey, spokesperson for the proponents of a multimillion dollar tourist and residential canal estate development said, "Even though the development would mean the destruc-
598 LIKENS
tion of fifty-three percent of the wetland (in the Bateman's Bay area), that would be balanced by the construction of a wetland's education centre to teach people of the need to preserve wetlands."
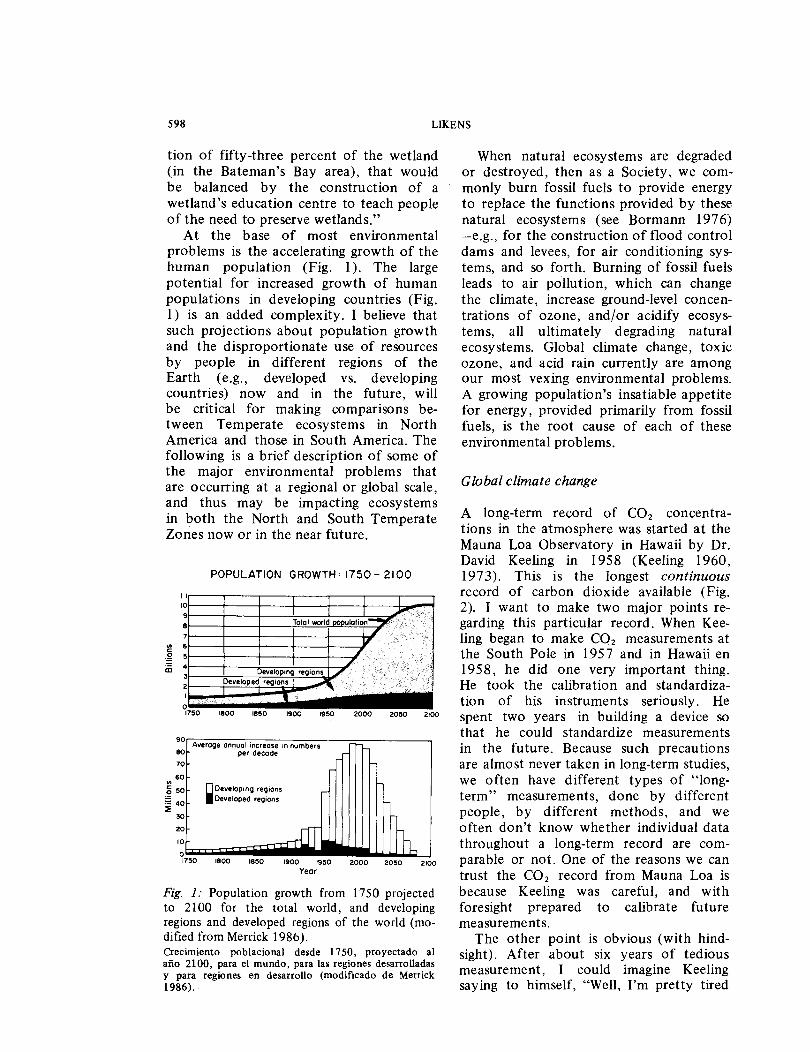
At the base of most environmental problems is the accelerating growth of the human population (Fig. 1 ). The large potential for increased growth of human populations in developing countries (Fig. 1) is an added complexity. I believe that such projections about population growth and the disproportionate use of resources by people in different regions of the Earth (e.g., developed vs. developing countries) now and in the future, will be critical for making comparisons be-tween Temperate ecosystems in North America and those in South America. The following is a brief description of some of the major environmental problems that are occurring at a regional or global scale, and thus may be impacting ecosystems in both the North and South Temperate Zones now or in the near future.
POPULATION GROWTH' 1750-2100
.. c ~ iii
90 Average annual increase in numbers
80 per decade 70 60 ..
-~ 50 0 Develop1ng re~ions : 40 I Developed reg1ons ::!:
30
~~ ~~ rh, ~7~50~·~~80~0~~18~50~ji~90~0~~195~0 ... 2.00.0UJj20~50liL2JIOO
Year
Fig. 1: Population growth from 1750 projected to 2100 for the total world, and developing regions and developed regions of the world (mo-dified from Merrick 1986). Crecimiento poblacional de~de 1750, proyectado al afio 2100, para el mundo, para las regiones desarrolladas y para regiones en desarrollo (modificado de Merrick 1986).
When natural ecosystems are degraded or destroyed, then as a Society, we com-monly burn fossil fuels to provide energy to replace the functions provided by these natural ecosystems (see Bormann 1976) -e.g., for the construction of flood control dams and levees, for air conditioning sys-tems, and so forth. Burning of fossil fuels leads to air pollution, which can change the climate, increase ground-level concen-trations of ozone, and/or acidify ecosys-tems, all ultimately degrading natural ecosystems. Global climate change, toxic ozone, and acid rain currently are among our most vexing environmental problems. A growing population's insatiable appetite for energy, provided primarily from fossil fuels, is the root cause of each of these environmental problems.
Global climate change
A long-term record of C02 concentra-tions in the atmosphere was started at the Mauna Loa Observatory in Hawaii by Dr. David Keeling in 1958 (Keeling 1960, 197 3). This is the longest continuous record of carbon dioxide available (Fig. 2). I want to make two major points re-garding this particular record. When Kee-ling began to make C02 measurements at the South Pole in 1957 and in Hawaii en 1958, he did one very important thing. He took the calibration and standardiza-tion of his instruments seriously. He spent two years in building a device so that he could standardize measurements in the future. Because such precautions are almost never taken in long-term studies, we often have different types of "long-term" measurements, done by different people, by different methods, and we often don't know whether individual data throughout a long-term record are com-parable or not. One of the reasons we can trust the C0 2 record from Mauna Loa is because Keeling was careful, and with foresight prepared to calibrate future measurements.
The other point is obvious (with hind-sight). After about six years of tedious measurement, I could imagine Keeling saying to himself, "Well, I'm pretty tired

HUMAN IMPACTS ON ECOSYSTEMS 599
1340
~ 330 i ~
i 320 J
u
3l0
~O~~~~~~~~~~LLLLLLL
1955 1960 1965 1970 YEAR
1975 1980 1985
Fig. 2: Concentration of atmospheric C02 at Mauna Loa Observatory, Hawaii. The horizontal bars represent annual averages. Data were obtain-ed by D.C. Keeling (from Gammon eta/. 1985). Concentraci6n atmosferica de C02 en el Observatorio de Mauna Loa, Hawaii. Las barras horizontales representan promedios anuales. Datos obtenidos por D.C. Keeling (de Gammon et a/. 1985).
of making these measurements, and who cares what the C02 concentration is any-way; it hasn't gone up very much; why don't I stop?" But he didn't stop, and in spite of much difficulty in trying to maintain funding, he has continued to measure C02 concentrations at Mauna Loa until the present. As a result, we now have this long-term record of C0 2 for the atmosphere, which is so valuable in terms of evaluating global climate change. Long-term records of C0 2 concentration also are available for Point Barrow in Alaska, American Samoa, and the South Pole, and they all show similar patterns of increase, and annual fluctuation, in our global atmosphere (Gammon et al. 1985). Carbon dioxide is one of the important "green-house" gases and is thought to contribute to global warming and climate change (e.g., Ember et al. 1986).
Because of increasing population size and increasing demands for energy, there is the potential to increase the carbon dioxide concentration of the Earth's atmo-sphere in only two hundred years or so by a similar amount to what occurred dur-ing the past hundred million years (Gam-mon et al. 1985). That statistic clearly shows the drama tic effect that humans can have on our global environment.
The human population is in fact often the multiplier in these environmental pro-
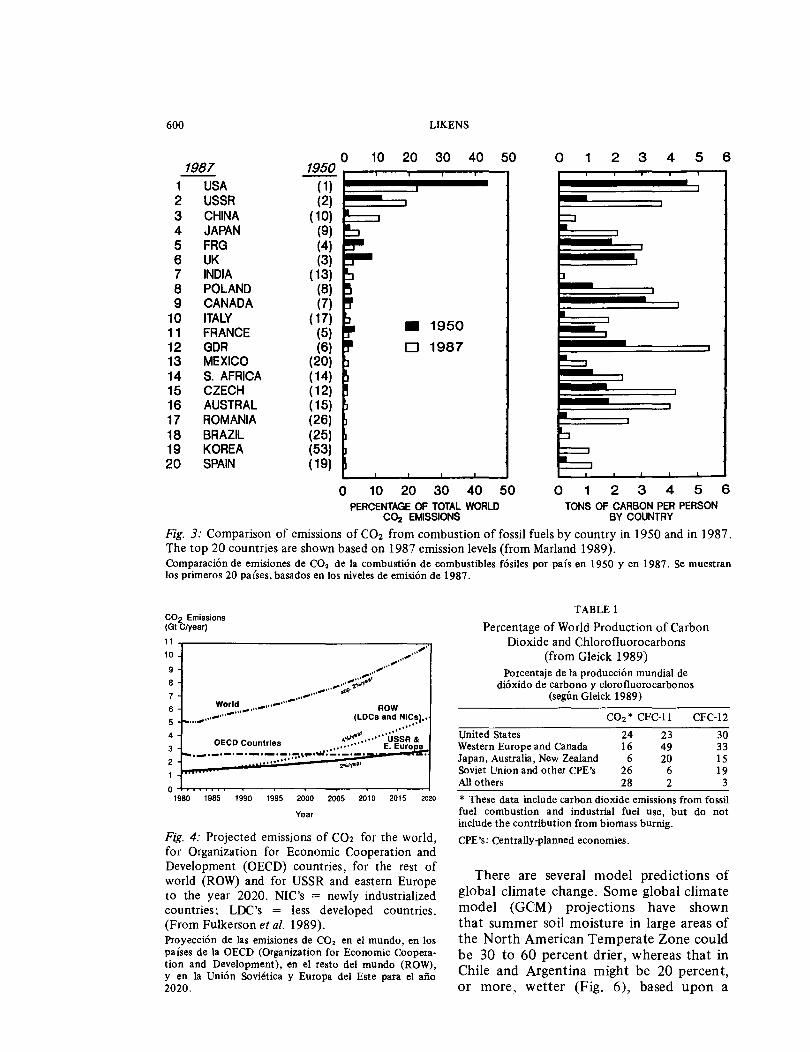
blems. Moreover, the human population in different parts of the globe has different impacts, e.g., in terms of combustion of fossil fuel and release of carbon dioxide into the atmosphere. Industrialized coun-tries of the Northern Hemisphere produce more than 70% of the global emissions of C02 , yet have only about 25% of the world's population (Gleick 1989). The USA alone contributes almost 24% of the world's total C0 2 emissions, followed by the USSR (~ 19%) and China(~ llot.) (Fig. 3, Table 1 ). In 1950 the USA was the largest contributor of C0 2 on a per capita basis, but now it has been exceeded by East Germany (Fig. 3). China and South Asia have large populations, but currently contribute relatively small aounts of carbon dioxide per person to the atmosphere (Fig. 3). Two Latin American countries, Mexico and Brazil, are in the top 20 of C02 producers; although their per capita rates are relatively low, they have increas-ed significantly since 1950 (Fig. 3). How this pattern changes in the future clearly will have a major overall effect on the global environment, as well as on individual ecosystems in North and South America (Fig. 4).
Carbon dioxide is not the only gas that can contribute to global climate change. Concentrations of chlorofluorocarbons, commonly known as CFC's or freons, are greenhouse gases and have increased dra-matically recently in the Earth's atmo-sphere. Chlorofluorocarbons are used widely as refrigerants, solvents, and aerosol pro-pellants. The United States, Canada, and Western Europe contribute more than 60% of the world's production of CFC's (Table 1 ). Other greenhouse gases, nitrous oxides, and particularly methane also have increased recently in the atmosphere, but the causes for these increases, particularly for methane, are unclear (see review in Ember et al. 1986, Cicerone & Oremland 1988). The effects of CFC's, nitrous oxide, and methane on global warming may be as large as that of C02 by the year 2000 (Fig. 5). The overall effects of increases in these gases on global climate change are complex and varied (see, e.g., Ember et al. 1986).
600 LIKENS
0 10 20 30 40 50 0 1 2 3 4 5 6 1987 1950
1 USA (1) 2 USSR (2) -3 CHINA (10) 4 JAPAN (9) ~ 5 FRG (4) 6 UK (3) 7 INDIA ( 13) 8 POLAND (8) i:.... 9 CANADA (7)
10 ITALY 11 FRANCE 12 GDR
( 17) (5) (6)
• 1950
D 1987 -
13 MEXICO (20) ~ 14 S. AFRICA ( 14) 15 CZECH ( 12) 16 AUSTRAL ( 15) 17 ROMANIA (26) • 18 BRAZIL (25) ~ 19 KOREA (53) 20 SPAIN ( 19) ~
0 10 20 30 40 50 PERCENTAGE OF TOTAL WORLD
C02 EMISSIONS
0 1 2 3 4 5 6 TONS OF CARBON PER PERSON
BY COUNTRY
Fig. 3: Comparison of emissions of C02 from combustion of fossil fuels by country in 1950 and in 1987. The top 20 countries are shown based on 1987 emission levels (from Marland 1989). Comparaci6n de emisiones de C02 de Ia combustion de combustibles f6siles por pals en 1950 y en 1987. Se muestran los prim eros 20 pa{ses, basados en los niveles de emisi6n de 1987.
C02 Emissions (Gt C/year)
11 ~-------------------------------~~· 10 ~···~···
9 ~··· 8 ,.···-=~(·· 7 ,,,,.. .......
.............. ~.'2.-f-1'1
6 Wo~~ ........... .. 5 ~-- ............ .
ROW (LDCs and NICs),•
..,t •••••••••• 4 ,.,,.. , ••••• USSR &
3 OECD Countries ............ E. Eur~e ~~-·-·-·-· lolll:':":':o"":"'o\ ..... 'lllo:o-1_1_1 I
2 2%1'1••'
1r-'"
0~~~~~--~--~--~--------~~ 1980 1985 1990 1995 2000 2005 2010 2015 2020
Year
Fig. 4: Projected emissions of C02 for the world, for Organization for Economic Cooperation and Development (OECD) countries, for the rest of world (ROW) and for USSR and eastern Europe to the year 2020. NIC's = newly industrialized countries; LDC's = less developed countries. (From Fulkerson et al. 1989). Proyecci6n de las emisiones de C02 en el mundo, en los pa{ses de Ia OECD (Organization for Economic Coopera-tion and Development), en el resto del mundo (ROW), y en Ia Union Sovietica y Europa del Este para el aiio 2020.
TABLE 1
Percentage of World Production of Carbon Dioxide and Chlorofluorocarbons
(from Gleick 1989) Porcentaje de Ia producci6n mundial de
dioxido de carbono y clorofluorocarbonos (segun Gleick 1989)
CFC-12 United States Western Europe and Canada Japan, Australia, New Zealand Soviet Union and other CPE's All others
24 23 16 49
6 20 26 6 28 2
30 33 15 19
3 * These data include carbon dioxide emissions from fossil fuel combustion and industrial fuel use, but do not include the contribution from biomass burnig. CPE's: Centrally-planned economies.
There are several model predictions of global climate change. Some global climate model (GCM) projections have shown that summer soil moisture in large areas of the North American Temperate Zone could be 30 to 60 percent drier, whereas that in Chile and Argentina might be 20 percent, or more, wetter (Fig. 6), based upon a

HUMAN IMPACTS ON ECOSYSTEMS
:;:::-·a; "iii" .c
• CFCS c::: " I!! "iii .c Gi If 0.4 D Nitrous oxide
0.22 () .. .. .. ~ I!!
01 01
• Methane .. .. ~ ~ .. I!! :; " ! D Carbon !
8. 0.2 dioxide 0.11 .. 0..
E E ~ ~ .E .E .. 5! .. a: a:
1950s 1960s 1970s 1980s 1990s 2000s
Fig. 5: Projected fractions of global warming caused by different greenhouse gases to the year 2000 (modified from Revkin 1988). Fracciones del calentamiento global causadas por diferentes gases de ''invernadero" proyecta-das para el aiio 2000.
- 30-60% DRIER
••• 20% DRIER
I i .·<d 10% DRIER
D NOCHANGE
- 20-100% WETTER
Fig. 6: Model results of the effect of a doubling of atmospheric C02 on summer soil moisture in North and South America (modified from Revkin 1988). Resultados de un modelo del efecto de Ia duplicaci6n de Ia concentraci6n de C02 sobre Ia hume-dad del suelo en el verano en Norte y Sudamerica (modificado de Revkin 1988).
601

602 LIKENS
doubling of the carbon dioxide concentra-tion in the atmosphere (Revkin 1988). Many GCM's, however, don't account accurately for the effects of regional geo-graphic barriers, such as the Andes. Alth-ough GCM projections are of uncertain validity, they do raise serious political and economic concerns, as well as concerns about ecologic impacts on North American and South American Temperate ecosys-tems. Given these scenarios about change in the temperature and moisture regime, work is needed on physiological constraints of seeds, seedlings, and plant communities.
Attention to the issue of global climate change (particularly enhancement of green-house warming) has become a type of fad in the U.S. and some other countries. Although global climate change is an ex-tremely important environmental issue, I believe that there should be more emphasis on global environmental change issues. Global environmental change includes, in addition to global climate change, regional-and global-scale problems that exist cur-rently, such as 1) the toxification of the biosphere by metals, pesticides, ozone, acid rain, etc., 2) landscape modification, including fragmentation, desertification, and pollution of water supplies by urbaniza-tion, industry, and agriculture, 3) invasion of exotic species, and 4) loss of species diversity, particularly in tropical regions as a result of human activity (Likens 1991).
Ozone
Another atmospheric component of global environmental change is ozone. There are two kinds of ozone, "good" ozone and "bad" ozone. Good ozone exists at about 20 kilometers above the Earth's surface in the stratosphere, and this ozone absorbs incoming ultraviolet radiation and thereby protects biota at the Earth's surface (Fig. 7). This good ozone is being destroyed by chlorofluorocarbons made by humans (Rowland 1989). The bad ozone accumu-lates at ground level in urban and in-dustrialized areas, in particular as a part of smog formation. It is well known that many urbanized regions of the Northern Hemisphere, e.g., Los Angeles, have very
80
60 E
.>t:
a.i "0 .s 40 <i:
20
0
03, molecules per cc
10 10 1011 1012 1013
• Ozone
······ ...
Mesosphere
······ •••• '' •••••• 0 •••• ••••• ••• '.' ••••••••••••••• ' ••• ' •••••••••
• • • • • Stratosphere
······ ···~ ... -••
oo o o o o o o o o o o o 0 0 I 0 0 0 0 I 0 0 o o o • ., •• !'~, o 0 I 0 0 0 0 0 0 0 0 0 I I o o o o o o o o o o
':. Troposphere .. 0 100 200 300 400 500
Temperature, K
Fig. 7: Generalized vertical profiles of ozone (- - -) and temperature (--) in the atmo-sphere (modified from Ember et al. 1986). Perfiles verticales generalizados de ozono (- - -) y tem-peratura (--) en la atmosfera (modificado de Ember et al. 1986).
high concentrations of ozone, but Sydney, Australia, Santiago, Chile, Johannesburg, South Africa, and other major urban cen-ters in the Southern Hemisphere also have similarly high amounts of air pollution, including ozone. It has been shown from a number of experiments in open-topped growth chambers that ozone can reduce greatly net photosynthesis of plants (Fig. 8).
The recent discovery of the "hole" in the good ozone layer above Antarctica has brought about a new urgency to the problem. Warnings about the destruction of ozone in the stratosphere were made some time ago (Molina & Rowland 197 4, Rowland & Molina 1975), but were ignored by policymakers. Only recently when the ozone hole became known widely and be-came publicized by the news media have the public and the politicians taken the matter seriously (see Likens in press). If the ozone hole were to expand from Antarctica northward into regions above New Zealand, Australia, southern Africa, Argentina, and Chile, this change could be very important in the future in terms of environmental impact in these areas.

HUMAN IMP ACTS ON ECOSYSTEMS 603
2 0
t 10 • .c 1: ,. ..
20 0 0 .c IL
~ 30 z .5 c:
40 0 n "' , .. a: 50
0 5 10 15 20 25 30 35
0 3 Dose (ppm-hr)
Fig. 8: Percent reduction in net photosynthesis, relative to background dose, for increasing dose of ozone. The natural background of ozone might be about 0.01 ppm or a 10-week dose of 5 ppm-hour (Kulp 1987). By comparison, ozone dose "in most of the eastern United States during a 1 0-week period in the summer ranges between 30 to 45 ppm-hour" (modified from Reich & Amundson 1985). Reducci6n porcentual de la fotos{ntesis neta, relativa a la dosis normal, para un aumento en la dosis de ozono. La dosis normal de ozono podrfa ser cerca de 0,01 ppm, o una dosis de 5 ppm por hora durante 10 sernanas (Kulp 1987). A modo de comparaci6n, la dosis de ozono "en la mayor parte de Estados Unidos durante un pe-rfodo de 10 semanas en el verano varia entre 30 y 45 ppm por hora" (segun Reich & Amundson 1985).
Acid rain
Large emissions of sulfur and nitrogem oxides, primarily from tall smokestacks, following the combustion of fossil fuels have led to another major component of global environmental change. The effects of these pollutants in acidifying regional landscapes are well known (e.g., Likens eta/. 1979, Schindler 1988).
Data from lakes in the Adirondack Mountain region of northern New York State in the United States provide and example of the acidification of natural ecosystems from atmospheric deposition (Asbury et a/. 1989). We found 274 lakes in this area that had high quality chemical data from the 1930's that we could com-pare with current data. This comparison showed that 80% of these lakes had become more acid; the median loss of alkalinity during the past 50 to 60 years for these 274lakes was -50 peq/1 (Fig. 9).
60 ... 0
~
~ 40 z
-600 -400 -200 0 200 400 500
Corrected Alkalinity ChanQe (t-eq/1)
Fig. 9: Frecuency distribution of changes in alka-linity between surveys done in 1929-1934 and surveys in 1975-1985 for 274 lakes in the Adi-rondack Mountain region of New York State, USA. The data were corrected for methyl orange overtitration (from Asbury et al. 1989).
Distribuci6n de frecuencias de cambios en la alcalinidad entre muestreos realizados en los periodos 1929-1934 y 1975-1985 en 274 lagos en las montaiias Adirondack, Nueva York, USA. Los datos fueron corregidos para so-bretitulaci6n con naranjo de metilo (segun Asbury et a/. 1989).
All of these lakes did not become more acid, however, only 80% of them did. Some of the lakes even became less acid (Fig. 9). These results illustrate that not all natural systems can be expected to respond in the same way to some general stress. Lakes differ in many respects, for example in depth, in geologic substrate, in clarity, in surrounding vegetation, etc. As a con-sequence, lakes tend to respond indivi-dualistically to an external stress such as acid rain. As ecologists, we are plagued with this variability, and at the same time we are intrigued by it. This kind of variable response of natural ecosystems has been commonly documented in acid rain research in North America and Europe; it is not surprising scientifically, but it is puzzling to the public and to politicians (Likens in press).
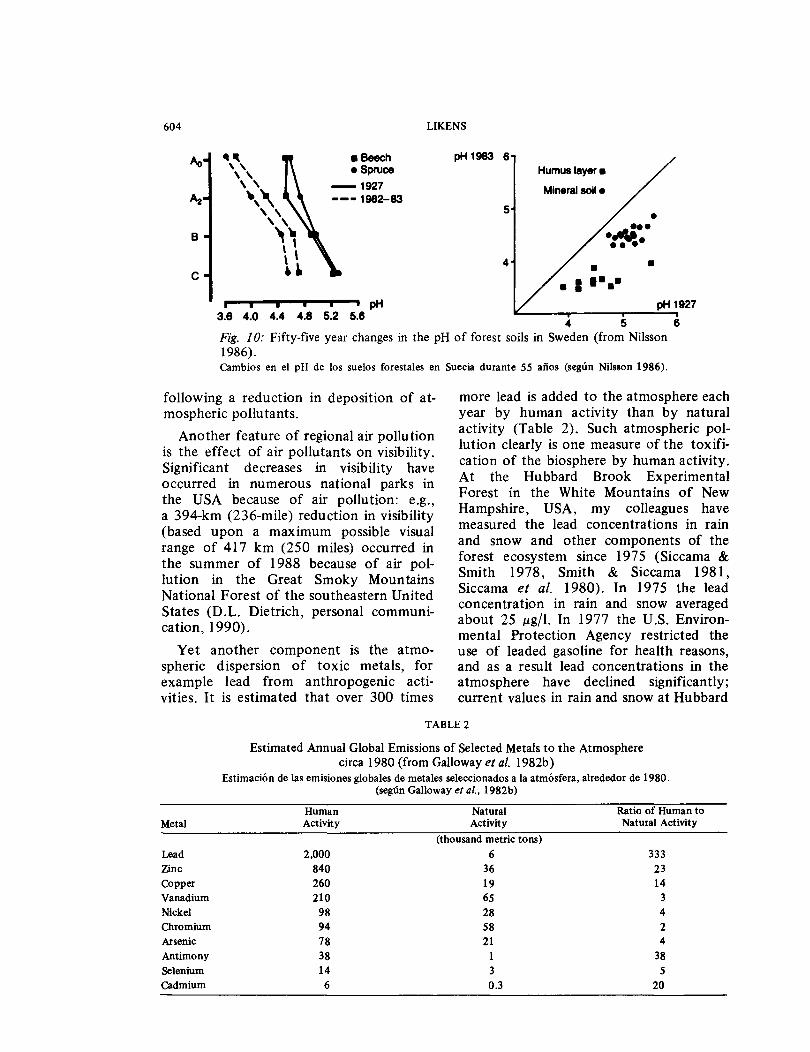
Swedish workers (Hallbacken & Tamm I 986, Tamm & Hallbacken 1986, 1988) have shown an appreciable acidification of forest soils in Sweden during the past 50 to 60 years from atmospheric deposition (Fig. 10). This result is very important ecologically because soils develop slowly, and presumably would recover slowly
604 LIKENS
Ao
~
B
c
~Ill
\ ' \' \ ' ~,,
' ' ' \ .., .. \ ' \ \ ~~
• Beech • Spruce
-1927 ---1982-83
~-P~~-P~~~• pH 3.6 4.0 4.4 4.8 5.2 5.6
pH 1983 6
5
4
Humus layer •
Mineral soil •
• •••• 4 5
•
•
pH 1927 6
Fig. 10: Fifty-five year changes in the pH of forest soils in Sweden (from Nilsson 1986). Cambios en el pH de los suelos forestales en Suecia durante 55 aiios (segun Nilsson 1986).
following a reduction in deposition of at-mospheric pollutants.
Another feature of regional air pollution is the effect of air pollutants on visibility. Significant decreases in visibility have occurred in numerous national parks in the USA because of air pollution: e.g., a 394-km (236-mile) reduction in visibility (based upon a maximum possible visual range of 417 km (250 miles) occurred in the summer of 1988 because of air pol-lution in the Great Smoky Mountains National Forest of the southeastern United States (D.L. Dietrich, personal communi-cation, 1990).
Yet another component is the atmo-spheric dispersion of toxic metals, for example lead from anthropogenic acti-vities. It is estimated that over 300 times
more lead is added to the atmosphere each year by human activity than by natural activity (Table 2). Such atmospheric pol-lution clearly is one measure of the toxifi-cation of the biosphere by human activity. At the Hubbard Brook Experimental Forest in the White Mountains of New Hampshire, USA, my colleagues have measured the lead concentrations in rain and snow and other components of the forest ecosystem since 1975 (Siccama & Smith 1978, Smith & Siccama 1981, Siccama et al. 1980). In 1975 the lead concentration in rain and snow averaged about 25 J.J.g/1. In 1977 the U.S. Environ-mental Protection Agency restricted the use of leaded gasoline for health reasons, and as a result lead concentrations in the atmosphere have declined significantly; current values in rain and snow at Hubbard
TABLE 2
Metal
Lead Zinc Copper Vanadium Nickel Chromium Arsenic Antimony Selenium Cadmium
Estimated Annual Global Emissions of Selected Metals to the Atmosphere circa 1980 (from Galloway eta/. 1982b)
Estimaci6n de las emisiones globales de metales seleccionados a Ia atmosfera, alrededor de 1980. (segun Galloway et al., 1982b)
Human Natural Ratio of Human to Activity Activity Natural Activity
(thousand metric tons) 2,000 6 333
840 36 23 260 19 14 210 65 3
98 28 4 94 58 2 78 21 4 38 38 14 3 5 6 0.3 20

HUMAN IMPACTS ON ECOSYSTEMS 605
Brook average about 2 J,LgPb/1 (Fig. 11). This reduction in the dispersal of a toxic metal throughout the landscape of the United States is an environmental success story in which the effects of governmental regulation, which reduced the use of lead in gasoline- and additive that we do not need-can be seen in the rainfall chemistry of a remote area. On the other hand, the United States is now exporting more lead additives on a yearly basis to developing countries than we ever burned annually in the United States (J. Nriagu, personal communication, September 1989).
Forest decline
The effects of air pollutants on forests is varied and complicated (Table 3). Alth-ough controversial, the effects in Europe have been described as large and increasing (Table 4). Critical questions include whether this damage has occurred because of an thro-pogenic pollutants, and whether the da-mage is outside the range of change that is normal. A common problem is that we ecologists frequently do not have enough
data to discriminate between pollution-generated change and normal forest dy-namics. Thus, long-term, baseline informa-tion is vital in determing whether damage (change) is pollution initiated or pollution enhanced, or is simply a part of the natural variation. What is caused by humans and what is caused by nature? We need to give confidence limits for our answers to policymakers.
Eutrophication of surface waters
The problems of eutrophication of aquatic ecosystems are not new, but continue to be varied and complex (e.g., Hasler 1947, Likens 1972, Hutchinson 1973). When freshwaters are enriched with nutrients, plant growth may become excessive, to levels that humans find undesirable unless they want to grow carp in a fish pond. In that latter case, eutrophication is not viewed as bad; it is desirable. What is meant by "bad" or "good", and what do we want? And who is "we", and how does "we" relate to people in developed versus developing countries?
Lead Concentration in Precipitation 1975-88
Hubbard Brook, New Hampshire
55
45
35 Pb cone. ~/1)
25
15
5
0 funding hkrtuo ~ ~
Feb. '75 Dec. '79 Sept. '81 March '88
Time
Fig. 11: Concentration of lead in precipitation at the Hubbard Brook Experimental Forest, New Hampshire, USA, from 1975 to 1988 (data from T.G. Siccama). Concentraci6n de plomo en Ia precipitaci6n en el Bosque Experimental de Hubbard Brook, New Hampshire, USA, desde 1975 a 1988 (datos de T.G. Siccama).

606 LIKENS
TABLE 3
Primary agents causing forest decline (ranked in order of importance) (modified from Hinrichsen 1986)
Principales agentes causantes de Ia declinacion de bosques (ordenados de acuerdo a su importancia)
(modificado de Hinrichsen 1986)
EASTERN EUROPE: 1. Gaseous pollutants (e.g., S02 and NOx) 2. Ozone 3. Acid deposition, particularly cloud water and fog 4. Toxic metals
WESTERN EUROPE: 1. Ozone 2. Acid deposition, particularly cloud water and fog 3. Excess nitrogen 4. Growth-altering organic chemicals
NORTH AMERICA: 1. Ozone 2. Input of nitrogen 3. Other phytotoxic gases 4. Toxic metals 5. Acid deposition 6. Growth-altering organic chemicals
Another recent feature of widespread environmental change is the increased concentrations of nitrate in surface waters. High concentrations are appearing throuhg-out the heavily industrialized and popul-ated parts of the Earth. Some recent anal-
yses done by scientists at the Institute of Ecosystem Studies show that there is a strong correlation between the density of people living in a catchment and the nitrate concentrations (or export) in river waters (Peierls et a/. 1991 ). This is another example of the human multiplier effect.
Lake Vattern, the second largest lake in Sweden, is an oligotrophic lake, similar to many of the lakes in Patagonia, Chile. Recent data show that there has been a steady increase in nitrogen concentrations in Lake Vattern since about 1965 when measurements were begun (Fig. 12). The causes of this long-term increase are un-clear, but may be the result of increased use of nitrogenous fertilizers for agri-culture, increased sewage, and possibly increased amounts of nitrogen from at-mospheric deposition (Persson et a/. 1989, Fisher & Oppenheimer in press).
Pesticides
Data from Lake Vattern also show long-term changes in the DDT and PCB con-centrations (Fig. 13). Decline in DDT and PCB's in the Lake are correlated with Sweden's ban on the use of both PCB 's and DDT. This is another environmental success story, in which the effects of go-
TABLE4
Estimated forest damage in Europe, 1988 (modified from French 1990a) Estimaci6n del area de bosque dafiado en Europa, 1988
Country or Area
Czechoslovakia Greece United Kingdom West Germany Norway Poland East Germany Switzerland Finland Sweden Estonia and Lithuania Spain France
Total (Europe)
(modificado de French 1990a)
Estimated Area damaged
(thousand hectares)
3,250 1,302 1,408 3,827 2,963 4,240 1,300
510 7,823 9,243 1,313 3,656 3,321
49,647
Percent of Total
71 64 64 52 50 49 44 43 39 39 36 31 23
35

(mg Nl 1)
'0 :::E
0 ROtl z w Cl 0 100 0 a: !::: 0 600 z w 0 ~00 ... "" a: 0 400 !::: z
0 300 0 z "" 0 200 ....i
"" 0000 ... 0 ... 65 70 75
YEAR
HUMAN IMPACTS ON ECOSYSTEMS 607
80 85
vernmental regulation can be seen in lower-ed levels of a toxic chemical in the en-
•o• N vironment.
Erosion
90
(from Persson, G., et a!. 1989. Ambio 18:208-215)
The effects of increased deforestation, agriculture, and/or grazing accelerate ero-sion (e.g., Likens & Bormann 1974). Such patterns are common throughout both North and South Temperate regions. Changes in human population density, climate, and/or land use will undoubt-edly exacerbate these problems in the fu-ture. Relative impacts from projected global climate change patterns (e.g., Fig. 6) could differ appreciably between North and South Temperate ecosystems. Fig. 12: Median concentrations for total nitrogen
and nitrate-nitrogen during the growing season in Lake Vattern, Sweden (modified from Persson eta/. 1989). Concentraciones medias para nitr6geno total y nitratos durante Ia estaci6n de crecimiento en Lago Vattern, Suecia (modificado de Persson et al. 1989).
lmg l<g -II
Acid deposition- A case study
I want to focus briefly on acid deposition from the atmosphere as an example of a regional/global-scale problem, and will use
6~--------------------------------------~
Food u 5 -- ----- -T- - -- ------- -- - -- - - - -- criterium z I 0 u 4 CD u n. 3-"0 c Ia
.... 0 0
2
I I
T I I I
f t I' I l. I
I
: ii II k j_ 0~-r~~~--r=T-~~~-r~-,~~r-r-~~~~~~
1965 70 75 80 85
YE·AR
(from Persson, G., et al. 1989. Ambio 18:208-215)
Food criterium
Fig. 13: Concentrations of DDT and chlorinated biphenyls (PCB's) in arctic char from Lake Vattern, Sweden. Broken lines represent DDT and solid lines PCB. Means are shown by dots, and range of variation is shown by vertical bars (from Persson eta/. 1989). Concentraciones de DDT y bifeniles clorinados (PCB) en turba artica del Lago Vattern, Suecia. Las lineas cortadas representan el DDT y las lineas continuas el PCB. Las medias estan indica-das por puntos y el rango de variaci6n por las barras verticales (segun Persson et al. 1989).

608 LIKENS
results from the Hubbard Brook Ecosys-tem Study in New Hampshire to illustrate a few major points.
The volume-weighted, average annual hydrogen ion concentration in precipita-tion has decreased since 1963 when we began our studies; thus the rain and snow now are somewhat less acid than they were 2 7 years ago when we began our research at Hubbard Brook (Fig. 14). The decline in H+ is correlated with a decline in sulfate concentrations. In turn the sulfate decline is correlated with a decrease in emissions of sulfur dioxide in the USA because of Federal regulations (Likens et al. 1984, Hedin et al. 1987, Butler & Likens 1991). There have been other long-term changes in the chemistry of precipitation at Hub-bard Brook as well (e.g., Likens et al. 1984, Driscoll et al. 1989). The Hubbard Brook record is particularly interesting because it represents the longest record of precipitation chemistry in North America.
There have been many short-term pat-terns within the long-term trend of H+ concentration at Hubbard Brook (Likens 1989a, Fig. 14). Indeed, it required 18 years before a statistically significant linear regression line could be fitted to these long-term data (Fig. 15). Without such long-term data, it frequently is not possible to determine an actual overall pattern.
We scientists, and particularly graduate students, normally do studies lasting for three, four, or five years. Because of the relatvely large investment of time and energy (relative to our life span) in these studies, it often is presumed that the natural world functions like that discover-ed during this three- to five-year period. Obviously these short-term patterns may not describe the overall (long-term) pat-tern. Such a conclusion shouldn't imply that short-term research isn't important; it is important. However, short-term research may be misleading about how natural ecosystems function in the long-term.
As part of the Global Precipitation Chemistry Project (GPCP), my colleagues and I have located sites in the Southern Hemisphere that were as clean as we
could find (Galloway et a!. 1982a). These "remote" sites-remote from human acti-vity-are used to collect samples to obtain a baseline for precipitation chemistry. Using this baseline, we then could deter-mine how much change had occurred in urbanized and industrialized areas of the Northern Hemisphere since the Industrial Revolution. We have established several such sites, including a site in Torres del Paine, Chile (Galloway eta!. 1982a, Likens eta!. 1987).
We found that the precipitation che-mistry at these remote sites had much lower average concentrations of sulfate, nitrate, and hydrogen ions than did sites in eastern North America (Fig. 16). This comparison provides some indication of how much anthropogenic pollution has occurred in the atmosphere of easte,rn North America.
One of the GPCP studies focused on The People's Republic of China (Galloway et a!. 1987). We found that in some loca-tions in China, particularly urban sites, the sulfate levels in rainfall were very high, much higher in fact than in New York City, which is quite polluted. Yet, the acidity of rainfall at these sites in China was not unusually_ high, and was not as acid as New York City. This discrepancy occurred because currently the presence of high concentrations of particles contain-ing base cations, like calcium, in rainfall neutralized the acidity in China. The par-ticulate matter originates from the in-complete combustion of soft coal (soot) and from soil particles, and these par-ticles themselves represent a serious air pollution problem (Galloway et al. 198 7, Zhao & Sun 1986a, 1986b ). Thus, a de-veloping country like China with high levels of so2' and high levels of particulate matter (Table 5) has a serious dilemma. Because cleaning up the particle problem could produce a major acid rain problem, the Chinese seem to have a choice: choose between an acid rain problem or a soot problem. Atmospheric particle pollution was one of the first issues that was attack-ed by Federal regulation in the United States through the Clean Air Act of 1970. Thus, developing countries have some very important choices relative to risks and

HUMAN IMPACTS ON ECOSYSTEMS
90
80 -0'" Cll :::1.
70 c -~ - 60 a ... -c Cll
50 u c 0 u
+ 40 :I:
30 0 1965 1970 1975 1980 1985
Year
Fig. 14: Annual, volume-weighted concentration (J.teq/1) of hydrogen ion for Watershed 6 of the Hubbard Brook Experimental Forest, New Hampshire, USA, during 1964-1965 to 1986-1987. The long-term regression line has a probability for a larger F-value of< 0.05; r2 = 0.57 (Y = -1.45X +79.4). The shorter, dashed lines are fitted by eye (from Likens 1989a ). Concentraci6n (}.leq/1) anual, ponderada por volumen, de ion hidr6geno en la Cuenca N° 6 del Bosque Experimental de Hubbard Brook, New Hampshire, USA, desde 1964-65 hasta 1986. 87. La linea de regresi6n para todo el per{odo tiene una probabilidad menor a 0,05; r 2 =0,57 (Y=-1 ,45X+ 79,4). Las Hneas punteadas mas cortas est:hi ajustadas a ojo (de Likens 1989a).
30 28 26 24 22 20
Q) 18 ::J 16 «< > 14 I
LL 12 10
8 6 4 2 0
0 4 8 12 16 20 24 Number of Years of Record
Fig. 15: Critical values of the F -distribution ( •- •) for a linear regression at a pro-bability of < 0.05 and calculated F -values (•- •) for an increasing record of actual data (1964-1965 to 1986-1987) for annual, volume-weighted hydrogen-ion con-centrations in precipitation for Watershed 6 of the Hubbard Brook Experimental Forest, New Hampshire, USA (from Likens 1989a). Valores cr{ticos de la distribuci6n de F (e-e) para una regresi6n lineal, probabilidad menor a 0,05 y valores de F calculados (•-• ) para una cantidad creciente de registros (1964-1965 a 1986-1987) de concentracion anual de iones hidrogeno, ponderada por volumen, en Ia precipi-taci6n en Ia Cuenca NO 6 del Bosque Experimental de Hubbard Brook, New Hampshire, USA (de Likens 1989a).
609

610 LIKENS
'";;' .. .. = .....
! a 0 ~ b a 8 8
80
60
40
20
0
80
60
40
20
0
40
30
20
10
0
NO~
SC PF KA AI BD WH IT PS CV IL
Remote Areas Eastern North America
Fig. 16: Volume-weighted mean concentrations with 95% confidence intervals for five sites in re-mote areas and five sites in the eastern United States. Remote areas: [SC = San Carlos, Venezue-la (n = 14); PF = Poker Flat, Alaska (n = 22); KA =Katherine, Australia (n = 125); AI= Ams-terdam Island, Indian Ocean (n = 73); BD = Ber-muda, Atlantic Ocean (n = 23)). Eastern North America: [WH = Whiteface Mountain, New York (n = 329); IT = Ithaca, New York (n = 295); PS = State College, Pennsylvania (n = 373); CV = Charlottesville, Virginia (n = 239); and IL = Champaign, Illinois (n = 186)] (modified from Galloway et al. 1984). Concentraciones medias de iones, ponderadas por volu-men, con sus intervalos de confianza (95%) para cinco sitios en areas remotas y cinco sitios en el este de Estados Unidos. Areas remotas: SC = San Carlos, Venezuela (n = 14); PF = Poker Flat, Alaska (n = 22); KA = Katherine, Australia (n = 125); AI= Amsterdam Island, Indean Ocean (n = 73); BD = Bermuda, Atlantic Ocean (n = 23). Este de Norteamerica: WH =Whiteface moun-tain, New York (n = 329); IT = Ithaca, New York (n = 295); CV =Charlottesville, Virginia (n = 239);and IL =Champaign, Illinois (n = 186). (Modificado de Galloway et al. 1984).
TABLES
Violations of sulfur dioxide and suspended particulate matter standards for selected cities
during 1980-1984 (modified from French 1990b) Violaci6n de los niveles estandar de di6xido de
azufre y material particulado en ciudades seleccionadas durante 1980-1984 (modificado de French 1990b)
City
Xi an Beijing Shenyang New York
Number of days above standard
S02aj Particulatesb/
72 68
146 8
273 272 219
0
a/ WHO Standard is a daily average of 150 JJgjm3 .
b/ WHO Standard is a daily average of 230 JJ.jfm 3
for suspended particulates and 150 JJg/m for smoke.
trade-offs, although the answer doesn't need to be either/or; obviously both airborne particulates and acid deposition could be reduced at the same time.
The rainfall at Torres del Paine, Chile, has a pH of about 5.1. The predominant movement of air from the West (from the sea) to Torres del Paine adds much oceanic sodium and chloride to the chemistry of rainfall. The average chemistry of pre-cipitation of Torres del Paine is given in Table 6. A reasonable background pH for unpolluted atmosphere is about 5 .I, with low concentrations of sulfate and nitrate (see Likens et a/. 1987). Torres del Paine is an exceptionally clean site relative to anthropogenic pollutants in precipitation compared to other remote sites in the Southern Hemisphere (Kathe-rine, Australia, and Amsterdam Island in the Indian Ocean) and particularly re-lative to a rural, forested site in the north-eastern United States (Table 6).
We also have measured the chemistry of cloudwater and fogwater throughout the contiguous United States, Alaska, and Puerto Rico. We found that cloudwater and fogwater generally were enriched in acidity, nitrate, sulfate, and toxic metals (Weathers et al. 1986, 1988a, 1988b). For example, mean concentrations of H+ in cloudwater and fogwater were approxi-mately 3 to 7 times higher than in rainfall

HUMAN IMPACTS ON ECOSYSTEMS 611
TABLE6
Volume-weighted concentrations in precipitation (J..teq/liter) for various remote sites of the Southern Hemisphere and for Hubbard Brook, USA (modified from Likens eta/. 1987)
Concentraciones (ponderadas por volumen) en la precipitaci6n (peqfl) de varios sitios remotos del hemisferio sur yen Hubbard Brook (modificado de Likens et al., 1987)
Torres del Paine, Katherine, Amsterdam Hubbard Brook, Ion Chilea Australiab Islandc USAd
so; 4.4 No,- 0,5 H+ 4.9 NH: 0.7 ea·· l.2 Mg++ 4.3 Ct 21.9 K+ 1.4 Na• 18.7
Sample No. 23
a 1984-1985 b 1980-1984 c 1980-1983 d 1963-1980
occurring at the same site and at the same time (Weathers 1988a).
Cloudwater concentrations of hydrogen ion, sulfate, and nitrate in the eastern United States are enriched up to hundreds of times over rainwater at remote locations (see Likens 1987). We have limited data on cloudwater in Torres del Paine, but both ammonium and H+ seem to be enriched relative to rainwater. The chemistry of cloudwater and fogwater potentially has significant ecological implications for ve-getation growing in areas subjected to moisture from these sources, both as sources of nutrients (e.g., N03) and/or pollutants.
It has been estimated that when wet and dry deposition are added together, the total atmospheric input of nitrogen equals about 2 KgN/ha-yr in remote regions (Galloway 1985). The wet plus dry depo-sition of sulfur would be about 3 KgS/ ha-yr (Galloway 1985). Critical limits of deposition have been set to protect sen-sitive ecosystems, both aquatic and ter-restrial, that might be subjected to atmo-
3.9 31.9 54 4.0 1.4 24
18.3 9.0 70 2.9 2.0 11 1.7 9.8 6.5 1.3 50.2 3.3 7.7 262 11 0.9 4.9 1.5 4.3 225 4.8
147 79 > 750
spheric deposition (Nilsson & Grennfelt 1988). The limits for N range between 5 and 15 Kg/ha-yr, and the value for S is > 32 to < 3 Kg/ha-yr, depending upon the geology and soils. Total atmospheric deposition of sulfur in the northeastern United States currently is 3 to 6 times greater than these acceptable levels (see Likens 1989b ). In contrast, atmospheric inputs to Torres del Paine, and probably much of Chile, are currently below the < 3 Kg limit-that is, most ecosystems in Chile are not being degraded now from atmospheric pollution. But because it is not possible to protect Chile by building a fence around the country, will it stay unpolluted in the future? It will be bom-barded by all of the pollutants that can move readily through the regional and global atmosphere. With increased numbers of people and increased industrial activity in the Southern Hemisnere, atmospheric deposition of N, S, and metals inevitably will increase. Galloway ( 1989) has esti-mated that emissions of S may increase by as much as fourfold and N by sevenfold

612 LIKENS
by 2020 over 1980 values in South America. Then as a result, it is safe to predict that Southern Temperate ecosystems will change from both of these local and "re-mote" atmospheric influences.
The GPCP sites in the Southern Hemi-sphere currently are providing very im-portant comparative baseline information for what is happening in the Northern Hemisphere and what could happen in the Southern Hemisphere in the future.
Policy
Two final points. In the book, Our Common Future (Brundtland 1987), it was estimated that countries of the world spend about $ 900 billion (USA, 1985) each year for military security. That amount represents about US$ 2.5 billion each day to protect ourselves from some real or imagined enemy. In comparison, this Brundtland report calculated that an action plan to protect tropical forests would be equivalent to one-half day of these annual military expenses (Table 7). Rectifying the lack of clean water in the Third World would be equivalent to ten days of global military expenditure. I calculated that it would cost an equi-valent of two days of the annual military expenditures to deal with the acid rain problem in the United States and three days for the European Common Market countries. As Robert MacNamara, former head of the World Bank, said recently in a
talk to the National Press Club in Wash-ington, D.C., "We can afford to clean up our environment''. We have enough money to do it; however, there is a critical need to set priorities for the betterment of humankind.
Recently at a Cary Conference on Long-Term Studies in Ecology, a statement in support of sustained ecological research was adopted by the participants (see Li-kens 1989c). This statement proposed a partnership: "Because they have common long-term goals, we propose a new partner-ship between scientists and resource ma-nagers. Elements of this partnership include:
1. Agreement by scientists to answer the questions put to them by managers, while making clear the level of uncertainty that exists and what additional research needs to be done.
2. Agreement by managers to give serious consideration to these answers and to sup-port the continuing research toward bet-ter answers.
Sustained Ecological Research supported by this new partnership can contribute significantly to the resolution of critical environmental problems" (Likens 1989c). The complexity and the uncertainty aso-sociated with large-scale environmental problemas, such as global environmental change, clearly demands the full talents of scientists and manager working together over sustained periods. Comparative ecology is an important research tool for this partnership.
TABLE 7
Spending on military versus environmental security (modified from Brundtland 1987)
Gasto militar versus seguridad ambiental (modificado de Brundtland 1987)
Environmental problems
Action plan for tropical forests Lack of clean water in
Third World Acid rain-halving emissions
of S02 and NOX - Eastern USA - European EEC
Cost to ameliorate
(US$ x 10 9 /yr)
1.3
30
6 5-7
Equivalent annual Military expenditure*
(Days)
0.5
10
2 3
*The world spend over US$ 900 x 109 on military purposes in 1985, more than US$ 2.5 x 10⁹ /day.
HUMAN IMPACTS ON ECOSYSTEMS 613
ACKNOWLEDGMENTS
This is a contribution to the program of the Institute of Ecosystem Studies and to the Hubbard Brook Ecosys-tem Study. I am grateful for financial support from the National Science Foundation and the Andrew W. Mellon Foundation. The Hubbard Brook Experimental Forest is operated and maintained by the USDA Forest Service, Radnor, Pennsylvania. The Global Precipitation Chemistry Project is funded by the National Oceanic and Atmo-spheric Administration. Steward T.A. Pickett provided helpful comments on a draft of this manuscript.
LITERATURE CITED
ASBURY CE, FA VERTUCCI, MD MATTSON & GE LIKENS (1989) Acidification of Adirondack lakes. Environmental Science & Technology 23: 362-365.
AUSTRALIAN SOCIETY OF LIMNOLOGY NEWS-LETTER 27(1): 12 (1989).
BORMANN FH (1976) An inseparable linkage: conserva-tion of natural ecosystems and the conservation of fossil energy. BioScience 26:754-760.
BRUNDTLAND GH (1987) Our common future. Oxford University Press, New York.
BUTLER TJ & GE LIKENS (1991) The impact of chang-ing regional emissions on precipitations chemistry in the eastern United States. Atmospheric Envi-ronment 25A(2): 305-315.
CICERONE RJ & RS OREMLAND (1988) Biogeoche-mical aspects of atmospheric methane. Global Biogeochemical Cycles 2(4): 299-327.
DRISCOLL CT, GE LIKENS, LO HEDIN, JS EATON & FH BORMANN (1989) Changes in the chemistry of surface waters: 25-year results at the Hubbard Brook Experimental Forest, New Hampshire. Environmental Science & Technology 23: 137-143.
EMBER LR, PL LAYMAN, W LEPKOWSKI &PSZUER (1986) The changing atmosphere. Tending the global commons. Chemical and Engineering News 64(47): 14·64.
FISHER D & M OPPENHEIMER (in press) Atmospheric nitrogen deposition and the Chesapeake Bay Estuary. Ambio.
FRENCH HF (1990a) Clearing the air: a global agenda. Worldwatch Paper 94.
FRENCH HF (1990b) Clearing the air. In: State of the world 1990: 98-118. Worldwatch Institute Report. W.W. Norton and Co., New York.
FULKERSON W, SI AUERBACH, AT CRANE, DE KASH, AM PERRY, DB REISTER & CW HAGAN, Jr (1989) Energy technology R&D: what could make a difference? (A study by staff of the Oak Ridge National Laboratory, Oak Ridge, Ten-nessee.) ORNL-6541/Vl.
GALLOWAY JN (1985) The deposition of sulfur and nitrogen from the remote atmosphere. Background paper. In: Galloway JN, RJ Charlson, MO An-dreae & H Rohde (eds.) The biogeochemical cycling of sulfur and nitrogen in the remote atmosphere: 143-175. D. Reidel Publishing Company, Dor-drecht.
GALLOWAY JN (1989) Atmospheric acidification: projections for the future. Ambio 18(3): 161-166.
GALLOWAY JN, GE LIKENS & ME HAWLEY (1984) Acid precipitation: natural versus anthropogenic components. Science 226: 829-831.
GALLOW.t\.Y JN, ZHAO DIANWU, XIONG JILING & GE LIKENS (1987) Acid rain: a comparison of China, United States and a remote area. Science 236: 1559-1562.
GALLOWAY JN, GE LIKENS, WC KEENE & JM MIL-LER (1982a) The composition of precipitation in remote areas of the world. Journal of Geophy-sical Research 87: 8771-8786.
GALLOWAY JN, JD THORNTON, SA NORTON, HL VOLCHOK & RAN McLEAN (1982b) Trace metals in atmospheric deposition: a review and assessment. Atmospheric Environment 16(7): 1677-1700.
GAMMON RH, ET SUNDQUIST & PJ FRASER (1985) History of carbon dioxide in the atmosphere. In: Trabalka JR (ed.) Atmospheric carbon dioxide and the global carbon cycle. U.S. Department of Energy DOE/ER-0239, Washington, D.C.
GLEICK PH (1989) Climate change and international politics: problems facing developing countries. Ambio 18(6): 333-339.
HALLBACKEN L & CO TAMM (1986) Changes in soil acidity from 1927 to 1982-84 in a forest area of south-west Sweden. Scandinavian Journal of Forest Research 9: 219-232.
HASLER AD (194 7) Eutrophication of lakes by domestic drainage. Ecology 28: 383-395.
HEDIN LO, GE LIKENS & FH BORMANN (1987) Decrease in precipitation acidity resulting from decreased SO/ concentration. Nature 325: 244-246.
HINRICHSEN D (1986) Multiple pollutants and forest decline. Ambio 15(5): 258-265.
HUTCHINSON GE (1973) Eutrophication. The scientific background of a contemporary practical problem. American Scientist 61: 269-279.
KEELING CD (1960) The concentration and isotopic abundances of carbon dioxide in the atmosphere. Tellus 12: 200-203.
KEELING CD (1973) Industrial production of carbon dioxide from fossil fuels and limestone. Tellus 28:174-198.
KULP L (1987) Interim assessment. The causes and ef-fects of acidic deposition. Volume I. Executive summary. National Acid Precipitation Assessment Program. Washington, D.C.
LIKENS GE, ed. (1972) Nutrients and eutrophication. The limiting nutrient controversy. Special Sym-posia, Vol. I. American Society of Limnology and Oceanography. Lawrence, Kansas.
LIKENS GE (1987) Chemical wastes in our atmosphere -an ecological crises. Industrial Crisis Quarterly 1(4): 13-33.
LIKENS GE (1989a) Some aspects of air pollution ef-fects on terrestrial ecosystems and prospects for the future. Ambio 18(3): 172-178.
LIKENS GE (1989b) Acid rain and its effects of sediments in lakes and streams. Hydrobiologia 176/177: 331-348.
LIKENS GE, ed. (1989c) Long-term studies in ecology. Approaches and alternatives. Springer-Verlag New York, Inc.
LIKENS GE (1991) Human-accelerated environmental change. BioScience 41(3): 130.
LIKENS GE (in press) Toxic winds: whose responsibility? In: Bormann FH & SR Kellert (eds.) Ecology, economics, ethics: the broken circle. Yale Uni-versity Press, New Haven, Connecticut.
LIKENS GE & FH BORMANN (1974) Linkages be-tween terrestrial and aquatic ecosystems. Bio-Science 24: 447-456.
614 LIKENS
LIKENS GE, WC KEENE, JM MILLER & JN GALLO-WAY (1987) Chemistry of precipitation from a remote, terrestrial site in Australia. Journal of Geophysical Research 92: 13,299-13,314.
LIKENS GE, RF WRIGHT, JN GALLOWAY & TJ BUTLER (1979) Acid rain. Scientific American 241 (4 ): 43-51.
LIKENS GE, FH BORMANN, RS PIERCE, JS EATON & RE MUNN (1984) Long-term trends in preci-pitation chemistry at Hubbard Brook, New Hamp-shire. Atmospheric Environment 18: 2641-2647.
MARLAND G (1989) Fossil fuels co. emissions: three countries account for 50% in 1986. Carbon Dioxide Information Analysis Center Communica-,tions, Oak Ridge National Laboratory (Winter), oak Ridge, Tennessee.
MERRICK TW (1986) World population in transition. Population Bulletin 41 (2 ).
MOLINA MJ & FS ROWLAND (1974) Stratospheric sink for chlorofluoromethanes: chlorine atom-catalysed destruction of ozone. Nature 249: 810-812.
NILSSON J (1986) Soil is vulnerable too. Acid Maga-zine4/Autumn: 24-27.
NILSSON J & P GREEN FELT, eds. (1988) Critical loads of sulphur and nitrogen. Nordic Council of Ministers, Gotab, Sweden.
PEIERLS BL, NF CARACO, ML PACE & JJ COLE (1991) Human influence on river nitrogen. Nature 350: 386-387.
PERSSON G, H OLSSON, T WIEDERHOLM & E WIL-LEN (1989) Lake Vattern, Sweden: a 20-year perspective. Ambio 18.(4): 208-215.
REICH PB & RG AMUNDSON (1985) Ambient levels of ozone reduce net photosynthesis in tree and crop species. Science 230: 566-570.
REVKIN AC (1988) Endless summer: living with the greenhouse effect. Discover 9(10): 50-61.
ROWLAND FS (1989) Chlorofluorocarbons and the de-pletion of stratospheric ozone. American Scientist 77(1): 36-45.
ROWLAND FS & MJ MOLINA (1975) Chlorofluoro-methanes in the environment. Reviews of Geo-physics and Space Physic 13: 1-35.
SCHINDLER DW (1988) Effects of acid rain on Fresh-water ecosystems. Science 239: 149-157.
SICCAMA TG & WH SMITH (1978) Lead accumulation in a northern hardwood forest. Environmental Science & Technology 12:593-594.
SICCAMA TG, WH SMITH & DLMADER (1980)Changes in lead, zinc, copper, dry weight and organic mat-ter content of the forest floor of white pine stands in central Massachusetts over 16 years. Environ-mental Science& Technology 14:54-56.
SMITH WH & TG SICCAMA (1981) The Hubbard Brook Ecosystem Study: biogeochemistry of lead in the northern hardwood forest. Journal of Environmen-tal Quality 10: 323-333.
TAMM CO & L HALLBACKEN (1986) Changes in soil pH over a 50-year period under different forest canopies in SW Sweden. Water, Air and Soil Pollution 31: 337-341.
TAMM CO & L HALLBACKEN (1988) Changes in soil acidity on two forest areas with different acid deposition: 1920's to 1980's. Ambio 17(1): 56-61.
WEATHERS KC, GE LIKENS, FH BORMANN, JS EAT-ON, WB BOWDEN, J ANDERSEN, DA CASS, JN GALLOWAY, WC KEENE, KD KIMBALL, P HUTH & D SMILEY (1986) A regional acidic cloud/fog water event in the eastern United States. Nature 319: 657-659.
WEATHERS KC, GE LIKENS, FH BORMANN, SH BICK-NELL, BTBORMANN,BC DAUBE Jr, JS EATON, JN GALLOWAY, WC KEENE, KD KIMBALL, WH McDOWELL, TG SICCAMA, D SMILEY & R TARRANT (1988a) Cloudwater chemistry from ten sites in North America. Environmental Science & Technology 22: 1018-1026.
WEATHERS KC, GE LICKENS, FH BORMANN, JS EATON, KD KIMBALL, JN GALLOWAY, TG SICCAMA & D SMILEY (1988b) Chemical con-centrations in cloud water from four sites in the eastern United States. In: Unsworth MH & D Fow-ler (eds.) Acid deposition at high elevation sites: 345-357. Kluwer Academic Publishers, Dordrecht.
ZHAO D, B SUN (1986a) Atmospheric pollution from coal combustion in China. Journal of the Air Polu-lution Control Association 36(4): 371-374.
ZHAO D, B SUN (1986b) Air pollution and acid rain in China. Ambio 15{1): 2-5.