some complicating factors in understanding … ross.mckitrick.googlepages.com 1 some complicating...
TRANSCRIPT
1
ross.mckitrick.googlepages.com 1
Some complicating factors in understanding climate change and making policy plans
Ross McKitrickDept of EconomicsUniversity of GuelphFebruary 2008

2
ross.mckitrick.googlepages.com 2
About me
� Associate professor of economics, specializing in environmental economics
� Coauthor, Taken By Storm
� Published in economics journals, as well as Climate Research, Geophysical Research Letters, Journal of Non-Equilibrium Thermodynamics, Journal of Geophysical Research
� Participant in 2006 US National Academy of Science Review of Paleoclimatology methods

3
ross.mckitrick.googlepages.com 3
Outline
� What do we mean by “global warming”
� How do measurements compare to predictions?
� Why isn’t it a simple issue?
� Underlying theory
� Measurement problems
� What should we do about it?

4
ross.mckitrick.googlepages.com 4
What do we mean by “global warming”?
� “Since the late 1960s, much of the North Atlantic Ocean has become less salty, in part due to increases in fresh water runoff induced by global warming, scientists say."
-Michael Schirber, LiveScienceJune 29, 2005
� “The surface waters of the North Atlantic are getting saltier, suggests a new study of records spanning over 50 years. They found that during this time, the layer of water that makes up the top 400 metres has gradually become saltier. The seawater is probably becoming saltier due to global warming, Boyer says."
-Catherine Brahic, New ScientistAugust 23, 2007

5
ross.mckitrick.googlepages.com 5
What do we mean by “global warming”?
� 2 recent reports help clarify:
� Intergovernmental Panel on Climate Change 2007
� US Climate Change Science Program 2006
� Both identify the key regions for observing GHG-induced warming:
Sources
IPCC Working Group I 4th Assessment Report (AR4)
http://www.ipcc.ch/ipccreports/ar4-wg1.htm
CCSP Report
http://www.climatescience.gov/Library/sap/sap1-1/finalreport/default.htm
6
ross.mckitrick.googlepages.com 6
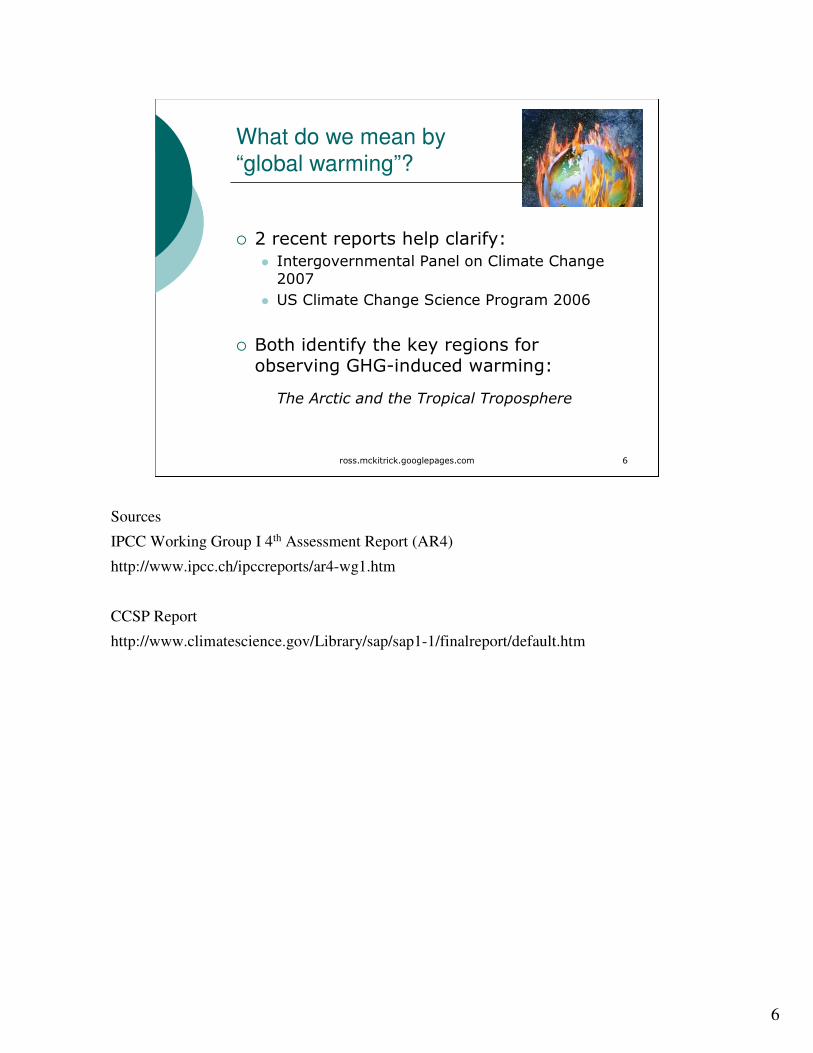
What do we mean by “global warming”?
� 2 recent reports help clarify:
� Intergovernmental Panel on Climate Change 2007
� US Climate Change Science Program 2006
� Both identify the key regions for observing GHG-induced warming:
The Arctic and the Tropical Troposphere
Sources
IPCC Working Group I 4th Assessment Report (AR4)
http://www.ipcc.ch/ipccreports/ar4-wg1.htm
CCSP Report
http://www.climatescience.gov/Library/sap/sap1-1/finalreport/default.htm

7
ross.mckitrick.googlepages.com 7
Tropical troposphere
� 1-16 km above the surface
� 30N to 30S
� Half the atmosphere

8
ross.mckitrick.googlepages.com 8
Tropical troposphere
� 8-16 km above the surface
� 30N to 30S
� Half the atmosphere

9
ross.mckitrick.googlepages.com 9
Predicted warming centers
� Tropical troposphere
� Arctic surface layer
� (Antarctica)
� Questions
� Is the response to GHG’s rapid?
� Is the pattern unique to GHG’s?

10
ross.mckitrick.googlepages.com 10
Predicted warming centers
� Tropical troposphere
� Yes- rapid adjustment
� Yes- unique
� Arctic
� Unclear- model-dependent
� No- not unique

11
ross.mckitrick.googlepages.com 11
IPCC Hindcast
1890-1999
AR4
Fig9.1
Each graph panel shows:
-latitude on horizintal axis (N to S = left to right),
-altitude on vertical axis.
Thus equator is on horizontal axis in centre, north pole at surface is in bottom left, etc.

12
ross.mckitrick.googlepages.com 12
IPCC Hindcast
1890-1999
AR4
Fig9.1
Each graph panel shows:
-latitude on horizintal axis (N to S = left to right),
-altitude on vertical axis.
Thus equator is on horizontal axis in centre, north pole at surface is in bottom left, etc.

13
ross.mckitrick.googlepages.com 13
IPCC Hindcast
1890-1999
AR4
Fig9.1
Sun Volcanoes
GHG’s O3 Depletion
SO4 Aerosols Total
14
ross.mckitrick.googlepages.com 14
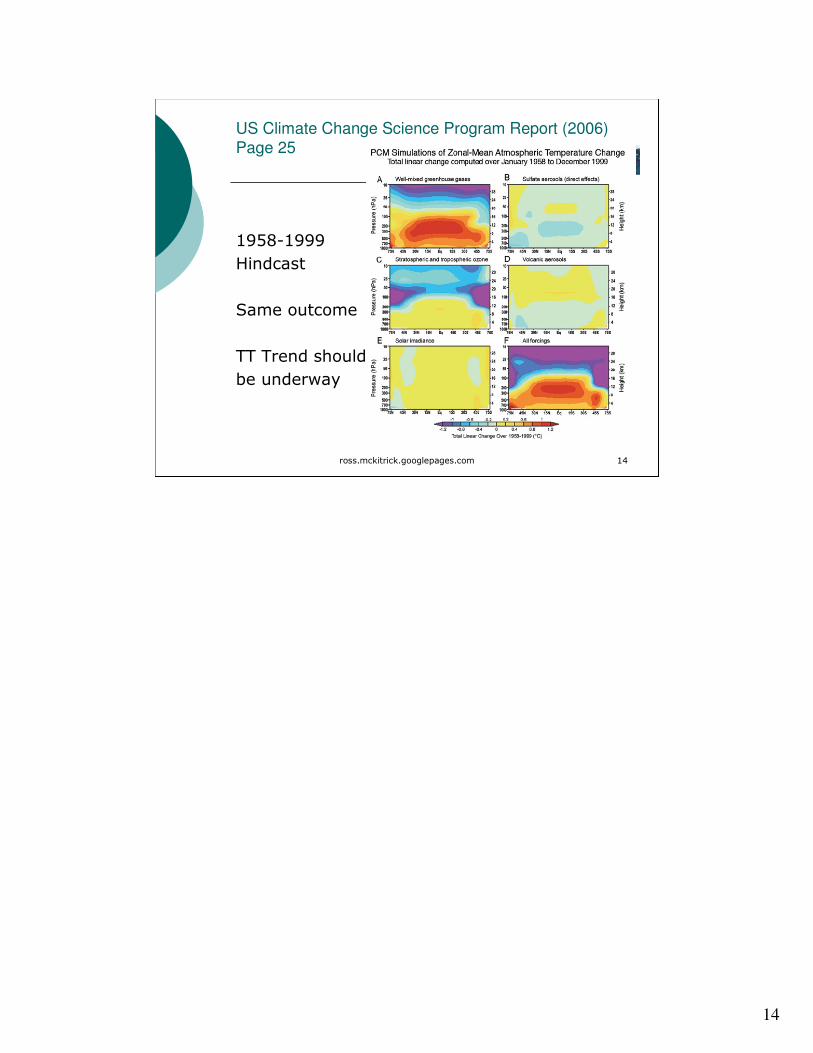
US Climate Change Science Program Report (2006) Page 25
1958-1999
Hindcast
Same outcome
TT Trend should
be underway

15
ross.mckitrick.googlepages.com 15
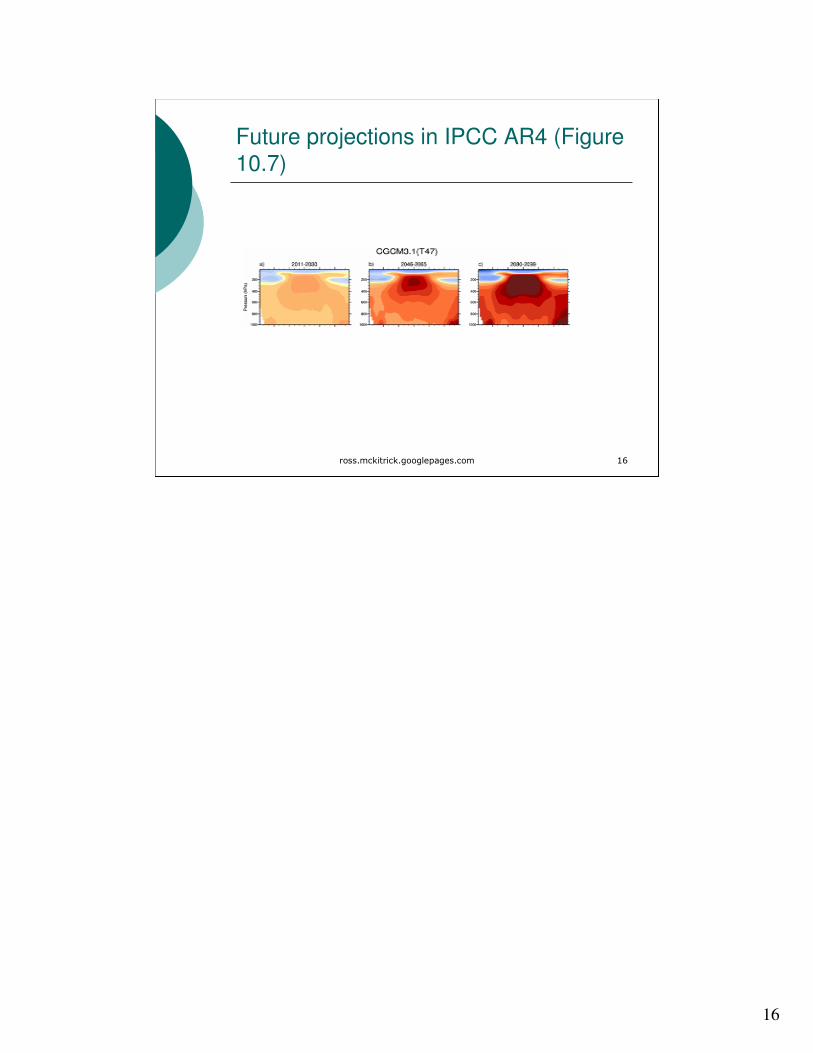
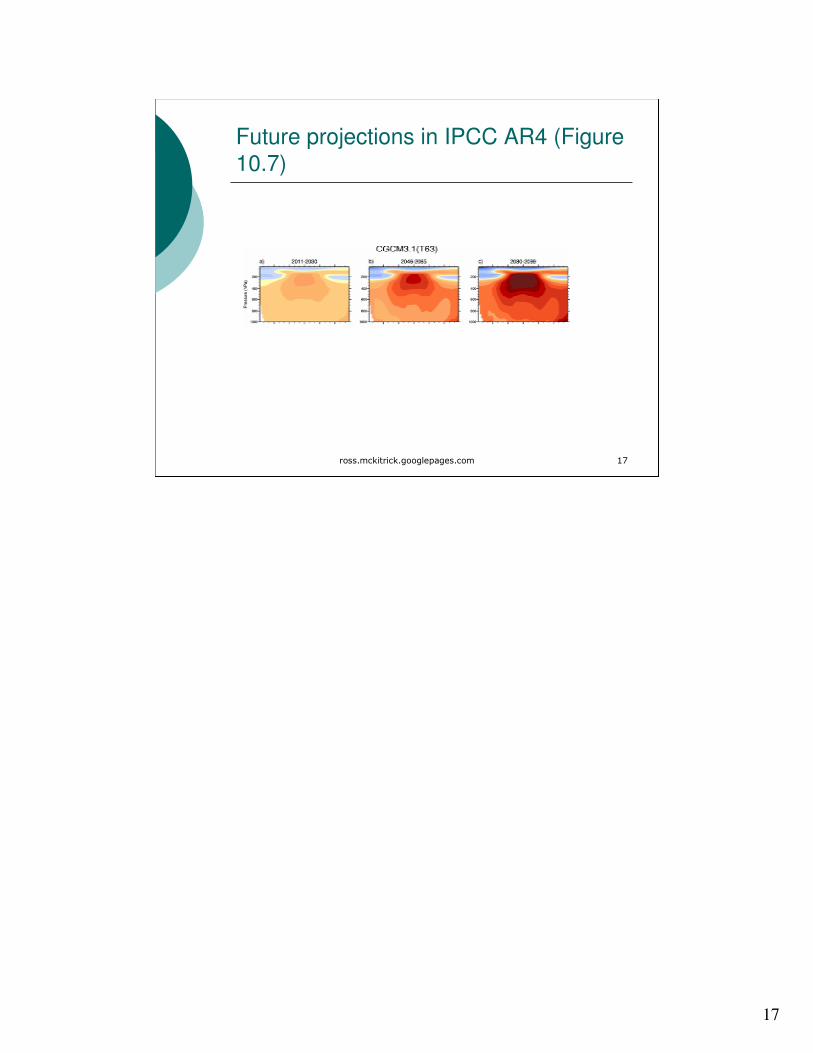
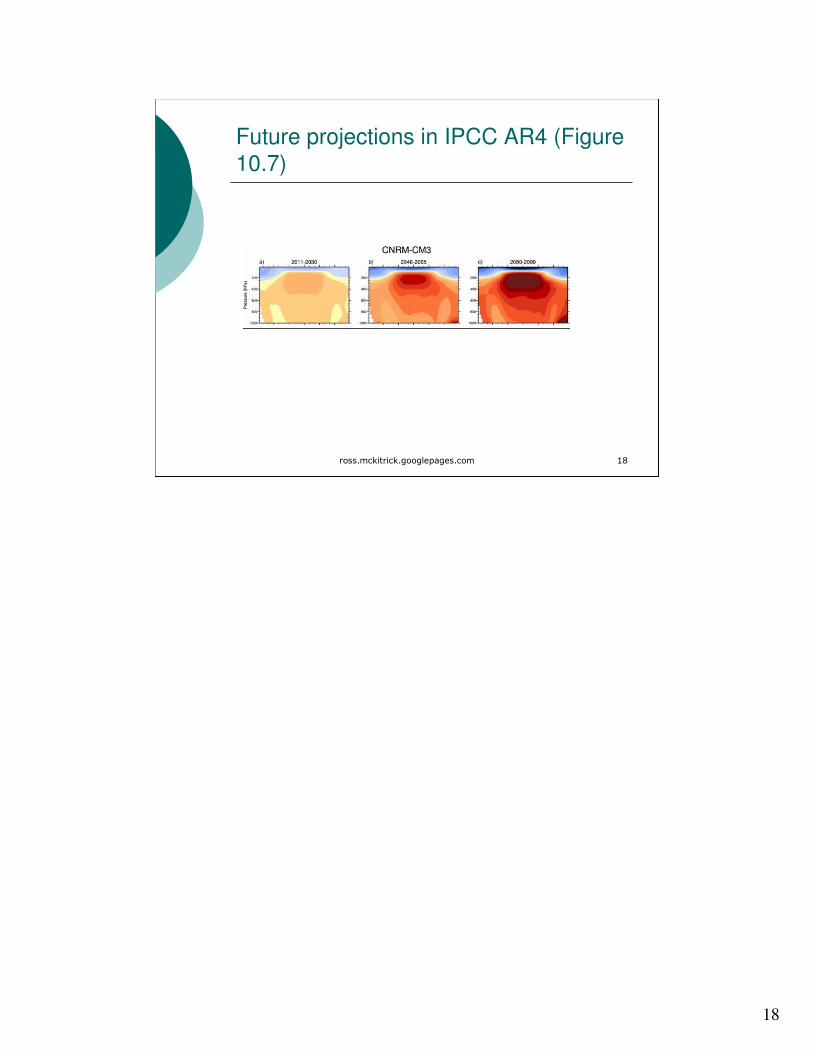
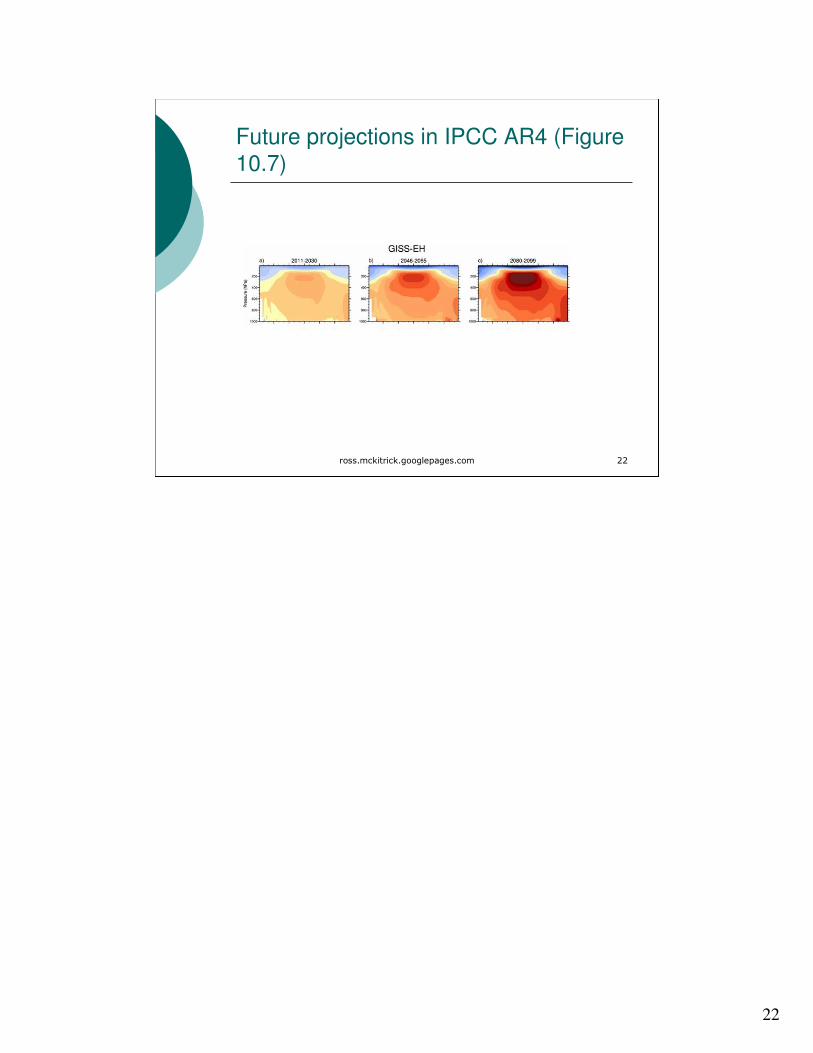
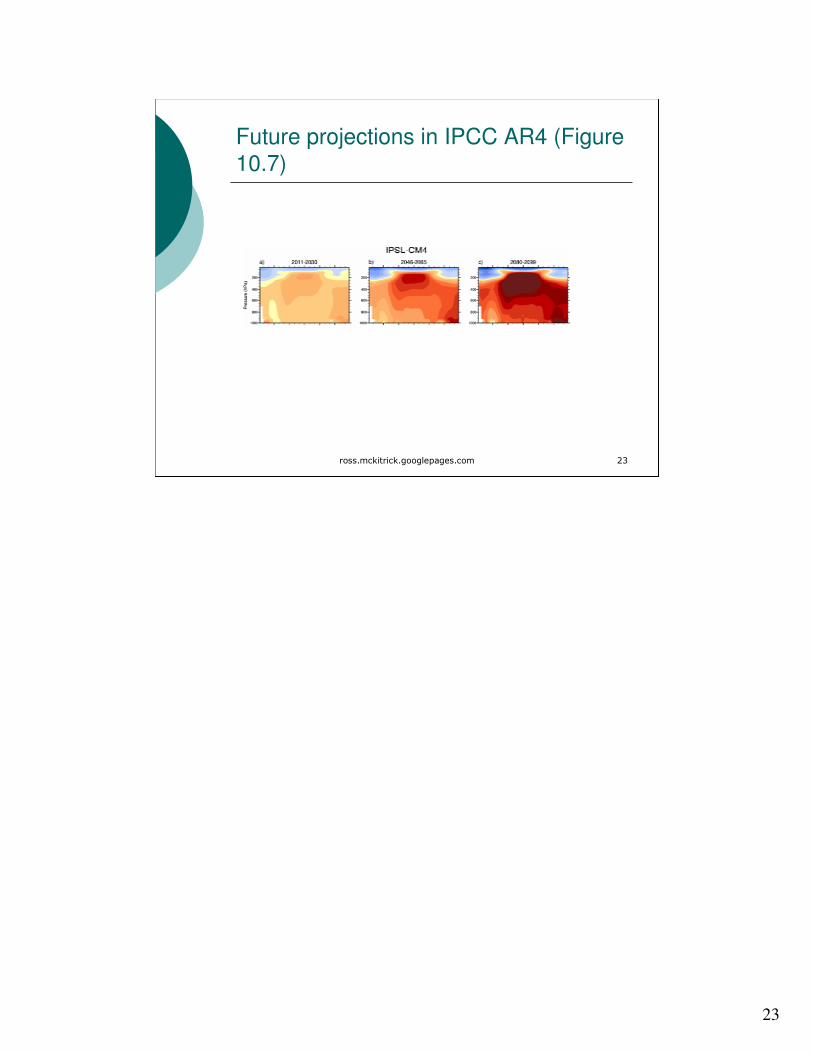
Future projections in IPCC AR4 (Figure 10.7)
This and next 11 all taken from IPCC Supplementary info web site
http://ipcc-wg1.ucar.edu/wg1/Report/suppl/Ch10/Ch10_indiv-maps.html
16
ross.mckitrick.googlepages.com 16
Future projections in IPCC AR4 (Figure 10.7)
17
ross.mckitrick.googlepages.com 17
Future projections in IPCC AR4 (Figure 10.7)
18
ross.mckitrick.googlepages.com 18
Future projections in IPCC AR4 (Figure 10.7)

19
ross.mckitrick.googlepages.com 19
Future projections in IPCC AR4 (Figure 10.7)

20
ross.mckitrick.googlepages.com 20
Future projections in IPCC AR4 (Figure 10.7)

21
ross.mckitrick.googlepages.com 21
Future projections in IPCC AR4 (Figure 10.7)
22
ross.mckitrick.googlepages.com 22
Future projections in IPCC AR4 (Figure 10.7)
23
ross.mckitrick.googlepages.com 23
Future projections in IPCC AR4 (Figure 10.7)
24
ross.mckitrick.googlepages.com 24
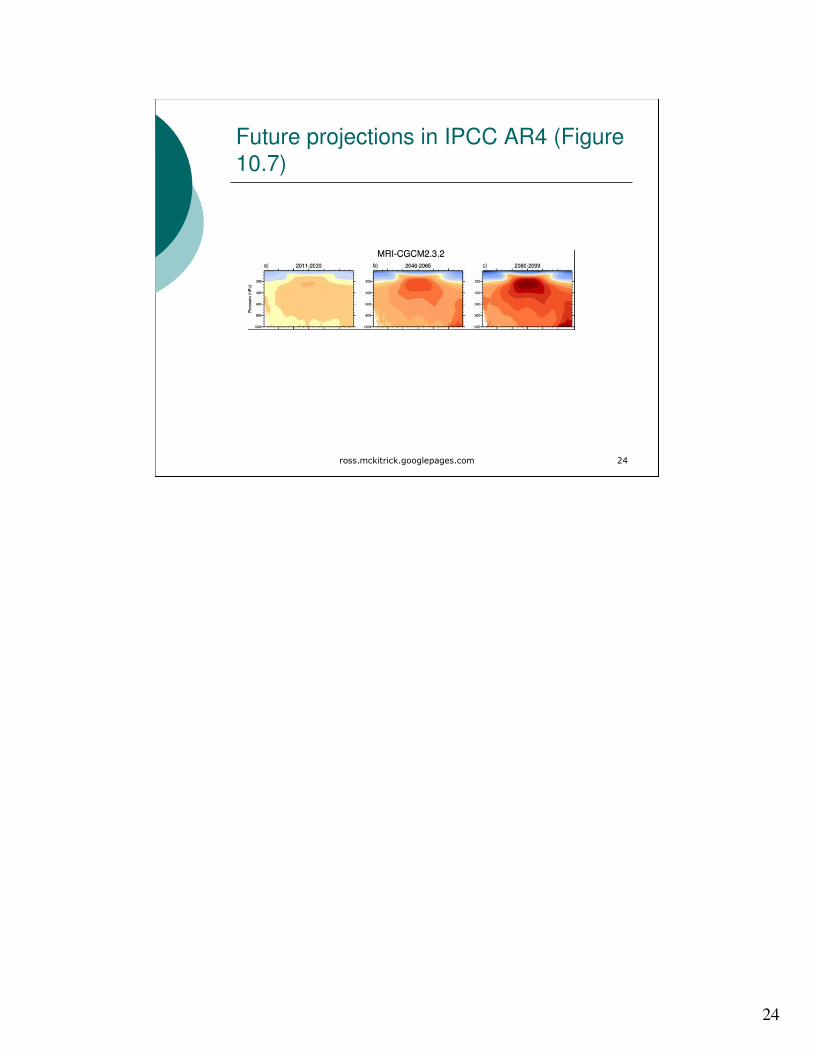
Future projections in IPCC AR4 (Figure 10.7)

25
ross.mckitrick.googlepages.com 25
Future projections in IPCC AR4 (Figure 10.7)

26
ross.mckitrick.googlepages.com 26
Future projections in IPCC AR4 (Figure 10.7)
27
ross.mckitrick.googlepages.com 27
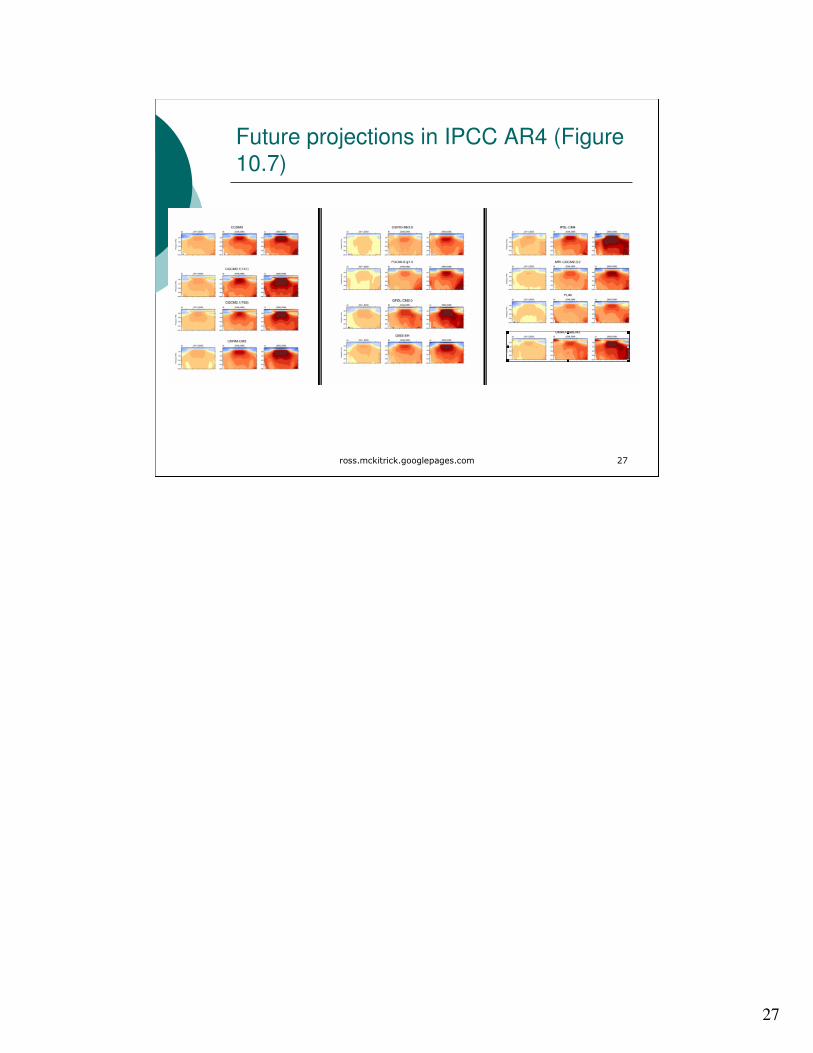
Future projections in IPCC AR4 (Figure 10.7)

28
ross.mckitrick.googlepages.com 28
Concentrated, rapid warming expected in tropical troposphere
� IPCC Report pp 763-764:
Upper-tropospheric warming reaches a maximum in the tropics
and is seen even in the early-century time period. The pattern is
very similar over the three periods, consistent with the rapid
adjustment of the atmosphere to the forcing. These changes are
simulated with good consistency among the models.
29
ross.mckitrick.googlepages.com 29
The Predictions
� Tropical region:� Troposphere should warm faster than the surface
� Pattern should be already showing up
� Arctic region:� Surface should warm faster than troposphere
� But pattern may not emerge until 2040’s
30
ross.mckitrick.googlepages.com 30
Arctic region
� Sensitive to
� Arctic Oscillation
� Solar changes
� Atmospheric circulation
� Ocean currents
� These have a lot of explanatory power
31
ross.mckitrick.googlepages.com 31
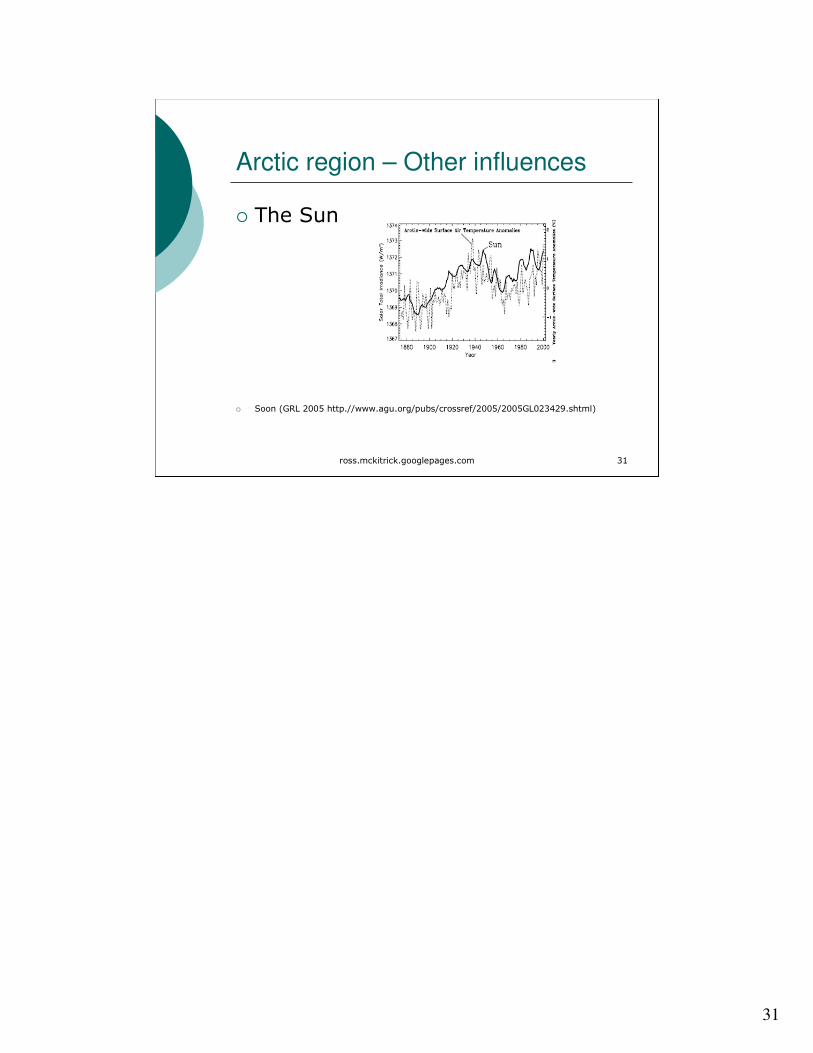
Arctic region – Other influences
� The Sun
� Soon (GRL 2005 http.//www.agu.org/pubs/crossref/2005/2005GL023429.shtml)
32
ross.mckitrick.googlepages.com 32
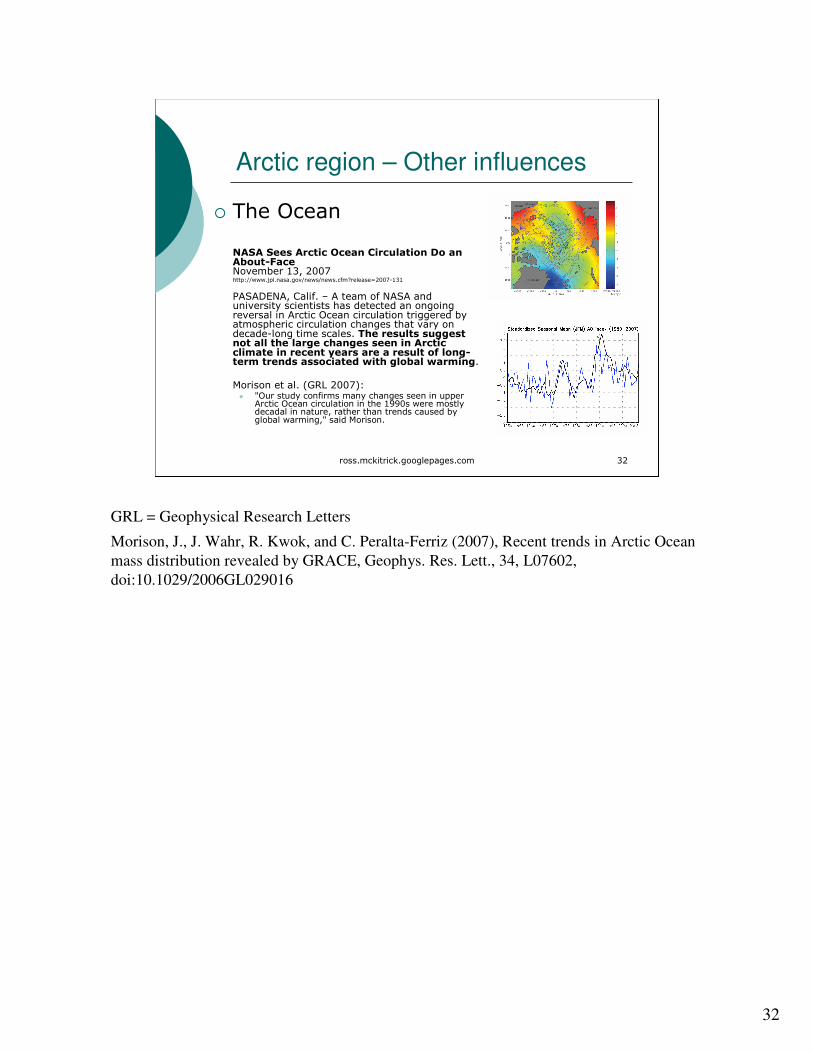
Arctic region – Other influences
� The Ocean
NASA Sees Arctic Ocean Circulation Do an About-FaceNovember 13, 2007 http://www.jpl.nasa.gov/news/news.cfm?release=2007-131
PASADENA, Calif. – A team of NASA and university scientists has detected an ongoing reversal in Arctic Ocean circulation triggered by atmospheric circulation changes that vary on decade-long time scales. The results suggest not all the large changes seen in Arctic climate in recent years are a result of long-term trends associated with global warming.
Morison et al. (GRL 2007):� "Our study confirms many changes seen in upper
Arctic Ocean circulation in the 1990s were mostly decadal in nature, rather than trends caused by global warming," said Morison.
GRL = Geophysical Research Letters
Morison, J., J. Wahr, R. Kwok, and C. Peralta-Ferriz (2007), Recent trends in Arctic Ocean
mass distribution revealed by GRACE, Geophys. Res. Lett., 34, L07602,
doi:10.1029/2006GL029016
33
ross.mckitrick.googlepages.com 33
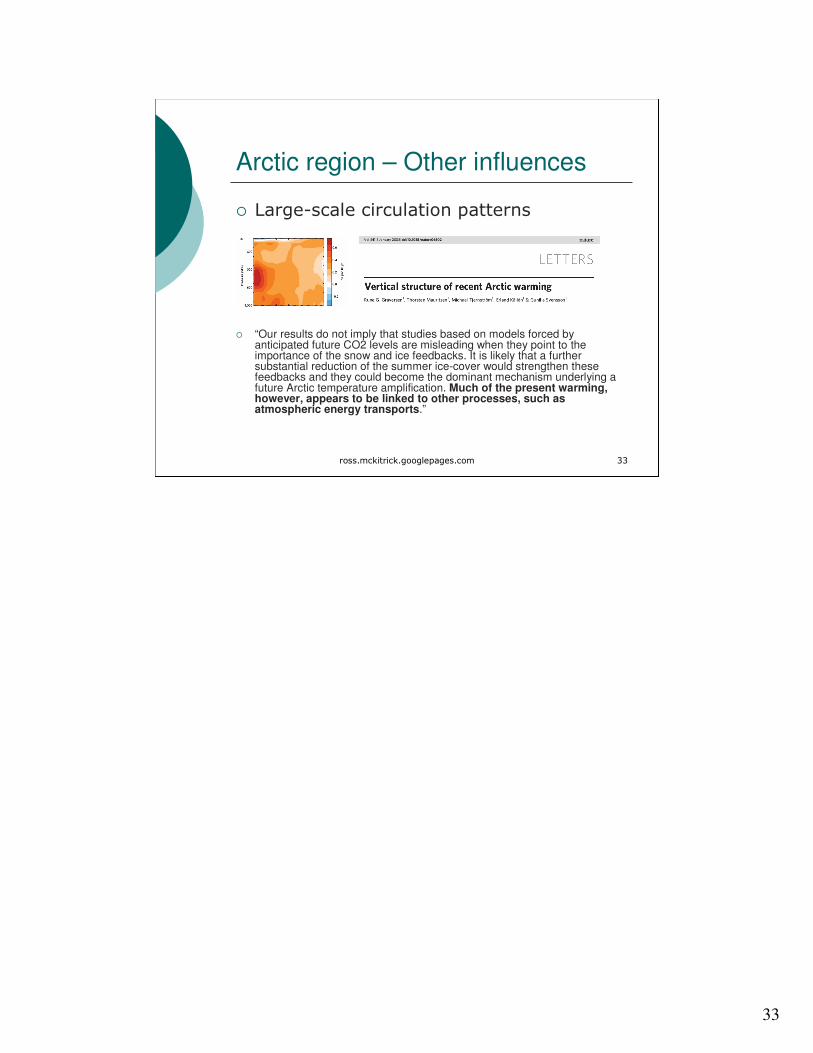
Arctic region – Other influences
� Large-scale circulation patterns
� “Our results do not imply that studies based on models forced by anticipated future CO2 levels are misleading when they point to the importance of the snow and ice feedbacks. It is likely that a further substantial reduction of the summer ice-cover would strengthen these feedbacks and they could become the dominant mechanism underlying a future Arctic temperature amplification. Much of the present warming, however, appears to be linked to other processes, such as atmospheric energy transports.”
34
ross.mckitrick.googlepages.com 34
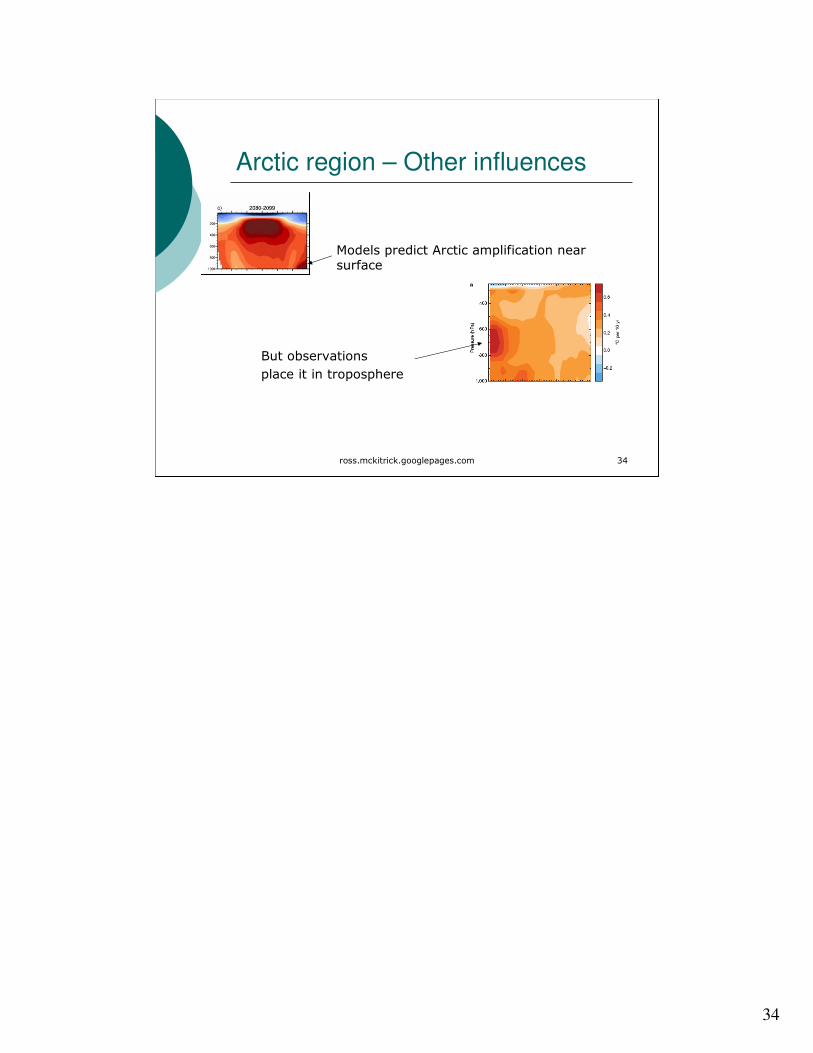
Arctic region – Other influences
� Models predict Arctic amplification near surface
But observations
place it in troposphere

35
ross.mckitrick.googlepages.com 35
Antarctica
� No increase in mean
temperature since 1960
� SH sea ice above
1979-2000 mean
Data compiled for the ISPM Figure 8:
http://www.uoguelph.ca/~rmckitri/research/ispm.html
Sources:
Goddard Institute for Space Studies (2006). Annual mean Land-Ocean Temperature Index
in 0.1C selected zonal means. Data available online at
http://data.giss.nasa.gov/gistemp/tabledata/ZonAnn.Ts+dSST.txt.
Mears, C.A., and F.J. Wentz (2006). MSU Data, Remote Sensing Systems, Santa Rosa,
California. Data available online at
http://www.remss.com/data/msu/monthly_time_series/RSS_Monthly_MSU_AMSU_Chann
el_TLT_Anomalies_Land_and_Ocean_v03_0.txt.

36
ross.mckitrick.googlepages.com 36
Good data exist for troposphere
� Daily measurements by NOAA satellites, analysedby independent teams at RSS and UAH
� 2 weather balloon networks (RATPAC and HADAT2)
RSS = Remote Sensing Systems
http://www.remss.com/msu/msu_data_description.html
UAH = University of Alabama-Huntsville
http://www.nsstc.uah.edu/data/msu/

37
ross.mckitrick.googlepages.com 37
Weather Balloons & Satellites 1979-1999 (CCSP p. 116)
� Balloon record � Model hindcasts
“Another noticeable difference is that the HadAT2 data show a relative lack of warming in the tropical troposphere where all four models simulate maximum warming.”

38
ross.mckitrick.googlepages.com 38
Tropical Troposphere
� 1979-2007
Tropical Troposphere (Monthly RSS Data)
-1
-0.5
0
0.5
1
1.5
1979 1981 1983 1985 1987 1989 1991 1993 1995 1997 1999 2001 2003 2005
UAH tropical tropospheric data record

39
ross.mckitrick.googlepages.com 39
Compilation of current trends (IPCC AR4, Fig 3.4.3)
� At present: positive but insignificant trend in tropical troposphere
This is from the Second Order Draft of the IPCC WG1 Assessment Report

40
ross.mckitrick.googlepages.com 40
8 data comparisons (CCSP)
� Surface (Ts); Troposphere (T2LT)
� Models: (Ts - T2LT) < 0 : negative� Data: (Ts - T2LT ) > 0 : positive
� US CCSP Report p. 111

41
ross.mckitrick.googlepages.com 41
8 data comparisons (CCSP)
� Surface (Ts); Troposphere (T2LT)
� Models: (Ts - T2LT) < 0 : negative� Data: (Ts - T2LT ) > 0 : positive
� US CCSP Report p. 111
Models:
negative
Data:
positive
42
ross.mckitrick.googlepages.com 42
US CCSP page 11
� “A potentially serious inconsistency, however, has been identified in the tropics. Figure 4G shows that the lower troposphere warms more rapidly than the surface in almost all model simulations, while, in the majority of observed data sets, the surface has warmed more rapidly than the lower troposphere. In fact, the nature of this discrepancy is not fully captured in Fig. 4G as the models that show best agreement with the observations are those that have the lowest (and probably unrealistic) amounts of warming.”

43
ross.mckitrick.googlepages.com 43
Preliminary conclusions
� IPCC & CCSP Reports identify 2 areas where we expect to see dominant GHG effects� Arctic and tropical troposphere
� Arctic � Multiple influences, unclear response timeline
� Many competing explanations for late 20th century warming� warming is stronger aloft than at surface: not consistent with
model projections
� Tropical troposphere� Consistent prediction across models of rapid response to
GHG’s� No observed warming pattern beyond natural variability� Warming weaker aloft than at surface: not consistent with model
projections

44
ross.mckitrick.googlepages.com 44
Why is the issue complicated?
� Lack of underlying theory for fluid dynamics on climatic scales
� Natural variability hard to estimate
� Measurement problems at surface
45
ross.mckitrick.googlepages.com 45
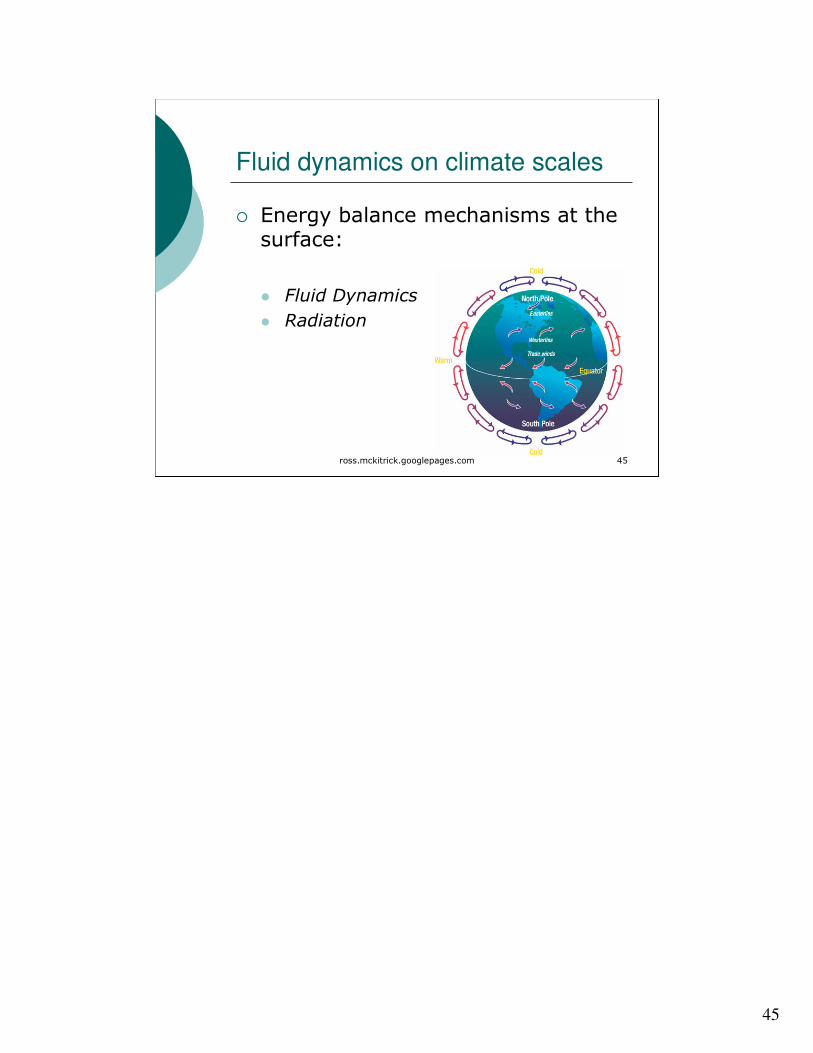
Fluid dynamics on climate scales
� Energy balance mechanisms at the surface:
� Fluid Dynamics
� Radiation

46
ross.mckitrick.googlepages.com 46
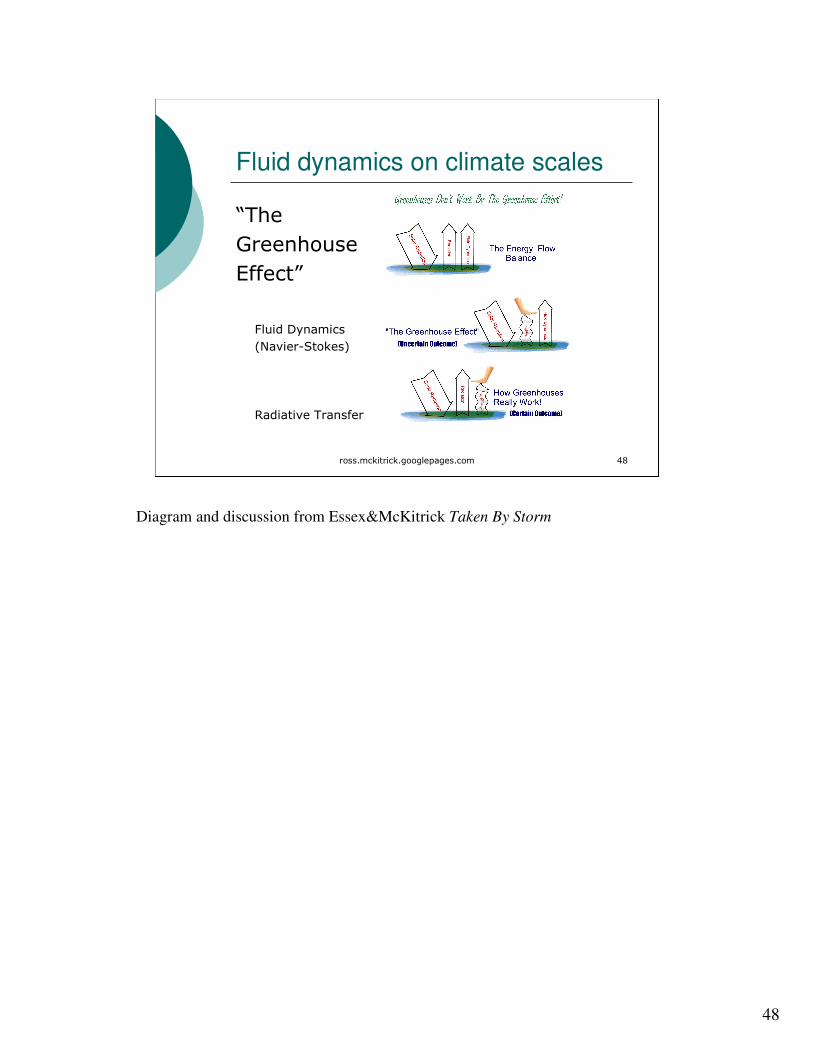
Fluid dynamics on climate scales
“The
Greenhouse
Effect”
Fluid Dynamics
(Navier-Stokes)
Radiative Transfer

47
ross.mckitrick.googlepages.com 47
Fluid dynamics on climate scales
“The
Greenhouse
Effect”
Fluid Dynamics
(Navier-Stokes)
Radiative Transfer
48
ross.mckitrick.googlepages.com 48
Fluid dynamics on climate scales
“The
Greenhouse
Effect”
Fluid Dynamics
(Navier-Stokes)
Radiative Transfer
Diagram and discussion from Essex&McKitrick Taken By Storm

49
ross.mckitrick.googlepages.com 49
Natural variability: Paleoclimate context
� NAS panel, page 107 (referring to M&M criticisms) � …taken together, they are an important aspect of a more general finding of this committee, which is that uncertainties of the published reconstructions have been underestimated.
� Wegman Panel pp. 4-5 � Overall, our committee believes that Mann’s assessments that the decade of the 1990s was the hottest decade of the millennium and that 1998 was the hottest year of the millennium cannot be supported by his analysis.
50
ross.mckitrick.googlepages.com 50
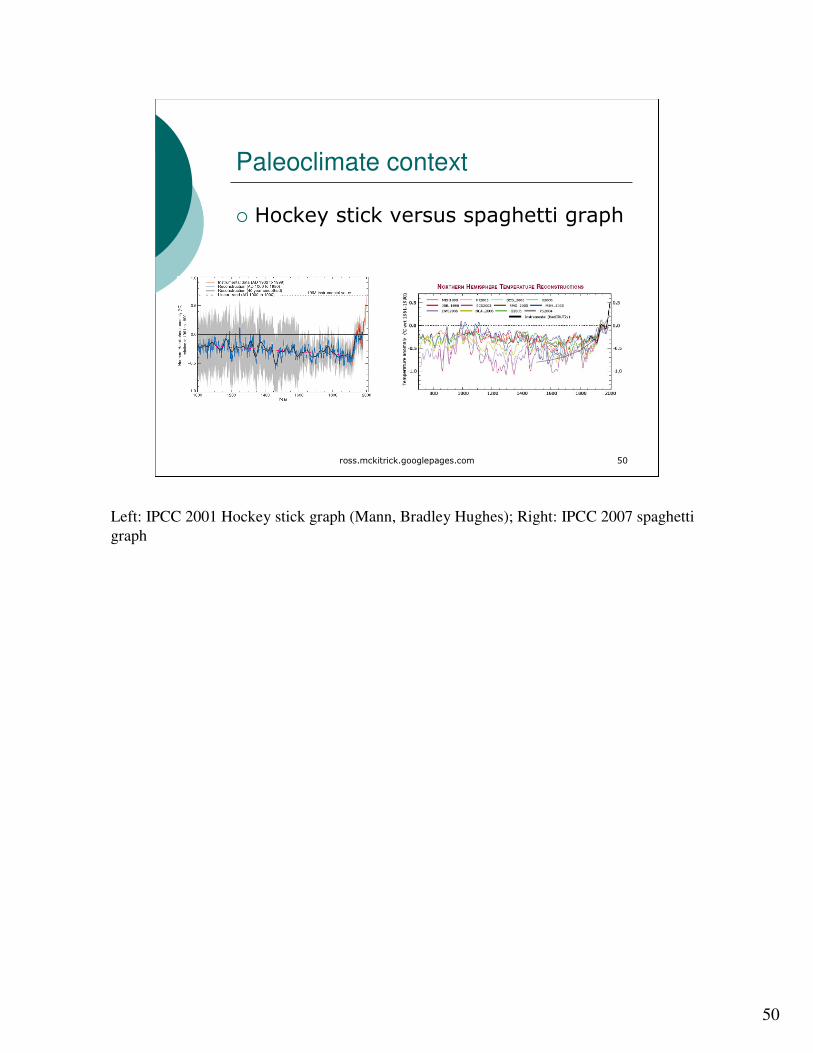
Paleoclimate context
� Hockey stick versus spaghetti graph
Left: IPCC 2001 Hockey stick graph (Mann, Bradley Hughes); Right: IPCC 2007 spaghetti
graph

51
ross.mckitrick.googlepages.com 51
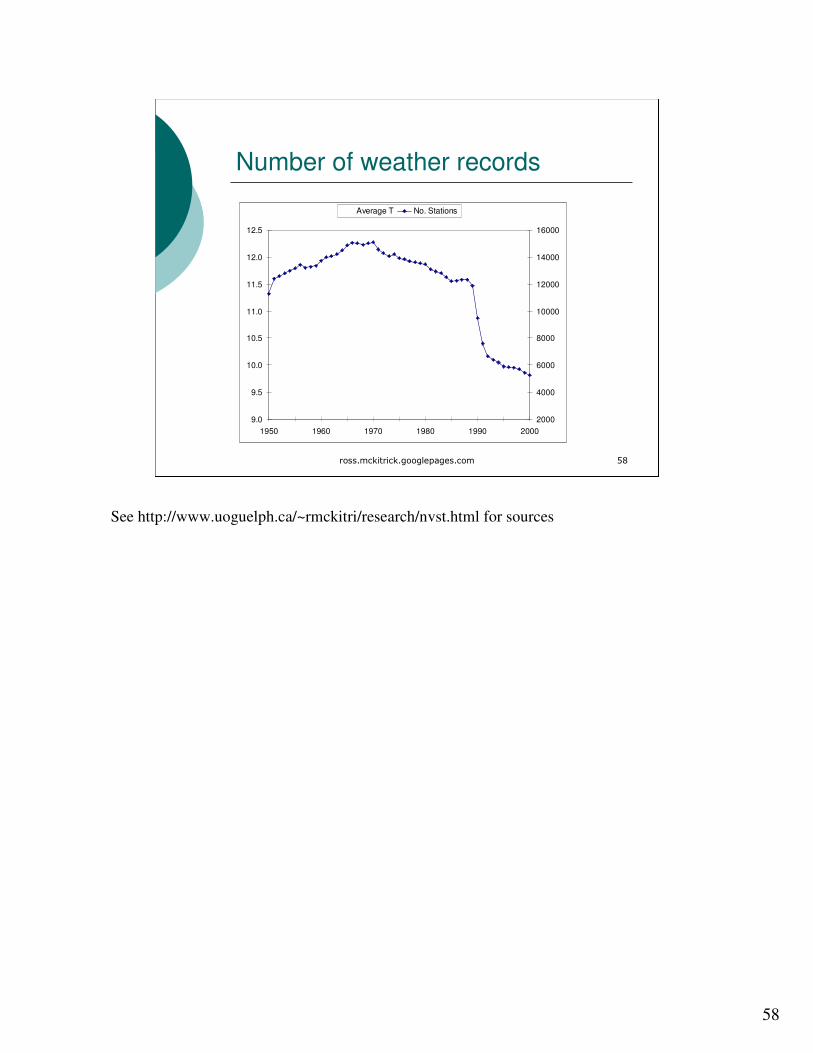
Measurement problems
� Sampling problems of surface temperature, especially after 1990
� Peterson&Vose, BAMS (1997) 2837-2849.
Diagrams show availability of weather monitoring stations over 20th century
Peterson T.C. and R.S. Vose (1997) “An Overview of the Global Historical Climatology
Network Temperature Database.” Bulletin of the American Meteorological Society
78:2837—2849.

52
ross.mckitrick.googlepages.com 52
Incomplete sampling at surface
� Locations of weather stations
This map and the next 5 were compiled by John Goetz using the GHCN archive. See
http://www.climateaudit.org/?p=2711. The same sequence was developed by the Center for
Climatic Research at the University of Delaware, see
http://climate.geog.udel.edu/~climate/index.shtml.

53
ross.mckitrick.googlepages.com 53
Incomplete sampling at surface
� Locations of weather stations

54
ross.mckitrick.googlepages.com 54
Incomplete sampling at surface
� Locations of weather stations

55
ross.mckitrick.googlepages.com 55
Incomplete sampling at surface
� Locations of weather stations

56
ross.mckitrick.googlepages.com 56
Incomplete sampling at surface
� Locations of weather stations

57
ross.mckitrick.googlepages.com 57
Incomplete sampling at surface
� Locations of weather stations
58
ross.mckitrick.googlepages.com 58
Number of weather records
9.0
9.5
10.0
10.5
11.0
11.5
12.0
12.5
1950 1960 1970 1980 1990 2000
2000
4000
6000
8000
10000
12000
14000
16000
Average T No. Stations
See http://www.uoguelph.ca/~rmckitri/research/nvst.html for sources

59
ross.mckitrick.googlepages.com 59
Number of weather records
9.0
9.5
10.0
10.5
11.0
11.5
12.0
12.5
1950 1960 1970 1980 1990 2000
2000
4000
6000
8000
10000
12000
14000
16000
Average T No. Stations
See http://www.uoguelph.ca/~rmckitri/research/nvst.html for sources

60
ross.mckitrick.googlepages.com 60
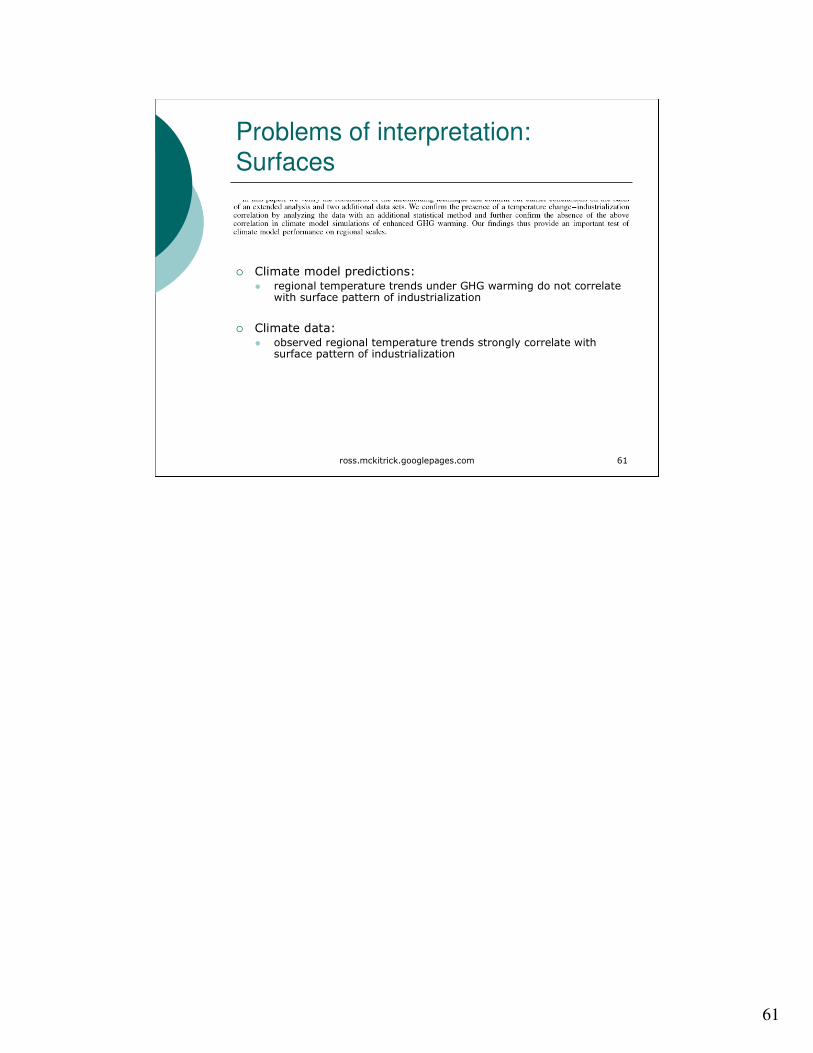
Problems of interpretation: Surfaces
� Anthropogenic surface processes
� Land-use changes, urbanization, data quality problems introduce false trends in data
� Large literature shows these cause warming bias in meteorological data, e.g.
De Laat, A.T.J., and A.N. Maurellis (2006). “Evidence for Influence of Anthropogenic
Surface Processes on Lower Tropospheric and Surface Temperature Trends.” International
Journal of Climatology 26:897—913.
61
ross.mckitrick.googlepages.com 61
Problems of interpretation: Surfaces
� Climate model predictions: � regional temperature trends under GHG warming do not correlate
with surface pattern of industrialization
� Climate data: � observed regional temperature trends strongly correlate with
surface pattern of industrialization

62
ross.mckitrick.googlepages.com 62
Biases in surface recordMcKitrick & Michaels, J. Geophys. Res.-Atmos (2007)
� Correlation between spatial warming pattern at surface, and indicators of industrial development significant at p=1.7E-14.
� Explains about half of post-1980 surface warming over land
See http://www.uoguelph.ca/~rmckitri/research/jgr07/jgr07.html for paper and sources

63
ross.mckitrick.googlepages.com 63
Biases in surface recordMcKitrick & Michaels, J. Geophys. Res.-Atmos (2007)

64
ross.mckitrick.googlepages.com 64
Summary
� Temperature data collected at Earth’s surface
� Sparse
� Contaminated by effects due to land surface
� Better option: use satellite data
65
ross.mckitrick.googlepages.com 65
Making Policy Plans
� Proposal: Put a tax on CO2 emissions tied to actual warming in the tropical troposphere
� Suppose we take the mean of the UAH & RSS measures of the mean tropical tropospheric temperature (T3)
� Calibrate these to a number (~ 5)
� Make this the tax per tonne on carbon emissions
See http://ross.mckitrick.googlepages.com/#t3tax for discussion and details

66
ross.mckitrick.googlepages.com 66
T3 Formula
� 3-year moving average x 20
( )∑=
−+−×=
35
0
21
361 )()(203
i
itRSSitSCT
67
ross.mckitrick.googlepages.com 67
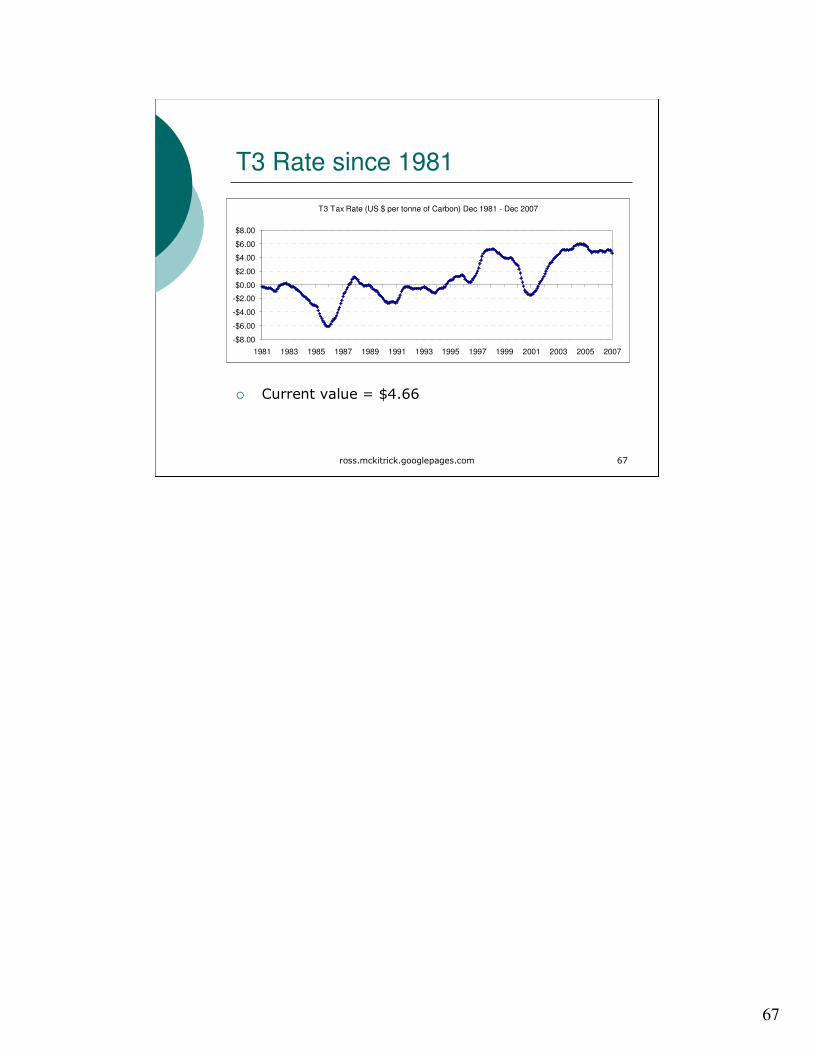
T3 Rate since 1981
� Current value = $4.66
T3 Tax Rate (US $ per tonne of Carbon) Dec 1981 - Dec 2007
-$8.00
-$6.00
-$4.00
-$2.00
$0.00
$2.00
$4.00
$6.00
$8.00
1981 1983 1985 1987 1989 1991 1993 1995 1997 1999 2001 2003 2005 2007
68
ross.mckitrick.googlepages.com 68
IPCC Projections
� 0.2 – 1.2 C/decade warming in Tropical Troposphere
� Implies $4 - $24 rise in T3 tax per decade
� Actual rate depends on actual warming

69
ross.mckitrick.googlepages.com 69
The T3 Tax
� If the mean tropical tropospheric temperature goes up, so does the tax
� If not, the tax does not go up
� It might even go down.
� Whatever happens, it is (approximately) the right outcome.
� We don’t have to know in advance who’s right.
� Everyone expects to get their preferred outcome.

70
ross.mckitrick.googlepages.com 70
Everyone expects to get their preferred outcome
� Skeptics expect the tax to stay flat or fall
� Believers expect the tax to soar
� Policymakers don’t have to guess who’s right, they get the right outcome either way
� But investors have to figure out who’s more credible

71
ross.mckitrick.googlepages.com 71
But it kicks in too late! The warming will already have happened when the price changes
� No, for 2 reasons
� The tropical troposphere is the atmosphere’s “leading indicator”—warming there leads surface effects
� Investors are forward-looking� Today’s decisions are based on forecast of tax rates
5-10 years from now
� Under this mechanism, investors incorporate projections of future warming into today’s decisions
72
ross.mckitrick.googlepages.com 72
Added benefit: market for ACCURATE climate forecasts
� Investors will need accurate forecasts of tropical troposphere climate
� If current GCM’s are systematically wrong, the market will look elsewhere
� Market for accuracy may lead to new techniques in climate forecasting
73
ross.mckitrick.googlepages.com 73
Summary
� What do we mean by “global warming”?
� Watch for trend in tropical troposphere
� How do measurements compare to predictions?
� The discrepancies are non-trivial
� Why isn’t it a simple issue?
� Underlying theory does not exist
� Natural variability hard to estimate
� Measurement problems contaminate basic surface data
� What should we do about it?
� Enact a policy with a close feedback between the observed outcome and the stringency of the measure
74
ross.mckitrick.googlepages.com 74
The End
� Thank you
75
ross.mckitrick.googlepages.com 75
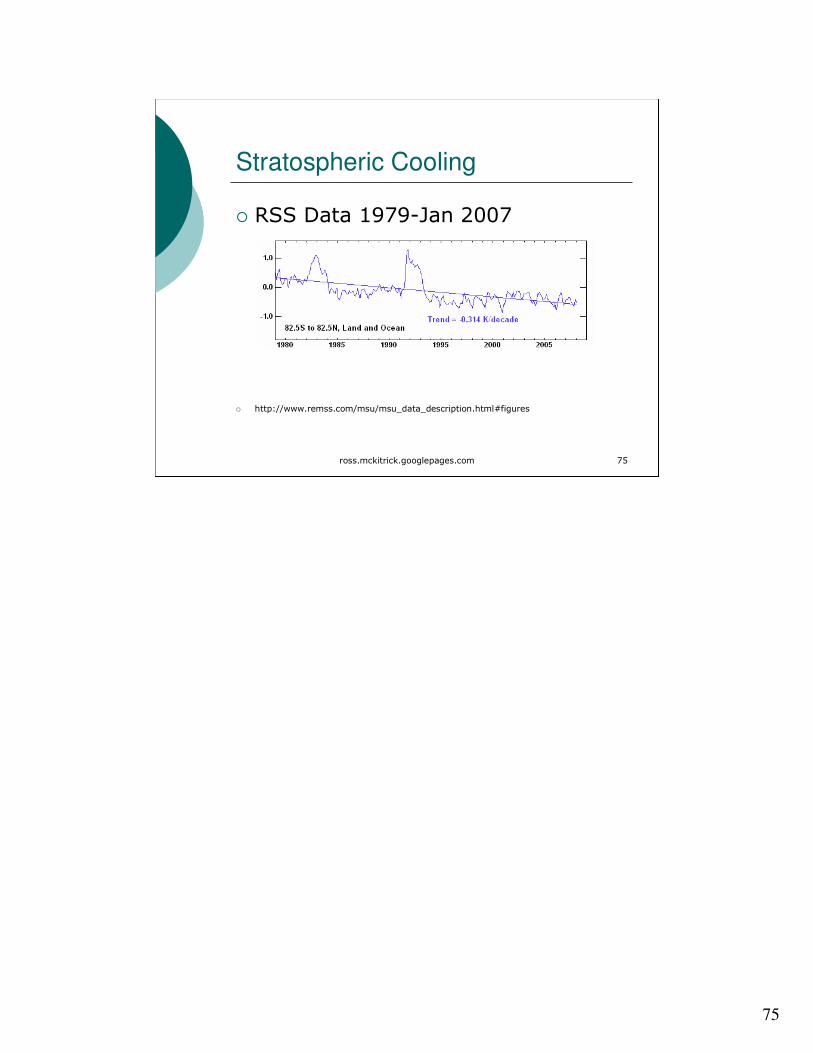
Stratospheric Cooling
� RSS Data 1979-Jan 2007
� http://www.remss.com/msu/msu_data_description.html#figures

76
ross.mckitrick.googlepages.com 76
Arctic region – Ice variability
� Univ Illinois Polar Research Group http://arctic.atmos.uiuc.edu/cryosphere/

77
ross.mckitrick.googlepages.com 77
Why isn’t it a simple issue?
� Experts sometimes refer to “simple physics”
� But the physics of aggregate climatic behaviour is not simple
78
ross.mckitrick.googlepages.com 78
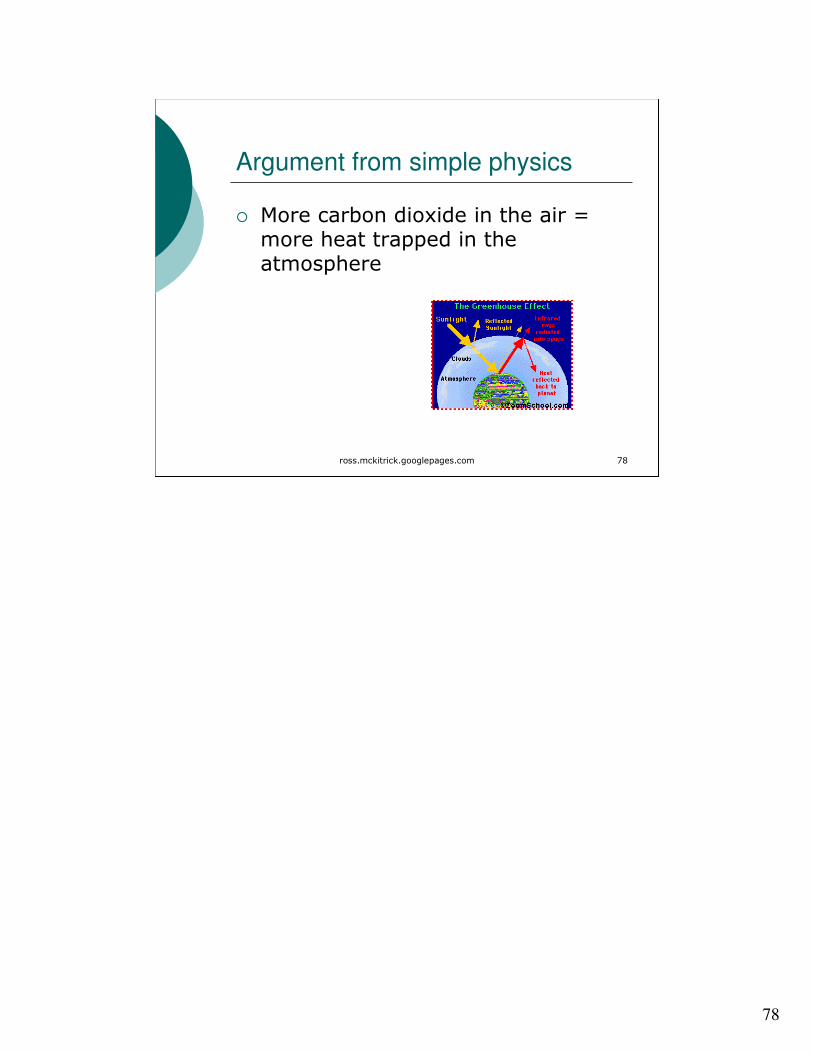
Argument from simple physics
� More carbon dioxide in the air = more heat trapped in the atmosphere

79
ross.mckitrick.googlepages.com 79
Energy is not just temperature
� Energy balance mechanisms at the surface:
� Fluid Dynamics
� Radiation

80
ross.mckitrick.googlepages.com 80
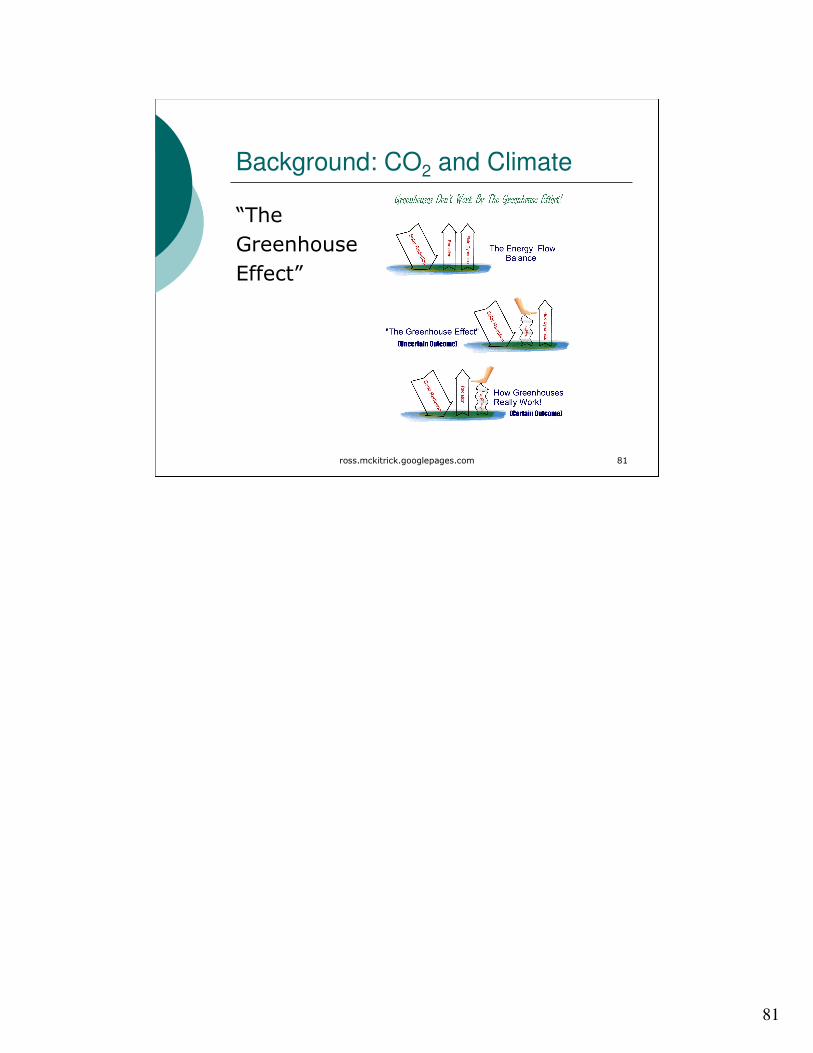
Background: CO2 and Climate
“The
Greenhouse
Effect”
Diagram and discussion from Essex&McKitrick Taken By Storm
81
ross.mckitrick.googlepages.com 81
Background: CO2 and Climate
“The
Greenhouse
Effect”
Fluid Dynamics
(Navier-Stokes)
Radiative Transfer

82
ross.mckitrick.googlepages.com 82
Background: CO2 and Climate
“The
Greenhouse
Effect”
Fluid Dynamics
(Navier-Stokes)
Radiative Transfer

83
ross.mckitrick.googlepages.com 83
Background: CO2 and Climate
“The
Greenhouse
Effect”
Fluid Dynamics
(Navier-Stokes)
Radiative Transfer
Diagram and discussion from Essex&McKitrick Taken By Storm

84
ross.mckitrick.googlepages.com 84
Navier-Stokes: the unsolved problem
� This is the equation which governs the flow of fluids such as water and air. However, there is no proof for the most basic questions one can ask: do solutions exist, and are they unique? Why ask for a proof? Because a proof gives not only certitude, but also understanding.
� Clay Institute Millennium Prize: $1million
Clay Institute
http://www.claymath.org/millennium/Navier-Stokes_Equations/
85
ross.mckitrick.googlepages.com 85
Climate Forecasting
� In climate research and modelling, we should recognise that we are dealing with a coupled non-linear chaotic system, and therefore that the long-term prediction of future climate states is not possible. The most we can expect to achieve is the prediction of the probability distribution of the system’s future possible states by the generation of ensembles of model solutions.
� IPCC Third Assessment Report, Chapter 14.2.2.2

86
ross.mckitrick.googlepages.com 86
But what about the cartoon Greenhouse Effect?
� “If not for the greenhouse effect the planet would be 30 oC colder at the surface.”
� Yes, but:� If not for convection, the planet would be 30
oC hotter at the surface.
� The Moon’s surface goes >100 oC during the day
� We live in a greenhouse that has giant air conditioners running

87
ross.mckitrick.googlepages.com 87
It is complicated because
� Energy and temperature are not equivalent
� Climate change is a problem in fluid dynamics
� No known theoretical solution exists
� No computational solution exists
88
ross.mckitrick.googlepages.com 88
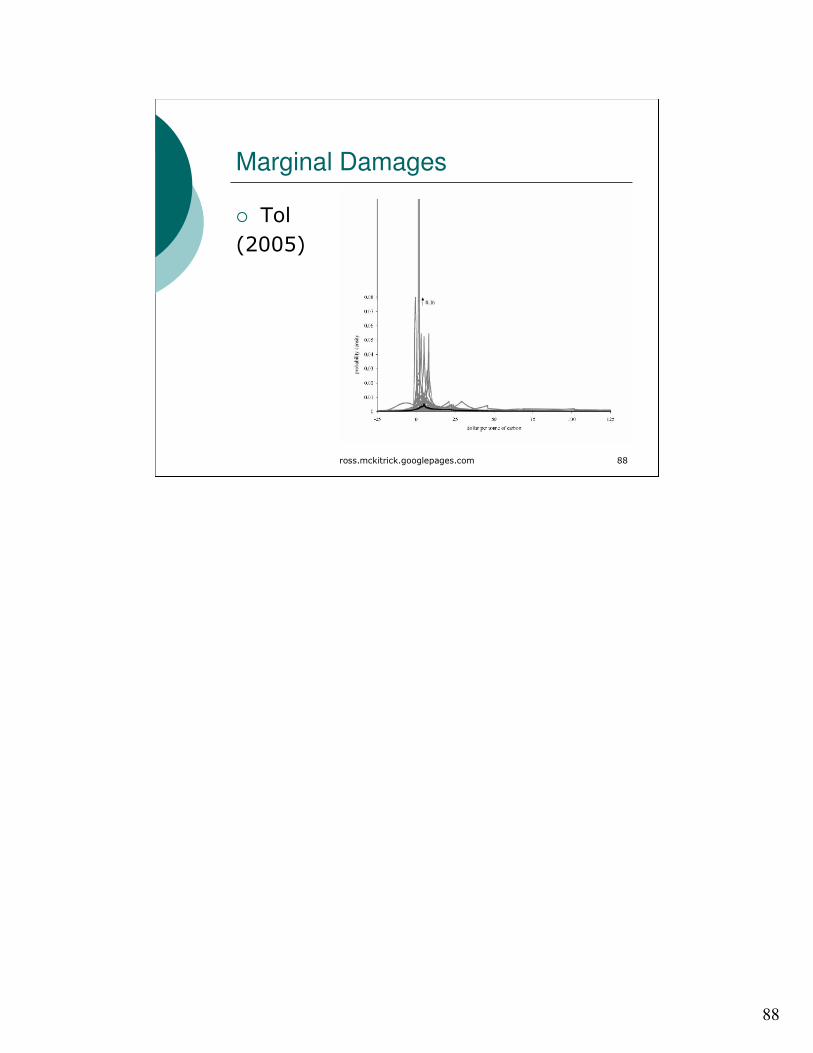
Marginal Damages
� Tol
(2005)
89
ross.mckitrick.googlepages.com 89
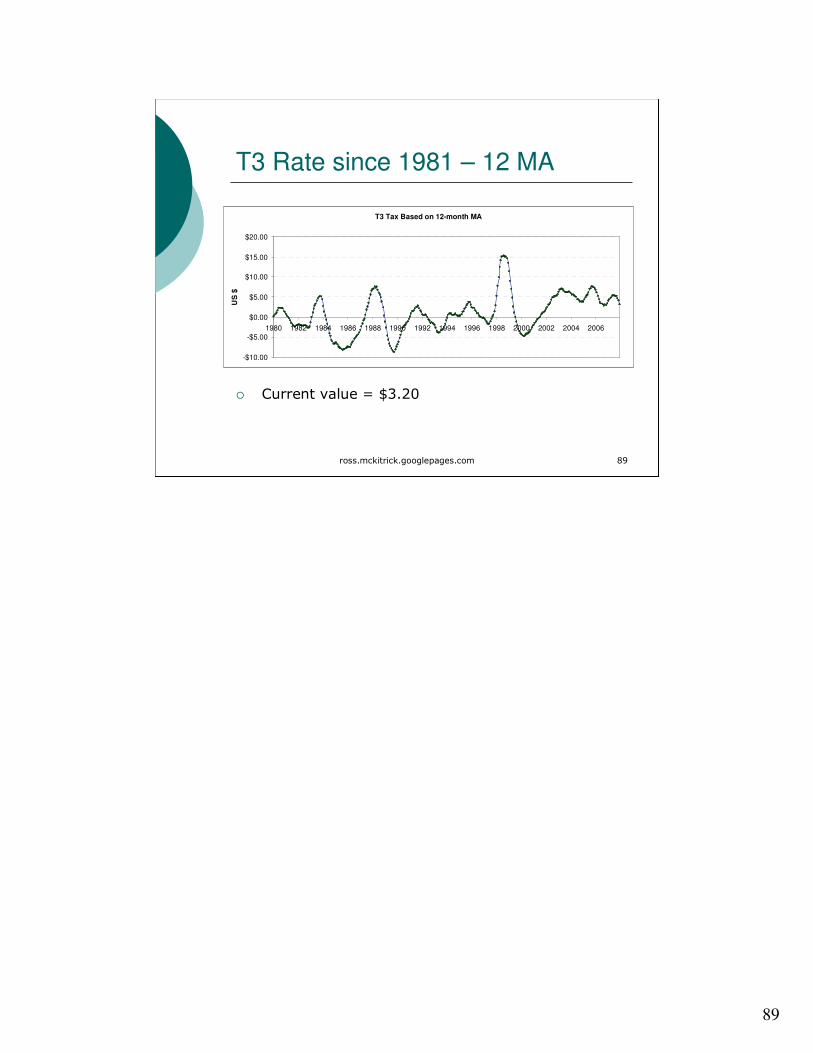
T3 Rate since 1981 – 12 MA
� Current value = $3.20
T3 Tax Based on 12-month MA
-$10.00
-$5.00
$0.00
$5.00
$10.00
$15.00
$20.00
1980 1982 1984 1986 1988 1990 1992 1994 1996 1998 2000 2002 2004 2006
US
$