somchintana puttamat and varong pavarajarn - ijcea · model to be 96.749 j mol-1 and the mean free...
TRANSCRIPT
Abstract—In this study, adsorption characteristic of
manganese (II) ion onto hydrated ferric (III) oxides (HFOs)
nanoparticle resins was analyzed and fitted with adsorption
isotherm models such as Freundlich, Langmuir, Temkin and
Dubinin–Radushkevich isotherms. The Freundlich isotherm
model gave the highest R2 value of 0.9739. The fitted Freundlich
parameter (n) is 6.757, which indicates favorable sorption. The
heat of sorption process was estimated from Temkin isotherm
model to be 96.749 Jmol-1 and the mean free energy was
estimated from Dubinin–Radushkevich isotherm model to be
288.675 Jmol-1. The thermodynamic parameters were
calculated and it was found that the adsorption process was
spontaneous and endothermic and was favored at higher
temperature.
Index Terms—Hydrated ferric (III) oxide (HFOs)
nanoparticle, adsorption, equilibrium isotherm and manganese
(II) ion.
I. INTRODUCTION
Manganese (Mn) is a heavy metal commonly found in soil,
sediment and especially in ground water. Not only it has
effect on appearance and taste of the water, it also causes
health problems on neurological and muscle function in
humans. The Department of Environment Services Health
Risk Assessment Program has adopted the health based
standard of manganese of 0.84 mgL-1
.
Manganese can present in water in one of three basic forms
i.e., dissolved, particulate and colloids, depending on pH of the
solution. Nevertheless, the most common treatment techniques
of manganese contaminated water is oxidation/filtration and
adsorbing onto ion exchange resin [1]-[3].
Oxidation of the dissolved manganese creates particles of
manganese dioxide (MnO2). The oxidation treatment is more
effective in removing high concentration of dissolved
manganese than the ion exchange. However, dissolved
manganese is generally oxidized so slowly that it takes
relatively long time for precipitation, hence it hardly becomes
cost effective. The oxidation with chlorine becomes more
effective when the pH is greater than 9.5 [4], [5].
Ion exchange technique employing sodium chloride
solution can remove low concentration of dissolved
manganese when the pH is greater than 6.8. Nevertheless, a
simple ion exchange process is only driven by electrostatic
interaction and it is nonspecific for heavy metal removal. This
Manuscript received May 31, 2015; revised August 16, 2015. This work
was a part of master degree thesis research at the Department of Chemical Engineering, Faculty of Engineering, Chulalongkorn University.
The authors are with the Department of Chemical Engineering, Faculty of
Engineering, Chulalongkorn University, Thailand (e-mail:
[email protected], [email protected]).
gives rise to the frequent regeneration and high operation cost,
rendering ion exchange technology unattractive. The use of
chemically stable polymeric chelating exchanger has resolved
the problem technically, but it is often too expensive to justify
the applications for heavy metals removal from water and
wastewater [1]-[7].
The major aim of the present study is to explore the
adsorption behavior of Mn2+
in single ion system. In
particular, we evaluated the equilibrium adsorption data by
adsorption isotherms i.e., Freundlich, Langmuir, Temkin and
Dubinin–Radushkevich. Also, we intend to evaluate the use
of HFOs-resin in removing Mn2+
from simulated wastewater.
II. EXPERIMENTAL METHOD
A. Preparation of the HFOs-Resin
Precipitated hydrated Fe(III) oxides or HFOs nanoparticle
were prepared by using Kastel
C300L (Siam Machinery
Thai Co., Ltd.), which is a commercially available
macroporous cation exchange resin with polystyrene matrix
and sulfonic acid functional group, as the parent cation
exchanger. Size of the exchanger resin beads varied between
450 to 550 m. The preparation of HFOs-resin was consisted
of the following three steps [8]. Firstly, Fe(III) was loaded
onto the sulfonic acid sites of the cation exchanged by
passing 4% FeCl3 (AR grade, Merck KGaA) solution at an
approximate pH of 2.0 through a column packed with the
resin. Secondly, desorption of Fe(III) and simultaneous
precipitation of Fe(III) hydroxides took place within the gel
and pore phase of the exchanger through passage of a
solution containing both NaCl (AR grade, Merck KGaA) and
NaOH (AR grade, Merck KGaA) solution, each at 5% w/v
concentration, through the column. Finally, the column was
rinsed and washed with a 50% ethanol (AR grade, Merck
KGaA), aqueous solution followed by a mild thermal
treatment (333 K) for 6 h under N2 atmosphere. The obtained
HFOs-resin was then kept in vacuum desiccator.
B. The Determination of Bulk Density
The bulk density of each of the sample of Kastel
cation
exchange resins and HFOs-resin was determined using
Archimedes’s principle [9] by weighing 10 mL measuring
cylinder before and after filling with the samples. The
measuring cylinder was then dried and the sample was
packed inside, leveled and weighed. The weight of the
sample packed in the measuring cylinder was determined
from the difference in weight of the filled and empty
measuring cylinder. The volume of water in the container
was determined by taking the difference in weight of the
empty and water filled measuring cylinder. The bulk density
was determined using the equation below.
Adsorption Study for Removal of Mn (II) Ion in Aqueous
Solution by Hydrated Ferric (III) Oxides
Somchintana Puttamat and Varong Pavarajarn
International Journal of Chemical Engineering and Applications, Vol. 7, No. 4, August 2016
239doi: 10.18178/ijcea.2016.7.4.581
2 1
bulkdensity
w w (1)
where:
w1 = weight of empty measuring cylinder.
w2 = weight of cylinder filled with sample.
v = volume of cylinder.
C. Effect of the Initial Concentration of Adsorption
Isotherm
The equilibrium sorption of the Mn2+
(from 4% HNO3
solution, ICP-OES & ICP-MS standard, SCP Science) was
carried out by contacting 5.0 g of the HFO-resins with 250
mL of the solution in various concentrations in the range
from 10–200 mgL-1
in 500 mL Duran conical flasks
intermittently for 120 minutes on orbital shaker. The mixture
was filtered and analyzed using Optimal Emission
Spectrometer with inductively coupled plasma (ICP-OES;
Perkin Elmer, Optima 8000). The amount of adsorbed
(mgg-1
) was calculated using the formulae reported by
Vanderborght and Van Griekemn [9]:
0
e
e
C Cq
w (2)
where:
qe = the amount of solute adsorbed from the solution.
v = volume of the adsorbate.
C0 = the concentration before adsorption.
Ce = the concentration after adsorption.
w = the weight in gram of the adsorbent.
The data was fitted into following isotherms: Freumdlich,
Langmuir, Temkin and Dubinin–Radushkevich. The removal
efficiency was determined by computing the percentage
sorption using the formulae in (3).
0
0
% 100
eC CAdsortion
C (3)
D. The Effect of Solution pH
The effect of pH on the removal of Mn2+
using HFOs-resin
was studied by varying the pH of the metal ion solution from
1 to 10. The solution pH was adjusted by phosphate buffer
and 0.1 molL-1
HCl or NaCl solutions. A mass of 0.05 g of
adsorbent was added to 10 mL of the solution containing the
metal ions with an initial concentration of 200 mgL-1
and
was the stirred with 150 rpm agitation for 7 h. The
temperature of the solution was kept constant at 303 K [1].
The residual concentration of the ion was determined as
explained earlier.
E. The Effect of Adsorption Kinetics
A set of experiments was conducted for studies of
adsorption kinetics by placing 0.05 g adsorbent into 10 mL of
solution containing Mn2+
with an initial concentration of 200
mgL-1
. The experiment was performed at pH = 2.0 and
temperature of 303 K. The concentration of the metal ion was
periodically measure within 10 – 120 min of the experiment
[10].
F. The Effect of Adsorption Thermodynamic
The effect of temperature on the adsorption of Mn2+
was
investigated in order to calculate the thermodynamic
parameter; 0.05 g of adsorbent was mixed with 10 mL of 200
mgL-1
metal ion solutions at a range of temperature from
303–333 K [11].
III. RESULTS AND DISCUSSION
A. Characterization of HFOs-resin
The hybrid sorbent HFOs-resin retained the spherical
geometry and developed a deep brown color after being
loaded with ferric oxide. The content of HFO loaded within
the cation exchange resin was about 12.3% in Fe mass (Table
I).
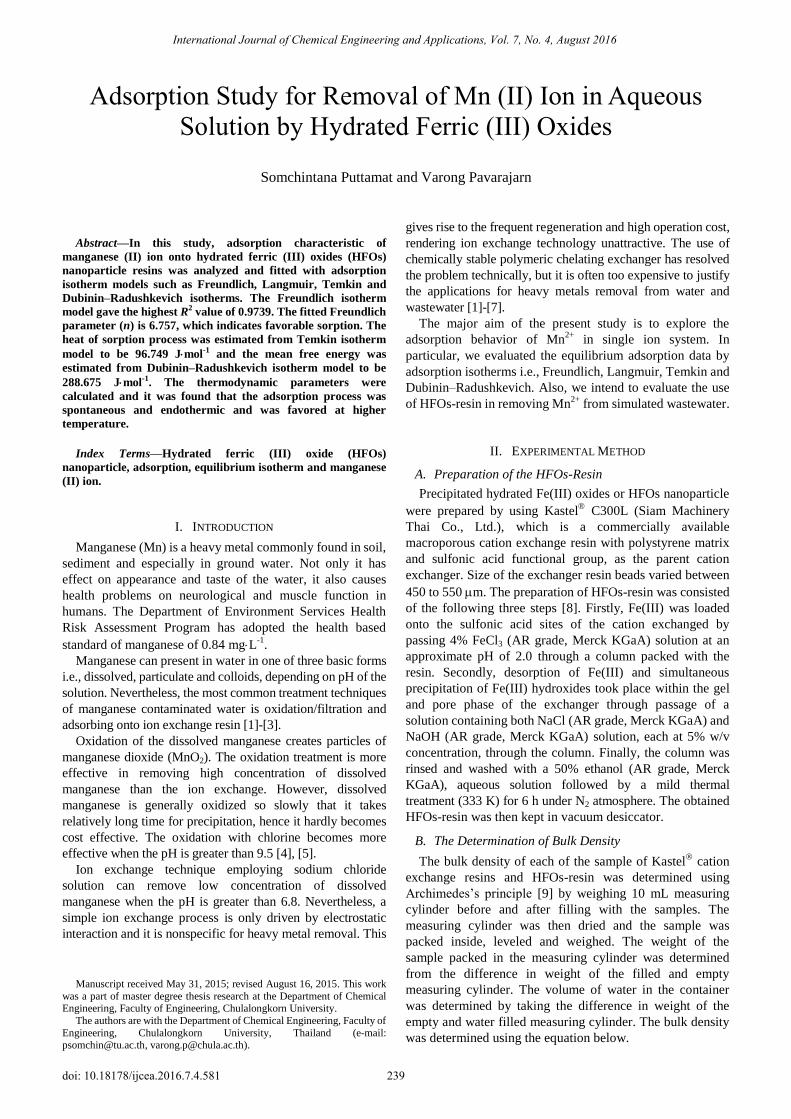
Fig. 1. FTIR chromatogram for HFOs-resin.
The FTIR spectra of HFO showed two major adsorption
peaks (Fig. 1). The peak at 3453 cm-1
is for the stretching
vibration of lattice water and hydroxyl group, while that
located at 1643 cm-1
is for -OH bending vibration of adsorbed
water molecules. The spectra also showed significant band of
metal at 682 and 583 cm-1
for Fe3+
adsorption.
TABLE I: SOME PROPERTIES OF THE CATION EXCHANGER (KASTEL
C300L) AND HFOS-RESIN
Sorbent
Kastel C300L HFOs-resin
Matrix structure Polystyrene Polystyrene
Functional groups R-SO3Na R-SO3Na; HFO
BET surface area (m2mg-1) 22.7 29.4
Average pore diameter (nm) 30.8 21.7
Apparent density (gmcm-3) 0.46 0.62
HFO content (Fe mass%) 0 12.3
B. Adsorption Isotherms of Mn (II) onto HFOs-Resins
The equilibrium adsorption of the Mn2+
was carried out as
mentioned earlier. The mixture was sampled every 5 minutes
to be analyzed for metal ion concentration using ICP-OES.
The data was fitted into following isotherms: Freundlich,
Langmuir, Temkin and Dubinin–Radushkevich.
1) Freundlich adsorption isotherm is commonly used to
describe the adsorption characteristics for the heterogeneous
surface. These data is often fitted with the following
empirical equation proposed by Freundlich [10]:
1
ne f eq K C (4)
where:
Kf = Freundlich isotherm constant (mgg-1
).
n = adsorption intensity.
Ce = the equilibrium concentration of adsorbate (mgL-1
)
qe = the amount of metal adsorbed per gram of the
adsorbent at equilibrium (mgg-1
).
3453
1643 6
82
583
20
25
30
35
40
45
50
55
60
05001000150020002500300035004000
Tra
nsm
itta
nce, %
wavelenght, cm-1
International Journal of Chemical Engineering and Applications, Vol. 7, No. 4, August 2016
240
Linearized form of the equation (4) can be written as:
1
log log log e f eq K Cn
(5)
The constant Kf is an approximate indicator of adsorption
capacity, while 1/n is a function of the strength of adsorption
in the adsorption process. If n = 1, then the partition between
the two phases are independent of the concentration. If value
of 1/n is below one, it indicates a normal adsorption. On the
other hand, 1/n being above one indicates cooperative
adsorption. The function has an asymptotic maximum as the
concentration is increased. As the temperature is increased,
the constants Kf and n change to reflect the empirical
observation that the quantity adsorbed rises more slowly and
higher concentration is required to saturate the surface.
However, Kf and n are characteristic parameters of the
sorbent-sorbate system, which must be determined by data
fitting. Linear regression is generally used to determine the
parameters of kinetic and isotherm models. Specifically, the
linear least-square method and the linearly transformed
equation have been widely applied to correlate sorption data
where 1/n is heterogeneity parameter. The smaller 1/n
becomes, the greater the expected heterogeneity is. This
expression can be reduced to a linear adsorption isotherm
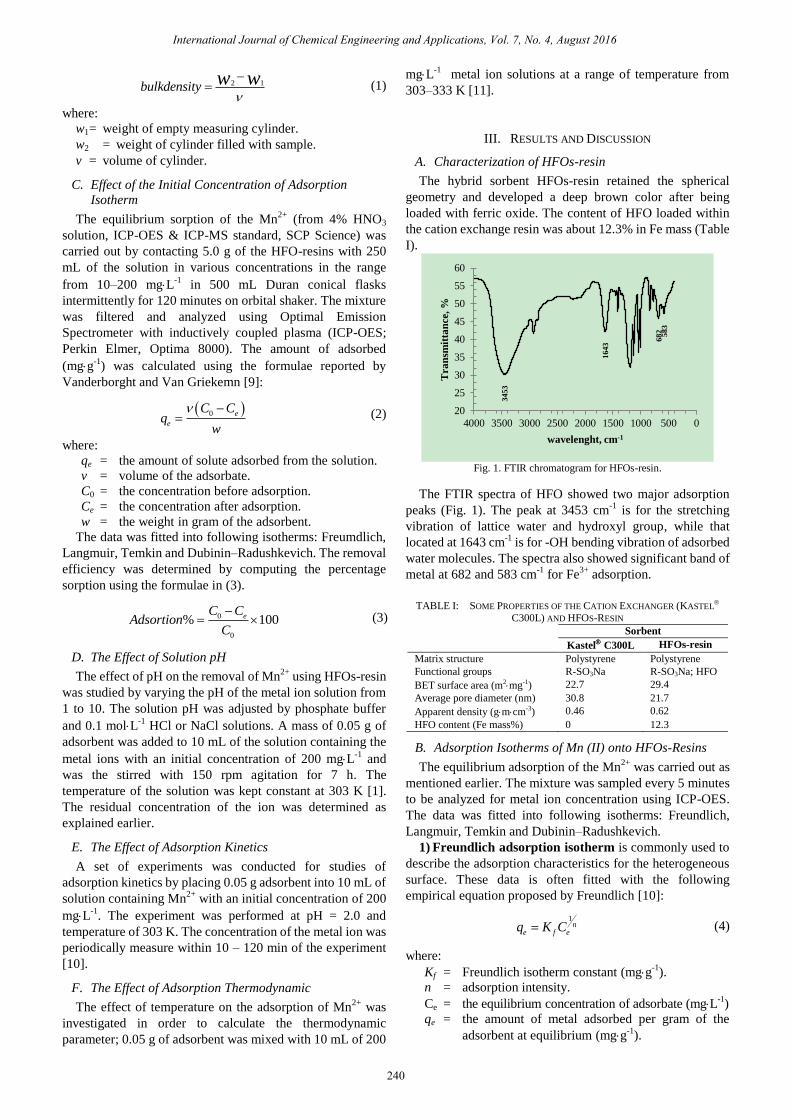
when 1/n = 1. If n lies between one and ten, this indicates a
favorable sorption process [9-10]. The value of 1/n = 0.148
while n = 6.757 indicating that the sorption of Mn2+
onto
HFO-resin is favorable and the R2 value is 0.9739 proving
that the sorption data is fitted well to Freundlich isotherm
model.
Fig. 2. Freundlich adsorption isotherm.
2) Langmuir adsorption isotherm model describes
quantitatively the formation of a formation of a monolayer
adsorbate on the outer surface of the adsorbent, after which
no further adsorption takes place. Thereby, the Langmuir
represents the equilibrium distribution of metal ions between
the solid and liquid phases. The Langmuir isotherm is valid
for monolayer adsorption onto a surface containing a finite
number of identical sites. The model assumes uniform energy
of adsorption onto the surface and no transmigration of
adsorbate in the plane of the surface. Based upon these
assumptions, Langmuir represented the following equation
[10]:
1
m L ee
L e
q K Cq
K C (6)
Langmuir adsorption parameters can be determined by
transforming the Langmuir (6) into linear form.
1 1 1
e m m L eq q q K C (7)
where:
Ce = the equilibrium concentration of adsorbate (mgL-1
).
qe = the amount of metal adsorbed per gram of the
adsorbent at equilibrium (mgg-1
).
qm = maximum monolayer coverage capacity (mgg-1
).
KL = Langmuir isotherm constant (Lmg-1
).
The value of qmax and KL were computed from the slope
and intercept of the Langmuir plot of 1/qe versus 1/Ce. The
essential features of the Langmuir isotherm may be expressed
in terms of equilibrium parameter RL, which is a
dimensionless constant referred to as separation factor or
equilibrium parameter.
0
1
1 (1 )L
L
RK C
(8)
where:
C0 = initial concentration.
KL = the constant related to the energy of adsorption
(Langmuir Constant).
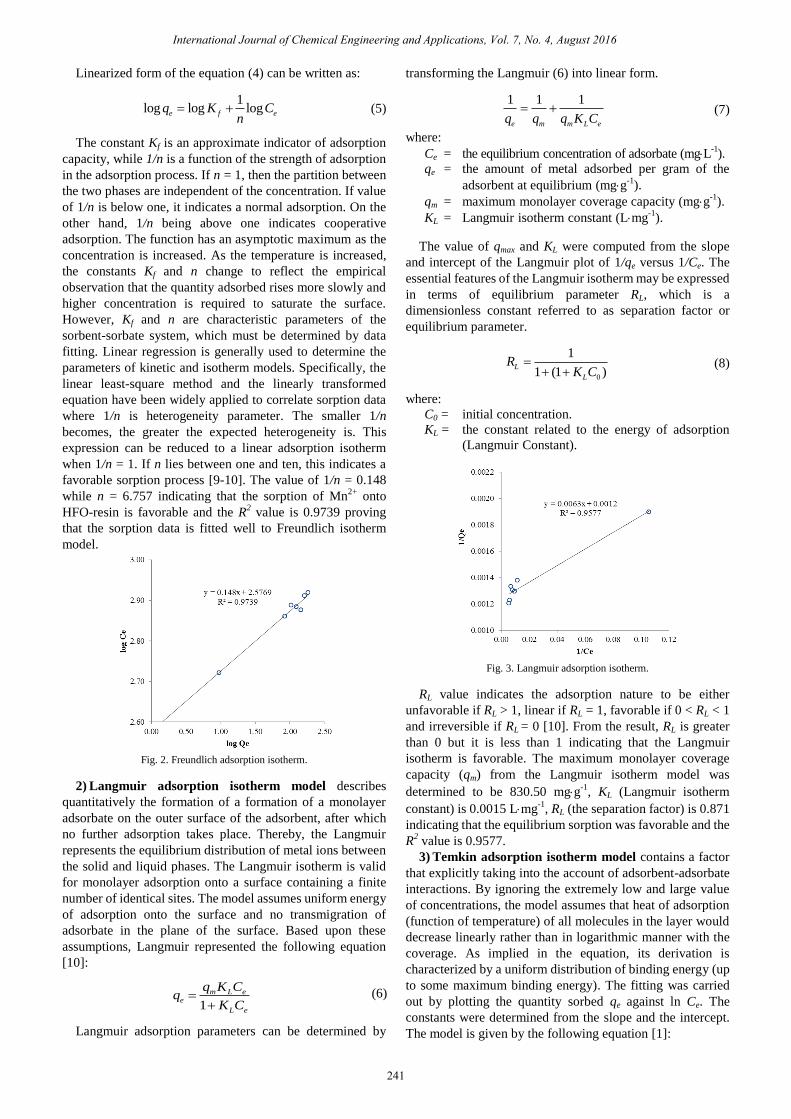
Fig. 3. Langmuir adsorption isotherm.
RL value indicates the adsorption nature to be either
unfavorable if RL > 1, linear if RL = 1, favorable if 0 < RL < 1
and irreversible if RL = 0 [10]. From the result, RL is greater
than 0 but it is less than 1 indicating that the Langmuir
isotherm is favorable. The maximum monolayer coverage
capacity (qm) from the Langmuir isotherm model was
determined to be 830.50 mgg-1
, KL (Langmuir isotherm
constant) is 0.0015 Lmg-1
, RL (the separation factor) is 0.871
indicating that the equilibrium sorption was favorable and the
R2 value is 0.9577.
3) Temkin adsorption isotherm model contains a factor
that explicitly taking into the account of adsorbent-adsorbate
interactions. By ignoring the extremely low and large value
of concentrations, the model assumes that heat of adsorption
(function of temperature) of all molecules in the layer would
decrease linearly rather than in logarithmic manner with the
coverage. As implied in the equation, its derivation is
characterized by a uniform distribution of binding energy (up
to some maximum binding energy). The fitting was carried
out by plotting the quantity sorbed qe against ln Ce. The
constants were determined from the slope and the intercept.
The model is given by the following equation [1]:
International Journal of Chemical Engineering and Applications, Vol. 7, No. 4, August 2016
241
lne T e
T
RTq A C
b (9)
ln ln
e T e
T T
RT RTq A C
b b (10)
T
RTB
b
(11)
ln lne T eq B A B C
(12)
where:
AT = Temkin isotherm equilibrium binding constant
(Lg-1
)
bT = Temkin isotherm constant
R = Universal gas constant (8.314 Jmol-1K
-1)
T = Temperature at 298 K.
B = Constant related to heat of sorption (Jmol-1
)
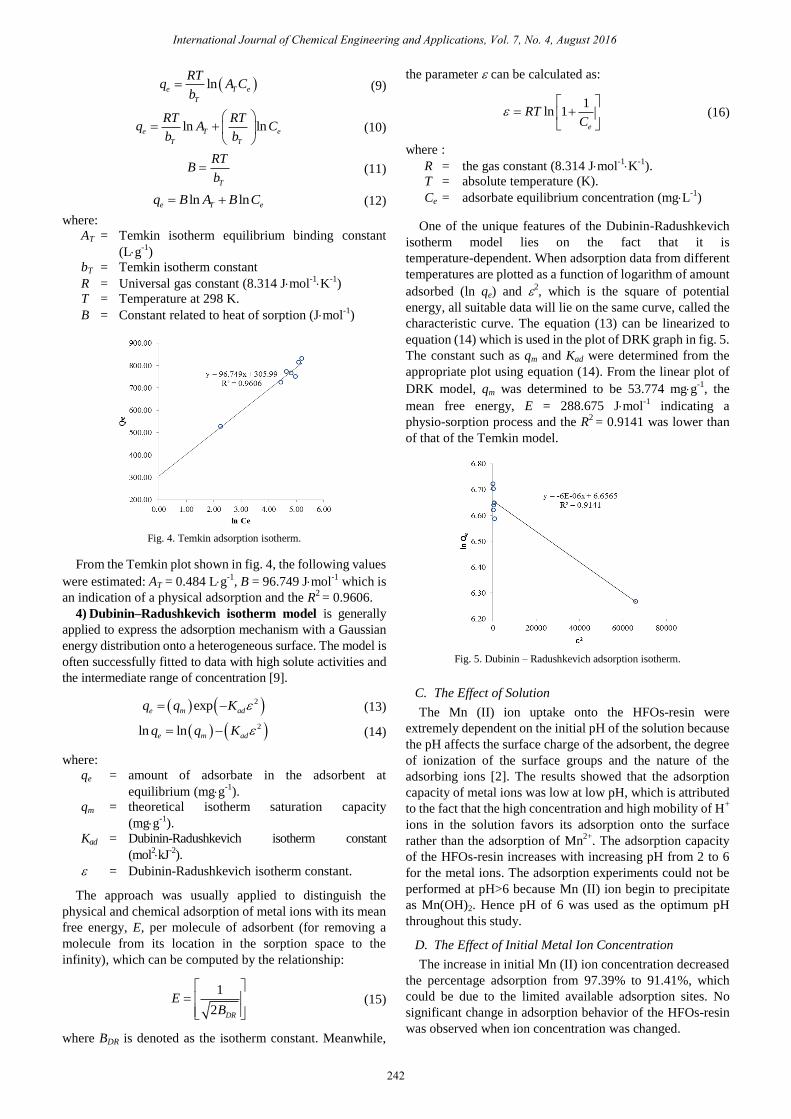
Fig. 4. Temkin adsorption isotherm.
From the Temkin plot shown in fig. 4, the following values
were estimated: AT = 0.484 Lg-1
, B = 96.749 Jmol-1
which is
an indication of a physical adsorption and the R2 = 0.9606.
4) Dubinin–Radushkevich isotherm model is generally
applied to express the adsorption mechanism with a Gaussian
energy distribution onto a heterogeneous surface. The model is
often successfully fitted to data with high solute activities and
the intermediate range of concentration [9].
2exp e m adq q K (13)
2ln ln e m adq q K (14)
where:
qe = amount of adsorbate in the adsorbent at
equilibrium (mgg-1
).
qm = theoretical isotherm saturation capacity
(mgg-1
).
Kad = Dubinin-Radushkevich isotherm constant
(mol2kJ
-2).
= Dubinin-Radushkevich isotherm constant.
The approach was usually applied to distinguish the
physical and chemical adsorption of metal ions with its mean
free energy, E, per molecule of adsorbent (for removing a
molecule from its location in the sorption space to the
infinity), which can be computed by the relationship:
1
2 DR
EB
(15)
where BDR is denoted as the isotherm constant. Meanwhile,
the parameter can be calculated as:
1ln 1
e
RTC
(16)
where :
R = the gas constant (8.314 Jmol-1K
-1).
T = absolute temperature (K).
Ce = adsorbate equilibrium concentration (mgL-1
)
One of the unique features of the Dubinin-Radushkevich
isotherm model lies on the fact that it is
temperature-dependent. When adsorption data from different
temperatures are plotted as a function of logarithm of amount
adsorbed (ln qe) and 2, which is the square of potential
energy, all suitable data will lie on the same curve, called the
characteristic curve. The equation (13) can be linearized to
equation (14) which is used in the plot of DRK graph in fig. 5.
The constant such as qm and Kad were determined from the
appropriate plot using equation (14). From the linear plot of
DRK model, qm was determined to be 53.774 mgg-1
, the
mean free energy, E = 288.675 Jmol-1
indicating a
physio-sorption process and the R2 = 0.9141 was lower than
of that of the Temkin model.
Fig. 5. Dubinin – Radushkevich adsorption isotherm.
C. The Effect of Solution
The Mn (II) ion uptake onto the HFOs-resin were
extremely dependent on the initial pH of the solution because
the pH affects the surface charge of the adsorbent, the degree
of ionization of the surface groups and the nature of the
adsorbing ions [2]. The results showed that the adsorption
capacity of metal ions was low at low pH, which is attributed
to the fact that the high concentration and high mobility of H+
ions in the solution favors its adsorption onto the surface
rather than the adsorption of Mn2+
. The adsorption capacity
of the HFOs-resin increases with increasing pH from 2 to 6
for the metal ions. The adsorption experiments could not be
performed at pH>6 because Mn (II) ion begin to precipitate
as Mn(OH)2. Hence pH of 6 was used as the optimum pH
throughout this study.
D. The Effect of Initial Metal Ion Concentration
The increase in initial Mn (II) ion concentration decreased
the percentage adsorption from 97.39% to 91.41%, which
could be due to the limited available adsorption sites. No
significant change in adsorption behavior of the HFOs-resin
was observed when ion concentration was changed.
International Journal of Chemical Engineering and Applications, Vol. 7, No. 4, August 2016
242

E. The Effect of Adsorption Kinetic
Adsorption is a time dependent process. In this section, our
main objective is to study the effect of pre-equilibrium
contact time in order to better comprehend the adsorption
kinetics of heavy metal ions onto the HFOs-resin. It was
found that the amount of adsorbed ions increased rapidly in
the first 25 min, which indicates that there were enough
adsorption sites for the ions to be accommodated. Then, the
process slows down as the adsorption sites became gradually
saturated. The adsorption equilibrium was reached at about
120 min. Also, the adsorption of metal ions increased with
agitation time, perhaps due to a decrease in mass transfer
resistance in the bulk solution and an increase in the kinetic
energy of the hydrated ions. The kinetics of adsorption is one
of the most important aspects defining the efficiency of
adsorption and also provides important information about of
the rate at which the pollutant is removed from the
wastewater for better design batch adsorption systems [7]. In
this study, the experimental data were analyzed using a
number of kinetic models in order to investigate the
mechanism of heavy metal ion adsorption onto the adsorbent.
The potential rate-controlling steps are transport of the ion to
the surface and surface adsorption itself.
F. The Effect of Temperature
In order to investigate the effect of temperature on the
adsorption capacity of Mn (II) onto the HFOs-resin, it is
observed that adsorption capacity increases with increasing
temperature in the range 303–333 K, demonstrating that the
process of adsorption is endothermic. This increase can be
due to the increased mobility of metal ions and to their
tendency to adsorb from the solution to the surface of the
adsorbent as well as due to a greater activity of binding sites
as the temperature is increased [10].
IV. CONCLUSIONS
In this paper, HFOs-resin were prepared by using Kastel
C300L resin as the starting material and applied as an
adsorbent. Adsorption experiments have shown that the
HFOs-resin has high adsorption capacity and can be used as a
sorbent for the removal of Mn (II) ion in aqueous solution.
The maximum adsorption capacity of the HFOs-resin was
111.925 mgg-1
. The pseudo-second order kinetic model was
applied to the experimental data, confirming that sorption
was chemically controlled and followed the intra-particle
diffusion model. However, intra particle diffusion was not
the sole rate-controlling step. The isotherm adsorption data
were well fitted by the Freundlich model. It gave the highest
R2 value, the sorption intensity which indicates favorable
sorption and the correlation value were 6.757 and 0.9739
respectively. Also from Langmuir isotherm model, the
maximum monolayer coverage was determined to be 830.50
mgg-1
, the separation factor indicating a favorable sorption
experiment 0.871. The heat of sorption process was estimated
from Temkin isotherm model to be 96.749 Jmol-1
and the
mean free energy was estimates from Dubinin-Radushkevich
isotherm model to be 288.675 Jmol-1
. Based on the
thermodynamic parameters (ΔG°, ΔH° and ΔS°), it was
found that the adsorption process was spontaneous and
endothermic over the temperature range considered.
ACKNOWLEDGMENT
The authors are thankful to Scientific and Technological
Research Equipment Centre, Chulalongkorn University for
equipping the analyses and Department of Chemistry,
Faculty of Science and Technology, Thammasat University
for core research work where this research work was carried
out.
REFERENCES
[1] B. Pan, H. Qiu, B. Pan, G. Nie, L. Xiao, L. Lv, W. Zhang, Q. Zhang,
and S. Zhang, “Highly efficient removal of heavy metals by olymer-supported nanosized hydrated Fe(III) oxides: Behavior and
XPS study,” Water Research, vol.44 , pp. 815-824, Oct. 2010.
[2] N. N. Nassar, “Rapid removal and recovery of Pb(II) from wastewater by magnetic nanoadsorbents,” J. of Hazardous Material, vol. 184, pp.
538-546, August 2010.
[3] S. Mandal, T. Padhi, and R. K. Patel, “Studies on the removal of
arsenic (III) from water by a novel hybrid material,” J. of Hazardous
Material, vol. 192, pp. 899-908, June 2011.
[4] Q. Su, B. Pan, S. Wan, W. Zhang, and L. Lv, “Use of hydrous manganese dioxide as a potential sorbent for selective removal of lead,
cadmium and zinc ion from water,” J. of Colloid and Interface Science,
vol. 349, pp. 607-612, May 2010. [5] S. Wan, X. Zhao, L. Lv, Q. Su, H. Gu, B. Pan, W. Zhang, Z. Lin, and J.
Luan, “Selective adsorption of Cd(III) and Zn(III) ions by Nano –
Hydrous Manganese Dioxide (HMO) – Encapsulated Cation exchanger,” Ind. Eng. Chem. Res., vol. 495, pp. 7574-7579, 2010.
[6] P. Puttamraju and A. K. SenGupta, “Evidence of Tunable on – off
sorption behaviors of metal oxide nanoparticles: Role of ion exchanger support,” Ind. Eng. Chem. Res., vol. 45, pp. 7737-7742, 2006.
[7] Q. R. Zhang, W. Du, B. C. Pan, B. J. Pan, W. M. Zhang, Q. J. Zhang,
Z.W. Xu, and Q. X. Zhang, “A comparative study on Pb2+, Zn2+ and Cd2+ sorption onto zirconium phosphate supported by a cation
exchanger,” J. of Hazardous Material, vol. 152, pp. 469-475, July
2007. [8] N. Tewari, P. Vasudevan, and B. K. Guha, “Study on biosorption of
Cr(VI) by Mucor hiemalis,” Biochemical Engineering Journal, vol. 23,
pp. 185-192, January 2005. [9] A. O. Dada, A. P. Olalekan, A. M. Olatunya, and O. Dada, “Langmuir,
Freundlich, Temkin and Dubinin – Raduskevich isotherms studies of
equilium Sorption of Zn2+ unto phosphoric acid modified rich husk,” OSR J. of Applied Chemistry, vol. 3, pp. 38-45, Nov.-Dec. 2012.
[10] F. Rashidi, R. S. Sarabi, Z. Ghasemi, and A. Seif, “Kinetic, equilibrium and thermodynamic studies for the removal of lead (II) and copper (II)
ions from aqueous solutions by nanocrystalline TiO2,” Superlattices
and Microstructures, vol. 48, pp. 577-591, December 2010. [11] B. Pan, J. Wu, B. Pan, L. Lv, W. Zhang, L. Xiao, X. Wang, X. Tao, and
S. Zheng, “Development pf polymer-based nanosized hydrated ferric
oxides (HFOs) for enhanced phosphate removal from waste effluents,” Water Research, vol.43 , pp. 4421–4429, July 2009.
Somchintana Puttamat holds a B.Sc. degree in
chemistry from Thaksin University, Songkhla Province
since 2000, and now she is studying chemical
engineering for master degree at Chulalongkorn
University.
After graduated with a B.Sc. degree, she works as a supervisor engineer at Unocal Thailand, Ltd. for a year
and she applied to become a government officer as
scientist at the Department of Science Service (DSS), the Ministry of Science and Technology, Bangkok during 2002-2003. Now
she works as Chemical Scientist at Department of Chemistry, Faculty of
Science and Technology, Thammasat University, Thailand since 2004.
Varong Pavarajarn has graduated with a B.Eng. degree in chemical
engineering from Chulalongkorn University, Bangkok, Thailand, in the
1992 and received a Ph.D. degree in chemical engineering from Oregon State University, U.S.A. in 2002. Since 2002, he has become a faculty
member at the Department of Chemical Engineering, Faculty of
Engineering, Chulalongkorn University, Bangkok, Thailand. Presently he holds a position as Associated Professor.
International Journal of Chemical Engineering and Applications, Vol. 7, No. 4, August 2016
243