solving the global cooling challenge - rmi.org · individual mini-split or self-contained window ac...
TRANSCRIPT

Solving the Global Cooling ChallengeHow to Counter the Climate Threat from Room Air Conditioners
By Iain Campbell, Ankit Kalanki, and Sneha Sachar
RO
C
KY MOUNTAIN
INSTIT UTE
A report by

| iSOLVING THE GLOBAL COOLING CHALLENGE: How to Counter the Climate Threat from Room Air Conditioners
Authors Iain Campbell, Ankit Kalanki, and Sneha Sachar (AEEE) * Authors listed alphabetically. All authors from Rocky Mountain Institute unless otherwise
noted.
Contacts Iain Campbell, [email protected] Ankit Kalanki, [email protected]
Suggested Citation Sachar, Sneha, Iain Campbell, and Ankit Kalanki, Solving the Global Cooling Challenge: How to Counter the Climate Threat from Room Air Conditioners. Rocky Mountain Institute, 2018. www.rmi.org/insight/solving_the_global_cooling_challenge.
Editorial/Design Editorial Director: Cindie Baker Editor: Laurie Guevara-Stone Layout: Aspire Design, New Delhi
Images courtesy of iStock unless otherwise noted.
Acknowledgments The authors thank the following individuals/organizations for offering their insights and perspectives on this work. The names are listed in alphabetical order by last name.Omar Abdelaziz, Clean Energy Air and Water Technologies, FZEPaul Bunje, Conservation X LabsAlex Dehgan, Conservation X labsSukumar Devotta, Former Director at National Environmental Engineering Research InstituteGabrielle Dreyfus, Institute of Governance and Sustainable DevelopmentJohn Dulac, International Energy AgencyChad Gallinat, Conservation X LabsBen Hartley, SEforALLSaikiran Kasamsetty, Alliance for an Energy Efficient EconomySatish Kumar, Alliance for an Energy Efficient EconomyRadhika Lalit, Rocky Mountain InstituteJames Mandel, Rocky Mountain InstituteSubhash Mullick, Former Professor at Indian Institute of Technology, DelhiSrinivasa Murthy, Indian Institute of Science, BangaloreRushad Nanavatty, Rocky Mountain InstituteElizabeth O’Grady, Rocky Mountain InstituteToby Peters, University of BirminghamRajan Rawal, Centre for Advanced Research in Building Science and Energy, CEPT UniversityNihar Shah, Lawrence Berkeley National LaboratoryYash Shukla, Centre for Advanced Research in Building Science and Energy, CEPT UniversityWilliam Sisson, Energy Projects Investment Company, LLCCaroline Winslow, Rocky Mountain Institute Hayes Zirnhelt, Rocky Mountain Institute
About Rocky Mountain Institute
Rocky Mountain Institute (RMI)—an independent nonprofit founded in 1982—transforms global energy use to create a clean, prosperous, and secure low-carbon future. It engages businesses, communities, institutions, and entrepreneurs to accelerate the adoption of market-based solu-tions that cost-effectively shift from fossil fuels to efficiency and renewables. RMI has offices in Basalt and Boulder, Colorado; New York City; Washington, D.C.; and Beijing.
Authors & Acknowledgments
RO
C
KY MOUNTAIN
INSTIT UTE
A report by

| vSOLVING THE GLOBAL COOLING CHALLENGE: How to Counter the Climate Threat from Room Air Conditioners
Table of Contents
ABSTRACT vii
1. THE CHALLENGE OF COOLING A WARMING WORLD 1
Growth Drivers 2
Worldwide Growth Outlook for Room Air Conditioners (RACs) 5
Key Findings of the Reference Scenario 6
Impacts of Cooling Growth 8
What This Means in a Nutshell 12
2. HOW THE WORLD IS RESPONDING TO THE COOLING CHALLENGE 15
Air Conditioner Industry Overview 16
The Market Failures 17
Conventional Solutions and Strategies 19
Impact of Conventional Strategies: How Far Can They Take Us? 20
Call for Action: The Need for a Step-Change 22
3. SOLVING THE GLOBAL COOLING CHALLENGE: THE 5X SOLUTION 23
Potential Impacts of the 5X Solution 24
5X Innovation Is Achievable Today 27
Market Landscape to Enable the Technology to Scale 29
Conclusion 31
APPENDIX 33
REFERENCES 40

vi | SOLVING THE GLOBAL COOLING CHALLENGE: How to Counter the Climate Threat from Room Air Conditioners
Figure 1.1: Estimates of installed RAC stock worldwide by the year 2050 2
Figure 1.2: Households with air conditioning today (percent) 3
Figure 1.3: Multiple drivers contribute to the sharp rise in global RAC demand 4
Figure 1.4: Global room air conditioner stock projections by region 2016–2050 6
Figure 1.5: Total and per capita electricity consumption from RACs by region—Reference Scenario
7
Figure 1.6: Share of RAC electricity consumption in total electricity consumption—Reference Scenario
9
Figure 1.7: New power generation capacity to meet the peak demand from RACs by 2050—Reference Scenario
9
Figure 1.8: Cumulative CO2e emissions (direct and indirect) from RAC operation by 2050 10
Figure 1.9: Share of RAC-related CO2e emissions (Reference Scenario) as percent of total CO2 emissions from primary energy
11
Figure 1.10: Impact of Kigali Amendment on annual CO2e emissions (direct and indirect) from RAC operation
12
Figure 2.1: Energy efficiency of most-stringent label compared to best-in-class AC units 16
Figure 2.2: Theoretical maximum efficiency achieved by different industries 17
Figure 2.3: How far the conventional strategies can take us 21
Figure 3.1: Annual emissions from RAC operations between 2016 and 2050 24
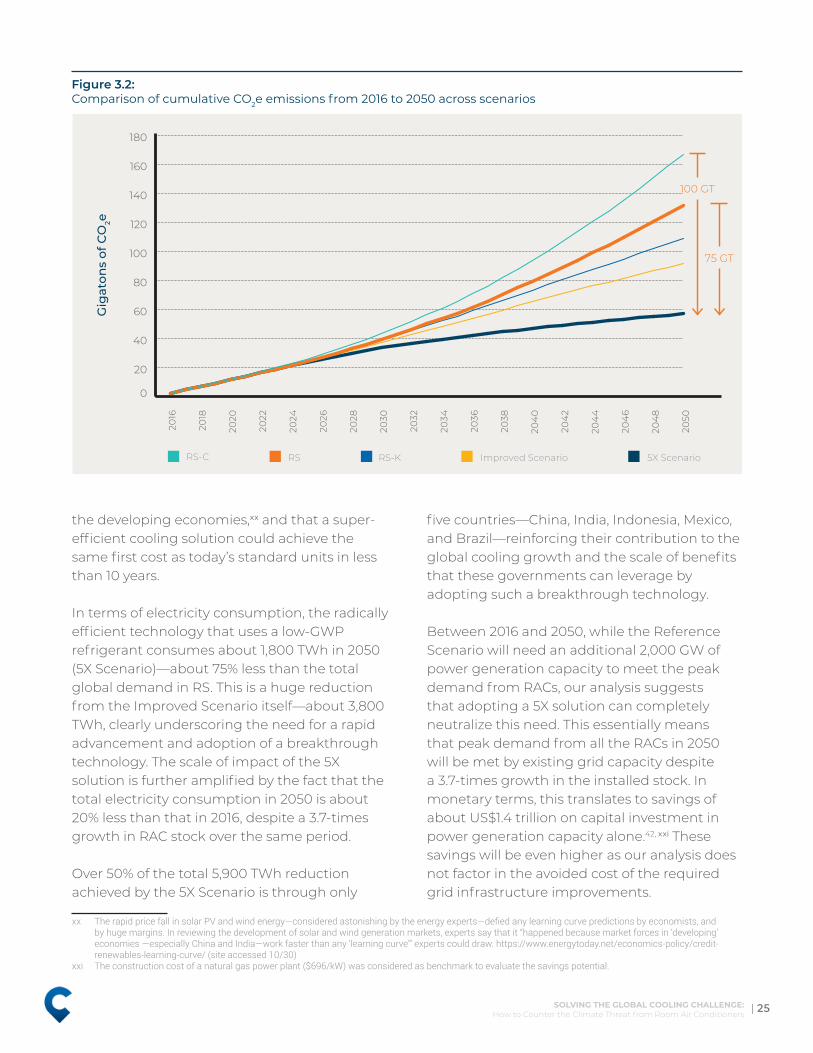
Figure 3.2: Comparison of cumulative CO2e emissions from 2016 to 2050 across scenarios 25
Figure 3.3: Electricity consumption from RAC operation in 2050 26
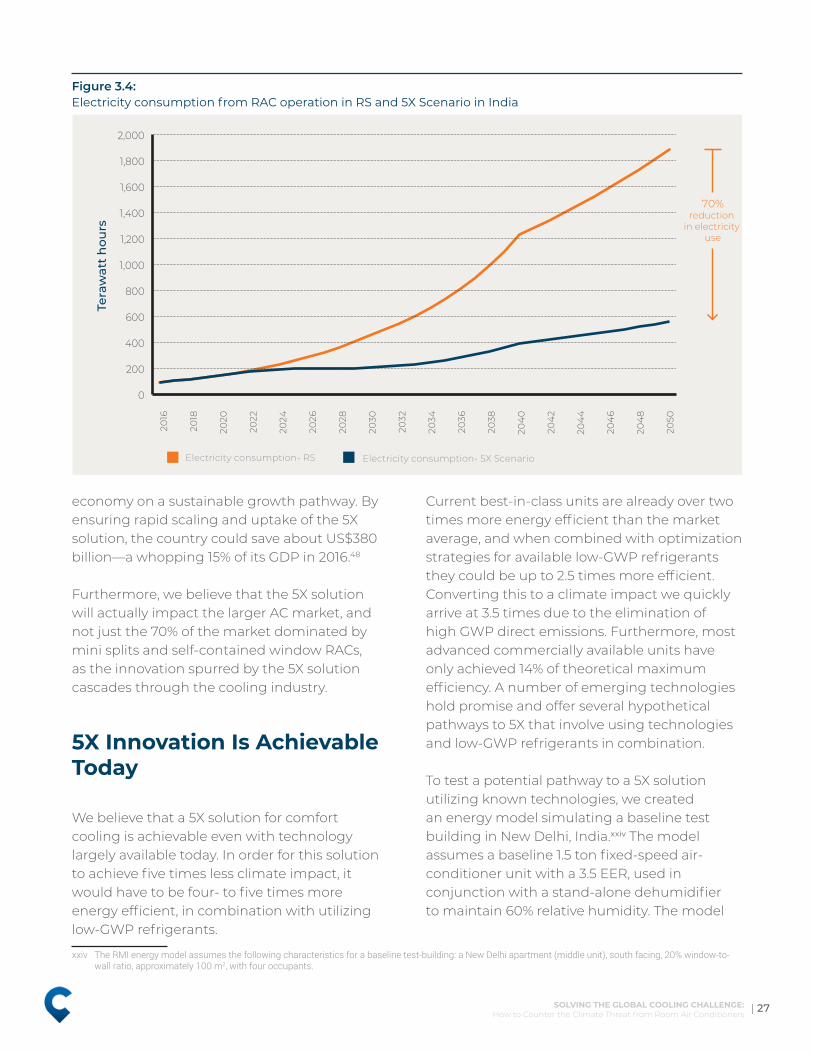
Figure 3.4: Electricity consumption from RAC operation in RS and 5X Scenario in India 27
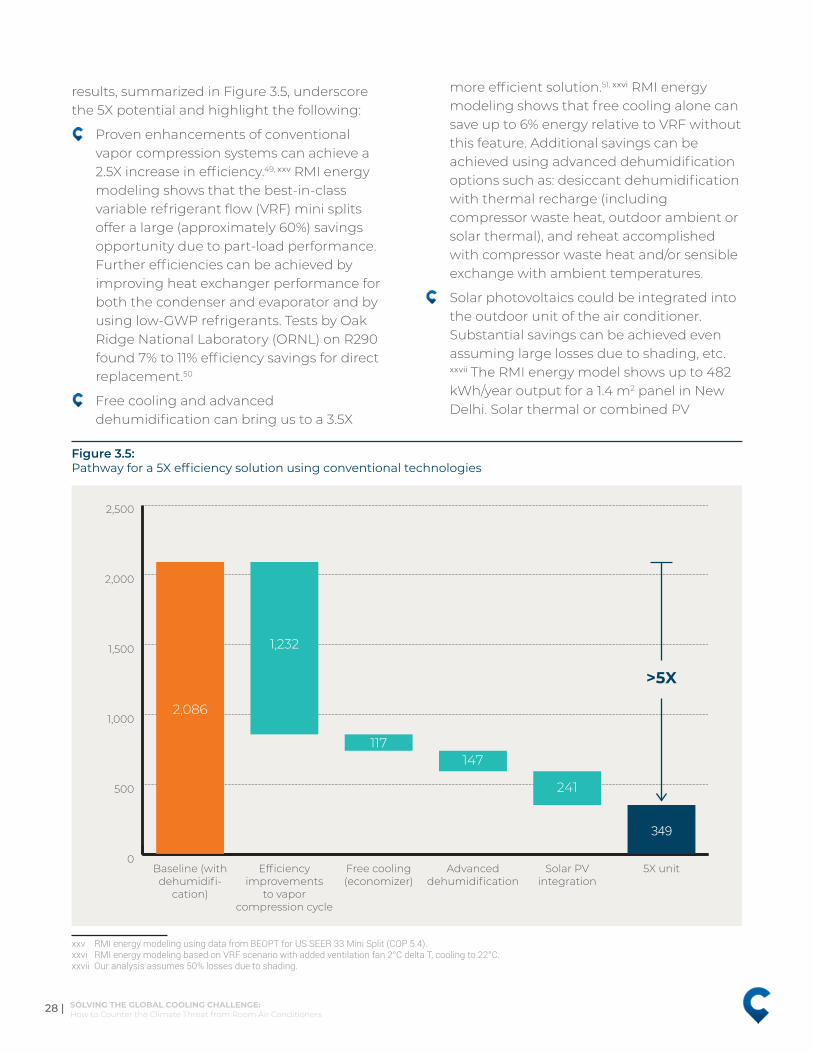
Figure 3.5: Pathway for a 5X efficiency solution using conventional technologies 28
Figure 3.6: RAC efficiency versus cost: India example 29
Figure 3.7: Projected 5X solution costs vs. current market average at different learning rates. 30
List of Figures

AbstractComfort cooling represents one of the largest end-use risks to our climate, and the residential sector alone is set to account for an over 0.5º C increase in global temperatures by 2100. A warming planet, rapid urbanization, growing population, and rising incomes are driving up the global demand for air conditioning, and under a business-as-usual growth trajectory, the number of room air conditioner (RAC) units in service is estimated to increase from 1.2 billion units today to 4.5 billion units by 2050. Much of this growth comes from emerging economies, which will see a five-times (5X) increase in the number of RACs between now and 2050.
The most advanced commercially available, vapor compression-based RACs have achieved only about 14% of the theoretical efficiency limit;i efforts to date have focused on meeting minimum performance standards and refrigerant transitions, and not transformative innovation in efficiency. Our analysis shows that conventional solutions— such as efficient building design, improved maintenance and operations, and driving behavior change, in combination with the incremental pace of technology improvement— will only address a portion of the challenge and cannot bring us anywhere close to neutralizing the impacts of the projected increase in the number of RACs. The world needs a radical change in comfort cooling technology, one that can effectively and assuredly offset the exponential increase in cooling energy demand and put us on a path to cooling with less warming.
i ThetheoreticalefficiencylimitistheefficiencyofaCarnotcycleoperatingbetweentwotemperatures.Consideringatypicaloutsidetemperatureof35°Candinsidetemperatureof27°C,themaximumpossibleefficiency(EER)is37.5W/W.ThebestavailableroomairconditionersintheworldhaveanEERofaroundsix.ThiscalculationforaCarnotcycleisbasedonthesensiblecoolingloadonly(i.e.,coolingtheairfromasourcetemperatureof35°Ctoasinktemperatureof27°C)andignoresthelatentloadimpact.Inaddition,webelievethatlatentload,ifany,canbemetviaadesiccantsystemwith100%theoreticalefficiency.ThisisfurtherinaccordancewiththeBureauofEnergyEfficiency(BEE),GovernmentofIndia,standardtestconditionsforevaluatingthecoolingcapacityofvariablecapacityroomairconditionersinIndia.
To offset the 5X increase in RAC cooling demand in the developing economies, we envision a technology solution that has one-fifth of the climate impact (grid-supplied electricity and refrigerant global warming potential [GWP] taken together) as compared to today’s standard products—the 5X solution. Scaling the 5X solution could be the most effective and certain step we can take to mitigate the climate impact of comfort cooling, bringing in cumulative emissions reductions of up to 100 gigatons by 2050, and helping us mitigate up to 0.5 °C in global warming impact by 2100.

| viiiSOLVING THE GLOBAL COOLING CHALLENGE: How to Counter the Climate Threat from Room Air Conditioners

THE CHALLENGE OF COOLING A WARMING WORLD
01
The world is poised for a significant growth in energy requirements for comfort cooling. With increasing populations and urbanization, and rising temperatures exacerbated by expanding urban heat-islands,1 cooling is, in many parts of the world, no longer a luxury, but an urgent priority for health and well-being, productivity, and in extreme cases, survival.
The use of energy for cooling buildings has more than tripled between 1990 and 2016, and is continuing to grow faster than for any other end use in buildings.2 Nearly 70% of this increase comes from the residential sector, where the potential for comfort cooling is the largest and continues to grow, particularly in developing economies.
Globally, air-conditioning (AC) systems are the dominant technology to achieve comfort cooling, with RACs—either individual mini-split or self-contained window AC units—constituting the overwhelming majority (~70%) of ACs in use today.ii RACs are the technology of choice in developing markets due to lowest cost to access, particularly in the residential sector, and are expected to grow disproportionately to other AC product categories.
ii Forthepurposeofthisstudy,aroomairconditioner(RAC)isdefinedasaself-containedorsplit-systemairconditionertypicallyupto15KWcapacityusedinresidentialcoolingbutthatcanalsobeusedinthecommercialsector.Theuseoftheterm“comfortcooling”inthisreportpertainstocoolingachievedfromtheuseofRACs,unlessotherwisespecified.
While the absolute numbers projected by different studies vary, they unanimously point to an astounding increase in the energy used by RACs between 2016 to 2050—estimated to be over three-fold globally and five-fold in the developing countries. Figure 1.1 maps RAC growth projected by Lawrence Berkeley National Laboratory (LBNL), the Green Cooling Initiative (GCI), and the International Energy Agency (IEA): these studies are conducted in different time periods—which may explain the variations in projections—with the most recent being the IEA’s The Future of Cooling report which shows that the projections have only increased over time.3 Several studies, including the IPCC’s latest report, highlight that the planet is warming faster than expected,4,5 which will lead to an increased demand for cooling, further strengthening the case for more aggressive growth projections in air conditioners.
Our analysis shows that at the current growth trajectory of RACs, by the year 2100 the world may see an over 50-fold increase in the cooling energy demand since the start of the century, causing over 0.5oC increase in global surface temperatures due to RAC growth alone.

2 | SOLVING THE GLOBAL COOLING CHALLENGE: How to Counter the Climate Threat from Room Air Conditioners
Growth DriversMultiple drivers are acting concurrently to contribute to the escalating demand for comfort cooling.
A Warming Planet: The average rate of change of global average surface temperature since 1901 is 0.7°C–0.9°C per century. However, this rate of change has nearly doubled in the period since 1975 (1.5°C–1.8°C per century).6 Per the international State of the Climate in 2017 report,7 the 10 warmest years on record have all occurred since 1998. Looking back to 1998, a pattern emerges: except for 2011, each new year
is one of the top 10 warmest on record at that time.
Available data points to the fact that our planet is warming at an increasing rate. Global average surface temperatures are expected to rise between 2oC and 5oC at current warming rates by 2100, making summers longer and hotter.8 The average number of cooling degree days (CDDs) across the globe have been on the rise, particularly in the recent few decades. An IEA study projects that CDDs will increase by around 25% globally by 2050,9 with the biggest increases occurring in already hot places where
0
500
1000
1500
2000
2500
3000
3500
4000
4500
5000
20
16
20
17
20
18
20
19
20
20
20
21
20
22
20
23
20
24
20
25
20
26
20
27
20
28
20
29
20
30
20
31
20
32
20
33
20
34
20
35
20
36
20
37
20
38
20
39
20
40
20
41
20
42
20
43
20
44
20
45
20
46
20
47
20
48
20
49
20
50
Mil
lio
n u
nit
s
LBNL: 2015 report RMI: RAC stock extracted from IEA 2018 report
GCI: Interactive analysis based on 2011 data
Figure 1.1: Estimates of installed RAC stock worldwide by the year 2050
Note: There are some variations in how these different studies estimate the stock of air conditioners, however these are limited to 10%–15% of the overall stock that represents systems other than mini splits. The LBNL study includes only mini splits in the residential and commercial sectors; the GCI study includes unitary air conditioners that mainly include split residential air conditioners; the RAC stock depicted by RMI is drawn from IEA 2018 report and includes mini splits and packaged room ACs, and all other AC types have been excluded.

| 3SOLVING THE GLOBAL COOLING CHALLENGE: How to Counter the Climate Threat from Room Air Conditioners
income and population are rising fastest. Africa, Latin America, southern and eastern Asia, and the Middle East could see an increase in CDDs ranging from 15% to 40%.
It is worth noting that a warming planet would lead to increased demand for cooling, particularly for room air conditioners, which in turn would cause further global warming, creating a circular loop. Already a staggering 2.2 billion people, 30% of the world’s population, are at risk of potentially deadly heat exposure for more than 20 days per year;10 and by 2100, up to three-quarters could experience this risk.
Population Growth: According to projections by Population Reference Bureau (PRB) in the 2018 World Population Data Sheet,11 the world population is expected to reach 9.9 billion by 2050, up 2.3 billion or 29% from an estimated 7.6 billion people now. The population is growing by nearly 75 million people each year, with
approximately 90% of this growth occurring in developing countries with warm climates. PRB projects that Africa’s population will more than double to 2.6 billion by 2050 and account for 58% of the global population increase by that date. The number of people in Asia is projected to rise about 717 million to 5.3 billion.
Urbanization: The global urban population is projected to grow by 2.5 billion between 2014 and 2050, with nearly 90% of the increase concentrated in Asia and Africa. Several developing countries in these continents, classified as lower-middle-income countries, are expected to experience the fastest rate of urbanization in the coming decades, reaching, on average, 57% urban, compared to 39% urban in 2014.12 Rapid urbanization in this group of countries—including India, Indonesia, Pakistan, Nigeria, and several other African countries—that are typically populous and have warm climates, will likely result in fewer options for
90%United States
16%Brazil
89%Japan & Korea60%
China
9%Indonesia
7%India
16%Mexico
Figure 1.2: Households with air conditioning today (percent)

4 | SOLVING THE GLOBAL COOLING CHALLENGE: How to Counter the Climate Threat from Room Air Conditioners
cooling due to dense development of high rise buildings, limited air flow, and exacerbated heat island effects. This will only increase dependence on air conditioners for thermal comfort.
Income growth: GDP growth for non-OECD countries will exceed 5% through 2025,13 making comfort cooling economical for millions of new consumers. Asian and African countries will lead global economic growth, with India and China in the lead at 6% and 4.5% average annual percent change in real GDP respectively, between 2015 and 2040.14
Room air-conditioning penetration is fairly low in developing countries, even where the climate is hot and humid. For instance, only ~7% of households in India possess an AC, despite having extremely high cooling needs (Figure 1.2).15
But AC ownership in households and its use is rising rapidly in India and other hot and humid countries as incomes rise, access to electricity improves, and prosperity becomes more widespread. Simultaneously, the market is experiencing falling AC prices due to the
increasing scale of production. In short, air conditioning is becoming accessible for more and more people. IEA’s analysis of average per-capita income and AC ownership shows that the rate of household ownership of AC rises with economic development and incomes, and rises very sharply in the case of the hottest and most humid countries.
The combined effect of these drivers—warming global temperatures and the most populous and warm parts of the world seeing large increases in population, urbanization, and purchasing power—creates ripe conditions for an exponential rise in the demand for room air conditioners to meet comfort cooling needs.
Concurrent with these drivers is the increasing recognition of cooling as a social imperative. Cooling is essential for achieving many of the Sustainable Development Goals (SDGs) and is closely tied to human well-being and productivity. The recent SEforALL report Chilling Prospects draws attention to the social and economic impacts of heat stress and lack of access to cooling.16 The report shows that approximately 1.1 billion people face cooling access risks and are exposed to heat extremes
Figure 1.3: Multiple drivers contribute to the sharp rise in global RAC demand
INCOME GROWTHGDP growth for non-OECD countries will exceed 5% through 2025, making comfort economical for millions of new consumers
Cooling demand indeveloping economies
will increase5X by 2050
A WARMING PLANET Global average temperatures expected to rise over 2.0°C by 2100, making summers longer and hotter
POPULATION GROWTH Population is growing by over 75 million people/year, with 90% of growth in developing countries
URBANIZATION Global urban population is projected to grow by 2.5 billion by 2050.

| 5SOLVING THE GLOBAL COOLING CHALLENGE: How to Counter the Climate Threat from Room Air Conditioners
with little or no means—and in some cases even no access to electricity—to allow for thermal comfort. This number will only grow as populations and global temperatures increase. The SEforALL report also points out that by 2050, work-hour losses by country are expected to be more than 2% across the globe and as high as 12% (worth billions of US dollars) in the worst-affected regions of South Asia and West Africa. Even a 2% per capita loss per year means that, over the next 30 years, growth in GDP per capita will be less than half as much as if the excessive heat had not occurred. Against this backdrop, globally there is increased activity and government focus on access to cooling, electrification, and enabling thermal comfort for all, which will further the demand and penetration of air conditioners.
Worldwide Growth Outlook for Room Air Conditioners (RACs)
Synthesizing and building upon the existing body of knowledge on the worldwide RAC market and its anticipated growth, we have developed a Growth and Impact Assessment (GIA) model for RACs.iii The model strives to estimate the most current set of RAC growth projections and more importantly, draws out the greenhouse gas (GHG) emission impacts of the RAC growth trajectory and what it means in the context of our global climate commitments. Further, we utilize the model to chart out potential solution scenarios that are discussed in sections 02 and 03 of this report.
iii TheconstructandkeyassumptionsunderlyingRMI’sGrowthandImpactAssessmentmodelareprovidedinAppendixIofthisreport.iv ForIndia,a3%annualimprovementinefficiencyhasbeenassumeduntil2030basedonBEE’sinformation.Past2030anEERincreaseof0.5%annuallyis
considereduntil2050.v A5%improvementincoolingenergydemandconsiderstheadoptionofbuildingcodesataslowtomoderatepaceinIndia.Thisimprovementpotentialis
assumedtobevalidforallregionsofthestudyasdevelopingcountriesareyettoseetheconstructionofmostoftheirbuildingstockanddevelopedcountryhouseholdswouldbegintorequiremodestretrofitsfortheiroldbuildingstock.
vi InOctober2016atthe28thMeetingofthePartiestotheMontrealProtocolinKigali,thePartiestotheMontrealProtocoladoptedtheKigaliAmendmentwherebythePartiesagreedtophasedownHFCsundertheMontrealProtocol.TheamendmentwillensurethatindustrializedcountriesbringdowntheirHFCproductionandconsumptionbyatleast85%comparedtotheirannualaveragevaluesintheperiod2011-2013.AgroupofdevelopingcountriesincludingChina,BrazilandSouthAfricaaremandatedtoreducetheirHFCuseby85%oftheiraveragevaluein2020-22bytheyear2045.Indiaandsomeotherdevelopingcountries—Iran,Iraq,Pakistan,andsomeoileconomieslikeSaudiArabiaandKuwait—willcutdowntheirHFCsby85%oftheirvaluesin2024-26bytheyear2047.
For projecting the worldwide RAC growth outlook between the years 2016 and 2050, our model considers the following baseline or “business-as-usual” scenarios:
Reference Scenario (RS): In this business-as-usual growth scenario, we assume that the current adopted or committed policies will move forward per established timelines, and that the government will fully act on its commitments (such as for clean energy and grid emissions reduction). Specifically, the Reference Scenario takes into account:
• Continued improvement of the energy efficiency ratio (EER) of RACs at a weighted average annual rate of 0.5%.iv
• Impact of continued adoption of building energy codes leading to 5% reduction in cooling energy demand in 2050.17, v
• Achievement of planned grid emissions reduction by various governments.18
• Inclusion of planned reduction in transmission and distribution losses in world regions, where known.
• Advancing penetration of inverter technology to 80% of the air conditioner market, in each of the regions in our analysis.
Reference Scenario—Isolating Cooling Impacts (RS-C): The same as the Reference Scenario except for maintaining a constant grid emissions factor throughout future years in order to isolate the emission impacts due to cooling alone.
Reference Scenario—Kigali Phasedown (RS-K): The same as the Reference Scenario, but adds in the successful implementation of the Kigali phasedown plan.vi
6 | SOLVING THE GLOBAL COOLING CHALLENGE: How to Counter the Climate Threat from Room Air Conditioners
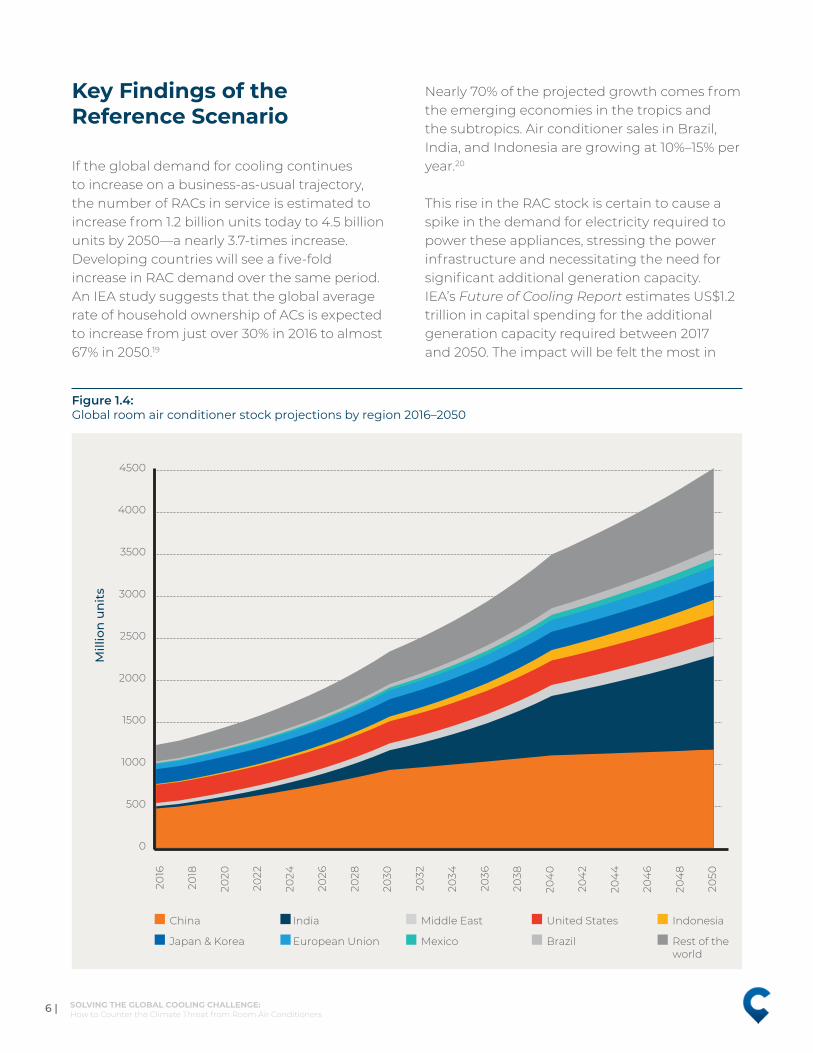
Key Findings of the Reference Scenario
If the global demand for cooling continues to increase on a business-as-usual trajectory, the number of RACs in service is estimated to increase from 1.2 billion units today to 4.5 billion units by 2050—a nearly 3.7-times increase. Developing countries will see a five-fold increase in RAC demand over the same period. An IEA study suggests that the global average rate of household ownership of ACs is expected to increase from just over 30% in 2016 to almost 67% in 2050.19
Nearly 70% of the projected growth comes from the emerging economies in the tropics and the subtropics. Air conditioner sales in Brazil, India, and Indonesia are growing at 10%–15% per year.20
This rise in the RAC stock is certain to cause a spike in the demand for electricity required to power these appliances, stressing the power infrastructure and necessitating the need for significant additional generation capacity. IEA’s Future of Cooling Report estimates US$1.2 trillion in capital spending for the additional generation capacity required between 2017 and 2050. The impact will be felt the most in
Figure 1.4: Global room air conditioner stock projections by region 2016–2050
0
500
1000
1500
2000
2500
3000
3500
4000
4500
2016
2018
2020
2022
2024
2026
2028
2030
2032
2034
2036
2038
204
0
204
2
204
4
204
6
204
8
2050
Mill
ion
un
its
China India Middle East United States Indonesia
Japan & Korea European Union Mexico Brazil Rest of theworld

| 7SOLVING THE GLOBAL COOLING CHALLENGE: How to Counter the Climate Threat from Room Air Conditioners
developing countries, where the per capita cooling energy consumption (from RACs) is relatively low and is expected to see major growth.
The Reference Scenario presents the following highlights of the worldwide growth outlook for RACs:
China and India account for more than half of the global expansion in the number and capacity of RACs. The two countries alone will have a total RAC stock of more than two billion. African countries are also expected to follow a similar trend as temperatures rise
vii Theelectricityuseincludesend-useconsumptionandtransmissionanddistribution(T&D)lossesforeachregion.Duetolimiteddataavailability,T&DlossesdeclineovertheyearsforIndiaandMexicoonly;forothercountriestheyremainconstantat2016levels.
and cooling becomes key to productivity and even at the extreme, survival.
While the Reference Scenario assumes a steady improvement in the efficiency of RACs, the global average EER in 2050 falls far short of the potential already available in the best performing units in most markets today.
Global energy use for space cooling from RACs—almost entirely in the form of electricity—is projected to jump from 2,300 terawatt hours (TWh) in 2016 to 7,700 TWh in 2050.vii This more than three-fold (~3.3x)
Figure 1.5: Total and per capita electricity consumption from RACs by region—Reference Scenario
China India MiddleEast
UnitedStates
Indonesia Japan& Korea
EuropeanUnion
Mexico Brazil Rest of the world
0
200
400
600
800
1000
1200
1400
1600
1800
2000
0
500
1000
1500
2000
2500
3000
Electricity consumption- 2016 Per capita electricity consumption- 2016
Electricity consumption- 2050 Per capita electricity consumption- 2050
Tera
wat
t-h
ours
(TW
h)
kWh
per cap
ita

8 | SOLVING THE GLOBAL COOLING CHALLENGE: How to Counter the Climate Threat from Room Air Conditioners
increase is driven predominantly by the residential sector.
The emerging economies are driving the bulk of the projected growth in energy use for space cooling, with India, China, and Indonesia alone contributing about half of the global TWh increase. India’s cooling-related energy demand from RACs soars from just 94 TWh in 2016 to 1,890 TWh in 2050—a 20-fold increase. Indonesia also observes a staggering 15-fold increase in its RACs-related energy demand, reaching 670 TWh over the same period.
In China, the energy demand for space cooling from RACs doubles to reach 910 TWh in 2050. Despite a significant rise in RAC stock, China’s energy demand does not grow at a similar pace to India’s or Indonesia’s, primarily because of the higher penetration of inverter air conditioners in that market.
The energy consumption of RACs in the United States also increases, but only marginally from about 600 TWh in 2016 to 820 TWh in 2050 owing to already high ownership levels of air conditioners in households.
India emerges to become the world’s largest energy user for space cooling in 2050. The per capita energy use for space cooling from RACs (Figure 1.5) increases from mere 72 kWh (one of the lowest in the world) to 1,140 kWh owing to rapid urbanization and growing affluent middle class that desires a better quality of life and health.
Indonesia and Middle East countries also see a major hike in RAC ownership levels. By 2050, these countries will be on par with the United States in terms of per capita energy use for space cooling.
Other developing countries such as Mexico, Brazil, and many African countries also show a similar growth trend, with a nearly two-to five-fold jump in their per capita energy use for space cooling over the same period.
Impacts of Cooling GrowthSpace cooling is set to become the single largest user of electricity in buildings overtaking appliances and plug loads. Although greater access to cooling and thermal comfort is a social imperative and supports the SDGs, it comes with large-scale impacts on global GHG emissions and required electricity generation capacity and peak load, particularly in economies with large populations and hot climates. Additionally, growing air conditioner usage will add more warming to an already warming planet. Our Growth and Impact Assessment model for room air conditioners draws out the magnitude of these impacts.
Impacts on the electric infrastructure: Per the projected growth, room air conditioning will account for around 16% of global electricity demand in 2050. In terms of electricity use, this is equivalent to adding two new countries to the world with the current total electricity consumption footprint of the US.21 Developing countries, where penetration of air conditioners is yet to happen in the future, will be the most affected as the electricity demand from RACs doubles by 2030, and grows to up to five-fold by 2050. The three major emerging economies (China, India, and Brazil) alone will need about 3,000 TWh of electricity generation in 2050 to meet the demand from RACs, equivalent to the total electricity consumption of the European Union today.22
New power generation: The Reference Scenario estimates that by 2050, 2,000 gigawatts (GW) of new generation capacity will be needed to supply the incremental 5,400 TWh of electricity to operate the RACs annually. This is approximately equivalent to the current annual electricity consumption of the US, Japan, and Germany combined.23 India alone would contribute to a third of this new capacity demand to supply the electricity to an installed stock of over a billion RACs by 2050.

| 9SOLVING THE GLOBAL COOLING CHALLENGE: How to Counter the Climate Threat from Room Air Conditioners
China India MiddleEast
UnitedStates
Indonesia Japan& Korea
EuropeanUnion
Mexico Brazil Rest of the world
0%
10%
20%
30%
40%
50%2016 2050
Figure 1.6: Share of RAC electricity consumption in total electricity consumption—Reference Scenario
Figure 1.7: New power generation capacity to meet the peak demand from RACs by 2050—Reference Scenario
China India MiddleEast
UnitedStates
Indonesia Japan& Korea
EuropeanUnion
Mexico Brazil Rest of the world
0
100
200
300
400
500
600
700
Gig
awat
ts
10 | SOLVING THE GLOBAL COOLING CHALLENGE: How to Counter the Climate Threat from Room Air Conditioners
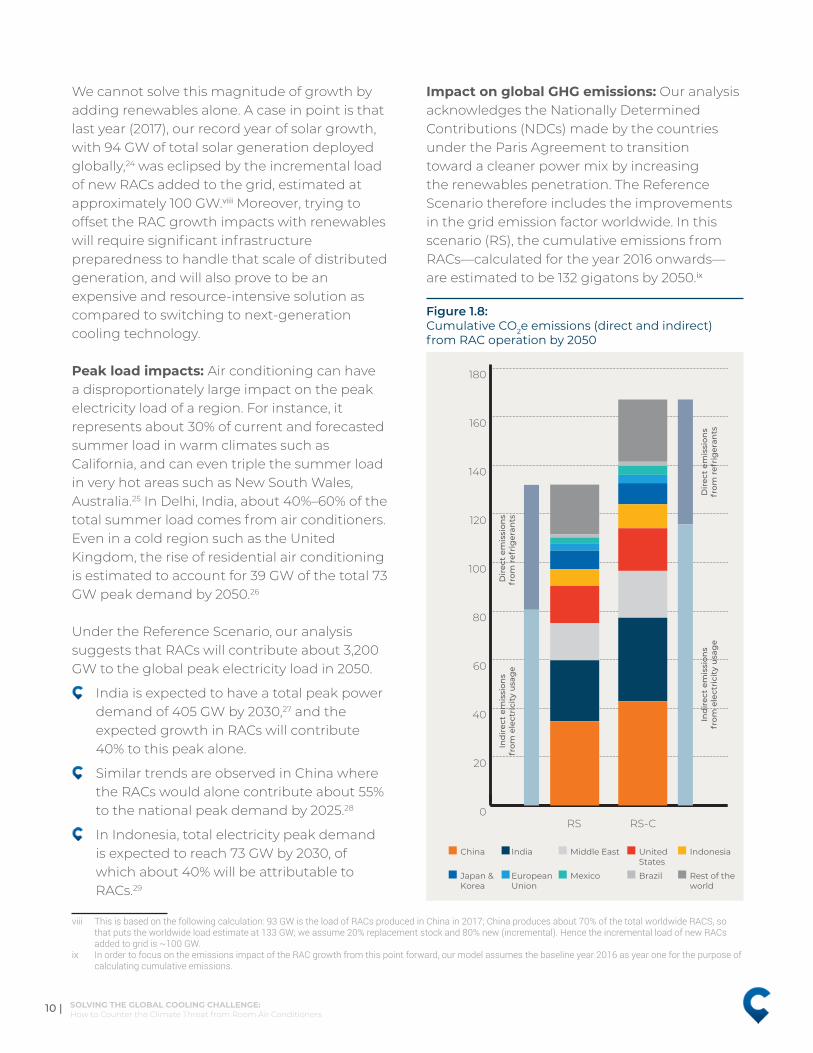
We cannot solve this magnitude of growth by adding renewables alone. A case in point is that last year (2017), our record year of solar growth, with 94 GW of total solar generation deployed globally,24 was eclipsed by the incremental load of new RACs added to the grid, estimated at approximately 100 GW.viii Moreover, trying to offset the RAC growth impacts with renewables will require significant infrastructure preparedness to handle that scale of distributed generation, and will also prove to be an expensive and resource-intensive solution as compared to switching to next-generation cooling technology.
Peak load impacts: Air conditioning can have a disproportionately large impact on the peak electricity load of a region. For instance, it represents about 30% of current and forecasted summer load in warm climates such as California, and can even triple the summer load in very hot areas such as New South Wales, Australia.25 In Delhi, India, about 40%–60% of the total summer load comes from air conditioners. Even in a cold region such as the United Kingdom, the rise of residential air conditioning is estimated to account for 39 GW of the total 73 GW peak demand by 2050.26
Under the Reference Scenario, our analysis suggests that RACs will contribute about 3,200 GW to the global peak electricity load in 2050.
India is expected to have a total peak power demand of 405 GW by 2030,27 and the expected growth in RACs will contribute 40% to this peak alone.
Similar trends are observed in China where the RACs would alone contribute about 55% to the national peak demand by 2025.28
In Indonesia, total electricity peak demand is expected to reach 73 GW by 2030, of which about 40% will be attributable to RACs.29
viii Thisisbasedonthefollowingcalculation:93GWistheloadofRACsproducedinChinain2017;Chinaproducesabout70%ofthetotalworldwideRACS,sothatputstheworldwideloadestimateat133GW;weassume20%replacementstockand80%new(incremental).HencetheincrementalloadofnewRACsaddedtogridis~100GW.
ix InordertofocusontheemissionsimpactoftheRACgrowthfromthispointforward,ourmodelassumesthebaselineyear2016asyearoneforthepurposeofcalculatingcumulativeemissions.
Impact on global GHG emissions: Our analysis acknowledges the Nationally Determined Contributions (NDCs) made by the countries under the Paris Agreement to transition toward a cleaner power mix by increasing the renewables penetration. The Reference Scenario therefore includes the improvements in the grid emission factor worldwide. In this scenario (RS), the cumulative emissions from RACs—calculated for the year 2016 onwards—are estimated to be 132 gigatons by 2050.ix
RS RS-C
China India
Ind
irec
t em
issi
ons
from
ele
ctri
city
usa
ge
Ind
irec
t em
issi
ons
from
ele
ctri
city
usa
ge
Dir
ect
emis
sion
sfr
om r
efri
ger
ants
Dir
ect
emis
sion
sfr
om r
efri
ger
ants
Middle East United States
Indonesia
Japan & Korea
EuropeanUnion
Mexico Brazil Rest of theworld
0
20
40
60
80
100
120
140
160
180
Figure 1.8: Cumulative CO2e emissions (direct and indirect) from RAC operation by 2050

| 11SOLVING THE GLOBAL COOLING CHALLENGE: How to Counter the Climate Threat from Room Air Conditioners
The total annual emissions from RACs see a substantial increase, with the 2050 annual emissions growing to 2.5 times that of the annual RAC emissions in 2016.
We also understand that targets could be difficult to sustain as planned policies may not pan out—the withdrawal of the United States from the Paris Agreement being the prime example. Our analysis therefore presents an alternative view maintaining a constant grid emission factor in order to isolate the emission impact of RAC operation. In this scenario (RS-C), the resulting cumulative emissions are estimated to be 167 gigatons of CO2 equivalent (CO2e) by the year 2050.
The total (direct and indirect) emissions from RAC operation will continue to contribute an increasing share of the global carbon dioxide emissions (from primary energy) through 2050, doubling to about 15% from the 2016 levels. Developing countries, mainly India, Mexico, Brazil, and Indonesia, will observe this trend more prominently owing to the soaring electricity demand from RAC growth.
As we analyze the emission impact of an increasing number of RACs, it would be remiss not to consider the mitigation potential of the Kigali Amendment, which is already set in motion. Though the Kigali Amendment is not yet ratified by many of the signatory countries,
Figure 1.9: Share of RAC-related CO2e emissions (Reference Scenario) as percent of total CO2 emissions from primary energy
China India MiddleEast
UnitedStates
Indonesia Japan& Korea
EuropeanUnion
Mexico Brazil Rest of the world
0%
5%
10%
15%
20%
25%
30%
Share of CO2 emissions- 2016 Share of CO2 emissions- 2050

12 | SOLVING THE GLOBAL COOLING CHALLENGE: How to Counter the Climate Threat from Room Air Conditioners
including the US, and therefore its impacts not yet assured, for the purpose of our analysis we assume its full implementation. Our analysis suggests that successful implementation of the Kigali Amendment will have a notable impact on the direct emissions footprint (that is emissions resulting from refrigerants) associated with RAC operation—estimated to be approximately 90% of the annual direct emissions in 2050 (RS)—as the world transitions to lower global-warming-potential refrigerants. The reduction in cumulative CO2e emissions is estimated to be 23 gigatons by the year 2050 (RS-K), which amounts to a 17% reduction in the
x TheclimatescientistsatIPCCestimatedthetotalcarbonbudgetof2,900GTofCO2e(accountingfornon-CO2forcing)witha66%probabilitytolimitthewarmingtobelow2°Cabovepre-industriallevels.
total cumulative emissions as compared with the Reference Scenario. While this is a huge positive, refrigerants account for about a third of total emissions from mechanical cooling, and only about one fifth in developing countries (owing to generally higher grid emission intensity factors in these countries) where the bulk of the future RAC stock will reside (Figure 1.4). Indirect emissions, from the electricity consumption by the cooling equipment, are a much larger portion of the total emissions related to comfort cooling, leaving a large gap to be addressed.
Envisioning that the Kigali Amendment is able to achieve its intended objectives, it still leaves us with a huge demand for electricity and associated emissions, as cooling appliances, particularly room air conditioners, evolve to become a basic necessity for a better quality of life and health in a warming world. The unresolved problem is clearly the indirect emissions. We must explore an alternative way to more rapidly decrease direct emissions.
What This Means in a Nutshell
Studies show that by the year 2017, we already exhausted a substantial portion of the total carbon budget estimated by the climate scientists in order to achieve the Paris Agreement goal: to keep global warming to less than two degrees above pre-industrial levels by the year 2100. Per the different scenarios envisioned by the climate science community, this leaves us with a mere 350 to 700 gigatons (GT) of permissible CO2e emissions for the remainder of the century.30, x Based on our analysis, RAC growth alone could add an estimated 132 (RS) to 167 GT (RS-C) of CO2e emissions, cumulatively, between now and 2050—amounting to nearly 25% to 50% of the remaining carbon budget, and expanding
Figure 1.10: Impact of Kigali Amendment on annual CO2e emissions (direct and indirect) from RAC operation
2016 2050
Indirect emissions Direct emissions
Reduction in direct emissions from Kigali Amendment
0
1
2
3
4
5
6
Gig
aton
s/ye
ar
1.52
0.723.2
0.28
2.09
| 13SOLVING THE GLOBAL COOLING CHALLENGE: How to Counter the Climate Threat from Room Air Conditioners
beyond the remaining carbon budget when projected through to 2100—potentially derailing the Paris Agreement goal.
Our analysis projects over 0.5°C increase in global temperature by 2100 just from the end use of the RAC segment of the comfort cooling market.xi Thus, RACs are achieving cooling at the cost of adding more warming to an already warming planet. The scientific community predicts that by the end of this century, if carbon emissions continue on their current trajectory, three-quarters of humanity will face some exposure to potentially deadly heat.
xi TodeterminethewarmingcausedbyRACsalonebytheyear2100,weextendourGIAmodelbeyondtheyear2050to2100.ToprojectthefutureRACstock,ametric,“numberofRACspercapita”wasdeveloped.UsingtheUnitedNationspopulationestimatesforyear2100,weassumeascenariowherewideraccesstocoolinghasbeenachievedandthepenetrationofRACsisapproximately0.7–0.8perperson.ExtendingourGIAmodelassumptionsforRSandRS-Ctotheyear2100,thetotalemissionsfromRACsaloneareabout476(RS)–786GT(RS-C)ofCO2e.AnIPCCAR5reportsuggestsalinearrelationshipbetweencumulativetotalemissionsandmeansurfacetemperature.Thisallowsustorelatethetotalcarbonbudget(2,900GTCO2e)toatemperatureriseof2°C,andapplyingthesamelinearlogic,thetotal(indirectanddirect)emissionsfromRACsalonewouldcorrespondtoanincreaseof0.3°C–0.55°Cbytheyear2100.
It is clear that the energy consumption associated with mechanical cooling combined with the atmospheric impact of the refrigerants utilized by these systems represents one of the single largest end-use risks to the climate. While the Kigali amendment to the Montreal Protocol was a huge accomplishment, it alone is not sufficient, necessitating a still-urgent call to action to holistically neutralize the impacts of cooling.

14 | SOLVING THE GLOBAL COOLING CHALLENGE: How to Counter the Climate Threat from Room Air Conditioners

| 15SOLVING THE GLOBAL COOLING CHALLENGE: How to Counter the Climate Threat from Room Air Conditioners
HOW THE WORLD IS RESPONDING TO THE COOLING CHALLENGE
02
Two recent international agreements—the Paris Agreement and the Kigali Amendment to the Montreal Protocol—have brought attention to the close linkages between cooling, energy demand, and climate change. The Paris Agreement, approved in December 2015, aims to limit the global temperature rise this century to less than 2°C above pre-industrial levels and to pursue efforts to limit the temperature increase even further to 1.5°C. The 2016 Kigali Amendment targets the impacts of hydrofluorocarbons (HFCs)—greenhouse gases with high global warming potential, primarily utilized as refrigerants in cooling equipment—and commits 197 countries to phasing down HFC use by 80% over the next 30 years.
xii ProjectDrawdownranksrefrigerantmanagement,andparticularlyphasingoutofHFCspertheKigaliaccord,asthenumberonesolution(thesinglelargestintermsofemissionsreductionpotential)tocontrolglobalwarming.
With its focus on eliminating damaging refrigerants associated with comfort cooling, the Kigali Amendment has been called the world’s “single largest real contribution” to meeting the Paris goals, and promises significant reduction in emissions from refrigerants.31, xii However, indirect emissions from the electricity consumption of the cooling equipment are a much larger portion of the emissions related to comfort cooling, leaving a large gap to be addressed. Thus, to neutralize the impacts of the imminent growth in cooling, a lot more needs to be done toward minimizing the electricity utilized for comfort cooling. In other words, significant improvements are required in the operational efficiency of the cooling equipment that we use.
16 | SOLVING THE GLOBAL COOLING CHALLENGE: How to Counter the Climate Threat from Room Air Conditioners
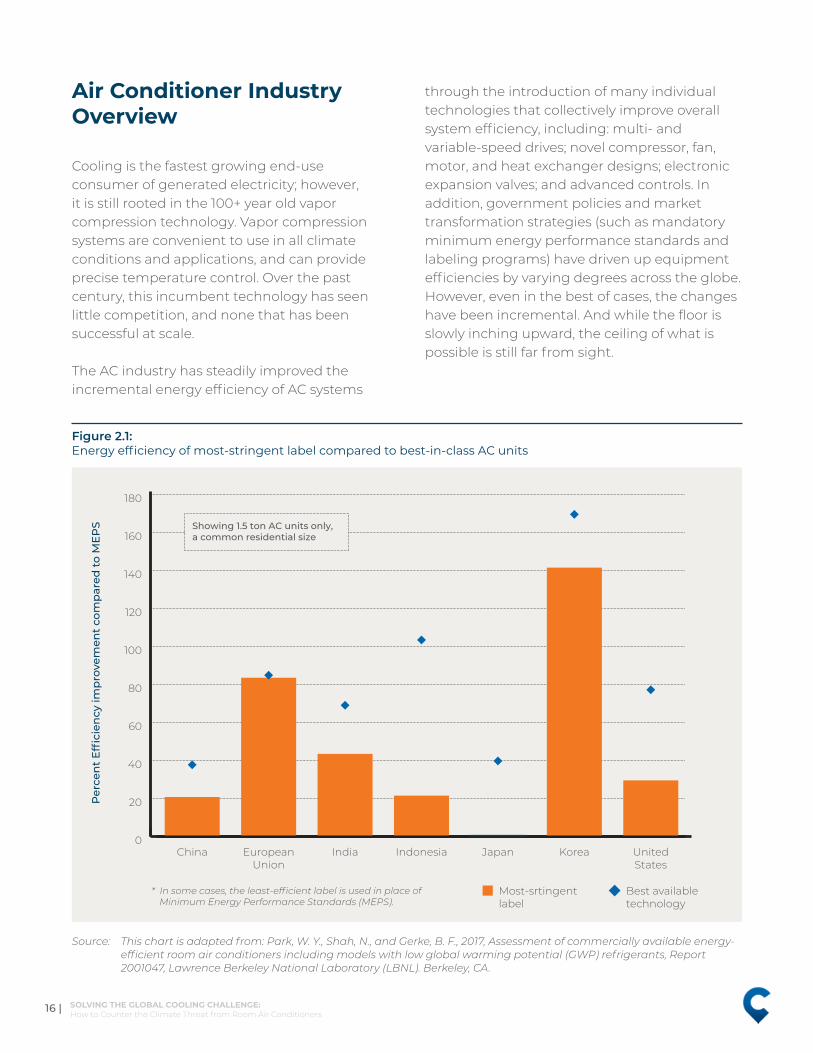
Air Conditioner Industry Overview
Cooling is the fastest growing end-use consumer of generated electricity; however, it is still rooted in the 100+ year old vapor compression technology. Vapor compression systems are convenient to use in all climate conditions and applications, and can provide precise temperature control. Over the past century, this incumbent technology has seen little competition, and none that has been successful at scale.
The AC industry has steadily improved the incremental energy efficiency of AC systems
through the introduction of many individual technologies that collectively improve overall system efficiency, including: multi- and variable-speed drives; novel compressor, fan, motor, and heat exchanger designs; electronic expansion valves; and advanced controls. In addition, government policies and market transformation strategies (such as mandatory minimum energy performance standards and labeling programs) have driven up equipment efficiencies by varying degrees across the globe. However, even in the best of cases, the changes have been incremental. And while the floor is slowly inching upward, the ceiling of what is possible is still far from sight.
China India UnitedStates
Indonesia Japan KoreaEuropeanUnion
0
20
40
60
80
100
120
140
160
180
Most-srtingent label
* In some cases, the least-efficient label is used in place of Minimum Energy Performance Standards (MEPS).
Best available technology
Per
cen
t E
ffici
ency
imp
rove
men
t co
mp
ared
to
ME
PS Showing 1.5 ton AC units only,
a common residential size
Figure 2.1: Energy efficiency of most-stringent label compared to best-in-class AC units
Source: This chart is adapted from: Park, W. Y., Shah, N., and Gerke, B. F., 2017, Assessment of commercially available energy-efficient room air conditioners including models with low global warming potential (GWP) refrigerants, Report 2001047, Lawrence Berkeley National Laboratory (LBNL). Berkeley, CA.

| 17SOLVING THE GLOBAL COOLING CHALLENGE: How to Counter the Climate Threat from Room Air Conditioners
A recent IEA report highlights that the average efficiency of air conditioners sold today is less than half of what is typically available on shelves.32 LBNL’s research (figure 2.1) also points out that in many regions, the most stringent energy labels lag behind the best-in-class AC units.
The pace of evolution of the AC industry is alarmingly slow even considering best available technology, especially when compared with some of the recent technological innovations in the century such as LED lighting, solar photovoltaic panels, and electric vehicles. Our analysis indicates that the AC industry has reached only about 14% of its maximum theoretical efficiency as defined by the Carnot cycle. In comparison, LEDs have achieved 67%–89% of their theoretical maximum efficiency,33
solar photovoltaics (PV) have achieved 28%–53%,34 both as costs have declined.
The rapid acceleration in adoption and the downward cost-curves of solar PVs and LEDs are due to not just technology but also leveraging materials, know-how, and processes from other industries that scaled; and utilizing the right push and pull factors through a combination of policy and regulations as well as financial and market based mechanisms. Also, in both these examples, the innovations were driven by competition with an existing technology or system: LEDs were in competition with the incandescent and fluorescent technologies, and solar PV distributed generation was chasing the levelized cost of fossil fuel generation.
However, the AC industry has seen no mainstream competing technology over the past century, and even though there are several innovative technologies, they largely remain below the ‘radar’. As for the incumbent technology, there hasn’t been an impetus to drive to transformational innovation, resulting in largely just incremental improvements. There are several reasons that contribute to the sluggish pace of innovation in the industry, discussed below.
The Market FailuresMisplaced consumer emphasis on low first cost versus operational cost: Typically, AC purchasing decisions are made on the basis of first cost, and most consumers are neither aware of nor understand the rating systems that represent a proxy for the operational costs of the AC equipment during its lifetime. Further, in many instances the purchasing decision is made by someone who will not be operating and paying for the equipment’s use—such as builders and developers—further skewing the decisions in favor of lower first costs. This market demand for low first cost has driven the AC industry to focus on scale, resulting in a highly
Figure 2.2: Theoretical maximum efficiency achieved by different industries
Lighting Solar PV A/C
Retail R&D
0%
20%
40%
60%
80%
100%
67%
28%
14%
25%
22%
18 | SOLVING THE GLOBAL COOLING CHALLENGE: How to Counter the Climate Threat from Room Air Conditioners
consolidated industry; low first cost requires economies of scale, thus the largest players will tend to win, especially for a mature technology. The AC manufacturers pursue high volumes of sales through low prices to consumers, at efficiencies that simply meet or marginally exceed the Minimum Energy Performance Standards (MEPS).
Consolidated industry with high barriers to entry: The AC manufacturing industry has become highly consolidated with economies of scale being key to growth, and the majority of the market share is consequently now controlled by just a small number of large corporations. There are fewer than 500 AC manufacturers worldwide, with two Chinese companies controlling over 35% of global room air conditioner production, according to K-CEP China.35 In fact, China manufactures 70% of the global RACs. Very high barriers to entry in the industry—such as necessary economies of scale and access to distribution—act to prevent start-ups and smaller companies from making headway. As a recent market report points out,36 the threat from a new entrant causes a negligible impact to the present players because of research and development and technical requirements needed to enter into the AC market. The importance of brand recognition to consumers leading to heavy marketing costs also adds to the barriers of entry.
Policy framework typically focuses on conservatively elevating the floor, and not assessing the height of the ceiling: Government policies are mostly focused on eliminating the least-efficient ACs, and not as much on advancing adoption of the most efficient ones. Policymakers employ MEPS to incrementally raise the lower level of acceptable efficiencies, and use standards and labels, like Energy Star in the United States, to encourage consumers to purchase the most energy-efficient options available. While MEPS have
been relatively successful, in many parts of the world the most stringent labels and standards lag far behind the best-in-class AC units in the market.37 In these cases, manufacturers have little to gain from making their best-performing products even more efficient.
Research shows that policy-driven incremental improvements in technology have resulted in a 1.7% average increase in efficiency per year globally since 1990.38 While this represents positive progress, it is not enough to offset the massive increase in future electricity requirement for RACs.
Market conditions create no real impetus to drive radical innovation: There is no individual competing technology that is recognized as providing an equivalent level of thermal comfort as a conventional air conditioner. In extreme heat, air conditioning is generally viewed as the only option to stay cool. So while air conditioner manufacturers are competing against one another in terms of cost and features, they are not in competition with another technology that will drive the kind of technological innovation we have seen in other industry sectors. In a sense, the vapor compression technology can be viewed as having a monopolistic hold over comfort cooling. In contrast, examples in adjacent industries show us that competition among technologies has led to radical and rapid innovation in recent decades.
As a result of these market failures, the vapor compression technologies have been slow to change, as historic trends show. Innovations in equipment have occurred over years, and market adoption of new products with higher first costs—even if offset by lower operating costs—can take time. Government policies promoting or mandating the use of more efficient equipment also take time to develop and implement.

| 19SOLVING THE GLOBAL COOLING CHALLENGE: How to Counter the Climate Threat from Room Air Conditioners
Conventional Solutions and Strategies
With the heightened focus on cooling and its evolving growth as a global challenge, the body of work on cooling is expanding. Several credible research entities and think tanks have been actively contributing to this topic with noteworthy reports and research. For instance, LBNL, IEA, and GCI have a robust body of work in this space, including particular focus on room air conditioners.xiii The recent body of work highlights the magnitude of the growth in cooling demand and its resulting impacts, and draws attention to a call for action. The possible solutions are also discussed albeit at a high-level. These solutions collectively advocate a long-term policy framework incorporating regulations, equipment efficiency, information and capacity building programs, and incentives to reduce both cooling-related energy consumption and refrigerant emissions.
Based on our literature review, the known and recommended strategies to address the cooling challenge fall within the following broad categories:
1. Policy and regulatory measures to reduce cooling-related energy: Developing and ensuring enforcement of effective policies is viewed as a key lever for driving market transformation toward efficient cooling practices. The IEA Future of Cooling report suggests a combination of regulation, information, and incentives as the basic formula for an effective policy suite. The regulations include minimum energy performance standards (MEPS) and building energy codes; information measures include equipment energy labels and capacity-building programs; and incentives include taxes and subsidies. Various studies suggest that the combination of elevating MEPS, enforcing building code adoption
xiii Thisisnotmeantasanexhaustivelistandseveralothernoteworthyexamplesexist.Wenotetheonesaboveaswehavedrawnupontheirbodyofworkforthepurposeofouranalysis.
and compliance, and utilizing market transformational levers is the key part of the solution in addressing the global cooling challenge.
Studies also suggest that complementing MEPS and building codes with simple solutions, such as cool roofs, vegetation, and shading, can play a role in lowering overall energy demand for cooling in the buildings sector where able to be deployed at a material scale.
2. Capacity building and skill development: The Kigali Cooling Efficiency Program estimates that effective optimization, monitoring, and maintenance of cooling equipment has the potential to deliver substantial electricity savings of up to 15%–20%.39 This could translate into an up to 13% reduction in total cooling emissions, including GHG emissions from refrigerants. Poor maintenance practices and lack of trained service technicians are significant issues in the developing world, resulting in reductions in equipment efficiency as well as refrigerant leakage. With 4.5 billion RAC appliances entering operation by 2050, training on installation and maintenance must increase rapidly and ahead of the demand curve to maintain an environmentally friendly industry.
3. User behavior adaptations: Demand-side management programs, improved operations and maintenance practices, and user behavioral adaptations, such as adaptive thermal comfort standards, could achieve operational efficiencies in comfort cooling.
4. Consumer awareness: Enhancing consumer awareness toward both the impacts of cooling and efficient equipment choices is viewed as a critical link in driving the solutions to our cooling challenge.
20 | SOLVING THE GLOBAL COOLING CHALLENGE: How to Counter the Climate Threat from Room Air Conditioners
The desired outcomes through these strategies are:
Improved energy performance of buildings including efficient envelope and building design for new construction and retrofits for existing buildings undergoing renovation programs
Increased energy efficiency of cooling equipment
Improved operational efficiency of equipment, improved maintenance and servicing practices to ensure equipment efficiency, and potentially user behavior adaptations toward energy efficient operations
Market transformation toward higher adoption of more efficient cooling equipment
All of these recommended strategies are being practiced, in varying degrees, in some parts of the world today. While their theoretical potential is promising, in reality, there are many implementation barriers that prevent scaling. Solutions such as driving behavior change, enforcing efficient building design, and building retrofits can be incredibly hard to mainstream and require long timeframes for impactful scaling. For instance, in some parts of the world, even though building codes exist, their adoption and enforcement is still too low to be effective.
In addition to the four broad solutions discussed above, studies recommend international collaboration on cooling-related research and a robust and collaborative research and development ecosystem to nurture innovations in technology. Certainly a critical need for addressing the global cooling challenge, this is not something that is in practice today, and needs to become a part of the solution going forward.
xiv Duetolimitedavailabilityofdataforallthemodelcountries,weassumethecoolingenergyreductionpotentialthroughbuildingenvelopeimprovementswouldfollowthetrendsintheUnitedStatesforalldevelopedcountriesandfollowthetrendsinIndiaandChinafordevelopingcountries.
Impact of Conventional Strategies: How Far Can They Take Us?
Our analysis tries to map out the potential impact of the conventional solutions with respect to the Reference Scenario, to see how far these solutions could take us in terms of neutralizing the impacts of future RAC growth. We define this as the Improved Scenario, which, for the sake of discussion, ambitiously assumes overcoming most of the implementation barriers achieving unhindered progress toward the recommended strategies.
Our Improved Scenario takes into consideration strict compliance with progressively more stringent building energy codes that focus on building envelope improvement, improved practices for refrigerant recovery at end of life, and accelerated improvements in the operating efficiency of air-conditioning units being added to the installed base, in addition to meeting the HFC phase-down requirements under the Kigali Amendment. The specific assumptions that we incorporated into the Improved Scenario include:
Building envelope improvements (thermal insulation driven by building codes) have the potential to achieve a 7.5% reduction in cooling demand in 2050 in developed countries. Similarly, developing countries could achieve a 15% reduction in cooling demand in 2050, considering that a significant portion of the building stock is yet to be built.40, xiv
The development of adequate methods to ensure refrigerant recovery at the end of life of the equipment. This progressively increases up to 50% in 2050.
Enforcing stringent MEPS to ensure that the average efficiency improvement of RACs occurs at twice the rate of the Reference Scenario.

| 21SOLVING THE GLOBAL COOLING CHALLENGE: How to Counter the Climate Threat from Room Air Conditioners
Ensuring full compliance to the HFC phase-down requirement laid down under the Kigali amendment to the Montreal Protocol. For the purpose of analysis, all the countries follow Group 1 A5 parties, with starting the year 2024 to freeze HFC production.xv
Figure 2.3 depicts the Improved Scenario, mapping out the conventional solutions and
xv Thismidpointisadoptedbecausethenon-A5partieshave2019asastartingyearwhiletheGroup2A5partieshaveastartingyearof2028tobegintheircompliancetotheKigaliAmendment.
xvi Additionalstrategies,suchasbehavioraladaptations,coolroofs,vegetation,andshading,canhelpoptimizeorlowerthecoolingenergydemandofthebuildingsector.Whilequantificationoftheirimpactliesoutsidethescopeofouranalysis,weacknowledgethatwhenutilizedincombinationwiththeproposedefficiencymeasuresintheImprovedScenario,suchstrategiesmayaugmentthepositiveoutcomes.
xvii Approximately75GTistheprojectedcumulativeemissions,intheyear2050,ofthenewRACstockthatcomesintouseintheyear2016andonwards.Foranapples-to-applescomparisonwiththecumulativeemissionsofthe2016stock,weaccumulatetheemissionsofthe2050stockoverthesametimeperiod(35years).Evenwiththegridimprovementsenvisionedinthelatterpartofthecentury,thecumulativeemissionsover35yearsofthe3.3billionnewRACsamounttoover170GT.
strategies to study the extent to which they can potentially neutralize the impact of RAC growth.xvi
Our analysis suggests that neutralizing the climate impact of the projected increase in the number of RACs between now and 2050 requires a reduction to the tune of nearly 75 gigatons of cumulative emissions.xvii The Improved Scenario, after assuming
Figure 2.3: How far the conventional strategies can take us
Cumulativeemissions- RS
Mitigationpotential-
KigaliAmendment
Mitigationpotential-
refrigerantrecovery
at end of life
Mitigationpotential-
acceleratedefficiency
improvements
Mitigationpotential-building
codes
Cumulativeemissions-ImprovedScenario
Cumulative emissions in 2050 fromcurrent RAC stock- RS
Cumulative emissions in 2050 fromprojected RAC stock- RS
0
30
60
90
120
150
40 GTincluding
successful Kigali implementation
17%
3%
3%
8%
Gig
aton
s

22 | SOLVING THE GLOBAL COOLING CHALLENGE: How to Counter the Climate Threat from Room Air Conditioners
aggressive steps across policy, technology, and operation and maintenance practices, if fully implemented, results in about 40 gigatons of reduction in emissions by 2050—half of which comes from an assumed full compliance to the HFC phase-down requirement laid down under the Kigali Amendment. It is worth noting that the Kigali Amendment is not yet ratified by many of the signatory countries, including the US, and therefore its intended impacts are not yet assured. Thus, the takeaway is that conventional solutions envisioned under the Improved Scenario cannot bring us anywhere close to neutralizing the climate impact of the exponential growth in RACs.
The big gap, and hence area of opportunity, lies in the reduction of the indirect emissions, which are three to five times greater than the direct emissions and yet only see a marginal reduction through conventional strategies. Aggressive improvement in technology holds the key. As our analysis points out, just doubling the market average efficiency improvement rate from current levels results in an 8% reduction, equivalent to 10 gigatons of CO2e emissions. There is a definite need for radically efficient air-conditioning technologies, as an assured and impactful path to neutralize the significant impacts of cooling and to keep us aligned with our global climate change commitments.
Call for Action: The Need for a Step-Change
The remaining carbon budget to pursue efforts to limit Earth’s temperature increase to 1.5°C, as outlined by the Paris Agreement, is vanishingly small and will be exhausted by 2030 at current emissions rates. Even aiming to limit temperature rise to well below 2°C will require unprecedented actions.
In the recently published Exponential Climate Action Roadmap,41 the scientific community strongly advocates an immediate shift from incremental to exponential actions, proposing that in order to reduce the risk of dangerous climate change, the greenhouse gas emissions must peak by 2020, approximately halving every decade thereafter until 2050. The report also stresses that this is technologically feasible and economically attractive but the world is not yet on this path.
It is clear that conventional solutions, incremental changes, and even deployment of renewables will not be enough to neutralize the increasing emissions due to the unprecedented increase in air-conditioning demand. The world needs a radical change in comfort cooling technology, one that can effectively and assuredly offset the 5X increase in cooling energy demand in developing economies and put us on a path to cooling with less warming.
| 23SOLVING THE GLOBAL COOLING CHALLENGE: How to Counter the Climate Threat from Room Air Conditioners
SOLVING THE GLOBAL COOLING CHALLENGE: THE 5X SOLUTION
03
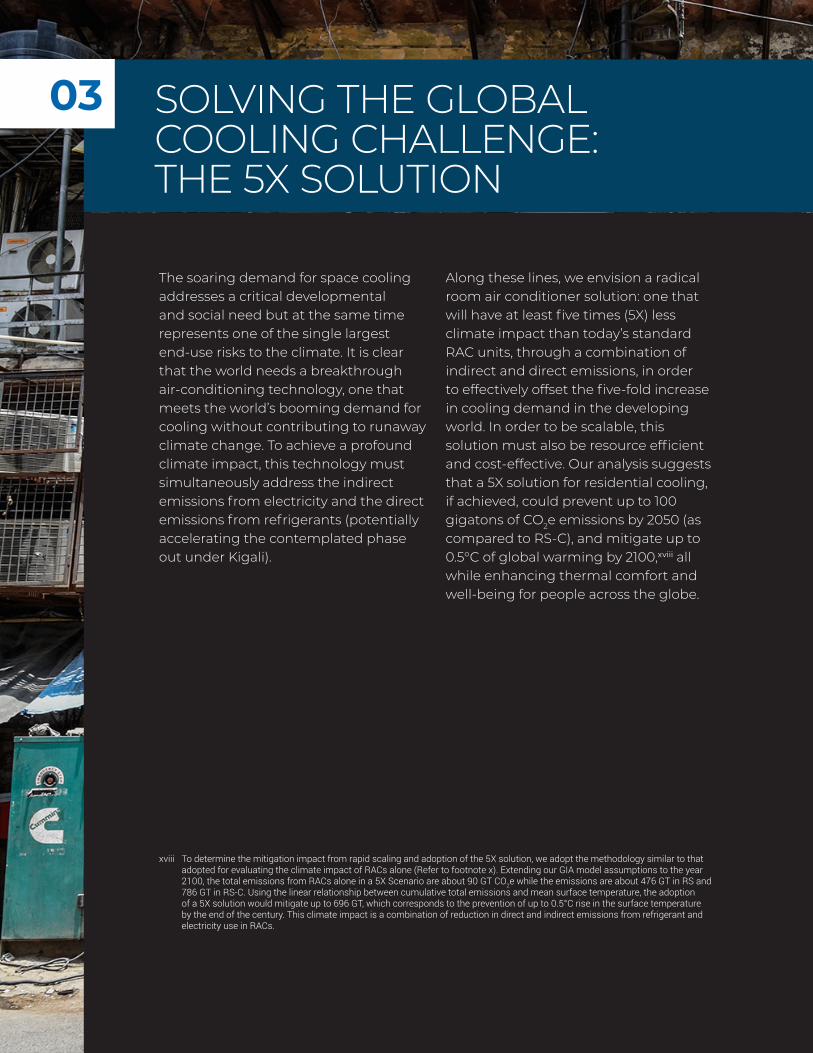
The soaring demand for space cooling addresses a critical developmental and social need but at the same time represents one of the single largest end-use risks to the climate. It is clear that the world needs a breakthrough air-conditioning technology, one that meets the world’s booming demand for cooling without contributing to runaway climate change. To achieve a profound climate impact, this technology must simultaneously address the indirect emissions from electricity and the direct emissions from refrigerants (potentially accelerating the contemplated phase out under Kigali).
xviii Todeterminethemitigationimpactfromrapidscalingandadoptionofthe5Xsolution,weadoptthemethodologysimilartothatadoptedforevaluatingtheclimateimpactofRACsalone(Refertofootnotex).ExtendingourGIAmodelassumptionstotheyear2100,thetotalemissionsfromRACsaloneina5XScenarioareabout90GTCO2ewhiletheemissionsareabout476GTinRSand786GTinRS-C.Usingthelinearrelationshipbetweencumulativetotalemissionsandmeansurfacetemperature,theadoptionofa5Xsolutionwouldmitigateupto696GT,whichcorrespondstothepreventionofupto0.5°Criseinthesurfacetemperaturebytheendofthecentury.ThisclimateimpactisacombinationofreductionindirectandindirectemissionsfromrefrigerantandelectricityuseinRACs.
Along these lines, we envision a radical room air conditioner solution: one that will have at least five times (5X) less climate impact than today’s standard RAC units, through a combination of indirect and direct emissions, in order to effectively offset the five-fold increase in cooling demand in the developing world. In order to be scalable, this solution must also be resource efficient and cost-effective. Our analysis suggests that a 5X solution for residential cooling, if achieved, could prevent up to 100 gigatons of CO2e emissions by 2050 (as compared to RS-C), and mitigate up to 0.5°C of global warming by 2100,xviii all while enhancing thermal comfort and well-being for people across the globe.

24 | SOLVING THE GLOBAL COOLING CHALLENGE: How to Counter the Climate Threat from Room Air Conditioners
Potential Impacts of the 5X Solution
Utilizing our GIA model, we map the effectiveness of the 5X solution in terms of neutralizing the impacts of the escalating room air-conditioning demand. Our 5X Scenario analysis shows that developing a room air-conditioning solution that combines exponential improvement in technology efficiency with environmentally friendly refrigerants can serve the global cooling needs with nearly 7.5 times (7.5X) fewer annual emissions as compared with the RS in the year 2050. The annual emissions in the 5X Scenario continue on a downward slope (Figure 3.1) compared with the Improved Scenario. The 5X solution saves up to 100 gigatons of
cumulative emissions by 2050 (Figure 3.2), which is equivalent to replacing around 400 GW of new coal-fired generation capacity with renewable energy today. In order to achieve
these outcomes and effectively neutralize the impacts of the cooling growth, the need for the development of a 5X solution is immediate, followed by rapid market adoption in order to avoid substantial lock-in during the next decade. Historically, the industry always responds to the anticipated government policies well in advance. With this in mind, our analysis assumes an adoption curve for the 5X solution such that: the market-entry year for the 5X solution is 2022, with a 5% share of the sales; by the year 2030, it achieves around 80% share of the annual sales; and by the year 2040, it achieves an almost 100% market share of the annual sales. A view into the learning rates and technology adoption in adjacent industriesxix—such as renewable energy—tells us that such rapid adoption is possible with the right market forces, particularly when the demand is led by
xix Learningrate(alsoreferredtoasthelearningcurve)isthereductioninup-frontcostresultingfromadoublingincumulativeproductionvolume.
0
2
4
6
8
10
2016
2018
2020
2022
2024
2026
2028
2030
2032
2034
2036
2038
204
0
204
2
204
4
204
6
204
8
2050
Gig
aton
s/ye
ar o
f CO
2e
RS-C RS-K Improved Scenario 5X ScenarioRS
7.5X
Figure 3.1: Annual emissions from RAC operations between 2016 and 2050
| 25SOLVING THE GLOBAL COOLING CHALLENGE: How to Counter the Climate Threat from Room Air Conditioners
the developing economies,xx and that a super-efficient cooling solution could achieve the same first cost as today’s standard units in less than 10 years.
In terms of electricity consumption, the radically efficient technology that uses a low-GWP refrigerant consumes about 1,800 TWh in 2050 (5X Scenario)—about 75% less than the total global demand in RS. This is a huge reduction from the Improved Scenario itself—about 3,800 TWh, clearly underscoring the need for a rapid advancement and adoption of a breakthrough technology. The scale of impact of the 5X solution is further amplified by the fact that the total electricity consumption in 2050 is about 20% less than that in 2016, despite a 3.7-times growth in RAC stock over the same period.
Over 50% of the total 5,900 TWh reduction achieved by the 5X Scenario is through only
xx TherapidpricefallinsolarPVandwindenergy—consideredastonishingbytheenergyexperts—defiedanylearningcurvepredictionsbyeconomists,andbyhugemargins.Inreviewingthedevelopmentofsolarandwindgenerationmarkets,expertssaythatit“happenedbecausemarketforcesin‘developing’economies—especiallyChinaandIndia—workfasterthanany‘learningcurve’”expertscoulddraw.https://www.energytoday.net/economics-policy/credit-renewables-learning-curve/(siteaccessed10/30)
xxi Theconstructioncostofanaturalgaspowerplant($696/kW)wasconsideredasbenchmarktoevaluatethesavingspotential.
five countries—China, India, Indonesia, Mexico, and Brazil—reinforcing their contribution to the global cooling growth and the scale of benefits that these governments can leverage by adopting such a breakthrough technology.
Between 2016 and 2050, while the Reference Scenario will need an additional 2,000 GW of power generation capacity to meet the peak demand from RACs, our analysis suggests that adopting a 5X solution can completely neutralize this need. This essentially means that peak demand from all the RACs in 2050 will be met by existing grid capacity despite a 3.7-times growth in the installed stock. In monetary terms, this translates to savings of about US$1.4 trillion on capital investment in power generation capacity alone.42, xxi These savings will be even higher as our analysis does not factor in the avoided cost of the required grid infrastructure improvements.
Figure 3.2: Comparison of cumulative CO2e emissions from 2016 to 2050 across scenarios
0
20
40
60
80
100
120
140
160
180
2016
2018
2020
2022
2024
2026
2028
2030
2032
2034
2036
2038
204
0
204
2
204
4
204
6
204
8
2050
Gig
aton
s of
CO
2e
100 GT
75 GT
RS-C RS-K Improved Scenario 5X ScenarioRS

26 | SOLVING THE GLOBAL COOLING CHALLENGE: How to Counter the Climate Threat from Room Air Conditioners
The benefits of a 5X solution are not just restricted to governments but will also flow down to the end consumers. Our analysis suggests that about US$130 billion in 2030, and up to US$1 trillion in 2050, in operational costs will be saved by consumers of these major growth markets by shifting to the 5X RAC technology.43, xxii
India, as the world’s largest growth market for RACs, stands to benefit significantly from the adoption of the 5X solution. Per our analysis, adoption of this technology could reduce India’s estimated peak loads by around 400 GW in 2050 while resulting in the curtailment of about 1,300 TWh required to operate these units—almost equivalent to India’s total electricity consumption today.44
xxii Theelectricitypricesinthefivemarkets(China,India,Indonesia,Mexico,andBrazil)wereconsideredtoincreaseatanaverageconsumerpriceinflationratebetween2016and2050.
xxiii TheemissionintensityoftheIndianeconomyintheyear2005isestimatedtobe0.96kgCO2perUS$inconstant2010dollars.
By 2050, India’s avoided cumulative emissions from the 5X solution are estimated to be 16 gigatons, which essentially neutralizes the climate impact of total carbon dioxide emissions (from primary energy) of the country over the last decade.45 The impact of switching from today’s standard RAC technology to the 5X solution becomes all the more critical if India is to successfully achieve its Nationally Determined Contributions (NDCs) in line with the Paris climate goals.46 Our analysis shows that the 5X solution alone could reduce the emission intensity of the Indian economy by 15% in the year 2030 (from 2005 levels)—nearly 40% of the NDC target.47, xxiii This, when combined with the country’s renewable energy target of 175 GW by 2022, could achieve a 48% reduction in the emissions intensity, putting the Indian
Figure 3.3: Electricity consumption from RAC operation in 2050
RS Savings- improvedScenario
Savings-5X Scenario
5X Scenario
RS- 2050 5x Scenario- 2050 Electricity savings Share of electricity savings-envelope improvement
0
1,000
2,000
3,000
4,000
5,000
6,000
7,000
8,000
Tera
wat
t h
ours
7,692
148
3,633
1,798
2,113
| 27SOLVING THE GLOBAL COOLING CHALLENGE: How to Counter the Climate Threat from Room Air Conditioners
economy on a sustainable growth pathway. By ensuring rapid scaling and uptake of the 5X solution, the country could save about US$380 billion—a whopping 15% of its GDP in 2016.48
Furthermore, we believe that the 5X solution will actually impact the larger AC market, and not just the 70% of the market dominated by mini splits and self-contained window RACs, as the innovation spurred by the 5X solution cascades through the cooling industry.
5X Innovation Is Achievable Today
We believe that a 5X solution for comfort cooling is achievable even with technology largely available today. In order for this solution to achieve five times less climate impact, it would have to be four- to five times more energy efficient, in combination with utilizing low-GWP refrigerants.
xxiv TheRMIenergymodelassumesthefollowingcharacteristicsforabaselinetest-building:aNewDelhiapartment(middleunit),southfacing,20%window-to-wallratio,approximately100m2,withfouroccupants.
Current best-in-class units are already over two times more energy efficient than the market average, and when combined with optimization strategies for available low-GWP refrigerants they could be up to 2.5 times more efficient. Converting this to a climate impact we quickly arrive at 3.5 times due to the elimination of high GWP direct emissions. Furthermore, most advanced commercially available units have only achieved 14% of theoretical maximum efficiency. A number of emerging technologies hold promise and offer several hypothetical pathways to 5X that involve using technologies and low-GWP refrigerants in combination.
To test a potential pathway to a 5X solution utilizing known technologies, we created an energy model simulating a baseline test building in New Delhi, India.xxiv The model assumes a baseline 1.5 ton fixed-speed air-conditioner unit with a 3.5 EER, used in conjunction with a stand-alone dehumidifier to maintain 60% relative humidity. The model
Figure 3.4: Electricity consumption from RAC operation in RS and 5X Scenario in India
2016
2018
2020
2022
2024
2026
2028
2030
2032
2034
2036
2038
204
0
204
2
204
4
204
6
204
8
2050
Tera
wat
t h
ours
Electricity consumption- RS Electricity consumption- 5X Scenario
0
200
400
600
800
1,000
1,200
1,400
1,600
1,800
2,000
70%reduction
in electricity use
28 | SOLVING THE GLOBAL COOLING CHALLENGE: How to Counter the Climate Threat from Room Air Conditioners
results, summarized in Figure 3.5, underscore the 5X potential and highlight the following:
Proven enhancements of conventional vapor compression systems can achieve a 2.5X increase in efficiency.49, xxv RMI energy modeling shows that the best-in-class variable refrigerant flow (VRF) mini splits offer a large (approximately 60%) savings opportunity due to part-load performance. Further efficiencies can be achieved by improving heat exchanger performance for both the condenser and evaporator and by using low-GWP refrigerants. Tests by Oak Ridge National Laboratory (ORNL) on R290 found 7% to 11% efficiency savings for direct replacement.50
Free cooling and advanced dehumidification can bring us to a 3.5X
xxv RMIenergymodelingusingdatafromBEOPTforUSSEER33MiniSplit(COP5.4).xxvi RMIenergymodelingbasedonVRFscenariowithaddedventilationfan2°CdeltaT,coolingto22°C.xxvii Ouranalysisassumes50%lossesduetoshading.
more efficient solution.51, xxvi RMI energy modeling shows that free cooling alone can save up to 6% energy relative to VRF without this feature. Additional savings can be achieved using advanced dehumidification options such as: desiccant dehumidification with thermal recharge (including compressor waste heat, outdoor ambient or solar thermal), and reheat accomplished with compressor waste heat and/or sensible exchange with ambient temperatures.
Solar photovoltaics could be integrated into the outdoor unit of the air conditioner. Substantial savings can be achieved even assuming large losses due to shading, etc. xxvii The RMI energy model shows up to 482 kWh/year output for a 1.4 m2 panel in New Delhi. Solar thermal or combined PV
Baseline (withdehumidifi-
cation)
Efficiencyimprovements
to vapor compression cycle
Free cooling(economizer)
Advanceddehumidification
Solar PVintegration
5X unit0
500
1,000
1,500
2,000
2,500
>5X
1,232
147
241
2,086
117
349
Figure 3.5: Pathway for a 5X efficiency solution using conventional technologies
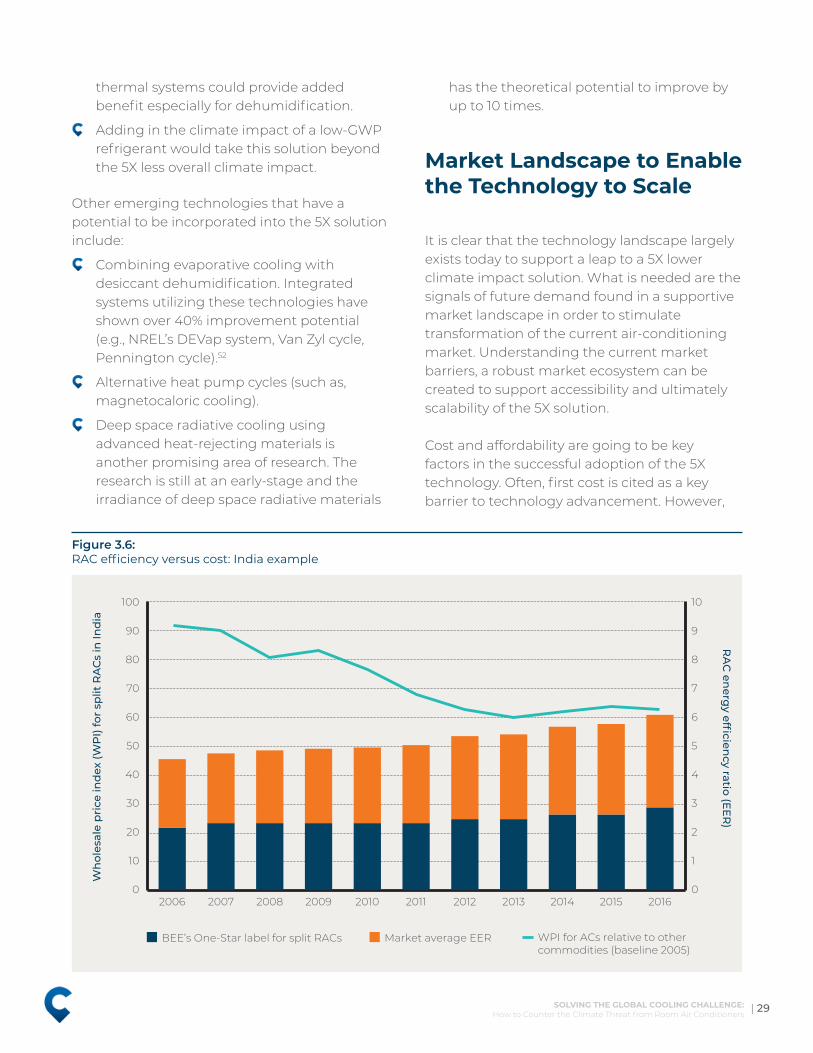
| 29SOLVING THE GLOBAL COOLING CHALLENGE: How to Counter the Climate Threat from Room Air Conditioners
thermal systems could provide added benefit especially for dehumidification.
Adding in the climate impact of a low-GWP refrigerant would take this solution beyond the 5X less overall climate impact.
Other emerging technologies that have a potential to be incorporated into the 5X solution include:
Combining evaporative cooling with desiccant dehumidification. Integrated systems utilizing these technologies have shown over 40% improvement potential (e.g., NREL’s DEVap system, Van Zyl cycle, Pennington cycle).52
Alternative heat pump cycles (such as, magnetocaloric cooling).
Deep space radiative cooling using advanced heat-rejecting materials is another promising area of research. The research is still at an early-stage and the irradiance of deep space radiative materials
has the theoretical potential to improve by up to 10 times.
Market Landscape to Enable the Technology to Scale
It is clear that the technology landscape largely exists today to support a leap to a 5X lower climate impact solution. What is needed are the signals of future demand found in a supportive market landscape in order to stimulate transformation of the current air-conditioning market. Understanding the current market barriers, a robust market ecosystem can be created to support accessibility and ultimately scalability of the 5X solution.
Cost and affordability are going to be key factors in the successful adoption of the 5X technology. Often, first cost is cited as a key barrier to technology advancement. However,
Figure 3.6: RAC efficiency versus cost: India example
2006 2007 2008 2009 2010 2011 2012 2013 2014 2015 20160
10
20
30
40
50
60
70
80
90
100
0
1
2
3
4
5
6
7
8
9
10
BEE’s One-Star label for split RACs Market average EER WPI for ACs relative to other commodities (baseline 2005)
Wh
oles
ale
pri
ce in
dex
(WP
I) fo
r sp
lit R
AC
s in
Ind
iaR
AC
energ
y efficien
cy ratio (EE
R)
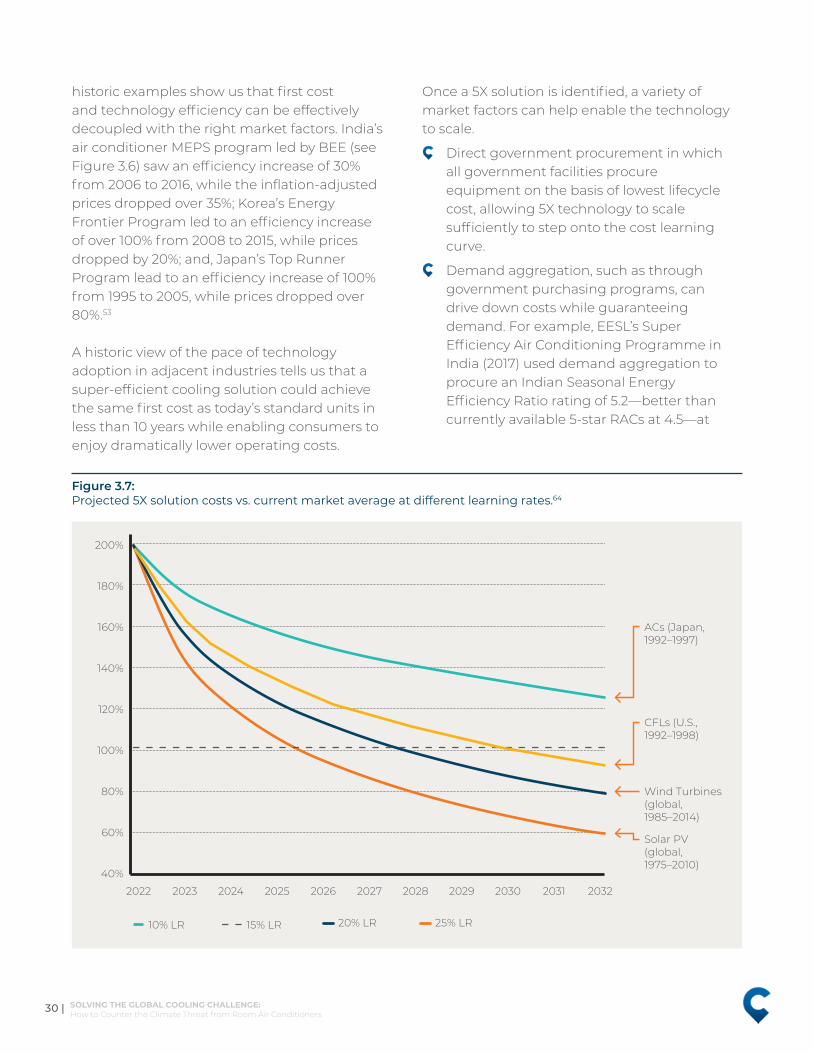
30 | SOLVING THE GLOBAL COOLING CHALLENGE: How to Counter the Climate Threat from Room Air Conditioners
historic examples show us that first cost and technology efficiency can be effectively decoupled with the right market factors. India’s air conditioner MEPS program led by BEE (see Figure 3.6) saw an efficiency increase of 30% from 2006 to 2016, while the inflation-adjusted prices dropped over 35%; Korea’s Energy Frontier Program led to an efficiency increase of over 100% from 2008 to 2015, while prices dropped by 20%; and, Japan’s Top Runner Program lead to an efficiency increase of 100% from 1995 to 2005, while prices dropped over 80%.53
A historic view of the pace of technology adoption in adjacent industries tells us that a super-efficient cooling solution could achieve the same first cost as today’s standard units in less than 10 years while enabling consumers to enjoy dramatically lower operating costs.
Once a 5X solution is identified, a variety of market factors can help enable the technology to scale.
Direct government procurement in which all government facilities procure equipment on the basis of lowest lifecycle cost, allowing 5X technology to scale sufficiently to step onto the cost learning curve.
Demand aggregation, such as through government purchasing programs, can drive down costs while guaranteeing demand. For example, EESL’s Super Efficiency Air Conditioning Programme in India (2017) used demand aggregation to procure an Indian Seasonal Energy Efficiency Ratio rating of 5.2—better than currently available 5-star RACs at 4.5—at
2022 2023 2024 2025 2026 2027 2028 2029 2030 2031 2032
40%
60%
80%
100%
120%
140%
160%
180%
200%
10% LR 15% LR 20% LR 25% LR
ACs (Japan,1992–1997)
CFLs (U.S.,1992–1998)
Wind Turbines(global,1985–2014)
Solar PV(global,1975–2010)
Figure 3.7: Projected 5X solution costs vs. current market average at different learning rates.64
| 31SOLVING THE GLOBAL COOLING CHALLENGE: How to Counter the Climate Threat from Room Air Conditioners
prices 25%–30% lower than the average market price of the 5-star RACs in India.
Advanced market commitments (AMCs) provide a further signal of demand, again helping to lower market barriers to entry.
In line with the step-change in technology, a step-change in MEP—not just the incremental moves we have largely seen to date—will support the scaling of the 5X solutions.
Supporting financing mechanisms such as on-bill financing, subsidies, incentives, and other structures can help consumers manage the higher initial first cost of next-generation technology. These mechanisms must be flexible and country- or region-specific in order to align and leverage local conditions and practices.
A coalition of policymakers, manufacturers, financiers, and major buyers that line up potential investments, influence standards, and secure advance market commitments can together effectively prime the market for the breakthrough technology.
While diverse market mechanisms are important to achieve scalability, mobilizing public awareness and consumer demand will be absolutely critical to transform the air-conditioning industry. Sensitizing consumers about the operating costs versus the first costs of efficient equipment is only a part of it. As regions continue to grow warmer and face degrading air quality, it is becoming important to link issues of efficiency with issues that consumers may care about a little bit more, like public health. Public awareness about how cooling is connected to climate change and pollution has to be elevated to a level where buying a super-efficient appliance is no longer only a first-cost-based decision, but one that the consumers base on lifecycle cost and the health and well-being of their children.
Conclusion
It is possible to solve the global cooling challenge and enable thermal comfort for all without warming the planet: the solution lies in a breakthrough cooling technology with five times less climate impact. This solution is within our reach. The societal, environmental, and global benefits of such a solution are far-reaching—the cumulative emissions reduction by 2050, estimated to be up to 100 gigatons, would be equivalent to immediately making all 28 countries in the European Union carbon neutral. The resulting electricity savings would avoid about US$1.4 trillion in capital investment in unnecessary power generation capacity, freeing up this capital for other developmental and national priorities. Universal adoption of the 5X more efficient technology could bring global climate goals within reach, as well as safeguard the well-being of populations, particularly those living in heat-stressed areas.
The magnitude of the cooling challenge serves as an urgent call to action. The world has the technical savvy to find the solution: but the critical need is for the global change agents to come together to demonstrate future demand necessary to catalyze and scale this solution. To get the innovative, energy-efficient cooling solutions into the hands of those that need them most, cross-sector work is required to effectively disrupt the industry, stimulate innovation, prime air-conditioning markets, and improve accessibility.
The need of the hour is for global, national, and local coalitions to come together in order to spur the industry, stimulate innovation, and prime the markets.
The clock is ticking—do we allow inertia to define us or do what humankind has done through the ages and look to innovation to move us forward?
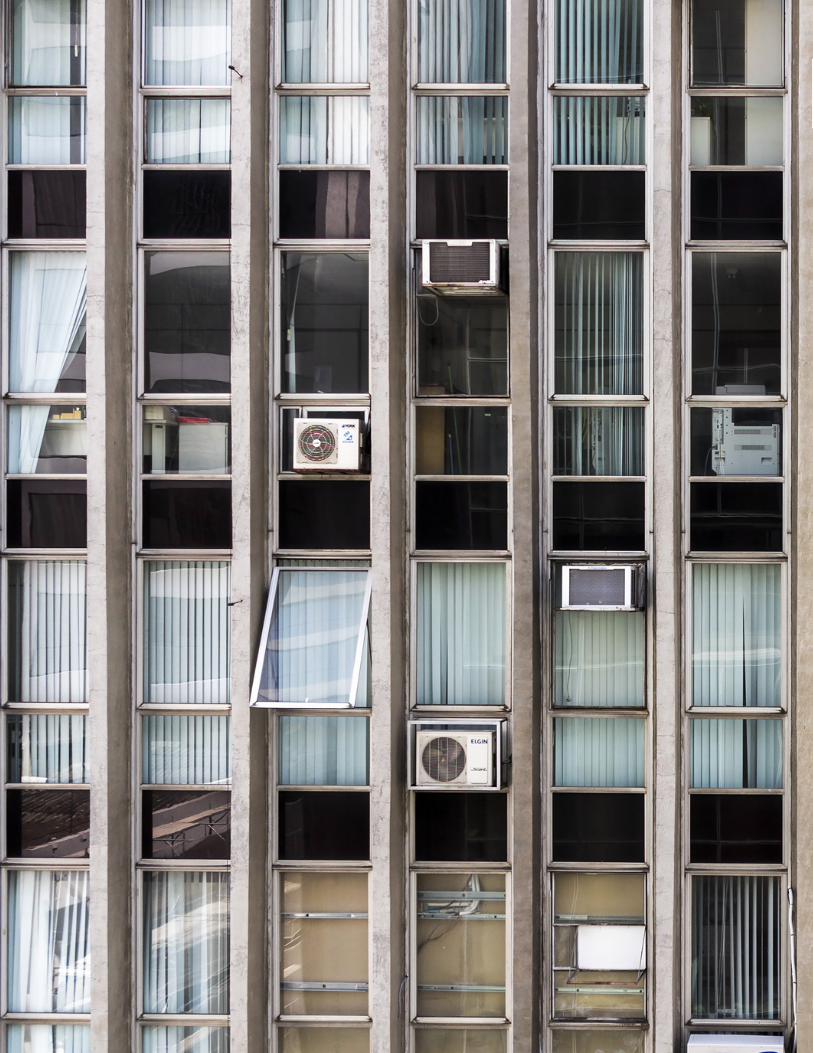
| 32SOLVING THE GLOBAL COOLING CHALLENGE: How to Counter the Climate Threat from Room Air Conditioners

| 33SOLVING THE GLOBAL COOLING CHALLENGE: How to Counter the Climate Threat from Room Air Conditioners
APPENDIX
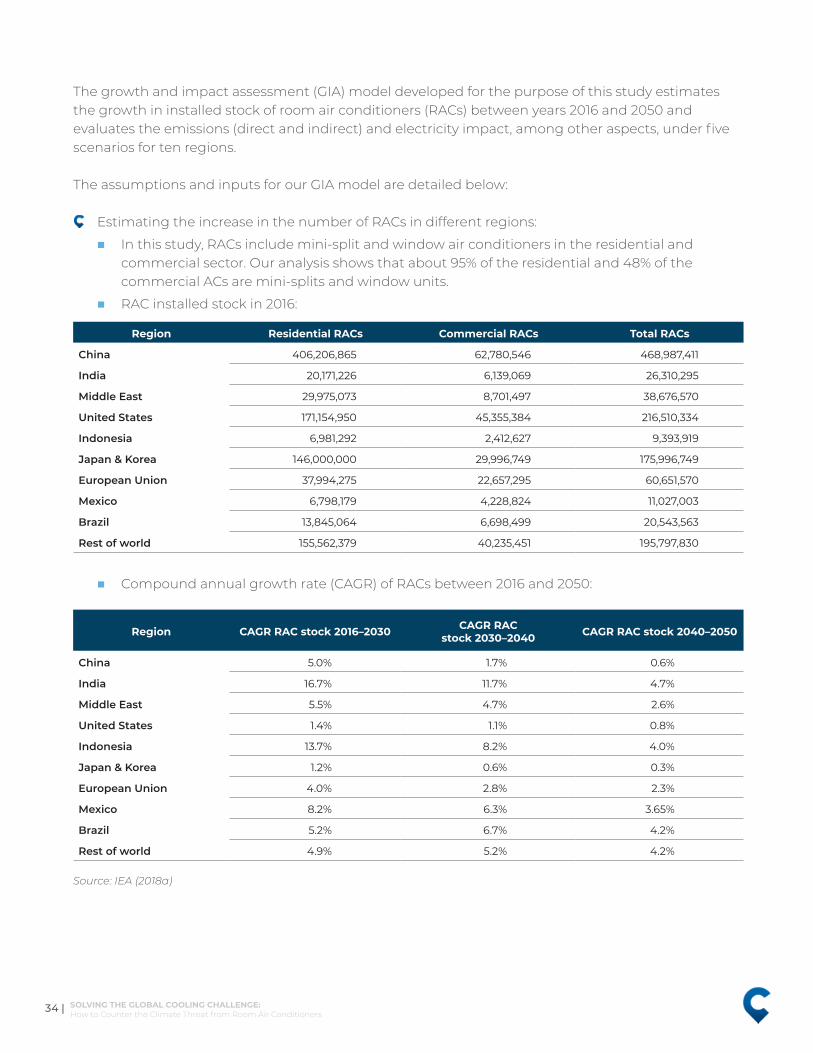
34 | SOLVING THE GLOBAL COOLING CHALLENGE: How to Counter the Climate Threat from Room Air Conditioners
The growth and impact assessment (GIA) model developed for the purpose of this study estimates the growth in installed stock of room air conditioners (RACs) between years 2016 and 2050 and evaluates the emissions (direct and indirect) and electricity impact, among other aspects, under five scenarios for ten regions.
The assumptions and inputs for our GIA model are detailed below:
Estimating the increase in the number of RACs in different regions:
� In this study, RACs include mini-split and window air conditioners in the residential and commercial sector. Our analysis shows that about 95% of the residential and 48% of the commercial ACs are mini-splits and window units.
� RAC installed stock in 2016:
Region Residential RACs Commercial RACs Total RACs
China 406,206,865 62,780,546 468,987,411
India 20,171,226 6,139,069 26,310,295
Middle East 29,975,073 8,701,497 38,676,570
United States 171,154,950 45,355,384 216,510,334
Indonesia 6,981,292 2,412,627 9,393,919
Japan & Korea 146,000,000 29,996,749 175,996,749
European Union 37,994,275 22,657,295 60,651,570
Mexico 6,798,179 4,228,824 11,027,003
Brazil 13,845,064 6,698,499 20,543,563
Rest of world 155,562,379 40,235,451 195,797,830
� Compound annual growth rate (CAGR) of RACs between 2016 and 2050:
Region CAGR RAC stock 2016–2030 CAGR RAC stock 2030–2040 CAGR RAC stock 2040–2050
China 5.0% 1.7% 0.6%
India 16.7% 11.7% 4.7%
Middle East 5.5% 4.7% 2.6%
United States 1.4% 1.1% 0.8%
Indonesia 13.7% 8.2% 4.0%
Japan & Korea 1.2% 0.6% 0.3%
European Union 4.0% 2.8% 2.3%
Mexico 8.2% 6.3% 3.65%
Brazil 5.2% 6.7% 4.2%
Rest of world 4.9% 5.2% 4.2%
Source: IEA (2018a)

| 35SOLVING THE GLOBAL COOLING CHALLENGE: How to Counter the Climate Threat from Room Air Conditioners
� Annual sales of RACs in 2016:
Region Residential RAC sales Commercial RAC sales Total RAC sales
China 38,552,040 5,805,822 44,357,863
India 2,934,564 967,637 3,902,201
Middle East 3,996,676 967,637 4,964,313
United States 11,362,984 3,870,548 15,233,532
Indonesia 997,327 483,819 1,481,146
Japan & Korea 11,000,000 1,935,274 12,935,274
European Union 7,952,290 1,451,456 9,403,746
Mexico 971,168 483,819 1,454,987
Brazil 988,933 145,146 1,134,079
Rest of world 6,848,658 3,241,584 10,090,242
Common assumptions for the model
� Market average energy efficiency ratio (EER) in 2016
Region EER (W/W)
China 3.18
India 3.10
Middle East 2.98
United States 2.81
Indonesia 2.95
Japan & Korea 2.91
European Union 2.79
Mexico 2.74
Brazil 2.88
Rest of world 2.93
Source: “Global Exchange on Efficiency: Cooling,” IEA (2018), accessed on October 2018, https://www.iea.org/exchange/cooling/; “Schedule 3: Room Air Conditioners,” Table 2.6, Bureau of Energy Efficiency (2016), https://www.beestarlabel.com/Content/Files/Schedule3A-RACS9jun.pdf
� Refrigerant assumptions
Refrigerant charge (kg) 1.1 kg/ton
Refrigerant leakage rate (%/year) 10%
End of life refrigerant loss (%) 100%
Recharge at loss of (%) 35%
Life of AC (years) 10
Source: Shah et. al, Benefits of Leapfrogging to Superefficiency and Low Global Warming Potential Refrigerants in Room Air Conditioning, 2015

36 | SOLVING THE GLOBAL COOLING CHALLENGE: How to Counter the Climate Threat from Room Air Conditioners
� Grid emissions intensity
• In all the scenarios (except the RS-C), we determined the grid emission intensity decline rate to acknowledge the latest commitments and policies of different nations. This was determined based on the IEA World Energy Outlook 2017 “New policies scenario.” Where the data is not available, we use a 1.82%/year decline rate, the predicted global average rate.54
• The following table provides the grid emissions intensity considered in the study for the year 2016 and the annual decline rate for each region.
Region kg CO2/kWh CAGR2016–2050
China 0.98 2.04%
India 0.96 1.70%
Middle East 0.65 1.29%
USA 0.48 1.01%
Indonesia 0.79 1.82%
Japan & Korea 0.55 1.56%
European Union 0.33 3.16%
Mexico 0.63 2.15%
Brazil 0.09 3.31%
Rest of world 0.76 1.82%
Source: IEA (2017), World Energy Outlook 2017; Shah et. al, Benefits of Leapfrogging to Superefficiency and Low Global Warming Potential Refrigerants in Room Air Conditioning, 2015
� Inverter AC market
• We assume that the inverter AC market share in 2016 for China, India, and Japan & Korea regions are 60%, 10%, and 95% respectively, based on data from a recent LBNL report.55 We assume that the inverter AC market share in the European Union (EU) is 80% based on the study which suggests the 2007 penetration level of 65%.
• Due to limited data availability, we assume that the 2016 market share of inverter ACs in all the other emerging economies (in the study) will be similar to that of India (i.e., 10% in 2016). For the United States, we assume that the trends are similar to the EU.
• We assume the projected Indian inverter AC market share to grow as expected—30% by 2018 and 50% by 2020.56 This trend is assumed to be followed by all the emerging economies.
• To estimate the number of inverter ACs in different regions by 2050, we assume that inverter ACs in each region will achieve a market share of 80% (where it falls short), increasing at 5%/year, and then get saturated.
• We assume that the inverter AC unit consumes about 75% of the total power of a fixed speed AC unit.57
� Transmission and distribution losses
• The transmission and distribution (T&D) losses of the electricity grid are considered to be the average of the last three years according to World Bank data.

| 37SOLVING THE GLOBAL COOLING CHALLENGE: How to Counter the Climate Threat from Room Air Conditioners
Region T&D losses (%)
China 5.7%
India 18.9%
Middle East 10.2%
USA 6.1%
Indonesia 9.3%
Japan & Korea 3.8%
European Union 6.5%
Mexico 14.1%
Brazil 16.5%
Rest of world 10.1%
• Due to limited data availability, we assume a constant T&D loss for all regions through 2050 except India and Mexico. Per available information, the T&D losses for India and Mexico are assumed to decrease to 7.2% and 8.6% by 2050, respectively.58,59
� Annual usage hours of the RACs
• The annual usage of air conditioners depends on a variety of factors ranging from temperature and humidity levels to occupant behavior. Our research from different studies and regions is compiled below to show the annual usage of room air conditioners.
Region Usage hours/year
China 545
India 1,600
Middle East 4,672
USA 1,600
Indonesia 2,263
Japan & Korea 720
European Union 520
Mexico 1,643
Brazil 1,679
Rest of world 720
Source: Liu et al, The Life Cycle rebound effect of air conditioner consumption in China, Applied Energy 184 (2016), 1026-1032; Fridley et al, Technical and Economic analysis of Energy Efficiency of Chinese Room Air Conditioners, 2001; Shah et. al, Benefits of Leapfrogging to Superefficiency and Low Global Warming Potential Refrigerants in Room Air Conditioning, 2015; “Climate Change Knowledge Portal,” The World Bank Group, accessed on October 2018, http://sdwebx.worldbank.org/climateportal/index.cfm?page=country_historical_climate&ThisCCode=KOR
• We assume that the annual usage hours increase at a CAGR of 0.7%/year in all scenarios (except 5X) for each region corresponding to a 25% increase in number of cooling degree days by 2050.60

38 | SOLVING THE GLOBAL COOLING CHALLENGE: How to Counter the Climate Threat from Room Air Conditioners
� Other common assumptions:
• Our analysis assumes a continued improvement of the energy efficiency ratio (EER) of RACs at a weighted average annual rate of 0.5% (except in the Improved Scenario).61, xxviii
Scenario specific assumptions
� Reference scenario (RS):
• We assume a continued adoption of building energy codes leading to 5% reduction in cooling energy demand in 2050.62,xxix
� Reference Scenario—Isolating Cooling Impact (RS-C):
• We assume that the grid emissions intensity factor remains constant at year 2016 levels.
• Other aspects of the reference scenario such as improvements from T&D losses and building codes remain unchanged in this scenario.
� Reference Scenario—Kigali Phasedown (RS-K):
• We assume a complete phase out of refrigerant R410a by the year 2035. The use of R32 (GWP 675) gradually increases between 2022 and 2035 replacing R410a. Our analysis shows that to achieve the Kigali Amendment goals, the world will have to transition to a further low-GWP refrigerant. A refrigerant with a GWP of about 50 will gradually replace R32 from the year 2035 onwards to capture the entire market by the year 2050.
• We assume that all the countries follow Group 1 A5 parties, with starting year 2024 to freeze HFC production. This midpoint is adopted because the non A5 parties have 2019 as a starting year while the Group 2 A5 parties have a starting year of 2028 to begin their compliance to the Kigali Amendment.
• Other aspects of the reference scenario remain unchanged in this scenario.
� Improved Scenario
• We assume that building envelope improvements (thermal insulation driven by building codes) have the potential to achieve a 7.5% reduction in cooling demand in 2050 in developed countries. For developing countries, we assume that a 15% reduction in cooling demand can be achieved in 2050 as a significant portion of the building stock is still to be built.63, xxx
• We assume the development of adequate methods to ensure refrigerant recovery at the end of life of the equipment. This progressively increases up to 50% in 2050.
• We assume that minimum efficiency performance standards (MEPS) are made stringent to ensure that the efficiency improvement of RACs occurs at twice the rate of the reference scenario. The market average EER of RACs in each region is thus improved at a steady rate and would reach to around 80% of the current best technology available in each region.
xxviiiForIndia,a3%annualimprovementinefficiencyhasbeenassumeduntil2030basedonBEE’sinformation.Past2030anEERincreaseof0.5%annuallyisconsidereduntil2050.
xxix A5%improvementincoolingenergydemandconsiderstheadoptionofbuildingcodesataslowtomoderatepaceinIndia.Thisimprovementpotentialisassumedtobevalidforallregionsof thestudyasdevelopingcountriesareyettoseetheconstructionofmostoftheirbuildingstockanddevelopedcountryhouseholdswouldbegintorequiremodestretrofitsfortheiroldbuildingstock.
xxx Duetolimitedavailabilityofdataforallthemodelcountries,weassumethecoolingenergyreductionpotentialthroughbuildingenvelopeimprovementswouldfollowthetrendsforUnitedStatesforalldevelopedcountriesandfollowthetrendsinIndiaandChinafordevelopingcountries.

| 39SOLVING THE GLOBAL COOLING CHALLENGE: How to Counter the Climate Threat from Room Air Conditioners
• We assume full compliance to the HFC phase-down requirement laid down under the Kigali amendment to the Montreal Protocol. For the purpose of analysis, all the countries follow Group 1 A5 parties, with starting year 2024 to freeze HFC production.xxxi
� 5X Scenario
• To achieve a 5X climate impact, our 5X solution assumes a technology that uses four times less electricity in combination with a low-GWP refrigerant (such as R290).
• We acknowledge the fact that the industry always responds to the anticipated government policies well in advance. The adoption curve for the 5X solution follows a trend such that by the year 2030 it gains an 80% share of the annual sales, and by the year 2040 it achieves an almost 100% share of the annual sales. It thus achieves the Kigali Amendment goals by itself.
• We understand that a super-efficient technology could result in increased usage and electricity consumption because of the rebound effect. Therefore, we assume a 5% increase in RAC operating hours by 2050 to account for this rebound effect.
• We assume that the strict implementation of building codes (as assumed in the Improved Scenario) will continue to flow in the 5X scenario.
xxxi Thismidpointisadoptedbecausethenon-A5partieshave2019asastartingyearwhiletheGroup2A5partieshaveastartingyearof2028tobegintheircompliancetotheKigaliAmendment.
40 | SOLVING THE GLOBAL COOLING CHALLENGE: How to Counter the Climate Threat from Room Air Conditioners
References
1 “Heat Island Effect,” US EPA, accessed on October 2018, https://www.epa.gov/heat-islands
2 IEA (International Energy Agency) (2018a), The Future of Cooling: Opportunities for energy-efficient air conditioning.
3 IEA (2018a); Shah et. al, Benefits of Leapfrogging to Superefficiency and Low Global Warming Potential Refrigerants in Room Air Conditioning, 2015; “Total emissions of unitary air conditioning,” Green Cooling Initiative, accessed October 2018, http://www.green-cooling-initiative.org/
4 IPCC (2018), Global Warming of 1.5℃: Summary for Policymakers.
5 Xu et al, Well below 2 °C: Mitigation strategies for avoiding dangerous to catastrophic climate changes, 2016.
6 R. J. H. Dunn, D. M. Stanitski, N. Gobron, and K. M. Willett, Eds., 2018: Global Climate [in “State of the Climate in 2017”]. Bull. Amer. Meteor. Soc., 99 (8), S5–68, doi:10.1175/2018BAMSStateoftheClimate.1.
7 Blunden, J., D. S. Arndt, and G. Hartfield , Eds., 2018: State of the Climate in 2017. Bull. Amer. Meteor. Soc., 99 (8), Si–S310, doi:10.1175/2018BAMSStateoftheClimate.1.
8 IPCC, 2014: Climate Change 2014: Synthesis Report. Contribution of Working Groups I, II and III to the Fifth Assessment Report of the Intergovernmental Panel on Climate Change [Core Writing Team, R.K. Pachauri and L.A. Meyer (eds.)]. IPCC, Geneva, Switzerland, 151 pp.
9 IEA (2018a)
10 “Global risk of deadly heat,” Nature Climate Change, accessed October 2018, https://www.nature.com/articles/nclimate3322
11 PRB (Population Reference Bureau), (2018), 2018 World Population Data Sheet.
12 United Nations, Department of Economic and Social Affairs, Population Division (2015). World Urbanization Prospects: The 2014 Revision, (ST/ESA/SER.A/366).
13 OECD (2018), Real GDP long-term forecast (indicator). doi: 10.1787/d927bc18-en, accessed on 19 October 2018.
14 EIA, (2018), International Energy Outlook 2018.
15 AEEE, (2018): Demand Analysis for Cooling by Sector in India in 2027 (Version 2)
16 SEforALL (2018), Chilling Prospects: Providing Sustainable Cooling For All
17 Aastha Ummat, NITI Aayog (National Institution for Transforming India), Government of India (2015), Examining the Effect of Efficient Construction Material on the Space Cooling Load in India
18 IEA (2017), World Energy Outlook 2017
19 IEA (2018a)
20 Shah et. al, Benefits of Leapfrogging to Superefficiency and Low Global Warming Potential Refrigerants in Room Air Conditioning, (2015)
21 “Total Energy: Electricity End Use,” EIA, accessed on October 2018, https://www.eia.gov/totalenergy/data/browser/?tbl=T07.06#/?f=A&start=1949&end=2017&charted=5-6-7
22 “Statistics,” IEA (2018b), accessed on October 2018, https://www.iea.org/statistics
23 IEA (2018b)
24 IRENA (2018), Renewable capacity statistics 2018, International Renewable Energy Agency, (IRENA), Abu Dhabi
25 Shah et. al, Benefits of Leapfrogging to Superefficiency and Low Global Warming Potential Refrigerants in Room Air Conditioning, (2015)
26 “Our energy insights: Residential air–conditioners; giving them the third degree,” National Grid, accessed on October 2018, http://fes.nationalgrid.com/media/1243/ac-2050-v21.pdf
27 “India’s peak power demand to jump four-fold by 2035-36: draft CEA plan,” The Hindu, January 02, 2017, accessed October 19, 2018, https://www.thehindubusinessline.com/economy/macro-economy/indias-peak-power-demand-to-jump-fourfold-by-203536-draft-cea-plan/article9455467.ece
28 Lin et al, Excess Capacity in China’s Power Systems: A Regional Analysis, 2016. Available at https://china.lbl.gov/sites/all/files/lbnl1006638.pdf
29 Karali et al, Potential Impact of Lighting and Appliance Efficiency Standards on Peak Demand: The Case of Indonesia, 2015. Avail-able at http://eta-publications.lbl.gov/sites/default/files/lbnl-1003760.pdf
| 41SOLVING THE GLOBAL COOLING CHALLENGE: How to Counter the Climate Threat from Room Air Conditioners
30 “Remaining Carbon Budget,” Mercator Research Institute on Global Commons and Climate Change, accessed October 2018, https://www.mcc-berlin.net/en/research/co2-budget.html; IPCC, 2013: Climate Change 2013: The Physical Science Basis. Contribution of Working Group I to the Fifth Assessment Report of the Intergovernmental Panel on Climate Change [Stocker, T.F., D. Qin, G.-K. Plattner, M. Tignor, S.K. Allen, J. Boschung, A. Nauels, Y. Xia, V. Bex and P.M. Midgley (eds.)]. Cambridge University Press, Cambridge, United Kingdom and New York, NY, USA, 1535 pp; IEA (2018b)
31 “Material: Refrigerant Management,” Drawdown, accessed October 2018, https://www.drawdown.org/solutions/materials/refrigerant-management
32 IEA (2018a)
33 “White LEDs with super-high luminous efficacy could satisfy all general lighting needs,” PhysOrg, August 31 2010, accessed October 2018, https://phys.org/news/2010-08-white-super-high-luminous-efficacy.html
34 “SunPower Holds World Record for Most Efficient Rooftop Solar Panel, Again,” Greentech Media, June 27 2016, accessed October 2018, https://www.greentechmedia.com/articles/read/sunpower-again-holds-record-for-worlds-most-efficient-rooftop-solar-panel
35 Kigali Cooling Efficiency Program (2018), Global, regional and country activities supported by the Kigali Efficiency Program. Avail-able at https://www.k-cep.org/wp-content/uploads/2018/09/Global-regional-and-country-profiles-of-K-CEP-projects.pdf
36 BIS Research – 2015-2020 Global AC Market Forecast
37 Park et al, Assessment of commercially available energy-efficient room air conditioners including models with low global warming potential (GWP) refrigerants, 2017.
38 IEA (2018a)
39 Kigali Cooling Efficiency Program (2018). Knowledge Brief, Optimization, Monitoring, and Maintenance of Cooling Technology.” Avail-able at http://k-cep.org/wp-content/uploads/2018/03/Optimization-Monitoring-Maintenance-of-Cooling-Technology-v2-subhead....pdf
40 Aastha Ummat, NITI Aayog (National Institution for Transforming India), Government of India (2015), Examining the Effect of Efficient Construction Material on the Space Cooling Load in India; Yu et al (2014), A long-term, integrated impact assessment of alternative building energy code scenarios in China, Energy Policy 67 (2014) 626–639; US DOE (2014), Windows and Building Envelope Research and Development: Roadmap for Emerging Technologies.
41 “Exponential Climate Action Roadmap,” Global Climate Action Summit, 2018, accessed on October 2018, https://exponentialroadmap.org/wp-content/uploads/2018/09/Exponential-Climate-Action-Roadmap-September-2018.pdf
42 “Construction costs of most power plant types have fallen in recent years,” EIA (2017), July 5 2017, accessed October 2018, https://www.eia.gov/todayinenergy/detail.php?id=31912
43 “G20 Economic Forecast,”, Knoema 2018, accessed on October 2018, https://knoema.com/haqctgc
44 IEA (2018b)
45 IEA (2018b)
46 “India INDC to UNFCCC,” UNFCCC, accessed on October 2018, http://www4.unfccc.int/ndcregistry/PublishedDocuments/India%20First/INDIA%20INDC%20TO%20UNFCCC.pdf
47 “World Development Indicators,” World Bank, accessed on October 2018, http://databank.worldbank.org/data/reports.aspx?source=world-development-indicators; Niti Aayog (2017), Energizing India: A joint report of Niti Aayog and IEEJ; IEA (2018b).
48 “World Development Indicators,” World Bank, accessed on October 2018, http://databank.worldbank.org/data/reports.aspx?source=world-development-indicators
49 ORNL (2015), Alternative Refrigerant Evaluation for High-Ambient-Temperature Environments: R-22 and R-410A Alternatives for Mini-Split Air Conditioners; Yun et al, Comparison of Performance of a Residential Air-Conditioning System Using Microchannel and Fin and-Tube Heat Exchanger, 2006.
50 ORNL (2015), Alternative Refrigerant Evaluation for High-Ambient-Temperature Environments: R-22 and R-410A Alternatives for Mini-Split Air Conditioners.
51 Wang, Ge & Zeng (2016), Comfortable, high-efficiency heat pump with desiccant-coated, water-sorbing heat exchangers, Nature Scientific Reports | 7:40437.
52 Pandelidis et al, Comparison of desiccant air conditioning systems with different indirect evaporative air coolers, 2016; Kozubal et al., Desiccant Enhanced Evaporative Air-Conditioning (DEVap): Evaluation of a New Concept in Ultra Efficient Air Conditioning, 2011; van Zyl & Warwicker, Desiccants of the Future

42 | SOLVING THE GLOBAL COOLING CHALLENGE: How to Counter the Climate Threat from Room Air Conditioners
53 LBNL (2018), Technical Analysis to Support Efficiency Improvement in VRF Air Conditioners with Low-GWP Refrigerants; Abhyankar et al, Accelerating Energy Efficiency Improvements in Room Air Conditioners in India, 2017. Available at https://ies.lbl.gov/sites/default/files/lbnl-1005798.pdf
54 IEA (2018a)55 Park et al., Assessment of commercially available energy-efficient room air conditioners including models with low GWP potential
refrigerants, Energy Analysis and Environmental Impacts Division, LBNL, 2017.56 Motilal Oswal (2017), Room air conditioners: Focus shifting to inverters.57 Shah et al., Cost Benefit of Improving the Efficiency of Room Air Conditioners (Inverter and Fixed speed) in India, Energy Analysis
and Environmental Impacts Division, LBNL, 2016.58 Niti Aayog (2015), A Report on Energy Efficiency and Energy Mix in the Indian Energy System (2030) Using India Energy Security
Scenarios, 2047. 59 IEA (2016), Mexico Energy Outlook.60 IEA (2018a)61 IEA (2018a)62 Aastha Ummat, NITI Aayog (National Institution for Transforming India), Government of India (2015), Examining the Effect of
Efficient Construction Material on the Space Cooling Load in India63 Aastha Ummat, NITI Aayog (National Institution for Transforming India), Government of India (2015), Examining the Effect of
Efficient Construction Material on the Space Cooling Load in India; Yu et al. (2014), A long-term, integrated impact assessment of alternative building energy code scenarios in China, Energy Policy 67 (2014) 626–639; US DOE (2014), Windows and Building Envelope Research and Development: Roadmap for Emerging Technologies.
64 IAEA, “Learning Curves and Technology Assessment”, 2003; Bloomberg New Energy Finance

17 State Street, 35th Floor, Unit 3520
New York, NY 10004
https://globalcoolingprize.org/
© November 2018 RMI. All rights reserved. Rocky Mountain Institute® and RMI® are registered trademarks.