solving systems of equations graphically equations on the coordinate plane we moved on to solving...
TRANSCRIPT

Unit 5: Graphs of Systems and Inequalities
1 | P a g e
Solving Systems of Equations Graphically
A system of equations is a collection of two or more equations with a same set of unknowns. In
solving a system of equations, we try to find values for each of the unknowns that will satisfy every
equation in the system. When solving a system containing two linear equations there will be one
ordered pair (x,y) that will work in both equations.
To solve such a system graphically, we will graph both lines on the same set of axis and look for the
point of intersection. The point of intersection will be the one ordered pair that works in both
equations. We must then CHECK the solution by substituting the x and y coordinates in BOTH
ORIGINAL EQUATIONS.
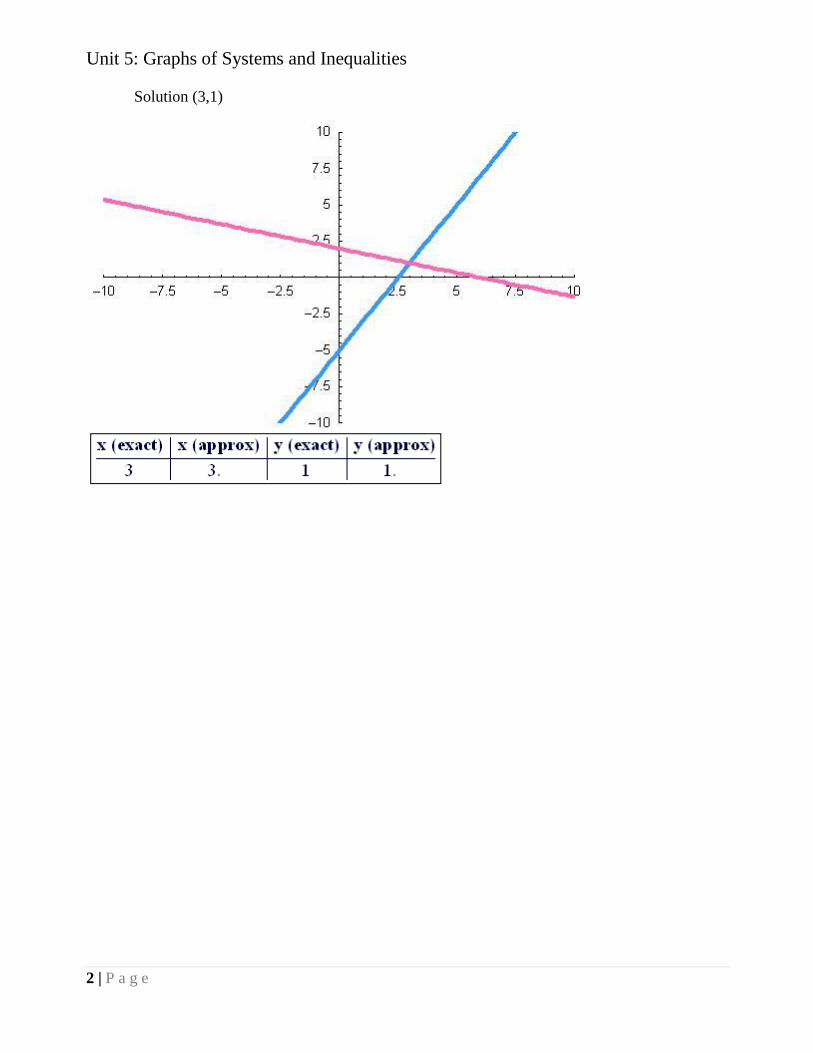
1) Solve the following system graphically:
y = 2x – 5
y = - ⅓x + 2
Unit 5: Graphs of Systems and Inequalities
2 | P a g e
Solution (3,1)

Unit 5: Graphs of Systems and Inequalities
3 | P a g e
Solve each of the systems of equations graphically:
2) y + 1 = -3(x – 1) 7x + 7y = 42

Unit 5: Graphs of Systems and Inequalities
4 | P a g e
Unit 5: Graphs of Systems and Inequalities
5 | P a g e
3) y – 9 = ¾ (x – 12) 6x + 12y = -60
Unit 5: Graphs of Systems and Inequalities
6 | P a g e

Unit 5: Graphs of Systems and Inequalities
7 | P a g e
4) 12x – 8y = 48
y – 4 = -2(x – 2)

Unit 5: Graphs of Systems and Inequalities
8 | P a g e
Unit 5: Graphs of Systems and Inequalities
9 | P a g e
5) y + 5 = 2(x + 4) y – 10 = - ½ (x + 4)

Unit 5: Graphs of Systems and Inequalities
10 | P a g e

Unit 5: Graphs of Systems and Inequalities
11 | P a g e
Solve each system graphically and check:
6) y = -4x -5 10) y-2= (3/5)(x-10)
y = 2x -7 y+11 =2(x+7)
7) 6x + 3y =21 11) 6x + 9y = 45
12x + 16y = -48 9x +15y = 75
8) 12x – 6y = -6 12) x = 5
16x -8y = 40 y-12 = -3(x+2)
9) y= -4
x = 7
Unit 5: Graphs of Systems and Inequalities
12 | P a g e

Unit 5: Graphs of Systems and Inequalities
13 | P a g e

Unit 5: Graphs of Systems and Inequalities
14 | P a g e
1) 36x – 12 y = 24 2) y – 8 = ½ (x – 2)
y - 4 = ⅓(x + 6) 24x + 24y = 24
3) y = -5 4) 27x + 18y = 72
y + 7 = -2(x – 2) y + 5 = -3(x – 2)
5) 15x + 30y = -120 6) 16x – 32y = -128
y - 1 = (3/2)(x + 2) 18x + 24y = -24

Unit 5: Graphs of Systems and Inequalities
15 | P a g e
Unit 5: Graphs of Systems and Inequalities
16 | P a g e
Graphing Inequalities
When we solved and graphed inequalities with only one variable (ex: x > 3), we moved on
to compound inequalities (AND/OR). We would graph both inequalities on the same number line
and decide what to keep based on whether it was an AND or an OR problem. When we graphed
linear equations on the coordinate plane we moved on to solving systems of equations graphically.
When we graph inequalities in two variables on the coordinate plane, we do not graph compound
inequalities. We move on to solving systems of inequalities. It takes a little from both inequalities
with one variable and solving systems graphically.
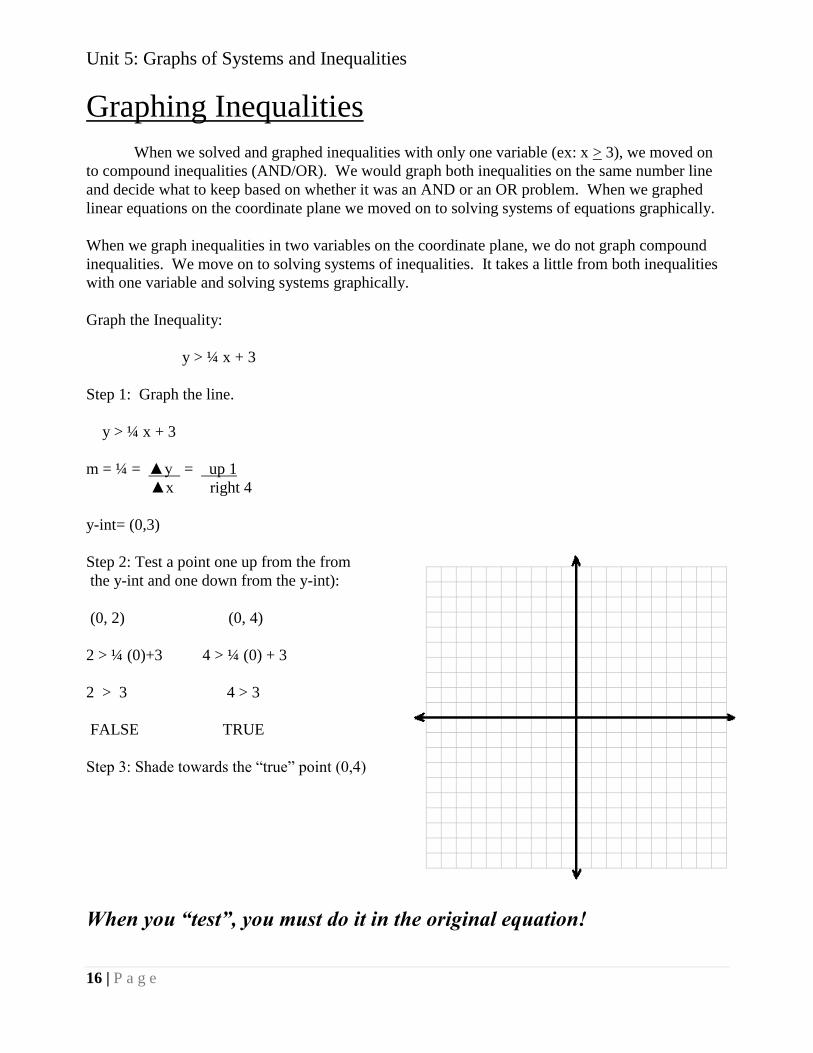
Graph the Inequality:
y > ¼ x + 3
Step 1: Graph the line.
y > ¼ x + 3
m = ¼ = ▲y = up 1
▲x right 4
y-int= (0,3)
Step 2: Test a point one up from the from
the y-int and one down from the y-int):
(0, 2) (0, 4)
2 > ¼ (0)+3 4 > ¼ (0) + 3
2 > 3 4 > 3
FALSE TRUE
Step 3: Shade towards the “true” point (0,4)
When you “test”, you must do it in the original equation!

Unit 5: Graphs of Systems and Inequalities
17 | P a g e
1) 6x - 9y > 36
2) y - 3 > -2(x + 1)

Unit 5: Graphs of Systems and Inequalities
18 | P a g e
3) 12x + 9y < 27
4) y + 4 > -3(x - 3)

Unit 5: Graphs of Systems and Inequalities
19 | P a g e
5) y > 4
6) x < -6

Unit 5: Graphs of Systems and Inequalities
20 | P a g e
Graphing Systems of Inequalities
Solve the system of inequalities graphically: y > ¼ x + 3
y < 3x – 5
Step 1: Graph the 1st inequality (graph and test a point one up from the y-int and one down from the
y-int.):
y > ¼ x + 3
m = ¼ =
y-int= (0,3)
(0, 2) TEST (0, 4)
2 > ¼ (0)+3 -3 > ¼ (0) + 3
2 > 3 4 > 3
FALSE TRUE
Step 2: Graph the 2nd
inequality (graph the line and test a point one up from the y-int and one down
from the y-int.):
y < 3x – 5
m = 3/1 =
y-int.= (0,-5)
(0-6) TEST (0,-4)
-6 < 3(0) - 5 -4 < 3(0) - 5
-6 < -5 -4 < -5
TRUE FALSE
Unit 5: Graphs of Systems and Inequalities
21 | P a g e
Step 3: Label the area where the shading intersects with an “S”
2) y - 3 < - ⅓(x – 6)
12x – 6y > -12

Unit 5: Graphs of Systems and Inequalities
22 | P a g e
3) x > 4
y < -5
4) 24x + 6x > -6
y > 2
Unit 5: Graphs of Systems and Inequalities
23 | P a g e
5) y – 6 < ⅔(x - 9)
x < -3