solving reverse logistics: optimizing multi-echelon
TRANSCRIPT

SOLVING REVERSE LOGISTICS:
OPTIMIZING MULTI-ECHELON REVERSE NETWORK
A thesis
presented to
the faculty of
California Polytechnic State University, San Luis Obispo
In partial Fulfillment
Of the requirements for the degree
Master of Science in Industrial Engineering
By
Jun Kim
September 2009

ii
© 2009 Jun Kim
ALL RIGHTS RESERVED

iii
ABSTRACT

iv
ABSTRACT
SOLVING REVERSE LOGISTICS:
OPTIMIZING MULTI-ECHELON REVERSE NETWORK
Jun Kim
As part of sustainable development initiative, product take‐back strategy
encourages manufacturers to transform definition of sustainability into business
practices that would reduce environmental wastes, while reducing increasingly
growing waste management cost from municipal governments. This thesis evaluates
the complexity of reverse logistics with regards to product take‐back strategy
development and presents a programmatic approach of determining appropriate
number and location of initial collection points that would reduce variable cost, while
promoting more frequent product return. The application of this thesis would grant
‘green’ opportunities for organizations to strategize and execute cost‐efficient
reverse logistics to advance sustainability. A single‐objective, mixed‐integer, binary
programming was utilized to optimize the variable cost of handling, transshipping,
facilities, and carrying of reverse logistics. Apple Inc.’s current product take‐back
strategy was carefully evaluated and analyzed to suggest potential improvements to
its system. Network optimization design methodology along with case study results
would provide useful managerial insights and suggest avenues for further research
and applications.

v
ACKNOWLEDGEMENTS
I would like to acknowledge the support, patience, and help of the defense
committee, Dr. Reza Pouraghabagher, Dr. Unny Menon, and Dr. Roya Javadpour for
making this thesis possible.
vi
TABLE OF CONTENTS
LIST OF TABLES…………………………………………………………………..……v
LIST OF FIGURES………………………………………………………………………vi
CHAPTER 1: INTRODUCTION…………………….…………………………………...1
CHAPTER 2: OBJECTIVE……………………………..………………………………...4
CHAPTER 3: LITERATURE REVIEW…………….……………………………………5
SUSTAINABILITY……………..………………………………………………...5
INDUSTRIAL RESPONSES……………………………………………………..6
REVERSE LOGISTICS…………………………………………………………..7
STRATEGIC MODELING……………………………………………………...11
CHAPTER 4: MATHEMATICAL MODEL…………………………………………….13
MODEL ASSUMPTIONS………………………….…………………..……….13
INDICES, PARAMETERS, AND VARIABLES DEFINITION………………..14
MODEL CONSTRAINTS………………………….……………………...…….16
RESULTS AND DISCUSSION………………………….……………………...17
CHAPTER 5: CASE STUDY ON APPLE INC. ………………………………………..25
PROBLEM DEFINITION………………………….……………………………25
ADDITIONAL MODEL CONSTRAINTS……………………………………...29
RESULTS AND DISCUSSION………………………….……………………...32
CHAPTER 6: CONCLUSION & FUTURE RESEARCH………………………………35
BIBLIOGRAPHY………………………….………………………….…………………44
vii
LIST OF TABLES
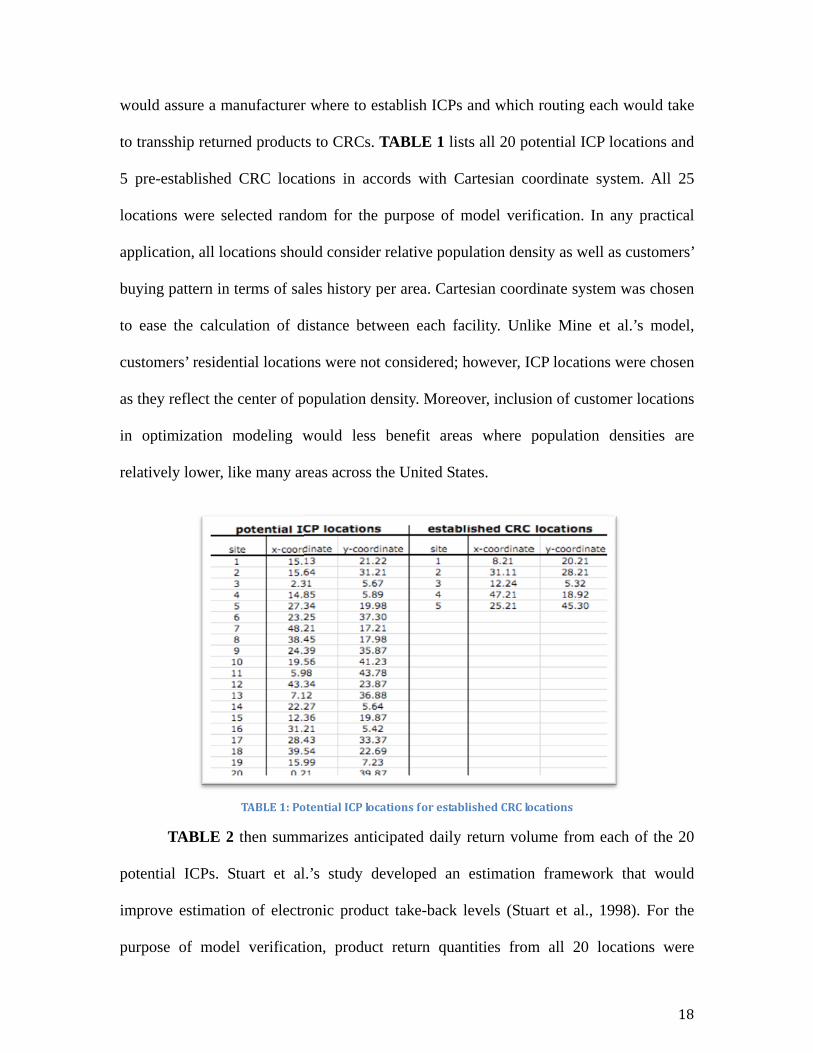
TABLE 1…..Potential ICP locations for established CRC locations……………….…...18
TABLE 2…..Daily return volume at 20 potential ICP locations……………….…….….19
TABLE 3…..Parameters used for mathematical modeling……………………………...20
TABLE 4…..Location of ICPs with specified return channel………………………………..….24
TABLE 5…..Locations in Cartesian coordinate………………………………………….………..…30
TABLE 6…..Annual return volume from 20 locations…………………………………………....31
TABLE 7….. Summary of optimization……………………………………………..…..33

viii
LIST OF FIGURES
FIGURE 1…..Product return path diagram……………………………………………….4
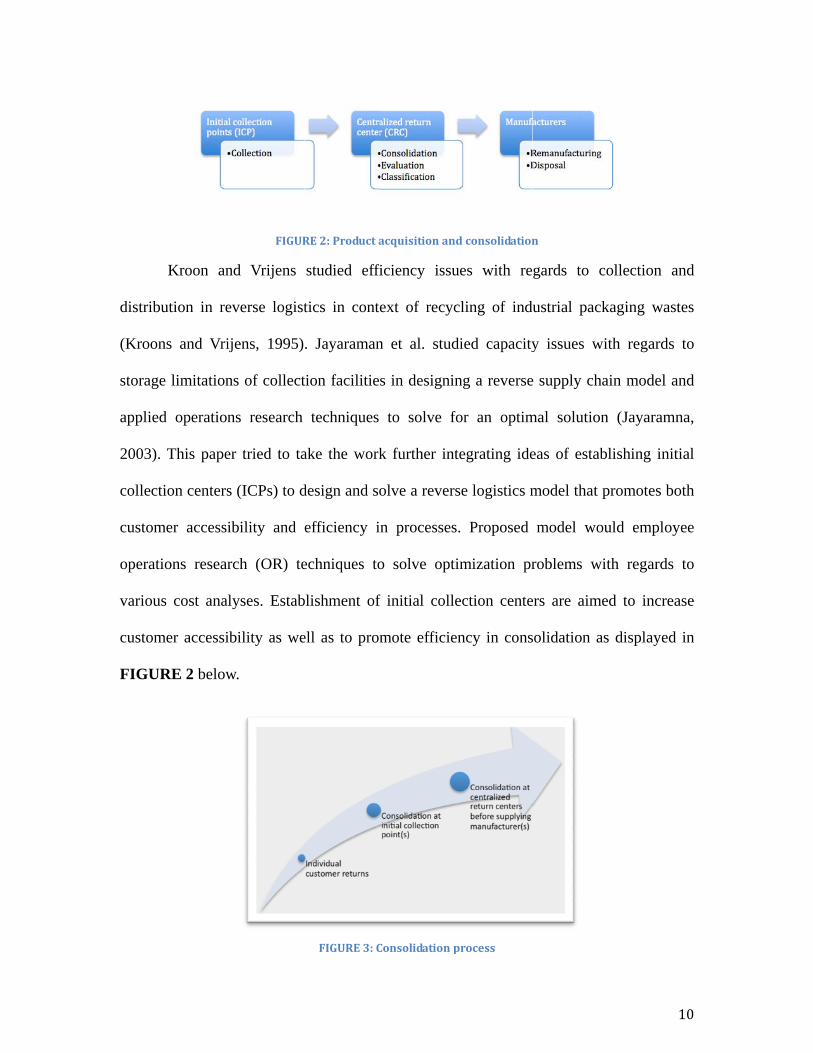
FIGURE 2…..Product acquisition and consolidation………………………………..…..10
FIGURE 3…..Consolidation process…………………………………………………….10
FIGURE 4…..Simplified cost analysis…………………………………………………..16
FIGURE 5…..Geographical plotting for all facilities……………………………………21
FIGURE 6…..Cost grid per return channel……………………………………………...22
FIGURE 7…..Total cost and location matrix……………………………………………23
FIGURE 8…..An example of branching………………………………………………...23
FIGURE 9…..Cost driver of product take-back…………………………………………25
FIGURE 10…..Take-back rate researched by Greenpeace……………………………...26
FIGURE 11…..Apple Inc.’s return method 1……………………………………………27
FIGURE 12…..Apple Inc.’s return method 2……………………………………………27
FIGURE 13…..Proposed mapping………………………………………………………29
FIGURE 14…..Location mapping with Cartesian coordinate system…………………...30
FIGURE 15…..Cost grid per return channel…………………………………………….32
FIGURE 16…..Cost per unit return……………………………………………………...33
FIGURE 17…..Mapping of potential ICPs by the return volume (Case 1, Case 2,
Case 3 from the left)…………………………………………………………..................34

1
CHAPTER 1
INTRODUCTION
Sustainability initiatives brought increasingly growing number of countries across
EU and Eastern Asia to enact legislations that would demand manufacturers to assume
higher responsibilities on their end-of-life products (Toffel, 2003). In many Western
European countries, “Green” parties have been initiated to deliver environmental
concerns due to industrial and operational wastes into public, social and political action.
Accordingly, nearly half of 50 U.S. state legislatures introduced similar rules. In response
to globally growing concerns for sustainability, many durable product manufacturers
began to launch programs that would both reduce operational wastes and advocate
environmental safety. The intent of the ‘product take-back’ laws is to pressurize durable
product manufacturers to pursue sustainable development and to transform it into
business practices that would promote environmental welfare, while avoiding
increasingly growing waste management cost charged by municipal governments. In
addition, higher customer expectations on manufacturers’ environmental responsibility
have also compelled manufacturers to assume increased responsibility with regards to
placing their products on the market.
‘Product take-back’ targets a wide variety of manufacturers of batteries,
automobiles, waste packaging, and electrical or electronic products. Instead of filling
landfills, more manufacturers are urged to take back their products for reassembling,
repackaging, remanufacturing, or component recycling before redistributing to the
market. Value recovery process of returned products consists of several sequential
activities: collection, evaluation, disassembly, capture of recyclable components, and
2
disposal of residuals as hazardous wastes (White et al., 2001). Despite growing
participation within industries, most value recovery processes still remain small,
independent and highly fragmented (Thierry et al., 1995).
To strategize cost efficient product take-back plan, there has been growing interest
in the development of reverse logistics that drives reverse flow of returned products from
the end customers back to the original equipment manufacturers. Efficient planning and
execution of reverse logistics would provide firms a competitive edge in the development
of sustainable, yet profit-generating, business strategies. Sound strategy and execution of
reverse logistics would promote not only economic, but also environmental benefits as
value of returned products should be counted towards savings of raw material and labor.
While reverse logistics do not promise guaranteed savings, many have reported
noticeable benefits: 40% less overall cost, 33% less inventory usage, and 44% higher
customer satisfaction (Poirier, 2004). From environmental viewpoint, reverse logistics
make significant contribution towards reduction of hazardous waste (Ginter and Starling,
1978), alleviation of landfill saturation (Kroon and Vrijens, 1995) and preservation of
scarce raw materials (Ginter and Starling, 1978).
Reverse logistics take fundamentally different approach from forward logistics
having characteristics of highly fragmented return quantities, multiple return channels,
complex transportation routing, higher level of expected serviceability for multiple
clients and variety of disposition options. Due to such characteristics, realization or
execution of reverse logistics often entail many new challenges. Two major challenges of
reverse logistics would include cost of value recovery process and low return rates from
customers. Recent research reported the cost of reverse logistics accounts for nearly 44%

3
of entire product take-back process (White et al., 2001). Additionally, Greenpeace’s
survey in 2007 revealed that many manufacturers struggle to achieve beyond 20 percent
of product return rate. Challenges in product take-back processes entail careful evaluation
of aforementioned two key issues of reverse logistics in order to minimize the variable
cost, while promoting higher customer product return frequency.
The thesis begins with defining the objective of the study, discusses challenges
and limitations in current practices of reverse logistics and proposes a methodology of
establishing initial collection points as part of reverse supply chain in order to minimize
the variable cost of logistics activities and to increase the product return rate by providing
convenient return locations to customers. The paper presents a mathematical framework
to optimize the variable cost associated with reverse logistics and utilizes a single-
objective, mixed-integer, binary programming for optimization with respect to multiple
constraints.

woul
provi
while
the s
prom
return
1)
2)
3)
4)
5)
The objec
d determine
ide reduction
e increasing
study would
mote more co
n path to be
The follow
) Develop
cost optim
1. m
2. m
3. en
) Verify the
) Conduct a
) Report re
) Recomme
ctive of this
e optimum n
n in transship
customer a
d benefit org
ost efficient
modeled.
F
wing specifi
a program
mization, wh
inimizes inv
aximizes cap
ncourages hig
e program
a case study
sults
end addition
CH
OB
s paper is to
number and
pment and h
accessibility
ganizations
product tak
FIGURE 1: Prod
ies the objec
– single-obj
hich;
ventory, facil
pacity utiliza
gher individ
nal research
HAPTER 2
BJECTIVE
o propose a
location of
handling cos
via conveni
to reduce c
ke-back stra
duct return pat
tives in deta
jective, mix
lity, handling
ation of initi
dual returns v
a decision-m
f initial coll
t through co
ient drop lo
cost of reve
ategy. FIGU
th diagram
ail:
xed-integer,
g and transsh
ial collection
via extended
making meth
ection point
onsolidated t
ocations. The
erse logistics
URE 1 illust
binary prog
hipping cost
n sites
d accessibilit
hodology tha
ts that woul
transshipping
e outcome o
s in order t
trates produc
gramming fo
t associated
ty
4
at
ld
g,
of
to
ct
or

5
CHAPTER 3
LITERATURE REVIEW
1. Sustainability
Sustainability is becoming one of the most desired and highly prized goals of
modern industrial operations and environmental management as the deterioration of
natural environment becomes increasingly more concerned. International Union for the
Conservation of Nature and Natural Resources, the Global Tomorrow Coalition, and the
World Resources Institute establish sustainability as a desired goal of environmental
management, development and international cooperation. The term, “sustainability,” is
used in numerous disciplines and is defined in many ways according to the context to
which it is applied and whether its use is based on an ecological, social, or economical
perspective. IUCN defines sustainability as improving the quality of human life while
living within the carrying capacity of supporting eco-systems. Although
conceptualization of sustainability may differ among different interest groups, the World
Commission on Environment and Development defines sustainable development, as
‘development that meets the needs of the present without compromising the ability of the
future generations to meet their own needs’ (Brundtland, 1987). Welford asserts that
sustainable development should not only require significant reduction of environmental
burdens, but also demand much more systematic thinking and interdisciplinary
approaches (Welford, 1998).
The first collective effort towards industry response to sustainability issues was
made in 1995 by the formation of the World Business Council for Sustainable

6
Development (WBCSD). The effort of WBCSD has brought more than 160 companies
around the world to provide business leadership towards sustainability (Bidwell and
Verfaillie, 2000). The Natural Step, a Swedish environmental education organization, has
been promoting organizational transformation towards sustainable development
(Bradbury and Clair, 1999). To assist corporations in implementing sustainability
initiatives, the SIGMA project has developed a set of tool kits that cover broad range
from benchmarking to building a business case, creating a management framework as
well as consideration of issues such as stakeholder engagement, sustainability measuring
and reporting guidelines. UNESCO’s Man and the Biosphere program focuses on the
integrated approaches to global natural resources management, particularly in and around
designated reserves. Moreover, the Global Environmental Monitoring System of the
United Nations Environment Programme (UNEP) has designed multinational and multi-
disciplinary research and monitoring programs. The World Commission on Environment
and Development of the UN has also designed a set of programs that emphasize on global
environmental policy making: the Population, Resources, and Environmental Program of
the American Association for the Advancement of Science (AAAS), the Program on
Analyzing Bio-spheric change of the International Federation of Institutes for Advanced
Study (IFIAS), and the program on Ecologically Sustainable Development of the
Biosphere of the International Institute for Applied Systems Analysis (IIASA).
2. Industrial response
In many ways, industries have been focusing on maximizing financial or
productive capital gain while consuming natural and social capital as needed. Global
environmental awareness, however, have brought environment friendly or green

7
initiatives in every aspect of product operations. Xerox’s accomplishment of ‘zero-waste-
to-landfill’ engineering can be a very good example of ‘cleaner production’ (Senge and
Carstedt, 2001). Increasingly many industries have adopted concepts of cleaner
production and developed many strategic approaches and practices that increase re-
manufacturability or recyclability of products or eliminate harmful wastes. Waste Electric
and Electronic Equipment (WEEE) directive of the European Union, for instance, obliges
manufacturers of electric and electronic equipment to assume extended responsibility by
taking back equipments reached end-of-life state for re-processing and recovery.
Radical transformation did more than mere improvement of corporate images.
The financial impact has been remarkable. 3M’s 3P (also known as Pollution Prevention
Pays) project has saved the company more than $1 billion in its first year by aggressively
limiting harmful byproducts and wastes (Esty and Winston, 2008). Kathy Reed of 3M
noted “Anything not in a product in a product is considered a cost (Esty and Winston,
2008).” Timberland’s redesigned shoeboxes saved nearly 15% of virgin packaging
material (Esty and Winston, 2008). AMD’s modified ‘wet processing’ technology reduced
the water usage from eighteen to less than now six gallons per minute.
Besides many notable individual achievements, the sustainability issues must be
dealt at supply chain managements’ level as today’s industries become more and more
interdependent on one another in every aspect of product and service delivery. Efforts of
environmental management and operations should no longer be limited to issues of
localized product operations. Rather, it needs to be assessed in a higher level of
operations, which encompass production, transportation, consumption and post-disposal
disposition.

8
Given such a significant and increasing level of attention toward issues related
sustainable development, or sustainability, it is imperative to define sustainability on
supply chain managements’ level to discuss environmental as well as economic benefits
as a whole. This article discusses benefits of reverse logistics, namely RL, in terms of
promoting sustainability and provides mathematical model to provide economic
justification.
3. Reverse Logistics
One of the collective solutions that industries have come up with is the
development of the reverse logistics that focus on the value recovery of returned products
for recycling or remanufacturing. Reverse logistics refers to the logistic management
skills and activities involved in reducing, managing and disposing packages or products
(Kroon et al., 1995). Srivastava defines reverse logistics as “Integrating environmental
thinking into supply chain management including product design, material sourcing and
selection, manufacturing processes, delivery of the final product to the consumers as well
as end-of-life management of the product after its useful life”. A growing responsibility
towards the environment and governmental regulations, and increasing awareness of
valuable commercial opportunities in collecting, recycling, and reusing products and
materials stimulate the development. One of the obvious challenges of reverse logistics is
reverse distribution of goods and information; which fundamentally differs from that of
forward logistics in terms of direction of material and information flow and their
respective volume. Due to its difficulties in handling, reverse logistics cost exceeds $35
billion dollars per year for US companies. For above reasons, many companies treat
reverse-logistics as a non-revenue-generating process which would often result in a very
9
few resources allocated to this part of the supply chain. However, more and more firms
now realize that reverse logistics is a business process by itself with growing attention
towards sustainability and environmental responsibility. Hawken et al. envision economic
benefits of as much as 90% through reduction of energy and materials consumption
(Hawken et al., 1999).
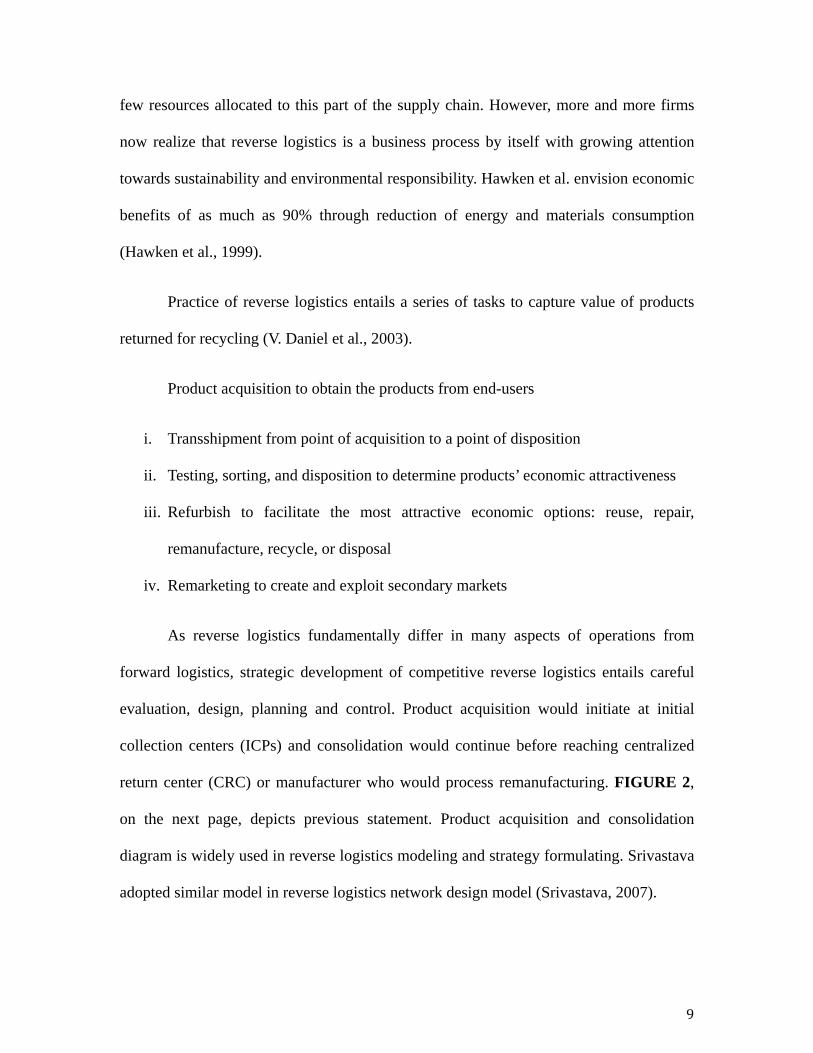
Practice of reverse logistics entails a series of tasks to capture value of products
returned for recycling (V. Daniel et al., 2003).
Product acquisition to obtain the products from end-users
i. Transshipment from point of acquisition to a point of disposition
ii. Testing, sorting, and disposition to determine products’ economic attractiveness
iii. Refurbish to facilitate the most attractive economic options: reuse, repair,
remanufacture, recycle, or disposal
iv. Remarketing to create and exploit secondary markets
As reverse logistics fundamentally differ in many aspects of operations from
forward logistics, strategic development of competitive reverse logistics entails careful
evaluation, design, planning and control. Product acquisition would initiate at initial
collection centers (ICPs) and consolidation would continue before reaching centralized
return center (CRC) or manufacturer who would process remanufacturing. FIGURE 2,
on the next page, depicts previous statement. Product acquisition and consolidation
diagram is widely used in reverse logistics modeling and strategy formulating. Srivastava
adopted similar model in reverse logistics network design model (Srivastava, 2007).
distri
(Kroo
storag
appli
2003)
collec
custo
opera
vario
custo
FIGU
Kroon an
ibution in re
ons and Vri
ge limitation
ed operation
). This pape
ction centers
omer accessi
ations resear
us cost anal
omer accessi
URE 2 below
FIGUR
nd Vrijens
everse logist
ijens, 1995)
ns of collect
ns research
er tried to ta
s (ICPs) to d
ibility and
rch (OR) te
lyses. Estab
ibility as we
w.
RE 2: Product a
studied effi
tics in conte
. Jayaraman
tion facilitie
techniques
ake the work
design and so
efficiency in
echniques to
blishment of
ell as to prom
FIGURE 3: C
acquisition and
ficiency issu
ext of recyc
n et al. stud
s in designin
to solve fo
k further int
olve a revers
n processes
o solve opti
f initial colle
mote efficie
Consolidation p
d consolidation
ues with re
cling of ind
died capacity
ng a reverse
for an optim
tegrating ide
se logistics m
s. Proposed
imization pr
ection cente
ency in cons
process
n
gards to co
dustrial pack
y issues wit
e supply cha
mal solution
eas of establ
model that p
model wou
roblems wit
ers are aime
solidation as
1
ollection an
kaging waste
th regards t
ain model an
n (Jayaramna
lishing initia
promotes bot
uld employe
th regards t
d to increas
s displayed i
10
nd
es
to
nd
a,
al
th
ee
to
se
in

11
4. Strategic modeling
Development of strategic modeling entails a number of critical dimensions
including: product acquisition, returns volume, return timing and quality, test, sort and
grade, reconditioning, and distribution and selling (Guide Jr. et al., 2000). Due to
challenges of identifying and defining these critical dimensions, many aspects of reverse
logistics remain with limited knowledge and theory base. For such, many developed
strategic models heavily rely on hypothetical scenario or specific product type (Guide Jr.
et al., 2002). Gudie Jr. et al. took a contingency approach to explore those critical factors
for closed-loop supply chains that enable product value recovery (Guide Jr. et al., 2002).
Van der Laan (1997) studied independent demand inventory models as they relate to
periodic and continuous models (Van der Laan, 1997). Krikke et al. proposed alternative
reverse logistics network models specifically for photocopiers in Western Europe (Krikke
et al., 1999). Toktay et al. modeled predicting return flows for instant cameras (Toktay et
al., 2000). Stuart et al. developed a new mathematical framework to estimate produt take-
back levels by defining various levels of product life and by incorporating those terms
into a life estimation framework (Stuart et al., 1998).
Various optimization methodologies and computational techniques have been
studied to provide an optimum solution to complex network problems with
aforementioned critical dimensions. Srivastava developed an integrated holistic
conceptual framework that combines descriptive modeling with optimization techniques
at the methodological level (Srivastava, 2008). Srivastava formulated a multi-product,
multi-echelon, profit maximizing reverse logistics and value recovery model covering
from collection to first stage of remanufacturing. Min et al. proposed a nonlinear mixed

12
programming model and a genetic algorithm that solve the reverse logistics problem to
determine the number and location of centralized return centers (i.e., reverse
consolidation points) (Min et al., 2006).
The thesis proposes a single-objective, mixed-integer programming that would
optimize the reverse logistics network in order to determine appropriate number and
location of initial collection centers, while Min et al. focused on the determination of
centralized return centers in reverse logistics network. Such intended to include
consideration of low customer return rate across United States and limited degree of
current remanufacturing capabilities across many facilities. In determination of variable
cost analysis, quantitative modeling of forward logistics were utilized and manipulated
with regards to those in reverse logistics practices. Various constraints were introduced to
the model to restrict critical parameters including budget and target number of returns; by
which few literatures attempted to restrict or constrained their study results. Single-
objective, mixed-integer programming was coded and executed via MatLab to generate
optimum cost, target number of return, location matrix and multi-echelon cost grid. The
thesis focused on the determination of initial collection points for pre-established
centralized return centers as the thesis aims to take more pragmatic approach in
consideration of return volume, remanufacturing capacity, and current customer return
behavior. As opposed to Srivastava’s multi-brand model, the thesis proposes single-brand
model to mimic realistic logistics practices currently utilized in U.S. firms. Many U.S.
firms including Nike, Cisco and Apple adopt single-brand reverse logistics model.

13
CHAPTER 4
MATHEMATICAL MODEL
To simplify the multi-echelon reverse logistics network, the model considers
following assumptions:
1) Despite proximity to centralized return centers, customers are only to return
products at the initial collection points in order to avoid individual shipping
2) Transportation cost of customers to the initial collection centers is neglected as
the model assumes initial collection points are conveniently located
3) Capacity requirements at the initial collection points are not considered assuming
that sufficient space for small volume of returned products and frequent
transshipment to the centralized return center
4) Returned products at one initial collection point are shipped to only one
centralized return center given minimum distance between the two locations
5) All facilities and logistics activities assume 365 days of operation within a
calendar year, which would allow drop-box applications
6) Returned products from all facilities are to be supplied to one manufacturer
7) Transshipping cost from centralized return center to manufacturer is neglected as
the cost is unavoidable as long as the centralized return center is in service
The following lists indices, parameters and variables used in model formulation.
Indices, parameters and variables were borrowed from Chung’s semi-closed supply chain
model (Chung et al., 2008), Min et al.’s network optimization model (Min et al., 2006),
14
and Chopra’s forward logistics model and manipulated to fit the purpose and scope of the
thesis.
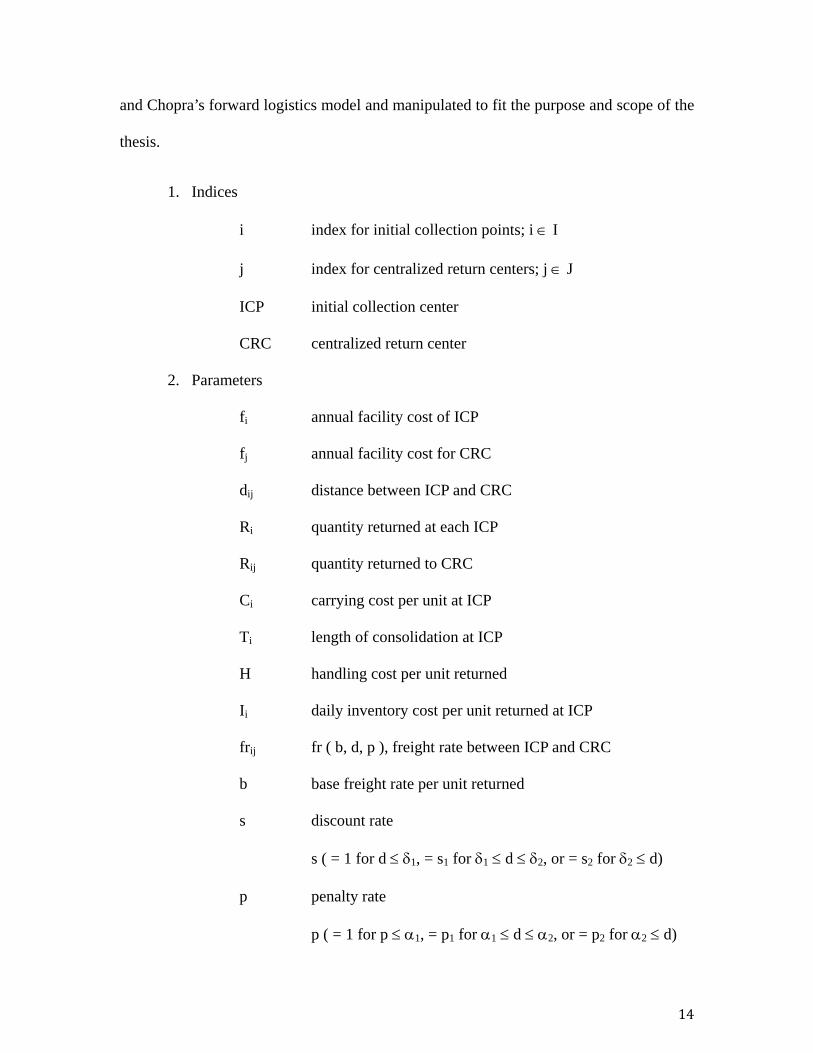
1. Indices
i index for initial collection points; i ∈ I
j index for centralized return centers; j ∈ J
ICP initial collection center
CRC centralized return center
2. Parameters
fi annual facility cost of ICP
fj annual facility cost for CRC
dij distance between ICP and CRC
Ri quantity returned at each ICP
Rij quantity returned to CRC
Ci carrying cost per unit at ICP
Ti length of consolidation at ICP
H handling cost per unit returned
Ii daily inventory cost per unit returned at ICP
frij fr ( b, d, p ), freight rate between ICP and CRC
b base freight rate per unit returned
s discount rate
s ( = 1 for d ≤ δ1, = s1 for δ1 ≤ d ≤ δ2, or = s2 for δ2 ≤ d)
p penalty rate
p ( = 1 for p ≤ α1, = p1 for α1 ≤ d ≤ α2, or = p2 for α2 ≤ d)
15
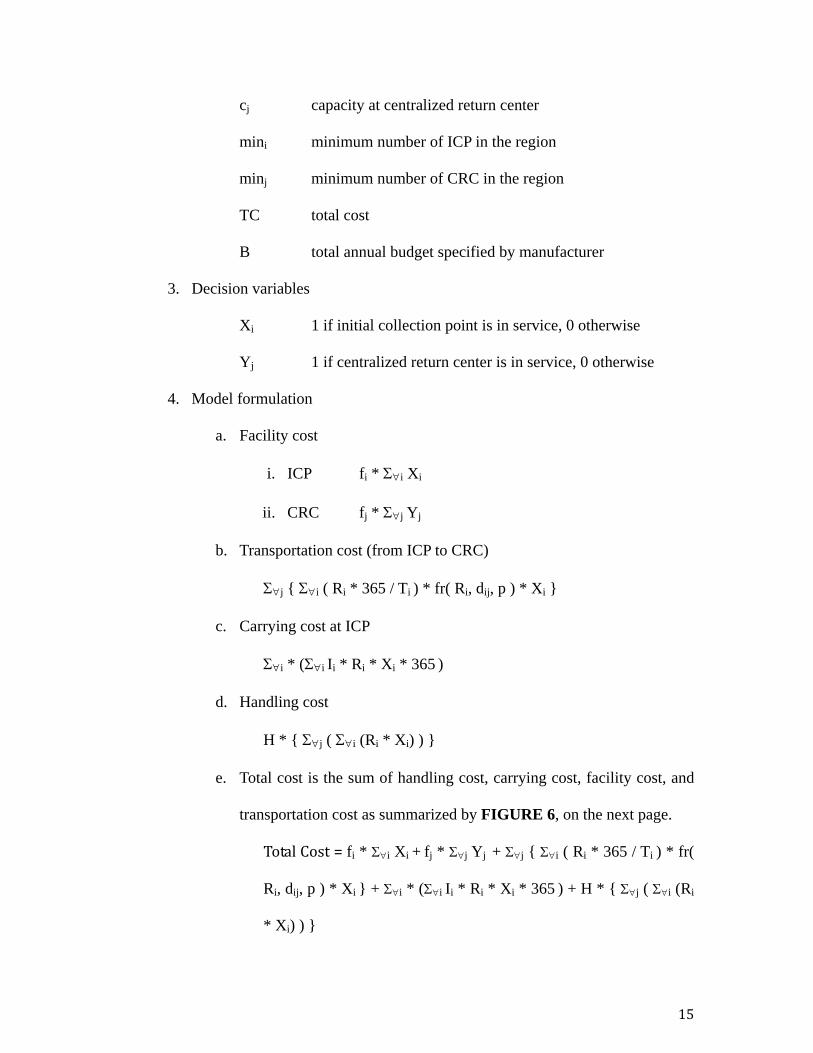
cj capacity at centralized return center
mini minimum number of ICP in the region
minj minimum number of CRC in the region
TC total cost
B total annual budget specified by manufacturer
3. Decision variables
Xi 1 if initial collection point is in service, 0 otherwise
Yj 1 if centralized return center is in service, 0 otherwise
4. Model formulation
a. Facility cost
i. ICP fi * Σ∀i Xi
ii. CRC fj * Σ∀j Yj
b. Transportation cost (from ICP to CRC)
Σ∀j { Σ∀i ( Ri * 365 / Ti ) * fr( Ri, dij, p ) * Xi }
c. Carrying cost at ICP
Σ∀i * (Σ∀i Ii * Ri * Xi * 365 )
d. Handling cost
H * { Σ∀j ( Σ∀i (Ri * Xi) ) }
e. Total cost is the sum of handling cost, carrying cost, facility cost, and
transportation cost as summarized by FIGURE 6, on the next page.
Total Cost = fi * Σ∀i Xi + fj * Σ∀j Yj + Σ∀j { Σ∀i ( Ri * 365 / Ti ) * fr(
Ri, dij, p ) * Xi } + Σ∀i * (Σ∀i Ii * Ri * Xi * 365 ) + H * { Σ∀j ( Σ∀i (Ri
* Xi) ) }

withi
minim
and C
factor
were
return
capac
math
limits
maxim
numb
carry
return
produ
A set of
in specific
mum numbe
CRCs were
rs that prize
included in
n volume of
city issues o
ematical mo
s. Capacity o
mize capaci
ber of each I
y out product
n quantity co
uct acquisitio
FIGURE
constraints w
boundaries.
er of facilitie
not constrai
ed shorter di
n the model t
f reverse logi
on truck wer
odel to impo
of each ICP
ity utilizatio
ICP and CRC
t acquisition
onstraints th
on. The follo
E 4: Simplified c
was devised
. The spec
es, and capac
ined; howev
stances. Bud
to provide u
istics is assu
re not consid
ose penaltie
or CRC loca
on and to m
C location w
n and other r
hat would se
owing explai
cost analysis
d to optimiz
cified const
city of facili
ver they wer
dget constrai
useful insigh
umed small c
dered. Howe
es on trucks
ation was co
minimize de
was set to m
remanufactur
et specific ta
ins each con
ze the propo
traints enco
ties. Distanc
re utilized in
ints, which f
hts on decisi
compared to
ever, freight
with volum
onstrained by
lays in logi
maintain mini
ring activitie
arget value to
nstraint in fur
osed mathem
ompass bud
ces between
n calculation
few literatur
on-making p
that of forw
rate was in
mes larger th
y specific vo
istics proces
imum facilit
es. Case stud
o ensure min
rther detail.
1
matical mode
dget, routing
each of ICP
n of discoun
res discussed
processes. A
ward logistic
ncluded in th
han specifie
olume both t
ss. Minimum
ties needed t
dy introduce
nimum retur
16
el
g,
Ps
nt
d,
As
s,
he
ed
to
m
to
es
rn

17
1. TC ≤ B
Total cost of reverse logistics must be less than specified budget constraint
2. For ∀i ∈ I and ∀j ∈ J, ∑ Yij = 1
This ensures that each ICP is assigned to only one CRC
3. For ∀i ∈ I and ∀j ∈ J, ∑ Ri * Xij * Ti = ∑ Xjk
This confirms that the quantity of initial product return from customer to ICP
equals that of outgoing flow from ICP to CRC
4. mini ≤ ∑ Xi
This maintains minimum number of ICP in the region
5. minj ≤ ∑ Yj
This maintains minimum number of CRC in the region
6. For ∀i ∈ I and ∀j ∈ J, ∑Rij ≤ cj * Yj
This ensures incoming return flow from ICP does not exceed capacity of each
CRC
For the purpose of model verification, hypothetical scenario was developed to test
the conceptual validity as well as mathematical functionality. The primary objective of
such modeling was to verify if the proposed model would efficiently identify the number
and location of the ICPs and corresponding return channel that would minimize the total
cost of reverse logistics. Optimum number and location of ICPs would be determined
with respect to multiple constraints as specified above. Outcome of the optimization
woul
to tra
5 pre
locati
appli
buyin
to ea
custo
as the
in op
relati
poten
impro
purpo
d assure a m
ansship retur
e-established
ions were se
cation, all lo
ng pattern in
ase the calcu
omers’ reside
ey reflect the
ptimization
ively lower,
TABLE 2
ntial ICPs.
ove estimati
ose of mod
manufacturer
rned product
d CRC loca
elected rand
ocations shou
n terms of sa
ulation of d
ential locatio
e center of p
modeling w
like many ar
TABLE 1: Po
2 then summ
Stuart et al
ion of electr
del verificati
r where to es
ts to CRCs. T
ations in acc
dom for the
uld consider
ales history p
distance betw
ons were not
population de
would less
reas across t
otential ICP loc
marizes antic
l.’s study de
ronic produc
ion, product
stablish ICP
TABLE 1 li
cords with C
purpose of
r relative pop
per area. Car
ween each f
t considered;
ensity. More
benefit are
he United St
ations for esta
cipated daily
eveloped an
ct take-back
t return qua
s and which
ists all 20 po
Cartesian co
model verif
pulation den
rtesian coord
facility. Unli
; however, IC
eover, inclus
eas where p
tates.
ablished CRC lo
y return volu
n estimation
k levels (Stu
antities from
h routing eac
otential ICP
oordinate sy
fication. In
sity as well
dinate system
ike Mine et
CP locations
ion of custom
population
ocations
ume from ea
n framework
uart et al., 19
m all 20 lo
1
ch would tak
locations an
ystem. All 2
any practica
as customer
m was chose
t al.’s mode
s were chose
mer location
densities ar
ach of the 2
k that woul
998). For th
ocations wer
18
ke
nd
25
al
s’
en
el,
en
ns
re
20
ld
he
re

rando
custo
turn o
all 20
produ
speci
transs
descr
p1, an
distan
existi
logist
Sriva
omized. In c
omers’ buyin
over rate. A
0 potential lo
ucts as opti
ified constrai
TABLE
shipment, f
ription, a sym
nd p2 were
nce discount
ing literature
tics firms an
astava sugge
onstruction
ng patterns in
s TABLE 2
ocations. Ho
imization w
ints.
TABLE 2: Da
3 lists pa
facility, and
mbol used in
used as uni
t, allowed u
es (Min et
nd manipulat
sted informa
of practical
n terms of a
2 indicates, t
owever, esta
would gener
aily return volu
arameters t
carrying c
n the model,
it-less perce
unit penalty,
al., 2006 an
ted to arrive
al interviews
application,
annual or qu
total daily re
ablished CRC
ate only se
ume at each po
that were
cost. Each
an assigned
ntage value
base freight
nd Srivastav
at some goo
s with variou
daily return
uarterly sales
eturn by cus
Cs are not to
elected ICP
otential ICP loc
used in c
parameter i
d value, and a
s in the mo
t rate, and e
va, 2008), co
od approxim
us stakehold
n volume sho
s data along
tomers reach
o handle all
locations t
cations
alculation
is entitled
an appropria
odel. Parame
etc, were ref
ompared to
mation for av
ders as secon
1
ould conside
with produc
hes 623 from
623 returne
that meet a
of handling
with a brie
ate unit. s1, s
eters, such a
ferenced from
various U.S
verage value
ndary source
19
er
ct
m
ed
all
g,
ef
s2,
as
m
S.
s.
es

to de
the t
Vario
and n
the m
decim
coord
Eucli
mode
highe
mode
cide on man
thesis, exhau
ous per unit
number of pr
model would
In order
mal values w
dinate of ea
idean distan
el more appl
er precision
eling, such a
ny parameter
ustive resea
costs were
roducts hand
function wi
TABLE 3
to increase
were assigne
ch locations
nce formula
licable to la
in terms o
as within a ci
rs (Srivastav
arch via inte
approximate
dled per serv
thin specifie
: Parameters u
the precisi
ed to repres
s, distance b
to promote
arge-scale mo
of calculatin
ity or a villag
va, 2008); ho
erviews wit
ed with rega
vice. Target b
ed budget co
used for mathe
ion of appo
sent each of
between eac
mathematic
odeling, suc
ng distances
ge. FIGUR
owever, for
th stakehold
ards to avera
budget of $5
onstraint.
ematical mode
ointing poten
f x and y c
ch ICP and
cal simplicit
ch as within
s would be
RE 5 displays
the scope an
ders was no
age total cos
50,000 was s
eling
ntial locatio
oordinate. W
CRC was c
ty. This wou
a county or
desired fo
s geographic
2
nd purpose o
ot conducted
st per servic
set to verify
ons for ICP
With x and
calculated vi
uld make th
r a region, a
r small-scal
cal plotting o
20
of
d.
ce
if
s,
y
ia
he
as
le
of

all fa
ease
blue s
all po
differ
coord
axis f
differ
volum
acilities inclu
location-ma
star indicate
Cost grid
ossible, 20 x
rent amount
dinate system
for associate
rence in dis
me that is lis
uded by TA
apping proce
es proposed p
FIGURE
d was then cr
x 5, return ch
t of cost is
m was also
ed cost of re
stance betwe
sted in TABL
ABLE 1. Aga
esses. Red s
potential loc
E 5: Geographic
reated to illu
hannels as F
s associated
used to repr
everse logist
een each IC
LE 2.
ain, Cartesia
star indicate
cations for IC
cal plotting for
ustrate cost
FIGURE 6 s
with each
resent: x-axi
tics. The dif
CP and CRC
an coordinat
es establishe
CPs.
all facilities
of reverse l
shows below
potential re
is for ICPs,
fference in c
C and the d
te system w
ed CRC loc
logistic activ
w. As the figu
eturn chann
y-axis for C
cost is large
difference in
2
was utilized t
cations, whil
vities throug
ure describe
nel. Cartesia
CRCs, and z
ely due to th
n daily retur
21
to
le
gh
s,
an
z-
he
rn

binar
algor
the p
integ
FIGU
ICP l
verifi
Optimizat
ry programm
rithm. More
proposed ma
er requirem
URE 7 brief
location and
ies that no be
FI
tion of the
ming that u
specifically
athematical m
ent on the v
fly demonstr
d then updat
etter feasible
IGURE 6: Cost g
proposed m
uses a linea
y, the algorit
model by so
variable was
rates the pro
tes the best
e solution is
grid per return
model utilize
ar programm
hm searched
olving specif
s represented
ocess, the al
ICP found
possible by
n channel
ed a single-o
ming (LP) b
d for optima
fied constrai
d by the po
lgorithm firs
as the sear
solving rem
objective, m
based, branc
al total cost
ints, in whic
otential ICP
st searches f
rch tree grow
maining cons
2
mixed-intege
ch-and-boun
in regards t
ch the binar
locations. A
for a feasibl
ws. Lastly,
traints.
22
er,
nd
to
ry
As
le
it
integ
locati
chann
earlie
which
repre
Again
0 bein
FIGURE
er, binary p
ion matrix
nel it should
er in respect
h return cha
esent 20 diffe
n, binary var
ng closed an
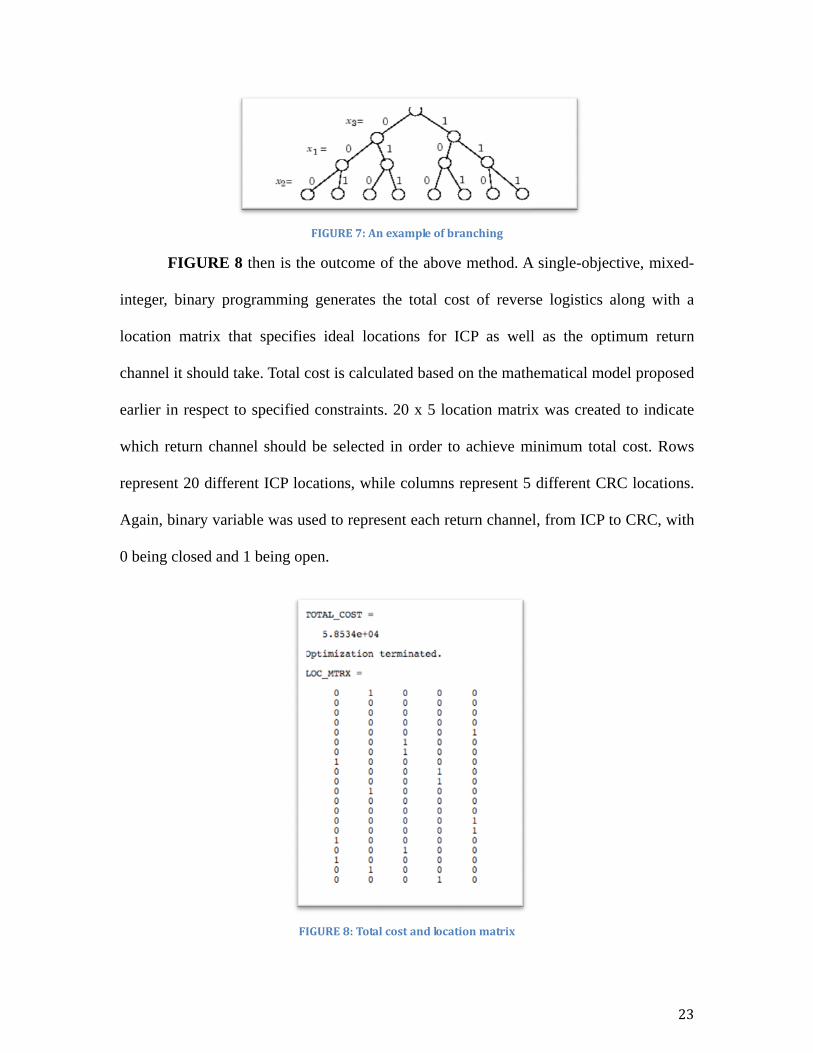
E 8 then is th
programming
that specifie
d take. Total
t to specified
annel should
ferent ICP lo
riable was u
nd 1 being op
F
FIGURE 7: An
he outcome
g generates
es ideal loc
cost is calcu
d constraints
d be selected
ocations, whi
used to repre
pen.
FIGURE 8: Total
n example of br
of the above
the total co
cations for I
ulated based
s. 20 x 5 loc
d in order to
ile columns
sent each re
l cost and locat
ranching
e method. A
ost of revers
ICP as well
on the math
cation matrix
o achieve m
represent 5
turn channe
tion matrix
A single-obje
se logistics
l as the opt
hematical mo
x was create
minimum tota
different CR
l, from ICP
2
ective, mixed
along with
timum retur
odel propose
ed to indicat
al cost. Row
RC location
to CRC, wit
23
d-
a
rn
ed
te
ws
s.
th

15 di
at IC
assoc
incre
effici
logist
in reg
Appl
TABLE 4
fferent ICPs
CP 8, 16, and
ciated with r
ase accessib
As so fa
iently develo
tics. The res
gards to bud
ication of th
4 summarize
s by 5 differe
d 18 must be
reverse logis
bility to custo
TABLE 4: L
ar discussed
oped a locat
sults met mi
dget, routing
his hypotheti
es the locati
ent return ch
e transshipp
stic activitie
omers, while
Locations for I
d, a single-
tion matrix
inimum requ
g, minimum
cal modeling
ion matrix sh
hannels. For
ped to CRC
es. Listed IC
e consolidati
CPs with speci
-objective, m
of ICPs and
uirement spe
m number of
g will be fur
hown by FI
examples, re
1 in order to
CPs are to b
ing individua
ified return ch
mixed-intege
d optimized
ecified by th
f facilities, a
rther discuss
IGURE 8. T
eturned prod
o minimize
be establishe
al shipments
hannel
er, binary p
the total co
he pre-define
and capacity
ed in the nex
2
The table list
duct collecte
the total cos
ed in order t
s.
programmin
ost of revers
ed constraint
y of facilitie
xt chapter.
24
ts
ed
st
to
ng
se
ts
s.

makin
gaine
impo
strate
televi
outco
imag
to rec
some
collec
cost o
Reverse lo
ng process
ed its popul
rtant market
egies, revers
isions, perso
omes of rev
e with advan
Despite a
ceive the des
e recyclable
ction and dis
of return and
C
ogistics brid
for the con
larity as pr
ting strategy
e supply cha
onal comput
erse logistic
nced sustain
agreed benef
sired attentio
materials su
stribution. R
d ultimately
FIG
CH
CASE STUD
dge sound en
nversion of
roducing en
y. As more m
ain has come
ers, cellular
cs is increas
able develop
fits, the prac
on and are ge
uch as plast
Regardless of
pass on to co
GURE 9: Cost d
HAPTER 5
DY ON APP
nvironmental
waste into
nvironmental
manufacturer
e to encomp
handsets, an
sed custome
pment strateg
tice and man
enerally carr
tics and met
f sources of
onsumers.
driver of produ
PLE INC.
l manageme
usable reso
l friendly p
rs began to e
pass a wide r
nd so on. O
er retention
gies.
nagement of
ried out by th
tals due to h
cost, many
uct takeback
nt tasks with
ources. Reve
products has
explore produ
range of pro
ne of the m
through imp
f reverse log
he unorganiz
high cost ass
manufacture
2
h the decisio
erse logistic
s become a
uct take-bac
ducts such a
ost importan
proved bran
gistics are ye
zed sector fo
sociated wit
ers absorb th
25
on
cs
an
ck
as
nt
nd
et
or
th
he

FIGU
back
logist
summ
produ
many
legisl
on th
adver
statis
from
Unite
televi
URE 9, on t
procedure
tics compris
Another
marizes an
uct take-back
y manufactu
lations that r
he industry
rtisement, in
tics provide
European c
ed States. S
isions) in Jap
the previous
within elec
es nearly 45
fundamenta
investigation
k rate among
urers reporte
requires prod
y or type o
nconvenient
ed by the G
countries or
Sony, for in
pan.
FIGURE
s page, brea
ctronics indu
5% of the tot
al challenge
n conducted
g electronics
ed 10% or l
duct take-ba
of products
method, and
Greenpeace i
Eastern As
nstance, repo
10: Takeback
aks down th
ustry. It sho
tal cost of the
is low pro
d by Green
s manufactur
lower produ
ack in many
; however,
d sub-par se
is limited to
ia countries
orts nearly
k rate research
he cost assoc
ould be not
e process.
oduct take-b
npeace USA
rers. Accord
uct return-rat
states. Reas
include lo
erviceability.
o only Unite
s perform fa
85% of pro
hed by Greenpe
ciated with p
ted that cos
back rate. F
A in regard
ding to their i
te, despite t
sons may va
ow accessib
One must a
ed States. M
ar superior t
oduct take-b
eace
2
product take
st of revers
FIGURE 1
s to averag
investigation
the new stat
ary dependin
bility, limite
also note tha
Manufacturer
to those from
back rate (o
26
e-
se
10
ge
n,
te
ng
ed
at
rs
m
of

appli
produ
nearly
partic
Calif
custo
cente
return
Case stud
ed to an exi
uce an optim
y 45 millio
cular, the stu
fornia.
Apple In
omer drop-o
er located in
When cu
ned product
dy was con
isting revers
mized solutio
on units of
udy focused
nc.’s produc
ff at Apple
Central Cali
F
ustomers dro
s are consol
ducted to s
se logistics s
on. Mathem
iPod, accor
on Apple In
t take-back
retail store
ifornia, as sh
Figure 11: Ap
FIGURE 12: App
op off produ
lidated befor
ee if the pr
system for A
atical model
rding to Ap
nc.’s produc
k program l
s or direct
hown by FIG
pple Inc.’s retur
ple Inc.'s return
ucts for rec
re being dir
roposed mo
Apple Inc’s
l was applie
ple Inc.’s a
ct take-back
largely com
shipment to
GURE 11 an
rn method 1
n method 2
cycling at on
rectly transsh
odel could b
popular iPo
ed to Apple
annual sales
operation w
mprises of tw
o their centr
nd FIGURE
ne of their
hipped to th
2
be effectivel
od in order t
Inc. that sol
in 2007. I
within Centra
wo methods
ralized retur
E 12.
retail store
he centralize
27
ly
to
ld
In
al
s;
rn
s,
ed

28
return center. Customers, however, are only allowed drop off during open store hours. In
addition, Apple Inc. operates only three retail stores, one in each of: San Luis Obispo,
Fresno, and Modesto in Central California where nearly 10 million people reside. By
allowing drop-offs only at operating retail stores, more customers are pushed to
individually ship products directly to the centralized return facility for recycling.
Although customers are not required to pay for shipping and handling in most cases, they
have to go through a hassle of pre-ordering packaging materials, packaging, and sending
at post offices. Each direct shipment costs nearly $30 to cover packaging materials,
shipping and handling. Moreover, direct shipping raises another environmental concern
for increased spending of packaging materials.
Proposed model was applied to Apple Inc.’s reverse logistic system with the
following additional constraints.
1. TC ≤ B ( = $100,000.00)
Total cost of reverse logistics must be less than specified budget constraint
2. G ≤ Total_return
This ensures number of returned product exceeds stated goal (G = 60,000, 70,000
or 80,000 units)
FIGURE 13, on the next page, presents proposed mapping of potential initial
collection centers along with Apple Inc’s centralized return center, and currently
operating retail stores in the Central California. Downward arrow indicates where Apple
Inc. currently operates their centralized return center. This is the only centralized return
center Apple Inc. operates in the United States. Flags were drawn to indicate cities where

Appl
indic
consi
centr
the c
reman
by its
locati
Coor
from
e Inc. curr
ated exclam
ideration of
alized return
case study
nufacturing
For consi
s x and y coo
ions for one
dinates for t
Goggle map
ently has o
mation mark
regional pop
n center hand
particularly
capacity of t
stency, Cart
ordinate. TA
e established
the location
p.
operating re
ks. Total of
pulations and
dles all retur
focused on
the CRC fac
FIGURE 13
tesian coordi
ABLE 5 lists
d centralized
s were calcu
etail stores.
f twenty po
d marked wi
rn products a
n the centr
cility was no
: Proposed ma
inate system
3 of operati
d return cen
ulated with
Potential l
otential loc
ith exclamat
across all sta
ral region o
ot restricted b
apping
m was used t
ing retail sto
nter in Cart
100 mile pe
ocations for
ations were
tion marks.
ates in the U
of Californi
by constraint
o represent
ores and 17 s
esian coord
er inch scale
2
r ICPs wer
e selected i
Despite the
U.S.; howeve
ia. For such
ts.
each locatio
suggested IC
inate system
e as obtaine
29
re
in
ir
er,
h,
on
CP
m.
ed

centr
retail
arrow
FIGURE
alized return
l stores along
ws to help un
TA
E 14 then p
n center wa
g with 17 su
nderstanding
FIGURE 14: Lo
BLE 5: Locatio
presents grap
as marked w
ggested ICP
g.
ocation mappin
ns in Cartesian
phical mapp
with a red st
Ps were mark
ng with Cartes
n coordinate
ping of eac
ar as shown
ked with blu
ian coordinate
ch location.
n below. Thr
e stars and in
e system
3
Apple Inc.
ree operatin
ndicated wit
30
’s
ng
th

to Ap
twent
recyc
Appl
obtain
numb
iPods
the lo
produ
20 lo
the to
Anticipate
pple Inc’s sa
ty locations
cling of iPo
e Inc. The m
ned by Gree
bers used as
s purchased
ocations liste
Single-ob
uce an optim
ocations were
otal cost req
ed annual re
ales in 2007
s as reporte
ds, it did n
model also ta
enpeace as p
s anticipated
from online
ed in the tabl
TABLE
bjective, mix
mal solution
e first gener
quired to de
eturn volume
7 along in c
d by U.S.
not consider
argeted 10%
previously sh
d return volu
e stores or st
le.
E 6: Annual ret
xed-integer,
to Apple Inc
rated in orde
eliver return
e from each
onsideration
census bure
all other e
% of return v
hown by FIG
ume for rec
tores in othe
turn volume fro
binary pro
c.’s reverse l
er to graphic
ned goods fr
location wa
ns with dem
eau. As stud
electronic pr
olume to be
GURE 10. T
cycling in un
er region cou
om 20 location
ogramming
logistic netw
ally show th
rom each co
as generated
mographics o
dy only foc
roducts man
consistent w
TABLE 6 di
nits. One m
uld be return
ns
was used
work. Cost gr
he difference
ollection loc
3
d with regard
f each of th
cused on th
nufactured b
with statistic
isplays actua
must note tha
ned to one o
in order t
rid among a
es in terms o
cations to th
31
ds
he
he
by
cs
al
at
of
to
all
of
he

centr
show
cost o
total
the ce
produ
Three
and 8
cost
alized return
wn by FIGUR
of logistics r
cost of logis
entralized re
Optimizati
uced total c
e case were
80,000 units.
of $76,330
n center. 3D
RE 15. Y-ax
required, res
stics varied w
eturn center a
F
ion of prop
ost of logis
tested to ta
. Case 1, tar
returning 6
D bar chart w
xis and Z-ax
spectively. A
widely depe
and anticipat
IGURE 15: Cos
osed mathem
stics, numbe
arget differen
rgeted minim
67,559 units
was used to
xis represent
As it can be
ending on the
ted volume o
st grid per retu
matical mod
er of units r
nt minimum
mum return v
s. Case 2, t
graphically
potential lo
easily ident
e distance be
of returned p
urn channel
del for Appl
returned, and
m return volu
volume of 60
argeted min
y present the
cation for IC
tified from th
etween each
products per
le Inc’s rev
d cost per u
ume with 60
0,000 units,
nimum retur
3
e cost grid a
CPS and tota
he figure, th
h location an
r location.
verse logistic
unit returned
0,000, 70,00
resulted tota
rn volume o
32
as
al
he
nd
cs
d.
00
al
of
70,00
target
80,05
incre
FIGU
unit i
sum t
return
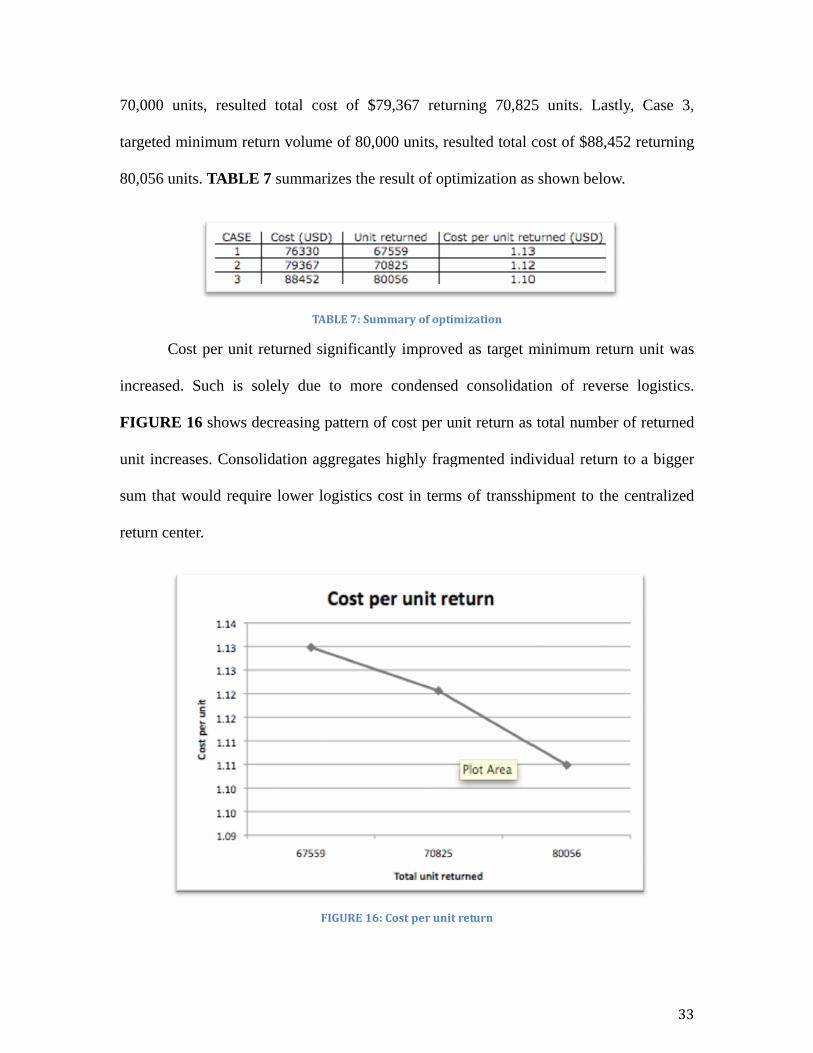
00 units, re
ted minimum
56 units. TAB
Cost per u
ased. Such
URE 16 sho
increases. C
that would r
n center.
sulted total
m return vol
BLE 7 summ
unit returned
is solely d
ows decreasin
onsolidation
require lowe
cost of $7
lume of 80,0
marizes the r
TABLE 7: Sum
d significant
due to more
ng pattern o
n aggregates
er logistics c
FIGURE 16:
79,367 retur
000 units, re
result of opt
mmary of optim
tly improved
e condensed
of cost per un
highly frag
cost in term
: Cost per unit
rning 70,825
sulted total c
imization as
mization
d as target m
d consolidat
nit return as
gmented indi
s of transshi
return
5 units. La
cost of $88,4
s shown belo
minimum ret
ion of reve
total numbe
ividual retur
ipment to th
3
stly, Case 3
452 returnin
ow.
turn unit wa
erse logistic
er of returne
rn to a bigge
he centralize
33
3,
ng
as
s.
ed
er
ed

Three
order
assign
chose
FIGURE 17:
FIGURE
e cases, prev
r to obtain d
ned with dif
en to achieve
Mapping of th
E 17 displays
viously sum
desired mini
fferent value
e desired min
he ICPs by the r
s three map
mmarized in
mum numbe
es for antici
nimum retur
return volume
s per Case
TABLE 7, r
er product r
ipated return
rn volume.
(Case1, Case 2
1, Case 2, a
required dif
returns. Sinc
n volume, di
2, Case 3 from t
and Case 3 f
fferent ICPs
ce each ICP
ifferent set o
3
the left)
from the lef
to operate i
location wa
of ICPs wer
34
ft.
in
as
re

35
CHAPTER 6
CONCLUSION AND FURTHER RESEARCH
Issues of sustainability are emerging regardless of region or nature of business
across the globe. Meanwhile, promoting sustainability would require significant efforts to
conceptualize ‘green’ processes and devise diverse approaches to their realization for
implementation. This task does not belong to a single industry or region. Rather,
companies and organizations must work together to jointly reduce environmental
burdens. Strategic plans are necessary to integrate environmental practices with daily
operations in order to maximize competitive advantages.
This paper accentuates and emphasizes the importance of optimizing reverse
logistics by establishing initial collection points (ICPs) as means of consolidation. The
major contribution of this research lies in developing a model for analyzing the reverse
logistics network and providing useful insights in optimization. Optimization technique
introduced in this paper can serve as useful decision aid tool to find an optimal solution
for reverse logistics network. The proposed model may be modified by differing
constraints, variables, parameters or routing configurations in order to design a specific
return strategy.
The model determines the optimum total cost of logistics, location of initial
collection centers, and routing to different centralized return centers. Proposed model was
developed borrowing pre-existing concepts from literature and industry practices and
applied to problems in an operations research (OR) framework. Single-objective,

36
multiple-constrained, mixed-integer, binary programming was utilized to solve the
optimization problem.
As in the existing literature, optimized consolidation significantly improved cost
efficiency of the multi-channel reverse logistic network. There was shipping distance and
return quantity dependency of various cost analysis, which was in agreement with the
basic rationale behind the approach. The number of ICPs and CRCs within reverse
logistic network also impacted cost analysis to a considerable extent. Furthermore, the
total number of each facility
The model would serve as a decision-aid tool towards reverse logistics network
design for product returns and value recovery across many industries. The paper
emphasized the close connection between reverse logistics and sustainable development
and highlighted potential business opportunities as well.
Although presently underdeveloped remanufacturing technologies along with
high capital requirement in many facility establishments may pose bottlenecks in many
procedures, improved efficiencies via highly coordinated processes would promote return
logistics to an economically attractive option to many. Research and development should
also be focused to create a ‘critical mass’ via reverse logistics
Further research should evaluate time variable of reverse logistics in terms of
tracking, routing, and transshipping in order to make disposition decisions for particular
period of time. Such would further integrate reverse logistics to time-constrained value
recovery processes in order do generate dynamic financial justifications. Toktay et al.
37
argued that return flow parameters should be updated time in a similar manner with
forward logistics (Toktay et al, 2004).
The proposed model had its own limitations. The study only focused on the
‘supplier’ side of the reverse logistics developing a model that follows a traditional push
system. The model did not address control issues that may arise between two sides of the
network. Initial collection centers did not consider specific locations with difficulty of
formatting lengthy location variables. Again, the study dealt with time in calculation of
carrying cost; however, did not consider various practical lead-times that may arise due to
transportation or handling. In addition, the proposed model did not consider cost of
sequential logistics activities that include examination, cleaning, or disposal.
With its own limitations; however, the proposed model bears high flexibility in
terms of including specific constraints, controlling variables or modifying routing
sequences. The model can be easily applied to existing reverse logistics network model to
determine benefit of establishing initial collection centers in order to increase customer
accessibility and consolidation efficiency. Existing models may also be configured to find
an optimal solution. Research towards best practices would help obtaining solutions for
various strategic, tactical and operational problems.

38
Bibliography
Amato-McCoy, D.M., 2003. “Sears gets a return on returns”, Stores, Vol. 85 No. 7, pp.66.
Banker, S., 2001. “e-Business and reverse logistics”, December, 2001
Bidwell, R. and Verfaillie, H.A., 2000. Measuring Eco-efficiency: a Guide to Reporting
Company Performance. Geneva: World Business Council for Sustainable Development.
Bilthoven, 1991. National Inventarisation of Environmental Affairs 1990-2010.
Bradbury, H. and Clair, J.A., 1999. Promoting sustainable organizations with Sweden’s
Natural Step. Academy of Management Executive, 13, 4, 63-74.
Brundtland, G., 1987. Our Common Future: the World Commission on Environment and
Development. Oxford: Oxford University Press.
Chopra, S. Meindl, P. Supply Chain Management 3rd edition Harvard Business Press
Chung, Chun-Jen, Wee, Hui-Ming, 2008. Green-component life-cycle value on design
and reverse manufacturing in semi-closed supply chain, Int. J. Production Economics 113
(2008) 528-545
Cooper, M.C. and Gardner, J.T., 1993. Building good business relationships: More that
partnering or strategic alliances? International Journal of Physical Distribution and
Logistics Management 23, 6 (1993), 14-26.
Environmental Consequences in Reverse Manufacturing for the Computer Industry,
Journal of Cleaner Production, 11/4 (2003): 445-458.

39
Esty, Daniel C. and Winston, Andrew S., 2008, Green to Gold, Yale University Press New
Haven & London.
Ginter, P.M., Starling, J.M., 1978. “Reverse distribution channels for recycling,”
California Management Review 20 (3), (1978) 72-82.
Grutter, Jurg M. and Egler, Haans-Peter, 2003. “From cleaner production to sustainable
industrial production modes,” Swiss State Secretariat for Economic Affairs (SECO)
Effingerstr.1, 3003, Bern, Switzerland.
Guide Jr., V.D.R. and Harrison, Terry P., 2003. The Challenge of Closed-loop Supply
Chains. Interfaces Vol. 33, No. 6, November-December 2003.
Guide Jr., V.D.R., Van Wassenhove, L.N., 2002. The reverse supply chain. Harvard
Business Review 80 (2), 25-26
Guide Jr. V.D.R., Souza, Gilvan C.,Wassenhove, Luk N., Blackburn, Joseph D., 2006
Time Value of Commercial product returns, Management Sience, Vol. 52, No.8, August
2006, pp.1200-1214.
Guide Jr., V.D.R., Jayaraman, V., Srivastava, R., Benton, W.C., 2000. Supply chain
management for recoverable manufacturing systems. Interfaces 30(3), 125-142.
Hawken, P., Lovins, A.B., Lovins, L.H., 1999. Natural Capitalism: Creating the
Next Industrial Revolution. Little, Brown and Company, Boston, MA.

40
IUCN/UNEP/WWF (1991) Caring for the Earth: A Strategy for Sustainable Living.
Gland, Switzerland.|IUCN - The World Conservation Union, UNEP - United Nations
Environment Programme, WWF - World Wide Fund for Nature.
Jayaraman V, Patterson RA, Rolland E., 2003. The design of reverse distribution
networks: models and solution procedures. European Journal of Opeartions research
2003; 150(1):128-49.
Krikke, H., van Harten, A., Schuur, P., 1999. Business case Oce: reverse logistics network
re-design for copiers. OR Spektrum 21, 381-409.
Kroon, L., Vrijens, G., 1995. Returnable containers: An example of reverse logistics.
International Journal of Physical Distribution and Logistics Management 25 (2), 56-68.
Min, Hokey, Ko, Hyun Jeung, Ko, C.S., 2006. A genetic algorithmic approach to
developing the multi-echelon reverse logistics network for product returns Omega 34
(2006) 56-69
Mitra, Subrata, 2005. A Survey of the Third-Party Logistics (3PL) Service Providers in
India, Indian Institute of Management Calcutta, WPS No. 562/ October 2005.
National Safety Council, “Electronic Product Recovery and Recycling Baseline Report:
Recycling of Selected Electronic Products in the United States,” (Washington, DC:
National Safety Council, 1999)
O’Rourke, D., Connelly, L., Koshland, C., 1996. “Industrial Ecology: A critical Review,”
International Journal of Environment and Pollution, Vol. 6, Nos. 2/3, pp. 89-112.

41
Poirier C.C., 2004. “Using models to improve the supply chain,” Boca Raton, FL: St.
Lucie Press; 2004.
Sarkis, J., 1995. Manufacturing strategies and environmental consciousness.
Technovation 15 (2), 79-97.
Senge, P.M., Carstedt G., 2001. "Innovating Our Way to the Next Industrial Revolution."
Sloan Management Review. Winter 2001, Volume 42, Number 2, pp. 24-38. (Beckhard
Prize Winner)
Srivastava, S. K., 2007. Green supply chain management: a state-of-the-art literature
review. International Journal of Management Reviews 2007; 9(1):3-80.
Srivastava, S. K., 2008. Network design for reverse logistics, Indian Institute of
Management, Lucknow 226013, India, Omega 36 (2008) 535-548
Stuart, Julie Ann, Low, Ming Kaan, Williams, David J., Turbini, Laura J., Ammons, Jane
Chumleve, 1998. IEEE Transaction on components, packaging, and manufacturing
technology – part c, vol. 21, NO.3, July 1998.
Thierry, Martijn, Salomon, Mark, Nunen, Jo Van, and Wassenhove, Luk Van, 1995.
“Strategic Issues in Product Recovery Management,” California Management Review,
37/2 (Winter 1995): 114-135.
Toffel, Michael W., 2003. “The Growing Strategic Importance of End-of-Life Product
Management,” California Management Review, 45/3 (Spring 2003): 102-129.
Toktay B, van der Laan EA, de Brito MP, 2004. Managing product returns: the role of
forecasting. In: Dekker R, Fleischmann M, Inderfurth K, Van Wassenhove LN, editors.

42
Toktay, B., Wein, L., Stefanos, Z., 2000. Inventory management of remanufacturable
products. Management Science 46, 1412-1426.
Reverse Logistics: quantitative models for closed-loop supply chains. Germany:
Springer; 2004. [chapter 3].
Van der Laan, E., 1997. The effects of remanufacturing on inventory control. Ph.D. Series
in General Management, vol. 28. Rotterdam School of Management, Erasmus University
Rotterdam, The Netherlands.
Welford R., 1998. Corporate environmental management, technology, and sustainable
development: postmodern perspectives and the need for a critical research agenda.
Business Strategy and the Environment 7(1):1-12.
White, C.D., Masanet, E., Rosen, C.M., and Beckman, S., 2001. “Product Recovery: An
Overview of Management Challenges” and Senge, Peter M., Carstedt, Goran, (2001),
“Innovating our way to the next industrial revolution,” MIT Sloan management review,
ISSN 1532-9194, Vol. 42 No 2, pp. 24-38.