solvent dependence of structural dynamics and spin-flip
TRANSCRIPT
doi.org/10.26434/chemrxiv.11798568.v2
Solvent Dependence of Structural Dynamics and Spin-flip Processes in3,4,5-tri(9H-carbazole-9-yl)benzonitrile (ortho-3CzBN)Masaki Saigo, Kiyoshi Miyata, Hajime Nakanotani, Chihaya Adachi, Ken Onda
Submitted date: 13/04/2020 • Posted date: 15/04/2020Licence: CC BY-NC-ND 4.0Citation information: Saigo, Masaki; Miyata, Kiyoshi; Nakanotani, Hajime; Adachi, Chihaya; Onda, Ken(2020): Solvent Dependence of Structural Dynamics and Spin-flip Processes in3,4,5-tri(9H-carbazole-9-yl)benzonitrile (ortho-3CzBN). ChemRxiv. Preprint.https://doi.org/10.26434/chemrxiv.11798568.v2
We have investigated the solvent-dependence of structural changes along with intersystem crossing of athermally activated delayed fluorescence (TADF) molecule, 3,4,5-tri(9H-carbazole-9-yl)benzonitrile(o-3CzBN), in toluene, tetrahydrofuran, and acetonitrile solutions using time-resolved infrared (TR-IR)spectroscopy and DFT calculations. We found that the geometries of the S1 and T1 states are very similar inall solvents though the photophysical properties mostly depend on the solvent. In addition, the time-dependentDFT calculations based on these geometries suggested that the thermally activated delayed fluorescenceprocess of o-3CzBN is governed more by the higher-lying excited states than by the structural changes in theexcited states.
File list (2)
download fileview on ChemRxiv200411_CzBN_TR-IR_Solvent_CPL_MS3.pdf (1.11 MiB)
download fileview on ChemRxiv200411_CzBN_TR-IR_Solvent_CPL(SI)_MS3_KO.pdf (1.51 MiB)
Solvent Dependence of Structural Dynamics and Spin-flip Processes in 3,4,5-tri(9H-carbazole-9-yl)benzonitrile (ortho-3CzBN)
Masaki Saigo, 1 Kiyoshi Miyata, 1 Hajime Nakanotani, 2,3 Chihaya Adachi, 2,3 and Ken Onda *1 1Department of Chemistry, Kyushu University, 744 Motooka, Nishi, Fukuoka 829-0395 2Center for Organic Photonics and Electronics Research (OPERA), Kyushu University, 744 Motooka, Nishi, Fukuoka 819-0395 3JST, ERATO, Adachi Molecular Exciton Engineering Project, Kyushu University, 744 Motooka, Nishi, Fukuoka 819-0395 *Corresponding author. E-mail: [email protected] Abstract We have investigated the solvent-dependence of structural changes along with intersystem crossing of a thermally activated delayed fluorescence (TADF) molecule, 3,4,5-tri(9H-carbazole-9-yl)benzonitrile (o-3CzBN), in toluene, tetrahydrofuran, and acetonitrile solutions using time-resolved infrared (TR-IR) spectroscopy and DFT calculations. We found that the geometries of the S1 and T1 states are very similar in all solvents though the photophysical properties mostly depend on the solvent. In addition, the time-dependent DFT calculations based on these geometries suggested that the thermally activated delayed fluorescence process of o-3CzBN is governed more by the higher-lying excited states than by the structural changes in the excited states. Keywords: Time-resolved infrared spectroscopy (TR-IR); Solvent dependence; Thermally activated delayed fluorescence (TADF)

1. Introduction
Thermally activated delayed fluorescence (TADF) molecules receive tremendous
attention owing to their unique ability to improve the efficiency of organic light-emitting
diodes (OLEDs). TADF molecules convert excitons at the lowest triplet state (T1) to the
lowest singlet excited state (S1) via reverse intersystem crossing (RISC) driven by thermal
excitation. To achieve an efficient RISC process, the energy gap between S1 and T1 (∆EST)
needs to be sufficiently small (<0.1 eV). The basic design strategy for obtaining small
∆EST is to separate the highest occupied molecular orbital (HOMO) from the lowest
unoccupied molecular orbital (LUMO), typically achieved by connecting electron donor
and electron acceptor chromophores1,2.
TADF molecules often have a charge transfer (CT) character in the excited states.
The CT character results in the strong solvent-dependence of photophysical properties
such as emission wavelength, photoluminescence quantum yield (PLQY), and lifetime.3–
5. Moreover, TADF activities also depend on the solvent. Although the mechanism of the
solvent-dependence is essential when designing high-performance devices, the
microscopic understanding of the mechanism is still elusive6–8. Recently, the contribution
of higher-lying excited states for TADF activity was suggested from the temperature
dependence of photoluminescence (PL) decay rate9, transient absorption spectroscopy6,
and theoretical calculations8,10. Hosokai et al. compared TADF activities of carbazole-
benzonitrile (Cz-BN) derivatives in a non-polar solvent (toluene, ε = 2.4) and a polar
solvent (acetonitrile, ε = 37). They found the solvent-dependent TADF in these
derivatives from the viewpoint of the difference in the shifting of energy levels and their
matching, including higher-lying excited states5. In addition to the T1 and S1 states, which
possess CT characters, Hosokai et al. proposed the existence of the higher-lying excited
state, T2, with a locally excited (LE) character to explain the solvent dependence. While
the S1 and T1 states are significantly stabilized in polar solvents, the energy level of a
locally excited T2 state is less affected; therefore, they determined the positive correlation
between TADF activity and energy matching of S1,CT and T2,LE.
TADF activity is also expected to be modulated by intra-molecular structural change
in the excited state. Nevertheless, discussions in many previous works were often based
on the geometry of the ground state. The structural change in the excited states has mainly
been discussed from theoretical calculations, but the lack of experimental justification of
the calculations has been problematic. Therefore, the correlation between the solvent
dependence of TADF activity and the structure in the excited state largely remains elusive.
We previously reported that the suppression of structural changes along with intersystem
crossing (ISC) assists the TADF process in Cz-BN derivatives with an ∆EST of about 0.2
eV11. Because structural changes in the excited states are highly sensitive to external
environments such as solvents, it is necessary to investigate the excited state structural
modulations with solvents to explore the solvent effects on TADF processes.
Here, we have studied the solvent dependence of structural change associated with
ISC using the combination method of time-resolved infrared spectroscopy (TR-IR) and
quantum chemical calculations. TR-IR is a powerful tool to investigate the structural
dynamics of functional molecules in excited states.11–15 We focused on 3,4,5-tri(9H-
carbazole-9-yl)benzonitrile (o-3CzBN, Figure 1a), which shows drastic structural
changes in the excited state. Although all Cz units of o-3CzBN in the ground state are in
the same plane, the location of one Cz unit shifts towards an out-of-plane direction in the
T1 state, as revealed by TR-IR and quantum chemical calculations.11 Intriguingly, o-
3CzBN shows no TADF activity in toluene solution although it becomes TADF active in
acetonitrile (MeCN) solution.5 Therefore, the o-3CzBN is an ideal system to explore
structural changes in higher-lying excited states by comparing the solvent dependence of
TR-IR in toluene and MeCN. We first carefully characterized the structural and electronic
properties of the lowest excited states, i.e., S1 and T1 states, in different solvents and
discuss the roles of the higher-lying excited states in these solvents based on these results.
2. Time-resolved spectroscopy and calculations
2.1 Time-resolved photoluminescence (TR-PL) measurements
TR-PL measurements were performed using a streak camera (Hamamatsu, C4334)
synchronized with a nanosecond Nd:YAG laser (EKSPLA, NL220, central wavelength:
1064 nm, pulse duration: 6 ns). The samples were pumped by the third harmonic
generation (THG) of the output of the nanosecond Nd:YAG laser. The polarization angles
of the light for pumping/detection were set to the magic angle. The concentration of the
solutions was prepared to be 1 mM. The solutions were continuously circulated through
a quartz cell to avoid potential damage from optical pumping.
2.2 Time-resolved infrared (TR-IR) measurements
The experimental setup for the pump-probe femtosecond TR-IR measurements has
been reported previously.12,13,16 Briefly, a broadband mid-IR pulse for a probe light (pulse
duration: 120 fs, bandwidth: 150 cm−1, tunable range: 1000–4000 cm−1) was generated
by difference frequency generation (DFG) of signal and idler lights from an optical
parametric amplifier (OPA) coupled to the output from a regenerative Ti:sapphire
amplifier (Spectra-Physics, Spitfire Ace, ~120 fs, 1 kHz, 4 mJ/pulse, 800 nm). For a pump
light, we employed one of the three lasers below accordingly to make S1 excitation: the
third harmonic generation (THG) from a nanosecond Nd:YAG laser (EKSPLA NL220,
central wavelength: 1064 nm, pulse duration: 6 ns). The polarization angles of the light
for the pump and probe were set to the magic angle. The pump pulse fluences were 2.9
mJ/cm2 for toluene solution, 3.6 mJ/cm2 for THF solution, and 3.7 mJ/cm2 for MeCN
solution. We also confirmed that the measurements were in a linear regime (Figure S1),
meaning such spectral change is not due to high-order effects but rather intrinsic change
of the molecule. The sample solutions were continuously circulated through a home-built
optical cell equipped with BaF2 windows with an optical path length of 0.1 mm. A probe
pulse passed through the optical cell and was dispersed by a 19-cm polychromator
followed by detection using a 64-channel mercury cadmium telluride (MCT) infrared
detector array. The concentrations of the solutions were prepared to be 1 mM for toluene
and MeCN solutions and 3 mM for THF solution. All measurements were conducted after
1-hour bubbling using N2 gas.
2.3. Calculations
Quantum chemical calculations based on the density functional theory (DFT) were
performed using the Gaussian 16 package.17 Vibrational spectra were calculated after
geometry optimization of each state. We employed the 6-31G(d,p) basis set and the
B3LYP functionals following previous research.11 The solvent effect was examined using
the polarizable continuum model of toluene solution (dielectric constant: 2.379) and
MeCN solution (dielectric constant: 36.64). The frequencies of the simulated spectra were
appropriately scaled to take into account frequency shifts caused by anharmonicity. The
scaling factor of 0.97 was adopted.
3. Results and discussion
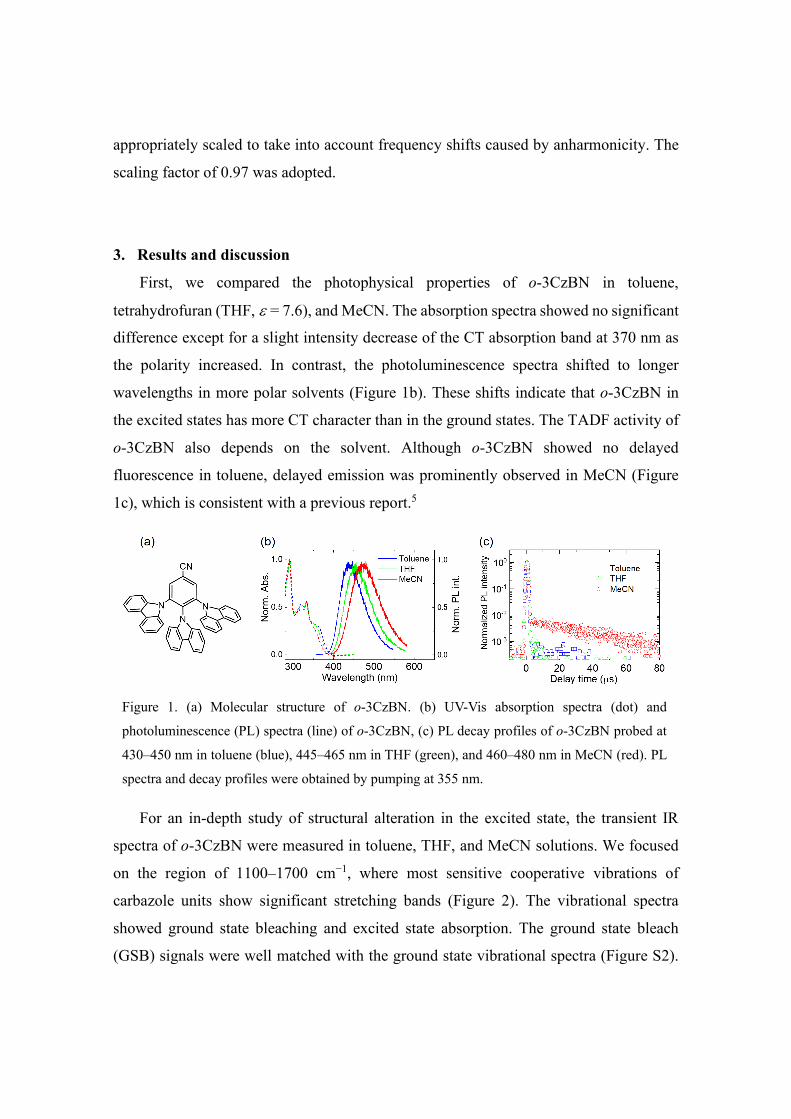
First, we compared the photophysical properties of o-3CzBN in toluene,
tetrahydrofuran (THF, ε = 7.6), and MeCN. The absorption spectra showed no significant
difference except for a slight intensity decrease of the CT absorption band at 370 nm as
the polarity increased. In contrast, the photoluminescence spectra shifted to longer
wavelengths in more polar solvents (Figure 1b). These shifts indicate that o-3CzBN in
the excited states has more CT character than in the ground states. The TADF activity of
o-3CzBN also depends on the solvent. Although o-3CzBN showed no delayed
fluorescence in toluene, delayed emission was prominently observed in MeCN (Figure
1c), which is consistent with a previous report.5
For an in-depth study of structural alteration in the excited state, the transient IR
spectra of o-3CzBN were measured in toluene, THF, and MeCN solutions. We focused
on the region of 1100–1700 cm−1, where most sensitive cooperative vibrations of
carbazole units show significant stretching bands (Figure 2). The vibrational spectra
showed ground state bleaching and excited state absorption. The ground state bleach
(GSB) signals were well matched with the ground state vibrational spectra (Figure S2).
Figure 1. (a) Molecular structure of o-3CzBN. (b) UV-Vis absorption spectra (dot) and
photoluminescence (PL) spectra (line) of o-3CzBN, (c) PL decay profiles of o-3CzBN probed at
430–450 nm in toluene (blue), 445–465 nm in THF (green), and 460–480 nm in MeCN (red). PL
spectra and decay profiles were obtained by pumping at 355 nm.
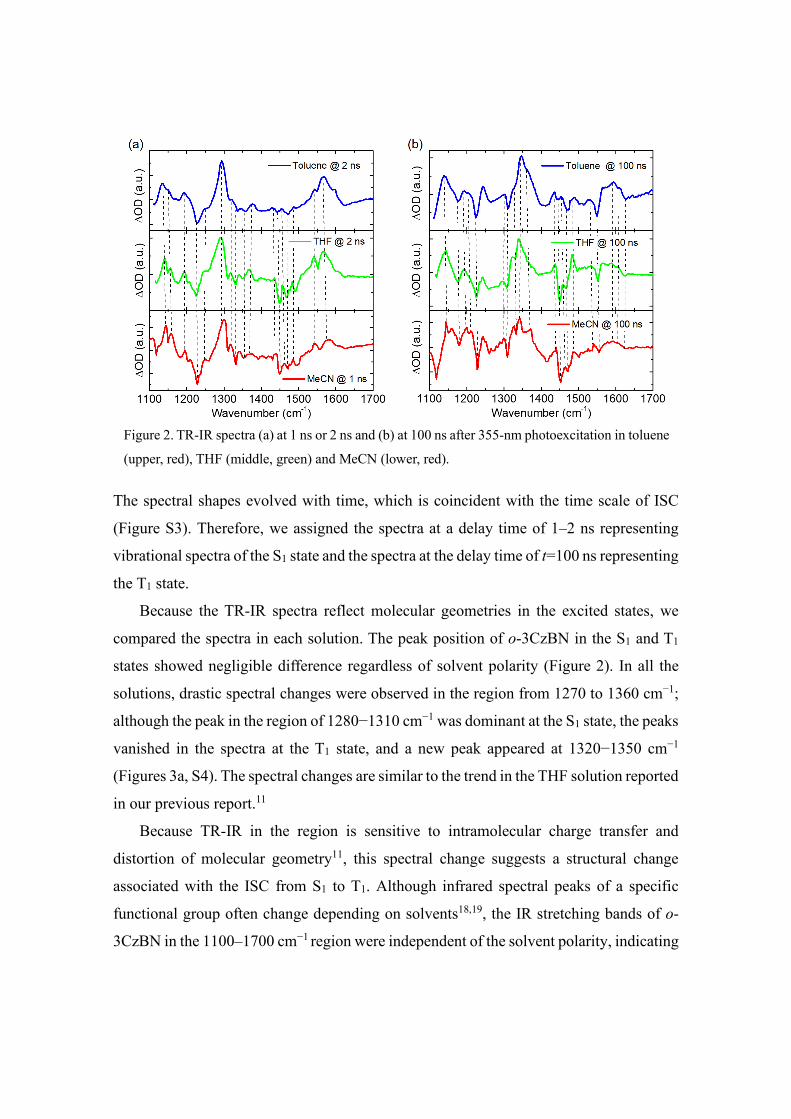
The spectral shapes evolved with time, which is coincident with the time scale of ISC
(Figure S3). Therefore, we assigned the spectra at a delay time of 1–2 ns representing
vibrational spectra of the S1 state and the spectra at the delay time of t=100 ns representing
the T1 state.
Because the TR-IR spectra reflect molecular geometries in the excited states, we
compared the spectra in each solution. The peak position of o-3CzBN in the S1 and T1
states showed negligible difference regardless of solvent polarity (Figure 2). In all the
solutions, drastic spectral changes were observed in the region from 1270 to 1360 cm−1;
although the peak in the region of 1280−1310 cm−1 was dominant at the S1 state, the peaks
vanished in the spectra at the T1 state, and a new peak appeared at 1320−1350 cm−1
(Figures 3a, S4). The spectral changes are similar to the trend in the THF solution reported
in our previous report.11
Because TR-IR in the region is sensitive to intramolecular charge transfer and
distortion of molecular geometry11, this spectral change suggests a structural change
associated with the ISC from S1 to T1. Although infrared spectral peaks of a specific
functional group often change depending on solvents18,19, the IR stretching bands of o-
3CzBN in the 1100–1700 cm−1 region were independent of the solvent polarity, indicating
Figure 2. TR-IR spectra (a) at 1 ns or 2 ns and (b) at 100 ns after 355-nm photoexcitation in toluene
(upper, red), THF (middle, green) and MeCN (lower, red).
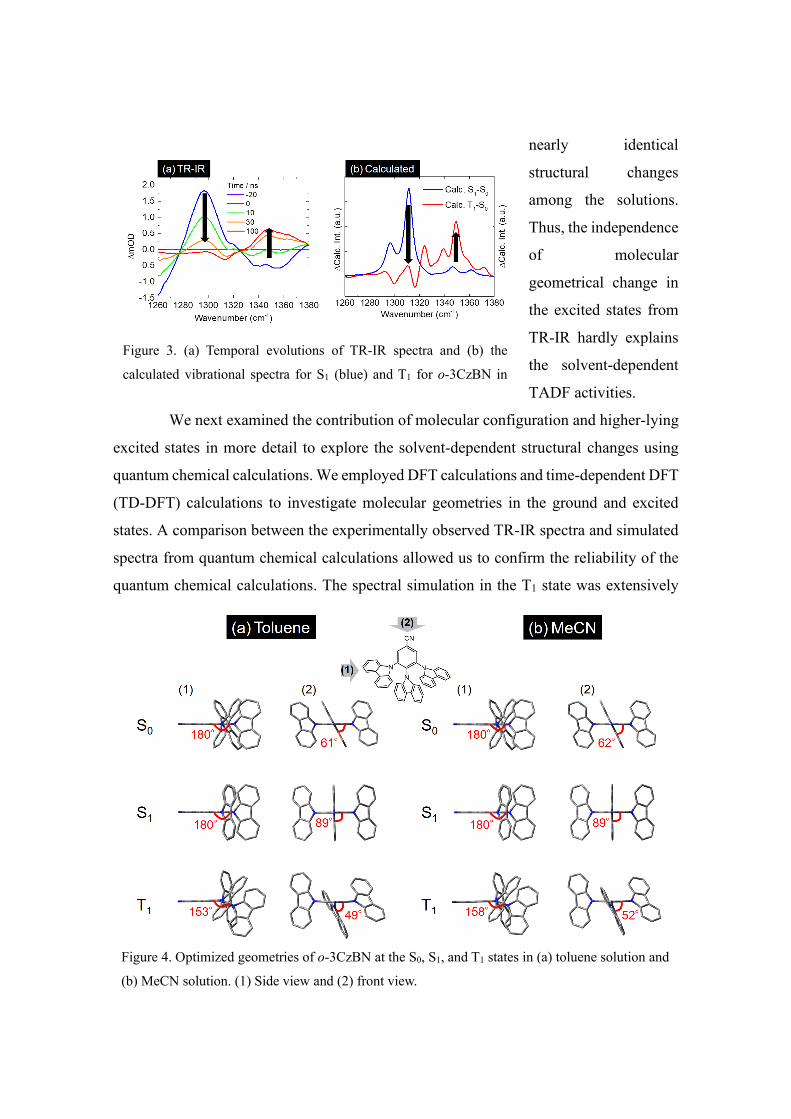
nearly identical
structural changes
among the solutions.
Thus, the independence
of molecular
geometrical change in
the excited states from
TR-IR hardly explains
the solvent-dependent
TADF activities.
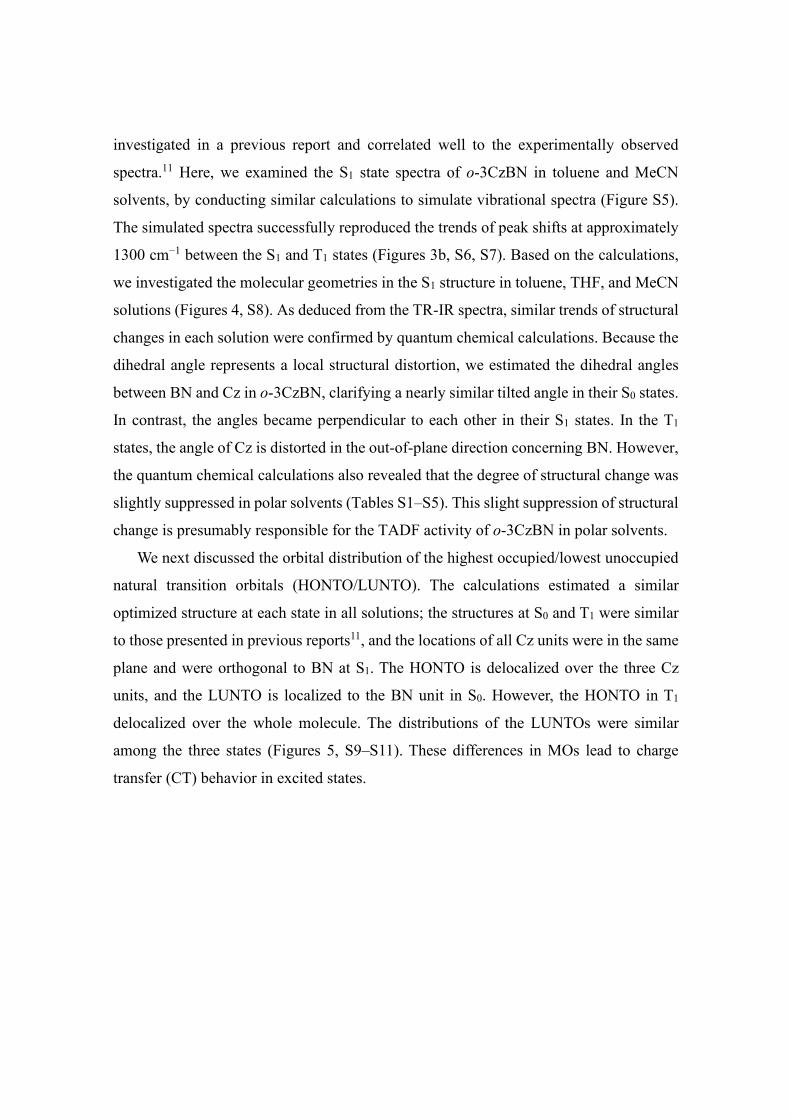
We next examined the contribution of molecular configuration and higher-lying
excited states in more detail to explore the solvent-dependent structural changes using
quantum chemical calculations. We employed DFT calculations and time-dependent DFT
(TD-DFT) calculations to investigate molecular geometries in the ground and excited
states. A comparison between the experimentally observed TR-IR spectra and simulated
spectra from quantum chemical calculations allowed us to confirm the reliability of the
quantum chemical calculations. The spectral simulation in the T1 state was extensively
Figure 4. Optimized geometries of o-3CzBN at the S0, S1, and T1 states in (a) toluene solution and
(b) MeCN solution. (1) Side view and (2) front view.
Figure 3. (a) Temporal evolutions of TR-IR spectra and (b) the
calculated vibrational spectra for S1 (blue) and T1 for o-3CzBN in
investigated in a previous report and correlated well to the experimentally observed
spectra.11 Here, we examined the S1 state spectra of o-3CzBN in toluene and MeCN
solvents, by conducting similar calculations to simulate vibrational spectra (Figure S5).
The simulated spectra successfully reproduced the trends of peak shifts at approximately
1300 cm−1 between the S1 and T1 states (Figures 3b, S6, S7). Based on the calculations,
we investigated the molecular geometries in the S1 structure in toluene, THF, and MeCN
solutions (Figures 4, S8). As deduced from the TR-IR spectra, similar trends of structural
changes in each solution were confirmed by quantum chemical calculations. Because the
dihedral angle represents a local structural distortion, we estimated the dihedral angles
between BN and Cz in o-3CzBN, clarifying a nearly similar tilted angle in their S0 states.
In contrast, the angles became perpendicular to each other in their S1 states. In the T1
states, the angle of Cz is distorted in the out-of-plane direction concerning BN. However,
the quantum chemical calculations also revealed that the degree of structural change was
slightly suppressed in polar solvents (Tables S1–S5). This slight suppression of structural
change is presumably responsible for the TADF activity of o-3CzBN in polar solvents.
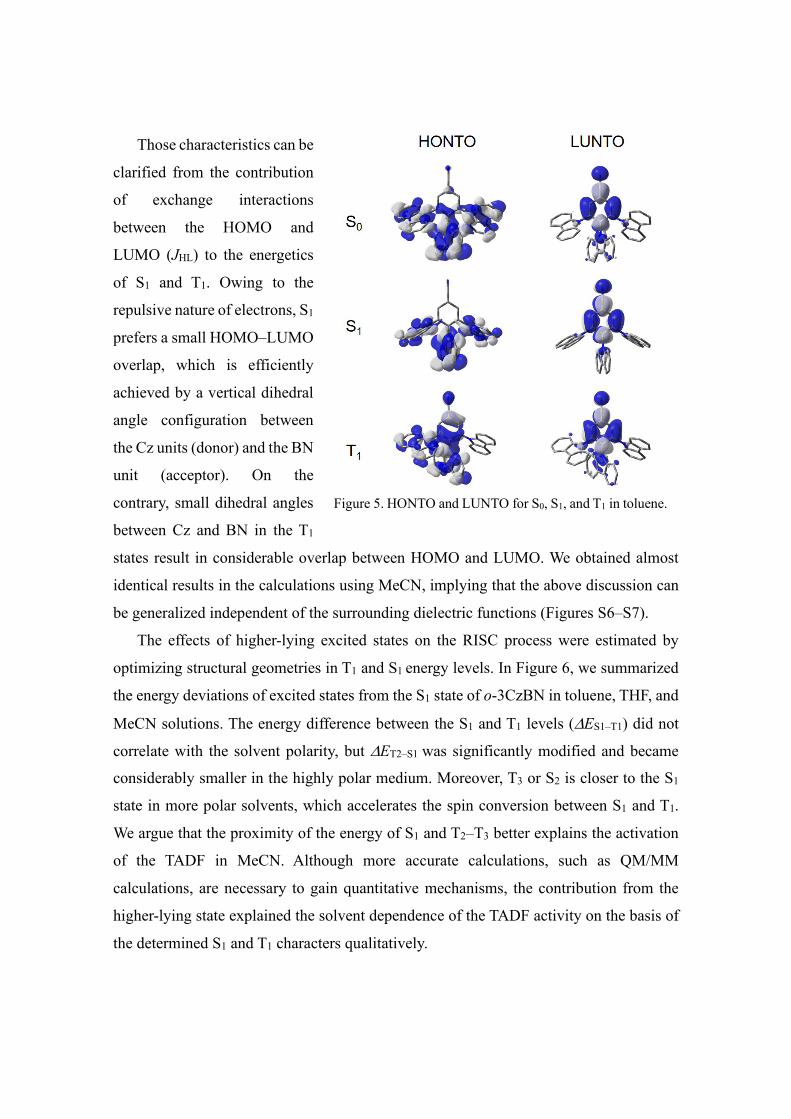
We next discussed the orbital distribution of the highest occupied/lowest unoccupied
natural transition orbitals (HONTO/LUNTO). The calculations estimated a similar
optimized structure at each state in all solutions; the structures at S0 and T1 were similar
to those presented in previous reports11, and the locations of all Cz units were in the same
plane and were orthogonal to BN at S1. The HONTO is delocalized over the three Cz
units, and the LUNTO is localized to the BN unit in S0. However, the HONTO in T1
delocalized over the whole molecule. The distributions of the LUNTOs were similar
among the three states (Figures 5, S9–S11). These differences in MOs lead to charge
transfer (CT) behavior in excited states.
Those characteristics can be
clarified from the contribution
of exchange interactions
between the HOMO and
LUMO (JHL) to the energetics
of S1 and T1. Owing to the
repulsive nature of electrons, S1
prefers a small HOMO–LUMO
overlap, which is efficiently
achieved by a vertical dihedral
angle configuration between
the Cz units (donor) and the BN
unit (acceptor). On the
contrary, small dihedral angles
between Cz and BN in the T1
states result in considerable overlap between HOMO and LUMO. We obtained almost
identical results in the calculations using MeCN, implying that the above discussion can
be generalized independent of the surrounding dielectric functions (Figures S6–S7).
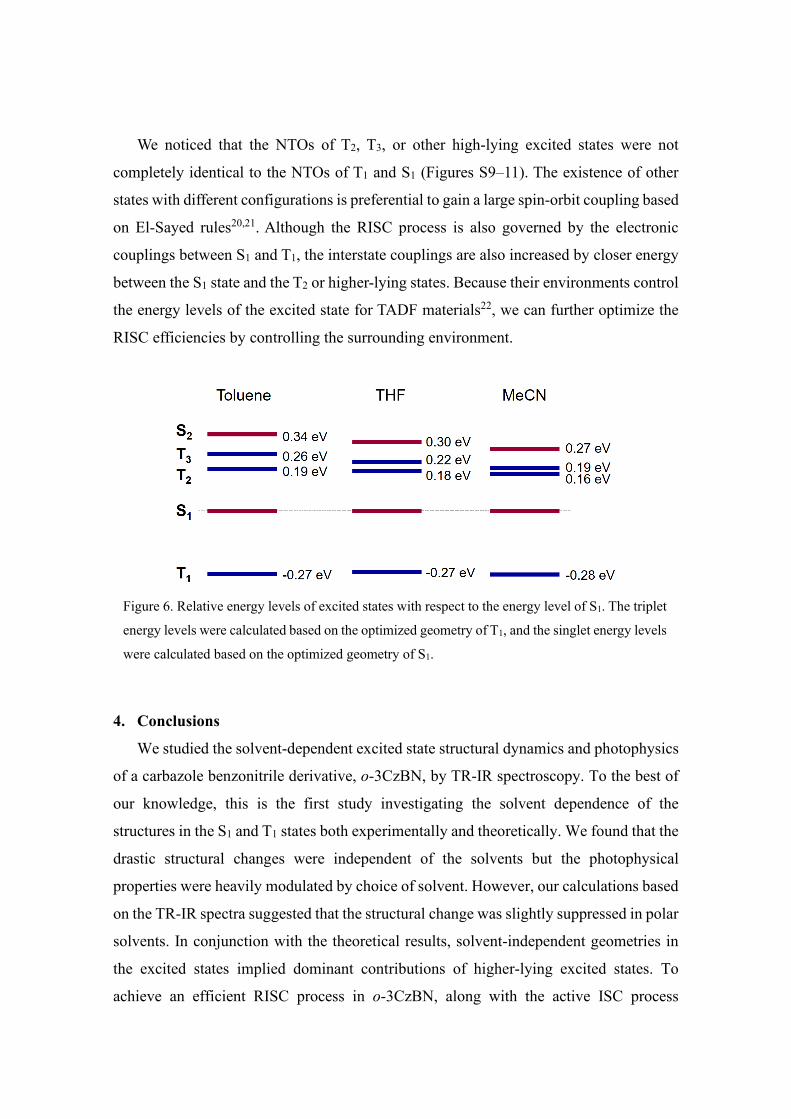
The effects of higher-lying excited states on the RISC process were estimated by
optimizing structural geometries in T1 and S1 energy levels. In Figure 6, we summarized
the energy deviations of excited states from the S1 state of o-3CzBN in toluene, THF, and
MeCN solutions. The energy difference between the S1 and T1 levels (∆ES1–T1) did not
correlate with the solvent polarity, but ∆ET2–S1 was significantly modified and became
considerably smaller in the highly polar medium. Moreover, T3 or S2 is closer to the S1
state in more polar solvents, which accelerates the spin conversion between S1 and T1.
We argue that the proximity of the energy of S1 and T2–T3 better explains the activation
of the TADF in MeCN. Although more accurate calculations, such as QM/MM
calculations, are necessary to gain quantitative mechanisms, the contribution from the
higher-lying state explained the solvent dependence of the TADF activity on the basis of
the determined S1 and T1 characters qualitatively.
Figure 5. HONTO and LUNTO for S0, S1, and T1 in toluene.
We noticed that the NTOs of T2, T3, or other high-lying excited states were not
completely identical to the NTOs of T1 and S1 (Figures S9–11). The existence of other
states with different configurations is preferential to gain a large spin-orbit coupling based
on El-Sayed rules20,21. Although the RISC process is also governed by the electronic
couplings between S1 and T1, the interstate couplings are also increased by closer energy
between the S1 state and the T2 or higher-lying states. Because their environments control
the energy levels of the excited state for TADF materials22, we can further optimize the
RISC efficiencies by controlling the surrounding environment.
4. Conclusions
We studied the solvent-dependent excited state structural dynamics and photophysics
of a carbazole benzonitrile derivative, o-3CzBN, by TR-IR spectroscopy. To the best of
our knowledge, this is the first study investigating the solvent dependence of the
structures in the S1 and T1 states both experimentally and theoretically. We found that the
drastic structural changes were independent of the solvents but the photophysical
properties were heavily modulated by choice of solvent. However, our calculations based
on the TR-IR spectra suggested that the structural change was slightly suppressed in polar
solvents. In conjunction with the theoretical results, solvent-independent geometries in
the excited states implied dominant contributions of higher-lying excited states. To
achieve an efficient RISC process in o-3CzBN, along with the active ISC process
Figure 6. Relative energy levels of excited states with respect to the energy level of S1. The triplet
energy levels were calculated based on the optimized geometry of T1, and the singlet energy levels
were calculated based on the optimized geometry of S1.
associated with structural change suppression, the existence of higher-lying triplet states
near the S1 state is also important. The detailed understanding of the effect of the
environment is essential to control the optoelectronic properties of molecules from the
choice of the environment, such as host materials in practical optoelectronics devices.
Acknowledgment
This work was supported in part by JSPS KAKENHI Grant Numbers JP17H06375,
JP18H05170, JP18H02047, JP18H05981, JP19K15508, and the Qdai-jump Research
(QR) Program Wakaba Challenge. The computations were performed using the Research
Center for Computational Science (National Institute of Natural Sciences) and Research
Institute for Information Technology (Kyushu University). We thank Kyulux Inc. for
supplying samples and Dr. Raj Kumar Koninti for fruitful discussions.

References
1. Tanaka, H., Shizu, K., Miyazaki, H. & Adachi, C. Efficient green thermally activated delayed
fluorescence (TADF) from a phenoxazine-triphenyltriazine (PXZ-TRZ) derivative. Chemical
Communications 48, 11392–11394 (2012).
2. Uoyama, H., Goushi, K., Shizu, K., Nomura, H. & Adachi, C. Highly efficient organic light-
emitting diodes from delayed fluorescence. Nature 492, 234–238 (2012).
3. Ishimatsu, R. et al. Solvent effect on thermally activated delayed fluorescence by 1,2,3,5-
tetrakis(carbazol-9-yl)-4,6-dicyanobenzene. Journal of Physical Chemistry A 117, 5607–5612
(2013).
4. Chen, X.-K. et al. A New Design Strategy for Efficient Thermally Activated Delayed
Fluorescence Organic Emitters: From Twisted to Planar Structures. Advanced Materials 1702767,
1702767 (2017).
5. Hosokai, T. et al. Solvent-dependent investigation of carbazole benzonitrile derivatives: does the
LE3−CT1 energy gap facilitate thermally activated delayed fluorescence? Journal of Photonics for
Energy 8, 1 (2018).
6. Hosokai, T. et al. Evidence and mechanism of efficient thermally activated delayed fluorescence
promoted by delocalized excited states. Science Advances 3, e1603282 (2017).
7. Noda, H., Nakanotani, H. & Adachi, C. Excited state engineering for efficient reverse intersystem
crossing. Science Advances 4, eaao6910 (2018).
8. Noda, H. et al. Critical role of intermediate electronic states for spin-flip processes in charge-
transfer-type organic molecules with multiple donors and acceptors. Nature Materials 18, 1084–
1090 (2019).
9. Kobayashi, T. et al. Contributions of a Higher Triplet Excited State to the Emission Properties of
a Thermally Activated Delayed-Fluorescence Emitter. Physical Review Applied 7, 1–10 (2017).
10. Chen, X. K., Kim, D. & Brédas, J. L. Thermally Activated Delayed Fluorescence (TADF) Path
toward Efficient Electroluminescence in Purely Organic Materials: Molecular Level Insight.
Accounts of Chemical Research 51, 2215–2224 (2018).
11. Saigo, M. et al. Suppression of Structural Change upon S1 -T1 Conversion Assists the Thermally
Activated Delayed Fluorescence Process in Carbazole-Benzonitrile Derivatives. Journal of
Physical Chemistry Letters 10, 2475–2480 (2019).
12. Fukazawa, N. et al. Time-Resolved Infrared Vibrational Spectroscopy of the Photoinduced Phase
Transition of Pd(dmit)2 Salts Having Different Orders of Phase Transition. The Journal of
Physical Chemistry C 117, 13187–13196 (2013).
13. Mukuta, T., Tanaka, S., Inagaki, A., Koshihara, S. & Onda, K. Direct Observation of the Triplet
Metal-Centered State in [Ru(bpy)3]2+ Using Time-Resolved Infrared Spectroscopy. Chemistry
Select 1, 2802 (2016).

14. Mukuta, T. et al. Photochemical Processes in a Rhenium(I) Tricarbonyl N-Heterocyclic Carbene
Complex Studied by Time-Resolved Measurements. Inorganic Chemistry 56, 3404–3413 (2017).
15. Grieco, C. et al. Direct Observation of Correlated Triplet Pair Dynamics during Singlet Fission
Using Ultrafast Mid-IR Spectroscopy. Journal of Physical Chemistry C 122, 2012–2022 (2018).
16. Mukuta, T. et al. Infrared Vibrational Spectroscopy of [Ru(bpy)2(bpm)]2+ and [Ru(bpy)3]2+ in the
Excited Triplet State. Inorganic Chemistry 53, 2481–2490 (2014).
17. Frisch, M. J. et al. Gaussian 16, Revision A.03,. (2016).
18. Allerhand, A. & Von Schleyer, P. R. Solvent Effects in Infrared Spectroscopic Studies of
Hydrogen Bonding. Journal of the American Chemical Society 85, 371–380 (1963).
19. Cole, A. R. H., Little, L. H. & Michell, A. J. Solvent effects in infra-red spectra. OE and SH
stretching vibrations. Spectrochimica Acta 21, 1169–1182 (1965).
20. El-Sayed, M. A. Spin-orbit coupling and the radiationless processes in nitrogen heterocyclics. The
Journal of Chemical Physics 38, 2834–2838 (1963).
21. Yersin, H., Mataranga-Popa, L., Czerwieniec, R. & Dovbii, Y. Design of a New Mechanism
beyond Thermally Activated Delayed Fluorescence toward Fourth Generation Organic Light
Emitting Diodes. Chemistry of Materials 31, 6110–6116 (2019).
22. Santos, P. L. et al. Engineering the singlet-triplet energy splitting in a TADF molecule. Journal of
Materials Chemistry C 4, 3815–3824 (2016).

download fileview on ChemRxiv200411_CzBN_TR-IR_Solvent_CPL_MS3.pdf (1.11 MiB)
Solvent Dependence of Structural Dynamics and Spin-flip Processes in 3,4,5-tri(9H-carbazole-9-yl)benzonitrile (ortho-3CzBN) Masaki Saigo, 1 Kiyoshi Miyata, 1 Hajime Nakanotani, 2,3 Chihaya Adachi, 2,3 and Ken Onda 1*
1 Department of Chemistry, Kyushu University, 744 Motooka, Nishi, Fukuoka 829-0395 2 Center for Organic Photonics and Electronics Research (OPERA), Kyushu University, 744 Motooka, Nishi, Fukuoka 819-0395 3 JST, ERATO, Adachi Molecular Exciton Engineering Project, Kyushu University, 744 Motooka, Nishi, Fukuoka 819-0395

Table of Contents
Methods
I. Sample Preparation
II. Steady State Spectroscopy
Table S1. Diheadral angle, torsion angle, and bond length between BN and Cz at S0.
Table S2. Diheadral angle, torsion angle, and bond length between BN and Cz at S1.
Table S3. Diheadral angle, torsion angle, and bond length between BN and Cz at T1.
Table S4. The differences between at S1 and at S0 of diheadral angle, torsion angle, and bond length between BN and Cz.
Table S5. The differences between at S1 and at S0 of diheadral angle, torsion angle, and bond length between BN and Cz.
Figures S1. TR-IR signal intensity for toluene and MeCN solution.
Figures S2. Comparison of the TR-IR and FT-IR spectra for o-3CzBN.
Figures S3. Comparison of the temporal decay of TR-IR signals and TR-PL intensity for o-3CzBN.
Figures S4. Temporal evolutions of TR-IR spectra for o-3CzBN in MeCN.
Figures S5. Comparison of the experimentally observed spectra and calculated vibrational spectra of o-3CzBN.
Figures S6. The calculated vibrational spectra of o-3CzBN for S1 and T1.
Figures S7. The comparison of calculated vibrational spectra of o-3CzBN for S1 and T1.
Figures S8. The optimized geometries of o-3CzBN at S0, S1, and T1 states in THF.
Figures S9. NTOs for some states from S0 to S2 in toluene solution.
Figures S10. NTOs for some states from S0 to S2 in THF solution.
Figures S11. NTOs for some states from S0 to S2 in MeCN solution.
Methods
I. Sample Preparation
We synthesized o-3CzBN according to previous works.1 We prepared solutions of the
purified molecules in toluene, tetrahydrofuran (THF) and acetonitrile (MeCN) purchased from
Kanto Kagaku.
II. Steady State Spectroscopy
1) UV-Vis absorption spectroscopy
The UV-Vis absorption spectra were measured with a UV-Vis spectrophotometer
(JASCO, V-630). The concentration of the solutions was prepared to be 0.1 mM.
2) Fourier transform infrared (FT-IR) spectroscopy
The IR spectra in the ground state were recorded with a FT-IR spectrophotometer
(Shimadzu, IRPrestige-21). The samples were measured in the KBr pellets, which were
prepared by mixing sample with KBr powder at a ratio of 1:100 and using a Hydraulic press.
KBr purchased from JASCO.
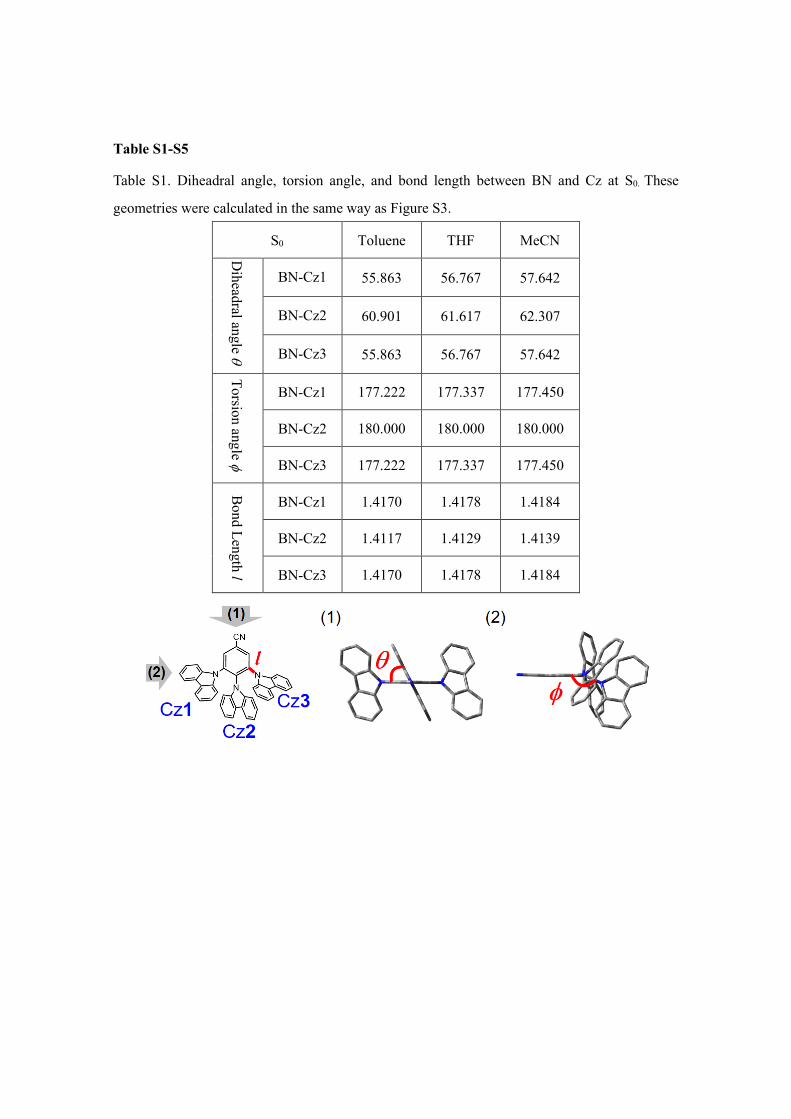
Table S1-S5
Table S1. Diheadral angle, torsion angle, and bond length between BN and Cz at S0. These
geometries were calculated in the same way as Figure S3.
S0 Toluene THF MeCN
Diheadral angle θ
BN-Cz1 55.863 56.767 57.642
BN-Cz2 60.901 61.617 62.307
BN-Cz3 55.863 56.767 57.642
Torsion angle φ
BN-Cz1 177.222 177.337 177.450
BN-Cz2 180.000 180.000 180.000
BN-Cz3 177.222 177.337 177.450
Bond Length l
BN-Cz1 1.4170 1.4178 1.4184
BN-Cz2 1.4117 1.4129 1.4139
BN-Cz3 1.4170 1.4178 1.4184

Table S2. Dihedral angle, torsion angle, and bond length between BN and Cz at S1. These
geometries were calculated in the same way as Figure S3.
S1 Toluene THF MeCN
Dihedral angle θ
BN-Cz1 88.444 88.208 88.600
BN-Cz2 89.106 88.973 89.325
BN-Cz3 88.424 88.171 88.592
Torsion angle φ
BN-Cz1 179.033 179.113 179.197
BN-Cz2 179.981 179.961 179.983
BN-Cz3 179.033 179.113 179.195
Bond Length l
BN-Cz1 1.4380 1.4377 1.4377
BN-Cz2 1.4401 1.4363 1.4341
BN-Cz3 1.4380 1.4377 1.4377
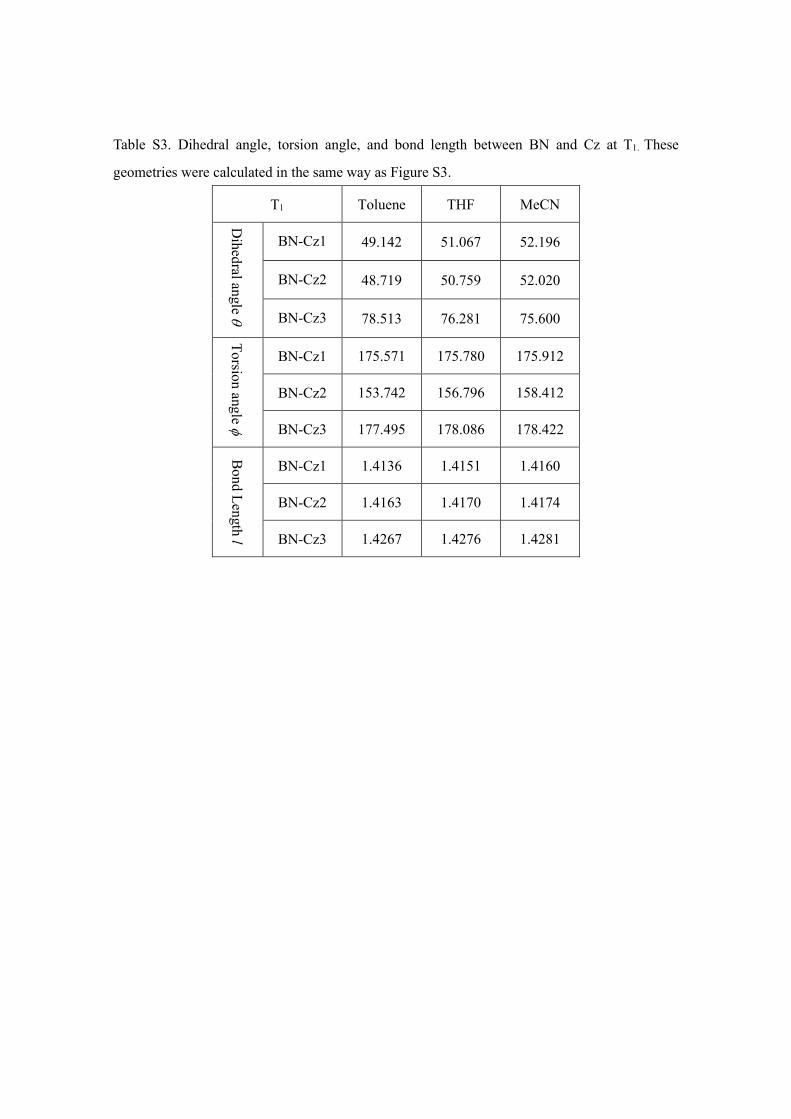
Table S3. Dihedral angle, torsion angle, and bond length between BN and Cz at T1. These
geometries were calculated in the same way as Figure S3.
T1 Toluene THF MeCN
Dihedral angle θ
BN-Cz1 49.142 51.067 52.196
BN-Cz2 48.719 50.759 52.020
BN-Cz3 78.513 76.281 75.600
Torsion angle φ
BN-Cz1 175.571 175.780 175.912
BN-Cz2 153.742 156.796 158.412
BN-Cz3 177.495 178.086 178.422
Bond Length l
BN-Cz1 1.4136 1.4151 1.4160
BN-Cz2 1.4163 1.4170 1.4174
BN-Cz3 1.4267 1.4276 1.4281
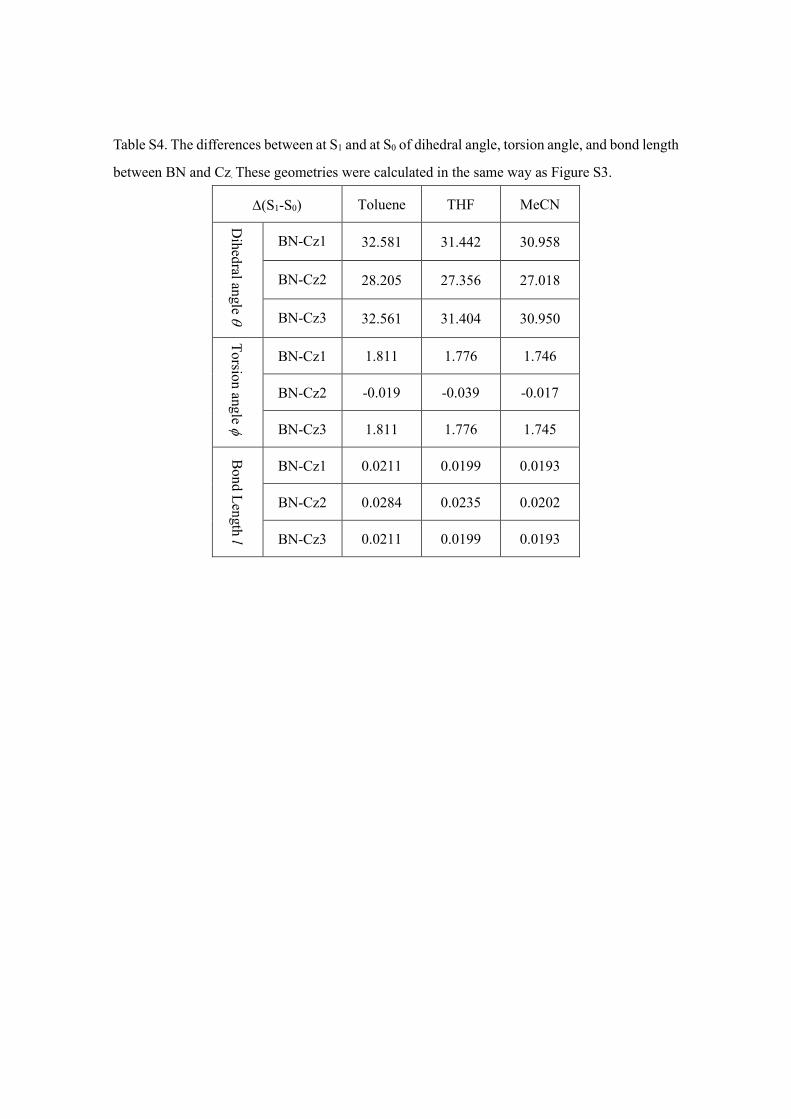
Table S4. The differences between at S1 and at S0 of dihedral angle, torsion angle, and bond length
between BN and Cz. These geometries were calculated in the same way as Figure S3.
∆(S1-S0) Toluene THF MeCN
Dihedral angle θ
BN-Cz1 32.581 31.442 30.958
BN-Cz2 28.205 27.356 27.018
BN-Cz3 32.561 31.404 30.950
Torsion angle φ
BN-Cz1 1.811 1.776 1.746
BN-Cz2 -0.019 -0.039 -0.017
BN-Cz3 1.811 1.776 1.745
Bond Length l
BN-Cz1 0.0211 0.0199 0.0193
BN-Cz2 0.0284 0.0235 0.0202
BN-Cz3 0.0211 0.0199 0.0193

Table S5. The differences between at T1 and at S0 of dihedral angle, torsion angle, and bond length
between BN and Cz. These geometries were calculated with the same way as Figure S3.
∆(T1-S0) Toluene THF MeCN
Dihedral angle θ
BN-Cz1 -6.721 -5.700 -5.446
BN-Cz2 -12.182 -10.857 -10.287
BN-Cz3 22.650 19.515 17.958
Torsion angle φ
BN-Cz1 -1.651 -1.557 -1.539
BN-Cz2 -26.258 -23.204 -21.588
BN-Cz3 0.273 0.749 0.972
Bond Length l
BN-Cz1 -0.0034 -0.0027 -0.0023
BN-Cz2 0.0045 0.0042 0.0035
BN-Cz3 0.0097 0.0098 0.0098

Figure S1-S11
Figure S1. TR-IR signal intensity for (a) toluene solution and (b) MeCN solution as a function of
pump pulse fluence. The linearity in the pump intensity was confirmed.
Figure S2. Comparison of the TR-IR and FT-IR spectra for o-3CzBN. The TR-IR spectra were
measured at 2 ns after 355-nm photoexcitation in THF solution. The FT-IR spectra of the sample
were measured as KBr pellet.
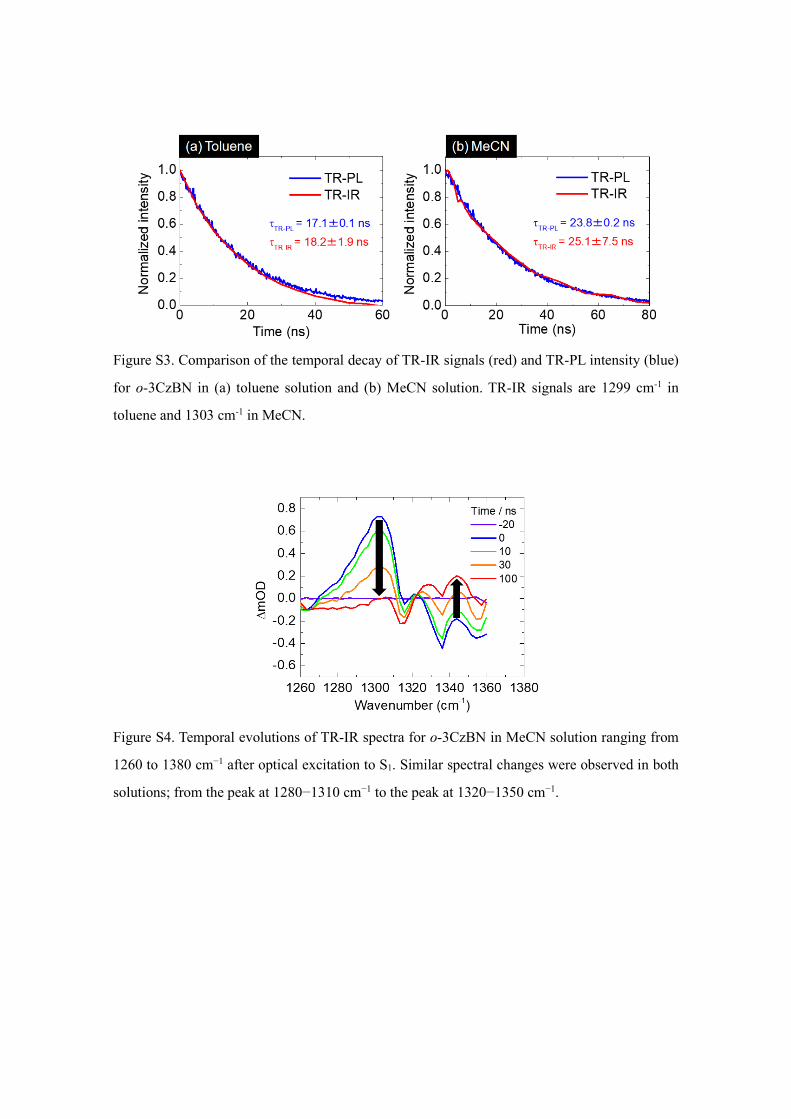
Figure S3. Comparison of the temporal decay of TR-IR signals (red) and TR-PL intensity (blue)
for o-3CzBN in (a) toluene solution and (b) MeCN solution. TR-IR signals are 1299 cm-1 in
toluene and 1303 cm-1 in MeCN.
Figure S4. Temporal evolutions of TR-IR spectra for o-3CzBN in MeCN solution ranging from
1260 to 1380 cm−1 after optical excitation to S1. Similar spectral changes were observed in both
solutions; from the peak at 1280−1310 cm−1 to the peak at 1320−1350 cm−1.
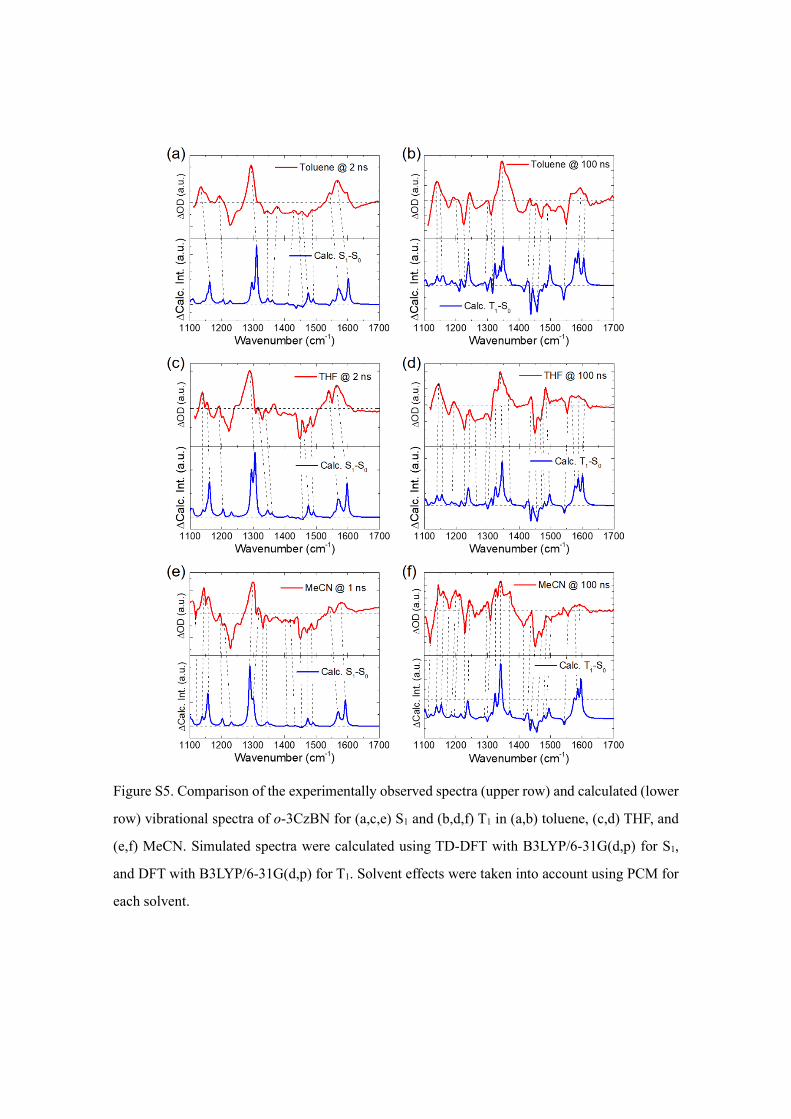
Figure S5. Comparison of the experimentally observed spectra (upper row) and calculated (lower
row) vibrational spectra of o-3CzBN for (a,c,e) S1 and (b,d,f) T1 in (a,b) toluene, (c,d) THF, and
(e,f) MeCN. Simulated spectra were calculated using TD-DFT with B3LYP/6-31G(d,p) for S1,
and DFT with B3LYP/6-31G(d,p) for T1. Solvent effects were taken into account using PCM for
each solvent.
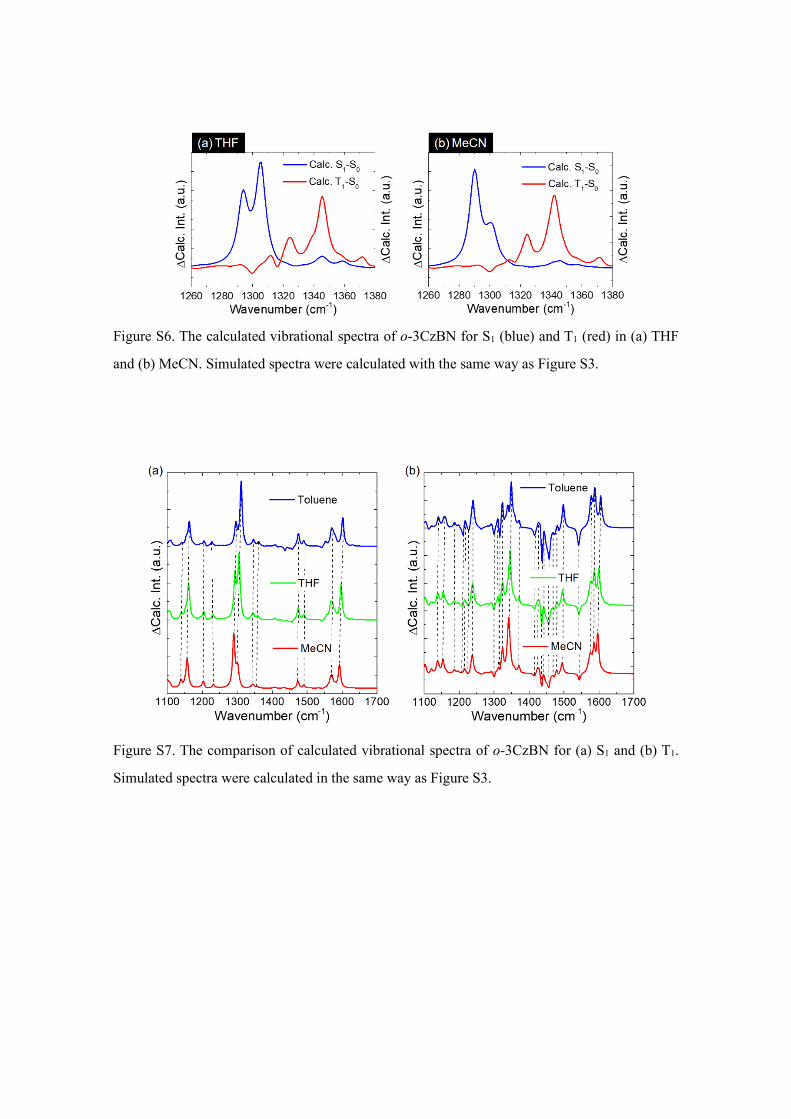
Figure S6. The calculated vibrational spectra of o-3CzBN for S1 (blue) and T1 (red) in (a) THF
and (b) MeCN. Simulated spectra were calculated with the same way as Figure S3.
Figure S7. The comparison of calculated vibrational spectra of o-3CzBN for (a) S1 and (b) T1.
Simulated spectra were calculated in the same way as Figure S3.
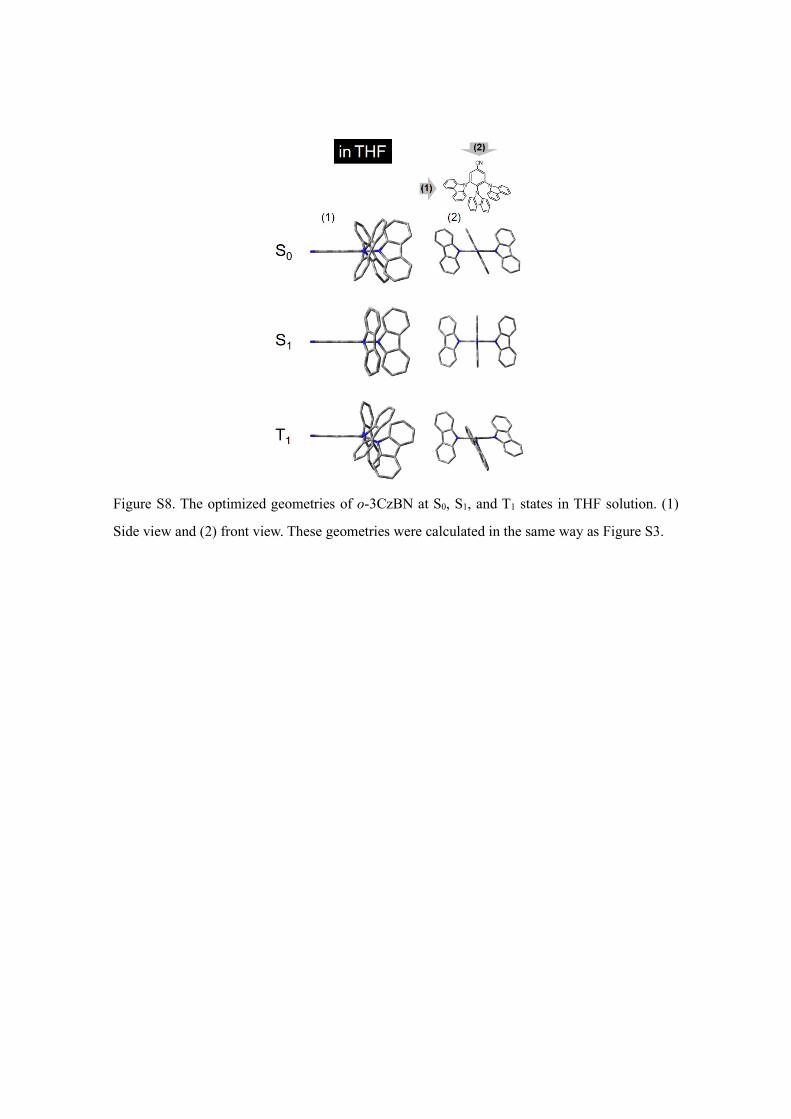
Figure S8. The optimized geometries of o-3CzBN at S0, S1, and T1 states in THF solution. (1)
Side view and (2) front view. These geometries were calculated in the same way as Figure S3.
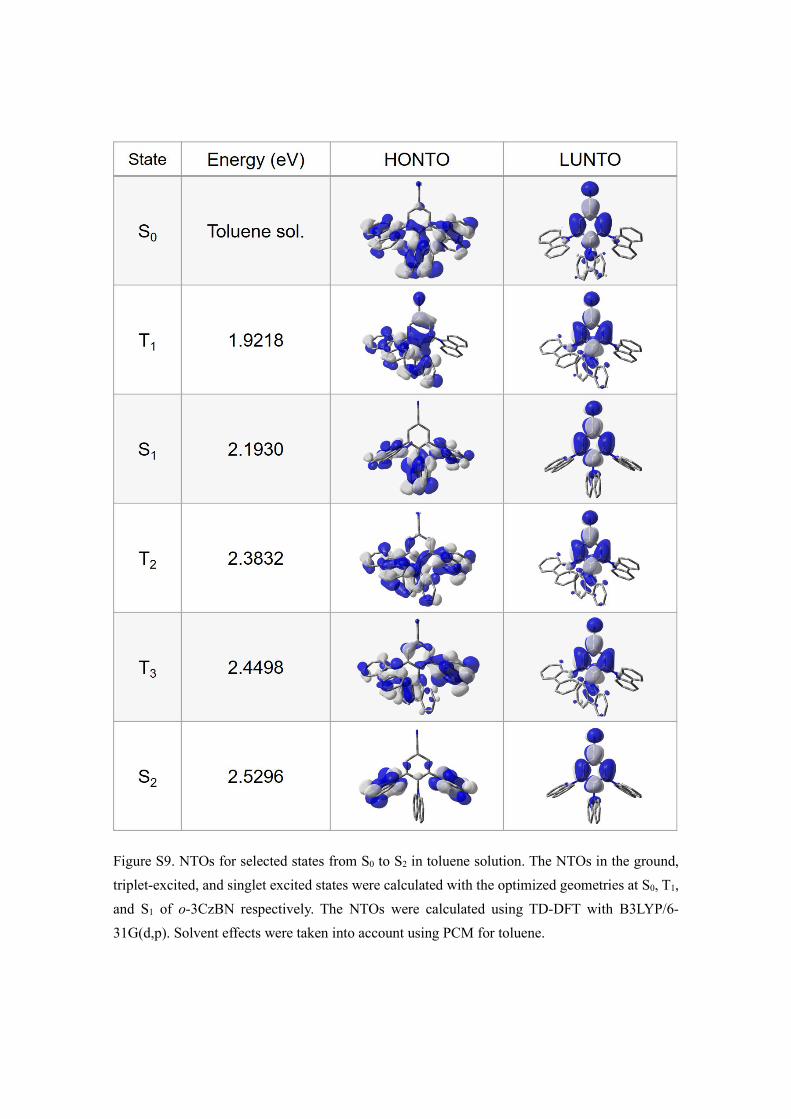
Figure S9. NTOs for selected states from S0 to S2 in toluene solution. The NTOs in the ground, triplet-excited, and singlet excited states were calculated with the optimized geometries at S0, T1, and S1 of o-3CzBN respectively. The NTOs were calculated using TD-DFT with B3LYP/6-31G(d,p). Solvent effects were taken into account using PCM for toluene.

Figure S10. NTOs for selected states from S0 to S2 in THF solution. The NTOs in the ground, triplet excited, and singlet excited states were calculated with the optimized geometries at S0, T1, and S1 of o-3CzBN respectively. The NTOs were calculated using TD-DFT with B3LYP/6-31G(d,p). Solvent effects were taken into account using PCM for THF.
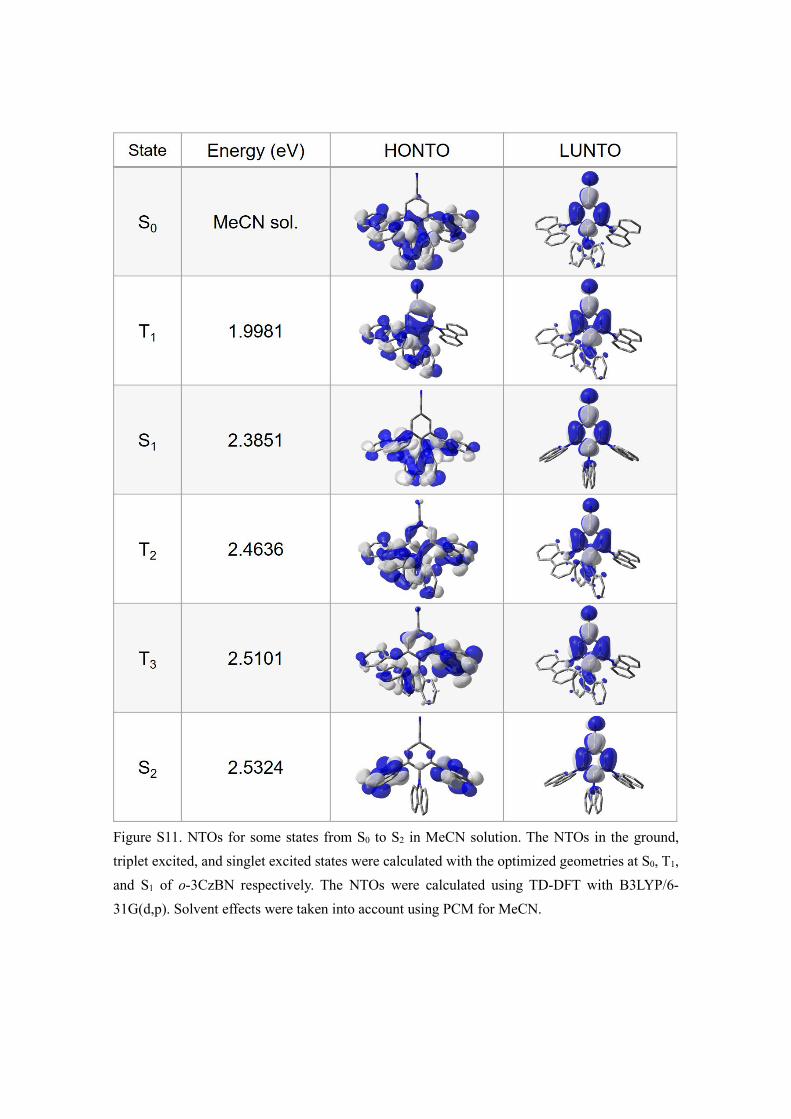
Figure S11. NTOs for some states from S0 to S2 in MeCN solution. The NTOs in the ground, triplet excited, and singlet excited states were calculated with the optimized geometries at S0, T1, and S1 of o-3CzBN respectively. The NTOs were calculated using TD-DFT with B3LYP/6-31G(d,p). Solvent effects were taken into account using PCM for MeCN.

References
1. Hosokai, T. et al. Evidence and mechanism of efficient thermally activated delayed
fluorescence promoted by delocalized excited states. Science Advances 3, e1603282
(2017).

download fileview on ChemRxiv200411_CzBN_TR-IR_Solvent_CPL(SI)_MS3_KO.pdf (1.51 MiB)