solutions to quick quizzes
TRANSCRIPT

Solutions to Quick Quizzes
1
Chapter 11. There are many possible answers.
2. There are many possible answers.
3. The three principles that describe how the economy as a whole works are: (1) a country’s standard of living depends on its ability to produce goods and services; (2) prices rise when the govern-ment prints too much money; and (3) society faces a short-run trade-off between inflation and unem-ployment. A country’s standard of living depends largely on the productivity of its workers, which in turn depends on the education of its workers and the access its workers have to the necessary tools and technology. Prices rise when the government prints too much money because more money in circulation reduces the value of money, causing inflation. Society faces a short-run trade-off between inflation and unemployment that is only temporary. Policymakers have some short-term ability to exploit this relationship using vari-ous policy instruments.
Chapter 21. Economics is like a science because
economists devise theories, collect data, and analyze the data in an attempt to verify or refute their theories. In other words, eco-nomics is based on the scientific method.
Figure 1 shows the production possibilities frontier for a society that produces food and clothing. Point A is an efficient point (on
the frontier), point B is an inef-ficient point (inside the frontier), and point C is an infeasible point (outside the frontier).
B
A
Quantity of Food Produced
Qua
ntit
y of
Clo
thin
g P
rodu
ced
C
Figure 1
The effects of a drought are shown in Figure 2. The drought reduces the amount of food that can be produced, shifting the production possibilities frontier inward.
Quantity of Food Produced
Qua
ntit
y of
Clo
thin
g P
rodu
ced
PPF2 PPF1
Figure 2
Microeconomics is the study of how households and firms make decisions and how they interact in markets. Macroeconomics is the study of economy-wide phenom-ena, including inflation, unem-ployment, and economic growth.
2. An example of a positive state-ment is “a higher price of coffee causes me to buy more tea.” It is a positive statement because it is a claim that describes the world as it is. An example of a norma-tive statement is “the government should restrain coffee prices.” It is a normative statement because it is a claim that prescribes how the world should be. Many other examples are possible.
Parts of the government that regularly rely on advice from economists are the Department of the Treasury in designing tax policy, the Department of Labor in analyzing data on the employ-ment situation, the Department of Justice in enforcing the nation’s antitrust laws, the Congressional Budget Office in evaluating policy proposals, and the Federal Reserve in analyzing economic develop-ments. Many other answers are possible.
3. Economic advisers to the president might disagree about a question of policy because of differences in scientific judgments or differences in values.
Chapter 31. Figure 1 shows Robinson Crusoe’s
production possibilities frontier
CHE-MANKMACRO-10-0706-MACRO SOLUTIONS.indd 1CHE-MANKMACRO-10-0706-MACRO SOLUTIONS.indd 1 28/01/11 6:08 PM28/01/11 6:08 PM

2 SOLUTIONS TO QUICK QUIZZES
for gathering coconuts and catch-ing fish. If Crusoe lives by himself, this frontier limits his consump-tion of coconuts and fish, but if he can trade with natives on the island, he will possibly be able to consume at a point outside his production possibilities frontier.
Coconuts Gathered
Fish
Cau
ght
Figure 1
2. Crusoe’s opportunity cost of catching one fish is 10 coconuts, since he can gather 10 coconuts in the same amount of time it takes to catch one fish. Friday’s oppor-tunity cost of catching one fish is 15 coconuts, since he can gather 30 coconuts in the same amount of time it takes to catch two fish. Friday has an absolute advantage in catching fish, since he can catch two per hour, while Crusoe can catch only one per hour. But Cru-soe has a comparative advantage in catching fish, since his opportu-nity cost of catching a fish is less than Friday’s.
3. If the world’s fastest typist hap-pens to be trained in brain sur-gery, she should hire a secretary because the secretary will give up less for each hour spent typing. Although the brain surgeon has an absolute advantage in typing, the secretary has a comparative advantage in typing because of the lower opportunity cost of typing.
Chapter 41. A market is a group of buyers
(who determine demand) and a
group of sellers (who determine supply) of a particular good or service. A perfectly competitive market is one in which there are many buyers and many sellers of an identical product so that each has a negligible impact on the market price.
2. Here is an example of a monthly demand schedule for pizza:
Price of Number of Pizza Pizza Slice Slices Demanded
$0.00 10 0.25 9 0.50 8 0.75 7 1.00 6 1.25 5 1.50 4 1.75 3 2.00 2 2.25 1 2.50 0
The demand curve is graphed in Figure 1.
Price
of P
izza
Slic
e
0
$2.50
2.00
1.50
1.00
0.50
2 4 6 8 10
Demand
Number of PizzaSlices Demanded
Figure 1
Examples of things that would shift the demand curve include changes in income, prices of related goods like soda or hot dogs, tastes, expectations about future income or prices, and the number of buyers.
A change in the price of pizza would not shift this demand curve; it would only lead to a movement from one point to
another along the same demand curve.
3. Here is an example of a monthly supply schedule for pizza:
Price of Number of Pizza Pizza Slice Slices Supplied
$0.00 0 0.25 100 0.50 200 0.75 300 1.00 400 1.25 500 1.50 600 1.75 700 2.00 800 2.25 900 2.50 1000
The supply curve is graphed in Figure 2.
Price
of P
izza
Slic
e
0
$2.50
2.00
1.50
1.00
0.50
200 400 600 800 1000
Supply
Number of PizzaSlices Supplied
Figure 2
Examples of things that would shift the supply curve include changes in prices of inputs like tomato sauce and cheese, changes in technology like more efficient pizza ovens or automatic dough makers, changes in expectations about the future price of pizza, or a change in the number of sellers.
A change in the price of pizza would not shift this supply curve; it would only lead to a movement from one point to another along the same supply curve.
4. If the price of tomatoes rises, the supply curve for pizza shifts to the left because there has been an increase in the price of an input
CHE-MANKMACRO-10-0706-MACRO SOLUTIONS.indd 2CHE-MANKMACRO-10-0706-MACRO SOLUTIONS.indd 2 28/01/11 6:08 PM28/01/11 6:08 PM

3SOLUTIONS TO QUICK QUIZZES
into pizza production, but there is no shift in demand. The shift to the left of the supply curve causes the equilibrium price to rise and the equilibrium quantity to decline, as Figure 3 shows.
If the price of hamburgers falls, the demand curve for pizza shifts to the left because the lower price of hamburgers will lead consum-ers to buy more hamburgers and fewer pizzas, but there is no shift in supply. The shift to the left of the demand curve causes the equilibrium price to fall and the equilibrium quantity to decline, as Figure 4 shows.
Price
of P
izza
Quantity of PizzaD
S1
S2
Figure 3
Price
of P
izza
Quantity of Pizza
S
D1
D2
Figure 4
Chapter 51. The price elasticity of demand is a
measure of how much the quantity demanded of a good responds to a change in the price of that good, computed as the percent-age change in quantity demanded
divided by the percentage change in price.
When demand is inelastic (a price elasticity less than 1), a price increase raises total revenue, and a price decrease reduces total revenue. When demand is elastic (a price elasticity greater than 1), a price increase reduces total reve-nue, and a price decrease increases total revenue. When demand is unit elastic (a price elasticity equal to 1), a change in price does not affect total revenue.
2. The price elasticity of supply is a measure of how much the quan-tity supplied of a good responds to a change in the price of that good, computed as the percent-age change in quantity supplied divided by the percentage change in price.
The price elasticity of supply might be different in the long run than in the short run because over short periods of time, firms cannot easily change the sizes of their factories to make more or less of a good. Thus, in the short run, the quantity supplied is not very responsive to the price. However, over longer periods, firms can build new factories, expand exist-ing factories, close old factories, or they can enter or exit a market. So, in the long run, the quantity sup-plied can respond substantially to a change in price.
3. A drought that destroys half of all farm crops could be good for farmers (at least those unaffected by the drought) if the demand for the crops is inelastic. The shift to the left of the supply curve leads to a price increase that will raise total revenue if the price elasticity of demand is less than 1.
No one farmer would have an incentive to destroy his crops in the absence of a drought because he takes the market price as given. Only if all farmers destroyed a portion of their crops together, for example through a government program, would this plan work to make farmers better off.
Chapter 61. A price ceiling is a legal maximum
on the price at which a good can be sold. Examples of price ceil-ings include rent controls, price controls on gasoline in the 1970s, and price ceilings on water during a drought. A price floor is a legal minimum on the price at which a good can be sold. Examples of price floors include the minimum wage and farm price supports. A price ceiling leads to a shortage, if the ceiling is binding, because suppliers will not produce enough goods to meet demand. A price floor leads to a surplus, if the floor is binding, because suppli-ers produce more goods than are demanded.
2. With no tax, as shown in Figure 1, the demand curve is D
1 and the
supply curve is S. The equilibrium price is P
1 and the equilibrium
quantity is Q1. If the tax is imposed
on car buyers, the demand curve shifts downward by the amount of the tax ($1,000) to D
2. The
downward shift in the demand curve leads to a decline in the price received by sellers to P
2 and a
decline in the equilibrium quan-tity to Q
2. The price received by
sellers declines by P1 – P
2, shown
in the figure as ΔPS. Buyers pay a
total of P2 + $1,000, an increase in
what they pay of (P2 + $1,000) – P
1,
shown in the figure as ΔPB.
P2 �
$1,000
P1
P2
Quantityof Cars
Pri
ceof
Car
s
Q1Q2
�PB
�PS
D1
D2
S
Figure 1
CHE-MANKMACRO-10-0706-MACRO SOLUTIONS.indd 3CHE-MANKMACRO-10-0706-MACRO SOLUTIONS.indd 3 28/01/11 6:08 PM28/01/11 6:08 PM

4 SOLUTIONS TO QUICK QUIZZES
If the tax is imposed on car sellers, as shown in Figure 2, the sup-ply curve shifts upward by the amount of the tax ($1,000) to S
2.
The upward shift in the supply curve leads to a rise in the price paid by buyers to P
2 and a decline
in the equilibrium quantity to Q2.
The price paid by buyers increases by P
2 – P
1, shown in the figure as
ΔPB. Sellers receive P
2 – 1,000, a
decrease in what they receive by P
1 – (P
2 – $1,000), shown in the
figure as ΔPS.
P2 �
$1,000
P1
P2
Quantityof Cars
Price
of C
ars
Q1Q2
�PB
�PS
S2
S1
D
Figure 2
Chapter 71. Figure 1 (on the next page) shows
the demand curve for turkey. The price of turkey is P
1 and the
consumer surplus that results from that price is denoted CS. Consumer surplus is the amount a buyer is willing to pay for a good minus the amount the buyer actually pays for it. It measures the benefit to buyers of participating in a market.
Quantity of Turkey
Pri
ce o
f Tu
rkey
Demand
P1
CS
Figure 1
Quantity of Turkey
Price
of
Turk
ey
Supply
PS
P1
Figure 2
2. Figure 2 shows the supply curve for turkey. The price of turkey is P
1 and the producer surplus that
results from that price is denoted PS. Producer surplus is the amount sellers are paid for a good minus the sellers’ cost of provid-ing it (measured by the supply curve). It measures the benefit to sellers of participating in a market.
Price
of Tu
rkey
P1
Quantity of Turkey
Supply
Demand
PS
CS
Figure 3
3. Figure 3 shows the supply and demand for turkey. The price of turkey is P
1, consumer surplus is
CS, and producer surplus is PS. Producing more turkeys than the equilibrium quantity would lower total surplus because the value to the marginal buyer would be lower than the cost to the marginal seller on those additional units.
Chapter 81. Figure 1 shows the supply and
demand curves for cookies, with equilibrium quantity Q
1 and equi-
librium price P1. When the govern-
ment imposes a tax on cookies, the price to buyers rises to P
B, the price
received by sellers declines to PS,
and the equilibrium quantity falls to Q
2. The deadweight loss is the
triangular area below the demand curve and above the supply curve between quantities Q
1 and Q
2. The
deadweight loss shows the fall in total surplus that results from the tax.
PB
DWLDWL
P1
Quantityof Cookies
Q2
Price
of
Coo
kies
PS
Q1
Demand
Supply
Figure 1
2. The deadweight loss of a tax is greater the greater is the elasticity of demand. Therefore, a tax on beer would have a larger deadweight loss than a tax on milk because the demand for beer is more elastic than the demand for milk.
3. If the government doubles the tax on gasoline, the revenue from the gasoline tax could rise or fall depending on whether the size of the tax is on the upward or down-ward sloping portion of the Laffer curve. However, if the government doubles the tax on gasoline, you can be sure that the deadweight loss of the tax rises because dead-weight loss always rises as the tax rate rises.
CHE-MANKMACRO-10-0706-MACRO SOLUTIONS.indd 4CHE-MANKMACRO-10-0706-MACRO SOLUTIONS.indd 4 28/01/11 6:08 PM28/01/11 6:08 PM
5SOLUTIONS TO QUICK QUIZZES
Chapter 9 1. Since wool suits are cheaper in
neighboring countries, Autarka would import suits if it were to allow free trade.
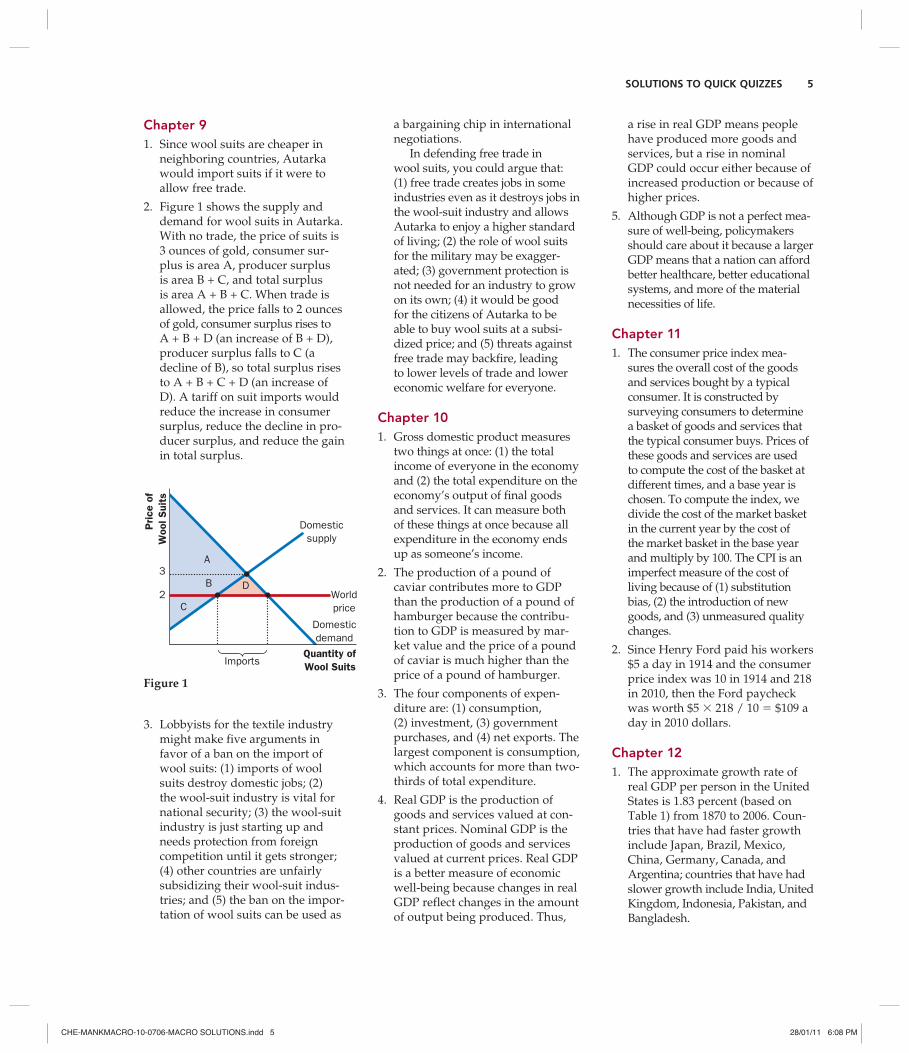
2. Figure 1 shows the supply and demand for wool suits in Autarka. With no trade, the price of suits is 3 ounces of gold, consumer sur-plus is area A, producer surplus is area B + C, and total surplus is area A + B + C. When trade is allowed, the price falls to 2 ounces of gold, consumer surplus rises to A + B + D (an increase of B + D), producer surplus falls to C (a decline of B), so total surplus rises to A + B + C + D (an increase of D). A tariff on suit imports would reduce the increase in consumer surplus, reduce the decline in pro-ducer surplus, and reduce the gain in total surplus.
C
B D
A
Price
of
Woo
l Sui
ts
3
Quantity ofWool Suits
Domesticsupply
Domesticdemand
2 Worldprice
Imports
Figure 1
3. Lobbyists for the textile industry might make five arguments in favor of a ban on the import of wool suits: (1) imports of wool suits destroy domestic jobs; (2) the wool-suit industry is vital for national security; (3) the wool-suit industry is just starting up and needs protection from foreign competition until it gets stronger; (4) other countries are unfairly subsidizing their wool-suit indus-tries; and (5) the ban on the impor-tation of wool suits can be used as
a bargaining chip in international negotiations.
In defending free trade in wool suits, you could argue that: (1) free trade creates jobs in some industries even as it destroys jobs in the wool-suit industry and allows Autarka to enjoy a higher standard of living; (2) the role of wool suits for the military may be exagger-ated; (3) government protection is not needed for an industry to grow on its own; (4) it would be good for the citizens of Autarka to be able to buy wool suits at a subsi-dized price; and (5) threats against free trade may backfire, leading to lower levels of trade and lower economic welfare for everyone.
Chapter 101. Gross domestic product measures
two things at once: (1) the total income of everyone in the economy and (2) the total expenditure on the economy’s output of final goods and services. It can measure both of these things at once because all expenditure in the economy ends up as someone’s income.
2. The production of a pound of caviar contributes more to GDP than the production of a pound of hamburger because the contribu-tion to GDP is measured by mar-ket value and the price of a pound of caviar is much higher than the price of a pound of hamburger.
3. The four components of expen-diture are: (1) consumption, (2) investment, (3) government purchases, and (4) net exports. The largest component is consumption, which accounts for more than two-thirds of total expenditure.
4. Real GDP is the production of goods and services valued at con-stant prices. Nominal GDP is the production of goods and services valued at current prices. Real GDP is a better measure of economic well-being because changes in real GDP reflect changes in the amount of output being produced. Thus,
a rise in real GDP means people have produced more goods and services, but a rise in nominal GDP could occur either because of increased production or because of higher prices.
5. Although GDP is not a perfect mea-sure of well-being, policymakers should care about it because a larger GDP means that a nation can afford better healthcare, better educational systems, and more of the material necessities of life.
Chapter 111. The consumer price index mea-
sures the overall cost of the goods and services bought by a typical consumer. It is constructed by surveying consumers to determine a basket of goods and services that the typical consumer buys. Prices of these goods and services are used to compute the cost of the basket at different times, and a base year is chosen. To compute the index, we divide the cost of the market basket in the current year by the cost of the market basket in the base year and multiply by 100. The CPI is an imperfect measure of the cost of living because of (1) substitution bias, (2) the introduction of new goods, and (3) unmeasured quality changes.
2. Since Henry Ford paid his workers $5 a day in 1914 and the consumer price index was 10 in 1914 and 218 in 2010, then the Ford paycheck was worth $5 × 218 / 10 = $109 a day in 2010 dollars.
Chapter 121. The approximate growth rate of
real GDP per person in the United States is 1.83 percent (based on Table 1) from 1870 to 2006. Coun-tries that have had faster growth include Japan, Brazil, Mexico, China, Germany, Canada, and Argentina; countries that have had slower growth include India, United Kingdom, Indonesia, Pakistan, and Bangladesh.
CHE-MANKMACRO-10-0706-MACRO SOLUTIONS.indd 5CHE-MANKMACRO-10-0706-MACRO SOLUTIONS.indd 5 28/01/11 6:08 PM28/01/11 6:08 PM

6 SOLUTIONS TO QUICK QUIZZES
2. The four determinants of a coun-try’s productivity are: (1) physical capital, which is the stock of equip-ment and structures that are used to produce goods and services; (2) human capital, which is the knowledge and skills that work-ers acquire through education, training, and experience; (3) natural resources, which are inputs into production that are provided by nature, such as land, rivers, and mineral deposits; and (4) technolog-ical knowledge, which is society’s understanding of the best ways to produce goods and services.
3. Ways in which a government policymaker can try to raise the growth in living standards in a society include: (1) investing more current resources in the production of capital, which has the drawback of reducing the resources used for producing current consumption; (2) encouraging investment from abroad, which has the draw-back that some of the benefits of investment flow to foreigners; (3) increasing education, which has an opportunity cost in that stu-dents are not engaged in current production; (4) protecting prop-erty rights and promoting political stability, for which no drawbacks are obvious; (5) pursuing outward-oriented policies to encourage free trade, which may have the drawback of making a country more dependent on its trading partners; (6) reducing the rate of population growth, which may have the drawbacks of reducing individual freedom and lowering the rate of technological progress; and (7) encouraging research and development, which (like invest-ment) may have the drawback of reducing current consumption.
Chapter 131. A stock is a claim to partial owner-
ship in a firm. A bond is a certificate of indebtedness. They are different in numerous ways: (1) a bond pays interest (a fixed payment determined
when the bond is issued), while a stock pays dividends (a share of the firm’s profits that can increase if the firm is more profitable); (2) a bond has a fixed time to maturity, while a stock never matures; and (3) if a company that has issued both stock and bonds goes bankrupt, the bond-holders get paid off before the stock-holders, so stocks have greater risk and potentially greater return than bonds. Stocks and bonds are similar in that both are financial instru-ments that are used by companies to raise money for investment, both are traded on exchanges, both entail a degree of risk, and the returns to both are taxed (usually).
2. Private saving is the amount of income that households have left after paying their taxes and paying for their consumption. Public sav-ing is the amount of tax revenue that the government has left after paying for its spending. National saving is equal to the total income in the economy that remains after paying for consumption and gov-ernment purchases. Investment is the purchase of new capital, such as equipment or buildings.
These terms are related in two ways: (1) National saving is the sum of public saving and private saving. (2) In a closed economy, national saving equals investment.
3. If more Americans adopted a “live for today” approach to life, they would spend more and save less. This would shift the supply curve to the left in the market for loan-able funds. At the new equilibrium, there would be less saving and investment and a higher interest rate.
Chapter 141. The present value of $150 to be
received in 10 years if the interest rate is 7 percent is $150 / (1.07)10 = $76.25.
2. There are three ways in which a risk-averse person may reduce the risk he faces: (1) purchase
insurance, (2) diversify his port-folio, or (3) choose safer alterna-tives by accepting a lower rate of return.
3. No. According to the efficient markets hypothesis, the price of a share of stock should reflect all available information about its value. Thus, the stocks on this list should perform no better on aver-age than other stocks listed on the stock exchange.
Chapter 151. The unemployment rate is mea-
sured through a survey of 60,000 households to determine the percentage of the labor force that is unemployed. The unemployment rate overstates the amount of job-lessness because some of those who report being unemployed may not, in fact, be trying hard to find a job. But the unemployment rate may understate the amount of jobless-ness because discouraged workers are considered not in the labor force even though they are workers without jobs.
2. An increase in the world price of oil increases the amount of frictional unemployment as oil-producing firms increase output and employment, but other firms, such as those in the auto industry, reduce output and employment. The sectoral shift from the auto industry to oil firms causes higher frictional unemployment for a time until workers have shifted from the auto industry to the oil industry. Although no increase in unemployment is really desirable, this type of frictional unemploy-ment is a natural outcome of the reallocation of resources between different sectors. Public policies that might affect the unemploy-ment caused by this change in the price of oil include government-run employment agencies, which can help autoworkers move into the oil industry, job-training programs to help workers adapt to a new
CHE-MANKMACRO-10-0706-MACRO SOLUTIONS.indd 6CHE-MANKMACRO-10-0706-MACRO SOLUTIONS.indd 6 28/01/11 6:08 PM28/01/11 6:08 PM

7SOLUTIONS TO QUICK QUIZZES
industry, and unemployment insurance, which keeps workers from suffering economic hardship while changing from one industry to another.
3. Figure 1 shows the supply curve (S) and the demand curve (D) for labor. The wage (W) is above the equilibrium wage (W
E). The result
is unemployment, equal to the amount by which the quantity of labor supplied (L
S) exceeds the
quantity of labor demanded (LD).
WE
Quantityof Labor
LE
unemploymentS
D
Wag
e
W
LD LS
Figure 1
4. A union in the auto industry raises the wages of workers employed by General Motors and Ford by threatening to strike. To prevent the costs of a strike, the firms generally pay higher wages than they would if there were no union. However, the higher wages reduce employment at General Motors and Ford. The unemployed autoworkers seek jobs elsewhere, reducing wages and increasing employment in the nonunion sector.
5. There are four reasons that firms might find it profitable to pay wages above the level that balances the quantity of labor supplied and the quantity of labor demanded: (1) to ensure that workers are in good health so they will be more productive; (2) to reduce worker turnover because it is costly to hire new workers; (3) to make workers eager to keep their jobs, thus
discouraging them from shirking; and (4) to attract a better pool of workers.
Chapter 161. The three functions of money are:
(1) medium of exchange; (2) unit of account; and (3) store of value. Money is a medium of exchange because money is the item people use to purchase goods and ser-vices. Money is a unit of account because it is the yardstick people use to post prices and record debts. Money is a store of value because people use it to transfer purchasing power from the pres-ent to the future.
2. The primary responsibilities of the Federal Reserve are to regulate banks, to ensure the health of the banking system, and to control the quantity of money that is made available in the economy. If the Fed wants to increase the supply of money, it usually does so by creating dollars and using them to purchase government bonds from the public in the nation’s bond markets.
3. Banks create money when they hold a fraction of their deposits in reserve and lend out the remain-der. If the Fed wanted to use all three of its tools to decrease the money supply, it would: (1) sell government bonds from its port-folio in the open market to reduce the number of dollars in circula-tion; (2) increase reserve require-ments to reduce the money created by banks; and (3) increase the discount rate to discourage banks from borrowing reserves from the Fed.
Chapter 171. When the government of a country
increases the growth rate of the money supply from 5 percent per year to 50 percent per year, the average level of prices will start rising very quickly, as predicted by the quantity theory of money.
Nominal interest rates will increase dramatically as well, as predicted by the Fisher effect. The government may be increasing the money supply to finance its expenditures.
2. Six costs of inflation are: (1) shoe-leather costs; (2) menu costs; (3) relative-price variability and the misallocation of resources; (4) inflation-induced tax dis-tortions; (5) confusion and inconvenience; and (6) arbi-trary redistributions of wealth. Shoeleather costs arise because inflation causes people to spend resources going to the bank more often. Menu costs occur when people spend resources changing their posted prices. Relative-price variability occurs because as general prices rise, a fixed dol-lar price translates into a declin-ing relative price, so the relative prices of goods are constantly changing, causing a misallocation of resources. The combination of inflation and taxation causes distortions in incentives because people are taxed on their nominal capital gains and interest income instead of their real income from these sources. Inflation causes confusion and inconvenience because it reduces money’s ability to function as a unit of account. Unexpected inflation redistributes wealth between borrowers and lenders.
Chapter 181. Net exports are the value of a
nation’s exports minus the value of its imports, also called the trade balance. Net capital outflow is the purchase of foreign assets by domestic residents minus the purchase of domestic assets by foreigners. Net exports equal net capital outflow.
2. The nominal exchange rate is the rate at which a person can trade the currency of one country for the currency of another. The real
CHE-MANKMACRO-10-0706-MACRO SOLUTIONS.indd 7CHE-MANKMACRO-10-0706-MACRO SOLUTIONS.indd 7 28/01/11 6:08 PM28/01/11 6:08 PM

8 SOLUTIONS TO QUICK QUIZZES
exchange rate is the rate at which a person can trade the goods and services of one country for the goods and services of another. They are related through the expression: real exchange rate equals nominal exchange rate times domestic price divided by foreign price.
If the nominal exchange rate goes from 100 to 120 yen per dollar, the dollar has appreciated because a dollar now buys more yen.
3. Because Spain has had high inflation and Japan has had low inflation, the number of Spanish pesetas a person can buy with Japanese yen has increased.
Chapter 191. The supply of loanable funds
comes from national saving. The demand for loanable funds comes from domestic investment and net capital outflow. The supply in the market for foreign-currency exchange comes from net capital outflow. The demand in the mar-ket for foreign-currency exchange comes from net exports.
2. The two markets in the model of the open economy are the market for loanable funds and the market for foreign-currency exchange. These markets determine two relative prices: (1) the market for loanable funds determines the real interest rate and (2) the market for foreign-currency exchange deter-mines the real exchange rate.
3. If Americans decided to spend a smaller fraction of their incomes, the increase in saving would shift the supply curve for loanable funds to the right, as shown in Figure 1. The decline in the real interest rate increases net capital outflow and shifts the supply of dollars to the right in the market for foreign-currency exchange. The result is a decline in the real exchange rate. Since the real interest rate is lower, domestic investment increases. Since the real exchange rate declines, net
exports increase and the trade balance moves toward surplus. Overall, saving and domestic investment increase, the real inter-est rate and real exchange rate decrease, and the trade balance moves toward surplus.
Rea
l Int
eres
t R
ate
Rea
l Int
eres
t R
ate
Quantity of Dollars
Quantity of Loanable Funds Net Capital Outflow
Rea
l Exc
hang
e R
ate
r2
E2
E1
Demand
Demand
r1
Net capitaloutflow
S2S1
S1 S2
Figure 1
Chapter 201. Three key facts about economic
fluctuations are: (1) economic fluc-tuations are irregular and unpre-dictable; (2) most macroeconomic quantities fluctuate together; and (3) as output falls, unemployment rises.
Economic fluctuations are irreg-ular and unpredictable, as you can see by looking at a graph of real GDP over time. Some recessions are close together and others are far apart. There appears to be no recurring pattern.
Most macroeconomic quantities fluctuate together. In recessions, real GDP, consumer spending, investment spending, corporate profits, and other macroeconomic variables decline or grow much more slowly than during eco-nomic expansions. However, the variables fluctuate by different amounts over the business cycle, with investment varying much more than other variables.
As output falls, unemploy-ment rises, because when firms want to produce less, they lay off
workers, thus causing a rise in unemployment.
2. The economy’s behavior in the short run differs from its behav-ior in the long run because the assumption of monetary neutrality applies only to the long run, not the short run. In the short run, real and nominal variables are highly intertwined. Figure 1 shows the model of aggregate demand and aggregate supply. The horizontal axis shows the quantity of output, and the vertical axis shows the price level.
Equilibriumoutput
Quantity ofOutput
Price
Lev
el
Equilibriumprice level
Aggregatesupply
Aggregatedemand
Figure 1
3. The aggregate-demand curve slopes downward for three rea-sons. First, when prices fall, the value of dollars in people’s wallets and bank accounts rises, so they are wealthier. As a result, they spend more, thereby increasing the quantity of goods and services demanded. Second, when prices fall, people need less money to make their purchases, so they lend more out, which reduces the inter-est rate. The lower interest rate encourages businesses to invest more, increasing the quantity of goods and services demanded. Third, since lower prices lead to a lower interest rate, some U.S. investors will invest abroad, supplying dollars to the foreign-exchange market, thus causing the dollar to depreciate. The decline in the real exchange rate causes net exports to increase, which
CHE-MANKMACRO-10-0706-MACRO SOLUTIONS.indd 8CHE-MANKMACRO-10-0706-MACRO SOLUTIONS.indd 8 28/01/11 6:08 PM28/01/11 6:08 PM

9SOLUTIONS TO QUICK QUIZZES
increases the quantity of goods and services demanded. Any event that alters the level of consumption, investment, govern-ment purchases, or net exports at a given price level will lead to a shift in aggregate demand. An increase in expenditure will shift the aggregate-demand curve to the right, while a decline in expen-diture will shift the aggregate-demand curve to the left.
4. The long-run aggregate-supply curve is vertical because the price level does not affect the long-run determinants of real GDP, which include supplies of labor, capital, natural resources, and the level of available technology. This is just an application of the classical dichotomy and mon-etary neutrality. There are three reasons the short-run aggregate-supply curve slopes upward. First, the sticky-wage theory suggests that because nominal wages are slow to adjust, a decline in the price level means real wages are higher, so firms hire fewer workers and produce less, causing the quantity of goods and services supplied to decline. Sec-ond, the sticky-price theory sug-gests that the prices of some goods and services are slow to change. If some economic event causes the overall price level to decline, the relative prices of goods whose prices are sticky will rise and the quantity of those goods sold will decline, leading firms to cut back on production. Thus, a lower price level reduces the quantity of goods and services supplied. Third, the misperceptions theory suggests that changes in the overall price level can temporarily mislead sup-pliers. When the price level falls below the level that was expected, suppliers think that the relative prices of their products have declined, so they produce less. Thus, a lower price level reduces the quantity of goods and ser-vices supplied. The long-run and short-run aggregate-supply curves
will both shift if the supplies of labor, capital, or natural resources change or if technology changes. A change in the expected price level will shift the short-run aggregate-supply curve but will have no effect on the long-run aggregate-supply curve.
5. When a popular presidential candidate is elected, causing people to be more confident about the future, they will spend more, causing the aggregate-demand curve to shift to the right, as shown in Figure 2. The economy begins at point A with aggregate-demand curve AD
1 and short-run
aggregate-supply curve AS1. The
equilibrium has price level P1 and
output level Y1. Increased confi-
dence about the future causes the aggregate-demand curve to shift to AD
2. The economy moves to
point B, with price level P2 and
output level Y2. Over time, price
expectations adjust and the short-run aggregate-supply curve shifts up to AS
2 and the economy moves
to equilibrium at point C, with price level P
3 and output level Y
1.
Quantityof Output
Y1 Y2
Price
Lev
el
AS1
Long-runaggregate
supply
AD1
A
B
C
P2
P3
P1
AS2
AD2
Figure 2
Chapter 211. According to the theory of liquid-
ity preference, the interest rate adjusts to balance the supply and demand for money. Therefore, a decrease in the money supply will increase the equilibrium interest rate. This decrease in the money
supply reduces aggregate demand because the higher interest rate causes households to buy fewer houses, reducing the demand for residential investment, and causes firms to spend less on new facto-ries and new equipment, reducing business investment.
2. If the government reduces spend-ing on highway construction by $10 billion, the aggregate-demand curve shifts to the left because gov-ernment purchases are lower. The shift to the left of the aggregate-demand curve could be more than $10 billion if the multiplier effect outweighs the crowding-out effect, or it could be less than $10 billion if the crowding-out effect outweighs the multiplier effect.
3. If people become pessimistic about the future, they will spend less, causing the aggregate-demand curve to shift to the left. If the Fed wants to stabilize aggregate demand, it should increase the money supply. The increase in the money supply will cause the inter-est rate to decline, thus stimulating residential and business invest-ment. The Fed might choose not to do this because by the time the policy action takes effect, the long lag time might mean the economy would have recovered on its own, and the increase in the money sup-ply will cause inflation.
Chapter 221. The Phillips curve is shown in
Figure 1.
Unemployment Rate
Infla
tion
Rat
e
Phillips curve
Figure 1
CHE-MANKMACRO-10-0706-MACRO SOLUTIONS.indd 9CHE-MANKMACRO-10-0706-MACRO SOLUTIONS.indd 9 28/01/11 6:08 PM28/01/11 6:08 PM

10 SOLUTIONS TO QUICK QUIZZES
To see how policy can move the economy from a point with high inflation to a point with low infla-tion, suppose the economy begins at point A in Figure 2. If policy is used to reduce aggregate demand (such as a decrease in the money supply or a decrease in govern-ment purchases), the aggregate-demand curve shifts from AD
1
to AD2, and the economy moves
from point A to point B with lower inflation, a reduction in real GDP, and an increase in the unemploy-ment rate.
Unemployment Rate
Infla
tion
Rat
e
A
B
Phillips curve
Quantity of Output
AS
B
A
AD2
AD1
Price
Lev
el
Figure 2
2. Figure 3 shows the short-run Phil-lips curve and the long-run Phil-lips curve. The curves are different because in the long run, monetary policy has no effect on unemploy-ment, which tends toward its natural rate. However, in the short run, monetary policy can affect the unemployment rate. An increase in the growth rate of money raises actual inflation above expected inflation, causing firms to produce more since the short-run aggregate
supply curve is positively sloped, which reduces unemployment temporarily.
Unemployment Rate
Infla
tion
Rat
e
Short-runPhillips curve
Long-runPhillips curve
Figure 3
3. Examples of favorable shocks to aggregate supply include improved productivity and a decline in oil prices. Either shock shifts the aggregate-supply curve to the right, increasing output and reducing the price level, moving the economy from point A to point B in Figure 4. As a result, the Phillips curve shifts to the left, as the figure shows.
Unemployment Rate
Infla
tion
Rat
e
A
B
PC1
PC2
Quantity of Output
Price
Lev
el
P1
P2
AD
A
B
AS1
AS2
Y1 Y2
Figure 4
4. The sacrifice ratio is the number of percentage points of annual output lost in the process of reduc-ing inflation by 1 percentage point. The credibility of the Fed’s com-mitment to reduce inflation might affect the sacrifice ratio because it affects the speed at which expectations of inflation adjust. If the Fed’s commitment to reduce inflation is credible, people will reduce their expectations of infla-tion quickly, the short-run Phillips curve will shift downward, and the cost of reducing inflation will be low in terms of lost output. But if the Fed is not credible, people will not reduce their expectations of inflation quickly, and the cost of reducing inflation will be high in terms of lost output.
Chapter 231. Monetary and fiscal policies work
with a lag. Monetary policy works with a lag because it affects spend-ing for residential and business investment, but spending plans for such investment are often set in advance. Thus, it takes time for changes in monetary policy, working through interest rates, to affect investment. Fiscal policy works with a lag because of the long political process that governs changes in spending and taxes.
These lags matter for the choice between active and passive policy because if the lags are long, policy must be set today for conditions far in the future, about which we can only guess. Since economic conditions may change between the time a policy is implemented and when it takes effect, policy changes may be destabilizing. Thus, long lags suggest a policy that is passive rather than active.
2. A dollar of additional government spending has a larger effect on GDP than a dollar of tax cuts. This occurs because, in general, some of the dollar tax cut will end up as saving.
CHE-MANKMACRO-10-0706-MACRO SOLUTIONS.indd 10CHE-MANKMACRO-10-0706-MACRO SOLUTIONS.indd 10 28/01/11 6:08 PM28/01/11 6:08 PM

11SOLUTIONS TO QUICK QUIZZES
3. There are many possible rules for monetary policy. One example is a rule that sets money growth at 3 percent per year. This rule might be better than discretionary policy because it prevents a political busi-ness cycle and the time inconsis-tency problem. It might be worse than discretionary policy because it would tie the Fed’s hands when there are shocks to the economy. For example, in response to a stock-market crash, the rule would prevent the Fed from easing monetary policy, even if it saw the economy slipping into recession.
4. The benefits of reducing inflation to zero include: (1) reducing shoe-leather costs; (2) reducing menu costs; (3) reducing the variability of relative prices; (4) preventing unintended changes in tax liabili-ties due to nonindexation of the
tax code; (5) eliminating the confu-sion and inconvenience resulting from a changing unit of account; and (6) preventing arbitrary redistribution of wealth associated with dollar-denominated debts. These benefits are all permanent. The costs of reducing inflation to zero are the high unemployment and low output needed to reduce inflation. According to the natural rate hypothesis, these costs are temporary.
5. Reducing the budget deficit makes future generations better off because with lower debt, future taxes will be lower. In addition, lower debt will reduce real inter-est rates, causing investment to increase, leading to a larger stock of capital in the future, which means higher future labor produc-tivity and higher real wages.
A fiscal policy that might improve the lives of future generations even more than reducing the budget deficit is increased spend-ing on education, which will also increase incomes in the future.
6. Our society discourages saving in a number of ways: (1) taxing the return on interest income; (2) tax-ing some forms of capital twice; (3) taxing bequests; (4) having means tests for welfare and Medic-aid; and (5) granting financial aid as a function of wealth. The draw-back of eliminating these disincen-tives is that, in many cases, doing so would reduce the tax burden on wealthy taxpayers. The lost revenue to the government could require raising other taxes, which might increase the tax burden on the poor.
CHE-MANKMACRO-10-0706-MACRO SOLUTIONS.indd 11CHE-MANKMACRO-10-0706-MACRO SOLUTIONS.indd 11 28/01/11 6:08 PM28/01/11 6:08 PM