solutions for sustainable water savings
TRANSCRIPT

GEWater & Process Technologies
Solutions forSustainableWater SavingsA Guide to Water Efficiency


1
Solutions for Sustainable Water Savings Table of Contents The Water Efficiency Process........................................................................................................................................................................2 Step 1 – Baseline Water Footprint ..............................................................................................................................................................2 Step 2 – Identify Efficiency Opportunities ...............................................................................................................................................5 Step 3 – Prepare an Optimization Plan.....................................................................................................................................................7 Step 4 – Execute and Measure.....................................................................................................................................................................9 Summary.............................................................................................................................................................................................................. 10 Appendix A: Solutions for Reducing Water Footprint ..................................................................................................................... 11
Appendix B: Case Studies............................................................................................................................................................................. 14

2
The Water Efficiency Process Because of a changing climate, reducing the environmental footprint of industrial operations has become more important than ever. It is no longer sufficient to simply attain sufficient profitability while avoiding discharge of toxic wastes. Increasingly industry must change strategies to become noticeably and substantially "greener", in both the use of raw materials like water, and in the discharge of by-products heretofore considered benign (such as carbon, heat, odor, sludge, and mildly saline water). This is leading companies to be more efficient in using resources, handling waste, optimizing supply chain operations and producing more environmentally friendly products. As water becomes more of a scarce resource, corporations are developing sustainability policies based on an effective water strategy. This strategy should encompass the full spectrum of water and wastewater treatments to uncover opportunities for cost savings, reduced downtime and improved operations. This document provides a framework for site managers, corporate officers, engineering firms and water saving advocates to develop a water efficiency objective and meet this objective by
applying a variety of tools and metrics. What gets measured gets managed. The following four step process will guide you through the necessary steps in delivering a reduction of water footprint and measuring the associated financial impact.
BaselineWater
Footprint
IdentifyEfficiency
Opportunities
Prepare anOptimization
Plan & EngageStakeholders
Execute&
Celebrate
Figure 1: The Water Efficiency Process
Step 1 – Baseline Water Footprint This first step will help you capture a baseline of your current water usage and identify sources of risk like leakage, inability to expand production, and compliance concerns. Innovative companies perform water assessments on a regular basis to prepare for more stringent regulatory pressure in the future. In some cases customers are demanding suppliers become more environmentally progressive in an effort to reduce their own legal risk or simply to improve brand image. Wal-Mart is a good example of that. Performing water assessments is, in essence, a search of hidden dividends, leading to improvements that include water savings and improved wastewater quality standards.
Water Balance Numerous levels of data can be collected. It is important that you first focus only on the attributes that are necessary to calculate an efficiency goal relevant to you. A water balance provides a full
picture of every water-consuming component on site, and serves as the first step in uncovering hidden opportunities for savings. We propose the water balance format provided below.
The water balance template includes six basic categories under which any water consuming entity on-site should be included.
• Inlet water pretreatment • Cooling towers • Boilers • Processing (any water consuming facility which
is a part of the production process) • Wastewater plant (if it exists), or water effluent • Other (ash ponds in a power plant)
For each unit operation, capture and diagram the water balance: that is, write down all flows of water into and out of the operation, and verify a mass balance of both the water flow and the key chemical constituents within or added to the water.
3
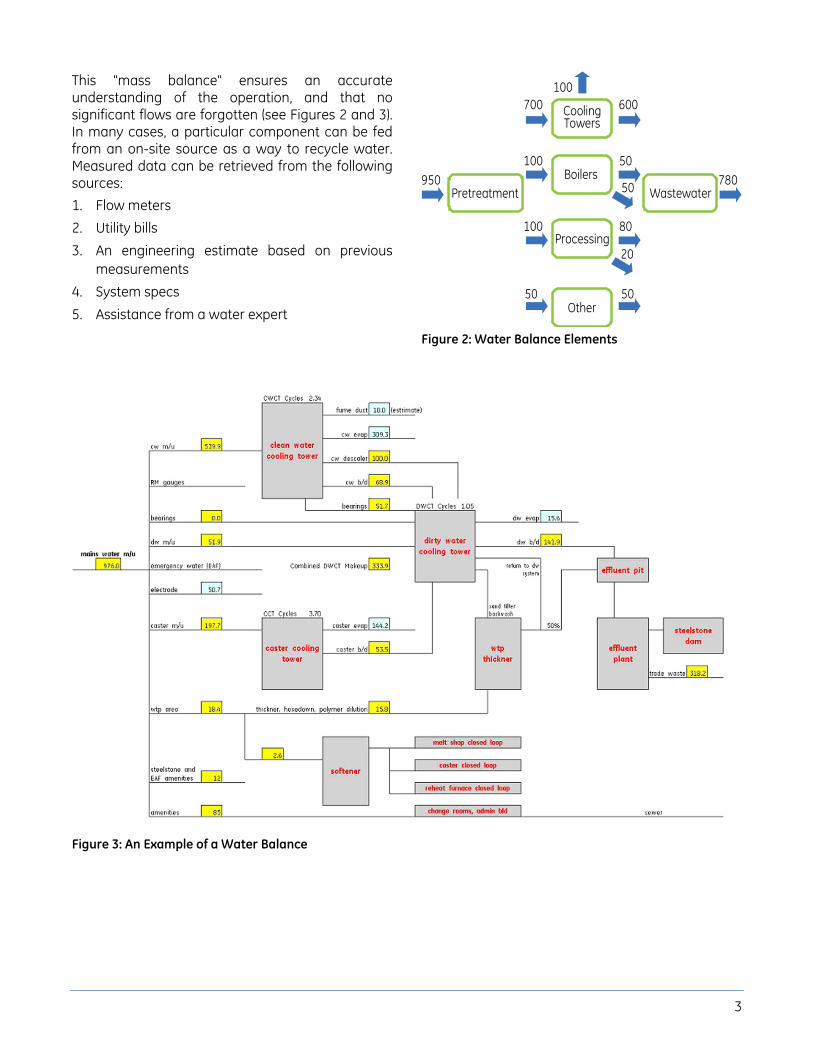
This "mass balance" ensures an accurate understanding of the operation, and that no significant flows are forgotten (see Figures 2 and 3). In many cases, a particular component can be fed from an on-site source as a way to recycle water. Measured data can be retrieved from the following sources: 1. Flow meters 2. Utility bills 3. An engineering estimate based on previous
measurements 4. System specs 5. Assistance from a water expert
Pretreatment
CoolingTowers
Boilers
Processing
Wastewater
Other
950 780
100700 600
100
100
50
50
80
20
50
50
Figure 2: Water Balance Elements
Figure 3: An Example of a Water Balance
4
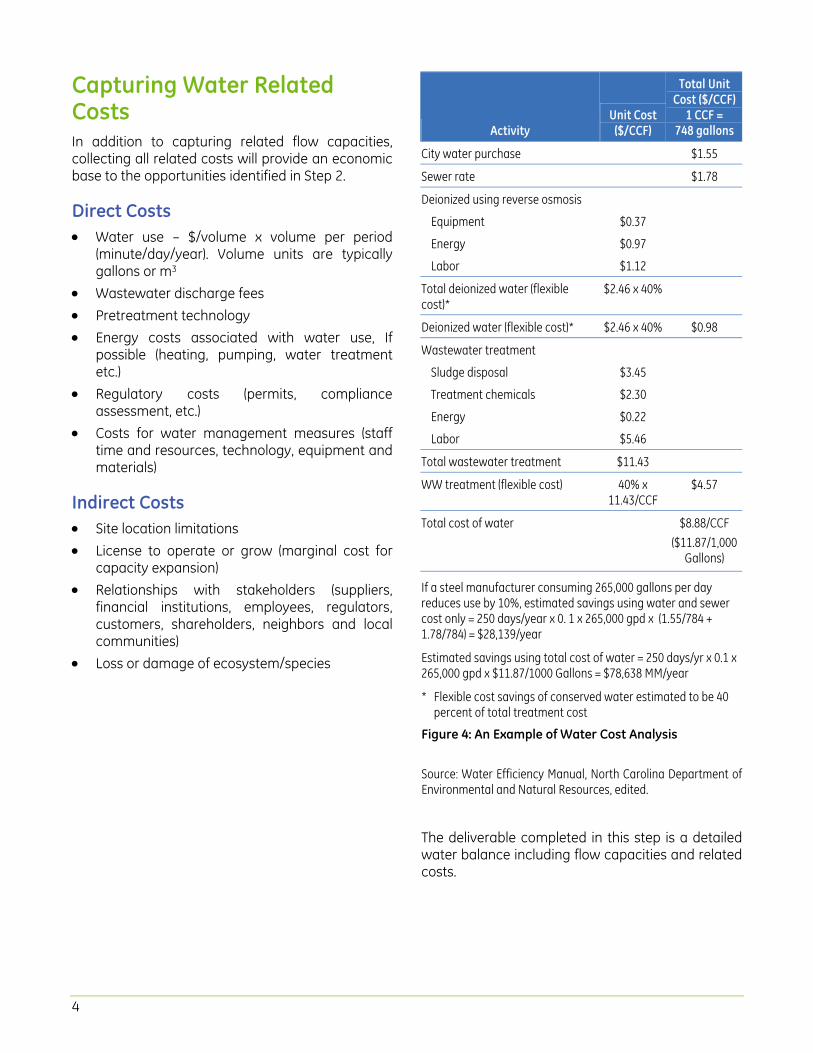
Capturing Water Related Costs In addition to capturing related flow capacities, collecting all related costs will provide an economic base to the opportunities identified in Step 2.
Direct Costs • Water use – $/volume x volume per period
(minute/day/year). Volume units are typically gallons or m3
• Wastewater discharge fees • Pretreatment technology • Energy costs associated with water use, If
possible (heating, pumping, water treatment etc.)
• Regulatory costs (permits, compliance assessment, etc.)
• Costs for water management measures (staff time and resources, technology, equipment and materials)
Indirect Costs • Site location limitations • License to operate or grow (marginal cost for
capacity expansion) • Relationships with stakeholders (suppliers,
financial institutions, employees, regulators, customers, shareholders, neighbors and local communities)
• Loss or damage of ecosystem/species
Activity Unit Cost
($/CCF)
Total Unit Cost ($/CCF)
1 CCF = 748 gallons
City water purchase $1.55
Sewer rate $1.78
Deionized using reverse osmosis
Equipment $0.37
Energy $0.97
Labor $1.12
Total deionized water (flexible cost)*
$2.46 x 40%
Deionized water (flexible cost)* $2.46 x 40% $0.98
Wastewater treatment
Sludge disposal $3.45
Treatment chemicals $2.30
Energy $0.22
Labor $5.46
Total wastewater treatment $11.43
WW treatment (flexible cost) 40% x 11.43/CCF
$4.57
Total cost of water $8.88/CCF
($11.87/1,000 Gallons)
If a steel manufacturer consuming 265,000 gallons per day reduces use by 10%, estimated savings using water and sewer cost only = 250 days/year x 0. 1 x 265,000 gpd x (1.55/784 + 1.78/784) = $28,139/year
Estimated savings using total cost of water = 250 days/yr x 0.1 x 265,000 gpd x $11.87/1000 Gallons = $78,638 MM/year
* Flexible cost savings of conserved water estimated to be 40 percent of total treatment cost
Figure 4: An Example of Water Cost Analysis
Source: Water Efficiency Manual, North Carolina Department of Environmental and Natural Resources, edited.
The deliverable completed in this step is a detailed water balance including flow capacities and related costs.
5
Step 2 – Identify Efficiency Opportunities The water balance developed in the previous step allows us to uncover opportunities for water efficiences and to develop a sustainability policy, or expand an existing one, into the water space.
A water savings policy is a crucial part of a company’s sustainability policy and should be reported in the Corporate Sustainability Report (CSR). It is an effective way to communicate expectations with customers, employees, shareholders and other stakeholders.
An effective way to identify opportunities is to perform a water solution technologies review. For this purpose, it is highly recommended to form a water savings team staffed by water, finance and engineering/operation experts.
The following will help you find 10 to 20% inlet water savings, achieve it quickly, and improve water quality:
Rank Your Water Usage Based on your water balance, rank the various components by water usage and focus on the largest water users. Identify leakages and sources for waste like excess cleaning and washing.
Sources for Water Reuse and Recycling Source: “At the Crest of a Wave: A Proactive Approach to Corporate Water Strategy” – The Pacific Institute and the Business for Social Responsibility
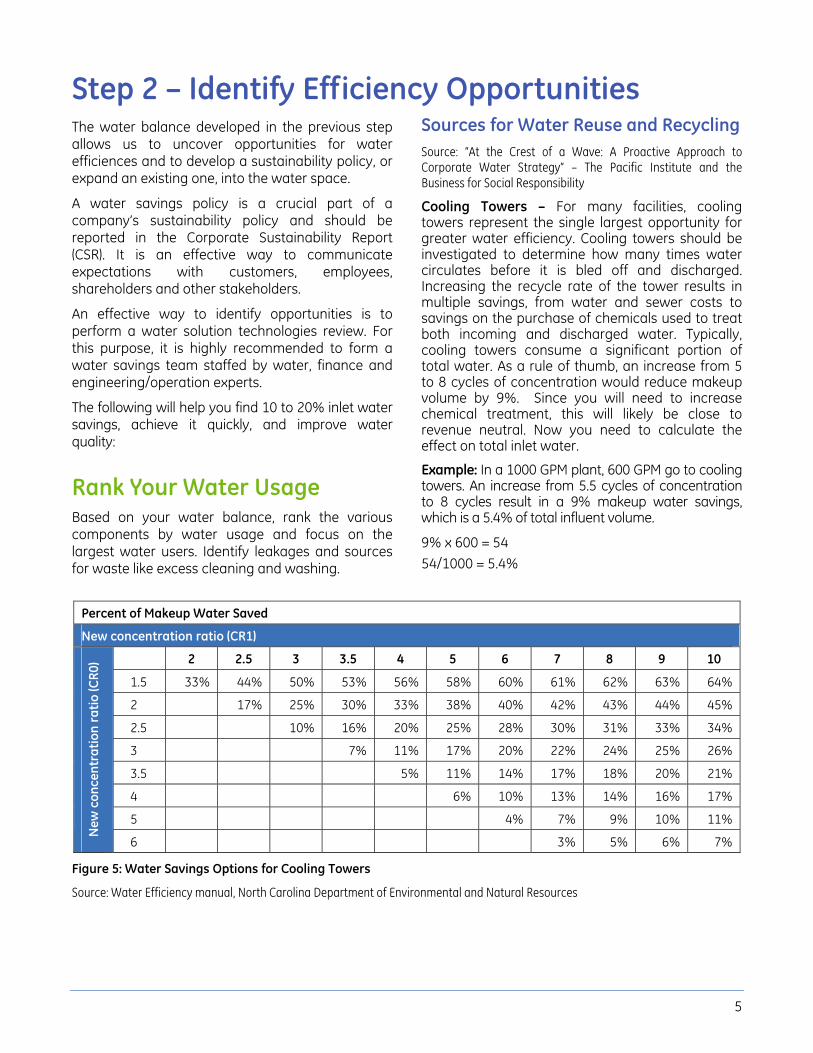
Cooling Towers – For many facilities, cooling towers represent the single largest opportunity for greater water efficiency. Cooling towers should be investigated to determine how many times water circulates before it is bled off and discharged. Increasing the recycle rate of the tower results in multiple savings, from water and sewer costs to savings on the purchase of chemicals used to treat both incoming and discharged water. Typically, cooling towers consume a significant portion of total water. As a rule of thumb, an increase from 5 to 8 cycles of concentration would reduce makeup volume by 9%. Since you will need to increase chemical treatment, this will likely be close to revenue neutral. Now you need to calculate the effect on total inlet water.
Example: In a 1000 GPM plant, 600 GPM go to cooling towers. An increase from 5.5 cycles of concentration to 8 cycles result in a 9% makeup water savings, which is a 5.4% of total influent volume.
9% x 600 = 54 54/1000 = 5.4%
Percent of Makeup Water Saved
New concentration ratio (CR1)
2 2.5 3 3.5 4 5 6 7 8 9 10
1.5 33% 44% 50% 53% 56% 58% 60% 61% 62% 63% 64%
2 17% 25% 30% 33% 38% 40% 42% 43% 44% 45%
2.5 10% 16% 20% 25% 28% 30% 31% 33% 34%
3 7% 11% 17% 20% 22% 24% 25% 26%
3.5 5% 11% 14% 17% 18% 20% 21%
4 6% 10% 13% 14% 16% 17%
5 4% 7% 9% 10% 11%
New
con
cent
ratio
n ra
tio (C
R0)
6 3% 5% 6% 7%
Figure 5: Water Savings Options for Cooling Towers
Source: Water Efficiency manual, North Carolina Department of Environmental and Natural Resources

6
Equipment Cooling – Replace single-pass cooling systems, where water is circulated once through a piece of equipment and then discharged to a sewer, with a process or cooling loop. This loop provides water at a pre-set temperature to cool equipment. When a process loop is not possible, reusing single loop discharge water for irrigation or other non-potable water requirements is another way to increase water efficiency.
Equipment Rinsing and Cleaning – There are many efficient rinsing options for facilities. Counter-current rinsing is typically the most water efficient method for rinsing equipment. In this process, the cleanest water is used only for the final or last stages of a rinse operation; water for early rinsing tasks, when the quality of the water is not as important, can be collected from water that is used during later stages in the process. Other forms of efficiency rinsing include batch processing, when several pieces of equipment are cleaned at the same time, using rinses from one process in another. Cleaning process equipment can be a significant part of many food, beverage and pharmaceutical companies’ manufacturing costs and in some cases can account for as much as 50 to 70% of a facility’s total water use. As such, this presents a tremendous opportunity for water savings.
Alternative Water Sources – Large facilities are good candidates for alternative water sources due to the fact that they typically use large amounts of non-potable water. Companies may be able to update processes to allow for the use of saline and wastewater instead of fresh water. This approach reduces the impact on freshwater resources with subsequent benefits to the local community and the ecosystem. The two most useful “alternative” water sources for facilities are air-conditioning condensate recovery and rainwater harvesting.
• Condensate recovery: The condensate from air conditioners, dehumidifiers, and refrigeration units can provide facilities with a steady supply of relatively pure water for many processes. Because condensate water is relatively free of minerals and other solids, it could be used for
cooling tower, boiler makeup and reverse osmosis feed water, or for drip-irrigation.
• Rainwater harvesting: Rainwater is another excellent source of non-potable water and can be used in many of the applications in which condensate recovery is used. Facilities in the U.S. considering the use of rainwater should check with local or state governments about possible restrictions. Some states allow facilities to detain water for irrigation and other uses that return water back to the system, but do not allow water to be retained permanently on a site.
Additional Savings Sources –
• Use domestic water efficiency techniques • Ultra low flush toilets, urinal, faucet aerators,
low flow showerheads, etc. • Reduce landscaping irrigation time schedules,
repair leaks, install spray nozzles, install and/or replace automatic shut-off nozzles
Engage Your Employees as a Source for Water Savings Ideas • Survey your employee base by asking them to
identify sources of waste. Employee awareness is a great way to uncover savings opportunities and to engage them in an execution program.
• Launch an employee awareness program. Provide them incentives and awards such as the most eco friendly employee award, for being proactive in helping your company save water.
• Communicate with them on weekly basis – progress, regulation and success stories.
• Hold managers accountable for adopting ideas and executing them.
The output of this step is a master list of water saving initiatives. Step 3 will build more rigor into this list with estimated water and pollutant savings as well as associated financial impact.

7
Step 3 – Prepare an Optimization Plan This step outlines all key factors that need to be addressed in order to deliver a successful execution: solution technologies, budget approval, a timeline for implementation, a key stakeholders analysis and an employee communication plan.
A. Identify process and product innovations and estimate the total effect on water savings to establish a goal. Key factors to be included in this step are:
• Regulatory constrains and local water supply issues
• Corporate mandate • Risk – Does the goal allow room for production
expansion? Are there any environmental risks?
An extensive optimization plan includes a list of water savings and wastewater quality related projects. Each project should include the following factors:
• A generic description • The internal process being fed • Technology to be employed • An estimate of the water volume savings • Capital and operating costs • A timeline for implementation • An estimate for the level of difficulty in
execution
The “Water Footprint Reduction Technology Solutions” described in Appendix A is a list of solutions that help create water savings. The solutions are sorted by level of implementation difficulty and timelines for implementation. They start with the most immediate and easy to implement, progress to projects that require additional infrastructure, and finally move on to longer term schedules. All monetary figures are based on averages and estimates to provide a basis for project planning but do not represent a price list. Any project selected for execution should start with a future state water balance, which will disclose an estimate of the new flow capacities and related cost efficiencies.
B. Establish a budget and procure funding. Outside funding and grants can be available.
C. Develop a timeline for implementation and schedule periodic reviews with the water efficiency team to monitor progress. The following scheme will help you in prioritizing projects:
Priority II:Low cost, limited value,
Also low hanging fruit
Priority III:Perform only if
necessary
Priority I:High value, low cost
Priority II:High value, significant
resources required
Implementation: Engineering and CostSimpleComplicated Medium
Envi
ronm
enta
l foo
tprin
t red
uctio
n High
Low
Med
ium
Figure 6: Water Projects Prioritization Scheme
D. Develop an internal communications plan to continue engaging employees and creating awareness.
E. It is important to include all related stakeholders, internal and external, to develop support in delivering water projects. A useful tool can be a stakeholder analysis (see Figure 7), which will develop a detailed sense of who the key stakeholders are, how they currently feel about the change initiative, and the level of support they need to exhibit for the change initiative to have a good chance of success. Based on your analysis, an action plan can be devised to align support and mitigate sources of resistance.

8
SA-2Key Stakeholders
Stakeholder Analysis for Change
MA-1
N0
Support LevelSupporting
ObservationsMS1
SD2
Figure 7: Stakeholder Analysis Framework
At the end of this step, everything should be ready to execute. The projects should be scoped and approved, employees informed and a water solutions supplier identified.
Support Levels
Support Levels are the team’s assessment of each stakeholder’s support of the proposed change, as demonstrated by his or her words and actions. They are “perceptions” and need to be validated through dialog with the stakeholders.
SA = Strongly Against – Clear actions and words that contradict the change.
MA = Moderately Against – Holding back resources and support
N = Neutral – Neither supportive nor opposed to the change, “Wait and See”
MS = Moderately Supportive – Sharing resources as required
SS = Strongly Supportive – Fully engaged and enlisting others

9
Step 4 – Execute and Measure Reducing your water footprint not only improves your operating performance and compliance, but it also creates value for your customers and shareholders. This step focuses on measuring your return on environment and recoginizing value.
Metrics Environmental impact goals can be managed only when they are measurable and quantifiable. Water footprint can be measured using a variety of metrics:
An Absolute Water Savings Volume Example: 10,000 gallons per day. This metric is the simplest and most intuitive but it does not include consideration for production expansion, as future growth can result in an increased demand for water.
A Variable Metric of Water Used per Common Denominator The most common denominators are unit production and revenue. Examples include*:
• Power - Gallons/KwHr • Refineries – Gallons/barrel of crude oil • Beverage – Gallons/liter of beverage • Auto – Gallons/vehicle • Warehouse areas – Gallons/ft2
*Calculations are normally done on average basis
Revenue is often used in cases where a manufacturing facility is producing many types of output products.
Total Metric Tons of Wastewater Loadings As per wastewater quality, most companies use their Corporate Sustainability Report to disclose volume of loadings in the following categories: COD, BOD, TSS and metals.
Realizing Value Reducing water footprint has several layers of value recognition. When monitoring a water project’s progress, it is recommended to capture the achieved value in all categories:
Economic Green is green. In order to execute a water related project, the economic value has to outweigh the cost of project. Using Steps 1-3 of the water efficiency process will allow you to compare the existing cost structure to a future state.
Risk Reduction Experts at the institute of Risk Management in the UK define four broad categories for risk:
• Financial – Savings created from water projects and production expansion
• Strategic – Getting ahead of the competition by creating a more progressive sustainability policy and reporting it in the annual CSR report.
• Operational – Optimized supply chain with high efficiency
• Hazard – Prevention of safety and compliance issues
Environmental Every gallon of water saved has a macro effect on the environment by being used for other purposes like residential water supply or agriculture irrigation. For example: Lake Lanier in Georgia was recorded on 11/29/2007 to have an inflow of 248.8MM GPD, outflow of 827.2 MM GPD with a deficit of (578.4MM) GPD. Every gallon saved translates into a reduction in the deficit and bringing the lake above its red line.
Creating a Competitive Advantage Social responsibility enhances a company’s image. Going beyond compliance and getting ahead of regulation can reduce time and money. Recognition comes in various forms. GE rewards its customers with an ecomagination Award given to its customers for delivering positive economic and ecologic impacts.
Operating Performance
• Reduced consumption • Improved availability • Economical
maintenance • Improved throughput
+
Environmental Performance
• Reduced waste • Make use of
brackish water • Enhanced public
image

10
Summary In conclusion, the four-step process is a structured framework to setting water footprint goals, executing initiatives, monitoring progress and celebrating success. The theme that connects all four steps is the ability to measure the water footprint using metrics. In their book “Green to Gold: How Smart Companies Use Environmental Strategy to Innovate, Create Value, and Build Competitive Advantage”, Dan Esty and Andrew Winston state the following:
“Environmental metrics show a company where it stands. Data and indicators are critical to fact-based decision-making and sound environmental management. They drive continuous improvement and allow managers to mark progress against pollution control and resource productivity goals.”

11
Appendix A: Solutions for Reducing Water Footprint Cooling Tower Cycles of Concentration Description – Increase cooling tower optimization by increasing the cycles of concentration and reducing blowdown stream flow capacities by applying chemicals programs.
Process Being Fed – Cooling towers makeup water
Technologies Employed –
• Chemistry − Fifth generation polymer − On-line polymer monitor − Silica deposit control product − Third generation biofilm removal agent
• Feed and Control – On-line polymer monitor for fifth generation polymer
• Monitoring
Estimated Volume Saving – 0 to 40% of total inlet water
Capital Cost – $0 to $50,000
Timelines for Implementation – Immediate (<2 months). A wastewater discharge permit change may be required as a result of an increase in material concentration, which may influence implementation scheduling. Additionally, Total Dissolved Solids limits may also influence timelines.
Level of Difficulty in Execution – Very easy, quick fix
Mobile Water Demineralizer Description – Replace the onsite demineralizer with mobile trailer demineralizer water, improving quality of boiler feedwater, increasing cycles of concentration and reducing blowdown flow.
Process Being Fed – Boiler feedwater
Technologies Employed – Mobile trailer to improve maintenance costs and reduce washing water usage
Estimated Volume Saving – 0 to 8% of boiler makeup
Capital Cost – $0 to $10,000
Operating Cost – $15,000/month
Timelines for Implementation – Immediate (<2 months). A wastewater discharge permit change may be required as a result of an increase in material concentration, which may influence implementation scheduling. Additionally, Total Dissolved Solids limits may also influence timelines.
Level of Difficulty in Execution – Very easy, the quickest fix
Water Reuse Description – Use any water-consuming component on site as a potential source of water for another component.
The most common internal water sources are:
• Cooling tower blowdown water • Boiler blowdown water • RO reject streams • Wastewater plant • Process unit wastewater
Power Industry
• Ash pond discharge • Scrubber blowdown • Coal pile runoff
Food Industry
• Lost condensate recovery – reuse (dairy and food plants)
• Meat/poultry wash water reuse
Process Being Fed – Mostly cooling towers but the source can be routed to any water consuming component. Cooling tower blowdown can be diverted to scrubbers.
Technologies Employed –
• Biological treatment to reduce TSS, BOD, COD, organic content and other loads of contamination
12
• Membranes - Reverse osmosis, membrane bio reactors, ZeeWeed UF membranes for industrial water reuse
• Brine concentrator and evaporator for a zero liquid discharge
• For food processors, Entrapped Air Floatation and reverse osmosis/UF membrane for wastewater reuse, as well boiler cycles optimization using pretreatment before going into reverse osmosis.
Estimated Volume Saving – 0 to 10% of total inlet water
Capital Cost – $0 to $150,000, depending on existing infrastructure – Piping, tank and pump
Operating Cost –
• $0 for generic and power industry water reuse • $0 to $2 for food processing specific solutions
described above • $250,000 in the case of using cooling tower
blowdown for scrubbers
Timelines for Implementation – Immediate (<2 months) if infrastructure exists, 2 to 6 months otherwise. A wastewater discharge permit change may be required as a result of an increase in material concentration, which may influence implementation scheduling. Additionally, Total Dissolved Solids limits may also influence timelines.
The food processing specific solutions above are longer term projects, one year on average.
Level of Difficulty in Execution – Easy – moderate
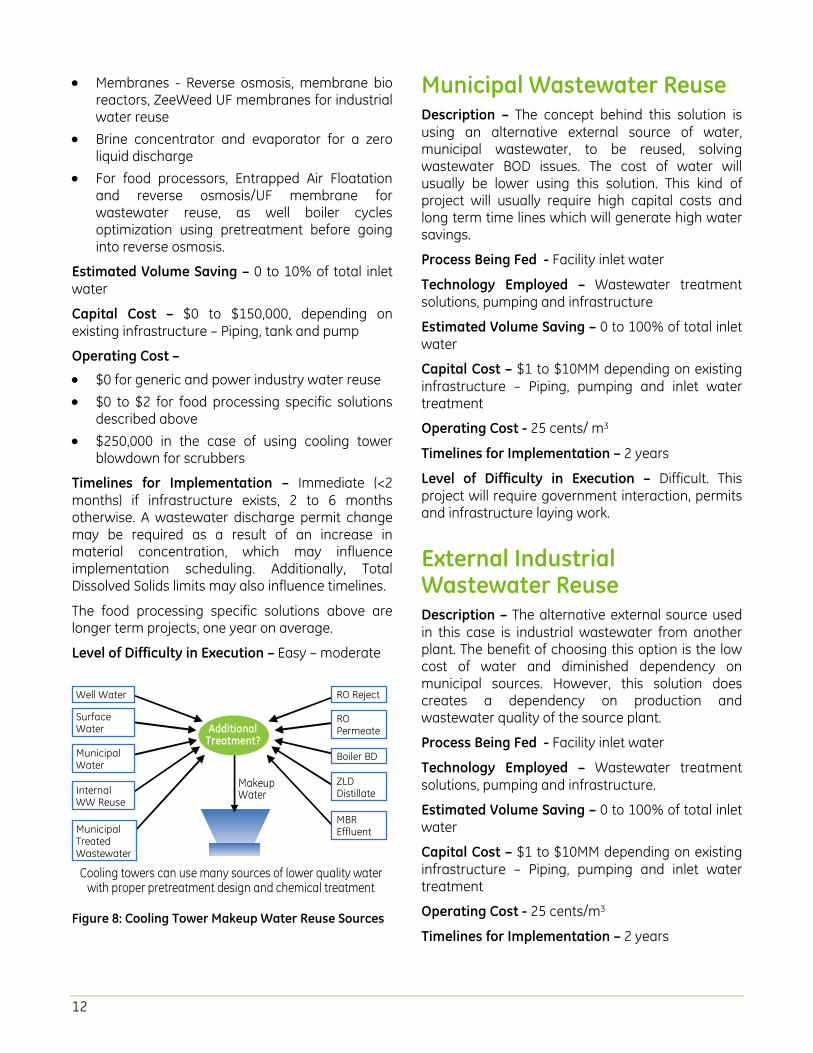
Well Water
SurfaceWater
MunicipalWater
InternalWW Reuse
AdditionalTreatment?
MakeupWater
MunicipalTreatedWastewater
Cooling towers can use many sources of lower quality waterwith proper pretreatment design and chemical treatment
RO Reject
ROPermeate
Boiler BD
ZLDDistillate
MBREffluent
Figure 8: Cooling Tower Makeup Water Reuse Sources
Municipal Wastewater Reuse Description – The concept behind this solution is using an alternative external source of water, municipal wastewater, to be reused, solving wastewater BOD issues. The cost of water will usually be lower using this solution. This kind of project will usually require high capital costs and long term time lines which will generate high water savings.
Process Being Fed - Facility inlet water
Technology Employed – Wastewater treatment solutions, pumping and infrastructure
Estimated Volume Saving – 0 to 100% of total inlet water
Capital Cost – $1 to $10MM depending on existing infrastructure – Piping, pumping and inlet water treatment
Operating Cost - 25 cents/ m3
Timelines for Implementation – 2 years
Level of Difficulty in Execution – Difficult. This project will require government interaction, permits and infrastructure laying work.
External Industrial Wastewater Reuse Description – The alternative external source used in this case is industrial wastewater from another plant. The benefit of choosing this option is the low cost of water and diminished dependency on municipal sources. However, this solution does creates a dependency on production and wastewater quality of the source plant.
Process Being Fed - Facility inlet water
Technology Employed – Wastewater treatment solutions, pumping and infrastructure.
Estimated Volume Saving – 0 to 100% of total inlet water
Capital Cost – $1 to $10MM depending on existing infrastructure – Piping, pumping and inlet water treatment
Operating Cost - 25 cents/m3
Timelines for Implementation – 2 years

13
Level of Difficulty in Execution – Difficult. This project will require government interaction, permits and infrastructure laying work.
Additional Solutions that Can be Utilized • Many facilities use once-through water to cool
small heat-generating equipment. Once-through cooling is a very wasteful practice because water is used only a single time before being sewered. Typical equipment that uses once-through cooling includes: vacuum pumps, air compressors, condensers, hydraulic equipment, rectifiers, degreasers, X-ray processors, welders, and sometimes even air conditioners. Options for eliminating once-through cooling are typically very cost effective and are normally focused on reuse.
• Any water used for landscape design and irrigation is always a good source for savings.
• Installing cartridge filters on waste lines, contaminated only with TSS and reusing the stream.
• Identify a low TDS stream going to waste, then install a poly tank and pump with level control to direct flow to the cooling tower.
• Take a portion of plant effluent and add standard UF and RO membranes to reduce TDS, put treated effluent into a poly tank and pump ahead of ion exchange system. You can recover 65 to 70% of plant effluent as product water.
• Reduce wasted condensate. Remember, each gallon of condensate saved represents a reduction in water intake of 1.25 gpm and a reduction in waste plant loading, as well as heat savings.
• Look for application of multi media filter Electro Dialysis Reversal (EDR) technology. Remember, EDR can get 90% recovery of inlet flow, 95+% removal of ions, but does not remove any silica.
• Is there a plan to collect rainwater, filter it, and use it as tower makeup?
• Is desalination of brackish water an option? • A mobile exchange trailer can be a good option
for putting an RO ahead of a 2-bed demineralizer, which will reduce demineralizer waste from 20 to 24% to 2% and the RO reject can be added to the cooling tower.

14
Appendix B: Case Studies • Canola • Cinergy • CMS Electric Company • Ford • Dupont • The Earth Ranges Center • Repsol YPF • Unilever

Case Study
Visit us online at www.gewater.com ©2005, General Electric Company. All rights reserved.
Americas Minnetonka, MN +1-952-933-2277
Europe/Middle East/Africa Heverlee, Belgium +32-16-40-20-00
Asia/Pacific Shanghai, China +86-21-5298-4573
Global Headquarters Trevose, PA +1-215-355-3300
CH1067EN 0505*Trademark of General Electric Company; may be registered in one or more countries.
Canola Processor Uses RO System to Save 965,000 Gallons of Water Challenge Canbra Foods Ltd. is one of the largest and oldest Canadian-based canola oil producers. As Canbra’s manufacturing process demands the use of a large amount of steam, the plant requires a large amount of city makeup water.
In order to maintain the purity of the incoming water, the company used a basic softening system with the use of sodium zeolite softeners. The softening system, however, was not nearly as efficient as Canbra would have liked. There were other problems as well. The amount of water required by the system was excessive. What’s more, it also used a tremendous volume of salt; which not only created a huge expense but also ulti-mately proved detrimental to the environment. Andfi-nally, fuel consumption in the boiler house was a concern to Canbra, since the burning fuel is a major con-tributor of greenhouse gases to the atmosphere. Conse-quently, while the softener system was somewhat useful, Canbra was convinced that a different system would be more effective and decided to look for alternatives.
The question was, which alternative would be best? Can-bra could have obtained a fairly high quality of water using weak acid cation system but in the end those systems would have cost twice as much as the original softening method. In addition, it would have required the company to bring sulfuric acid on site, which would not only be cumbersome but also potentially hazardous. It would have also required the construction of degasifying towers, a significant expense and an engineering challenge.
Canbra needed to have ultrapure water because without it, they would experience corrosion problems in their return systems. In the end, this would not only harm the system but would negatively impact the overall manufacturing process.
Solution Canbra had initially formulated a plan to proceed with a weak acid cation system. However, after conducting some in-depth research, Canbra personnel determined that reverse osmosis (RO) might be a potential solution. Subsequently, GE Infrastructure Water & Process Technologies provided Canbra with a Reverse Osmosis system. The system is used to supply high purity makeup water to the boilers.
Results From June 2004, when the system was first installed, until June 2005, Canbra will have saved 965,000 gallons (365,000 L) of water. Part of this water savings is due to the decreased demand for softener regeneration, a proc-ess that uses 3,500 gallons (13,250 L) of water each time. In addition, through using only a ton of salt every day and half, about 230 tons of salt were saved. Finally, the RO system has helped the company reduce fuel con-sumption in the boiler house by 15 percent, which trans-lates to a reduction of over 3,000 tons of green house gases in the atmosphere every year.
Canbra has achieved significant cost savings by reducing the amount of water treatment chemicals added to the boiler for water treatment by 80 percent. These are chemicals, like the salt and green house gases, that will no longer find their way into the environment.
Case Study
Find a contact near you by visiting gewater.com or e-mailing [email protected].
©2006, General Electric Company. All rights reserved. *Trademark of General Electric Company; may be registered in one or more countries. CH1062EN 0611
Americas Watertown, MA +1-617-926-2500
Global Headquarters Trevose, PA +1-215-355-3300
Europe/Middle East/Africa Heverlee, Belgium +32-16-40-20-00
Asia/Pacific Shanghai, China +86 (0) 411-8366-6489
Customer Uses GE Chemicals to Reduce Solid Waste at Gypsum Plant by 645 Tons per Day
Challenge
A large diversified energy company lo-cated in the in the Midwest, USA, has a commercial business at one of their power plants that produces about 2,400 tons per
day of high-quality gypsum – a soft, white mineral, which is sells for use in manufacturing wallboard.
Producing high-quality gypsum requires the re-moval of several unwanted byproducts; chief among these are silica, iron, and aluminum oxide. The importance of removing the byproducts is cru-cial because the gypsum must maintain a purity of 95% in order to be sold to produce wallboard.
The customer’s existing gypsum removal process, called Flue Gas Desulfurization (FGD), involved the depositing of the unwanted byproducts into a waste water pond. When the pond reached capac-ity, which was every four months, the customer had to remove the solids and ship the refuse to a landfill. The existing FGD process was both environmentally and financially draining, producing a large amount of sulfur and costing the customer millions of dol-lars.
Additionally, a fair amount of gypsum was being lost in the existing process, further increasing over-all production costs. The customer needed a chemi-cal control system that would enhance the performance of the existing FGD process by reduc-
ing the amount of sulfur, and thus the massive amount of water produced.
Solution
Following a comprehensive analysis of various treatment options, the customer turned to GE, who supplied a polymer and biocide chemical that treated the water produced during the FGD proc-ess. The chemical polymer, when mixed with the thickeners in the FGD process, caused the solids in the gypsum mixture to settle more efficiently while the biocide prevents the solid mixture from turning septic.
Results
As a result of adding the polymer and the biocide to its FGD process, solids are being removed and the remaining purified water is returning to the FGD process without being wasted. Through this proc-ess, the customer is also producing a higher quality product and losing less gypsum during its FGD process.
GE’s chemical solution has reduced the solid dis-charge at the plant from 2,400 to 645 tons per day, and the customer has reduced yearly impurity costs be 50%, while doubling it removal of solids.
The new solution has ensured that the customer is meeting all applicable environmental regulations. Because remaining waster is now returned to the FGD process. The customer is no longer depositing unwanted byproducts into the wastewater pond.
GE’s solution has allowed the customer to maintain its commitment to conduct business with respect for the environment, while providing its customers with low cost, reliable, and efficient energy services.

Case Study
Find a contact near you by visiting ge.com/water or e-mailing [email protected].
©2007, General Electric Company. All rights reserved. *Trademark of General Electric Company; may be registered in one or more countries. CS1095EN Dec-07
Americas Watertown, MA +1-617-926-2500
Global Headquarters Trevose, PA +1-215-355-3300
Europe/Middle East/Africa Heverlee, Belgium +32-16-40-20-00
Asia/Pacific Shanghai, China +86 (0) 411-8366-6489
GE’s Helps ST CMS Electric Company’s Effluent Water Treatment Program Dramatically Reduce Water Use, Protect the Environment and Save Money
Challenge Driven by a desire to protect India’s precious water supply and the environment, ST CMS Electric Com-pany took a serious look at the millions of gallons of cooling water blowdown it was conventionally dis-charging each year. The 250 Megawatt lignite-fired plant uses a lot of water for cooling purposes, and the blowdown water after reuse in ash disposal was sent to Nalla as clarified ash water. As India has fo-cused on maximizing its scarce water resources and protecting the environment and public health, plants such as ST CMS’ in Tamilnadu could contrib-ute to the conservation.
As part of environmental improvement in accor-dance with CMS’ corporate policy, utilization of the ash pond water for cooling water makeup was initi-ated in the year 2004. “We were using 15,000 m3/d of water,” said Mr Muthukumar, the Chief Chemist, which compared favorably with the best of industry norms. “However, we decided to explore possibili-ties of further improvement.”
Representative K, Vijaykrishnan of GE Water & Process Technologies, who was involved in the pro-ject, said that ST CMS was conducting a study for reuse of ash pond water for cooling system makeup and GE joined the efforts with very positive and in-novative ideas in the combined study of the project.
Solution Based on the study, it was decided to recycle the ash pond water back to the cooling tower makeup and the cooling water blowdown for ash handling. The water was recycled to the cooling towers, lead-ing to huge savings in water and in the electricity needed to run the plant. After 11 months of recycle operation, the condensers remain clean and well protected, thanks to GE’s superior cooling water treatment program.
The cooling water system is an open recirculation type with a capacity of 26,400 m3/hr. The makeup water consumption for the cooling tower was at an average of 15,000 m3/d.
ST CMS taps bore well water to meet its entire cool-ing and service water needs.
Results The results have been very impressive. Water sav-ings are an amazing 482,166,460 US gallons, with daily water savings of 5,000 m3. Total financial sav-ings exceed US$26K annually and the plant now uses six bore well pumps, instead of eight, with a daily savings of 10,800 Rupees or US$251.
The plant has become a model for others in India to follow, attracting attention from people interested in replicating the recycle program.
“The recycling program perfectly met our needs and expectations,” said Mr. N. Sundararajan, GM of the ST CMS plant. “It has saved us money, protected our scarce resources and proven to be very reliable.”

Case Study
Visit us online at www.gewater.com ©2005, General Electric Company. All rights reserved.
Americas Minnetonka, MN +1-952-933-2277
Europe/Middle East/Africa Heverlee, Belgium +32-16-40-20-00
Asia/Pacific Shanghai, China +86-21-5298-4573
Global Headquarters Trevose, PA +1-215-355-3300
CH1070EN 0505*Trademark of General Electric Company; may be registered in one or more countries.
Ford Reduces Water Consumption and Sewer Disposal by 230,400 Gallons per Year Challenge The wastewater defoaming process was performing poorly at the Ford Motor Company, Kentucky Truck Plant (KTP) in Louisville, Kentucky.
Wastewater from this assembly plant (800,000 to 1 million gallons per day) is collected and treated at KTP Waste Water Treatment Plant (WWTP) prior to discharge into the Metropolitan Sewer District (MSD) system. Due the large volume of foam that is generated, an antifoam agent is applied to the discharge. However, the product was separating, clumping up and clogging pumps and piping systems.
Consequently, feed lines needed to be cleaned every three days. The two-hour cleaning process tied up two specially trained and certified wastewater treatment operators, making them unavailable to perform jobs elsewhere in the plant.
“This cleaning process was particularly onerous,” according to Mark J. Weinzapfel, Plant Design Engineer. “It was beginning to create morale problems in the plant.”
Another problem was the need to dilute the antifoam agent prior to application, a labor intensive process that also consumed a large volume of water. One quart of concentrated solution was combined with 120 quarts of water in mixing tanks, six times per day. Each time, operators needed to fill and carry five gallon buckets of the antifoaming concentrate from the storage area to the location of the mixing tanks.
Solutions Weinzapfel tasked GE Infrastructure Water & Process Technologies and the WWTP operators to find a solution. After a thorough review of the GE product line and utiliz-ing the WWTP operators knowledge of the equipment and treatment process, it was decided that the plant would attempt to convert to Antifoam Feed Conversion AF1440, a formulation that can be applied neat (without dilution).
After a two-month pilot test demonstrated that the AF1440 solution effectively defoamed the discharge at
KTP, a full-scale dosing system was put into operation. The process is automated with two metering pumps, flexible tubing, and a remote control box.
Results “Everything performed as planned. There were no surprises,” says Gilbert Bridges, WWTP Operator. “Instead of cleaning the lines every three days, we now do it only every three-months. And we no longer have to perform the cumbersome task of transferring products in 5 gallon buckets.”
Ford calculates that 242 hours of labor are now saved each year from the reduced cleaning requirements, alone. This equates to more than $10,800 in savings, without factoring in the additional labor savings from not having to dilute the antifoaming agent.
Moreover, by no longer diluting the antifoam agent, KTP is reducing its water consumption and sewer disposal by 230,400 gallons per year. This figure does not include the water saved by the reduced flushing and cleaning requirements.
Weinzapfel says, “The new system is highly dependable and easy to use. There are none of the headaches that were involved with the old dilution system. We are pleased with the environmental benefit of less water us-age and the clear cost savings to Ford. We are also happy to have freed up WWTP operators from some unpleasant and unproductive tasks, allowing them to focus more on preventative maintenance tasks.”

Case Study
Find a contact near you by visiting gewater.com or e-mailing [email protected].
©2007, General Electric Company. All rights reserved. *Trademark of General Electric Company; may be registered in one or more countries. CS1252EN 0702
Americas Watertown, MA +1-617-926-2500
Global Headquarters Trevose, PA +1-215-355-3300
Europe/Middle East/Africa Heverlee, Belgium +32-16-40-20-00
Asia/Pacific Shanghai, China +86 (0) 411-8366-6489
Dupont and GE Join Forces to Conserve Water at Dutch Fluoroproducts Plant New Water Treatment Solution Yields 44% ROI and Saves 265,000 m3 of Water
Challenge: Conserving Scarce Municipal Water With its low-lying coastal geography, the Nether-lands has long needed to carefully manage its wa-ter resources. For centuries, it has been a world leader in the conservation and protection of scarce drinking water supplies.
This commitment to water conservation has been particularly evident at the DuPont de Nemours manufacturing complex at Dordrecht. “We have a strong corporate commitment to minimizing the environmental impact of our manufacturing proc-esses,” says Rob Rasenberg, Technology Manager, Du Pont de Nemours (Nederland) B.V. “The heat ex-changers of our cooling towers require large vol-umes of water, and we are continually seeking ways to conserve this natural resource.”
The cooling tower of the Dordrecht Fluoroproducts plant, for example, utilizes 265,000 m3 (70 million US gallons) of high-quality, purified water each year for the production of Teflon™ and other fluoride-based materials. Until last year, this cooling tower makeup water — equivalent to the amount of water con-sumed by five thousand Dutch residents — was purchased from the local municipal water com-pany.
“The challenge was finding an alternative source of water of sufficiently high-quality,” explains Rasen-berg. “We need to avoid biological contaminants, corrosion, and scale deposits that could harm our
equipment, reduce cooling efficiency, and require cumbersome cleaning efforts involving significant labor, downtime and chemical usage.”
Solution: Tapping Unused Wastewater In 2002, as part of the ISO 14001 environmental management certification process, GE Water & Process Technologies engineers recommended that DuPont utilize the outflow from a groundwater puri-fication plant as an alternative to the use of potable municipal water for the cooling tower makeup wa-ter at the Dordrecht Fluoroproducts plant.

Page 2 CS1252EN 0702
The purification system was built in the mid-1990s to remediate decades-old fluoride pollution at the Dordrecht plant. The purified water was previously discharged into the Merwede River in the Rhine-Maas Delta.
“The outflow of the groundwater purification plant was a wasted resource. We simply needed a treat-ment and monitoring system to ensure that the wa-ter could be safely used in our cooling towers,” says Rasenberg.
Laboratory tests performed at GE verified the feasi-bility of utilizing the purification plant’s outflow without any adverse effects on the existing heat exchange equipment and the cooling tower. GE en-gineers specified a chemical treatment regime for biological control with continuous dosing of Spec-trus* OX1272, as well as treatment for corrosion control and scale inhibition. The new treatment re-gime utilizes almost identical chemical doses as the treatment required for the municipal water source, but the Spectrus OX1272 is introduced further up-stream in the feed water coming from the purifica-tion plant.
“The engineering team at GE was able to prove to our satisfaction that we could safely use the water from the purification plant without any detrimental effect on our equipment,” said Rasenberg. “We worked closely together to design a system to link the purification plant to our Fluoroproducts cooling tower, with an automated monitoring system to ensure that we meet the quality standards we set for the cooling tower makeup water.”
DuPont has installed a PaceSetter* Platinum system from GE to automatically measure the turbidity and conductivity of the groundwater purification system outflow and perform chemical dosing. If the turbid-ity or conductivity levels exceed a safe threshold, the PaceSetter Platinum system will automatically divert the groundwater purification system outflow to a buffer tank and turn on the municipal water feed. In addition to providing automated control, the system also provides off-site monitoring capa-bility.
Results: Conserving Water and Reducing Costs The project was completed in January 2005, saving €170,000 (US$215,900) in municipal water charges during 2005, with intermittent usage of the new wa-ter source, while the system was being optimized. On a going-forward basis, the reuse of the purified water will result in annual savings of €230,000 (US$292,100). Not only will the plant avoid purchas-ing 265,000 m3 (70 million US gallons) of municipal water each year, but the groundwater purification plant will also avoid discharging 265,000 m3 (70 mil-lion US gallons) of water from the purification plant into the Merwede River.
The total cost of the project, including the PaceSet-ter Platinum system and all piping and pumps was €445,000 ($565,150). This investment will produce an internal rate of return of 44%. “We have achieved an excellent financial return on this in-vestment, in addition to the environmental benefit of reusing a water supply that would otherwise be wasted,” said Rasenberg.

Case Study
Find a contact near you by visiting gewater.com or e-mailing [email protected].
©2007, General Electric Company. All rights reserved. *Trademark of General Electric Company; may be registered in one or more countries. CS1250EN 0702
Americas Watertown, MA +1-617-926-2500
Global Headquarters Trevose, PA +1-215-355-3300
Europe/Middle East/Africa Heverlee, Belgium +32-16-40-20-00
Asia/Pacific Shanghai, China +86 (0) 411-8366-6489
The Earth Rangers Centre
Building Type: Recreation/Animal Care
Building Size: 60,000 ft2 (5,575 m2)
Location: Woodbridge, Ontario, Canada
Occupancy Date: March 2004
Application: Wastewater reuse
Treatment Plant Size: 845 ft2 (78.5 m2)
Capacity: 2,900 gpd (11 m3/d)
LEED Rating: Canada Green Building Council LEED-NC Gold
Introduction Earth Rangers is a partnership-driven environ-mental organization, established in 1999, with the mission of inspiring children with a lasting passion to build a better future. The Earth Ranger education and outdoor leadership programs are centered out of the award-winning, LEED Gold building located just north of Toronto, Ontario, Canada. The building incorporates leading edge environmental technolo-
gies and is recognized as being one of the most en-ergy efficient of its kind and a showpiece for sustainable building. The facility encompasses 5,575 m2 (60,000 ft2) on a 31 acre site. It houses a small interactive theatre, educational displays, ani-mal ambassadors, and staff. The centre welcomes thousands of visitors every year, including govern-ment officials, architects, land developers, green builders, and consultants.
The Centre is surrounded by old farmland pasture and woodland that is the natural habitat of many of resident animals. The building’s location is a result of an extensive study to minimize disruption of the local ecosystem and preserve views. Incorporating leading edge environmental technologies, the cen-ter is a showplace of environmental responsibility.
Plant Overview Among the many innovative technologies that make the Centre a model of sustainable design, the Earth Rangers Centre features on-site wastewater treatment and reuse. Earth Rangers selected a ZeeWeed* membrane bioreactor (MBR), to treat all the sewage generated at the facility in a compact, odor-free, in-house system. Sanitary wastewater is treated onsite to near drinking water quality using

Page 2 CS1250EN 0702
ZeeWeed MBR and UV light sterilization. The treated water is then reused within the facility for toilet flush water, animal ponds, irrigation and floor washing. Potable water for the facility is supplied from an onsite well.
By recycling all the treated wastewater, the con-sumption of fresh water and the discharge of wastewater are significantly reduced. The ZeeWeed MBR system allows the Earth Rangers Centre to consistently operate with negligible impact on the environment—providing a true demonstration of sustainable development.
Process Overview The 2,900-gpd system will process the entire wastewater load from the facility and is concealed in the Centre’s basement. Wastewater is pumped from the sewage collection equalization tank. The equalized flow is then sent through trash grinder pumps and is then pumped to the bioreactor where bacteria consume or digest the biodegradable waste before it enters the membrane chamber con-taining immersed ZeeWeed membranes.
Water is gently drawn through billions of micro-scopic pores on the surface of the membrane fiber via a permeate pump. The pores act as a filter that physically block suspended solids, bacteria and vi-ruses from passing through, producing an excep-tional water quality that is completely suitable for non-potable applications.
The treated water then flows through an activated carbon filter, and ultraviolet units for further disin-fection. The sanitized, finished water flows to the water storage tank for use within the facility.
Water Supply and Wastewater Treatment
Typical Treated Water Results
BOD (mg/L) < 2
TP (mg/L) < 0.05
BOD (mg/L) < 2

Case Study
Find a contact near you by visiting gewater.com or e-mailing [email protected].
©2007, General Electric Company. All rights reserved. *Trademark of General Electric Company; may be registered in one or more countries. CS1253EN 0702
Americas Watertown, MA +1-617-926-2500
Global Headquarters Trevose, PA +1-215-355-3300
Europe/Middle East/Africa Heverlee, Belgium +32-16-40-20-00
Asia/Pacific Shanghai, China +86 (0) 411-8366-6489
Repsol YPF awarded GE ecomagination Leadership Award for environmental improvement GE’s Dianodic* Plus contribution to Repsol YPF´s environmental impact reduction through effluent reuse in cooling circuits during contingency situations resulted in significant additional operational savings.
Challenge Repsol YPF is an integrated international oil and gas company, operating in 30 countries. It is involved in oil and gas downstream and upstream operations, as well as chemical processing and gas and power distribution. It is also one of the ten major private oil companies in the world, the largest private en-ergy company in Latin America in terms of assets, and the leading company in Spain and Argentina.
La Plata Refinery, a processing plant extending along 340 hectares in the interlock among La Plata, Berisso and Ensenada districts in the province of Buenos Aires, is the greatest crude oil processing plant in the country – amounting to 30,000 m3/day, i.e. 30% of Argentina’s total refining market.
Given its capacity for crude diversity processing throughout Argentina, Refinería La Plata is devoted to refining processes aimed at producing a wide array of products – gasoline, gasoil and aviation fuel for transportation purposes, lube oil, paraffins, petroleum coal, petrochemical gasoline, petro-chemical polypropylene, liquefied petroleum gas (LPG) and, asphalts.
By mid 2005, Repsol YPF’s La Plata Refinery faced a critical situation. Several challenges regarding its liquid effluents and the absence of a control action plan were increasing costs and, were inconsistent with current regulations.
Therefore, the management of La Plata Refinery decided to invite GE Water & Process Technologies to design a short-term action plan which would prevent liquid effluent discharge from exceeding discharge parameters to the river. Longer term, the plan would need to solve any other problems arising from effluents with these characteristics.
Solution GE Water & Process Technologies implemented a three tiered plan which included: 1. Creation of a joint team composed of energy,
processes, laboratory and environmental experts from Repsol YPF, local experts and GE international experts.
2. Evaluation – Survey of facilities and operational conditions, recovery of analytical historical information and special analysis of water samples performed by GE Water & Process Technologies’ Global Centre for Investigation and Development Excellence at The Woodlands, Texas, USA.

Page 2 CS1253EN 0702
3. Statistical data analysis applyling Six Sigma methodology for the selection of technologies, process simulation and operative implementation of feasible solutions.
The work carried out along these three guidelines allowed GE to identify the most efficient solution to this problem – effluent reuse as makeup water in the Mayor Conversion cooling circuit, thus avoiding its discharge into the Río de la Plata.
To complete the reuse process, it would also be necessary to replace traditional chemical treatment technology in cooling circuits with GE Water & Process Technologies’ Dianodic Plus technology. The system would then be able to tolerate higher contamination levels – C.O.D, ammonia, etc.- while being protected from corrosion, bioloical fouling and scaling.
This made it possible to create total effluent reuse conditions in contingency situations.
Results
Thanks to the implementation of the GE Dianodic Plus technology, Repsol YPF attained a 16,000 m3 decrease of its effluent discharge and makeup water consumption, as well as significant pollutant reduction in liquid effluents and, an overall savings of US$ 530.000 in operational costs.
In addition, Repsol YPF´s implementation of a Comprehensive Management Program comprising effluent chemical treatment processing through PolyFloc and KlarAid technology and, GE Water & Process Technologies’ technical maintenance at its La Plata Refinery allowed for water management centralization. This, in turn, stabilized the whole system and eliminated all possible contingencies.
The efficiency and significance of this solution led Repsol YPF to be granted the 2006 ecomagination Leadership Award, a GE Water & Process Technologies reward program which globally recognizes customers with an outstanding performance in environmental conservation.
Within the framework of GE’s global ecomagination initiative, this award is granted to those clients who, through their teamwork and innovative solutions, reach environmental objectives such as the reduc-tion of water, energy and emissions, while decreas-ing the overall cost of its operations. Considering the existence of environmental concerns such as water scarcity, this award emphasizes the positive balance between industrial and environmental challenges.

Case Study
Find a contact near you by visiting gewater.com or e-mailing [email protected].
©2007, General Electric Company. All rights reserved. *Trademark of General Electric Company; may be registered in one or more countries. CS1251EN 0702
Americas Watertown, MA +1-617-926-2500
Global Headquarters Trevose, PA +1-215-355-3300
Europe/Middle East/Africa Heverlee, Belgium +32-16-40-20-00
Asia/Pacific Shanghai, China +86 (0) 411-8366-6489
GE’s RO System Helps Unilever Reduce Water, Natural Gas Consumption and Chemical Usage Challenge In the face of rising and unpredictable energy prices, the ongoing campaign to improve energy efficiency is necessary for the Unilever plant in Rexdale, Ontario to remain competitive. The Rexdale plant consumes huge quantities of energy for the annual production of 185 million pounds of margarine and other vegetable-oil products, and energy expenditures represent 15% of all produc-tion costs.
To meet an aggressive goal of reducing energy consumption by at least 6% per year, the Rexdale plant’s Energy Team has implemented, and care-fully documented, 120 projects since 1999, saving more than $4.2 million in energy costs and eliminat-ing about 23,000 tons of greenhouse gases.
The initiatives of the plant’s Energy Team are also part of the Unilever corporate commitment to envi-ronmentally responsible practices at its 365 manu-facturing sites across six continents. In 2005 for the seventh year running, Unilever led the food industry category of the Dow Jones Sustainability World In-dexes (DJSI World), based on assessment of corpo-rate economic, environmental and social performance.
“By 2003, our Energy Team at the Rexdale plant had already attacked many of the more obvious ways of reducing energy consumption, but we needed to take additional initiatives to keep pace with our company goal of achieving further reductions of 6% per year,” explains Doug Dittburner, chief engineer and head of the Energy Team at the Unilever plant
in Rexdale, Ontario. “We turned to GE Water & Proc-ess Technologies to investigate whether we could achieve significant, measurable improvements in the efficiency of our steam plant operations.”
Solution The Energy Team worked with GE to analyze the total cost of purchasing and treating water used to produce the 218 million pounds of steam that the plant uses each year. Municipal water, chemically softened and dealkalized, was the source of 100% of the boiler make-up water.
GE recommended a reverse osmosis (RO) system to replace the water softeners and chloride anion dealkalizers. RO is a mechanical process involving the reversal of flow through a semi-permeable membrane from a high salinity, or concentrated, solution to the high purity, or “permeate,” stream on the opposite side of the membrane. Pressure is used as the driving force for the separation.
A “turn key” system was commissioned in the Rexdale plant in January 2005. The RO system not only softens and purifies municipal water, but it also recycles process water captured throughout the plant for use as boiler make-up, significantly reduc-ing the consumption of municipal water. The “con-

Page 2 CS1251EN 0702
centrate” waste from the RO process is used in the plant’s cooling tower and evaporative condenser for ammonia.
Results The higher quality RO feed water allows the boilers to operate at 100 feedwater cycles instead of 10, dramatically increasing energy efficiency. Blow-down has been reduced by more than 80%, with a bleed off of only 1%.
“The results of the RO project have greatly ex-ceeded our expectations, and they are easily meas-ured,” says Dittburner. “In the first year of operation, we calculated that the project produced a net sav-ings of $378,166, even after accounting for the full cost of operating and maintaining the RO system. We calculate that the RO system will pay for itself in less than 16 months.”
By converting to the RO system, the plant is con-suming 13 million gallons less of municipal water ($68,000) and 8% less natural gas ($299,000). The plant is also saving $11,700 in boiler chemicals and $22,000 in commodity softening chemicals, allow-ing 240,000 less pounds of chemicals into the sani-tary sewer.
These costs savings do not include the safety and ergonomic benefits of eliminating the backbreaking work of handling 3,976 bags of salt, each weighing 44 lbs, and the related labor and storage costs.
The RO system also qualified the Rexdale plant for a $50,000 incentive grant from the city of Toronto for decreased water consumption and a $14k incentive grant from local gas utility, Enbridge Consumers Gas.
According to Dittburner, “The RO project is easily justified by the direct financial benefit to Unilever, but we are also proud of the environmental bene-fits. The project has led to our producing 1.6 million fewer kilograms of CO2, as well as reductions in methane and nitrous oxides. We are also consum-ing far less chemicals and reducing the environ-mental impact of producing and transporting those chemicals.”


Bulletin 1040EN Dec-07
Global HeadquartersTrevose, PennsylvaniaT + 1-215-355-3300F + 1-215-953-5524
AmericasWatertown, MassachusettsT + 1-617-926-2500F + 1-617-926-4304
ZENON Membrane SolutionsOakville, Ontario, CanadaT + 1-905-465-3030F + 1-905-465-3050
Europe/Middle East/AfricaHeverlee, BelgiumT + 32-16-40-20-00F + 32-16-40-00-87
Asia/PacificShanghai, ChinaT + 86 (0) 411 8366 6489F + 86 (0) 411 8366 6894
Find a contact near you by visiting gewater.com or e-mailing [email protected].
©2007 General Electric CompanyAll Rights Reserved.