solutions for a changing world - waste management
TRANSCRIPT

Solutions for a Changing World
2010 AnnuAl RepoRt

Nearly 20 million customers across North America rely on Waste Management to pick up and dispose of their trash safely and effi ciently. But the way the world thinks about waste is changing. People depend on us to help them reduce, reuse and recycle the waste they generate. Businesses are demanding new waste strategies that benefi t both the environment and the bottom line. And many of North America’s largest companies, including 80 percent of those on Fortune magazine’s list of the top 100, are setting “zero-waste” goals—in other words, sending no trash to the landfi ll.
Attitudes are changing, and actions are following suit.
This is good news. It means that people everywhere—in homes, businesses and communities across the continent—are taking seriously the responsibility of protecting the planet. So are we.
Waste Management continues to play a leading role in this changing landscape. We are known as a company that not only collects and disposes of waste, but also partners with customers to provide effi cient, innovative, sustainable, environmental options for the management of waste.
Waste Management is providing solutions for a changing world.
Waste Management, Inc. is the leading provider of comprehensive waste and environmental services in North America, as well as North America’s largest residential municipal waste recycler and a leader in waste-based energy technologies. As of December 31, 2010, the company served nearly 20 million municipal, commercial, industrial, and residential customers through a network of 390 collection operations, 294 transfer stations, 271 active landfi ll disposal sites, 17 waste-to-energy plants, 98 recycling facilities, and 127 benefi cial-use landfi ll gas projects. To learn more about Waste Management, visit www.wm.com or www.thinkgreen.com.
The world is changing, and so is the way we manage waste.

In recent years, we’ve seen a major shift in thinking about
the environment. People are more concerned about our
natural resources and what we are doing to ensure the future
well-being of the planet. They are choosing to do business
with companies that have sound environmental practices.
And they are looking to the waste industry—which manages
the 243 million tons of municipal solid waste generated
every year in the U.S. alone—to step up and do its part. For
our industry, the rising tide of environmental awareness
means that customers want more than the traditional ways
of managing waste. We are being called upon to develop new
solutions that meet the environmental and economic needs
of a changing world.
Waste Management is leading the way. We are working
to maximize the value of the waste we collect by pulling
more recyclables and reusable materials out of the waste
stream and transforming waste into usable resources such as
electric power, fuels and specialty chemicals. In short, we are
reinventing what can be done with trash.
We can make these strides in a challenging economic
climate because of our operational and fi nancial strength.
Throughout 2010, we proved our ability to weather a down
economy and emerge as a stronger company, focused on
growth. We worked hard to reduce costs, we maintained
our discipline in pricing our services, and we strengthened
our sales and marketing eff orts. We made investments in
information technologies that help us serve customers better,
in green technologies that help us manage and transform
waste streams including organics and medical waste, and in
acquisitions that fi t our criteria for growth.
In 2010, we continued to demonstrate the fi nancial
performance that allows us to produce strong cash fl ow, fuel
our operating needs, fund our growth strategies and return
cash to our shareholders.
• We reported revenues of $12.52 billion, an increase of 6.1 percent over 2009 revenues.
•We generated $2.3 billion in cash from operating activities.
• We returned $1.1 billion to our shareholders through increased dividends and common stock repurchases. We paid $604 million in dividends and repurchased $501 million in common stock.
• In addition, the 8 percent dividend increase announced in late 2010 for anticipated future dividends marks eight consecutive years of increasing dividends to our shareholders.
Solutions Driven by Customer Needs
At Waste Management, meeting the needs of our nearly
20 million customers is a driving force behind everything we
do. To fully understand these needs, we invest a great deal of
time and energy in learning more about our customers and
how to service them better than anyone else in our industry.
During the year, we completed the realignment of our sales
organization to better meet the specifi c needs of each of
the customer segments we serve. This approach allows us
to match customers in a particular industry with
sales representatives who have specialized
training and knowledge about that
industry. We also continued to invest in
new technologies that give our call center
representatives faster access to
information about customers and
the services they need, making
it easier for customers to do
business with us.
Learning more about the needs
of our customers enables us
to develop the most eff ective,
effi cient environmental solutions
for not only managing their
waste, but also helping them
create less of it and recover value
from materials they once discarded. In
many cases, we help them turn waste
into energy or back into raw materials
suitable for reuse. The solutions we
provide oft en go beyond traditional
sales representatives who have specialized
training and knowledge about that
industry. We also continued to invest in
new technologies that give our call center
representatives faster access to
information about customers and
the services they need, making
Learning more about the needs
effi cient environmental solutions
create less of it and recover value
from materials they once discarded. In
many cases, we help them turn waste
into energy or back into raw materials
suitable for reuse. The solutions we
provide oft en go beyond traditional
Waste Management provides environmental solutions that are driven by customer needs and fueled by experience, technology and financial strength.
To Our Shareholders, Customers, Employees And Communities:

waste collection and disposal services and can lead to reduced
energy use, lower greenhouse gas emissions and lower costs.
We pride ourselves on lending our experience and expertise
to help customers incorporate sustainability initiatives into
their operations. Through our ISO 9001 / 14001 certifi ed
professional services division, Upstream®, we work with
businesses to minimize the impact of their operations on
the environment by providing sustainable, cost-eff ective
strategies. Oft en, we can help them create a closed-loop
strategy that begins with the collection of waste and ends
with the benefi cial use of that waste—for example, by
converting it to landfi ll gas for use as power in the customer’s
facilities or transforming the waste into materials that can be
re-introduced into the material supply chain.
Knowing more about our customers than anyone else is the
key to providing programs and services that deliver better
solutions. Doing this while maintaining our ongoing focus on
environmental performance, safety and customer service will
help us earn the customer loyalty that is essential to meeting
our fi nancial and business goals.
Solutions for Maximizing the Value of Waste
The waste we collect can be put to a variety of good uses.
It can go to a recycling center where materials such as paper,
metal, glass and plastics are pulled out and repurposed for
further use. It can go to one of our waste-to-energy plants
for use as fuel to generate renewable energy. It can go to a
composting facility for converting organic waste into soil-
enriching products or vehicle fuel. Or it can go to a landfi ll,
where the natural gas it creates during decomposition is
harnessed and used as a renewable energy resource.
Increasingly, we are managing the waste stream as a resource,
extracting materials that can be used in ways that create
more value than if they were thrown away.
Waste Management has long led the way in sustainable
recycling solutions. As North America’s largest residential
recycler of municipal waste, we managed more than
8.5 million tons of recyclable materials in 2010. Following
a very challenging year for recycling in 2009, our recycling
business rebounded substantially in 2010.
A decade ago, we became the fi rst major solid waste company
in the U.S. to focus on residential single-stream recycling,
which allows customers the convenience of combining all
recyclables into a single collection bin without having to
separate the materials. We now have 34 single-stream
recycling facilities that use advanced sorting technologies to
make recycling programs more cost-eff ective. We also have
214 electronic waste collection depots and eight e-waste
recycling and processing facilities to serve this growing
business. Our continuing investment in new technologies for
recycling has led to expanded capabilities for other materials
such as juice cartons and asphalt shingles.
In 2010, we partnered with PepsiCo in the Dream Machine
initiative, aimed at increasing the U.S. recycling rate for
beverage containers from 34 percent to 50 percent by 2018.
The Dream Machine recycling program will place thousands
of recycling kiosks in popular public venues and will reward
customers with redeemable points to encourage the capture
and recycling of both PET and aluminum containers.
Also during the year, we invested in a proprietary clean
technology that dramatically increases the yield of recycled
PET plastic while reducing the materials cost by 50 percent.
In 2010, we rolled out a unique retail product to help
homeowners and small businesses with projects too
small to require a conventional metal dumpster. Waste
Management’s Bagster® is a “Dumpster-in-a-Bag®” made
of a high-strength woven material that can hold up to
3,300 pounds of waste. When the bag is fi lled, customers
can call or go online to schedule pickup service by Waste
Management’s local operation. Bagster is now sold in over
4,000 retail locations across the U.S. and Canada, including
ACE Hardware, The Home Depot, Lowe’s, TrueValue and others.
SOLUTION: Dumpster-in-a-Bag®

This off ers great opportunity for creating more value from
recycled PET, which is the world’s most recycled plastic.
Waste Management began recycling universal waste for
commercial and industrial customers in 2007, with a focus
on mercury-containing fl uorescent lamps. Universal waste
requires special handling due to its hazardous content and
includes items such as batteries, pesticides and fl uorescent
lamps. We also off er mail-in solutions for consumers
for the recycling of universal household waste through
ThinkGreenFromHome.com®, a convenient online service.
Last year, customers shipped more than 75 million fl uorescent
lamps to us for safe recycling.
Organic waste, which includes food, yard and wood waste,
makes up about one-third of the waste generated in the
U.S. and off ers us another opportunity to maximize the
value found in waste. In 2010, we processed 1.25 million
tons of organic waste through 34 organics composting
facilities, processing organic waste into products such as soil
amendments, organic fertilizers, renewable energy, advanced
biofuels and renewable chemicals. In 2010, we added over
1 million tons of processing capacity as well as commercial
A major brewing company turned to Waste Management to help recover more value from materials both inside its facilities and out, with the ultimate goal of becoming a “zero-waste” company. We enhanced the company’s recycling participation, resulting in landfi ll diversion rates of 90 percent and a reduction in costs of more than 20 percent. Working with the customer, we also created a national reverse-logistics program to recover commodities from non-saleable goods. The result was a closed-loop recycling option that reduced the cost of logistics by 15 percent.
and consumer organic products to our organics recycling
business through the acquisition of a majority equity interest
in Garick LLC, a leading manufacturer and distributor of
organic lawn and garden products.
We continuously explore new service off erings that answer
the demand for alternative solutions to the disposal of waste
and enable us to extract more value from the materials we
manage. We are investing in greener technologies that include:
• Converting landfi ll gas into liquefi ed natural gas (LNG) through a joint venture with Linde North America to develop the world’s largest landfi ll-gas-to-LNG facility, which opened in late 2009 and has the capacity to produce 13,000 gallons of LNG a day
• Developing plasma gasifi cation technology that will convert waste into clean fuels and renewable energy through a joint venture with InEnTec, along with another gasifi cation venture with Enerkem that will convert waste materials into biofuels such as ethanol
• Investing in biogas-to-power off erings with Harvest Power
• Off ering trash-compacting containers that run solely on solar power, ideal for sporting venues, schools, malls and municipal customers
• Investing in a technological venture with Terrabon and Valero to convert organic wastes into a high-octane transportation fuel
• Developing processes to convert syngas made from municipal solid waste into chemical products, through a joint development agreement with Genomatica
SOLUTION: Less Waste, More Value

Processing waste diff erently is nothing new for Waste
Management. For more than 20 years, we have helped to
meet the demand for clean, renewable energy through two
waste-based power generation initiatives. One uses landfi ll
gas, a clean, natural by-product of decomposing waste that is
in abundant supply at our landfi lls. We capture this gas for use
as fuel to generate electricity and for industrial applications.
We now have 127 landfi ll-gas-to-energy plants, with 12 more
planned for development in 2011.
We also burn waste to generate electrical power through
17 waste-to-energy plants and fi ve independent power
production facilities. We are expanding our waste-to-energy
business into fast-growing international markets through joint
venture and operating opportunities in China and Europe.
Altogether, Waste Management’s waste-based energy projects
produce enough energy to power nearly 1.1 million homes.
Solutions for the Future
In 2007, Waste Management announced four goals for
sustainable growth that signify our commitment to providing
solutions for critical future needs. These goals reinforce our
conviction that what is good for the environment is also good
for our business, good for our customers’ businesses, good for
our communities and good for future generations.
We are making signifi cant progress toward our goals, which
include doubling our renewable energy production to power
the equivalent of 2 million homes, tripling our recycling
capacity to 20 million tons per year, increasing our investment
in emerging technologies for managing waste, and protecting
more wildlife habitat on our own lands across North
America—all by the year 2020.
We committed to set aside 25,000 acres of our land for nature
preservation and to having at least 100 of our wildlife habitats
certifi ed by the Wildlife Habitat Council (WHC) by 2020. I am
pleased to report that we attained both these goals in 2010,
10 years ahead of schedule. Waste Management is the only
company to have received 30 WHC certifi cations in one year
and to have more than 100 WHC-certifi ed programs.
We look forward with renewed excitement to creating more
solutions for a changing world. We will work to grow our
markets by focusing on customer-driven solutions, making
strategic acquisitions, maintaining our pricing discipline
and making the company operate more effi ciently. We will
continue to extract more value from the waste stream,
invest in greener technologies, and protect and improve the
environment. And we will do all of this while maintaining our
fi nancial and operational strength so that we can accomplish
our work and return value to our shareholders.
Thank you for your continuing confi dence in our ability to
achieve these goals.
Sincerely,
David P. Steiner
President and Chief Executive Offi cer
In May, Waste Management was asked by BP to assist
in the Gulf Coast cleanup eff ort along hundreds of miles
of coastline following the leak at its Deepwater Horizon
MC252 oil well in the Gulf of Mexico. We deployed more
than 65 trucks and drivers, 700 containers, 1,000 Bagsters
and hundreds of personnel from across our operations.
Our role quickly expanded from providing the manpower,
equipment and services for emergency cleanup services—
a job for which we are well prepared—to providing vital
solutions for the treatment and processing of solid waste,
oily liquids and other wastes.
SOLUTION: Cleanup on the Coast

Proxy Statement and Form 10-K

1001 Fannin Street, Suite 4000Houston, Texas 77002
NOTICE OF ANNUAL MEETING OF STOCKHOLDERSOF WASTE MANAGEMENT, INC.
Date and Time:
May 13, 2011 at 11:00 a.m., Central Time
Place:
The Maury Myers Conference CenterWaste Management, Inc.1021 Main StreetHouston, Texas 77002
Purpose:
• To elect eight directors;
• To ratify the appointment of Ernst & Young LLP as our independent registered public accounting firmfor the fiscal year ending December 31, 2011;
• To hold an advisory vote on executive compensation;
• To hold an advisory vote on the frequency of the advisory vote on executive compensation;
• To vote on a proposal to amend our By-laws to allow stockholders who have held at least a 25% netlong position in our Common Stock for one year to call special stockholder meetings; and
• To conduct other business that is properly raised at the meeting.
Only stockholders of record on March 16, 2011 may vote at the meeting.
Your vote is important. We urge you to promptly vote your shares by telephone, by the Internet or, if thisProxy Statement was mailed to you, by completing, signing, dating and returning your proxy card as soon aspossible in the enclosed postage prepaid envelope.
LINDA J. SMITHCorporate Secretary
March 30, 2011
IMPORTANT NOTICE REGARDING THE AVAILABILITY OF PROXY MATERIALS FOR THEANNUAL MEETING OF STOCKHOLDERS TO BE HELD ON MAY 13, 2011: This Notice of AnnualMeeting and Proxy Statement and the Company’s Annual Report on Form 10-K for the year endedDecember 31, 2010 are available at http://www.wm.com.

TABLE OF CONTENTS
Page
General Information . . . . . . . . . . . . . . . . . . . . . . . . . . . . . . . . . . . . . . . . . . . . . . . . . . . . . . . . . . . . . . . 1
Board of Directors . . . . . . . . . . . . . . . . . . . . . . . . . . . . . . . . . . . . . . . . . . . . . . . . . . . . . . . . . . . . . . . . 4
Leadership Structure . . . . . . . . . . . . . . . . . . . . . . . . . . . . . . . . . . . . . . . . . . . . . . . . . . . . . . . . . . . . . 4
Role in Risk Oversight . . . . . . . . . . . . . . . . . . . . . . . . . . . . . . . . . . . . . . . . . . . . . . . . . . . . . . . . . . . 4
Independence of Board Members. . . . . . . . . . . . . . . . . . . . . . . . . . . . . . . . . . . . . . . . . . . . . . . . . . . . 5
Meetings and Board Committees . . . . . . . . . . . . . . . . . . . . . . . . . . . . . . . . . . . . . . . . . . . . . . . . . . . . 6
Audit Committee . . . . . . . . . . . . . . . . . . . . . . . . . . . . . . . . . . . . . . . . . . . . . . . . . . . . . . . . . . . . . . . 6
Audit Committee Report . . . . . . . . . . . . . . . . . . . . . . . . . . . . . . . . . . . . . . . . . . . . . . . . . . . . . . . . . . 8
Management Development and Compensation Committee . . . . . . . . . . . . . . . . . . . . . . . . . . . . . . . . . 9
Compensation Committee Report . . . . . . . . . . . . . . . . . . . . . . . . . . . . . . . . . . . . . . . . . . . . . . . . . . . 9
Compensation Committee Interlocks and Insider Participation . . . . . . . . . . . . . . . . . . . . . . . . . . . . . . 10
Nominating and Governance Committee . . . . . . . . . . . . . . . . . . . . . . . . . . . . . . . . . . . . . . . . . . . . . . 10
Related Party Transactions . . . . . . . . . . . . . . . . . . . . . . . . . . . . . . . . . . . . . . . . . . . . . . . . . . . . . . . . 11
Special Committee . . . . . . . . . . . . . . . . . . . . . . . . . . . . . . . . . . . . . . . . . . . . . . . . . . . . . . . . . . . . . . 12Board of Directors Governing Documents . . . . . . . . . . . . . . . . . . . . . . . . . . . . . . . . . . . . . . . . . . . . . 12
Non-Employee Director Compensation . . . . . . . . . . . . . . . . . . . . . . . . . . . . . . . . . . . . . . . . . . . . . . . 12
Election of Directors (Item 1 on the Proxy Card) . . . . . . . . . . . . . . . . . . . . . . . . . . . . . . . . . . . . . . . . 14
Director Nominee and Officer Stock Ownership . . . . . . . . . . . . . . . . . . . . . . . . . . . . . . . . . . . . . . . . . . 17
Persons Owning More than 5% of Waste Management Common Stock . . . . . . . . . . . . . . . . . . . . . . . . . 18
Section 16(a) Beneficial Ownership Reporting Compliance . . . . . . . . . . . . . . . . . . . . . . . . . . . . . . . . . . 19
Executive Officers . . . . . . . . . . . . . . . . . . . . . . . . . . . . . . . . . . . . . . . . . . . . . . . . . . . . . . . . . . . . . . . . 20
Executive Compensation . . . . . . . . . . . . . . . . . . . . . . . . . . . . . . . . . . . . . . . . . . . . . . . . . . . . . . . . . . . . 22
Compensation Discussion and Analysis . . . . . . . . . . . . . . . . . . . . . . . . . . . . . . . . . . . . . . . . . . . . . . . 22
Executive Compensation Tables. . . . . . . . . . . . . . . . . . . . . . . . . . . . . . . . . . . . . . . . . . . . . . . . . . . . . 36
Equity Compensation Plan Table . . . . . . . . . . . . . . . . . . . . . . . . . . . . . . . . . . . . . . . . . . . . . . . . . . . . . . 50
Ratification of Independent Registered Public Accounting Firm (Item 2 on the Proxy Card) . . . . . . . . . . 51
Proposal on Executive Compensation (Item 3 on the Proxy Card) . . . . . . . . . . . . . . . . . . . . . . . . . . . . . 52
Proposal on Frequency of Vote on Executive Compensation (Item 4 on the Proxy Card) . . . . . . . . . . . . . 53
Proposal to Amend our By-laws to Allow Stockholders to Call Special Stockholder Meetings(Item 5 on the Proxy Card) . . . . . . . . . . . . . . . . . . . . . . . . . . . . . . . . . . . . . . . . . . . . . . . . . . . . . . . . 54
Other Matters . . . . . . . . . . . . . . . . . . . . . . . . . . . . . . . . . . . . . . . . . . . . . . . . . . . . . . . . . . . . . . . . . . . . 55
Appendix
Proposed Amendment to By-laws . . . . . . . . . . . . . . . . . . . . . . . . . . . . . . . . . . . . . . . . . . . . . . . . . . . A-1

PROXY STATEMENT
ANNUAL MEETING OF STOCKHOLDERS
WASTE MANAGEMENT, INC.1001 Fannin Street, Suite 4000
Houston, Texas 77002
Our Board of Directors is soliciting your proxy for the 2011 Annual Meeting of Stockholders and at anypostponement or adjournment of the meeting. We are furnishing proxy materials to our stockholders primarilyvia the Internet. On March 30, 2011, we sent an electronic notice of how to access our proxy materials,including our Annual Report, to stockholders that have previously signed up to receive their proxy materialsvia the Internet. On March 30, 2011, we began mailing a Notice of Internet Availability of Proxy Materials tothose stockholders that previously have not signed up for electronic delivery. The Notice contains instructionson how stockholders can access our proxy materials on the website referred to in the Notice or request that aprinted set of the proxy materials be sent to them. Internet distribution of our proxy materials is designed toexpedite receipt by stockholders, lower the costs of the annual meeting, and conserve natural resources.
Record Date March 16, 2011.
Quorum A majority of shares outstanding on the record date must bepresent in person or by proxy.
Shares Outstanding There were 475,145,633 shares of Common Stock outstanding andentitled to vote as of March 16, 2011.
Voting by Proxy Internet, phone, or mail.
Voting at the Meeting Stockholders can vote in person during the meeting. Stockholdersof record will be on a list held by the inspector of elections. Bene-ficial holders must obtain a proxy from their brokerage firm, bank,or other stockholder of record and present it to the inspector ofelections with their ballot. Voting in person by a stockholder willreplace any previous votes submitted by proxy.
Changing Your Vote Stockholders of record may revoke their proxy at any time beforewe vote it at the meeting by submitting a later-dated proxy via theInternet, by telephone, by mail, by delivering instructions to ourCorporate Secretary before the annual meeting revoking the proxyor by voting in person at the annual meeting. If you hold sharesthrough a bank or brokerage firm, you may revoke any prior votinginstructions by contacting that firm.
Votes Required to Adopt Proposals Each share of our Common Stock outstanding on the record date isentitled to one vote on each of the eight director nominees and onevote on each other matter. To be elected, a director must receive amajority of the votes cast with respect to that director at the meet-ing. Each of the other proposals requires the favorable vote of amajority of the shares present, either by proxy or in person, andentitled to vote, except with respect to proposal 4, the frequency ofthe advisory vote on executive compensation, the alternative receiv-ing a majority of the votes cast — every year, every two years orevery three years — will be the frequency that stockholdersapprove. If none of the frequency alternatives receive a majority ofthe votes cast, the alternative receiving the greatest number of votescast will be the frequency that stockholders approve.

Effect of Abstentions and BrokerNon-Votes Abstentions will have no effect on the election of directors or the
frequency of the advisory vote on executive compensation. Foreach of the other proposals, abstentions will have the same effectas a vote against these matters because they are considered presentand entitled to vote.
If your shares are held by your broker and you do not give votinginstructions, your broker will be entitled to vote your shares in itsdiscretion for the ratification of our independent registered publicaccounting firm and for the amendment to our By-laws. For theelection of directors and each of the executive compensation pro-posals, your shares will be treated as broker non-votes, which arenot entitled to vote on such matters. Thus, absent voting instruc-tions from you, your broker will not be able to vote your shares forthe election of directors and will not be able to vote on the execu-tive compensation proposals. A broker non-vote will be counted forpurposes of a quorum but will have no effect on the outcome ofthe vote.
Voting Instructions You may receive more than one proxy card depending on how youhold your shares. If you hold shares through a broker, your abilityto vote by phone or over the Internet depends on your broker’s vot-ing process. You should complete and return each proxy or othervoting instruction request provided to you.
If you complete and submit your proxy voting instructions, the per-sons named as proxies will follow your instructions. If you submityour proxy but do not give voting instructions, we will vote yourshares as follows:
• FOR our director candidates;
• FOR the ratification of the independent registered publicaccounting firm;
• FOR approval of our executive compensation;
• FOR conducting future advisory votes on executive compensationannually; and
• FOR the proposal to amend our By-laws to allow stockholders tocall special stockholder meetings.
If you give us your proxy, any other matters that may properlycome before the meeting will be voted at the discretion of theproxy holders.
Attending in Person Only stockholders, their proxy holders and our invited guests mayattend the meeting. If you plan to attend, please bring identificationand, if you hold shares in street name, bring your bank or brokerstatement showing your beneficial ownership of Waste Manage-ment stock in order to be admitted to the meeting.
If you are planning to attend our annual meeting and require direc-tions to the meeting, please contact our Corporate Secretary at713-512-6200.
2

The only items that will be discussed at this year’s annual meetingwill be the items set out in the Notice. There will be nopresentations.
Stockholder Proposals for the 2012Annual Meeting Eligible stockholders who want to have proposals considered for
inclusion in the Proxy Statement for our 2012 Annual Meetingshould notify our Corporate Secretary at Waste Management, Inc.,1001 Fannin Street, Suite 4000, Houston, Texas 77002. The writtenproposal must be received at our offices no later than November 30,2011 and no earlier than October 31, 2011. A stockholder musthave been the registered or beneficial owner of (a) at least 1% ofour outstanding Common Stock or (b) shares of our CommonStock with a market value of $2,000 for at least one year beforesubmitting the proposal. Also, the stockholder must continue toown the stock through the date of the 2012 Annual Meeting.
Expenses of Solicitation We pay the cost of preparing, assembling and mailing this proxy-soliciting material. In addition to the use of the mail, proxies maybe solicited personally, by Internet or telephone, or by Waste Man-agement officers and employees without additional compensation.We pay all costs of solicitation, including certain expenses of bro-kers and nominees who mail proxy materials to their customers orprincipals. Also, Innisfree M&A Incorporated has been hired tohelp in the solicitation of proxies for the 2011 Annual Meeting fora fee of approximately $15,000 plus associated costs and expenses.
Annual Report A copy of our Annual Report on Form 10-K for the year endedDecember 31, 2010, which includes our financial statements for fis-cal year 2010, is included with this Proxy Statement. The AnnualReport on Form 10-K is not incorporated by reference into thisProxy Statement or deemed to be a part of the materials for thesolicitation of proxies.
Householding Information We have adopted a procedure approved by the SEC called “house-holding.” Under this procedure, stockholders of record who havethe same address and last name and do not participate in electronicdelivery of proxy materials will receive only one copy of theAnnual Report and Proxy Statement unless we are notified that oneor more of these individuals wishes to receive separate copies. Thisprocedure helps reduce our printing costs and postage fees.
If you wish to receive a separate copy of this Proxy Statement andthe Annual Report, please contact: Waste Management, Inc., Cor-porate Secretary, 1001 Fannin Street, Suite 4000, Houston, Texas77002, telephone 713-512-6200.
If you do not wish to participate in householding in the future, andprefer to receive separate copies of the proxy materials, please con-tact: Broadridge Financial Solutions, Attention HouseholdingDepartment, 51 Mercedes Way, Edgewood, NY 11717, telephone1-800-542-1061. If you are currently receiving multiple copies ofproxy materials and wish to receive only one copy for your house-hold, please contact Broadridge.
3

BOARD OF DIRECTORS
Our Board of Directors currently has eight members. Each member of our Board is elected annually.Mr. Pope is the Non-Executive Chairman of the Board and presides over all meetings of the Board, includingexecutive sessions that only non-employee directors attend.
Stockholders and interested parties wishing to communicate with the Board or the non-employee directorsshould address their communications to Mr. John C. Pope, Non-Executive Chairman of the Board, c/o WasteManagement, Inc., P.O. Box 53569, Houston, Texas 77052-3569.
Leadership Structure
We separated the roles of Chairman of the Board and Chief Executive Officer at our Company in 2004.The separation of the roles occurred in connection with our Board of Directors’ succession planning for theretirement of A. Maurice Myers, our then Chairman, Chief Executive Officer and President. At that time, ourBoard decided that when Mr. Myers retired, the Company should appoint separate individuals to serve asChairman and as Chief Executive Officer.
We believe that having a Non-Executive Chairman of the Board is in the best interests of the Companyand stockholders. Over the past several years, the demands made on boards of directors have been everincreasing. This is in large part due to increased regulation under federal securities laws, national stockexchange rules and other federal and state regulatory changes. More recently, on-going market challenges andeconomic conditions have increased the demands made on boards of directors. The Non-Executive Chairman’sresponsibilities include leading full Board meetings and executive sessions, as well as ensuring best practicesand managing the Board function. The Board named Mr. Pope Chairman of the Board due to his tenure withand experience and understanding of the Company, as well as his vast experience on public company boardsof directors.
The separation of the positions allows Mr. Pope to focus on management of Board matters and allows ourChief Executive Officer to focus his attention on managing our business. Additionally, we believe theseparation of those roles ensures the independence of the Board in its oversight role of critiquing and assessingthe Chief Executive Officer and management generally.
Role in Risk Oversight
Our executive officers have the primary responsibility for risk management within our Company. OurBoard of Directors oversees risk management to ensure that the processes designed and implemented by ourexecutives are adapted to and integrated with the Company’s strategy and are functioning as directed. Theprimary means by which the Board oversees our risk management structures and policies is through its regularcommunications with management. The Company believes that its leadership structure is conducive tocomprehensive risk management practices, and that the Board’s involvement is appropriate to ensure effectiveoversight.
The Board of Directors and its committees meet in person approximately six times a year, including onemeeting that is dedicated specifically to strategic planning. At each of these meetings, our President and ChiefExecutive Officer; Chief Financial Officer; and General Counsel are asked to report to the Board and, whenappropriate, specific committees. Additionally, other members of management and employees are requested toattend meetings and present information, including those responsible for our Internal Audit, EnvironmentalAudit, Human Resources, Government Affairs, Risk Management, Safety and Accounting functions. One ofthe purposes of these presentations is to provide direct communication between members of the Board andmembers of management; the presentations provide members of the Board with the information necessary tounderstand the risk profile of the Company, including information regarding the specific risk environment,exposures affecting the Company’s operations and the Company’s plans to address such risks. In addition toinformation regarding general updates to the Company’s operational and financial condition, managementreports to the Board on a number of specific issues meant to inform the Board about the Company’s outlookand forecasts, and any impediments to meeting those or its pre-defined strategies generally. These direct
4

communications between management and the Board of Directors allow the Board to assess management’sevaluation and management of the risks of the Company.
Management is encouraged to communicate with the Board of Directors with respect to extraordinary riskissues or developments that may require more immediate attention between regularly scheduled Boardmeetings. Mr. Pope, as Non-Executive Chairman, facilitates communications with the Board of Directors as awhole and is integral in initiating the frank, candid discussions among the independent Board membersnecessary to ensure management is adequately evaluating and managing the Company’s risks. These intra-Board communications are essential in its oversight function. Additionally, all members of the Board areinvited to attend all committee meetings, regardless of whether the individual sits on the specific committee,and committee chairs report to the full Board. These practices ensure that all issues affecting the Company areconsidered in relation to each other and by doing so, risks that affect one aspect of our Company can be takeninto consideration when considering other risks.
The Company also initiated an enterprise risk management process several years ago, which iscoordinated by the Company’s Internal Audit department, under the supervision of the Company’s ChiefFinancial Officer. This process initially involved the identification of the Company’s programs and processesrelated to risk management, and the individuals responsible for them. Included was a self-assessment surveycompleted by senior personnel requesting information regarding perceived risks to the Company, withfollow-up interviews with members of senior management to review any gaps between their and their directreports’ responses. The information gathered was tailored to coordinate with the Company’s strategic planningprocess such that the risks could be categorized in a manner that identified the specific Company strategiesthat may be jeopardized and plans could be developed to address the risks to those strategies. The Companythen conducted an open-ended survey aligned with the objectives of the Company’s strategic goals with severalindividuals with broad risk management and/or risk oversight responsibilities. Included in the survey was theidentification of the top concerns, assessment of their risk impact and probability, and identification of theresponsible risk owner. Finally, a condensed survey of top risks was completed by approximately 200 seniorpersonnel to validate the risks and the risk rankings.
The results of these efforts were reported to the Board of Directors, which is responsible for overseeingthe design of the risk management process. Since its implementation, regular updates are given to the Board ofDirectors on all Company risks. In addition, the Audit Committee is responsible for ensuring that an effectiverisk assessment process is in place, and quarterly reports are made to the Audit Committee on all financial andcompliance risks in accordance with New York Stock Exchange requirements.
Independence of Board Members
The Board of Directors has determined that each of the following seven non-employee director candidatesis independent in accordance with the New York Stock Exchange listing standards:
Pastora San Juan CaffertyFrank M. Clark, Jr.Patrick W. Gross
John C. PopeW. Robert Reum
Steven G. RothmeierThomas H. Weidemeyer
Mr. Steiner is an employee of the Company and, as such, is not considered an “independent” director.
To assist the Board in determining independence, the Board of Directors adopted categorical standards ofdirector independence, which meet or exceed the requirements of the New York Stock Exchange. Thesestandards specify certain relationships that are prohibited in order for the non-employee director to be deemedindependent. In addition to these categorical standards, our Board makes a subjective determination ofindependence considering relevant facts and circumstances. The Board reviewed all commercial and non-profitaffiliations of each non-employee director and the dollar amount of all transactions between the Company and
5

each entity with which a non-employee director is affiliated to determine independence. These transactionsincluded the Company, through its subsidiaries, providing waste management services in the ordinary courseof business and the Company’s subsidiaries purchasing goods and services in the ordinary course of business.The categorical standards our Board uses in determining independence are included in our CorporateGovernance Guidelines, which can be found on our website. The Board has determined that each non-employee director candidate meets these categorical standards and that there are no other relationships thatwould affect independence.
Meetings and Board Committees
Last year the Board held eight meetings and each committee of the Board met independently as set forthbelow. Each director attended at least 75% of the meetings of the Board and the committees on which heserved. In addition, all directors attended the 2010 Annual Meeting of Stockholders. Although we do not havea formal policy regarding director attendance at annual meetings, it has been longstanding practice that alldirectors attend unless there are unavoidable schedule conflicts or unforeseen circumstances.
The Board appoints committees to help carry out its duties. In particular, Board committees work on keyissues in greater detail than would be possible at full Board meetings. Each committee reviews the results ofits meetings with the full Board, and all members of the Board are invited to attend all committee meetings.The Board has three separate standing committees: the Audit Committee; the Management Development andCompensation Committee (the “MD&C Committee”); and the Nominating and Governance Committee.Additionally, the Board has the power to appoint additional committees, as it deems necessary. In 2006, theBoard appointed a Special Committee, as described below.
The Audit Committee
Mr. Gross has been the Chairman of our Audit Committee since May 2010. The other members of ourAudit Committee are Ms. Cafferty and Messrs. Clark, Pope, Reum and Rothmeier. Each member of our AuditCommittee satisfies the additional New York Stock Exchange independence standards for audit committees.Our Audit Committee held eight meetings in 2010.
SEC rules require that we have at least one financial expert on our Audit Committee. Our Board ofDirectors has determined that Mr. Gross, Mr. Rothmeier and Mr. Pope are Audit Committee financial expertsfor purposes of the SEC’s rules based on a thorough review of their education and financial and publiccompany experience.
Mr. Gross was a founder of American Management Systems where he was principal executive officer forover 30 years. He has served as Chairman of The Lovell Group, a private investment and advisory firm, since2001. Mr. Gross holds an MBA from the Stanford University Graduate School of Business, a master’s degreein engineering science from the University of Michigan and a bachelor’s degree in engineering science fromRensselaer Polytechnic Institute. Mr. Gross serves on four public company audit committees in addition toours. The Board reviewed the time Mr. Gross spends on each company’s audit committee and the time hespends on other companies’ interests and determined that such service and time does not impair his ability toserve on our Audit Committee.
Mr. Rothmeier served in various leadership positions in the airline industry for approximately 16 years,including the positions of Chairman, CEO and CFO of Northwest Airlines. He founded Great NorthernCapital, a private investment management, consulting and merchant banking firm, in 1993, where he continuesto serve as Chairman and CEO. Mr. Rothmeier has a master’s degree in finance from the University ofChicago Graduate School of Business and a bachelor’s degree in business administration from the Universityof Notre Dame. Mr. Rothmeier serves on one public company audit committee in addition to ours.
Mr. Pope served in various financial positions, primarily in the airline industry, for approximately 17 years,including over nine years combined in CFO positions at American Airlines and United Airlines. He has amaster’s degree in finance from the Harvard Graduate School of Business Administration and a bachelor’s
6

degree in engineering and applied science from Yale University. Mr. Pope serves on two public company auditcommittees in addition to ours.
Ms. Cafferty serves on one additional public company audit committee in addition to ours. NeitherMr. Clark nor Mr. Reum currently serves on the audit committees of other public companies.
The Audit Committee’s duties are set forth in a written charter that was approved by the Board ofDirectors. A copy of the charter can be found on our website. The Audit Committee generally is responsiblefor overseeing all matters relating to our financial statements and reporting, internal audit function andindependent auditors. As part of its function, the Audit Committee reports the results of all of its reviews tothe full Board. In fulfilling its duties, the Audit Committee, has the following responsibilities:
Administrative Responsibilities
• Report to the Board, at least annually, all public company audit committee memberships by membersof the Audit Committee;
• Perform an annual review of its performance relative to its charter and report the results of itsevaluation to the full Board; and
• Adopt an orientation program for new Audit Committee members.
Independent Auditor
• Engage an independent auditor, determine the auditor’s compensation and replace the auditor ifnecessary;
• Review the independence of the independent auditor and establish our policies for hiring current orformer employees of the independent auditor;
• Evaluate the lead partner of our independent audit team and review a report, at least annually,describing the independent auditor’s internal control procedures; and
• Pre-approve all services, including non-audit engagements, provided by the independent auditor.
Internal Audit
• Review the plans, staffing, reports and activities of the internal auditors; and
• Review and establish procedures for receiving, retaining and handling complaints, including anonymouscomplaints by our employees, regarding accounting, internal controls and auditing matters.
Financial Statements
• Review financial statements and Forms 10-K and 10-Q with management and the independent auditor;
• Review all earnings press releases and discuss with management the type of earnings guidance that weprovide to analysts and rating agencies;
• Discuss with the independent auditor any material changes to our accounting principles and mattersrequired to be communicated by Public Company Accounting Oversight Board (United States) AuditStandard AU Section 380 Communication with Audit Committees;
• Review our financial reporting, accounting and auditing practices with management, the independentauditor and our internal auditors;
• Review management’s and the independent auditor’s assessment of the adequacy and effectiveness ofinternal controls over financial reporting; and
• Review CEO and CFO certifications related to our reports and filings.
7

Audit Committee Report
The role of the Audit Committee is, among other things, to oversee the Company’s financial reportingprocess on behalf of the Board of Directors, to recommend to the Board whether the Company’s financialstatements should be included in the Company’s Annual Report on Form 10-K and to select the independentauditor for ratification by stockholders. Company management is responsible for the Company’s financialstatements as well as for its financial reporting process, accounting principles and internal controls. TheCompany’s independent auditors are responsible for performing an audit of the Company’s financial statementsand expressing an opinion as to the conformity of such financial statements with generally accepted accountingprinciples.
The Audit Committee has reviewed and discussed the Company’s audited financial statements as of andfor the year ended December 31, 2010 with management and the independent registered public accountingfirm, and has taken the following steps in making its recommendation that the Company’s financial statementsbe included in its annual report:
• First, the Audit Committee discussed with Ernst & Young, the Company’s independent registered publicaccounting firm for fiscal year 2010, those matters required to be discussed by Public CompanyAccounting Oversight Board (United States) Audit Standard AU Section 380 Communication with AuditCommittees, including information regarding the scope and results of the audit. These communicationsand discussions are intended to assist the Audit Committee in overseeing the financial reporting anddisclosure process.
• Second, the Audit Committee discussed with Ernst & Young its independence and received fromErnst & Young a letter concerning independence as required under applicable independence standardsfor auditors of public companies. This discussion and disclosure helped the Audit Committee inevaluating such independence. The Audit Committee also considered whether the provision of othernon-audit services to the Company is compatible with the auditor’s independence.
• Third, the Audit Committee met periodically with members of management, the internal auditors andErnst & Young to review and discuss internal controls over financial reporting. Further, the AuditCommittee reviewed and discussed management’s report on internal control over financial reporting asof December 31, 2010, as well as Ernst & Young’s report regarding the effectiveness of internal controlover financial reporting.
• Finally, the Audit Committee reviewed and discussed, with the Company’s management and Ernst &Young, the Company’s audited consolidated balance sheet as of December 31, 2010, and consolidatedstatements of income, cash flows and equity for the fiscal year ended December 31, 2010, including thequality, not just the acceptability, of the accounting principles, the reasonableness of significantjudgments and the clarity of the disclosure.
The Committee has also discussed with the Company’s internal auditors and independent registered publicaccounting firm the overall scope and plans of their respective audits. The Committee meets periodically withboth the internal auditors and independent registered public accounting firm, with and without managementpresent, to discuss the results of their examinations and their evaluations of the Company’s internal controlsover financial reporting.
The members of the Audit Committee are not engaged in the accounting or auditing profession and,consequently, are not experts in matters involving auditing or accounting. In the performance of their oversightfunction, the members of the Audit Committee necessarily relied upon the information, opinions, reports andstatements presented to them by Company management and by the independent registered public accountingfirm.
Based on the reviews and discussions explained above (and without other independent verification), theAudit Committee recommended to the Board (and the Board approved) that the Company’s financialstatements be included in its annual report for its fiscal year ended December 31, 2010. The Committee has
8

also approved the selection of Ernst & Young as the Company’s independent registered public accounting firmfor fiscal year 2011.
The Audit Committee of the Board of Directors
Patrick W. Gross, ChairmanPastora San Juan CaffertyFrank M. Clark, Jr.John C. PopeW. Robert ReumSteven G. Rothmeier
The Management Development and Compensation Committee
Mr. Reum has served as the Chairman of our MD&C Committee since May 2004. The other members ofthe Committee are Messrs. Clark, Pope, Rothmeier and Weidemeyer. Each member of our MD&C Committeeis independent in accordance with the rules and regulations of the New York Stock Exchange. The MD&CCommittee met seven times in 2010.
Our MD&C Committee is responsible for overseeing all of our executive and senior managementcompensation, as well as developing the Company’s compensation philosophy generally. The MD&CCommittee’s written charter, which was approved by the Board of Directors, can be found on our website. Infulfilling its duties, the MD&C Committee has the following responsibilities:
• Review and establish policies governing the compensation and benefits of all of our executives;
• Approve the compensation of our senior management and set the bonus plan goals for thoseindividuals;
• Conduct an annual evaluation of our Chief Executive Officer by all independent directors to set hiscompensation;
• Oversee the administration of all of our equity-based incentive plans;
• Recommend to the full Board new Company compensation and benefit plans or changes to our existingplans; and
• Perform an annual review of its performance relative to its charter and report the results of itsevaluation to the full Board.
In overseeing compensation matters, the MD&C Committee may delegate authority for day-to-dayadministration and interpretation of the Company’s plans, including selection of participants, determination ofaward levels within plan parameters, and approval of award documents, to Company employees. However, theMD&C Committee may not delegate any authority under those plans for matters affecting the compensationand benefits of the executive officers.
For additional information on the MD&C Committee, see the Compensation Discussion and Analysis onpage 22.
Compensation Committee Report
The MD&C Committee has reviewed and discussed the Compensation Discussion and Analysis,beginning on page 22, with management. Based on the review and discussions, the MD&C Committee
9

recommended to the Board of Directors that the Compensation Discussion and Analysis be included in theCompany’s Proxy Statement.
The Management Development and CompensationCommittee of the Board of Directors
W. Robert Reum, ChairmanFrank M. Clark, Jr.John C. PopeSteven G. RothmeierThomas H. Weidemeyer
Compensation Committee Interlocks and Insider Participation
During 2010, Messrs. Clark, Pope, Reum, Rothmeier and Weidemeyer served on the MD&C Committee.No member of the MD&C Committee was an officer or employee of Waste Management during 2010; nomember of the MD&C Committee is a former officer of the Company; and during 2010, none of our executiveofficers served as a member of a board of directors or compensation committee of any entity that has one ormore executive officers who serve on our board of directors or MD&C Committee. Mr. Pope entered into twoopen market transactions involving publicly traded debt of the Company, which are described below, under“Related Party Transactions.”
The Nominating and Governance Committee
Ms. Cafferty has served as the Chairperson of our Nominating and Governance Committee since May2008. The other members of the Committee include Messrs. Gross, Pope and Weidemeyer. Each member ofour Nominating and Governance Committee is independent in accordance with the rules and regulations of theNew York Stock Exchange. In 2010, the Nominating and Governance Committee met four times.
The Nominating and Governance Committee has a written charter that has been approved by the Board ofDirectors and can be found on our website. It is the duty of the Nominating and Governance Committee tooversee matters regarding corporate governance. In fulfilling its duties, the Nominating and GovernanceCommittee has the following responsibilities:
• Review and recommend the composition of our Board, including the nature and duties of each of ourcommittees;
• Evaluate and recommend to the Board the compensation paid to our non-employee directors;
• Evaluate the charters of each of the committees and recommend directors to serve as committee chairs;
• Review individual director’s performance in consultation with the Chairman of the Board;
• Recommend retirement policies for the Board, the terms for directors and the proper ratio of employeedirectors to outside directors;
• Perform an annual review of its performance relative to its charter and report the results of itsevaluation to the full Board;
• Review stockholder proposals received for inclusion in the Company’s proxy statement and recommendaction to be taken with regard to the proposals to the Board; and
• Identify and recommend to the Board candidates to fill director vacancies.
Potential director candidates are identified through various methods; the Committee welcomes suggestionsfrom directors, members of management, and stockholders. From time to time, the Nominating andGovernance Committee uses outside consultants to assist it with identifying potential director candidates.
For all potential candidates, the Nominating and Governance Committee considers all factors it deemsrelevant, such as a candidate’s personal and professional integrity and sound judgment, business and
10
professional skills and experience, independence, possible conflicts of interest, diversity, and the potential foreffectiveness, in conjunction with the other directors, to serve the long-term interests of the stockholders.While there is no formal policy with regard to consideration of diversity in identifying director nominees, theCommittee considers diversity in business experience, professional expertise, gender and ethnic background,along with various other factors when evaluating director nominees. The Committee uses a matrix offunctional and industry experiences to develop criteria to select candidates. Before being nominated by theNominating and Governance Committee, director candidates are interviewed by the Chief Executive Officerand a minimum of two members of the Nominating and Governance Committee, including the Non-ExecutiveChairman of the Board. Additional interviews may include other members of the Board, representatives fromsenior levels of management and an outside consultant.
The Nominating and Governance Committee will consider all potential nominees on their merits withoutregard to the source of recommendation. The Nominating and Governance Committee believes that thenominating process will and should continue to involve significant subjective judgments. To suggest anominee, you should submit your candidate’s name, together with biographical information and his or herwritten consent to nomination to the Chairman of the Nominating and Governance Committee, WasteManagement, Inc., 1001 Fannin Street, Suite 4000, Houston, Texas 77002, between October 31, 2011 andNovember 30, 2011.
Related Party Transactions
The Board of Directors has adopted a written Related Party Transactions Policy for the review andapproval or ratification of related party transactions. Our policy generally defines related party transactions ascurrent or proposed transactions in excess of $120,000 in which (i) the Company is a participant and (ii) anydirector, executive officer or immediate family member of any director or executive officer has a direct orindirect material interest. In addition, the policy sets forth certain transactions that will not be consideredrelated party transactions, including (i) executive officer compensation and benefit arrangements; (ii) directorcompensation arrangements; (iii) business travel and expenses, advances and reimbursements in the ordinarycourse of business; (iv) indemnification payments and advancement of expenses, and payments under directors’and officers’ indemnification insurance policies; (v) any transaction between the Company and any entity inwhich a related party has a relationship solely as a director, a less than 5% equity holder, or an employee(other than an executive officer); and (vi) purchases of Company debt securities, provided that the relatedparty has a passive ownership of no more than 2% of the principal amount of any outstanding series. TheNominating and Governance Committee is responsible for overseeing the policy.
All executive officers and directors are required to notify the General Counsel or the Corporate Secretaryas soon as practicable of any proposed transaction that they or their family members are considering enteringinto that involves the Company. The General Counsel will determine whether potential transactions orrelationships constitute related party transactions that must be referred to the Nominating and GovernanceCommittee.
The Nominating and Governance Committee will review a detailed description of the transaction,including:
• the terms of the transaction;
• the business purpose of the transaction;
• the benefits to the Company and to the relevant related party; and
• whether the transaction would require a waiver of the Company’s Code of Conduct.
In determining whether to approve a related party transaction, the Nominating and Governance Commit-tee will consider, among other things, whether:
• the terms of the related party transaction are fair to the Company and such terms would be reasonablein an arms-length transaction;
11

• there are business reasons for the Company to enter into the related party transaction;
• the related party transaction would impair the independence of any non-employee director;
• the related party transaction would present an improper conflict of interest for any director or executiveofficer of the Company; and
• the related party transaction is material to the Company or the individual.
Any member of the Nominating and Governance Committee who has an interest in a transactionpresented for consideration will abstain from voting on the related party transaction.
The Nominating and Governance Committee’s consideration of related party transactions and its determi-nation of whether to approve such a transaction are reflected in the minutes of the Nominating and GovernanceCommittee’s meetings.
The following transactions considered by the Nominating and Governance Committee did not constituterelated party transactions under our policy because the ownership of the debt securities was less than 2% ofthe outstanding principal amount of the series; however, we are disclosing them in accordance with SECrequirements:
In 2008, Mr. Steiner, President, Chief Executive Officer and a Director, purchased $300,000 principalamount of the Company’s 6.10% Senior Notes due March 2018 in an open-market transaction. Interestpayments on the notes are made on March 15 and September 15 of each year, with the final interest paymentmade at maturity on March 15, 2018. In 2010, Mr. Steiner received interest payments in the amount of$18,300.
In 2009, Mr. Pope, Non-Executive Chairman of the Board, purchased an aggregate of $600,015 of ourtax-exempt bonds in open-market transactions. Although he no longer owns such bonds, in 2010 he receivedinterest payments on account of the bonds in the amount of $14,450. In 2010, Mr. Pope purchased anaggregate of $400,000 of our tax-exempt bonds in open-market transactions. Mr. Pope purchased $200,000 ofsuch bonds in each of the remarketings that occurred in March 2010 and December 2010 when the interestrates were set at 2.875% and 2.65%, respectively. Mr. Pope received $2,875 in interest related to the bondspurchased in March 2010 and will receive future interest payments in accordance with the terms of the bonds.
The Company is not aware of any other transactions that would require disclosure.
Special Committee
The Board of Directors appointed a Special Committee in November 2006 to make determinationsregarding the Company’s obligation to provide indemnification when and as may be necessary. The SpecialCommittee consists of Mr. Gross and Mr. Weidemeyer. The Special Committee held no meetings in 2010.
Board of Directors Governing Documents
Stockholders may obtain copies of our Corporate Governance Guidelines, the Charters of the AuditCommittee, the MD&C Committee, and the Nominating and Governance Committee, and our Code ofConduct free of charge by contacting the Corporate Secretary, c/o Waste Management, Inc., 1001 FanninStreet, Suite 4000, Houston, Texas 77002 or by accessing the “Corporate Governance” section of the “InvestorRelations” page on our website at http://www.wm.com.
Non-Employee Director Compensation
Our non-employee director compensation program consists of equity awards and cash consideration.Compensation for directors is recommended annually by the Nominating and Governance Committee with theassistance of an independent third-party consultant, and set by action of the Board of Directors. The Board’sgoal in designing directors’ compensation is to provide a competitive package that will enable the Company toattract and retain highly skilled individuals with relevant experience. The compensation also is designed toreward the time and talent required to serve on the board of a company of our size and complexity. The Board
12

seeks to provide sufficient flexibility in the form of compensation delivered to meet the needs of differentindividuals while ensuring that a substantial portion of directors’ compensation is linked to the long-termsuccess of the Company.
Equity Compensation
Non-employee directors receive an annual grant of shares of Common Stock under the Company’s 2009Stock Incentive Plan. There are no restrictions on the shares; however, non-employee directors are subject toownership guidelines that establish a minimum ownership standard and require that all net shares received inconnection with a stock award, after selling shares to pay all applicable taxes, be held during their tenure as adirector and for one year following termination of Board service. The grant of shares is made in two equalinstallments and the number of shares issued is based on the market value of our Common Stock on the datesof grant, which are January 15 and July 15 of each year. In January 2010, the total annual equity grant to non-employee directors was valued at $110,000 and each director received a grant valued at $55,000 on January 15,2010. In July 2010, the value of the annual grant was increased to $130,000 and, as a result, the grants todirectors on July 15, 2010 were valued at $65,000. In addition to the annual grant, Mr. Pope receives a grantof shares valued at $100,000 for his service as Non-Executive Chairman of the Board, which is also awardedin two equal installments on January 15 and July 15 of each year. The grant date fair value of the awards isequal to the number of shares issued times the market value of our Common Stock on that date; there are noassumptions used in the valuation of shares.
Cash Compensation
All non-employee directors receive an annual cash retainer for Board service and additional cash retainersfor serving as a committee chair. Directors do not receive meeting fees in addition to the retainers. The cashretainers are payable in two equal installments in January and July of each year. The payments of the retainersfor each six-month period are not pro-rated, nor are they subject to refund. In July 2010, the Board increasedthe annual cash retainer for Board service and discontinued the cash retainers for committee service, otherthan for the committee chairs. The table below sets forth the cash retainers as of January 1, 2010 and as theyare currently, after the July 2010 increase:
January 1, 2010 July 1, 2010
Annual Retainer $90,000 $105,000
Annual Chair Retainers $100,000 for Non-Executive Chairman No change
$25,000 for Audit Committee Chair No change
$20,000 for MD&C Committee Chair No change
$15,000 for Nominating and Governance Committee Chair No change
Other Annual Retainers $5,000 for Audit Committee service (other than Chair) No retainer
$4,000 for MD&C Committee service (other than Chair) No retainer
The table below shows the aggregate cash paid, and stock awards issued, to the non-employee directorsin 2010 in accordance with the descriptions set forth above:
Name
Fees Earnedor Paid inCash ($)
StockAwards($)(1)
OptionAwards($)(2)
Total($)
John C. Pope, Chairman of the Board . . . . . . . . . . . . . 202,000 220,000 — 422,000
Pastora San Juan Cafferty . . . . . . . . . . . . . . . . . . . . . . 115,000 120,000 — 235,000
Frank M. Clark, Jr. . . . . . . . . . . . . . . . . . . . . . . . . . . . 102,000 120,000 — 222,000
Patrick W. Gross . . . . . . . . . . . . . . . . . . . . . . . . . . . . . 112,500 120,000 — 232,500
W. Robert Reum . . . . . . . . . . . . . . . . . . . . . . . . . . . . . 120,000 120,000 — 240,000
Steven G. Rothmeier . . . . . . . . . . . . . . . . . . . . . . . . . . 112,000 120,000 — 232,000
Thomas H. Weidemeyer . . . . . . . . . . . . . . . . . . . . . . . 99,500 120,000 — 219,500
13

(1) Amounts in this column represent the grant date fair value of stock awards granted in 2010, in accordancewith ASC Topic 718.
(2) The table below shows the number of stock options held by each of our non-employee directors as ofDecember 31, 2010. The options are all fully vested based on their initial terms and all expire ten yearsfrom date of grant. We have not granted any stock options to our non-employee directors since 2002.
Name Grant Date
No. ofSecurities
UnderlyingUnexercised
Options
OptionExercisePrice ($)
John C. Pope . . . . . . . . . . . . . . . . . . . . . . . . . . . . . . . . . . 01/02/2002 10,000 30.24
Pastora San Juan Cafferty . . . . . . . . . . . . . . . . . . . . . . . . . 01/02/2002 10,000 30.24
Steven G. Rothmeier . . . . . . . . . . . . . . . . . . . . . . . . . . . . . 01/02/2002 10,000 30.24
ELECTION OF DIRECTORS(Item 1 on the Proxy Card)
The first proposal on the agenda is the election of eight directors to serve until the 2012 Annual Meetingof Stockholders or until their respective successors have been duly elected and qualified. The Board hasnominated the eight director candidates named below, and recommends that you vote FOR their election. Ifany nominee is unable or unwilling to serve as a director, which we do not anticipate, the Board, byresolution, may reduce the number of directors that constitute the Board or may choose a substitute. Our By-laws provide that if any director nominee does not receive more than 50% of the votes cast for his election, hewill tender his resignation to the Board of Directors. The Nominating and Governance Committee will thenmake a recommendation to the Board on whether to accept or reject the resignation, or whether other actionshould be taken.
The table below shows all of our director nominees; their ages, terms of office on our Board; experiencewithin the past five years; and their qualifications we considered when inviting them to join our Board as wellas nominating them for re-election. We believe that, as a general matter, our directors’ past five years ofexperience gives an indication of the wealth of knowledge and experience these individuals have and that weconsidered; however, we have also indicated the specific skills and areas of expertise we believe makes eachof these individuals a valuable member of our Board.
Director NomineesDirector Qualifications
Pastora San Juan Cafferty, 70Director since 1994Professor Emerita — University of Chicago sinceJune 2005; Professor — University of Chicago from1985 to 2005; and faculty member from 1971 to2005.
Director of Integrys Energy Group, Inc., or one of itspredecessors, since 1988.
Director of Harris Financial Corporation, a privatecorporation, since 1997.
Director of Kimberly Clark Corporation from 1976 to2007.
Ms. Cafferty has significant expertise in areas ofpublic policy, strategic planning, and government andcommunity relations through her 34-yearprofessorship with the University of Chicago, as wellas her experience serving on public boards andcommittees at the federal, state and local levels.Additionally, she has served as a director on multiplepublic company boards and brings over 30 years ofboard experience to the Company.
14

Director Qualifications
Frank M. Clark, Jr., 65Director since 2002Chairman and Chief Executive Officer — ComEd(energy services company and subsidiary of ExelonCorporation) since November 2005; President —ComEd from 2001 to November 2005.
Executive Vice President and Chief of Staff — ExelonCorporation (public utility holding company) from2004 to 2005; Senior Vice President — ExelonCorporation from 2001 to 2004.
Director of Harris Financial Corporation, a privatecorporation, since 2005.
Director of Aetna, Inc. since 2006.
Mr. Clark has served in executive positions at a largepublic utility company for several years, providinghim with extensive experience and knowledge oflarge company management, operations and businesscritical functions. He also brings over eight years ofexperience as a member of a public company boardof directors.
Patrick W. Gross, 66Director since 2006Chairman of The Lovell Group (private investmentand advisory firm) since October 2001.
Director of Capital One Financial Corporation since1995.
Director of Liquidity Services, Inc. since 2001.
Director of Career Education Corporation since 2005.
Director of Taleo Corporation since 2006.
Director of Rosetta Stone, Inc. since 2009.
Director of Computer Network TechnologyCorporation from 1997 to 2006.
Director of Mobius Management Systems, Inc. from2002 to 2007.
Mr. Gross was a founder of American ManagementSystems, Inc., a global business and informationtechnology firm, where he was principal executiveofficer for over 30 years. As a result, he has extensiveexperience in applying information technology andadvanced data analytics in global companies. He alsobrings over 30 years of experience as a director onpublic company boards of directors.
John C. Pope, 62Non-Executive Chairman of the Board since 2004;Director since 1997Chairman of the Board — PFI Group (privateinvestment firm) since July 1994.
Director of R.R. Donnelley & Sons Company, orpredecessor companies, since 1996.
Director of Dollar Thrifty Automotive Group, Inc.since 1997.
Director of Kraft Foods, Inc. since 2001.
Director of Con-way, Inc. since 2003.
Director of Federal Mogul Corporation from 1987 to2007.
Prior to his current service on the boards of multiplemajor corporations, Mr. Pope served in executiveoperational and financial positions at large airlinecompanies for almost 20 years, providing him withextensive experience and knowledge of managementof large public companies. His background, educationand board service also provide him with expertise infinance and accounting. Mr. Pope has over 30 yearsexperience as a director on public company boards.
15

Director Qualifications
W. Robert Reum, 68Director since 2003Chairman, President and CEO — Amsted IndustriesIncorporated (diversified manufacturer for therailroad, vehicular and construction industries) sinceMarch 2001.
Mr. Reum has served as the chief executive of aprivate diversified manufacturing company for tenyears. He also served as Chairman, President andChief Executive Officer of The Interlake Corporation,a public diversified metal products company, from1991 to 1999. As a result, he has extensivemanagement experience within a wide range ofbusiness functions. Mr. Reum also brings over15 years of experience as a director on publiccompany boards.
Steven G. Rothmeier, 64Director since 1997Chairman and CEO — Great Northern Capital(private investment management, consulting andmerchant banking firm) since March 1993.
Director of Precision Castparts Inc. since 1994.
Director of ArvinMeritor, Inc. since 2004.
Director of GenCorp, Inc. from 2000 to 2006.
Mr. Rothmeier served in executive operational andfinancial positions at a large airline company forseveral years. He also has many years of experienceas an executive of asset management, venture capitaland merchant banking firms. His experience andbackground provide him with a broad range ofexpertise in public company issues. Mr. Rothmeierbrings almost 30 years of experience as a director ofa wide range of public companies.
David P. Steiner, 50Chief Executive Officer and Director since 2004;President since June 2010Executive Vice President and Chief Financial Officerfrom April 2003 to March 2004.
Director of Tyco Electronics Corporation since 2007.
Director of FedEx Corporation since 2009.
Mr. Steiner is our President and Chief ExecutiveOfficer and, in that capacity, brings extensiveknowledge of the details of our Company and itsemployees, as well as the front-line experiences ofrunning our Company, to his service as a member ofour Board. Mr. Steiner also brings his experience asa director of other major public companies.
Thomas H. Weidemeyer, 63Director since 2005Chief Operating Officer — United Parcel Service, Inc.(package delivery and supply chain servicescompany) from 2001 to 2003; Senior VicePresident — United Parcel Service, Inc. from 1994 to2003.
President, UPS Airlines (UPS owned airline) from1994 to 2003.
Director of NRG Energy, Inc. since 2003.
Director of The Goodyear Tire & Rubber Companysince 2004.
Director of Amsted Industries Incorporated since2007.
Mr. Weidemeyer served in executive positions at alarge public company for several years. His rolesencompassed significant operational managementresponsibility, providing him knowledge andexperience in an array of functional areas critical tolarge public companies. Mr. Weidemeyer also hasover 10 years of experience as a director on publiccompany boards of directors.
THE BOARD OF DIRECTORS RECOMMENDS THAT YOU VOTE FOR THE ELECTION OFEACH OF THE EIGHT NOMINEE DIRECTORS.
16
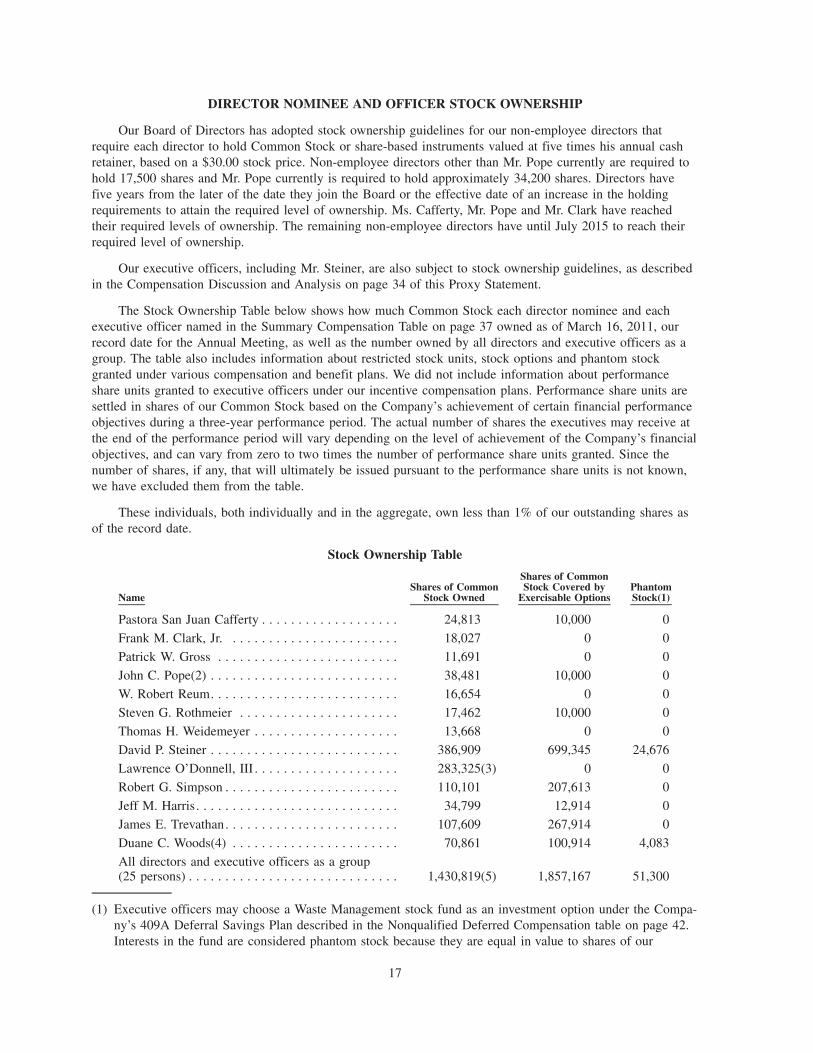
DIRECTOR NOMINEE AND OFFICER STOCK OWNERSHIP
Our Board of Directors has adopted stock ownership guidelines for our non-employee directors thatrequire each director to hold Common Stock or share-based instruments valued at five times his annual cashretainer, based on a $30.00 stock price. Non-employee directors other than Mr. Pope currently are required tohold 17,500 shares and Mr. Pope currently is required to hold approximately 34,200 shares. Directors havefive years from the later of the date they join the Board or the effective date of an increase in the holdingrequirements to attain the required level of ownership. Ms. Cafferty, Mr. Pope and Mr. Clark have reachedtheir required levels of ownership. The remaining non-employee directors have until July 2015 to reach theirrequired level of ownership.
Our executive officers, including Mr. Steiner, are also subject to stock ownership guidelines, as describedin the Compensation Discussion and Analysis on page 34 of this Proxy Statement.
The Stock Ownership Table below shows how much Common Stock each director nominee and eachexecutive officer named in the Summary Compensation Table on page 37 owned as of March 16, 2011, ourrecord date for the Annual Meeting, as well as the number owned by all directors and executive officers as agroup. The table also includes information about restricted stock units, stock options and phantom stockgranted under various compensation and benefit plans. We did not include information about performanceshare units granted to executive officers under our incentive compensation plans. Performance share units aresettled in shares of our Common Stock based on the Company’s achievement of certain financial performanceobjectives during a three-year performance period. The actual number of shares the executives may receive atthe end of the performance period will vary depending on the level of achievement of the Company’s financialobjectives, and can vary from zero to two times the number of performance share units granted. Since thenumber of shares, if any, that will ultimately be issued pursuant to the performance share units is not known,we have excluded them from the table.
These individuals, both individually and in the aggregate, own less than 1% of our outstanding shares asof the record date.
Stock Ownership Table
NameShares of Common
Stock Owned
Shares of CommonStock Covered by
Exercisable OptionsPhantomStock(1)
Pastora San Juan Cafferty . . . . . . . . . . . . . . . . . . . 24,813 10,000 0
Frank M. Clark, Jr. . . . . . . . . . . . . . . . . . . . . . . . 18,027 0 0
Patrick W. Gross . . . . . . . . . . . . . . . . . . . . . . . . . 11,691 0 0
John C. Pope(2) . . . . . . . . . . . . . . . . . . . . . . . . . . 38,481 10,000 0
W. Robert Reum. . . . . . . . . . . . . . . . . . . . . . . . . . 16,654 0 0
Steven G. Rothmeier . . . . . . . . . . . . . . . . . . . . . . 17,462 10,000 0
Thomas H. Weidemeyer . . . . . . . . . . . . . . . . . . . . 13,668 0 0
David P. Steiner . . . . . . . . . . . . . . . . . . . . . . . . . . 386,909 699,345 24,676
Lawrence O’Donnell, III . . . . . . . . . . . . . . . . . . . . 283,325(3) 0 0
Robert G. Simpson . . . . . . . . . . . . . . . . . . . . . . . . 110,101 207,613 0
Jeff M. Harris. . . . . . . . . . . . . . . . . . . . . . . . . . . . 34,799 12,914 0
James E. Trevathan. . . . . . . . . . . . . . . . . . . . . . . . 107,609 267,914 0
Duane C. Woods(4) . . . . . . . . . . . . . . . . . . . . . . . 70,861 100,914 4,083
All directors and executive officers as a group(25 persons) . . . . . . . . . . . . . . . . . . . . . . . . . . . . . 1,430,819(5) 1,857,167 51,300
(1) Executive officers may choose a Waste Management stock fund as an investment option under the Compa-ny’s 409A Deferral Savings Plan described in the Nonqualified Deferred Compensation table on page 42.Interests in the fund are considered phantom stock because they are equal in value to shares of our
17

Common Stock. Phantom stock receives dividend equivalents, in the form of additional phantom stock, atthe same time that holders of shares of Common Stock receive dividends. The value of the phantom stockis paid out, in cash, at a future date elected by the executive. Phantom stock is not considered as equityownership for SEC disclosure purposes; we have included it in this table because it represents an invest-ment risk in the performance of our Common Stock.
(2) The number of shares owned by Mr. Pope includes 435 shares held in trusts for the benefit of his children.
(3) Common Stock ownership is as of June 30, 2010, Mr. O’Donnell’s date of departure from the Company.
(4) The number of shares owned by Mr. Woods includes 125 shares held by his children and 185 shares heldby his wife’s IRA.
(5) Included in the “All directors and executive officers as a group” are 12,668 restricted stock units held byour executive officers not named in the table. Restricted stock units were granted to the executive officersunder our 2009 Stock Incentive Plan. The restricted stock units will be paid out in shares of our CommonStock upon vesting, subject to forfeiture in certain circumstances.
PERSONS OWNING MORE THAN 5% OF WASTE MANAGEMENT COMMON STOCK
The table below shows information for stockholders known to us to beneficially own more than 5% ofour Common Stock based on their filings with the SEC through March 16, 2011.
Name and Address Number Percent(1)
Shares BeneficiallyOwned
Capital World Investors . . . . . . . . . . . . . . . . . . . . . . . . . . . . . . . . . . . . . . . . . . 70,001,400(2) 14.7333 South Hope StreetLos Angeles, CA 90071
Maori European Holding, S.L. (formerly known as Riofisa Holdings, S.L.) . . . . 32,653,680(3) 6.9Arbea Campus EmpresarialEdificio 5Carretera de Fuencarral a Alcobendas M 603Km 3’800 Alcobendas (Madrid)Spain
William H. Gates III . . . . . . . . . . . . . . . . . . . . . . . . . . . . . . . . . . . . . . . . . . . . 27,894,579(4) 5.9One Microsoft WayRedmond, WA 98052
Wellington Management Company, LLP . . . . . . . . . . . . . . . . . . . . . . . . . . . . . . 23,990,195(5) 5.0280 Congress StreetBoston, MA 02210
(1) Percentage is calculated using the number of shares of Common Stock outstanding as of March 16, 2011.
(2) This information is based on a Schedule 13G/A filed with the SEC on February 14, 2011. Capital WorldInvestors reports that it is deemed to be the beneficial owner of 41,886,400 shares of Common Stock as aresult of acting as investment adviser to various investment companies. Additionally, The Income Fund ofAmerica reports that it is the beneficial owner of 28,115,000 shares of Common Stock, but has delegatedvoting authority for all such shares to Capital World Investors. Capital World Investors disclaims beneficialownership of all shares.
(3) This information is based on a Schedule 13G filed with the SEC on June 30, 2008, which is the mostrecent Schedule 13G this investor has filed with respect to ownership of our Common Stock.
(4) This information is based on a Schedule 13G/A filed with the SEC on February 14, 2011. Mr. Gatesreports that he has sole voting and dispositive power over 9,260,907 shares of Common Stock held by Cas-cade Investment, L.L.C., as the sole member of such entity. Additionally, the Schedule 13G/A reports thatMr. Gates and Melinda French Gates share voting and dispositive power over 18,633,672 shares of Com-mon Stock beneficially owned by Bill & Melinda Gates Foundation Trust.
18

(5) This information is based on a Schedule 13G filed with the SEC on February 14, 2011. Wellington Man-agement Company reports that it may be deemed to be the beneficial owner of 23,990,195 shares of Com-mon Stock in its capacity as investment adviser.
SECTION 16(a) BENEFICIAL OWNERSHIP REPORTING COMPLIANCE
The federal securities laws require our executive officers and directors to file reports of their holdings andtransactions in our Common Stock with the SEC and the New York Stock Exchange.
Based on a review of the forms and written representations from our executive officers and directors, webelieve that all applicable requirements were complied with in 2010, except that, due to an error by our planadministrator, each of Mr. Aardsma, Senior Vice President, Sales and Marketing, and Mr. Rush, Senior VicePresident, Organic Growth, was late in filing a Form 4 to report the acquisition of phantom stock under theCompany’s 409A Deferral Savings Plan.
19

EXECUTIVE OFFICERS
The following is a listing of our current executive officers, other than Mr. Steiner, whose personalinformation is included in the Director Nominees section of this Proxy Statement on page 16, their ages andbusiness experience for the past five years.
Name Age Positions Held and Business Experience for Past Five Years
David A. Aardsma . . . . . . . . . . . . 54 • Senior Vice President, Sales and Marketing since January 2005.
Puneet Bhasin . . . . . . . . . . . . . . . 48 • Senior Vice President and Chief Information Officer sinceDecember 2009.
• Senior Vice President — Global Product & Technology, MonsterWorldwide (provider of global online employment solutions) fromApril 2005 to November 2009.
Barry H. Caldwell . . . . . . . . . . . . 50 • Senior Vice President — Government Affairs and CorporateCommunications since September 2002.
Grace M. Cowan . . . . . . . . . . . . . 52 • Senior Vice President — Customer Experience since January2011.
• Senior Vice President — Customer Service, Operations, CNOFinancial Group Inc. (insurance holding company) from October2008 to December 2010.
• Senior Vice President — National Practice Leader U.S., AonCorporation (provider of risk management services, insurance andreinsurance brokerage and human resources consulting andoutsourcing services) from June 2008 to October 2008.
• Senior Vice President — Customer Service, UnderwritingOperations, MetLife, Inc. (global provider of insurance, annuitiesand employee benefit programs) from 2000 to 2008.
Patrick J. DeRueda . . . . . . . . . . . 49 • President, WM Recycle America, L.L.C., a wholly-ownedsubsidiary of the Company, since March 2005.
Brett W. Frazier. . . . . . . . . . . . . . 56 • Senior Vice President — Eastern Group since June 2007.
• Vice President — Collections Operation Support from February2006 to June 2007.
• Vice President — Operations Improvement from November 2005to February 2006.
Jeff M. Harris . . . . . . . . . . . . . . . 56 • Senior Vice President — Midwest Group since April 2006.
• Area Vice President — Michigan Market Area from April 2000 toApril 2006.
Cherie C. Rice. . . . . . . . . . . . . . . 48 • Vice President — Finance since May 2004, and Treasurer sinceJanuary 2004.
Greg A. Robertson. . . . . . . . . . . . 57 • Vice President and Chief Accounting Officer since March 2004.
Michael J. Romans . . . . . . . . . . . 60 • Senior Vice President, People since January 2007.
• Senior Vice President — Human Resources, The St. Joe Company(real estate operating company) from May 2006 to January 2007.
• Senior Vice President — Human Resources, Hughes Supply, Inc.(wholesale distributor of construction, repair and maintenance-related products) from December 2004 to March 2006.
20

Name Age Positions Held and Business Experience for Past Five Years
Carl V. Rush, Jr . . . . . . . . . . . . . . 55 • Senior Vice President — Organic Growth since December 2010.
• Vice President — Organic Growth from January 2006 toDecember 2010.
Robert G. Simpson . . . . . . . . . . . 59 • Senior Vice President and Chief Financial Officer since March2004.
James E. Trevathan . . . . . . . . . . . 58 • Senior Vice President — Southern Group since July 2007.
• Senior Vice President — Eastern Group from July 2004 to June2007.
Mark A. Weidman . . . . . . . . . . . . 54 • President of Wheelabrator Technologies Inc., a wholly-ownedsubsidiary of the Company, since March 2006.
• Vice President — Operations of Wheelabrator from June 2001 toMarch 2006.
Rick L Wittenbraker . . . . . . . . . . 63 • Senior Vice President, General Counsel and Chief ComplianceOfficer since November 2003.
Duane C. Woods . . . . . . . . . . . . . 59 • Senior Vice President — Western Group since July 2004.
21

EXECUTIVE COMPENSATIONCompensation Discussion and Analysis
Executive Summary
The objective of our executive compensation program is to attract, retain, reward and incentivizeexceptional, talented employees who will lead the Company in the successful execution of its strategy. TheCompany seeks to accomplish this goal by designing a compensation program that is supportive of and alignswith the strategy of the Company and the creation of stockholder value. Our MD&C Committee believes theexecutive compensation program for 2010 fulfilled its objective by helping the Company overcome achallenging business environment and achieve strong performance. Further, the MD&C Committee believesthe compensation of the Company’s executive officers set forth in the Summary Compensation Table of thisProxy Statement, whom we refer to as the “named executive officers” or “named executives,” evidences ourcommitment to link executive pay with Company performance.
Our executive compensation program provides for a significant difference in total compensation in periodsof above-target Company performance as compared to periods of below-target Company performance. We arepleased with the Company’s 2010 accomplishments, which reflect discipline in pricing, ability to control costsin our collection and disposal operations and continued production of strong cash flow. The Companygenerated revenues of $12.5 billion in 2010, compared with $11.8 billion in 2009, an increase of $724 million,or 6.1%. Our collection, landfill, and recycling businesses performed strongly, as each of these business linesincreased both their operating earnings and operating margins compared with the prior year period, and for thefull year 2010, we outpaced our long-term pricing objective of achieving price increases of at least 50 to100 basis points above the consumer price index. Accordingly, the annual cash incentive awards for 2010 thatare based on Company-wide performance metrics warranted an above-target payout. However, our emphasison performance-based compensation may result in the loss of one or more significant components of thenamed executives’ target annual compensation. This was the case in 2010, as the threshold performancecriteria were not met for performance share units that would have been earned for the three-year performanceperiod ended December 31, 2010. The MD&C Committee is dedicated to the principle that executivecompensation should be substantially linked to the performance of the Company.
In late 2010, the MD&C Committee considered the evolution of the strategy of the Company into adifferentiation strategy to grow the Company through three long-term goals: know more about our customersand how to service them than anyone else; use conversion and processing technology to extract more valuefrom the materials we manage; and continuously improve our operational efficiency. The MD&C Committeedetermined that, in light of the growth-focused strategy of the Company, it was necessary to review theCompany’s overall executive compensation structure. Key considerations included:
• Ensuring compensation is appropriately weighted toward long-term incentives;
• Emphasizing profitable revenue growth and cost controls;
• Encouraging aspirational goals that will drive a change in Company-wide culture; and
• Avoiding an overly complex compensation program that may confuse or de-motivate employees.
As a result of these considerations and our growth-oriented strategy, we have made changes to ourexecutive compensation program for 2011. As will be described in more detail in next year’s executivecompensation discussion and analysis, these changes include:
• Increasing the weighting of stock options in our long-term incentive plan awards to 70% stock optionsand 30% performance share units, which better aligns the Company with equity compensation practicesof growth-oriented companies and motivates our executives to aggressively focus on growth;
• Allocating emphasis on performance metrics for our annual cash bonus plan that will make sure growthis disciplined;
22
• Applying a revenue multiplier to the annual cash bonus plan to incentivize employees to strive beyonda specific target for growth; in order to maintain a focus on profitable growth, the revenue multiplier isonly applied if EBITDA targets are first achieved; and
• Altering the overall compensation allocation of operational leaders to increase the weight of long-termequity compensation.
The MD&C Committee recognizes that, while it is critical that the Company grow, it is equally criticalthat the Company grow in a way that rewards our stockholders. In furtherance of that goal, the MD&CCommittee believes the 2011 executive compensation plan will best align our executive compensation structurewith the overall Company strategy and will best motivate the performance we seek to reward.
Our Compensation Philosophy for Named Executive Officers
The Company’s compensation philosophy is designed to:
• Attract and retain exceptional employees;
• Encourage and reward performance; and
• Align our decision makers’ long-term interests with those of our stockholders.
With respect to our named executive officers, the MD&C Committee believes that total direct compensa-tion should be targeted at a range around the competitive median according to the following:
• Base salaries should be paid within a range around the competitive median, but attention must be givento individual circumstances, including strategic importance of the named executive’s role, theexecutive’s experience and individual performance; and
• Short- and long-term incentive opportunities should be within a range around the competitive median.
Highlights of 2010 Named Executive Officer Compensation
• The Company’s salary freeze, put into effect in early 2009, was lifted, and each of Mr. Steiner andMr. Simpson received a 2% increase in base pay, in line with the Company-wide budget;
• Annual cash bonuses were contingent on crossing an initial “gate” of minimum pricing improvements;after crossing the gate, financial metrics used for annual cash bonus targets included (i) income fromoperations as a percentage of revenues and (ii) income from operations, net of depreciation andamortization;
• Actual bonus payments made in March 2011 for fiscal 2010 were 112% of target for Messrs. Steiner,Simpson and O’Donnell, based on Company-wide performance, and were 156%, 101% and 92% forMessrs. Harris, Trevathan and Woods, respectively;
• Long-term incentive awards granted to named executives consisted of (i) 50% performance share unitswith a three-year performance period ending December 31, 2012, which may be earned based on theachievement of a pre-determined return on invested capital, or ROIC, goal and (ii) 50% stock optionswhich vest in 25% increments on the first two anniversaries of the grant date, with the remaining 50%vesting on the third anniversary date;
• Performance criteria were not met for the performance share units that were granted in 2008 with thethree-year performance period ended December 31, 2010. As a result, no performance share unitswere earned;
• On June 2, 2010, we announced that one of our named executives, Lawrence O’Donnell, III, wasleaving the Company. David Steiner assumed the role of President effective as of the announcement.We entered into an employment termination agreement with Mr. O’Donnell, pursuant to which hisdeparture was treated as a termination without cause by the Company, entitling him to certain
23

payments, compensation and benefits provided for in his employment agreement and set forth under“Potential Consideration Upon Termination of Employment” below.
Key Elements of Our Compensation Program
Base Salary. We pay base salaries to our named executives to provide them with sufficient, regularlypaid income appropriate for their respective positions and responsibilities. The amounts of the base salaries wepay are meant to help us in attracting and retaining the best employees.
Annual Cash Bonus. We grant annual cash bonuses pursuant to our 2005 Annual Incentive Plan. Ournamed executives’ bonuses are targeted at a percentage of base salary. Since 2007, our named executives’bonuses have been earned based solely on the achievement of Company financial measures and could rangefrom zero to 200% of target. We tie our named executives’ bonuses to the achievement of Company financialmeasures because these individuals have the highest level of decision making authority and, therefore, themost ability to influence the Company’s results of operations. As a result, we believe it is appropriate to puttheir entire bonus at risk based on whether the financial goals of the Company are achieved. Additionally, webelieve this level of objective determination and transparency for these individuals’ compensation is appropri-ate and important to stockholders. In cases of individual performance that varies significantly fromexpectations, the MD&C Committee has the discretion to increase or decrease the calculated incentivepayment by up to 25%, resulting in a modified payout for the named executive. This modifier has never beenused for a named executive officer.
The financial measures chosen for our named executive officers’ bonus calculations are those that webelieve drive behaviors that increase value to our stockholders and are appropriately measured on an annualbasis, and performance targets are designed to be challenging, yet achievable. In order for named executives tobe eligible for an annual cash bonus in 2010, certain minimum pricing improvement targets were required tobe met. This performance “gate” was intended to ensure that employees were maintaining discipline inexecuting our pricing programs. Annual cash bonuses were further dependent on (i) income from operations asa percentage of revenues, which is meant to motivate employees to control and lower costs, operate efficientlyand drive our pricing programs, thereby increasing our income from operations margin, and (ii) income fromoperations, net of depreciation and amortization, which is an indication of our ability to generate cash flowsbefore interest and taxes. We believe the ability to grow our cash flow is an important metric to ourstockholders and drives stockholder value.
Long-Term Equity Incentives. We grant annual equity awards to our named executive officers under our2009 Stock Incentive Plan. For several years, it has been our practice to grant performance share units with aperformance period of three years to motivate our named executive officers to act in a manner that canincrease the value of the Company over time. The number of performance share units granted to our namedexecutive officers corresponds to an equal number of shares of Common Stock. At the end of the three-yearperformance period for each grant, the Company will deliver a number of shares ranging from 0% to 200% ofthe initial number of units granted, depending on the Company’s three-year performance against a pre-established ROIC target and subject to the general payout and forfeiture provisions. ROIC in our plan isdefined generally as net operating profit after taxes divided by capital. Capital is comprised of long-term debt,noncontrolling interests and stockholders’ equity, less cash. Since 2007, performance share units earn dividendequivalents, which are paid out based on the number of shares actually awarded, if any, at the end of theperformance period. Recipients can defer receipt of the shares issuable under their performance share unitawards until a specified date or dates they choose. Deferred amounts are not invested, nor do they earninterest, but deferred amounts do earn dividend equivalents during deferral. Deferred amounts are paid out inshares of Common Stock at the end of the deferral period.
We believe that the profitable allocation of capital is critical to the long-term success of the Company.Using ROIC as a measure for incentive compensation purposes ensures that decisions are made with the bestlong-term interests of the Company in mind. ROIC is an indicator of our ability to generate returns for ourstockholders. We believe that earnings growth is important and an appropriate measure for our annual bonuses.However, creating value over time is also important, and we therefore chose the three-year performance period
24

for our long-term incentive compensation. We believe that using a three-year average of ROIC incentivizes ournamed executive officers to ensure the strategic direction of the Company is being followed and forces themto balance the short-term incentives awarded for growth with the long-term incentives awarded for valuegenerated.
In 2010, the MD&C Committee decided to re-introduce stock options as a component of the equitycompensation awarded to our named executive officers in order to direct focus on increasing the market valueof our Common Stock. Stock options were granted in the first quarter of 2010 in connection with the annualgrant of long-term equity awards at a regularly scheduled MD&C Committee meeting.
Post-Employment Compensation. The compensation our named executives receive post-employment isbased on provisions included in individual equity award agreements, retirement plan documents and employ-ment agreements. We enter into employment agreements with our named executive officers because theyprovide a form of protection for the Company through restrictive covenant provisions. They also provide theindividual with the protection that he will be treated fairly in the event of a termination not for cause or undera change-in-control situation. The change-in-control provision included in each named executive officer’sagreement requires a double trigger in order to receive any payment in the event of a change-in-controlsituation. First, a change-in-control must occur, and second the individual must terminate his employment forgood reason or the Company must terminate his employment without cause within six months prior to or twoyears following the change-in-control event. We believe providing a change-in-control protection ensuresimpartiality and objectivity of our named executive officers in the context of a change-in-control situation andprotects the interests of our stockholders.
In August 2005, the MD&C Committee approved an Executive Officer Severance Policy. The policygenerally provides that after the effective date of the policy, the Company may not enter into severancearrangements with its executive officers, as defined in the federal securities laws, that provide for benefits, lessthe value of vested equity awards and benefits provided to employees generally, in an amount that exceeds2.99 times the executive officer’s then current base salary and target bonus, unless such future severancearrangement receives stockholder approval. The policy applies to all of our named executive officers.
Deferral Plan. Each of our named executive officers is eligible to participate in our 409A DeferredSavings Plan. The plan allows all employees with a minimum base salary of $170,000 to defer up to 25% oftheir base salary and up to 100% of their annual bonus (“eligible pay”) for payment at a future date. Underthe plan, the Company matches the portion of pay that cannot be matched in the Company’s 401(k) SavingsPlan due to IRS limits. The Company match provided under the 401(k) Savings Plan and the Deferral Plan isdollar for dollar on the first 3% of eligible pay, and fifty cents on the dollar for the next 3% of eligible pay.Participants can contribute the entire amount of their eligible pay to the Deferral Plan. Contributions in excessof the 6% will not be matched but will be tax-deferred. Company matching contributions begin in the DeferralPlan once the employee has reached the IRS limits in the 401(k) plan. Funds deferred under this plan areallocated into accounts that mirror selected investment funds in our 401(k) plan, although the funds deferredare not actually invested in the funds. We believe that providing a program that allows and encouragesplanning for retirement is a key factor in our ability to attract and retain talent. Additional details on the plancan be found in the Nonqualified Deferred Compensation table and the footnotes to the table on page 42.
Perquisites. We have eliminated all perquisites for our named executive officers.
Based on a periodic security assessment by an outside consultant, for security purposes, the Companyrequires the Chief Executive Officer to use the Company’s aircraft for business and personal use. Use of theCompany’s aircraft is permitted for other employees’ personal use only with Chief Executive Officer approvalin special circumstances, which seldom occurs. The value of our named executives’ personal use of theCompany’s airplanes, if any, is treated as taxable income to the respective executive in accordance with IRSregulations using the Standard Industry Fare Level formula. This is a different amount than we disclose in theSummary Compensation Table, which is based on the SEC requirement to report the incremental cost to us oftheir use.
25

How Named Executive Officer Compensation Decisions are Made
The MD&C Committee meets several times each year to perform its responsibilities as delegated by theBoard of Directors and as set forth in the MD&C Committee’s charter. These responsibilities includeevaluating and approving the Company’s compensation philosophy, policies, plans and programs for ournamed executive officers.
In the performance of its duties, the MD&C Committee regularly reviews the total compensation,including the base salary, target annual bonus award opportunities, long-term incentive award opportunitiesand other benefits, including potential severance payments for each of our named executive officers. At aregularly scheduled meeting each year, the MD&C Committee reviews our named executives’ total compensa-tion and compares that compensation to the competitive market, as discussed below. In the first quarter ofeach year, the MD&C Committee meets to determine salary increases, if any, for the named executive officers;verifies the results of the Company’s performance for annual incentive and performance share unit calcula-tions; reviews the individual annual incentive targets for the current year as a percent of salary for each of thenamed executive officers; and makes decisions on granting long-term equity awards.
Compensation Consultant. The MD&C Committee uses several resources in its analysis of the appropri-ate compensation for the named executive officers. The MD&C Committee employs an independent consultantto provide it advice relating to market and general compensation trends. The consultant is selected and hiredby the MD&C Committee. The MD&C Committee also uses the services of its independent consultant fordata gathering and analyses, which it uses for its discussions of and decisions on the named executive officers’compensation. The MD&C Committee has retained Frederic W. Cook & Co., Inc. as its independent consultantsince 2002. The Company makes regular payments to Frederic W. Cook for its services around executivecompensation, including meeting preparation and attendance, advice, best practice information, as well ascompetitive data. Such payments are submitted to the chair of the MD&C Committee.
In addition to services related to executive compensation, the consultant also provides the Board ofDirector’s Nominating and Governance Committee information and advice related to director compensation.The Nominating and Governance Committee takes these recommendations into consideration when recom-mending compensation of the independent directors. Frederic W. Cook has no other business relationships withthe Company and receives no other payments from the Company. In February 2008, the MD&C Committeeadopted a written policy to ensure the independence of any compensation consultants utilized by the MD&CCommittee for executive compensation matters. Pursuant to the policy, no compensation consultant engagedby the MD&C Committee to assist in determining or recommending the compensation of executive officers orindependent directors of the Board of Directors may be engaged by management of the Company to provideany other services unless first approved by the MD&C Committee. Since the adoption of the policy, noengagements have been proposed to the MD&C Committee for approval.
Role of CEO. Mr. Steiner also plays a part in determining compensation, as he assesses the performanceof the named executive officers reporting to him and reports these assessments with recommendations to theMD&C Committee. Personnel within the Company’s People Department assist the MD&C Committee byworking with the independent consultant to provide information requested by the MD&C Committee andassisting it in designing and administering the Company’s incentive programs.
Peer Company Comparisons. One of the data sources used by the MD&C Committee is compensationinformation of a comparison group of companies. The purpose of the comparisons of our named executives’compensation with executives at other companies is to gauge the competitive market. This market is relevantfor attracting and retaining key talent and also for ensuring that the Company’s compensation practices arealigned with general practices. Each of our named executive officers has been promoted to his current positionfrom within the Company.
26

For purposes of establishing the 2010 executive compensation program, the independent consultantprovided the MD&C Committee with a competitive analysis of total direct compensation levels andcompensation mixes for our executive officers, using information from:
• market data of 61 general industry companies with revenues ranging from $9.0 to $19.7 billion(excluding private companies, subsidiaries and financial companies) prepared by Hewitt Associates; and
• a comparison group of 20 companies, described below.
The comparison group of companies is initially recommended by the independent consultant prior to theactual data gathering process, with input from management. The composition of the group is evaluated and afinal comparison group of companies is approved by the MD&C Committee each year. The selection processfor the comparison group begins with all companies in the Standard & Poor’s North American database thatare publicly traded U.S. companies in 17 different Global Industry Classifications. These industry classifica-tions are meant to provide a collection of companies in industries that share similar characteristics with WasteManagement. The companies are then limited to those with at least $5 billion in annual revenue to ensureappropriate comparisons, and further narrowed by choosing those with asset intensive domestic operations, aswell as those focusing on transportation and logistics. Finally, we focus on companies that identify us as apeer. Companies with these characteristics are chosen because the MD&C Committee believes that it isappropriate to compare our executives’ compensation with executives that have similar responsibilities andchallenges at other companies. The comparison group used for consideration of 2010 compensation iscomposed of the companies listed below:
American Electric PowerBaker Hughes
Burlington Northern Santa FeCH Robinson
CSXEntergyFedEx
FPL GroupGrainger
Halliburton
HertzNorfolk SouthernRepublic Services
RyderSchlumberger
Southern CompanySysco
Union PacificUnited Parcel Service
YRC Worldwide
The market and the comparison group data are blended when composing the competitive analysis, whenpossible, such that each data source is weighted 50%. The competitive analysis shows that the Company’snamed executives’ total direct compensation opportunities are positioned in the median range of thecompensation of the executives comprising the competitive analysis. For competitive comparisons, the MD&CCommittee has determined that total direct compensation packages for our named executive officers within arange of plus or minus twenty percent of the median total compensation of the competitive analysis isappropriate. In making these determinations, total direct compensation consists of base salary, target annualbonus, and the annualized grant date fair value of long-term equity incentive awards. When the competitiveanalysis was reviewed in 2009 and 2010, it showed that none of our named executive officers’ total directcompensation was above the median for their peers in the competitive analysis.
Allocation of Compensation Elements and Tally Sheets. The MD&C Committee considers the forms inwhich total compensation will be paid to executive officers and seeks to achieve an appropriate balancebetween base salary, annual cash incentive compensation and long-term incentive compensation. The MD&CCommittee determines the size of each element based primarily on comparison group data and individual andCompany performance. The percentage of compensation that is contingent on achievement of performancecriteria typically increases in correlation to an executive officer’s responsibilities within the Company, with at-risk performance-based incentive compensation making up a greater percentage of total compensation for ourmost senior executive officers. Additionally, as an executive becomes more senior, a greater percentage of theexecutive’s compensation shifts away from short-term to long-term incentive awards.
27

The MD&C Committee uses tally sheets to review the compensation of our named executive officers,which show the cumulative impact of all elements of compensation. These tally sheets include detailedinformation and dollar amounts for each component of compensation, the value of all equity held by eachnamed executive, and the value of welfare and retirement benefits and severance payments. Tally sheetsprovide the MD&C Committee with the relevant information necessary to determine whether the balancebetween long-term and short-term compensation, as well as fixed and variable compensation, is consistent withthe overall compensation philosophy of the Company. This information is also useful in the MD&CCommittee’s analysis of whether total direct compensation provides a compensation package that is appropri-ate and competitive. Tally sheets are provided to the full Board of Directors.
The following charts display the allocation of total 2010 compensation among base salary, annual cashincentive at target and long-term incentives at target for our Chief Executive Officer and for Messrs. Harris,Trevathan and Woods, on average. These charts reflect the MD&C Committee’s 2010 desired total mix ofcompensation for Senior Group Vice Presidents, which includes approximately 40% of total compensationrelating to long-term equity, while long-term equity comprises almost 65% of Mr. Steiner’s totalcompensation.
Chief Executive Officer
17%
19%64%
Senior Group Vice Presidents (average)
33%
28%
Base Salary
Annual CashIncentiveLong-TermIncentive
39%
In the process of establishing the 2011 executive compensation program, the MD&C Committeedetermined that the compensation of our Senior Group Vice President position was weighted too heavily infavor of short-term incentives in comparison to our peers. As a result, the MD&C Committee has revised theallocation of 2011 targeted compensation of Senior Group Vice Presidents that are named executives as shownbelow to shift emphasis toward long-term incentives:
Senior Group Vice Presidents (average)2011 Target Compensation
29%
22%
49%
Base Salary
Annual CashIncentiveLong-TermIncentive
Internal Pay Equity. The MD&C Committee considers the differentials between compensation of theindividual named executive officers, as well as the additional responsibilities of the President and ChiefExecutive Officer compared to the other executive officers. Internal comparisons are also made betweenexecutive officers and their direct reports. The MD&C Committee confirms that the compensation paid toexecutive officers is reasonable compared to that of their direct reports, while recognizing that an executive’sactual total compensation, as a multiple of the total compensation of his or her subordinates, will increase inperiods of above-target performance and decrease in times of below-target performance.
Tax Matters. The MD&C Committee complies with the performance-based compensation exemptionunder Section 162(m) of the Internal Revenue Code when appropriate. Section 162(m) generally limits a
28

company’s ability to deduct compensation paid in excess of $1 million during any fiscal year to the ChiefExecutive Officer or any of the other named executive officers unless the excess amount is performance-based.Throughout the following discussion we have noted the programs that are designed to meet the Section 162(m)requirements.
Risk Assessment. The MD&C Committee also seeks to structure compensation that will providesufficient incentives for named executive officers to drive results while avoiding unnecessary or excessive risktaking that could harm the long-term value of the Company. The MD&C Committee believes that thefollowing measures help achieve this goal:
• Named executives are provided with competitive base salaries that are not subject to performance risk,which helps to mitigate risk-taking behaviors and provides an incentive for executives to retain theiremployment with the Company;
• The MD&C Committee has a clawback policy designed to recoup annual cash incentive payments andperformance share units when the recipient’s personal misconduct results in a restatement or otherwiseaffects the payout calculations for the awards;
• The MD&C Committee relies on detailed processes to establish the Company financial performancemeasures under our incentive plans;
• Measures are calibrated to maintain directional alignment with pay and performance;
• Measures are designed to be challenging, yet achievable, to mitigate the potential for excessive risk-taking behaviors;
• Our annual cash incentive and performance share unit awards generally provide for a range of payoutsdependent on achievement within ranges of performance, which are less likely to encourage inappropri-ate risk-taking behaviors than a single measurement that provides an “all-or-nothing” basis forcompensation;
• Maximum payouts of incentive awards have reasonable caps, reducing the likelihood of inappropriateor overly-aggressive actions for exorbitant payouts;
• Long-term equity incentive awards are granted annually to allow executives to accumulate these awardsand become further vested in the longer-term sustainability of our business; and
• Performance share units’ three-year performance period and stock options’ three-year vesting periodallow overlap of such periods to reduce the incentive to maximize performance in any one year.
During 2010, the MD&C Committee reviewed the Company’s assessment of compensation risk of theCompany’s incentive plans, which was conducted with guidance from the independent compensation consult-ant. The MD&C Committee concluded that our compensation policies do not create risks that are reasonablylikely to have a material adverse effect on the Company.
Named Executives’ 2010 Compensation Program
Base Salary — Each of our named executive officers is party to an employment agreement approved byour MD&C Committee that provides for a base salary that, once increased, may not be reduced. The MD&CCommittee’s annual decisions regarding base salaries generally relate to merit increases, if any, as each of ournamed executive officers has been in his current role for several years. In determining annual merit increases,the Company looks at competitive market data for cost of labor increases and considers executives’ individualperformance and impact on the Company. In early 2009, the MD&C Committee determined that because ofeconomic conditions, no named executive officers would receive an annual merit increase; however, that salaryfreeze was lifted for all Company employees in 2010, and each of Mr. Steiner and Mr. Simpson received a 2%increase in base salary, in line with the Company-wide budget. The base salaries of the Group Senior VicePresidents were determined to be on the high side of our target range around the competitive median, and as a
29

result, none of the Group Senior Vice Presidents that are named executives received an increase in base salary.The table below shows the 2010 base salary for each of our named executive officers:
Named Executive Officer Base Salary
Mr. Steiner . . . . . . . . . . . . . . . . . . . . . . . . . . . . . . . . . . . . . . . . . . . . . . . . . . . . . . . . . $1,100,000Mr. Simpson . . . . . . . . . . . . . . . . . . . . . . . . . . . . . . . . . . . . . . . . . . . . . . . . . . . . . . . . $ 531,405Mr. Harris . . . . . . . . . . . . . . . . . . . . . . . . . . . . . . . . . . . . . . . . . . . . . . . . . . . . . . . . . . $ 536,278Mr. Trevathan . . . . . . . . . . . . . . . . . . . . . . . . . . . . . . . . . . . . . . . . . . . . . . . . . . . . . . . $ 566,298Mr. Woods . . . . . . . . . . . . . . . . . . . . . . . . . . . . . . . . . . . . . . . . . . . . . . . . . . . . . . . . . $ 565,710Mr. O’Donnell . . . . . . . . . . . . . . . . . . . . . . . . . . . . . . . . . . . . . . . . . . . . . . . . . . . . . . . $ 775,288
Annual Cash Bonus — The percentages of base salary targets for the annual bonuses of the namedexecutive officers were set when the individuals were promoted to their current roles. These target percentagesare reviewed annually to ensure they are still appropriate given the competitive market and the individuals’responsibilities and performance. Additionally, each year the MD&C Committee determines the financialmeasures that will be used for the named executives’ bonus determinations and sets the threshold, target andmaximum measures necessary for bonus payments. The MD&C Committee makes these determinations basedon what it believes are most likely to both drive and reward performance that is beneficial to the Companyand stockholders.
The annual bonus plan is designed to comply with the performance-based compensation exemption underSection 162(m) of the Code by allowing the MD&C Committee to set performance criteria for payments,which may not exceed the predetermined amount of 0.5% of the Company’s pre-tax income per participant.
In 2010, the MD&C Committee continued an action it took in early 2009 to emphasize the Company’spricing excellence, wherein we focus on ensuring we receive appropriate pricing for all of our services. Weare committed to our pricing program and we do not intend to accept volumes at prices that do not providestrong operating margins. As a result, the MD&C Committee included a feature to our annual bonus plan thatrequires minimum pricing improvement targets to be achieved in order for employees to be eligible to receivea bonus. Upon achievement of the Corporate pricing improvement measure, all named executive officerswould be bonus eligible. If the Corporate measure was not met, field-based named executive officers, whichinclude Mr. Harris, Mr. Trevathan and Mr. Woods, would still be eligible for a bonus payment to the extent hisrespective Group pricing improvement measure was met. The Company met the Corporate pricing improve-ment target and as a result, each of the named executives was eligible to receive his 2010 annual bonuspayment, as calculated based on the income from operations margin and income from operations excludingdepreciation and amortization performance metrics set forth below. The pricing improvement targets, shown inthe table below, were a weighted average rate per unit increase, based on commercial, residential and industrialcollection operations; transfer stations; and municipal solid waste and construction and demolition volumes atour landfills.
Named Executive OfficerPricing Improvement
Target Required*
Corporate:Mr. Steiner . . . . . . . . . . . . . . . . . . . . . . . . . . . . . . . . . . . . . . . . . . . . . . . . . . 3.0%Mr. O’Donnell. . . . . . . . . . . . . . . . . . . . . . . . . . . . . . . . . . . . . . . . . . . . . . . . 3.0%Mr. Simpson . . . . . . . . . . . . . . . . . . . . . . . . . . . . . . . . . . . . . . . . . . . . . . . . . 3.0%
Respective Groups:Mr. Harris — Midwest Group . . . . . . . . . . . . . . . . . . . . . . . . . . . . . . . . . . . . 3.5%Mr. Trevathan — Southern Group. . . . . . . . . . . . . . . . . . . . . . . . . . . . . . . . . . 3.4%Mr. Woods — Western Group . . . . . . . . . . . . . . . . . . . . . . . . . . . . . . . . . . . . 2.4%
* The pricing measures used for these calculations are not the same as “yield” as we present in any of our dis-closures, such as the Management’s Discussion and Analysis section of our Forms 10-K and 10-Q or ourearnings press releases, and the targeted increases shown in the table should not be construed as a targetedincrease in “yield” as discussed in those disclosures.
30

For purposes of 2010 annual cash bonuses for corporate-level employees, including Messrs. Steiner,Simpson and O’Donnell, performance is measured using the Company’s consolidated results of operations.The table below sets forth the Company-wide performance measures set by the MD&C Committee for thecorporate-level named executive officers’ bonuses earned in 2010. Each of the performance measures wasassigned equal weight.
ThresholdPerformance
(60% Payment)
TargetPerformance
(100% Payment)
MaximumPerformance
(200%Payment)
Income from Operations Margin . . . . . . . . . . 16.4% 17.4% 19.1%
Income from Operations excludingDepreciation and Amortization . . . . . . . . . $3,028 million $3,364 million $3,700 million
The 2010 annual cash bonuses of Messrs. Harris, Trevathan and Woods were calculated using (i) theCompany’s consolidated results of operations for measuring income from operations margin and (ii) theirrespective field-based results of operations for measuring income from operations excluding depreciation andamortization. We believe using field-based results for this measure is appropriate because it ties our field-based named executive officers’ compensation directly to the success or failure of operations over which theyhave direct control. Each of the two performance measures was assigned equal weight; however, in the case ofMessrs. Trevathan and Woods, the measure “income from operations excluding depreciation and amortization”was comprised of two separate equally-weighted calculations. The first calculation was based solely on resultsof operations for their respective Group; the second calculation was based on results of operations for theirrespective Group, as integrated with operations of our Wheelabrator subsidiary that are not a component of theGroup’s calculated results for financial reporting purposes, but which are located physically within the Group’sgeographic area. This calculation, which we refer to as the Group’s “integrated” performance measure, isintended to encourage the large geographic Groups to support and collaborate with Wheelabrator’s operationsin their area. The following table sets forth the “income from operations excluding depreciation andamortization” performance measure, on a stand alone and an integrated basis, as set by the MD&C Committeefor the respective Groups of Messrs. Harris, Trevathan and Woods:
ThresholdPerformance
(60% Payment)
TargetPerformance
(100% Payment)
MaximumPerformance
(200%Payment)(In millions) (In millions) (In millions)
Midwest Group (Mr. Harris) . . . . . . . . . . . . . . . $ 699 $ 777 $ 855
Integrated: Midwest Group (Mr. Harris) . . . . . . N/A N/A N/A
Southern Group (Mr. Trevathan) . . . . . . . . . . . . $1,040 $1,155 $1,271
Integrated: Southern Group (Mr. Trevathan) . . $1,142 $1,269 $1,396
Western Group (Mr. Woods) . . . . . . . . . . . . . . . $ 788 $ 875 $ 963
Integrated: Western Group (Mr. Woods) . . . . . . $ 795 $ 883 $ 971
The MD&C Committee believes that the 2010 financial performance measures were goals that appropri-ately drove behaviors to create performance and results, in particular focusing on generating profitablerevenue, cost cutting and cost control, and making the best use of our assets. When setting performancemeasure goals each year, the MD&C Committee looks to the Company’s historical results of operations andanalyses and forecasts for the coming year. Specifically, the MD&C Committee considers expected revenuebased on analyses of pricing and volume trends, as affected by operational and general economic factors;expected wage, maintenance, fuel and other operational costs; and expected selling and administrative costs.Based on this information and in light of general economic conditions and indicators in early 2010, theMD&C Committee determined that the target performance under the annual bonus plan should be increased ascompared to the prior year’s target and actual performance. The MD&C Committee discussed the effects therecessionary environment was having on the Company’s results of operations and the challenges that theCompany was facing in 2010, but determined the improvement in performance targeted by the performancemeasures was reasonable and appropriate for 2010.
31

In determining whether Company financial performance measures have been met, the MD&C Committeehas discretion to make adjustments to the calculations for unusual or otherwise non-operational matters that itbelieves do not accurately reflect results of operations expected from management for bonus purposes. In2010, actual results were adjusted to exclude the effects of: (i) revisions of estimates associated principallywith remedial liabilities at closed sites; (ii) the accounting effect of changes in ten-year Treasury rates, whichare used to discount remediation reserves; (iii) expense charges incurred as a result of employees of fivebargaining units agreeing to our proposal to withdraw them from an under-funded multiemployer pension plan;and (iv) an increase in litigation reserves on account of a case on appeal. Adjustments are not made to forgivepoor performance, and the MD&C Committee considers both positive and negative adjustments to results.Adjustments are made to ensure that rewards are aligned with the right business decisions and are notinfluenced by potential short-term gain or impact on bonuses. Adjusting for certain items, like those discussedherein, avoids creating incentives for individuals to fail to take actions that are necessary for the longer-termgood of the Company in order to meet short-term goals.
As adjusted for the items noted above, the Company’s income from operations as a percentage of revenuewas 17.65%. This measure made up half of the performance metrics for all of our named executives and was0.25% above the target performance level. Income from operations excluding depreciation and amortizationfor 2010, also as adjusted, was $3,403 million on a Company-wide basis. This measure, which exceeded thetarget performance level by $39 million, made up the remainder of the performance metrics for the 2010annual cash bonus of Messrs. Steiner, Simpson and O’Donnell. The remainder of the performance metrics forthe 2010 annual cash bonus of Mr. Harris was calculated using income from operations excluding depreciationand amortization for the Midwest Group, which was $872 million and exceeded maximum level performance.The remainder of the performance metrics for the 2010 annual cash bonus of Mr. Trevathan was calculatedusing income from operations excluding depreciation and amortization for the Southern Group, on a stand-alone basis and an integrated basis, which were $1,129 million and $1,239 million, respectively. Theperformance of the Southern Group on both of these measures fell slightly short of target. The remainder ofthe performance measures for the 2010 annual cash bonus of Mr. Woods was calculated using income fromoperations excluding depreciation and amortization for the Western Group, on a stand-alone basis and anintegrated basis, which were $808 million and $821 million, respectively. The performance of the WesternGroup on both of these measures also fell short of target, but exceeded threshold performance levels.
Named Executive OfficerTarget Percentage of
Base SalaryPercentage of Base Salary
Earned in 2010
Mr. Steiner . . . . . . . . . . . . . . . . . . . . . . . . . . . . . . . . . 115 131.2
Mr. Simpson . . . . . . . . . . . . . . . . . . . . . . . . . . . . . . . . 85 96.9
Mr. Harris . . . . . . . . . . . . . . . . . . . . . . . . . . . . . . . . . . 85 132.6
Mr. Trevathan . . . . . . . . . . . . . . . . . . . . . . . . . . . . . . . 85 86.2
Mr. Woods . . . . . . . . . . . . . . . . . . . . . . . . . . . . . . . . . 85 77.8
Mr. O’Donnell* . . . . . . . . . . . . . . . . . . . . . . . . . . . . . . 100 113.6
* In connection with his departure from the Company, Mr. O’Donnell received a prorated bonus based on hislength of service in 2010.
Long-Term Equity Incentives — Long-term equity incentives are a key component of our named executiveofficers’ compensation packages. Our equity awards are designed to hold individuals accountable for long-term decisions by rewarding the success of those decisions. The MD&C Committee continuously evaluates thecomponents of its programs. In determining which forms of equity compensation are appropriate, the MD&CCommittee considers whether the awards granted are achieving their purpose; the competitive market; andaccounting, tax or other regulatory issues, among others. In determining the appropriate awards for the namedexecutives’ 2010 long-term incentive grant, the MD&C Committee decided to grant both performance shareunits and stock options to its named executive officers. The MD&C Committee determined that equallydividing the awards between performance share units that use ROIC to focus on improved asset utilization andstock options that focus on increasing the market value of our stock would appropriately incentivize ournamed executives.
32

Performance Share Units — Performance share units are granted to our named executive officers annuallyto align compensation with the achievement of our long-term financial goals and to build stock ownership.Performance share units provide an immediate retention value to the Company because there is unvestedpotential value at the date of grant. Each annual grant of performance share units has a three-year performanceperiod, and grants are forfeited if the executive voluntarily terminates his employment.
The MD&C Committee determined the number of units that were granted to each of the namedexecutives in 2010 by establishing a targeted dollar amount value for the award. The values chosen were basedprimarily on the comparison information for the competitive market, including an analysis of the namedexecutives’ responsibility for meeting the Company’s strategic objectives. Once dollar values of targetedawards were set, those values were divided by the average of the high and low price of our Common Stockover the 30 trading days preceding the MD&C Committee meeting at which the grants were approved todetermine the target number of performance share units granted. The dollar value of the awards andcorresponding number of performance share units are shown in the table below:
Named Executive OfficerDollar Values
Set by the Committee (at Target)Number of Performance
Share Units
Mr. Steiner . . . . . . . . . . . . . . . . . . . . . . . . . . $2,297,193 69,612
Mr. Simpson . . . . . . . . . . . . . . . . . . . . . . . . . 578,680 17,536
Mr. Harris . . . . . . . . . . . . . . . . . . . . . . . . . . . 358,500 10,864
Mr. Trevathan . . . . . . . . . . . . . . . . . . . . . . . . 358,500 10,864
Mr. Woods . . . . . . . . . . . . . . . . . . . . . . . . . . . 358,500 10,864
Mr. O’Donnell . . . . . . . . . . . . . . . . . . . . . . . . 875,916 26,543
The table below shows the required achievement of the ROIC performance measure and the correspond-ing potential payouts under our performance share units granted in 2010:
Performance Payout Performance Payout Performance PayoutThreshold Target Maximum
ROIC . . . . . . . . . . . . . . . . . . 15.8% 60% 17.6% 100% 21.1% 200%
The threshold, target and maximum measures are determined based on an analysis of historicalperformance and current projections and trends. The MD&C Committee uses this analysis and modeling ofdifferent scenarios related to items that affect the Company’s performance such as yield, volumes and capitalto set the performance measures. As with the consideration of targets for the annual bonus, the MD&CCommittee carefully considered several material factors affecting the Company for 2010 and beyond, includingthe continued impact of the recessionary economy and economic indicators for future periods. Given thesefactors, the MD&C Committee determined that the target for ROIC for the 2010 award should be animprovement from 2009 target and actual ROIC, but that it should not be as high as the targets established in2007 and 2008.
The table below shows the performance measures, the achievement of those measures and the correspond-ing payouts for the performance share units that have been granted since 2007:
Threshold Target Maximum Actual Threshold Target Maximum Actual Award EarnedROIC EPS(1)
2007 PSUsfor periodended 12/31/09
13.4% 18.5% 34.1% 16.9% — — — — Units earned an84.1% payout inshares of CommonStock issued in 2/10
2008 PSUsfor periodended 12/31/10
17.6% 19.6% 23.5% 17.1% $7.15 $7.44 $8.60 $6.29 Threshold criteriawas not obtained,and awards expiredwithout vesting
2009 PSUsfor periodended 12/31/11
15.6% 17.3% 20.8% — — — — — Pending completionof performanceperiod
33

(1) Earnings per share is based on the cumulative measure over the three-year performance period.
As reflected in the table above, the performance period for performance share units granted in 2008ended on December 31, 2010. The calculation of ROIC for the three-year performance period for purposes ofsuch performance share units was 17.1%, and the calculation of EPS for the three-year performance period forpurposes of such performance share units was $6.29. As a result, the threshold performance criteria were notmet and no performance share units were earned in 2010.
In evaluating appropriate financial measures for the 2009 and 2010 grants to named executives, theMD&C Committee decided to retain only ROIC, rather than an equal split between ROIC and EPS measures.This decision was primarily a result of the MD&C Committee’s determination that such grants should subjectnamed executives to the same measures as all other employees that are granted equity awards and that themost appropriate long-term financial measure for our Company’s employees generally is ROIC.
Our performance share unit awards are intended to meet the qualified performance-based compensationexception under Section 162(m). Modifications were made to the terms of awards granted in 2007 and later toallow for payouts under those awards to be fully deductible under Section 162(m).
Stock Options — Stock options were granted in the first quarter of 2010 in connection with the annualgrant of long-term equity awards at a regularly scheduled MD&C Committee meeting in order to direct focuson increasing the market value of our Common Stock. The MD&C Committee believes use of stock options isappropriate to support the growth strategy of the Company. The number of options granted to the namedexecutive officers was based on a dollar value of compensation decided by the MD&C Committee; the actualnumber of stock options granted was determined by assigning a value to the options using an option pricingmodel, and dividing the dollar value of compensation by the value of each option. The stock options will vestin 25% increments on the first two anniversaries of the date of grant and the remaining 50% will vest on thethird anniversary. The exercise price of the options is the average of the high and low market price of ourCommon Stock on the date of grant, or $33.49, and the options have a term of 10 years. We account for ouremployee stock options under the fair value method of accounting using a Black-Scholes methodology tomeasure stock option expense at the date of grant. The fair value of the stock options at the date of grant isamortized to expense over the vesting period.
Other Compensation Policies and Practices
Stock Ownership Requirements — All of our named executive officers are subject to stock ownershipguidelines. We instituted stock ownership guidelines because we believe that ownership of Company stockdemonstrates a commitment to, and confidence in, the Company’s long-term prospects and further alignsemployees’ interests with those of our stockholders. We believe that the requirement that these individualsmaintain a portion of their individual wealth in the form of Company stock deters actions that would notbenefit stockholders generally. Additionally, the guidelines contain holding period provisions that generallyrequire Senior Vice Presidents and above to hold all of their shares and Vice Presidents to hold 50% of theirshares for at least one year, even after required ownership levels have been achieved. We believe these holdingperiods discourage these individuals from taking actions in an effort to gain from short-term or otherwisefleeting increases in the market value of our stock.
The MD&C Committee regularly reviews its ownership guidelines to ensure that the appropriate shareownership requirements are in place, and the guidelines were revised in late 2010 to increase the ownershiprequirements. The stock ownership guidelines vary dependent on the individual’s title and are expressed as afixed number of shares. Ownership requirements range from three to five times the named executive’s 2010base salary. The number of shares required to be owned is determined based on a $33.50 stock price. Sharesowned outright, deferred stock units, and phantom stock held in the 401(k) plan and in the Deferral Plan counttoward meeting the targeted ownership requirements. Restricted stock shares, restricted stock units andperformance share units, if any, do not count toward meeting the requirement until they are vested or earned.
34

The following table outlines the ownership requirements for the named executive officers currentlyserving:
Named Executive OfficerOwnership Requirement
(number of shares)Attainment as of
12/31/2010
Mr. Steiner . . . . . . . . . . . . . . . . . . . . . . . . . . . . . . . . . . . . . 165,000 249%
Mr. Simpson. . . . . . . . . . . . . . . . . . . . . . . . . . . . . . . . . . . . 48,000 229%
Mr. Harris* . . . . . . . . . . . . . . . . . . . . . . . . . . . . . . . . . . . . 48,000 72%
Mr. Trevathan . . . . . . . . . . . . . . . . . . . . . . . . . . . . . . . . . . . 48,000 224%
Mr. Woods . . . . . . . . . . . . . . . . . . . . . . . . . . . . . . . . . . . . . 48,000 156%
* As of December 31, 2010, Mr. Harris had fully attained his stock ownership requirement under the guide-lines in place prior to the increased requirements adopted in late 2010. Under our stock ownership guide-lines, executives, including Mr. Harris, have up to five years to attain the incremental stock ownershiprequirement following an increase.
The Nominating and Governance Committee also establishes ownership guidelines for the independentdirectors and performs regular reviews to ensure all independent directors are in compliance.
Policy Limiting Death Benefits and Gross-up Payments — The Company recently adopted a new “PolicyLimiting Certain Compensation Practices,” which generally provides that after the effective date of the policy,the Company will not enter into new compensation arrangements that would obligate the Company to pay adeath benefit or gross up-payment to an executive officer unless such arrangement receives stockholderapproval. The policy is subject to certain exceptions, including benefits generally available to management-level employees and any payment in reasonable settlement of a legal claim. Additionally, “Death Benefits”under the policy does not include deferred compensation, retirement benefits or accelerated vesting orcontinuation of equity-based awards pursuant to generally-applicable equity award plan provisions.
Insider Trading — The Company maintains an insider trading policy that prohibits executive officers fromengaging in most transactions involving the Company’s Common Stock during periods, determined by theCompany, that those executives are most likely to be aware of material, non-public information. Executiveofficers must clear all of their transactions in our Common Stock with the Company’s General Counsel’s officeto ensure they are not transacting in our securities during a time that they may have material, non-publicinformation. Additionally, it is our policy that executive officers are not permitted to engage in transactionsthat reduce or cancel the risk of an investment in our Common Stock, such as puts, calls and other exchange-traded derivatives, or hedging activities that allow a holder to own a covered security without the full risks andrewards of ownership.
35

Executive Compensation
We are required to present compensation information in the tabular format prescribed by the SEC. Thisformat, including the tables’ column headings, may be different from the way we describe or considerelements and components of compensation internally. We have provided the following information because webelieve it may be useful to an understanding of the tables presented in this section. The CD&A contains adiscussion that should be read in conjunction with these tables to gain a complete understanding of ourexecutive compensation philosophy, programs and decisions.
• As described in the CD&A, equity awards granted to the named executive officers in 2010 includeperformance share units earned over a three-year performance period, after which shares of CommonStock may be issued depending on whether financial performance measures have been met, and stockoptions that vest 25% on the first and second anniversary of the date of grant and 50% on the thirdanniversary of the date of grant. In 2008 and 2009, our named executives were granted performanceshare units only.
The value of stock awards and stock options included in the tables is the aggregate grant date fair valuecalculated in accordance with the Financial Accounting Standards Board Accounting StandardsCodification (“ASC”) Topic 718. In the case of performance share units, the value is based on what webelieve the most probable outcome is at the date of grant, and excludes the effect of forfeitures. Stockoptions have been valued using an option valuation model. The grant date fair values in the tables arebased on the “grant date” for accounting purposes, which generally is the date on which the materialterms of the awards have been communicated to the named executives. The MD&C Committeedetermines the dollar value of equity awards at a meeting that precedes the date of grant. The numberof performance share units to be granted is based on a thirty day trailing average of the market price ofour Common Stock. The number of stock options to be granted is determined by assigning a value tothe options using an option pricing model and dividing the dollar value of compensation by the valueof each option.
• As described in the CD&A, our 2010 annual bonuses had threshold, target and maximum payouts basedon the achievement of Company financial measures. In March 2011, we paid out bonuses to the namedexecutives as disclosed in the Summary Compensation Table. Notwithstanding that the bonuses wereearned and paid, we included the threshold, target and maximum dollar amounts that were possibleduring 2010 in the “Estimated Possible Payouts Under Non-Equity Incentive Plan Awards,” in the Grantof Plan-Based Awards in 2010 table.
• Although we consider all of our equity awards to be a form of incentive compensation because theirvalue will increase as the market value of our Common Stock increases, only awards with performancecriteria are considered “equity incentive plan awards” for SEC disclosure purposes. As a result, onlyperformance share units have been included as “Equity Incentive Plan Awards” in the OutstandingEquity Awards at December 31, 2010 table. Restricted stock units and stock options, if any, aredisclosed in other tables as applicable.
• Information pertaining to Mr. O’Donnell, our former President and Chief Operating Officer, is includedin the following tables in accordance with SEC rules, although his employment with the Companyended in June 2010.
36

Summary Compensation Table
Name and Principal Position YearSalary
($)
StockAwards($)(1)
OptionAwards($)(2)
Non-EquityIncentive PlanCompensation
($)(3)
All OtherCompensation
($)(4)Total
($)
David P. Steiner . . . . . . . . . . . . . . . . . . . . 2010 1,073,077 2,331,306 1,943,017 1,407,514 206,509 6,961,423President and Chief Executive Officer 2009 1,116,346 3,069,956 0 1,035,978 258,524 5,480,804
2008 1,066,049 3,928,673 0 1,050,895 153,976 6,199,593
Robert G. Simpson . . . . . . . . . . . . . . . . . . 2010 518,781 587,281 489,458 502,953 38,356 2,136,829Senior Vice President & Chief 2009 541,022 845,824 0 371,098 31,655 1,789,599Financial Officer 2008 516,483 1,190,651 0 376,473 31,114 2,114,721
Jeff M. Harris . . . . . . . . . . . . . . . . . . . . . 2010 536,278 363,835 303,227 711,265 42,553 1,957,158Senior Vice President — Midwest Group 2009 536,278 499,973 0 381,991 33,194 1,451,436
2008 526,278 703,797 0 367,907 31,133 1,629,115
James E. Trevathan . . . . . . . . . . . . . . . . . 2010 566,298 363,835 303,227 487,875 12,325 1,733,560Senior Vice President — Southern Group 2009 566,298 499,973 0 403,374 12,575 1,482,220
2008 562,105 703,797 0 409,936 32,855 1,708,693
Duane C. Woods . . . . . . . . . . . . . . . . . . . 2010 565,710 363,835 303,227 439,860 12,322 1,684,954Senior Vice President — Western Group 2009 565,710 499,973 0 402,955 15,263 1,483,901
2008 561,521 703,797 0 378,635 32,382 1,676,335
Lawrence O’Donnell, III(5) . . . . . . . . . . . . 2010 381,680 888,925 740,870 433,638 3,300,432 5,745,545Former President & Chief Operating 2009 805,107 1,255,155 0 649,691 66,818 2,776,771Officer 2008 768,754 1,606,233 0 659,102 83,289 3,117,378
(1) Amounts in this column represent the grant date fair value of performance share units granted in the appli-cable year, in accordance with ASC Topic 718. The grant date fair value of performance share units is cal-culated using the closing price of our Common Stock on the date of grant.
37

The table below shows the aggregate grant date fair value of performance share units if we assumed thehighest level of performance criteria will be achieved and the maximum amounts will be earned.
Year
Aggregate Grant Date FairValue of Award Assuming
Highest Level of PerformanceAchieved
($)
Mr. Steiner . . . . . . . . . . . . . . . . . . . . . . . . . . . . . . . . . . . . . . . . 2010 4,662,6122009 6,139,9122008 7,857,346
Mr. Simpson . . . . . . . . . . . . . . . . . . . . . . . . . . . . . . . . . . . . . . . 2010 1,174,5622009 1,691,6482008 2,381,302
Mr. Harris . . . . . . . . . . . . . . . . . . . . . . . . . . . . . . . . . . . . . . . . . 2010 727,6702009 999,9462008 1,407,594
Mr. Trevathan . . . . . . . . . . . . . . . . . . . . . . . . . . . . . . . . . . . . . . 2010 727,6702009 999,9462008 1,407,594
Mr. Woods . . . . . . . . . . . . . . . . . . . . . . . . . . . . . . . . . . . . . . . . 2010 727,6702009 999,9462008 1,407,594
Mr. O’Donnell . . . . . . . . . . . . . . . . . . . . . . . . . . . . . . . . . . . . . . 2010 1,777,8502009 2,510,3102008 3,212,466
(2) Amounts in this column represent the grant date fair value of stock options granted in 2010, in accordancewith ASC Topic 718. The grant date fair value of the options was estimated using the Black-Scholesoption pricing model. The assumptions made in determining the grant date fair values of options are dis-closed in Note 16 in the Notes to the Consolidated Financial Statements in our 2010 Annual Report onForm 10-K.
(3) Amounts in this column represent cash bonuses earned and paid based on the achievement of performancegoals pursuant to our Annual Incentive Plan.
(4) The amounts included in “All Other Compensation” for 2010 are shown below (in dollars):
PersonalUse of
CompanyAircraft
401(k)Matching
Contributions
DeferralPlan
MatchingContributions
LifeInsurancePremiums Severance
Mr. Steiner . . . . . . . . . . . . . . . . . 109,138 11,025 83,882 2,464 0
Mr. Simpson . . . . . . . . . . . . . . . . 0 11,025 26,137 1,194 0Mr. Harris . . . . . . . . . . . . . . . . . . 0 11,025 30,297 1,231 0
Mr. Trevathan . . . . . . . . . . . . . . . 0 11,025 0 1,300 0
Mr. Woods. . . . . . . . . . . . . . . . . . 0 11,025 0 1,297 0
Mr. O’Donnell . . . . . . . . . . . . . . . 0 11,025 34,314 889 3,254,204
Mr. Steiner is required by us to use the Company aircraft for all travel, whether for personal or businesspurposes. We calculated this amount based on the incremental cost to us, which includes fuel, crew travelexpenses, on-board catering, landing fees, trip related hangar/parking costs and other variable costs. Weown or operate our aircraft primarily for business use; therefore, we do not include the fixed costsassociated with the ownership or operation such as pilots’ salaries, purchase costs and non-trip relatedmaintenance.
Information concerning Mr. O’Donnell’s severance payment can be found on page 49.
38

(5) At the time of Mr. O’Donnell’s departure from the Company on June 30, 2010, the performance shareunits that were granted to him in March 2010, March 2009 and March 2008 were prorated and will beearned at the end of the applicable performance periods if the Company meets its threshold performancecriteria. In addition, the stock options Mr. O’Donnell received on March 9, 2010 were cancelled at thetime of his termination. The Non-Equity Incentive Plan Compensation paid to Mr. O’Donnell in 2010reflects his annual cash bonus earned for 2010 prorated to date of termination.
Grant of Plan-Based Awards in 2010
NameGrantDate
Threshold($)
Target($)
Maximum($)
Threshold(#)
Target(#)
Maximum(#)
All otherOption
Awards:Number ofSecurities
UnderlyingOptions
(#)(3)
Exercise orBase Priceof OptionAwards($/sh)(4)
ClosingMarketPrice onDate ofGrant
($)
Grant DateFair Value
of Stockand Option
Awards($)(5)
Estimated Possible PayoutsUnder Non-Equity Incentive Plan
Awards (1)
Estimated Future PayoutsUnder Equity Incentive Plan
Awards (2)
David P. Steiner . . . . . . . . . . 754,936 1,258,226 2,516,45203/09/10 41,767 69,612 139,224 2,331,30603/09/10 331,008 33.49 33.62 1,943,017
Robert G. Simpson . . . . . . . . 269,764 449,607 899,21503/09/10 10,522 17,536 35,072 587,28103/09/10 83,383 33.49 33.62 489,458
Jeff M. Harris . . . . . . . . . . . 273,502 455,836 911,67303/09/10 6,518 10,864 21,728 363,83503/09/10 51,657 33.49 33.62 303,227
James E. Trevathan . . . . . . . . 288,812 481,353 962,70703/09/10 6,518 10,864 21,728 363,83503/09/10 51,657 33.49 33.62 303,227
Duane C. Woods . . . . . . . . . 288,512 480,854 961,70703/09/10 6,518 10,864 21,728 363,83503/09/10 51,657 33.49 33.62 303,227
Lawrence O’Donnell, III(6) . . 232,586 387,644 775,28803/09/10 15,926 26,543 53,086 888,92503/09/10 126,213 33.49 33.62 740,870
(1) Actual payouts of our 2010 cash bonuses pursuant to our Annual Incentive Plan are shown in the Sum-mary Compensation Table under “Non-Equity Incentive Plan Compensation.” The named executives’ targetand maximum bonuses are a percentage of base salary, provided for in their employment agreements. Thethreshold levels represent the bonus amounts that would have been payable if the minimum performancerequirements were met for each performance measure. Please see “Compensation Discussion and Analy-sis — Named Executive’s 2010 Compensation Program — Annual Cash Bonus” for additional informationabout these awards, including performance criteria.
(2) Represents the number of shares of Common Stock potentially issuable based on the achievement of per-formance criteria under performance share unit awards granted under our 2009 Stock Incentive Plan.Please see “Compensation Discussion and Analysis — Named Executive’s 2010 Compensation Program —Long-Term Equity Incentives — Performance Share Units” for additional information about these awards,including performance criteria. The performance period for these awards ends December 31, 2012. Perfor-mance share units earn dividend equivalents, which are paid out based on the number of shares actuallyearned, if any, at the end of the performance period.
(3) Represents the number of shares of Common Stock potentially issuable upon the exercise of optionsgranted under our 2009 Stock Incentive Plan. Please see “Compensation Discussion and Analysis —Named Executive’s 2010 Compensation Program — Long-Term Equity Incentives — Stock Options” foradditional information about these awards. The stock options will vest in 25% increments on the first twoanniversaries of the date of grant and the remaining 50% will vest on the third anniversary.
(4) The exercise price represents the average of the high and low market price on the date of the grant, inaccordance with our 2009 Stock Incentive Plan.
39

(5) These amounts represent grant date fair value of the awards as calculated under ASC Topic 718. Pleasesee footnotes (1) and (2) to the Summary Compensation Table above for additional information.
(6) At the time of Mr. O’Donnell’s departure on June 30, 2010, his performance share units that were grantedon March 9, 2010 were prorated and he received 4,383 shares, at target, that will be earned at the end ofthe performance period if the Company meets its threshold performance criteria. In addition, the stockoptions granted to Mr. O’Donnell on March 9, 2010 were cancelled at the time of his termination.
Outstanding Equity Awards at December 31, 2010
Name
Number ofSecurities
UnderlyingUnexercised
OptionsExercisable
(#)(2)
Number ofSecurities
UnderlyingUnexercised
OptionsUnexercisable
(#)
OptionExercise
Price($)
OptionExpiration
Date
EquityIncentive
PlanAwards:
Number ofUnearned
Shares,Units orOther
Rights ThatHave Not
Vested(#)(5)
EquityIncentive
PlanAwards:
Market orPayout
Value ofUnearned
Shares,Units orOther
Rights ThatHave Not
Vested
Option Awards Stock Awards(1)
David P. Steiner . . . . . . . . . . . . . . . . . . . . . . . . . 331,008(3) 33.49 03/09/2020 410,242 $15,125,62324,922(4) 38.205 03/06/2013 — —
90,000 — 29.24 03/04/2014 — —335,000 — 21.08 04/03/2013 — —56,593 — 19.61 03/06/2013 — —
135,000 — 27.88 03/07/2012 — —
Robert G. Simpson . . . . . . . . . . . . . . . . . . . . . . . 83,383(3) 33.49 03/09/2020 109,742 $ 4,046,18812,892(4) 37.095 03/06/2013 — —
33,000 — 27.60 05/13/2014 — —42,000 — 29.24 03/04/2014 — —65,000 — 21.08 04/03/2013 — —13,768 — 19.61 03/06/2013 — —33,000 — 27.88 03/07/2012 — —
Jeff M. Harris . . . . . . . . . . . . . . . . . . . . . . . . . . 51,657(3) 33.49 03/09/2020 65,866 $ 2,428,479
James E. Trevathan . . . . . . . . . . . . . . . . . . . . . . 51,657(3) 33.49 03/09/2020 65,866 $ 2,428,47920,000 — 29.23 07/19/2014 — —50,000 — 29.24 03/04/2014 — —
120,000 — 19.61 03/06/2013 — —65,000 — 27.88 03/07/2012 — —
Duane C. Woods . . . . . . . . . . . . . . . . . . . . . . . . 51,657(3) 33.49 03/09/2020 65,866 $ 2,428,47950,000 — 28.45 06/03/2014 — —20,000 — 29.24 03/04/2014 — —18,000 — 19.61 03/06/2013 — —
Lawrence O’Donnell, III . . . . . . . . . . . . . . . . . . . 79,466 — 19.61 03/06/2013 64,018 $ 2,360,344140,114 — 27.88 03/07/2012 — —
(1) All amounts are as of December 31, 2010, and dollar values are based on the closing price of the Compa-ny’s Common Stock on that date of $36.87 and assume the highest level of performance criteria and maxi-mum payout will be achieved.
(2) Represents vested stock options granted prior to 2005 pursuant to our 1993 Stock Incentive Plan, 2000Stock Incentive Plan or 2004 Stock Incentive Plan (collectively, the “Prior Plans”). All of the Prior Planshave terminated, and no new awards are being granted pursuant to such plans.
(3) Represents stock options granted March 9, 2010 that vest 25% on the first and second anniversary of thedate of grant and 50% on the third anniversary of the date of grant.
(4) Represents reload stock options that become exercisable once the market value of our Common Stock hasincreased by 25% over the option’s exercise price.
40

(5) Includes performance share units with three-year performance periods. Performance share units are paid afterthe Company’s financial results of operations for the entire performance period are reported, typically in mid tolate February of the succeeding year. The performance share units for the performance period ended onDecember 31, 2010 are not included in the table as they were cancelled on December 31, 2010 because theCompany did not meet its threshold performance criteria. The performance period ending on December 31,2011 includes the following performance share units based on target performance: Mr. Steiner — 135,509;Mr. O’Donnell — 27,626; Mr. Simpson — 37,335; Mr. Harris — 22,069; Mr. Trevathan — 22,069; andMr. Woods — 22,069. The performance period ending on December 31, 2012 includes the following perfor-mance share units based on target performance: Mr. Steiner — 69,612; Mr. O’Donnell — 4,383; Mr. Simp-son — 17,536; Mr. Harris — 10,864; Mr. Trevathan — 10,864; and Mr. Woods — 10,864.
Option Exercises and Stock Vested in 2010
Name
Number of SharesAcquired on Exercise
(#)
Value Realizedon Exercise
($)
Number of SharesAcquired on Vesting
(#)
Value Realizedon Vesting
($)
Option Awards Stock Awards(1)
David P. Steiner . . . . . . . . . . . . . . . . 150,000(2) 1,288,700 37,207 1,210,934
Robert G. Simpson. . . . . . . . . . . . . . 35,000(3) 394,100 12,403 403,667
Jeff M. Harris . . . . . . . . . . . . . . . . . — — 7,102 234,883
James E. Trevathan . . . . . . . . . . . . . 100,000(4) 1,230,000 7,330 238,561
Duane C. Woods . . . . . . . . . . . . . . . 35,000(5) 243,700 7,330(6) 238,561
Lawrence O’Donnell, III . . . . . . . . . 274,886 2,652,326 15,785 513,737
(1) Includes restricted stock units granted in 2006 that vested in equal installments over four years andrestricted stock units granted in 2007 that cliff-vested after three years.
(2) We withheld shares in payment of the exercise price and minimum statutory tax withholding fromMr. Steiner’s exercise of non-qualified stock options. Mr. Steiner received 23,104 net shares in thistransaction.
(3) We withheld shares in payment of the exercise price and minimum statutory tax withholding fromMr. Simpson’s exercise of non-qualified stock options. Mr. Simpson received 7,101 net shares in thistransaction.
(4) We withheld shares in payment of the exercise price and minimum statutory tax withholding fromMr. Trevathan’s exercise of non-qualified stock options. Mr. Trevathan received 21,346 net shares in thistransaction.
(5) We withheld shares in payment of the exercise price and minimum statutory tax withholding fromMr. Woods’ exercise of non-qualified stock options. Mr. Woods received 5,167 net shares in thistransaction.
(6) Mr. Woods deferred receipt of 4,622 shares, valued at $150,700, payable under his 2006 restricted stockunit award, based on the market value of our Common Stock on the date of payment. Mr. Woods electedto defer the receipt of the shares until he leaves the Company. Information about deferrals of performanceshare units can be found in the “Compensation Discussion and Analysis — Key Elements of Our Compen-sation Program — Long-Term Equity Incentives.”
41

Nonqualified Deferred Compensation in 2010
Name
ExecutiveContributions
in LastFiscal Year
($)(1)
RegistrantContributions
in LastFiscal Year
($)(2)
AggregateEarningsin Last
Fiscal Year($)(3)
AggregateWithdrawals/Distributions
($)(4)
AggregateBalance atLast FiscalYear End
($)(1)
David P. Steiner . . . . . . . . . . . . . . . . . . 214,616 83,882 127,162 0 2,101,740
Robert G. Simpson . . . . . . . . . . . . . . . . 31,127 26,137 12,642 0 472,237
Jeff M. Harris . . . . . . . . . . . . . . . . . . . 91,168 30,297 42,738 0 788,799
James E. Trevathan . . . . . . . . . . . . . . . 0 0 70,565 0 2,622,751
Duane C. Woods . . . . . . . . . . . . . . . . . 0 0 144,777 0 1,636,969
Lawrence O’Donnell, III. . . . . . . . . . . . 60,451 34,314 102,279 0 2,877,467
(1) Contributions are under the Company’s Deferral Plan as described in “Compensation Discussion andAnalysis — Key Elements of Our Compensation Program — Deferral Plan.” In this Proxy Statement aswell as in previous years, we include executive contributions to the Deferral Plan in the Base Salary col-umn of the Summary Compensation Table. Aggregate Balance at Last Fiscal Year End includes the follow-ing aggregate amounts of the named executives’ base salaries that were included in Base Salary in theSummary Compensation Table in 2008-2010: Mr. Steiner — $628,153; Mr. O’Donnell — $857,209; Mr.Simpson — $131,976; Mr. Harris - $234,304; Mr. Trevathan — $644,912; and Mr. Woods — $235,333.
(2) Company contributions to the executives’ Deferral Plan accounts are included in All Other Compensation,but not Base Salary, in the Summary Compensation Table.
(3) Earnings on these accounts are not included in any other amounts in the tables included in this ProxyStatement, as the amounts of the named executives’ earnings represent the general market gains (or losses)on investments, rather than amounts or rates set by the Company for the benefit of the named executives.
(4) Accounts are distributed as either a lump sum payment or in annual installments (i) when the employeehas reached at least 65 years of age or (ii) at a future date that occurs after termination of employment.Special circumstances may allow for a modified distribution in the event of the employee’s death, anunforeseen emergency, or upon a change-in-control of the Company. In the event of death, distribution willbe made to the designated beneficiary in the form previously elected by the executive. In the event of anunforeseen emergency, the plan administrator may allow an early payment in the amount required to sat-isfy the emergency. All participants are immediately 100% vested in all of their contributions, Companymatching contributions, and gains and/or losses related to their investment choices.
Potential Payments Upon Termination or Change-in-Control
The Company has entered into employment agreements with each of the named executive officers. Theagreements contain provisions regarding consideration payable by the Company upon termination of employ-ment as described below. In some cases, the form of award agreements for equity awards may also containprovisions regarding termination or change-in-control. Each of the agreements also contains post-terminationrestrictive covenants, including a covenant not to compete, non-solicitation covenants, and a non-disparage-ment covenant, each of which lasts for two years after termination.
We entered into employment agreements with our named executive officers based on competitive marketpractices and because they provide a form of protection for the Company through restrictive covenantprovisions. They also provide the named executives a sense of security and trust that they will be treated fairlyin the event of a termination not for cause or under a change-in-control situation. We believe change-in-controlprotections ensure impartiality and objectivity for our named executives and enhance the interest of ourstockholders.
Employment agreements entered into with named executive officers after February 2004 include aclawback feature that allows for the suspension and refund of termination benefits for subsequently discoveredcause. These provisions are applicable to Mr. Simpson and Mr. Woods, whose agreements were entered into in
42

October 2004, and Mr. Harris, whose agreement was entered into in November 2006. The agreementsgenerally allow the Company to cancel any remaining payments due and obligate the named executive torefund to the Company any severance payments already made if, within one year of termination ofemployment of the named executive by the Company for any reason other than for cause, the Companydetermines that the named executive could have been terminated for cause. Additionally, in August 2007, theMD&C Committee adopted an Executive Compensation Clawback Policy. The purpose of the policy is to setforth guidelines as to when the Company should seek reimbursement of payments that are predicated on theachievement of financial results. Generally, the policy allows recoupment of annual cash incentive paymentsand performance share units when the recipient’s personal misconduct results in a restatement or otherwiseaffects the payout calculations for the awards.
The terms “Cause,” “Good Reason,” and “Change-in-Control” as used in the table below are defined inthe executives’ employment agreements and have the meanings generally described below. You should refer tothe individual agreements for the actual definitions.
“Cause” generally means the named executive has:
• deliberately refused to perform his duties;
• breached his duty of loyalty to the Company;
• been convicted of a felony;
• intentionally and materially harmed the Company; or
• breached the covenants contained in his agreement.
“Good Reason” generally means that, without the named executive’s consent:
• his duties or responsibilities have been substantially changed;
• he has been removed from his position;
• the Company has breached his employment agreement;
• any successor to the Company has not assumed the obligations under his employment agreement; or
• he has been reassigned to a location more than 50 miles away.
“Change-in-Control” generally means that:
• at least 25% of the Company’s Common Stock has been acquired by one person or persons acting as agroup;
• the majority of the Board of Directors consists of individuals other than those serving as of the date ofthe named executive’s employment agreement or those that were not elected by at least two-thirds ofthose directors;
• there has been a merger of the Company in which at least 50% of the combined post-merger votingpower of the surviving entity does not consist of the Company’s pre-merger voting power, or a mergerto effect a recapitalization that resulted in a person or persons acting as a group acquired 25% or moreof the Company’s voting securities; or
• the Company is liquidating or selling all or substantially all of its assets.
The following tables represent potential payouts to our named executives still serving the Company atyear-end upon termination of employment in the circumstances indicated pursuant to the terms of theiremployment agreements and outstanding incentive awards. In the event a named executive is terminated forcause, he is entitled to any accrued but unpaid salary only. Please see the Non-Qualified Deferred
43

Compensation table above for aggregate balances payable to the named executives under our Deferral Planpursuant to the executive’s distribution election.
The payouts assume the triggering event indicated occurred on December 31, 2010, at which time theclosing price of our Common Stock was $36.87 per share. These payouts are determined for SEC disclosurepurposes and are not necessarily indicative of the actual amounts the named executive would receive. Anyactual performance share unit payouts will be based on future performance of the Company. We have basedthe payout of performance share units included in the amounts below on target awards outstanding atDecember 31, 2010. The payout related to accelerated vesting of stock options relates only to the stock optionsgranted to the named executives on March 9, 2010, which were unexercisable on December 31, 2010. Allother stock options, other than the reload options, are fully vested as discussed below. The payout forcontinuation of benefits is an estimate of the cost the Company would incur to continue those benefits.
Potential Consideration upon Termination of Employment:
David P. SteinerTriggering Event Compensation Component Payout ($)
Death or Disability Severance Benefits• Accelerated vesting of stock options . . . . . . . . 1,118,807• Payment of performance share units at target
(contingent on actual performance at end ofperformance period) . . . . . . . . . . . . . . . . . . . . 7,562,811
• Two times base salary as of date of termination(payable in bi-weekly installments over a two-year period)(1) . . . . . . . . . . . . . . . . . . . . . . . . 2,200,000
• Life insurance benefit (in the case ofDeath)(2) . . . . . . . . . . . . . . . . . . . . . . . . . . . . 1,075,000
Total . . . . . . . . . . . . . . . . . . . . . . . . . . . . . . . . 11,956,618
Termination Without Cause by the Company orFor Good Reason by the Employee
Severance Benefits• Two times base salary plus target annual cash
bonus (one-half payable in lump sum; one-halfpayable in bi-weekly installments over a two-year period) . . . . . . . . . . . . . . . . . . . . . . . . . . 4,730,000
• Continued coverage under health and welfarebenefit plans for two years . . . . . . . . . . . . . . . 21,600
• Prorated payment of performance share units . . 4,185,556
Total . . . . . . . . . . . . . . . . . . . . . . . . . . . . . . . . 8,937,156
Termination Without Cause by the Company or ForGood Reason by the Employee Six Months Prior toor Two Years Following a Change-in-Control
Severance Benefits• Three times base salary plus target annual cash
bonus, paid in lump sum . . . . . . . . . . . . . . . . . 7,095,000(Double Trigger) • Continued coverage under health and welfare
benefit plans for three years . . . . . . . . . . . . . . 32,400• Accelerated vesting of stock options . . . . . . . . 1,118,807• Accelerated payment of performance share
units(3) . . . . . . . . . . . . . . . . . . . . . . . . . . . . . 7,562,811• Full maximum annual cash bonus, prorated to
date of termination . . . . . . . . . . . . . . . . . . . . . 2,530,000• Gross-up payment for any excise taxes . . . . . . . 5,002,054
Total . . . . . . . . . . . . . . . . . . . . . . . . . . . . . . . . 23,341,072
44

Robert G. SimpsonTriggering Event Compensation Component Payout ($)
Death or Disability Severance Benefits• Accelerated vesting of stock options . . . . . . . . . 281,835• Payment of performance share units at target
(contingent on actual performance at end ofperformance period) . . . . . . . . . . . . . . . . . . . . 2,023,094
• Life insurance benefit (in the case ofDeath)(2) . . . . . . . . . . . . . . . . . . . . . . . . . . . . 521,000
Total . . . . . . . . . . . . . . . . . . . . . . . . . . . . . . . . . 2,825,929
Termination Without Cause by the Company orFor Good Reason by the Employee
Severance Benefits• Two times base salary plus target annual cash
bonus (one-half payable in lump sum; one-halfpayable in bi-weekly installments over a two-year period) . . . . . . . . . . . . . . . . . . . . . . . . . . 1,966,198
• Continued coverage under health and welfarebenefit plans for two years . . . . . . . . . . . . . . . . 21,600
• Prorated payment of performance share units. . . 1,133,015
Total . . . . . . . . . . . . . . . . . . . . . . . . . . . . . . . . . 3,120,813
Termination Without Cause by the Company or ForGood Reason by the Employee Six Months Prior toor Two Years Following a Change-in-Control
Severance Benefits• Three times base salary plus target bonus, paid
in lump sum . . . . . . . . . . . . . . . . . . . . . . . . . . 2,949,297(Double Trigger) • Continued coverage under health and welfare
benefit plans for three years . . . . . . . . . . . . . . . 32,400• Accelerated vesting of stock options . . . . . . . . . 281,835• Accelerated payment of performance share
units(3) . . . . . . . . . . . . . . . . . . . . . . . . . . . . . . 2,023,094• Full maximum annual cash bonus, prorated to
date of termination . . . . . . . . . . . . . . . . . . . . . 903,388• Gross-up payment for any excise taxes . . . . . . . 1,671,212
Total . . . . . . . . . . . . . . . . . . . . . . . . . . . . . . . . . 7,861,226
45

Jeff M. HarrisTriggering Event Compensation Component Payout ($)
Death or Disability Severance Benefits• Accelerated vesting of stock options . . . . . . . . . 174,601• Payment of performance share units at target
(contingent on actual performance at end ofperformance period) . . . . . . . . . . . . . . . . . . . . 1,214,240
• Life insurance benefit (in the case ofDeath)(2) . . . . . . . . . . . . . . . . . . . . . . . . . . . . 537,000
Total . . . . . . . . . . . . . . . . . . . . . . . . . . . . . . . . . 1,925,841
Termination Without Cause by the Company orFor Good Reason by the Employee
Severance Benefits• Two times base salary plus target annual cash
bonus (one-half payable in lump sum; one-halfpayable in bi-weekly installments over a two-year period) . . . . . . . . . . . . . . . . . . . . . . . . . . 1,984,228
• Continued coverage under health and welfarebenefit plans for two years . . . . . . . . . . . . . . . . 21,600
• Prorated payment of performance share units. . . 675,864
Total . . . . . . . . . . . . . . . . . . . . . . . . . . . . . . . . . 2,681,692
Termination Without Cause by the Company or ForGood Reason by the Employee Six Months Prior toor Two Years Following a Change-in-Control
Severance Benefits• Three times base salary plus target annual cash
bonus, paid in lump sum . . . . . . . . . . . . . . . . . 2,976,342(Double Trigger) • Continued coverage under health and welfare
benefit plans for three years . . . . . . . . . . . . . . . 32,400• Accelerated vesting of stock options . . . . . . . . . 174,601• Accelerated payment of performance share
units(3) . . . . . . . . . . . . . . . . . . . . . . . . . . . . . . 1,214,240• Full maximum annual cash bonus, prorated to
date of termination . . . . . . . . . . . . . . . . . . . . . 911,672
Total . . . . . . . . . . . . . . . . . . . . . . . . . . . . . . . . . 5,309,255
46

James E. TrevathanTriggering Event Compensation Component Payout ($)
Death or Disability Severance Benefits• Accelerated vesting of stock options . . . . . . . . . 174,601• Payment of performance share units at target
(contingent on actual performance at end ofperformance period) . . . . . . . . . . . . . . . . . . . . 1,214,240
• Life insurance benefit (in the case of Death)(2) 567,000
Total . . . . . . . . . . . . . . . . . . . . . . . . . . . . . . . . . 1,955,841
Termination Without Cause by the Company orFor Good Reason by the Employee
Severance Benefits• Two times base salary plus target annual cash
bonus (one-half payable in lump sum; one-halfpayable in bi-weekly installments over a two-year period) . . . . . . . . . . . . . . . . . . . . . . . . . . 2,095,302
• Continued coverage under benefit plans for twoyears• Health and Welfare Benefit Plans . . . . . . . . . 21,600• Deferred Savings Plan Contributions . . . . . . . 0• 401(k) Contributions . . . . . . . . . . . . . . . . . . . 22,050
• Prorated payment of performance share units 675,864
Total . . . . . . . . . . . . . . . . . . . . . . . . . . . . . . . . . 2,814,816
Termination Without Cause by the Company or ForGood Reason by the Employee Six Months Prior toor Two Years Following a Change-in-Control
Severance Benefits• Two times base salary plus target annual cash
bonus, paid in lump sum . . . . . . . . . . . . . . . . . 2,095,302(Double Trigger) • Continued coverage under benefit plans for two
years . . . . . . . . . . . . . . . . . . . . . . . . . . . . . . .• Health and Welfare Benefit Plans . . . . . . . . . 21,600• Deferred Savings Plan Contributions . . . . . . . 0• 401(k) Contributions . . . . . . . . . . . . . . . . . . . 22,050
• Accelerated vesting of stock options . . . . . . . . . 174,601• Accelerated payment of performance share
units(3) . . . . . . . . . . . . . . . . . . . . . . . . . . . . . . 1,214,240• Full maximum annual cash bonus, prorated to
date of termination . . . . . . . . . . . . . . . . . . . . . 962,706
Total . . . . . . . . . . . . . . . . . . . . . . . . . . . . . . . . . 4,490,499
47

Duane C. Woods
Triggering Event Compensation Component Payout ($)
Death or Disability Severance Benefits• Accelerated vesting of stock options . . . . . . . . . . 174,601• Payment of performance share units at target
(contingent on actual performance at end ofperformance period) . . . . . . . . . . . . . . . . . . . . . 1,214,240
• Life insurance benefit (in the case of Death)(2) . . 566,000
Total . . . . . . . . . . . . . . . . . . . . . . . . . . . . . . . . . . 1,954,841
Termination Without Cause by the Company or ForGood Reason by the Employee
Severance Benefits• Two times base salary plus target annual cash
bonus (one-half payable in lump sum; one-halfpayable in bi-weekly installments over a two-year period) . . . . . . . . . . . . . . . . . . . . . . . . . . . 2,093,128
• Continued coverage under health and welfarebenefit plans for two years . . . . . . . . . . . . . . . . . 21,600
• Prorated payment of performance share units . . . 675,864
Total . . . . . . . . . . . . . . . . . . . . . . . . . . . . . . . . . . 2,790,592
Termination Without Cause by the Company or ForGood Reason by the Employee Six Months Prior toor Two Years Following a Change-in-Control
Severance Benefits• Three times base salary plus target annual cash
bonus, paid in lump sum . . . . . . . . . . . . . . . . . . 3,139,692(Double Trigger) • Continued coverage under health and welfare
benefit plans for three years . . . . . . . . . . . . . . . . 32,400• Accelerated vesting of stock options . . . . . . . . . . 174,601• Accelerated payment of performance share
units(3) . . . . . . . . . . . . . . . . . . . . . . . . . . . . . . . 1,214,240• Full maximum annual cash bonus, prorated to
date of termination . . . . . . . . . . . . . . . . . . . . . . 961,708• Gross-up payment for any excise taxes . . . . . . . . 1,976,820
Total . . . . . . . . . . . . . . . . . . . . . . . . . . . . . . . . . . 7,499,461
(1) Although these provisions were included in certain named executives’ employment agreements prior to2004, in December 2010, the Board adopted a policy wherein the Company will not enter into any futurecompensation arrangements that obligate the Company to provide increased payments in the event ofdeath, subject to certain exceptions as discussed in “Compensation Discussion and Analysis — Other Com-pensation Policies and Practices.”
(2) The insurance benefit is a payment by an insurance company under the terms of an insurance policy pursu-ant to Waste Management’s practice to provide all benefits eligible employees with life insurance that paysone times annual base salary upon death.
(3) The performance share unit award agreements provide that the awards will be accelerated upon achange-in-control regardless of termination of employment. In the event of a change-in-control, theemployee would receive a payout of shares of Common Stock calculated on a shortened performanceperiod plus a restricted stock unit award in the successor entity to compensate for the lost opportunity fromthe date of the change-in-control to the end of the original performance period. If the employee is thereaf-ter terminated within the window period referenced, he would vest in full in the new restricted stock unitaward. The payment in the event of acceleration is based on the achievement, as of the date of thechange-in-control, of the performance target interpolated back to the date of grant. The performance tar-gets of performance share units are for a three-year average; because the achievement of the interpolatedtarget cannot be determined, we have assumed the interpolated target was the same as the original targetand was met as of the date of the change-in-control.
48

With the exception of the March 9, 2010 stock option awards, all of the named executives’ stock options,other than reload options, have vested in full. In the event of termination for cause, all options are immediatelycancelled. Some of our named executive officers have provisions in their employment agreements that givethem continued exercisability of stock options in the event of the termination of their employment that islonger than the normal terms contained in the stock option agreements themselves. The employmentagreements we entered into with Mr. Steiner and Mr. Simpson give them the ability to exercise all stockoptions granted before 2004 for (i) two years after termination of employment without cause or for goodreason and (ii) three years after termination without cause or for good reason six months prior to, or two yearsfollowing, a change-in-control. Mr. Trevathan’s employment agreement gives him the ability to exercise allstock options granted before 2004 for two years after termination of employment (i) without cause or for goodreason or (ii) without cause or for good reason six months prior to, or two years following, achange-in-control. Mr. Harris’ and Mr. Wood’s employment agreements do not provide for extendedexercisability of their stock options upon termination. The value, if any, of the benefit of continuedexercisability to executives is dependent on whether the market value of our Common Stock exceeds theexercise prices of the stock options during the post-termination period of exercisability. The following is acalculation of the potential gain the named executive could have realized if their vested stock options wereexercised as of December 31, 2010: Mr. Steiner — $8,166,795; Mr. Simpson — $2,187,026; Mr. Harris — $0;Mr. Trevathan — $3,189,850; and Mr. Woods — $884,280.
Upon Mr. O’Donnell’s departure from the Company on June 30, 2010, he received, or is continuing toreceive, the following:
Cash severance payable in lump sum . . . . . . . . . . . . . . . . . . . . . . . . . . . . . . . . . . . . . . $1,550,576
Cash severance payable over two years . . . . . . . . . . . . . . . . . . . . . . . . . . . . . . . . . . . . $1,550,576
Annual cash bonus earned in 2010 prorated to date of termination payable in lump sumin March 2011 . . . . . . . . . . . . . . . . . . . . . . . . . . . . . . . . . . . . . . . . . . . . . . . . . . . . . $ 433,638
Value of Company match in Deferral Plan for two years payable in lump sum . . . . . . . $ 139,552
Value of group long-term disability and group life insurance coverage for two yearspayable over two years. . . . . . . . . . . . . . . . . . . . . . . . . . . . . . . . . . . . . . . . . . . . . . . $ 13,500
Value of group health and dental coverage for two years payable over two years (oruntil similar coverage is obtained from a subsequent employer) . . . . . . . . . . . . . . . . . $ 35,055
We are also continuing certain benefits for Mr. O’Donnell, as described below. The payout value shownfor the stock components are based on awards and options outstanding, and the closing price of the Company’sCommon Stock of $36.87 per share on December 31, 2010.
• Prorated vesting of performance share units granted in 2009 and 2010 at target(contingent on actual performance at end of performance period) . . . . . . . . . . . . . . $1,180,172
• Continued exercisability of vested options . . . . . . . . . . . . . . . . . . . . . . . . . . . . . . . $2,631,208
49

Equity Compensation Plan Table
The following table provides information as of December 31, 2010 about the number of shares to beissued upon vesting or exercise of equity awards and the number of shares remaining available for issuanceunder our equity compensation plans.
Plan Category
Number ofSecurities to
be Issued UponExercise
of OutstandingOptions
and Rights
Weighted-AverageExercise Price of
Outstanding Optionsand Rights
Number ofSecurities
Remaining Availablefor Future Issuance
Under EquityCompensation Plans
Equity compensation plans approved bysecurity holders(a) . . . . . . . . . . . . . . . . . 12,561,093(b) $28.95(c) 15,850,505(d)
Equity compensation plans not approvedby security holders(e) . . . . . . . . . . . . . . 92,446(f) $28.45 0
Total . . . . . . . . . . . . . . . . . . . . . . . . . . . 12,653,539 $28.95 15,850,505
(a) Includes our 1993 Stock Incentive Plan, 2000 Stock Incentive Plan, 1996 Non-Employee Director’s Plan,2004 Stock Incentive Plan and 2009 Stock Incentive Plan. Only our 2009 Stock Incentive Plan is availablefor awards. Also includes our Employee Stock Purchase Plan (ESPP).
(b) Includes: options outstanding for 9,864,621 shares of Common Stock; 371,118 shares of Common Stockto be issued in connection with deferred compensation obligations; 585,400 shares underlying unvestedrestricted stock units and up to 1,739,954 shares of Common Stock that may be issued under unearnedperformance share units. Excludes purchase rights that accrue under the ESPP. Purchase rights under theESPP are considered equity compensation for accounting purposes; however, the number of shares to bepurchased is indeterminable until the time shares are actually issued, as automatic employee contributionsmay be terminated before the end of an offering period and, due to the look-back pricing feature, the pur-chase price and corresponding number of shares to be purchased is unknown.
(c) Excludes performance share units and restricted stock units because those awards do not have exerciseprices associated with them. Also excludes purchase rights under the ESPP for the reasons described in(b) above.
(d) The shares remaining available include 14,261,528 shares under our 2009 Stock Incentive Plan and1,588,977 shares under our ESPP. In determining the number of shares available under the 2009 StockIncentive Plan, we subtracted the maximum number of shares that may be issued under our performanceshare units, which is two times the number at target. No additional shares may be issued under any of theother plans approved by stockholders, other than on account of awards already outstanding.
(e) Includes our 2000 Broad-Based Employee Plan. No awards under the Broad-Based Plan are held by, ormay be granted to, any of our directors or executive officers. The Broad-Based Plan allows for the grant-ing of equity awards on such terms and conditions as the MD&C Committee may decide; provided, thatthe exercise price of options may not be less than 100% of the fair market value of the stock on the dateof grant, and all options expire no later than ten years from the date of grant.
(f) Includes options exercisable for shares of Common Stock.
50

RATIFICATION OF INDEPENDENT REGISTERED PUBLIC ACCOUNTING FIRM(Item 2 on the Proxy Card)
Our Board of Directors, upon the recommendation of the Audit Committee, has ratified the selection ofErnst & Young LLP to serve as our independent registered public accounting firm for fiscal year 2011, subjectto ratification by our stockholders.
Representatives of Ernst & Young LLP will be at the Annual Meeting. They will be able to make astatement if they want, and will be available to answer any appropriate questions stockholders may have.
Although ratification of the selection of Ernst & Young is not required by our By-laws or otherwise, weare submitting the selection to stockholders for ratification because we value our stockholders’ views on ourindependent registered public accounting firm and as a matter of good governance. If our stockholders do notratify our selection, it will be considered a direction to our Board and Audit Committee to consider selectinganother firm. Even if the selection is ratified, the Audit Committee may, in its discretion, select a differentindependent registered public accounting firm, subject to ratification by the Board, at any time during the yearif it determines that such a change is in the best interests of the Company and our stockholders.
THE BOARD OF DIRECTORS RECOMMENDS THAT YOU VOTE FOR THE RATIFICATIONOF ERNST & YOUNG LLP AS THE COMPANY’S INDEPENDENT REGISTERED PUBLICACCOUNTING FIRM FOR FISCAL YEAR 2011.
Independent Registered Public Accounting Firm Fee Information
Fees for professional services provided by our independent registered public accounting firm in each ofthe last two fiscal years, in each of the following categories, were as follows:
2010 2009(In millions)
Audit Fees . . . . . . . . . . . . . . . . . . . . . . . . . . . . . . . . . . . . . . . . . . . . . . . . . . . . . . . . $5.7 $7.1Audit-Related Fees . . . . . . . . . . . . . . . . . . . . . . . . . . . . . . . . . . . . . . . . . . . . . . . . . . 1.3 1.2Tax Fees . . . . . . . . . . . . . . . . . . . . . . . . . . . . . . . . . . . . . . . . . . . . . . . . . . . . . . . . . . 0.0 0.1All Other Fees . . . . . . . . . . . . . . . . . . . . . . . . . . . . . . . . . . . . . . . . . . . . . . . . . . . . . 0.0 0.0
Total . . . . . . . . . . . . . . . . . . . . . . . . . . . . . . . . . . . . . . . . . . . . . . . . . . . . . . . . . . . . . $7.0 $8.4
Audit includes fees for the annual audit, reviews of the Company’s Quarterly Reports on Form 10-Q,work performed to support the Company’s debt issuances, accounting consultations, and separate subsidiaryaudits required by statute or regulation, both domestically and internationally. Audit-related fees principallyinclude separate subsidiary audits not required by statute or regulation, employee benefit plan audits andfinancial due diligence services relating to certain potential acquisitions. Tax fees were for tax audit andcompliance assistance in certain foreign jurisdictions.
The Audit Committee has adopted procedures for the approval of Ernst & Young’s services and relatedfees. At the beginning of each year, all audit and audit-related services, tax fees and other fees for theupcoming audit are provided to the Audit Committee for approval. The services are grouped into significantcategories and provided to the Audit Committee in the format shown above. All projects that have thepotential to exceed $100,000 are separately identified and reported to the Committee for approval. The AuditCommittee Chairman has the authority to approve additional services, not previously approved, betweenCommittee meetings. Any additional services approved by the Audit Committee Chairman between Committeemeetings are ratified by the full Audit Committee at the next regularly scheduled meeting. The AuditCommittee is updated on the status of all services and related fees at every regular meeting. In 2010 and 2009,the Audit Committee pre-approved all audit, audit-related and tax services performed by Ernst & Young.
As set forth in the Audit Committee Report on page 8, the Audit Committee has considered whether theprovision of these non-audit services is compatible with maintaining auditor independence and has determinedthat they are.
51

ADVISORY VOTE ON EXECUTIVE COMPENSATION(Item 3 on the Proxy Card)
In accordance with recent legislation, the Company is providing stockholders with an advisory (non-binding)vote on compensation programs for our named executive officers (sometimes referred to as a “say on pay”).
We encourage stockholders to review the Compensation Discussion and Analysis on pages 22 to 35 ofthis Proxy Statement. The Company has designed its executive compensation program to be supportive of, andalign with, the strategy of the Company and the creation of stockholder value, while discouraging excessiverisk-taking. Some facts about our executive compensation program that further these goals include:
• a substantial portion of executive compensation is linked to Company performance, through annual cashperformance criteria and long-term incentive programs;
• performance measures are designed to be challenging, yet achievable, and are recalibrated to maintaindirectional alignment between pay and performance;
• performance based awards include threshold, target and maximum payouts correlating to a range ofperformance, which limits risk-taking behavior;
• our compensation mix targets approximately 50% of total compensation of our named executives (andapproximately 65% in the case of our Chief Executive Officer) to result from long-term equity awards,which aligns executives’ interests with those of stockholders; and
• performance stock units’ three-year performance period, as well as stock options’ vesting over a three-year period, link executives’ interests with long-term performance and reduce incentives to maximizeperformance in any one year.
Additionally, the following compensation-related policies, each discussed in further detail in the Compen-sation Discussion and Analysis, evidence the Company’s dedication to competitive and reasonable compensa-tion practices that are in the best interests of stockholders:
• all of our named executive officers are subject to stock ownership requirements, which we believedemonstrates a commitment to, and confidence in, the Company’s long-term prospects;
• the Company has a clawback policy designed to recoup annual cash incentive payments andperformance share units when the recipient’s personal misconduct results in a restatement or otherwiseaffects the payout calculations for the awards;
• our executive officer severance policy implemented a limitation on the amount of benefits the Companymay provide to its executive officers under severance agreements entered into after the date of suchpolicy; and
• the Company recently adopted a new policy that prohibits the Company from entering into newagreements with executive officers that provide for certain death benefits or tax gross-up payments.
The Board and the MD&C Committee believe that the Company’s executive compensation programeffectively achieved its objectives and helped the Company overcome a challenging business environment in2010 to achieve strong performance. Accordingly, the Board strongly endorses the Company’s executivecompensation program and recommends that the stockholders vote in favor of the following resolution:
RESOLVED, that the stockholders approve the compensation of the Company’s named executiveofficers as described in this Proxy Statement under “Executive Compensation,” including the Compensa-tion Discussion and Analysis and the tabular and narrative disclosure contained in this Proxy Statement.
Because the vote is advisory, it will not be binding upon the Board or the MD&C Committee and neitherthe Board nor the MD&C Committee will be required to take any action as a result of the outcome of the vote
52

on this proposal. The MD&C Committee will carefully consider the outcome of the vote in connection withfuture executive compensation arrangements.
THE BOARD RECOMMENDS THAT YOU VOTE FOR THE APPROVAL OF THE COMPANY’SEXECUTIVE COMPENSATION.
ADVISORY VOTE ON FREQUENCY OFFUTURE ADVISORY VOTES ON EXECUTIVE COMPENSATION
(Item 4 on the Proxy Card)
In accordance with recent legislation, the Company is providing stockholders with an advisory (non-binding) vote on whether future “say on pay” advisory votes, similar to the prior proposal, should occur everyyear, every two years or every three years.
The Board has determined that an advisory vote on executive compensation that occurs annually is themost appropriate interval. Conducting an advisory vote on executive compensation every year will enhancestockholder communication and provide the Company with regular feedback on its executive compensationpractices and philosophy. Accordingly, our Board recommends you vote for a one-year interval for theadvisory vote on executive compensation.
The proxy card provides stockholders with the opportunity to choose among four options (holding thevote every one, two or three years, or abstaining) and, therefore, stockholders will not be voting to approve ordisapprove the Board’s recommendation.
Because the vote is advisory, it will not be binding upon the Board or the MD&C Committee. However,the MD&C Committee will carefully consider the outcome of the vote when deciding how often to conductfuture stockholder advisory votes on executive compensation.
THE BOARD RECOMMENDS THAT YOU VOTE FOR THE OPTION OF EVERY YEAR FORFUTURE ADVISORY VOTES ON EXECUTIVE COMPENSATION.
53

PROPOSAL TO AMEND THE COMPANY’S AMENDED AND RESTATEDBY-LAWS REGARDING SPECIAL STOCKHOLDER MEETINGS
(Item 5 on the Proxy Card)
The Board is proposing, for approval by the Company’s stockholders, an amendment to Article II,Section 2.4 of the Company’s Amended and Restated By-laws to add a right permitting record holders whohave held at least a twenty-five percent (25%) net long position in the outstanding Common Stock of theCompany for at least one year to call a special meeting of stockholders. Currently, only the Chairman of theBoard, the Chief Executive Officer or the majority of the Board may call a special meeting of the Company’sstockholders.
The Board believes that establishing an ownership threshold of 25% in order to request a special meetingstrikes a reasonable balance between enhancing stockholder rights and protecting against the risk that a smallminority of stockholders could trigger a special meeting and the resulting financial expense and disruption tothe Company’s business of holding a special meeting. The Board believes special meetings should only becalled to consider extraordinary events that are of interest to a broad base of stockholders and that cannot waituntil the next annual meeting. For every special meeting of stockholders, the Company is required to provideeach holder of its Common Stock a notice and proxy materials, which results in significant legal, printing andmailing expenses, as well as other costs normally associated with holding a meeting of stockholders.Additionally, preparing for stockholder meetings requires significant attention of the Company’s directors,officers and employees, diverting their attention away from performing their primary function, which is tooperate the Company’s business in the best interests of the stockholders. Establishing a 25% threshold for theright of stockholders to call a special meeting would provide stockholders a meaningful ability to request thatthe Board call a special meeting, while helping protect against these concerns. The requirement thatstockholders requesting a special meeting must have held a net long position in the Company’s Common Stockfor at least one year ensures that stockholders seeking to exercise the right have a true economic interest in theCompany. Further, the proposed amendment contains various exceptions and timing mechanisms that areintended to avoid the cost and distraction that would result from multiple stockholder meetings being held in ashort time period.
Our Board is strongly committed to good governance practices and is keenly interested in the views andconcerns of our stockholders. In addition to the proposed amendment to allow stockholders to call a specialmeeting, our stockholders have the ability to act by written consent. We also provide significant opportunityfor our stockholders to raise matters at our annual meetings. Institutional Shareholder Services, Inc. has ratedour shareholder rights practices as a “low concern,” which is its lowest rating. The Corporate Library hasassigned our Board a “Low” Corporate Governance Risk Assessment, indicating that our Company’sgovernance practices are not a cause for concern.
In light of our Board’s continuing commitment to ensuring effective corporate governance and the otherreasons outlined in this proposal, our Board believes the proposed amendment to our By-laws is reasonable,appropriate and in the best interests of the Company and the stockholders. Under the Company’s governingdocuments, the Board or the Company’s stockholders may amend our By-laws. Consequently, the specialmeeting By-law amendment may, in the future, be further amended, modified or repealed.
The complete text of the proposed amendment, including the requirements and procedures for calling aspecial meeting of stockholders, is set forth in Appendix A.
Approval of this proposal requires the affirmative vote of the holders of a majority of stock having votingpower present or represented by proxy at the meeting. An abstention will have the effect of a vote against theproposal.
THE BOARD RECOMMENDS THAT YOU VOTE FOR THE AMENDMENT OF THECOMPANY’S AMENDED AND RESTATED BY-LAWS REGARDING SPECIAL STOCKHOLDERMEETINGS.
54

OTHER MATTERS
We do not intend to bring any other matters before the Annual Meeting, nor do we have any presentknowledge that any other matters will be presented by others for action at the meeting. If any other mattersare properly presented, your proxy card authorizes the people named as proxy holders to vote using theirjudgment.
55

Appendix A
RELATED TO ITEM 5: PROPOSAL TO AMEND THE COMPANY’SAMENDED AND RESTATED BY-LAWS
REGARDING SPECIAL STOCKHOLDER MEETINGS
THE BOARD PROPOSES THAT SECTION 2.4 OF THE COMPANY’S AMENDED AND RESTATEDBY-LAWS BE DELETED AND REPLACED WITH THE FOLLOWING:
SECTION 2.4 Special Meetings.
(a) General. Special meetings of the stockholders, for any purpose or purposes, unless otherwiseprescribed by the General Corporation Law of the State of Delaware, may be called by the Chairman of theBoard (if any), the Chief Executive Officer, or by written order of a majority of the Board of Directors (each,a “Special Meeting Request”). A special meeting of stockholders shall be called by the Secretary upon thewritten request of the record holders having an aggregate “net long position” of at least twenty-five percent(25%) of the outstanding common stock of the Corporation, and having held such “net long position”continuously for at least one year, as of the date of such request (the “Requisite Percent”), subject toSubsection (b) of this Section 2.4 (a “Stockholder Requested Special Meeting”). “Net long position” shall bedetermined with respect to each requesting holder in accordance with the definition thereof set forth inRule 14e-4 under the Securities Exchange Act of 1934, provided that (x) for purposes of such definition, indetermining such holder’s “short position,” the reference in such Rule to “the date the tender offer is firstpublicly announced or otherwise made known by the bidder to the holders of the security to be acquired” shallbe the date of the relevant Special Meeting Request and all dates in the one-year period prior thereto, and thereference to the “highest tender offer price or stated amount of the consideration offered for the subjectsecurity” shall refer to the closing sales price of the Corporation’s common stock on the New York StockExchange on such corresponding date (or, if such date is not a trading day, the next succeeding trading day)and (y) the net long position of such holder shall be reduced by the number of shares as to which such holderdoes not, or will not, have the right to vote or direct the vote at the Special Meeting or as to which suchholder has entered into any derivative or other agreement, arrangement or understanding that hedges ortransfers, in whole or in part, directly or indirectly, any of the economic consequences of ownership of suchshares. Whether the requesting holders have complied with the requirements of this Article and relatedprovisions of these by-laws shall be determined in good faith by the Board, which determination shall beconclusive and binding on the Corporation and the stockholders.
(b) Stockholder Requested Special Meetings. In order for a Stockholder Requested Special Meeting to becalled, one or more requests for a special meeting (each, a “Stockholder Special Meeting Request,” andcollectively, the “Stockholder Special Meeting Requests”) must be signed by the Requisite Percent of recordholders (or their duly authorized agents) and must be delivered to the Secretary. The Stockholder SpecialMeeting Request(s) shall be delivered to the Secretary at the principal executive offices of the Corporation byregistered mail, return receipt requested. Each Stockholder Special Meeting Request shall (i) set forth astatement of the specific purpose(s) of the meeting and the matters proposed to be acted on at it, (ii) bear thedate of signature of each such stockholder (or duly authorized agent) signing the Stockholder Special MeetingRequest, (iii) set forth (A) the name and address, as they appear in the Corporation’s stock ledger, of eachstockholder signing such request (or on whose behalf the Stockholder Special Meeting Request is signed),(B) the class, if applicable, and the number of shares of common stock of the Corporation that are owned ofrecord and beneficially by each such stockholder and (C) include documentary evidence of such stockholder’srecord and beneficial ownership of such stock, (iv) set forth all information relating to each such stockholderthat must be disclosed in solicitations of proxies for election of directors in an election contest (even if anelection contest is not involved), or is otherwise required, in each case, pursuant to Regulation 14A under theSecurities Exchange Act of 1934, as amended (the “Exchange Act”) and (v) contain the information requiredby Section 2.13 of these by-laws. Any requesting stockholder may revoke his, her or its request for a specialmeeting at any time by written revocation delivered to the Secretary at the principal executive offices of theCorporation, and if, following such revocation, there are un-revoked requests from stockholders holding in the
A-1

aggregate less than the Requisite Percent, the Board of Directors, in its discretion, may cancel the specialmeeting.
(c) Calling of a Special Meeting. Notwithstanding the foregoing, the Secretary shall not be required tocall a special meeting of stockholders if (i) the Board of Directors calls an annual or special meeting ofstockholders to be held not later than sixty (60) days after the date on which a valid Special Meeting Requestor Stockholder Special Meeting Request(s) has been delivered to the Secretary (the “Delivery Date”); or (ii) theSpecial Meeting Request or the Stockholder Special Meeting Request(s) (A) is received by the Secretaryduring the period commencing ninety (90) days prior to the first anniversary of the date of the immediatelypreceding annual meeting and ending on the date of the next annual meeting; (B) contains an identical orsubstantially similar item (a “Similar Item”) to an item that was presented at any meeting of stockholders heldwithin one hundred and twenty (120) days prior to the Delivery Date (and, for purposes of this clause (B) theelection of directors shall be deemed a “Similar Item” with respect to all items of business involving theelection or removal of directors); (C) relates to an item of business that is not a proper subject for action bythe party requesting the special meeting under applicable law; (D) was made in a manner that involved aviolation of Regulation 14A under the Exchange Act or other applicable law; or (E) does not comply with theprovisions of this Section 2.4.
(d) Holding a Special Meeting. Except as provided in the next sentence, any special meeting shall beheld at such date and time as may be fixed by the Board of Directors in accordance with these by-laws andthe General Corporation Law of the State of Delaware. In the case of a Stockholder Requested SpecialMeeting, such meeting shall be held at such date and time as may be fixed by the Board of Directors;provided, however, that the date of any Stockholder Requested Special Meeting shall be not more than sixty(60) days after the record date for such meeting (the “Meeting Record Date”), which shall be fixed inaccordance with Section 2.12 of these by-laws; provided further that, if the Board of Directors fails todesignate, within ten (10) days after the Delivery Date, a date and time for a Stockholder Requested SpecialMeeting, then such meeting shall be held at 9:00 a.m. local time on the 60th day after the Meeting RecordDate (or, if that day shall not be a business day, then on the next preceding business day); and provided furtherthat in the event that the Board of Directors fails to designate a place for a Stockholder Requested SpecialMeeting within ten (10) days after the Delivery Date, then such meeting shall be held at the Corporation’sprincipal executive offices. In fixing a date and time for any Stockholder Requested Special Meeting, theBoard of Directors may consider such factors as it deems relevant within the good faith exercise of businessjudgment, including, without limitation, the nature of the matters to be considered, the facts and circumstancessurrounding any request for meeting and any plan of the Board of Directors to call an annual meeting or aspecial meeting.
(e) Business Transacted at a Special Meeting. Business to be transacted at a special meeting may only bebrought before the meeting pursuant to the Corporation’s notice of meeting. Business transacted at anyStockholder Requested Special Meeting shall be limited to the purpose(s) stated in the Stockholder SpecialMeeting Request(s); provided, however, that nothing herein shall prohibit the Board of Directors fromsubmitting matters to the stockholders at any Stockholder Requested Special Meeting.
A-2

UNITED STATES SECURITIES AND EXCHANGE COMMISSIONWashington, D.C. 20549
Form 10-K(Mark One)
¥ ANNUAL REPORT PURSUANT TO SECTION 13 OR 15(d)OF THE SECURITIES AND EXCHANGE ACT OF 1934For the fiscal year ended December 31, 2010
ORn TRANSITION REPORT PURSUANT TO SECTION 13 OR 15(d)
OF THE SECURITIES AND EXCHANGE ACT OF 1934For the transition period from to
Commission file number 1-12154
Waste Management, Inc.(Exact name of registrant as specified in its charter)
Delaware(State or other jurisdiction ofincorporation or organization)
73-1309529(I.R.S. Employer
Identification No.)
1001 Fannin Street, Suite 4000Houston, Texas
(Address of principal executive offices)
77002(Zip code)
Registrant’s telephone number, including area code:(713) 512-6200
Securities registered pursuant to Section 12(b) of the Act:Title of Each Class Name of Exchange on Which Registered
Common Stock, $.01 par value New York Stock ExchangeIndicate by check mark if the registrant is a well-known seasoned issuer, as defined by Rule 405 of the Securities
Act. Yes ¥ No n
Indicate by check mark if the registrant is not required to file reports pursuant to Section 13 or Section 15(d) of theAct. Yes n No ¥
Indicate by check mark whether the registrant (1) has filed all reports required to be filed by Section 13 or 15(d) of the SecuritiesExchange Act of 1934 during the preceding 12 months (or for such shorter period that the registrant was required to file such reports), and(2) has been subject to such filing requirements for the past 90 days. Yes ¥ No n
Indicate by check mark whether the registrant has submitted electronically and posted on its corporate Web site, if any, every InteractiveData File required to be submitted and posted pursuant to Rule 405 of Regulations S-T (§ 232.405 of this chapter) during the preceding12 months (or for such shorter period that the registrant was required to submit and post such files). Yes ¥ No n
Indicate by check mark if disclosure of delinquent filers pursuant to Item 405 of Regulations S-K (§ 229.405 of this chapter) is notcontained herein, and will not be contained, to the best of Registrant’s knowledge, in definitive proxy or information statements incorporatedby reference in Part III of this Form 10-K or any amendment to this Form 10-K. n
Indicate by check mark whether the registrant is a large accelerated filer, an accelerated filer, a non-accelerated filer, or a smallerreporting company. See the definitions of “large accelerated filer,” “accelerated filer” and “smaller reporting company” in Rule 12b-2 of theExchange Act. (Check one):
Large accelerated filer ¥ Accelerated filer n Non-accelerated filer n Smaller reporting company n
(Do not check if a smaller reporting company)
Indicate by check mark whether the registrant is a shell company (as defined in Rule 12b-2 of the Act). Yes n No ¥
The aggregate market value of the voting stock held by non-affiliates of the registrant at June 30, 2010 was approximately $15.0 billion.The aggregate market value was computed by using the closing price of the common stock as of that date on the New York Stock Exchange(“NYSE”). (For purposes of calculating this amount only, all directors and executive officers of the registrant have been treated as affiliates.)
The number of shares of Common Stock, $0.01 par value, of the registrant outstanding at February 10, 2011 was 475,487,984 (excludingtreasury shares of 154,794,477).
DOCUMENTS INCORPORATED BY REFERENCE
Document Incorporated as to
Proxy Statement for the2011 Annual Meeting of Stockholders
Part III

TABLE OF CONTENTS
Page
PART IItem 1. Business . . . . . . . . . . . . . . . . . . . . . . . . . . . . . . . . . . . . . . . . . . . . . . . . . . . . . . . . . . . . . . . 2
Item 1A. Risk Factors . . . . . . . . . . . . . . . . . . . . . . . . . . . . . . . . . . . . . . . . . . . . . . . . . . . . . . . . . . . . 13
Item 1B. Unresolved Staff Comments . . . . . . . . . . . . . . . . . . . . . . . . . . . . . . . . . . . . . . . . . . . . . . . . . 21
Item 2. Properties . . . . . . . . . . . . . . . . . . . . . . . . . . . . . . . . . . . . . . . . . . . . . . . . . . . . . . . . . . . . . . 21
Item 3. Legal Proceedings . . . . . . . . . . . . . . . . . . . . . . . . . . . . . . . . . . . . . . . . . . . . . . . . . . . . . . . . 22
Item 4. Reserved . . . . . . . . . . . . . . . . . . . . . . . . . . . . . . . . . . . . . . . . . . . . . . . . . . . . . . . . . . . . . . . 22
PART IIItem 5. Market for Registrant’s Common Equity, Related Stockholder Matters and Issuer Purchases
of Equity Securities . . . . . . . . . . . . . . . . . . . . . . . . . . . . . . . . . . . . . . . . . . . . . . . . . . . . . . . 23
Item 6. Selected Financial Data . . . . . . . . . . . . . . . . . . . . . . . . . . . . . . . . . . . . . . . . . . . . . . . . . . . . 25
Item 7. Management’s Discussion and Analysis of Financial Condition and Results of Operations . . . 26Item 7A. Quantitative and Qualitative Disclosures About Market Risk . . . . . . . . . . . . . . . . . . . . . . . . . 60
Item 8. Financial Statements and Supplementary Data . . . . . . . . . . . . . . . . . . . . . . . . . . . . . . . . . . . 63
Item 9. Changes in and Disagreements with Accountants on Accounting and Financial Disclosure . . . 133
Item 9A. Controls and Procedures . . . . . . . . . . . . . . . . . . . . . . . . . . . . . . . . . . . . . . . . . . . . . . . . . . . 133
Item 9B. Other Information . . . . . . . . . . . . . . . . . . . . . . . . . . . . . . . . . . . . . . . . . . . . . . . . . . . . . . . . 133
PART IIIItem 10. Directors, Executive Officers and Corporate Governance . . . . . . . . . . . . . . . . . . . . . . . . . . . . 133
Item 11. Executive Compensation . . . . . . . . . . . . . . . . . . . . . . . . . . . . . . . . . . . . . . . . . . . . . . . . . . . 133
Item 12. Security Ownership of Certain Beneficial Owners and Management and Related StockholderMatters . . . . . . . . . . . . . . . . . . . . . . . . . . . . . . . . . . . . . . . . . . . . . . . . . . . . . . . . . . . . . . . . 133
Item 13. Certain Relationships and Related Transactions, and Director Independence . . . . . . . . . . . . . 133
Item 14. Principal Accounting Fees and Services . . . . . . . . . . . . . . . . . . . . . . . . . . . . . . . . . . . . . . . . 134
PART IVItem 15. Exhibits, Financial Statement Schedules . . . . . . . . . . . . . . . . . . . . . . . . . . . . . . . . . . . . . . . . 134
1

PART I
Item 1. Business.
General
The financial statements presented in this report represent the consolidation of Waste Management, Inc., aDelaware corporation; Waste Management’s wholly-owned and majority-owned subsidiaries; and certain variableinterest entities for which Waste Management or its subsidiaries are the primary beneficiary as described in Note 20to the Consolidated Financial Statements. Waste Management is a holding company and all operations areconducted by its subsidiaries. When the terms “the Company,” “we,” “us” or “our” are used in this document, thoseterms refer to Waste Management, Inc., its consolidated subsidiaries and consolidated variable interest entities.When we use the term “WM,” we are referring only to Waste Management, Inc., the parent holding company.
WM was incorporated in Oklahoma in 1987 under the name “USA Waste Services, Inc.” and was reincor-porated as a Delaware company in 1995. In a 1998 merger, the Illinois-based waste services company formerlyknown as Waste Management, Inc. became a wholly-owned subsidiary of WM and changed its name to WasteManagement Holdings, Inc. (“WM Holdings”). At the same time, our parent holding company changed its namefrom USA Waste Services to Waste Management, Inc. Like WM, WM Holdings is a holding company and alloperations are conducted by subsidiaries. For detail on the financial position, results of operations and cash flows ofWM, WM Holdings and their subsidiaries, see Note 23 to the Consolidated Financial Statements.
Our principal executive offices are located at 1001 Fannin Street, Suite 4000, Houston, Texas 77002. Ourtelephone number at that address is (713) 512-6200. Our website address is http://www.wm.com. Our annual reportson Form 10-K, quarterly reports on Form 10-Q and current reports on Form 8-K are all available, free of charge, onour website as soon as practicable after we file the reports with the SEC. Our stock is traded on the New York StockExchange under the symbol “WM.”
We are the leading provider of comprehensive waste management services in North America. Our subsidiariesprovide collection, transfer, recycling, and disposal services. We are also a leading developer, operator and owner ofwaste-to-energy and landfill gas-to-energy facilities in the United States. Our customers include residential,commercial, industrial and municipal customers throughout North America. During 2010, our largest customerrepresented approximately 2% of annual revenues. We employed approximately 42,800 people as of December 31,2010.
Through our core waste management services, we own or operate 271 landfill sites, which is the largestnetwork of landfills in our industry. In order to make disposal more practical for larger urban markets, where thedistance to landfills or waste-to-energy facilities is typically farther, we manage 294 transfer stations thatconsolidate, compact and transport waste efficiently and economically. We also use waste to create energy.One method we use involves recovering the naturally occurring gas in landfills for use in the generation ofelectricity. We also use waste to create energy through a highly efficient combustion process. Our waste-to-energysubsidiary, Wheelabrator Technologies Inc., operates 22 plants that produce clean, renewable energy. We are aleading recycler in North America, handling materials that include paper, cardboard, glass, plastic, metal andelectronics. Through our recycling operations, we provide cost-efficient, environmentally sound programs formunicipalities, businesses and households across the U.S. and Canada. In addition to traditional waste operations,we are also expanding to increase the service offerings we provide for our customers.
Our Company’s goals are targeted at serving our customers, our employees, the environment, the communitiesin which we work and our stockholders, and achievement of our goals is intended to meet the needs of a changingindustry. The waste industry continues to confront significant changes. In recent years landfill volumes havedeclined, and customers are increasingly using alternatives to traditional disposal, such as recycling andcomposting, while also working to reduce the waste they generate. Accomplishment of our goals will grow ourCompany and allow us to meet the needs of our customers and communities as they, too, Think Green». We believethat helping our customers achieve their environmental goals will enable us to achieve profitable growth.
Our strategic focus is centered on three long-term goals: know more about our customers and how to servicethem than anyone else; use conversion and processing technology to extract more value from the materials we
2

manage; and continuously improve our operational efficiency. We intend to pursue achievement of our long-termgoals in the short-term through efforts to:
• Grow our markets by implementing customer-focused growth, through customer segmentation and throughstrategic acquisitions, while maintaining our pricing discipline and increasing the amount of recyclablematerials we handle each year;
• Grow our customer loyalty, in part through the use of enabling technologies;
• Grow into new markets by investing in greener technologies; and
• Pursue initiatives that improve our operations and cost structure.
We believe that execution of our strategy, including making the investments required by our strategy, willprovide long-term value to our stockholders. In addition, we intend to continue to return value to our stockholdersthrough common stock repurchases and dividend payments. In December 2010, we announced that our Board ofDirectors expects that quarterly dividend payments will be increased to $0.34 per share in 2011, which is an 8%increase from the quarterly dividend we paid in 2010. This will result in an increase in the amount of free cash flowthat we expect to pay out as dividends for the eighth consecutive year and is an indication of our ability to generatestrong and consistent cash flows. All quarterly dividends will be declared at the discretion of our Board of Directors.
Operations
General
We manage and evaluate our principal operations through five Groups. Our four geographic operating Groups,comprised of our Eastern, Midwest, Southern and Western Groups, provide collection, transfer, disposal (in bothsolid waste and hazardous waste landfills) and recycling services. Our fifth Group is the Wheelabrator Group,which provides waste-to-energy services and manages waste-to-energy facilities and independent power productionplants, or IPPs. We also provide additional services that are not managed through our five Groups, as describedbelow. These operations are presented in this report as “Other.”
The table below shows the total revenues (in millions) contributed annually by each of our Groups, orreportable segments, in the three-year period ended December 31, 2010. More information about our results ofoperations by reportable segment is included in Note 21 to the Consolidated Financial Statements and inManagement’s Discussion and Analysis of Financial Condition and Results of Operations, included in this report.
2010 2009 2008Years Ended December 31,
Eastern . . . . . . . . . . . . . . . . . . . . . . . . . . . . . . . . . . . . . . . . . . . . . $ 2,943 $ 2,960 $ 3,319
Midwest . . . . . . . . . . . . . . . . . . . . . . . . . . . . . . . . . . . . . . . . . . . . 3,048 2,855 3,267
Southern . . . . . . . . . . . . . . . . . . . . . . . . . . . . . . . . . . . . . . . . . . . . 3,461 3,328 3,740
Western . . . . . . . . . . . . . . . . . . . . . . . . . . . . . . . . . . . . . . . . . . . . . 3,173 3,125 3,387
Wheelabrator . . . . . . . . . . . . . . . . . . . . . . . . . . . . . . . . . . . . . . . . . 889 841 912
Other . . . . . . . . . . . . . . . . . . . . . . . . . . . . . . . . . . . . . . . . . . . . . . 963 628 897
Intercompany . . . . . . . . . . . . . . . . . . . . . . . . . . . . . . . . . . . . . . . . (1,962) (1,946) (2,134)
Total . . . . . . . . . . . . . . . . . . . . . . . . . . . . . . . . . . . . . . . . . . . . . $12,515 $11,791 $13,388
3

The services we provide include collection, landfill (solid and hazardous waste landfills), transfer, waste-to-energyfacilities and independent power production plants, recycling and other services, as described below. The followingtable shows revenues (in millions) contributed by these services for each of the three years indicated:
2010 2009 2008Years Ended December 31,
Collection . . . . . . . . . . . . . . . . . . . . . . . . . . . . . . . . . . . . . . . . . . . $ 8,247 $ 7,980 $ 8,679
Landfill . . . . . . . . . . . . . . . . . . . . . . . . . . . . . . . . . . . . . . . . . . . . . 2,540 2,547 2,955
Transfer . . . . . . . . . . . . . . . . . . . . . . . . . . . . . . . . . . . . . . . . . . . . 1,318 1,383 1,589Wheelabrator . . . . . . . . . . . . . . . . . . . . . . . . . . . . . . . . . . . . . . . . . 889 841 912
Recycling . . . . . . . . . . . . . . . . . . . . . . . . . . . . . . . . . . . . . . . . . . . 1,169 741 1,180
Other . . . . . . . . . . . . . . . . . . . . . . . . . . . . . . . . . . . . . . . . . . . . . . 314 245 207
Intercompany . . . . . . . . . . . . . . . . . . . . . . . . . . . . . . . . . . . . . . . . (1,962) (1,946) (2,134)
Total . . . . . . . . . . . . . . . . . . . . . . . . . . . . . . . . . . . . . . . . . . . . . $12,515 $11,791 $13,388
Collection. Our commitment to customers begins with a vast waste collection network. Collection involvespicking up and transporting waste and recyclable materials from where it was generated to a transfer station,material recovery facility (“MRF”) or disposal site. We generally provide collection services under one of two typesof arrangements:
• For commercial and industrial collection services, typically we have a three-year service agreement. Thefees under the agreements are influenced by factors such as collection frequency, type of collectionequipment we furnish, type and volume or weight of the waste collected, distance to the disposal facility,labor costs, cost of disposal and general market factors. As part of the service, we provide steel containers tomost customers to store their solid waste between pick-up dates. Containers vary in size and type accordingto the needs of our customers and the restrictions of their communities. Many are designed to be liftedmechanically and either emptied into a truck’s compaction hopper or directly into a disposal site. By usingthese containers, we can service most of our commercial and industrial customers with trucks operated byonly one employee.
• For most residential collection services, we have a contract with, or a franchise granted by, a municipality,homeowners’ association or some other regional authority that gives us the exclusive right to service all or aportion of the homes in an area. These contracts or franchises are typically for periods of three to five years.We also provide services under individual monthly subscriptions directly to households. The fees forresidential collection are either paid by the municipality or authority from their tax revenues or servicecharges, or are paid directly by the residents receiving the service.
Landfill. Landfills are the main depositories for solid waste in North America. At December 31, 2010, weowned or operated 266 solid waste landfills, which represents the largest network of landfills in North America.Solid waste landfills are constructed and operated on land with engineering safeguards that limit the possibility ofwater and air pollution, and are operated under procedures prescribed by regulation. A landfill must meet federal,state or provincial, and local regulations during its design, construction, operation and closure. The operation andclosure activities of a solid waste landfill include excavation, construction of liners, continuous spreading andcompacting of waste, covering of waste with earth or other acceptable material and constructing the cap of thelandfill. These operations are carefully planned to maintain environmentally safe conditions and to maximize theuse of the airspace.
All solid waste management companies must have access to a disposal facility, such as a solid waste landfill.The significant capital requirements of developing and operating a landfill serve as a barrier to landfill ownershipand, as a result, third-party haulers often dispose of waste at our landfills. It is usually preferable for our collectionoperations to use disposal facilities that we own or operate, a practice we refer to as internalization, rather than usingthird-party disposal facilities. Internalization generally allows us to realize higher consolidated margins andstronger operating cash flows. The fees charged at disposal facilities, which are referred to as tipping fees, are basedon several factors, including competition and the type and weight or volume of solid waste deposited.
4
We also operate five secure hazardous waste landfills in the United States. Under environmental laws, thefederal government (or states with delegated authority) must issue permits for all hazardous waste landfills. All ofour hazardous waste landfills have obtained the required permits, although some can accept only certain types ofhazardous waste. These landfills must also comply with specialized operating standards. Only hazardous waste in astable, solid form, which meets regulatory requirements, can be deposited in our secure disposal cells. In somecases, hazardous waste can be treated before disposal. Generally, these treatments involve the separation or removalof solid materials from liquids and chemical treatments that transform waste into inert materials that are no longerhazardous. Our hazardous waste landfills are sited, constructed and operated in a manner designed to provide long-term containment of waste. We also operate a hazardous waste facility at which we isolate treated hazardous wastein liquid form by injection into deep wells that have been drilled in certain acceptable geologic formations far belowthe base of fresh water to a point that is safely separated by other substantial geological confining layers.
Transfer. At December 31, 2010, we owned or operated 294 transfer stations in North America. We depositwaste at these stations, as do other waste haulers. The solid waste is then consolidated and compacted to reduce thevolume and increase the density of the waste and transported by transfer trucks or by rail to disposal sites.
Access to transfer stations is critical to haulers who collect waste in areas not in close proximity to disposalfacilities. Fees charged to third parties at transfer stations are usually based on the type and volume or weight of thewaste deposited at the transfer station, the distance to the disposal site and general market factors.
The utilization of our transfer stations by our own collection operations improves internalization by allowingus to retain fees that we would otherwise pay to third parties for the disposal of the waste we collect. It enables us tomanage costs associated with waste disposal because (i) transfer trucks, railcars or rail containers have largercapacities than collection trucks, allowing us to deliver more waste to the disposal facility in each trip; (ii) waste isaccumulated and compacted at transfer stations that are strategically located to increase the efficiency of ournetwork of operations; and (iii) we can retain the volume by managing the transfer of the waste to one of our owndisposal sites.
The transfer stations that we operate but do not own generally are operated through lease agreements underwhich we lease property from third parties. There are some instances where transfer stations are operated undercontract, generally for municipalities. In most cases we own the permits and will be responsible for any regulatoryrequirements relating to the operation and closure of the transfer station.
Wheelabrator. As of December 31, 2010, we owned or operated 17 waste-to-energy facilities and fiveindependent power production plants which are located in the Northeast, in the Mid-Atlantic, and in Florida,California and Washington.
At our waste-to-energy facilities, solid waste is burned at high temperatures in specially designed boilers toproduce heat that is converted into high-pressure steam. As of December 31, 2010, our waste-to-energy facilitieswere capable of processing up to 22,300 tons of solid waste each day. In 2010, our waste-to-energy facilitiesreceived and processed 7.5 million tons of solid waste, or approximately 20,700 tons per day.
Our IPPs convert various waste and conventional fuels into steam. The plants burn wood waste, anthracite coalwaste (culm), tires, landfill gas and natural gas. These facilities are integral to the solid waste industry, disposing ofurban wood, waste tires, railroad ties and utility poles. Our anthracite culm facility in Pennsylvania processes thewaste materials left over from coal mining operations from over half a century ago. Ash remaining after burning theculm is used to reclaim the land damaged by decades of coal mining.
We generate steam at our waste-to-energy and IPP facilities for the production of electricity. We sell theelectricity produced at our facilities into wholesale markets, which include investor-owned utilities, powermarketers and regional power pools. Some of our facilities also sell steam directly to end users. Fees chargedfor electricity and steam at our waste-to-energy facilities and IPPs have generally been subject to the terms andconditions of long-term contracts that include interim adjustments to the prices charged for changes in marketconditions such as inflation, electricity prices and other general market factors. During 2010 and 2009, several ofour long-term energy contracts and short-term pricing arrangements expired, significantly increasing ourwaste-to-energy revenues’ exposure to volatility attributable to changes in market prices for electricity, whichgenerally correlate with fluctuations in natural gas prices in the markets in which we operate. Our market-price
5

volatility will continue to increase as additional long-term contracts expire. We use short-term “receive fixed, payvariable” electricity commodity swaps to mitigate the variability in our revenues and cash flows caused byfluctuations in the market prices for electricity. Refer to the Quantitative and Qualitative Disclosures About MarketRisk section of this report for additional information about the Company’s current considerations related to themanagement of this market exposure.
We continue to look at opportunities to expand our waste-to-energy business. In 2010, we made twoinvestments which increased the total assets of our Wheelabrator Group by $318 million for the year endedDecember 31, 2010. In the first quarter of 2010, we paid $142 million to acquire a 40% equity investment inShanghai Environment Group (“SEG”), a subsidiary of Shanghai Chengtou Holding Co., Ltd. As a joint venturepartner in SEG, we will participate in the operation and management of waste-to-energy and other waste services inthe Chinese market. SEG will also focus on building new waste-to-energy facilities in China. As of December 31,2010, SEG owned and operated two waste-to-energy facilities, five landfills and five transfer stations. An additionalfive waste-to-energy facilities were under construction. Our share of SEG’s earnings are included in “Equity in netlosses in unconsolidated entities” in our Consolidated Statement of Operations. In the second quarter of 2010, wepaid $150 million for the acquisition of a waste-to-energy facility in Portsmouth, Virginia. Additionally,Wheelabrator is actively pursuing development projects with industry partners and pursuing other opportunitiesto provide waste-to-energy services in the United Kingdom.
Recycling. Our recycling operations focus on improving the sustainability and future growth of recyclingprograms within communities and industries. In 2001, we became the first major solid waste company to focus onresidential single-stream recycling, which allows customers to mix recyclable paper, plastic and glass in one bin.Residential single-stream programs have greatly increased the recycling rates. Single-stream recycling is possiblethrough the use of various mechanized screens and optical sorting technologies. We have also been advancing thesingle-stream recycling programs for commercial applications. Recycling involves the separation of reusablematerials from the waste stream for processing and resale or other disposition. Our recycling operations include thefollowing:
Materials processing — Through our collection operations, we collect recyclable materials from res-idential, commercial and industrial customers and direct these materials to one of our MRFs for processing.We operate 98 MRFs where paper, cardboard, metals, plastics, glass, construction and demolition materialsand other recyclable commodities are recovered for resale. We also operate nine secondary processingfacilities where recyclable materials can be further processed into raw products used in the manufacturing ofconsumer goods. Materials processing services include data destruction and automated color sorting.
Plastics materials recycling — Using state-of-the-art sorting and processing technology, we process,inventory and sell plastic commodities making the recycling of such items more cost effective and convenient.
Commodities recycling — We market and resell recyclable commodities to customers world-wide. Wemanage the marketing of recyclable commodities that are processed in our facilities by maintaining com-prehensive service centers that continuously analyze market prices, logistics, market demands and productquality.
Fees for recycling services are influenced by the type of recyclable commodities being processed, the volumeor weight of the recyclable material, degree of processing required, the market value of the recovered material andother market factors.
Some of the recyclable materials processed in our MRFs are purchased from various sources, including thirdparties and our own operations. The cost per ton of material purchased is based on market prices and the cost totransport the processed goods to our customers to whom we sell such materials. The price we pay for recyclablematerials is often referred to as a “rebate.” Rebates generally are based upon the price we receive for sales ofprocessed goods and on market conditions, but in some cases are based on fixed contractual rates or on definedminimum per-ton rates. As a result, changes in commodity prices for recycled fiber can significantly affect ourrevenues, the rebates we pay to our suppliers and our operating income and margins.
6

Other. Other services not managed within our Groups include the following:
We provide recycling brokerage services, which includes managing the marketing of recyclable materials forthird parties. The experience of our recycling operations in managing recyclable commodities for our ownoperations gives us the expertise needed to effectively manage volumes for third parties. Utilizing the resources andknowledge of our recycling operations’ service centers, we can assist customers in marketing and selling theirrecyclable commodities with little to no capital requirements. We also provide electronics recycling. We recyclediscarded computers, communications equipment, and other electronic equipment. Services include the collection,sorting and disassembling of electronics in an effort to reuse or recycle all collected materials. In recent years, wehave teamed with major electronics manufacturers to offer comprehensive “take-back” programs of their productsto assist the general public in disposing of their old electronics in a convenient and environmentally safe manner.
We provide sustainability services to businesses through our Upstream» and Green Squad» organizations. Thisincludes in-plant services, where our employees work full-time inside our customers’ facilities to provide full-service waste management solutions and consulting services. Our vertically integrated waste management oper-ations enable us to provide customers with full management of their waste. The breadth of our service offerings andthe familiarity we have with waste management practices gives us the unique ability to assist customers inminimizing waste they generate, identifying recycling opportunities and determining the most efficient meansavailable for waste collection and disposal.
We develop, operate and promote projects for the beneficial use of landfill gas through our Waste ManagementRenewable Energy Program. Landfill gas is produced naturally as waste decomposes in a landfill. The methanecomponent of the landfill gas is a readily available, renewable energy source that can be gathered and usedbeneficially as an alternative to fossil fuel. The EPA endorses landfill gas as a renewable energy resource, in thesame category as wind, solar and geothermal resources. At December 31, 2010, landfill gas beneficial use projectswere producing commercial quantities of methane gas at 127 of our solid waste landfills. At 97 of these landfills, theprocessed gas is delivered to electricity generators. The electricity is then sold to public utilities, municipal utilitiesor power cooperatives. At 21 landfills, the gas is delivered by pipeline to industrial customers as a direct substitutefor fossil fuels in industrial processes. At nine landfills, the landfill gas is processed to pipeline-quality natural gasand then sold to natural gas suppliers.
Our WM Healthcare Solutions subsidiary offers integrated medical waste services for healthcare facilities,pharmacies and individuals. We provide full-service solutions to facilities to assist them in best practices,identifying waste streams and proper disposal. Our healthcare services also include a sharps mail return programthrough which individuals can safely dispose of their used syringes and lancets using our MedWaste Trackersystem.
Although by their very nature many waste management services such as collection and disposal are localservices, our Strategic Accounts program works with customers whose locations span the United States. OurStrategic Accounts program provides centralized customer service, billing and management of accounts tostreamline the administration of customers’ multiple and nationwide locations’ waste management needs.
We also have begun investing in businesses and technologies that are designed to offer services and solutionsancillary or supplementary to our current operations. These investments include joint ventures, acquisitions andpartial ownership interests. The solutions and services include the collection of project waste, including construc-tion debris and household or yard waste, through our Bagster» program; the development, operation and marketingof plasma gasification facilities; operation of a landfill gas-to-liquid natural gas plant; solar powered trashcompactors; and organic waste-to-fuel conversion technology. Part of our expansion of services includes offeringportable self-storage services; and fluorescent bulb and universal waste mail-back through our LampTracker»program. In addition, at a time when oil prices were low, we decided to pursue investment opportunities thatinvolved acquisition and development of non-working interests in oil and gas producing properties.
Finally, we rent portable restroom facilities to municipalities and commercial customers under the namePort-o-Let», we service such facilities and we provide street and parking lot sweeping services.
7
Competition
The waste industry is very competitive. In North America, the industry consists primarily of two national wastemanagement companies, regional companies and local companies of varying sizes and financial resources,including smaller companies that specialize in certain discrete areas of waste management. We compete withthese companies as well as with counties and municipalities that maintain their own waste collection and disposaloperations.
Operating costs, disposal costs and collection fees vary widely throughout the geographic areas in which weoperate. The prices that we charge are determined locally, and typically vary by volume and weight, type of wastecollected, treatment requirements, risk of handling or disposal, frequency of collections, distance to final disposalsites, the availability of airspace within the geographic region, labor costs and amount and type of equipmentfurnished to the customer. We face intense competition in our core business based on pricing and quality of service.We have also begun competing for business based on service offerings. As companies, individuals and communitiesbegin to look for ways to be more sustainable, we are ensuring our customers know about our comprehensiveservices that go beyond our core business of collecting and disposing of waste.
Seasonal Trends
Our operating revenues normally tend to be somewhat higher in the summer months, primarily due to thetraditional seasonal increase in the volume of construction and demolition waste. The volumes of industrial andresidential waste in certain regions where we operate also tend to increase during the summer months. Our secondand third quarter revenues and results of operations typically reflect these seasonal trends, although we saw asignificantly weaker seasonal volume increase during 2009 than we generally experience.
Additionally, certain destructive weather conditions that tend to occur during the second half of the year, suchas the hurricanes that most often impact our Southern Group, can actually increase our revenues in the areasaffected. While weather-related and other “one-time” occurrences can boost revenues through additional work, as aresult of significant start-up costs and other factors, such revenue sometimes generates earnings at comparativelylower margins. Certain weather conditions, including severe winter storms, may result in the temporary suspensionof our operations, which can significantly affect the operating results of the affected regions. The operating resultsof our first quarter also often reflect higher repair and maintenance expenses because we rely on the slower wintermonths, when waste flows are generally lower, to perform scheduled maintenance at our waste-to-energy facilities.
Employees
At December 31, 2010, we had approximately 42,800 full-time employees, of which approximately 7,600were employed in administrative and sales positions and the balance in operations. Approximately 9,300 of ouremployees are covered by collective bargaining agreements.
Financial Assurance and Insurance Obligations
Financial Assurance
Municipal and governmental waste service contracts generally require contracting parties to demonstratefinancial responsibility for their obligations under the contract. Financial assurance is also a requirement forobtaining or retaining disposal site or transfer station operating permits. Various forms of financial assurance alsoare required to support variable-rate tax-exempt debt and by regulatory agencies for estimated capping, closure,post-closure and environmental remedial obligations at many of our landfills.
We establish financial assurance using surety bonds, letters of credit, insurance policies, trust and escrowagreements and financial guarantees. The type of assurance used is based on several factors, most importantly: thejurisdiction, contractual requirements, market factors and availability of credit capacity. The following table
8

summarizes the various forms and dollar amounts (in millions) of financial assurance that we had outstanding as ofDecember 31, 2010:
Surety bonds:
Issued by consolidated subsidiary(a) . . . . . . . . . . . . . . . . . . . . . . . . . . . . . . . . $ 221
Issued by affiliated entity(b) . . . . . . . . . . . . . . . . . . . . . . . . . . . . . . . . . . . . . . 1,025
Issued by third-party surety companies . . . . . . . . . . . . . . . . . . . . . . . . . . . . . . 1,800
Total surety bonds . . . . . . . . . . . . . . . . . . . . . . . . . . . . . . . . . . . . . . . . . . . . . . . $3,046
Letters of credit:
Revolving credit facility(c) . . . . . . . . . . . . . . . . . . . . . . . . . . . . . . . . . . . . . . . 1,138
Letter of credit facilities(d) . . . . . . . . . . . . . . . . . . . . . . . . . . . . . . . . . . . . . . . 505
Other lines of credit . . . . . . . . . . . . . . . . . . . . . . . . . . . . . . . . . . . . . . . . . . . . 237
Total letters of credit . . . . . . . . . . . . . . . . . . . . . . . . . . . . . . . . . . . . . . . . . . . . . 1,880
Insurance policies:
Issued by consolidated subsidiary(a) . . . . . . . . . . . . . . . . . . . . . . . . . . . . . . . . 1,053
Issued by affiliated entity(b) . . . . . . . . . . . . . . . . . . . . . . . . . . . . . . . . . . . . . . 16
Issued by third-party insurance companies . . . . . . . . . . . . . . . . . . . . . . . . . . . . 184
Total insurance policies . . . . . . . . . . . . . . . . . . . . . . . . . . . . . . . . . . . . . . . . . . . 1,253
Funded trust and escrow accounts(e) . . . . . . . . . . . . . . . . . . . . . . . . . . . . . . . . . . 132
Financial guarantees(f) . . . . . . . . . . . . . . . . . . . . . . . . . . . . . . . . . . . . . . . . . . . . 248
Total financial assurance . . . . . . . . . . . . . . . . . . . . . . . . . . . . . . . . . . . . . . . . . . . $6,559
(a) We use surety bonds and insurance policies issued by a wholly-owned insurance subsidiary, National GuarantyInsurance Company of Vermont, the sole business of which is to issue financial assurance to WM and itssubsidiaries. National Guaranty Insurance Company is authorized to write up to approximately $1.5 billion insurety bonds or insurance policies for our capping, closure and post-closure requirements, waste collectioncontracts and other business-related obligations.
(b) We hold a noncontrolling financial interest in an entity that we use to obtain financial assurance. Ourcontractual agreement with this entity does not specifically limit the amounts of surety bonds or insurance thatwe may obtain, making our financial assurance under this agreement limited only by the guidelines andrestrictions of surety and insurance regulations.
(c) WM has a $2.0 billion revolving credit facility that matures in June 2013. At December 31, 2010, we had nooutstanding borrowings and $1,138 million of letters of credit issued and supported by the facility. The unusedand available credit capacity of the facility was $862 million as of December 31, 2010.
(d) We have an aggregate committed capacity of $505 million under letter of credit facilities with maturities thatextend from June 2013 to June 2015. As of December 31, 2010, no borrowings were outstanding under theseletter of credit facilities and we had no unused or available credit capacity.
(e) Our funded trust and escrow accounts generally have been established to support landfill capping, closure,post-closure and environmental remediation obligations and our performance under various operating con-tracts. Balances maintained in these trust funds and escrow accounts will fluctuate based on (i) changes instatutory requirements; (ii) future deposits made to comply with contractual arrangements; (iii) the ongoinguse of funds for qualifying activities; (iv) acquisitions or divestitures of landfills; and (v) changes in the fairvalue of the financial instruments held in the trust fund or escrow accounts. The assets held in our funded trustand escrow accounts may be drawn and used to meet the obligations for which the trusts and escrows wereestablished.
(f) WM provides financial guarantees on behalf of its subsidiaries to municipalities, customers and regulatoryauthorities. They are provided primarily to support our performance of landfill capping, closure and post-closure activities.
9

(g) The amount of financial assurance required can, and generally will, differ from the obligation determined andrecorded under U.S. generally accepted accounting principles.
Virtually no claims have been made against our financial assurance instruments in the past, and consideringour current financial position, management does not expect there to be claims against these instruments that willhave a material adverse effect on our Consolidated Financial Statements. In 2010, we experienced an increase incosts associated with letters of credit as a result of the June 2010 refinancing of our revolving credit facility. Weactively monitor our financial assurance needs and optimize the utilization of lower-cost instruments when possibleto minimize our costs.
Insurance
We carry a broad range of insurance coverages, including general liability, automobile liability, real andpersonal property, workers’ compensation, directors’ and officers’ liability, pollution legal liability and othercoverages we believe are customary to the industry. Our exposure to loss for insurance claims is generally limited tothe per incident deductible under the related insurance policy. As of December 31, 2010, our general liabilityinsurance program carried self-insurance exposures of up to $2.5 million per incident and our workers’ compen-sation insurance program carried self-insurance exposures of up to $5 million per incident. As of December 31,2010, our auto liability insurance program included a per-incident base deductible of $5 million, subject toadditional deductibles of $4.8 million in the $5 million to $10 million layer. We do not expect the impact of anyknown casualty, property, environmental or other contingency to have a material impact on our financial condition,results of operations or cash flows. Our estimated insurance liabilities as of December 31, 2010 are summarized inNote 11 to the Consolidated Financial Statements.
The Directors’ and Officers’ Liability Insurance policy we choose to maintain covers only individual executiveliability, often referred to as “Broad Form Side A,” and does not provide corporate reimbursement coverage, oftenreferred to as “Side B.” The Side A policy covers directors and officers directly for loss, including defense costs,when corporate indemnification is unavailable. Side A-only coverage cannot be exhausted by payments to theCompany, as the Company is not insured for any money it advances for defense costs or pays as indemnity to theinsured directors and officers.
Regulation
Our business is subject to extensive and evolving federal, state or provincial and local environmental, health,safety and transportation laws and regulations. These laws and regulations are administered by the U.S. EPA andvarious other federal, state and local environmental, zoning, transportation, land use, health and safety agencies inthe United States and various agencies in Canada. Many of these agencies regularly examine our operations tomonitor compliance with these laws and regulations and have the power to enforce compliance, obtain injunctionsor impose civil or criminal penalties in case of violations.
Because the major component of our business is the collection and disposal of solid waste in an environ-mentally sound manner, a significant amount of our capital expenditures are related, either directly or indirectly, toenvironmental protection measures, including compliance with federal, state or provincial and local provisions thatregulate the placement of materials into the environment. There are costs associated with siting, design, operations,monitoring, site maintenance, corrective actions, financial assurance, and facility closure and post-closure obli-gations. In connection with our acquisition, development or expansion of a disposal facility or transfer station, wemust often spend considerable time, effort and money to obtain or maintain required permits and approvals. Therecannot be any assurances that we will be able to obtain or maintain required governmental approvals. Onceobtained, operating permits are subject to renewal, modification, suspension or revocation by the issuing agency.Compliance with these and any future regulatory requirements could require us to make significant capital andoperating expenditures. However, most of these expenditures are made in the normal course of business and do notplace us at any competitive disadvantage.
10

The primary United States federal statutes affecting our business are summarized below:
• The Resource Conservation and Recovery Act of 1976, as amended, regulates handling, transporting anddisposing of hazardous and non-hazardous waste and delegates authority to states to develop programs toensure the safe disposal of solid waste. In 1991, the EPA issued its final regulations under Subtitle D ofRCRA, which set forth minimum federal performance and design criteria for solid waste landfills. Theseregulations are typically implemented by the states, although states can impose requirements that are morestringent than the Subtitle D standards. We incur costs in complying with these standards in the ordinarycourse of our operations.
• The Comprehensive Environmental Response, Compensation and Liability Act of 1980, as amended, whichis also known as Superfund, provides for federal authority to respond directly to releases or threatenedreleases of hazardous substances into the environment that have created actual or potential environmentalhazards. CERCLA’s primary means for addressing such releases is to impose strict liability for cleanup ofdisposal sites upon current and former site owners and operators, generators of the hazardous substances atthe site and transporters who selected the disposal site and transported substances thereto. Liability underCERCLA is not dependent on the intentional disposal of hazardous substances; it can be based upon therelease or threatened release, even as a result of lawful, unintentional and non-negligent action, of hazardoussubstances as the term is defined by CERCLA and other applicable statutes and regulations. Liability mayinclude contribution for cleanup costs incurred by a defendant in a CERCLA civil action or by an entity thathas previously resolved its liability to federal or state regulators in an administrative or judicially-approvedsettlement. Liability under CERCLA could also include obligations to a PRP that voluntarily expends siteclean-up costs. Further, liability for damage to publicly-owned natural resources may also be imposed. Weare subject to potential liability under CERCLA as an owner or operator of facilities at which hazardoussubstances have been disposed and as a generator or transporter of hazardous substances disposed of at otherlocations.
• The Federal Water Pollution Control Act of 1972, known as the Clean Water Act, regulates the discharge ofpollutants into streams, rivers, groundwater, or other surface waters from a variety of sources, including solidand hazardous waste disposal sites. If run-off from our operations may be discharged into surface waters, theClean Water Act requires us to apply for and obtain discharge permits, conduct sampling and monitoring,and, under certain circumstances, reduce the quantity of pollutants in those discharges. In 1990, the EPAissued additional standards for management of storm water runoff that require landfills and other waste-handling facilities to obtain storm water discharge permits. In addition, if a landfill or other facilitydischarges wastewater through a sewage system to a publicly-owned treatment works, the facility mustcomply with discharge limits imposed by the treatment works. Also, before the development or expansion ofa landfill can alter or affect “wetlands,” a permit may have to be obtained providing for mitigation orreplacement wetlands. The Clean Water Act provides for civil, criminal and administrative penalties forviolations of its provisions.
• The Clean Air Act of 1970, as amended, provides for increased federal, state and local regulation of theemission of air pollutants. Certain of our operations are subject to the requirements of the Clean Air Act,including large municipal solid waste landfills and large municipal waste-to-energy facilities. Standardshave also been imposed on manufacturers of transportation vehicles (including waste collection vehicles). In1996 the EPA issued new source performance standards and emission guidelines controlling landfill gasesfrom new and existing large landfills. In January 2003, the EPA issued Maximum Achievable ControlTechnology standards for municipal solid waste landfills subject to the new source performance standards.These regulations impose limits on air emissions from large municipal solid waste landfills, subject most ofour large municipal solid waste landfills to certain operating permitting requirements under Title V of theClean Air Act and, in many instances, require installation of landfill gas collection and control systems tocontrol emissions or to treat and utilize landfill gas on or off-site. In 2010, the EPA issued the Prevention ofSignificant Deterioration, or PSD, and Title V Greenhouse Gas, or GHG, Tailoring Rule which expanded theEPA’s federal air permitting authority to include the six GHGs, including methane and carbon dioxide. Airpermits for new and modified large municipal solid waste landfills, waste-to-energy facilities and landfillgas-to-energy facilities could be impacted, but the degree of impact is incumbent upon the EPA’s final
11

determination on permitting of biogenic GHG emissions (e.g. carbon dioxide) as well as the EPA’s orimplementing states’ determinations on what may constitute “Best Available Control Technology” for newprojects exceeding certain thresholds. In addition, recent final and proposed reductions in certain NationalAmbient Air Quality Standards and related PSD increment/significance thresholds could impact the cost,timeliness and availability of air permits for new and modified large municipal solid waste landfills,waste-to-energy facilities and landfill gas-to-energy facilities. In general, controlling emissions involvesdrilling collection wells into a landfill and routing the gas to a suitable energy recovery system orcombustion device. We are currently capturing and utilizing the renewable energy value of landfill gasat 127 of our solid waste landfills. Efforts to curtail the emission of greenhouse gases and to ameliorate theeffect of climate change may require our landfills to deploy more stringent emission controls, with resultingcapital or operating costs. See Item 1A. Risk Factors — “The adoption of climate change legislation orregulations restricting emissions of “greenhouse gases” could increase our costs to operate.”
The EPA has issued new source performance standards and emission guidelines for large and smallmunicipal waste-to-energy facilities, which include stringent emission limits for various pollutants based onMaximum Achievable Control Technology standards. These sources are also subject to operating permitrequirements under Title Vof the Clean Air Act. The Clean Air Act requires the EPA to review and revise theMACT standards applicable to municipal waste-to-energy facilities every five years.
• The Occupational Safety and Health Act of 1970, as amended, establishes certain employer responsibilities,including maintenance of a workplace free of recognized hazards likely to cause death or serious injury,compliance with standards promulgated by the Occupational Safety and Health Administration, and variousreporting and record keeping obligations as well as disclosure and procedural requirements. Variousstandards for notices of hazards, safety in excavation and demolition work and the handling of asbestos,may apply to our operations. The Department of Transportation and OSHA, along with other federalagencies, have jurisdiction over certain aspects of hazardous materials and hazardous waste, includingsafety, movement and disposal. Various state and local agencies with jurisdiction over disposal of hazardouswaste may seek to regulate movement of hazardous materials in areas not otherwise preempted by federallaw.
There are also various state or provincial and local regulations that affect our operations. Sometimes states’regulations are stricter than federal laws and regulations when not otherwise preempted by federal law. Addi-tionally, our collection and landfill operations could be affected by legislative and regulatory measures requiring orencouraging waste reduction at the source and waste recycling.
Various states have enacted, or are considering enacting, laws that restrict the disposal within the state of solidwaste generated outside the state. While laws that overtly discriminate against out-of-state waste have been found tobe unconstitutional, some laws that are less overtly discriminatory have been upheld in court. Additionally, severalstate and local governments have enacted “flow control” regulations, which attempt to require that all wastegenerated within the state or local jurisdiction be deposited at specific sites. In 1994, the United States SupremeCourt ruled that a flow control ordinance that gave preference to a local facility that was privately owned wasunconstitutional, but in 2007, the Court ruled that an ordinance directing waste to a facility owned by the localgovernment was constitutional. In addition, from time to time, the United States Congress has consideredlegislation authorizing states to adopt regulations, restrictions, or taxes on the importation of out-of-state orout-of-jurisdiction waste. The United States Congress’ adoption of legislation allowing restrictions on interstatetransportation of out-of-state or out-of-jurisdiction waste or certain types of flow control or the adoption oflegislation affecting interstate transportation of waste at the state level could adversely affect our operations.Courts’ interpretation of flow control legislation or the Supreme Court decisions also could adversely affect oursolid and hazardous waste management services.
Many states, provinces and local jurisdictions have enacted “fitness” laws that allow the agencies that havejurisdiction over waste services contracts or permits to deny or revoke these contracts or permits based on theapplicant’s or permit holder’s compliance history. Some states, provinces and local jurisdictions go further andconsider the compliance history of the parent, subsidiaries or affiliated companies, in addition to the applicant orpermit holder. These laws authorize the agencies to make determinations of an applicant’s or permit holder’s fitness
12

to be awarded a contract to operate, and to deny or revoke a contract or permit because of unfitness, unless there is ashowing that the applicant or permit holder has been rehabilitated through the adoption of various operating policiesand procedures put in place to assure future compliance with applicable laws and regulations.
See Note 11 to the Consolidated Financial Statements for disclosures relating to our current assessments of theimpact of regulations on our current and future operations.
Item 1A. Risk Factors.
In an effort to keep our stockholders and the public informed about our business, we may make “forward-looking statements.” Forward-looking statements usually relate to future events and anticipated revenues, earnings,cash flows or other aspects of our operations or operating results. Forward-looking statements are often identifiedby the words, “will,” “may,” “should,” “continue,” “anticipate,” “believe,” “expect,” “plan,” “forecast,” “project,”“estimate,” “intend” and words of similar nature and generally include statements containing:
• projections about accounting and finances;
• plans and objectives for the future;
• projections or estimates about assumptions relating to our performance; or
• our opinions, views or beliefs about the effects of current or future events, circumstances or performance.
You should view these statements with caution. These statements are not guarantees of future performance,circumstances or events. They are based on facts and circumstances known to us as of the date the statements aremade. All phases of our business are subject to uncertainties, risks and other influences, many of which we do notcontrol. Any of these factors, either alone or taken together, could have a material adverse effect on us and couldchange whether any forward-looking statement ultimately turns out to be true. Additionally, we assume noobligation to update any forward-looking statement as a result of future events, circumstances or developments. Thefollowing discussion should be read together with the Consolidated Financial Statements and the notes thereto.Outlined below are some of the risks that we believe could affect our business and financial statements for 2011 andbeyond.
General economic conditions can directly and adversely affect our revenues and our operating margins.
Our business is directly affected by changes in national and general economic factors that are outside of ourcontrol, including consumer confidence, interest rates and access to capital markets. A weak economy generallyresults in decreases in volumes of waste generated, which decreases our revenues. In addition, we have a relativelyhigh fixed-cost structure, which is difficult to quickly adjust to match shifting volume levels. Consumer uncertaintyand the loss of consumer confidence may limit the number or amount of services requested by customers and ourability to implement our pricing strategy. In addition to disruption in the credit markets, recent and continuingeconomic conditions have negatively affected business and consumer spending generally. If our commercialcustomers do not have access to capital, both our volumes and our ability to increase new business will be negativelyimpacted.
The waste industry is highly competitive, and if we cannot successfully compete in the marketplace, ourbusiness, financial condition and operating results may be materially adversely affected.
We encounter intense competition from governmental, quasi-governmental and private sources in all aspectsof our operations. In North America, the industry consists primarily of two national waste management companies,regional companies and local companies of varying sizes and financial resources, including smaller companies thatspecialize in certain discrete areas of waste management. We compete with these companies as well as withcounties and municipalities that maintain their own waste collection and disposal operations. These counties andmunicipalities may have financial competitive advantages because tax revenues are available to them and tax-exempt financing is more readily available to them. Also, such governmental units may attempt to impose flowcontrol or other restrictions that would give them a competitive advantage. In addition, competitors may reduce
13

their prices to expand sales volume or to win competitively-bid contracts. When this happens, we may be unable toexecute our pricing strategy, resulting in a negative impact to our revenue growth from yield on base business.
If we fail to implement our business strategy, our financial performance and our growth could bematerially and adversely affected.
Our future financial performance and success are dependent in large part upon our ability to implement ourbusiness strategy successfully. We have adopted a business strategy built on three key initiatives: know more aboutour customers and how to service them than anyone else; use conversion and processing technology to extract morevalue from the materials we manage; and continuously improve our operational efficiency. In the short-term, weintend to pursue these initiatives through efforts to:
• Grow our markets by implementing customer-focused growth, through customer segmentation and throughstrategic acquisitions, while maintaining our pricing discipline and increasing the amount of recyclablematerials we handle each year;
• Grow our customer loyalty, in part through the use of enabling technologies;
• Grow into new markets by investing in greener technologies; and
• Pursue initiatives that improve our operations and cost structure.
There are risks involved in pursuing our strategy, including the following:
• Our strategy may result in a significant change to our business, and our employees, customers or investorsmay not embrace and support our strategy.
• Customer segmentation is new to our business, and it could result in fragmentation of our efforts, rather thanimproved customer relationships.
• In efforts to enhance our revenues, we have implemented price increases and environmental fees, and wehave continued our fuel surcharge program to offset fuel costs. The loss of volumes as a result of priceincreases may negatively affect our cash flows or results of operations.
• Our ability to make strategic acquisitions and invest in greener technologies depends on our ability toidentify desirable acquisition or investment targets, negotiate advantageous transactions despite competitionfor such opportunities, and realize the benefits we expect from those transactions.
• Acquisitions and/or investments may not increase our earnings in the timeframe anticipated, or at all, due todifficulties operating in new markets or providing new service offerings, failure to operate within budget,integration issues, or regulatory issues, among others.
• We continue to seek to divest underperforming and non-strategic assets if we cannot improve theirprofitability. We may not be able to successfully negotiate the divestiture of underperforming and non-strategic operations, which could result in asset impairments or the continued operation of low-marginbusinesses.
In addition to the risks set forth above, implementation of our business strategy could also be affected by anumber of factors beyond our control, such as increased competition, legal developments, government regulation,general economic conditions, increased operating costs or expenses and changes in industry trends. Further, we maydecide to alter or discontinue certain aspects of our business strategy at any time. If we are not able to implement ourbusiness strategy successfully, our long-term growth and profitability may be adversely affected. Even if we are ableto implement some or all of the initiatives of our business plan successfully, our operating results may not improveto the extent we anticipate, or at all.
The seasonal nature of our business and “one-time” special projects cause our results to fluctuate, andprior performance is not necessarily indicative of our future results.
Our operating revenues tend to be somewhat higher in summer months, primarily due to the higher volume ofconstruction and demolition waste. The volumes of industrial and residential waste in certain regions where we
14

operate also tend to increase during the summer months. Our second and third quarter revenues and results ofoperations typically reflect these seasonal trends. Additionally, certain destructive weather conditions that tend tooccur during the second half of the year, such as the hurricanes that most often impact our Southern Group, canactually increase our revenues in the areas affected. While weather-related and other “one-time” occurrences canboost revenues through additional work, as a result of significant start-up costs and other factors, such revenuesometimes generates earnings at comparatively lower margins. During 2010, our financial results included revenuegenerated as a result of clean-up efforts in connection with the oil spill along the Gulf Coast and the substantialflooding in Tennessee; however, these special projects have a limited time span.
Certain weather conditions, including severe weather storms, may result in the temporary suspension of ouroperations, which can significantly affect the operating results of the affected regions. The operating results of ourfirst quarter also often reflect higher repair and maintenance expenses because we rely on the slower winter months,when waste flows are generally lower, to perform scheduled maintenance at our waste-to-energy facilities.
For these and other reasons, operating results in any interim period are not necessarily indicative of operatingresults for an entire year, and operating results for any historical period are not necessarily indicative of operatingresults for a future period.
Our operations are subject to environmental, health and safety laws and regulations, as well as contractualobligations, that may result in significant liabilities.
There is risk of incurring significant environmental liabilities in the use, treatment, storage, transfer anddisposal of waste materials. Under applicable environmental laws and regulations, we could be liable if ouroperations cause environmental damage to our properties or to the property of other landowners, particularly as aresult of the contamination of air, drinking water or soil. Under current law, we could also be held liable for damagecaused by conditions that existed before we acquired the assets or operations involved. This risk is of particularconcern as we execute our growth strategy, partially though acquisitions, because we may be unsuccessful inidentifying and assessing potential liabilities during our due diligence investigations. Further, the counterparties insuch transactions may be unable to perform their indemnification obligations owed to us. Additionally, we could beliable if we arrange for the transportation, disposal or treatment of hazardous substances that cause environmentalcontamination, or if a predecessor owner made such arrangements and, under applicable law, we are treated as asuccessor to the prior owner. Any substantial liability for environmental damage could have a material adverseeffect on our financial condition, results of operations and cash flows.
In the ordinary course of our business, we have in the past, we are currently, and we may in the future, becomeinvolved in legal and administrative proceedings relating to land use and environmental laws and regulations. Theseinclude proceedings in which:
• agencies of federal, state, local or foreign governments seek to impose liability on us under applicablestatutes, sometimes involving civil or criminal penalties for violations, or to revoke or deny renewal of apermit we need; and
• local communities, citizen groups, landowners or governmental agencies oppose the issuance of a permit orapproval we need, allege violations of the permits under which we operate or laws or regulations to which weare subject, or seek to impose liability on us for environmental damage.
We generally seek to work with the authorities or other persons involved in these proceedings to resolve anyissues raised. If we are not successful, the adverse outcome of one or more of these proceedings could result in,among other things, material increases in our costs or liabilities as well as material charges for asset impairments.
Further, we often enter into contractual arrangements with landowners imposing obligations on us to meetcertain regulatory or contractual conditions upon site closure or upon termination of the agreements. Compliancewith these arrangements is inherently subject to subjective determinations and may result in disputes, includinglitigation. Costs to remediate or restore the condition of closed sites may be significant.
15

The waste industry is subject to extensive government regulation, and existing or future regulations mayrestrict our operations, increase our costs of operations or require us to make additional capitalexpenditures.
Stringent government regulations at the federal, state, provincial, and local level in the United States andCanada have a substantial impact on our business, and compliance with such regulations is costly. A large number ofcomplex laws, rules, orders and interpretations govern environmental protection, health, safety, land use, zoning,transportation and related matters. Among other things, they may restrict our operations and adversely affect ourfinancial condition, results of operations and cash flows by imposing conditions such as:
• limitations on siting and constructing new waste disposal, transfer or processing facilities or on expandingexisting facilities;
• limitations, regulations or levies on collection and disposal prices, rates and volumes;
• limitations or bans on disposal or transportation of out-of-state waste or certain categories of waste; or
• mandates regarding the disposal of solid waste, including requirements to recycle rather than landfill certainwaste streams.
Regulations affecting the siting, design and closure of landfills could require us to undertake investigatory orremedial activities, curtail operations or close landfills temporarily or permanently. Future changes in theseregulations may require us to modify, supplement or replace equipment or facilities. The costs of complying withthese regulations could be substantial.
In order to develop, expand or operate a landfill or other waste management facility, we must have variousfacility permits and other governmental approvals, including those relating to zoning, environmental protection andland use. The permits and approvals are often difficult, time consuming and costly to obtain and could containconditions that limit our operations.
We also have significant financial obligations relating to capping, closure, post-closure and environmentalremediation at our existing landfills. We establish accruals for these estimated costs, but we could underestimatesuch accruals. Environmental regulatory changes could accelerate or increase capping, closure, post-closure andremediation costs, requiring our expenditures to materially exceed our current accruals.
Various states have enacted, or are considering enacting, laws that restrict the disposal within the state of solidwaste generated outside the state. Additionally, several state and local governments have enacted “flow control”regulations, which attempt to require that all waste generated within the state or local jurisdiction be deposited atspecific sites. The United States Congress’ adoption of legislation allowing restrictions on interstate transportationof out-of-state or out-of-jurisdiction waste or certain types of flow control or the adoption of legislation affectinginterstate transportation of waste at the state level could adversely affect our operations. Courts’ interpretation offlow control legislation or the Supreme Court decisions also could adversely affect our solid and hazardous wastemanagement services.
The adoption of climate change legislation or regulations restricting emissions of “greenhouse gases”could increase our costs to operate.
Efforts to curtail the emission of GHGs, to ameliorate the effect of climate change, continue to advance on thefederal, regional, and state level. Our landfill operations emit methane, identified as a GHG. In the 111th Congress, theU.S. House of Representatives passed a bill that would regulate GHGs comprehensively. While the centerpiece of thatbill would be a GHG emission allowance cap-and-trade system, neither landfills nor qualifying waste-to-energy plantswould be compelled to hold allowances for their GHG emissions. Rather, they would be subject to certain furtheremission controls to be determined through administrative rule-making. Should comprehensive federal climate changelegislation be enacted, we expect it to impose costs on our operations, the materiality of which we cannot predict.
Absent comprehensive federal legislation to control GHG emissions, the EPA is moving ahead administra-tively under its existing Clean Air Act authority. In 2010, the EPA published a Prevention of SignificantDeterioration (“PSD”) and Title V Greenhouse Gas Tailoring Rule (“PSD tailoring rule”). The rule sets new
16

thresholds for GHG emissions that define when Clean Air Act permits are required under the PSD and Title Vprograms. The EPA’s legal authority to “tailor” statutory thresholds in this rule has been challenged, and the EPAintends to delay regulation of certain emissions pending further regulatory analysis. We cannot predict the finalrequirements of stationary source rules that might apply to landfills and waste-to-energy facilities as a result of thisrulemaking and, accordingly, further developments in this area could have a material effect on our results ofoperations or cash flows.
Our business depends on our reputation and the value of our brand.
We believe we have developed a reputation for high-quality service, reliability and social and environmentalresponsibility, and we believe our brand symbolizes these attributes. The Waste Management brand name,trademarks and logos and our reputation are powerful sales and marketing tools, and we devote significantresources to promoting and protecting them. Adverse publicity, whether or not justified, relating to activities by ouroperations, employees or agents could tarnish our reputation and reduce the value of our brand. Damage to ourreputation and loss of brand equity could reduce demand for our services and thus have an adverse effect on ourfinancial condition, liquidity and results of operations, as well as require additional resources to rebuild ourreputation and restore the value of our brand.
Significant shortages in fuel supply or increases in fuel prices will increase our operating expenses.
The price and supply of fuel can fluctuate significantly based on international, political and economiccircumstances, as well as other factors outside our control, such as actions by the Organization of the PetroleumExporting Countries, or OPEC, and other oil and gas producers, regional production patterns, weather conditionsand environmental concerns. We have seen average quarterly fuel prices increase by as much as 30% on ayear-over-year basis and decrease by as much as 47% on a year-over-year basis within the last two years. We needfuel to run our collection and transfer trucks and our equipment used in our landfill operations. Supply shortagescould substantially increase our operating expenses. Additionally, as fuel prices increase, our direct operatingexpenses increase and many of our vendors raise their prices as a means to offset their own rising costs. We have inplace a fuel surcharge program, designed to offset increased fuel expenses; however, we may not be able to passthrough all of our increased costs and some customers’ contracts prohibit any pass-through of the increased costs.Additionally, we are currently party to a pending suit that pertains to our fuel and environmental charge andgenerally alleges that such charges were not properly disclosed, were unfair, and were contrary to contract. SeeNote 11 of the Consolidated Financial Statements for more information. Regardless of any offsetting surchargeprograms, the increased operating costs will decrease our operating margins.
Some of our customers, including governmental entities, have suffered financial difficulties affecting theircredit risk, which could negatively impact our operating results.
We provide service to a number of governmental entities and municipalities, some of which have sufferedsignificant financial difficulties due to the downturn in the U.S. economy and reduced tax revenue. Some of theseentities could be unable to pay amounts owed to us or renew contracts with us at previous or increased rates. Manynon-governmental customers have also suffered serious financial difficulties, and the inability of our customers topay us in a timely manner or to pay increased rates could negatively affect our operating results.
In addition, the financial difficulties of municipalities could result in a decline in investors’ demand formunicipal bonds and a correlating increase in interest rates. As of December 31, 2010, we had $611 million of tax-exempt bonds that are subject to re-pricing on either a daily or a weekly basis through a remarketing process and$405 million of tax-exempt bonds with term interest rate periods that are subject to re-pricing within the next twelvemonths. If the weakness in the municipal debt market results in re-pricing of our tax-exempt bonds at significantlyhigher interest rates, we will incur increased interest expenses that may negatively affect our operating results andcash flows.
17

We have substantial financial assurance and insurance requirements, and increases in the costs of obtainingadequate financial assurance, or the inadequacy of our insurance coverages, could negatively impact ourliquidity and increase our liabilities.
The amount of insurance we are required to maintain for environmental liability is governed by statutoryrequirements. We believe that the cost for such insurance is high relative to the coverage it would provide and,therefore, our coverages are generally maintained at the minimum statutorily-required levels. We face the risk ofincurring additional costs for environmental damage if our insurance coverage is ultimately inadequate to coverthose damages. We also carry a broad range of other insurance coverages that are customary for a company our size.We use these programs to mitigate risk of loss, thereby enabling us to manage our self-insurance exposureassociated with claims. The inability of our insurers to meet their commitments in a timely manner and the effect ofsignificant claims or litigation against insurance companies may subject us to additional risks. To the extent ourinsurers were unable to meet their obligations, or our own obligations for claims were more than we estimated, therecould be a material adverse effect to our financial results.
In addition, to fulfill our financial assurance obligations with respect to variable-rate tax-exempt debt, capping,closure, post-closure and environmental remediation obligations, we generally obtain letters of credit or suretybonds, rely on insurance, including captive insurance, fund trust and escrow accounts or rely upon WM financialguarantees. We currently have in place all financial assurance instruments necessary for our operations. Generaleconomic factors may adversely affect the cost of our current financial assurance instruments and changes inregulations may impose stricter requirements on the types of financial assurance that will be accepted. Additionally,in the event we are unable to obtain sufficient surety bonding, letters of credit or third-party insurance coverage atreasonable cost, or one or more states cease to view captive insurance as adequate coverage, we would need to relyon other forms of financial assurance. It is possible that we could be forced to deposit cash to collateralize ourobligations. Other forms of financial assurance could be more expensive to obtain, and any requirements to use cashto support our obligations would negatively impact our liquidity and capital resources and could affect our ability tomeet our obligations as they become due.
We may record material charges against our earnings due to any number of events that could causeimpairments to our assets.
In accordance with generally accepted accounting principles, we capitalize certain expenditures and advancesrelating to disposal site development, expansion projects, acquisitions, software development costs and otherprojects. Events that could, in some circumstances, lead to an impairment include, but are not limited to, shuttingdown a facility or operation or abandoning a development project or the denial of an expansion permit. If wedetermine a development or expansion project is impaired, we will charge against earnings any unamortizedcapitalized expenditures and advances relating to such facility or project reduced by any portion of the capitalizedcosts that we estimate will be recoverable, through sale or otherwise. We also carry a significant amount of goodwillon our Consolidated Balance Sheet, which is required to be assessed for impairment annually, and more frequentlyin the case of certain triggering events. We may be required to incur charges against earnings if we determine thatevents such as those described cause impairments. Any such charges could have a material adverse effect on ourresults of operations.
Our revenues will fluctuate based on changes in commodity prices.
Our recycling operations process for sale certain recyclable materials, including fibers, aluminum and glass,all of which are subject to significant market price fluctuations. The majority of the recyclables that we process forsale are paper fibers, including old corrugated cardboard, known as OCC, and old newsprint, or ONP. Thefluctuations in the market prices or demand for these commodities can affect our operating income and cash flowsnegatively, as we experienced in 2008, or positively, as we experienced in 2010. In the fourth quarter of 2008, themonthly market prices for OCC and ONP fell by 79% and 72%, respectively, from their high points within the year.Additionally, the decline in market prices for commodities resulted in a year-over-year decrease in revenue of$447 million in 2009. Increases in the prices of recycling commodities in 2010 resulted in an increase in revenues of$423 million as compared with 2009. Market prices for recyclable commodities have increased significantly fromthe near-historic lows experienced in late 2008 and early 2009. For the twelve months of 2010, overall commodity
18

prices have increased approximately 57% as compared with 2009. Despite the recent positive trend in commodityprices, these prices may fluctuate substantially and without notice in the future. Additionally, our recyclingoperations offer rebates to suppliers. Therefore, even if we experience higher revenues based on increased marketprices for commodities, the rebates we pay will also increase. In other circumstances, the rebates may be subject to afloor, such that as market prices decrease, any expected profit margins on materials subject to the rebate floor areeliminated.
There are also significant price fluctuations in the price of methane gas, electricity and other energy-relatedproducts that are marketed and sold by our landfill gas recovery, waste-to-energy and independent powerproduction plant operations that can significantly impact our revenue from yield provided by such businesses.In most of the markets in which we operate, electricity prices correlate with natural gas prices. For the year endedDecember 31, 2009, we experienced declines in revenue from yield at our waste-to-energy facilities of $76 million,due to the expiration of certain above-market contracts, resulting in greater exposure to market pricing. During theyears ended December 31, 2010, 2009 and 2008, approximately 47%, 46% and 24%, respectively, of the electricityrevenue at our waste-to-energy facilities was subject to current market rates. Our waste-to-energy facilities’exposure to market price volatility will continue to increase as additional long-term contracts expire. We enter into“receive fixed, pay variable” electricity swaps to mitigate the variability in our revenues and cash flows caused byfluctuations in the market prices for electricity. These swaps are generally short-term in nature. Additionally,revenues from our independent power production plants can be affected by price fluctuations. If we are unable tosuccessfully negotiate long-term contracts, or if market prices are at lower levels for sustained periods, our revenuescould be adversely affected.
The development and acceptance of alternatives to landfill disposal and waste-to-energy facilities couldreduce our ability to operate at full capacity and cause our revenues and operating results to decline.
Our customers are increasingly diverting waste to alternatives to landfill and waste-to-energy disposal, such asrecycling and composting, while also working to reduce the amount of waste they generate. In addition, several stateand local governments mandate recycling and waste reduction at the source and prohibit the disposal of certaintypes of waste, such as yard and food waste, at landfills or waste-to-energy facilities. Where such organic waste isnot banned from the landfill or waste-to-energy facility, large customers such as grocery stores and restaurants arechoosing to divert their organic waste from landfills. Zero-waste goals (sending no waste to the landfill) have beenset by many of North America’s largest companies. Although such mandates and initiatives help to protect ourenvironment, these developments reduce the volume of waste going to landfills and waste-to-energy facilities incertain areas, which may affect our ability to operate our landfills and waste-to-energy facilities at full capacity, aswell as affecting the prices that we can charge for landfill disposal and waste-to-energy services. Our landfills andour waste-to-energy facilities currently provide and have historically provided our highest operating margins. If weare not successful in expanding our service offerings and growing lines of businesses to service waste streams thatdo not go to landfills or waste-to-energy facilities and to provide services for customers that wish to reduce wasteentirely, then our revenues and operating results will decline. Additionally, despite the development of new serviceofferings and lines of business, it is reasonably possible that our revenues and our operating margins could benegatively affected due to disposal alternatives.
Our operating expenses could increase as a result of labor unions organizing or changes in regulationsrelated to labor unions.
Labor unions continually attempt to organize our employees, and these efforts will likely continue in thefuture. Certain groups of our employees are currently represented by unions, and we have negotiated collectivebargaining agreements with these unions. Additional groups of employees may seek union representation in thefuture, and, if successful, the negotiation of collective bargaining agreements could divert management attentionand result in increased operating expenses and lower net income. If we are unable to negotiate acceptable collectivebargaining agreements, our operating expenses could increase significantly as a result of work stoppages, includingstrikes. Any of these matters could adversely affect our financial condition, results of operations and cash flows.
19

We could face significant liabilities for withdrawal from multiemployer pension plans.
We have participated in and contributed to various “multiemployer” pension plans administered by employerand union trustees. In renegotiation of collective bargaining agreements with labor unions that participate in theseplans, we may decide to discontinue participation in various plans. When we withdraw from plans, we can incurwithdrawal liabilities for those plans that have underfunded pension liabilities. Various factors affect our liabilitiesfor a plan’s underfunded status, including the numbers of retirees and active workers in the plan, the ongoingsolvency of participating employers, the investment returns obtained on plan assets, and the ratio of our historicalparticipation in such plan to all employers’ historical participation. We reflect any withdrawal liability as anoperating expense in our statement of operations and as a liability on our balance sheet.
We have previously withdrawn several employee bargaining units from underfunded multiemployer pensionplans, and we recognized related expenses of $26 million in 2010, $9 million in 2009 and $39 million in 2008. Weare still negotiating and litigating final resolutions of our withdrawal liability for these previous withdrawals, whichcould be materially higher than the charges we have recognized.
Currently pending or future litigation or governmental proceedings could result in material adverseconsequences, including judgments or settlements.
We are involved in civil litigation in the ordinary course of our business and from time-to-time are involved ingovernmental proceedings relating to the conduct of our business. The timing of the final resolutions to these typesof matters is often uncertain. Additionally, the possible outcomes or resolutions to these matters could includeadverse judgments or settlements, either of which could require substantial payments, adversely affecting ourliquidity.
We are increasingly dependent on technology in our operations and if our technology fails, our businesscould be adversely affected.
We may experience problems with either the operation of our current information technology systems or thedevelopment and deployment of new information technology systems that could adversely affect, or eventemporarily disrupt, all or a portion of our operations until resolved. Inabilities and delays in implementingnew systems can also affect our ability to realize projected or expected cost savings. Additionally, any systemsfailures could impede our ability to timely collect and report financial results in accordance with applicable lawsand regulations.
If we are not able to develop and protect intellectual property, or if a competitor develops or obtainsexclusive rights to a breakthrough technology, our financial results may suffer.
Our existing and proposed service offerings to customers may require that we develop or license, and protect,new technologies. We may experience difficulties or delays in the research, development, production and/ormarketing of new products and services which may negatively impact our operating results and prevent us fromrecouping or realizing a return on the investments required to bring new products and services to market. Further,protecting our intellectual property rights and combating unlicensed copying and use of intellectual property isdifficult, and any inability to obtain or protect new technologies could impact our services to customers anddevelopment of new revenue sources. Additionally, a competitor may develop or obtain exclusive rights to a“breakthrough technology” that provides a revolutionary change in traditional waste management. If we haveinferior intellectual property to our competitors, our financial results may suffer.
We may experience adverse impacts on our reported results of operations as a result of adopting newaccounting standards or interpretations.
Our implementation of and compliance with changes in accounting rules, including new accounting rules andinterpretations, could adversely affect our reported financial position or operating results or cause unanticipatedfluctuations in our reported operating results in future periods.
20

Our capital requirements could increase our expenses or cause us to change our growth and developmentplans.
Recent economic conditions have reduced our cash flows from operations and could do so in the future. Ifimpacts on our cash flows from operations are significant, we may reduce or suspend capital expenditures, growthactivity, dividend declarations or share repurchases. We may choose to incur indebtedness to pay for these activities,and there can be no assurances that we would be able to incur indebtedness on terms we deem acceptable. We alsomay need to incur indebtedness to refinance scheduled debt maturities, and it is possible that the cost of financingcould increase significantly, thereby increasing our expenses and decreasing our net income. Further, our ability toexecute our financial strategy and our ability to incur indebtedness depends on our ability to maintain investmentgrade ratings on our senior debt. The credit rating process is contingent upon a number of factors, many of which arebeyond our control. If we were unable to maintain our investment grade credit ratings in the future, our interestexpense would increase and our ability to obtain financing on favorable terms could be adversely affected.
Additionally, we have $1.8 billion of debt as of December 31, 2010 that is exposed to changes in marketinterest rates within the next twelve months because of the combined impact of our tax-exempt bonds, our interestrate swap agreements and borrowings outstanding under our Canadian Credit Facility. Therefore, increases ininterest rates can increase our interest expenses which also would lower our net income and decrease our cash flow.
We may use our three-year, $2.0 billion revolving credit facility to meet our cash needs, to the extent available.As of December 31, 2010, we had $1,138 million of letters of credit issued and supported by the facility, leaving anunused and available credit capacity of $862 million. In the event of a default under our credit facility, we could berequired to immediately repay all outstanding borrowings and make cash deposits as collateral for all obligationsthe facility supports, which we may not be able to do. Additionally, any such default could cause a default undermany of our other credit agreements and debt instruments. Without waivers from lenders party to those agreements,any such default would have a material adverse effect on our ability to continue to operate.
Item 1B. Unresolved Staff Comments.
None.
Item 2. Properties.
Our principal executive offices are in Houston, Texas, where we lease approximately 435,000 square feetunder leases expiring at various times through 2020. Our Group offices are in Pennsylvania, Illinois, Georgia,Arizona and New Hampshire. We also have field-based administrative offices in Arizona, Illinois and Texas. Weown or lease real property in most locations where we have operations. We have operations in each of the fifty statesother than Montana. We also have operations in the District of Columbia, Puerto Rico and throughout Canada.
Our principal property and equipment consists of land (primarily landfills and other disposal facilities, transferstations and bases for collection operations), buildings, vehicles and equipment. We believe that our vehicles,equipment, and operating properties are adequately maintained and sufficient for our current operations. However,we expect to continue to make investments in additional equipment and property for expansion, for replacement ofassets, and in connection with future acquisitions. For more information, see Management’s Discussion andAnalysis of Financial Condition and Results of Operations included within this report.
21

The following table summarizes our various operations at December 31 for the periods noted:
2010 2009
Landfills:
Owned . . . . . . . . . . . . . . . . . . . . . . . . . . . . . . . . . . . . . . . . . . . . . . . . . . . . . . . . . . 210 211
Operated through lease agreements . . . . . . . . . . . . . . . . . . . . . . . . . . . . . . . . . . . . . 26 26
Operated through contractual agreements . . . . . . . . . . . . . . . . . . . . . . . . . . . . . . . . . 35 36
271 273
Transfer stations . . . . . . . . . . . . . . . . . . . . . . . . . . . . . . . . . . . . . . . . . . . . . . . . . . . . . 294 310
Material recovery facilities . . . . . . . . . . . . . . . . . . . . . . . . . . . . . . . . . . . . . . . . . . . . . 98 90
Secondary processing facilities . . . . . . . . . . . . . . . . . . . . . . . . . . . . . . . . . . . . . . . . . . 9 8
Waste-to-energy facilities . . . . . . . . . . . . . . . . . . . . . . . . . . . . . . . . . . . . . . . . . . . . . . 17 16
Independent power production plants . . . . . . . . . . . . . . . . . . . . . . . . . . . . . . . . . . . . . . 5 5
The following table provides certain information by Group regarding the 236 landfills owned or operatedthrough lease agreements and a count, by Group, of contracted disposal sites as of December 31, 2010:
LandfillsTotal
Acreage(a)PermittedAcreage(b)
ExpansionAcreage(c)
ContractedDisposal
Sites
Eastern . . . . . . . . . . . . . . . . . . . . . . . . 40 30,362 6,663 319 7
Midwest. . . . . . . . . . . . . . . . . . . . . . . . 73 32,351 9,397 1,051 9
Southern . . . . . . . . . . . . . . . . . . . . . . . 78 38,705 12,861 211 12
Western . . . . . . . . . . . . . . . . . . . . . . . . 41 38,452 8,783 1,041 7
Wheelabrator . . . . . . . . . . . . . . . . . . . . 4 781 340 — —
236 140,651 38,044 2,622 35
(a) “Total acreage” includes permitted acreage, expansion acreage, other acreage available for future disposal thathas not been permitted, buffer land and other land owned or leased by our landfill operations.
(b) “Permitted acreage” consists of all acreage at the landfill encompassed by an active permit to dispose of waste.
(c) “Expansion acreage” consists of unpermitted acreage where the related expansion efforts meet our criteria tobe included as expansion airspace. A discussion of the related criteria is included within the Management’sDiscussion and Analysis of Financial Condition and Results of Operations — Critical Accounting Estimatesand Assumptions section included herein.
Item 3. Legal Proceedings.
Information regarding our legal proceedings can be found under the Litigation section of Note 11 in theConsolidated Financial Statements included in this report.
Item 4. Reserved.
Former Item 4., Submission of Matters to a Vote of Security Holders, has been removed and reserved incompliance with Form 10-K.
22

PART II
Item 5. Market for Registrant’s Common Equity, Related Stockholder Matters and Issuer Purchases ofEquity Securities.
Our common stock is traded on the New York Stock Exchange (“NYSE”) under the symbol “WM.” The followingtable sets forth the range of the high and low per-share sales prices for our common stock as reported on the NYSE:
High Low
2009First Quarter . . . . . . . . . . . . . . . . . . . . . . . . . . . . . . . . . . . . . . . . . . . . . . . . . . $33.99 $22.10Second Quarter . . . . . . . . . . . . . . . . . . . . . . . . . . . . . . . . . . . . . . . . . . . . . . . . 29.00 25.06Third Quarter . . . . . . . . . . . . . . . . . . . . . . . . . . . . . . . . . . . . . . . . . . . . . . . . . 30.80 26.31Fourth Quarter . . . . . . . . . . . . . . . . . . . . . . . . . . . . . . . . . . . . . . . . . . . . . . . . 34.18 28.28
2010First Quarter . . . . . . . . . . . . . . . . . . . . . . . . . . . . . . . . . . . . . . . . . . . . . . . . . . $35.00 $31.29Second Quarter . . . . . . . . . . . . . . . . . . . . . . . . . . . . . . . . . . . . . . . . . . . . . . . . 35.98 31.18Third Quarter . . . . . . . . . . . . . . . . . . . . . . . . . . . . . . . . . . . . . . . . . . . . . . . . . 36.24 31.22Fourth Quarter . . . . . . . . . . . . . . . . . . . . . . . . . . . . . . . . . . . . . . . . . . . . . . . . 37.25 34.09
2011First Quarter (through February 10, 2011) . . . . . . . . . . . . . . . . . . . . . . . . . . . . $38.58 $35.94
On February 10, 2011, the closing sale price as reported on the NYSE was $38.14 per share. The number ofholders of record of our common stock at February 10, 2011 was 13,922.
The graph below shows the relative investment performance of Waste Management, Inc. common stock, theDow Jones Waste & Disposal Services Index and the S&P 500 Index for the last five years, assuming reinvestmentof dividends at date of payment into the common stock. The graph is presented pursuant to SEC rules and is notmeant to be an indication of our future performance.
Comparison of Cumulative Five Year Total Return
$0
$50
$100
$150
$200
2005 2006 2007 2008 20102009
Waste Management, Inc.
S&P 500 Index
Dow Jones Waste & Disposal Services
12/31/05 12/31/06 12/31/07 12/31/08 12/31/09 12/31/10
Waste Management, Inc. $100 $124 $113 $119 $126 $143S&P 500 Index $100 $116 $122 $ 77 $ 97 $112Dow Jones Waste & Disposal Services Index $100 $123 $129 $121 $137 $163
23

Under capital allocation programs approved by our Board of Directors, we paid quarterly cash dividends of$0.27 per share for a total of $531 million in 2008; $0.29 per share for a total of $569 million in 2009; and $0.315 pershare for a total of $604 million in 2010.
The Board of Directors approved a capital allocation program for 2010 that provided for expenditures of up to$1.3 billion, comprised of approximately $615 million in cash dividends and up to $685 million in common stockrepurchases. In 2010, we paid $604 million in cash dividends and we repurchased $501 million of our commonstock. All of the cash dividends paid and common stock repurchases in 2010 were made pursuant to this capitalallocation program.
The following table summarizes common stock repurchases made during the fourth quarter of 2010:
Issuer Purchases of Equity Securities
Period
TotalNumber of
SharesPurchased
AveragePrice Paid
per Share(a)
Total Number ofShares Purchased as
Part of PubliclyAnnounced Plans or
Programs
Approximate MaximumDollar Value of Shares that
May Yet be Purchased Underthe Plans or Programs(b)
October 1 — 31 . . . . . . . 493,401 $36.49 493,401 $232 millionNovember 1 — 30 . . . . . 593,360 $35.39 593,360 $211 millionDecember 1 — 31 . . . . . 453,300 $35.25 453,300 $195 million
Total . . . . . . . . . . . . . 1,540,061 $35.70 1,540,061 $ —
(a) This amount represents the weighted average price paid per share and includes a per-share commission paid forall repurchases.
(b) For each period presented, the maximum dollar value of shares that may yet be purchased under the programhas been provided net of the $604 million of dividends declared and paid in 2010. The total amount availablefor repurchases under the program is shown as zero because our capital allocation program, by its own terms,provided for up to $1.3 billion in dividends and share repurchases in 2010, with any unused portion of thecapital allocated under the program unavailable after the end of 2010.
In December 2010, we announced that our Board of Directors expects that future quarterly dividend paymentswill be increased to $0.34 per share in 2011, which is an 8% increase from the quarterly dividend we paid in 2010.All quarterly dividends will be declared at the discretion of our Board of Directors. Additionally, the Board ofDirectors approved up to $575 million in share repurchases for 2011.
24

Item 6. Selected Financial Data.
The information below was derived from the audited Consolidated Financial Statements included in this reportand in previous annual reports we filed with the SEC. This information should be read together with thoseConsolidated Financial Statements and the notes thereto. The adoption of new accounting pronouncements,changes in certain accounting policies and certain reclassifications impact the comparability of the financialinformation presented below. These historical results are not necessarily indicative of the results to be expected inthe future.
2010(a) 2009(a) 2008(a) 2007 2006Years Ended December 31,
(In millions, except per share amounts)
Statement of Operations Data:Operating revenues . . . . . . . . . . . . . . . . . . . . . . . . . . $12,515 $11,791 $13,388 $13,310 $13,363
Costs and expenses:
Operating . . . . . . . . . . . . . . . . . . . . . . . . . . . . . . . 7,824 7,241 8,466 8,402 8,587
Selling, general and administrative . . . . . . . . . . . . . 1,461 1,364 1,477 1,432 1,388
Depreciation and amortization . . . . . . . . . . . . . . . . 1,194 1,166 1,238 1,259 1,334
Restructuring . . . . . . . . . . . . . . . . . . . . . . . . . . . . . (2) 50 2 10 —
(Income) expense from divestitures, assetimpairments and unusual items . . . . . . . . . . . . . . (78) 83 (29) (47) 25
10,399 9,904 11,154 11,056 11,334
Income from operations . . . . . . . . . . . . . . . . . . . . . . . 2,116 1,887 2,234 2,254 2,029
Other expense, net . . . . . . . . . . . . . . . . . . . . . . . . . . . (485) (414) (437) (505) (511)
Income before income taxes. . . . . . . . . . . . . . . . . . . . 1,631 1,473 1,797 1,749 1,518
Provision for income taxes . . . . . . . . . . . . . . . . . . . . . 629 413 669 540 325
Consolidated net income . . . . . . . . . . . . . . . . . . . . . . 1,002 1,060 1,128 1,209 1,193
Less: Net income attributable to noncontrollinginterests . . . . . . . . . . . . . . . . . . . . . . . . . . . . . . . . . 49 66 41 46 44
Net income attributable to Waste Management, Inc. . . $ 953 $ 994 $ 1,087 $ 1,163 $ 1,149
Basic earnings per common share . . . . . . . . . . . . . . . $ 1.98 $ 2.02 $ 2.21 $ 2.25 $ 2.13
Diluted earnings per common share . . . . . . . . . . . . . . $ 1.98 $ 2.01 $ 2.19 $ 2.23 $ 2.10
Cash dividends declared per common share . . . . . . . . $ 1.26 $ 1.16 $ 1.08 $ 0.96 $ 0.66
Cash dividends paid (includes $0.22 declared in 2005,paid in 2006) . . . . . . . . . . . . . . . . . . . . . . . . . . . . . $ 1.26 $ 1.16 $ 1.08 $ 0.96 $ 0.88
Balance Sheet Data (at end of period):Working capital (deficit) . . . . . . . . . . . . . . . . . . . . . . $ (3) $ 109 $ (701) $ (118) $ (86)Goodwill and other intangible assets, net . . . . . . . . . . 6,021 5,870 5,620 5,530 5,413
Total assets . . . . . . . . . . . . . . . . . . . . . . . . . . . . . . . . 21,476 21,154 20,227 20,175 20,600
Debt, including current portion. . . . . . . . . . . . . . . . . . 8,907 8,873 8,326 8,337 8,317
Total Waste Management, Inc. stockholders’ equity . . 6,260 6,285 5,902 5,792 6,222
Total equity . . . . . . . . . . . . . . . . . . . . . . . . . . . . . . . . 6,591 6,591 6,185 6,102 6,497
(a) For more information regarding these financial data, see the Management’s Discussion and Analysis ofFinancial Condition and Results of Operations section included in this report. For disclosures associated withthe impact of the adoption of new accounting pronouncements and changes in our accounting policies on thecomparability of this information, see Note 2 of the Consolidated Financial Statements.
25

Item 7. Management’s Discussion and Analysis of Financial Condition and Results of Operations.
This section includes a discussion of our results of operations for the three years ended December 31, 2010.This discussion may contain forward-looking statements that anticipate results based on management’s plans thatare subject to uncertainty. We discuss in more detail various factors that could cause actual results to differ fromexpectations in Item 1A, Risk Factors. The following discussion should be read in light of that disclosure andtogether with the Consolidated Financial Statements and the notes to the Consolidated Financial Statements.
Overview
Our 2010 results of operations reflect our discipline in pricing, our ability to control costs in our collection anddisposal operations and our continued investment in our strategic initiatives, which will enable us to grow into newmarkets, provide expanded service offerings and improve our information technology systems. Our results alsoreflect an improvement in the general economic environment. Highlights of our financial results for 2010 include:
• Revenues of $12.5 billion compared with $11.8 billion in 2009, an increase of $724 million, or 6.1%. Thisincrease in revenues is primarily attributable to:
• Increases from recyclable commodity prices of $423 million; increases from our fuel surcharge programof $69 million; and increases from foreign currency translation of $66 million;
• Increases associated with acquired businesses of $240 million; and
• Internal revenue growth from yield on our collection and disposal business of 2.3% in the current period,which increased revenue by $239 million;
• Internal revenue growth from volume was negative 2.6% in 2010, compared with negative 8.1% in 2009. Inaddition to the lower rate of decline driven by changes in the economy, our volume was favorably affected byrevenues associated with oil spill clean-up activities along the Gulf Coast. The year-over-year decline ininternal revenue growth due to volume was $304 million;
• Operating expenses of $7.8 billion, or 62.5% of revenues, compared with $7.2 billion, or 61.4% of revenues,in 2009. This increase of $583 million, or 8.1%, is due primarily to higher customer rebates because ofrecyclable commodity prices; higher fuel prices; increases in subcontractor costs associated with our oil spillclean-up services along the Gulf Coast; and increases in our landfill operating costs;
• Selling, general and administrative expenses increased by $97 million, or 7.1%, from $1.4 billion in 2009 to$1.5 billion in 2010. These cost increases were primarily due to support of our strategic growth plans andinitiatives;
• Income from operations of $2.1 billion, or 16.9% of revenues, in 2010 compared with $1.9 billion, or 16.0%of revenues, in 2009;
• Interest expense of $473 million compared with $426 million in 2009, an increase of $47 million, or 11.0%.This increase is primarily due to higher average debt balances, including additional borrowings incurred inlate 2009 primarily to support our strategic plans, and higher costs related to the execution and maintenanceof our revolving credit facility executed in June 2010; and
• Net income attributable to Waste Management, Inc. of $953 million, or $1.98 per diluted share for 2010, ascompared with $994 million, or $2.01 per diluted share in 2009.
The comparability of our 2010 results with 2009 has been affected by certain items management believes arenot representative or indicative of our performance. Our 2010 results were affected by the following:
• The recognition of pre-tax charges aggregating $55 million related to remediation and closure costs at fiveclosed sites, which had a negative impact of $0.07 on our diluted earnings per share;
• The recognition of net tax charges of $32 million due to refinements in estimates of our deferred stateincome taxes and the finalization of our 2009 tax returns, partially offset by favorable tax audit settlements,all of which, combined, had a negative impact of $0.07 on our diluted earnings per share;
26

• The recognition of a net favorable pre-tax benefit of $46 million for litigation and associated costs, whichhad a favorable impact of $0.06 on our diluted earnings per share; and
• The recognition of net pre-tax charges of $26 million as a result of the withdrawal of certain of our unionbargaining units from an underfunded multiemployer pension plan, which had a negative impact of $0.03 onour diluted earnings per share.
Our 2009 results were affected by the following:
• The recognition of a tax benefit of $130 million due principally to favorable adjustments from the carry-backof a capital loss, the recognition of state net operating losses and tax credits, the finalization of our 2008 taxreturns, the impact of tax audit settlements and the revaluation of deferred taxes due to Canadian tax ratereductions. These items had a combined favorable impact of $0.26 on our diluted earnings per share;
• The recognition of impairment charges totaling $83 million due primarily to the abandonment of revenuemanagement software and a change in expectations for the future operations of an inactive landfill inCalifornia. These items had a negative impact of $0.10 on our diluted earnings per share; and
• The recognition of pre-tax charges of $50 million related to our 2009 restructuring, primarily related toseverance and benefit costs. These restructuring charges reduced diluted earnings per share for the year by$0.06.
We are pleased about the lower rate of decline in internal revenue growth from volumes that we experiencedduring 2010. On the pricing front, our fourth quarter 2010 results were the strongest of the year. For both the fourthquarter and the full year of 2010, we outpaced our long-term pricing objective of achieving price increases in therange of 50 to 100 basis points above the consumer price index, or CPI. In 2011, we will remain committed to ourpricing discipline. Based on an anticipated CPI run-rate of 1.0%, we expect our overall revenue growth from yield tobe approximately 2.0%. Additionally, we expect our revenue growth from volumes to be flat to slightly positive.However, we are mindful of trends toward waste reduction at the source, diversion from landfills and customersseeking alternative methods of disposal. We will continue to implement measures that we believe will grow ourbusiness, improve our current operations performance and enhance and expand our services.
Free Cash Flow
As is our practice, we are presenting free cash flow, which is a non-GAAP measure of liquidity, in ourdisclosures because we use this measure in the evaluation and management of our business. We define free cashflow as net cash provided by operating activities, less capital expenditures, plus proceeds from divestitures ofbusinesses (net of cash divested) and other sales of assets. We believe it is indicative of our ability to pay ourquarterly dividends, repurchase common stock, fund acquisitions and other investments and, in the absence ofrefinancings, to repay our debt obligations. Free cash flow is not intended to replace “Net cash provided byoperating activities,” which is the most comparable U.S. GAAP measure. However, we believe free cash flow givesinvestors useful insight into how we view our liquidity. Nonetheless, the use of free cash flow as a liquidity measurehas material limitations because it excludes certain expenditures that are required or that we have committed to,such as declared dividend payments and debt service requirements.
Our calculation of free cash flow and reconciliation to “Net cash provided by operating activities” is shown inthe table below (in millions), and may not be the same as similarly titled measures presented by other companies:
2010 2009
Years EndedDecember 31,
Net cash provided by operating activities . . . . . . . . . . . . . . . . . . . . . . . . . . . . . $ 2,275 $ 2,362
Capital expenditures . . . . . . . . . . . . . . . . . . . . . . . . . . . . . . . . . . . . . . . . . . . . . (1,104) (1,179)
Proceeds from divestitures of businesses (net of cash divested) and other salesof assets . . . . . . . . . . . . . . . . . . . . . . . . . . . . . . . . . . . . . . . . . . . . . . . . . . . . 44 28
Free cash flow . . . . . . . . . . . . . . . . . . . . . . . . . . . . . . . . . . . . . . . . . . . . . . . . . $ 1,215 $ 1,211
27
Our free cash flow was consistent in both years, however our cash provided by operating activities decreased$87 million and our capital expenditures decreased $75 million. The decrease in cash provided by operatingactivities was primarily due to net unfavorable changes in working capital, increased interest payments and higherincome tax payments. These decreases in operating cash flow were partially offset by a cash benefit of $77 millionresulting from a litigation settlement that occurred in April 2010. Payments made in 2009 related to severance andbenefits costs associated with our 2009 restructuring also affected the comparability of our operating cash flow forthe periods presented.
The decrease in capital expenditures in 2010 compared with 2009 can generally be attributed to timing of cashpayments for the previous years’ fourth quarter capital expenditures. We generally use a significant portion of ourfree cash flow on capital expenditures in the fourth quarter of each year. A less significant portion of our fourthquarter 2009 capital expenditures were paid for in cash in 2010, as compared with the portion of our fourth quarter2008 capital expenditures that were paid for in cash in 2009.
Our ability to generate over $1.2 billion in free cash flow in 2010 enabled us to return $1.1 billion in cash tostockholders during the year through the payment of $604 million in dividends and the repurchase of $501 millionof our common stock.
Basis of Presentation of Consolidated Financial Information
Consolidation of Variable Interest Entities — In June 2009, the Financial Accounting Standards Board, orFASB, issued revised authoritative guidance associated with the consolidation of variable interest entities. The newguidance primarily uses a qualitative approach for determining whether an enterprise is the primary beneficiary of avariable interest entity, and is, therefore, required to consolidate the entity. This new guidance generally defines theprimary beneficiary as the entity that has (i) the power to direct the activities of the variable interest entity that canmost significantly impact the entity’s performance; and (ii) the obligation to absorb losses and the right to receivebenefits from the variable interest entity that could be significant from the perspective of the entity. The newguidance also requires that we continually reassess whether we are the primary beneficiary of a variable interestentity rather than conducting a reassessment only upon the occurrence of specific events.
As a result of our implementation of this guidance, effective January 1, 2010, we deconsolidated certaincapping, closure, post-closure and environmental remediation trusts because we share power over significantactivities of these trusts with others. Our financial interests in these entities are discussed in Note 20 of ourConsolidated Financial Statements. The deconsolidation of these trusts has not materially affected our financialposition, results of operations or cash flows during the periods presented.
Business Combinations — In December 2007, the FASB issued revisions to the authoritative guidanceassociated with business combinations. This guidance clarified and revised the principles for how an acquirerrecognizes and measures identifiable assets acquired, liabilities assumed, and any noncontrolling interest in theacquiree. This guidance also addressed the recognition and measurement of goodwill acquired in businesscombinations and expanded disclosure requirements related to business combinations. Effective January 1,2009, we adopted the FASB’s revised guidance associated with business combinations. The portions of thisguidance that relate to business combinations completed before January 1, 2009 did not have a material impact onour consolidated financial statements. Further, business combinations completed subsequent to January 1, 2009,which are discussed in Note 19 of our Consolidated Financial Statements, have not been material to our financialposition, results of operations or cash flows. However, to the extent that future business combinations are material,our adoption of the FASB’s revised authoritative guidance associated with business combinations may significantlyimpact our accounting and reporting for future acquisitions, principally as a result of (i) expanded requirements tovalue acquired assets, liabilities and contingencies at their fair values when such amounts can be determined and(ii) the requirement that acquisition-related transaction and restructuring costs be expensed as incurred rather thancapitalized as a part of the cost of the acquisition.
Noncontrolling Interests in Consolidated Financial Statements — In December 2007, the FASB issuedauthoritative guidance that established accounting and reporting standards for noncontrolling interests in subsid-iaries and for the de-consolidation of a subsidiary. The guidance also established that a noncontrolling interest in asubsidiary is an ownership interest in the consolidated entity that should be reported as equity in the consolidated
28

financial statements. We adopted this guidance on January 1, 2009. The presentation and disclosure requirements ofthis guidance, which must be applied retrospectively for all periods presented, resulted in reclassifications to ourprior period consolidated financial information and the remeasurement of our 2008 effective tax rate, which isdiscussed in Note 9 of our Consolidated Financial Statements.
Fair Value Measurements — In September 2006, the FASB issued authoritative guidance associated with fairvalue measurements. This guidance defined fair value, established a framework for measuring fair value, andexpanded disclosures about fair value measurements. In February 2008, the FASB delayed the effective date of theguidance for all non-financial assets and non-financial liabilities, except those that are measured at fair value on arecurring basis. Accordingly, we adopted this guidance for assets and liabilities recognized at fair value on arecurring basis effective January 1, 2008 and adopted the guidance for non-financial assets and liabilities measuredon a non-recurring basis effective January 1, 2009. The application of the fair value framework did not have amaterial impact on our consolidated financial position, results of operations or cash flows.
Refer to Note 2 of our Consolidated Financial Statements for additional information related to the impact ofthe implementation of new accounting pronouncements on our results of operations and financial position.
Critical Accounting Estimates and Assumptions
In preparing our financial statements, we make numerous estimates and assumptions that affect the accountingfor and recognition and disclosure of assets, liabilities, equity, revenues and expenses. We must make theseestimates and assumptions because certain information that we use is dependent on future events, cannot becalculated with a high degree of precision from data available or simply cannot be readily calculated based ongenerally accepted methods. In some cases, these estimates are particularly difficult to determine and we mustexercise significant judgment. In preparing our financial statements, the most difficult, subjective and complexestimates and the assumptions that present the greatest amount of uncertainty relate to our accounting for landfills,environmental remediation liabilities, asset impairments, deferred income taxes and reserves associated with ourinsured and self-insured claims. Each of these items is discussed in additional detail below. Actual results coulddiffer materially from the estimates and assumptions that we use in the preparation of our financial statements.
Landfills
Accounting for landfills requires that significant estimates and assumptions be made regarding (i) the cost toconstruct and develop each landfill asset; (ii) the estimated fair value of capping, closure and post-closure assetretirement obligations, which must consider both the expected cost and timing of these activities; (iii) thedetermination of each landfill’s remaining permitted and expansion airspace; and (iv) the airspace associatedwith each capping event.
Landfill Costs — We estimate the total cost to develop each of our landfill sites to its remaining permitted andexpansion capacity. This estimate includes such costs as landfill liner material and installation, excavation forairspace, landfill leachate collection systems, landfill gas collection systems, environmental monitoring equipmentfor groundwater and landfill gas, directly related engineering, capitalized interest, on-site road construction andother capital infrastructure costs. Additionally, landfill development includes all land purchases for landfillfootprint and required landfill buffer property. The projection of these landfill costs is dependent, in part, onfuture events. The remaining amortizable basis of each landfill includes costs to develop a site to its remainingpermitted and expansion capacity and includes amounts previously expended and capitalized, net of accumulatedairspace amortization, and projections of future purchase and development costs.
Capping Costs — We estimate the cost for each capping event based on the area to be finally capped and thecapping materials and activities required. The estimates also consider when these costs would actually be paid andfactor in inflation and discount rates. Our engineering personnel allocate landfill capping costs to specific cappingevents. The landfill capacity associated with each capping event is then quantified and the capping costs for eachevent are amortized over the related capacity associated with the event as waste is disposed of at the landfill. Wereview these costs annually, or more often if significant facts change. Changes in estimates, such as timing or cost ofconstruction, for capping events immediately impact the required liability and the corresponding asset. When thechange in estimate relates to a fully consumed asset, the adjustment to the asset must be amortized immediately
29

through expense. When the change in estimate relates to a capping event that has not been fully consumed, theadjustment to the asset is recognized in income prospectively as a component of landfill airspace amortization.
Closure and Post-Closure Costs — We base our estimates for closure and post-closure costs on our inter-pretations of permit and regulatory requirements for closure and post-closure maintenance and monitoring. Theestimates for landfill closure and post-closure costs also consider when the costs would actually be paid and factorin inflation and discount rates. The possibility of changing legal and regulatory requirements and the forward-looking nature of these types of costs make any estimation or assumption less certain. Changes in estimates forclosure and post-closure events immediately impact the required liability and the corresponding asset. When thechange in estimate relates to a fully consumed asset, the adjustment to the asset must be amortized immediatelythrough expense. When the change in estimate relates to a landfill asset that has not been fully consumed, theadjustment to the asset is recognized in income prospectively as a component of landfill airspace amortization.
Remaining Permitted Airspace — Our engineers, in consultation with third-party engineering consultants andsurveyors, are responsible for determining remaining permitted airspace at our landfills. The remaining permittedairspace is determined by an annual survey, which is then used to compare the existing landfill topography to theexpected final landfill topography.
Expansion Airspace — We include currently unpermitted expansion airspace in our estimate of remainingpermitted and expansion airspace in certain circumstances. First, to include airspace associated with an expansioneffort, we must generally expect the initial expansion permit application to be submitted within one year, and thefinal expansion permit to be received within five years. Second, we must believe the success of obtaining theexpansion permit is likely, considering the following criteria:
• Personnel are actively working on the expansion of an existing landfill, including efforts to obtain land useand local, state or provincial approvals;
• It is likely that the approvals will be received within the normal application and processing time periods forapprovals in the jurisdiction in which the landfill is located;
• We have a legal right to use or obtain land to be included in the expansion plan;
• There are no significant known technical, legal, community, business, or political restrictions or similarissues that could impair the success of such expansion;
• Financial analysis has been completed, and the results demonstrate that the expansion has a positivefinancial and operational impact; and
• Airspace and related costs, including additional closure and post-closure costs, have been estimated based onconceptual design.
For unpermitted airspace to be initially included in our estimate of remaining permitted and expansionairspace, the expansion effort must meet all of the criteria listed above. These criteria are evaluated by our field-based engineers, accountants, managers and others to identify potential obstacles to obtaining the permits. Once theunpermitted airspace is included, our policy provides that airspace may continue to be included in remainingpermitted and expansion airspace even if these criteria are no longer met, based on the facts and circumstances of aspecific landfill. In these circumstances, continued inclusion must be approved through a landfill-specific reviewprocess that includes approval of our Chief Financial Officer and a review by the Audit Committee of our Board ofDirectors on a quarterly basis. Of the 33 landfill sites with expansions at December 31, 2010, 14 landfills requiredthe Chief Financial Officer to approve the inclusion of the unpermitted airspace. Eight of these landfills requiredapproval by our Chief Financial Officer because of community or political opposition that could impede theexpansion process. The remaining six landfills required approval primarily due to the permit application processesnot meeting the one- or five-year requirements.
When we include the expansion airspace in our calculations of remaining permitted and expansion airspace,we also include the projected costs for development, as well as the projected asset retirement cost related to capping,and closure and post-closure of the expansion in the amortization basis of the landfill.
30

Once the remaining permitted and expansion airspace is determined in cubic yards, an airspace utilizationfactor, or AUF, is established to calculate the remaining permitted and expansion capacity in tons. The AUF isestablished using the measured density obtained from previous annual surveys and is then adjusted to account forsettlement. The amount of settlement that is forecasted will take into account several site-specific factors includingcurrent and projected mix of waste type, initial and projected waste density, estimated number of years of liferemaining, depth of underlying waste, anticipated access to moisture through precipitation or recirculation oflandfill leachate, and operating practices. In addition, the initial selection of the AUF is subject to a subsequentmulti- level review by our engineering group, and the AUF used is reviewed on a periodic basis and revised asnecessary. Our historical experience generally indicates that the impact of settlement at a landfill is greater later inthe life of the landfill when the waste placed at the landfill approaches its highest point under the permitrequirements.
After determining the costs and remaining permitted and expansion capacity at each of our landfills, wedetermine the per ton rates that will be expensed as waste is received and deposited at the landfill by dividing thecosts by the corresponding number of tons. We calculate per ton amortization rates for each landfill for assetsassociated with each capping event, for assets related to closure and post-closure activities and for all other costscapitalized or to be capitalized in the future. These rates per ton are updated annually, or more often, as significantfacts change.
It is possible that actual results, including the amount of costs incurred, the timing of capping, closure and post-closure activities, our airspace utilization or the success of our expansion efforts, could ultimately turn out to besignificantly different from our estimates and assumptions. To the extent that such estimates, or related assump-tions, prove to be significantly different than actual results, lower profitability may be experienced due to higheramortization rates, or higher expenses; or higher profitability may result if the opposite occurs. Most significantly, ifit is determined that the expansion capacity should no longer be considered in calculating the recoverability of thelandfill asset, we may be required to recognize an asset impairment or incur significantly higher amortizationexpense. If it is determined that the likelihood of receiving an expansion permit has become remote, the capitalizedcosts related to the expansion effort are expensed immediately.
Environmental Remediation Liabilities
We are subject to an array of laws and regulations relating to the protection of the environment. Under currentlaws and regulations, we may have liabilities for environmental damage caused by our operations, or for damagecaused by conditions that existed before we acquired a site. These liabilities include potentially responsible party(“PRP”) investigations, settlements, and certain legal and consultant fees, as well as costs directly associated withsite investigation and clean up, such as materials, external contractor costs and incremental internal costs directlyrelated to the remedy. We provide for expenses associated with environmental remediation obligations when suchamounts are probable and can be reasonably estimated. We routinely review and evaluate sites that requireremediation and determine our estimated cost for the likely remedy based on a number of estimates andassumptions.
Where it is probable that a liability has been incurred, we estimate costs required to remediate sites based onsite-specific facts and circumstances. We routinely review and evaluate sites that require remediation, consideringwhether we were an owner, operator, transporter, or generator at the site, the amount and type of waste hauled to thesite and the number of years we were associated with the site. Next, we review the same type of information withrespect to other named and unnamed PRPs. Estimates of the cost for the likely remedy are then either developedusing our internal resources or by third-party environmental engineers or other service providers. Internallydeveloped estimates are based on:
• Management’s judgment and experience in remediating our own and unrelated parties’ sites;
• Information available from regulatory agencies as to costs of remediation;
• The number, financial resources and relative degree of responsibility of other PRPs who may be liable forremediation of a specific site; and
• The typical allocation of costs among PRPs unless the actual allocation has been determined.
31

Asset Impairments
Our long-lived assets, including landfills and landfill expansions, are carried on our financial statements basedon their cost less accumulated depreciation or amortization. We monitor the carrying value of our long-lived assetsfor potential impairment whenever events or changes in circumstances indicate that their carrying amounts may notbe recoverable. These events or changes in circumstances are referred to as impairment indicators. If an impairmentindicator occurs, we perform a test of recoverability by comparing the carrying value of the asset or asset group to itsundiscounted expected future cash flows. If cash flows cannot be separately and independently identified for asingle asset, we will determine whether an impairment has occurred for the group of assets for which we can identifythe projected cash flows. If the carrying values are in excess of undiscounted expected future cash flows, wemeasure any impairment by comparing the fair value of the asset or asset group to its carrying value. Fair value isgenerally determined by considering (i) internally developed discounted projected cash flow analysis of the asset orasset group; (ii) actual third-party valuations; and/or (iii) information available regarding the current market forsimilar assets. If the fair value of an asset or asset group is determined to be less than the carrying amount of the assetor asset group, an impairment in the amount of the difference is recorded in the period that the impairment indicatoroccurs and is included in the “(Income) expense from divestitures, asset impairments and unusual items” line itemin our Consolidated Statement of Operations. Estimating future cash flows requires significant judgment andprojections may vary from the cash flows eventually realized, which could impact our ability to accurately assesswhether an asset has been impaired.
There are other considerations for impairments of landfills and goodwill, as described below.
Landfills — Certain impairment indicators require significant judgment and understanding of the wasteindustry when applied to landfill development or expansion projects. For example, a regulator may initially deny alandfill expansion permit application though the expansion permit is ultimately granted. In addition, managementmay periodically divert waste from one landfill to another to conserve remaining permitted landfill airspace.Therefore, certain events could occur in the ordinary course of business and not necessarily be considered indicatorsof impairment of our landfill assets due to the unique nature of the waste industry.
Goodwill — At least annually, we assess our goodwill for impairment. We assess whether an impairmentexists by comparing the fair value of each operating segment to its carrying value, including goodwill. We use acombination of two valuation methods, a market approach and an income approach, to estimate the fair value of ouroperating segments. Fair value computed by these two methods is arrived at using a number of factors, includingprojected future operating results, economic projections, anticipated future cash flows, comparable marketplacedata and the cost of capital. There are inherent uncertainties related to these factors and to our judgment in applyingthem to this analysis. However, we believe that these two methods provide a reasonable approach to estimating thefair value of our operating segments.
The market approach estimates fair value by measuring the aggregate market value of publicly-tradedcompanies with similar characteristics of our business as a multiple of their reported cash flows. We then apply thatmultiple to our operating segments’ cash flows to estimate their fair values. We believe that this approach isappropriate because it provides a fair value estimate using valuation inputs from entities with operations andeconomic characteristics comparable to our operating segments.
The income approach is based on the long-term projected future cash flows of our operating segments. Wediscount the estimated cash flows to present value using a weighted-average cost of capital that considers factorssuch as the timing of the cash flows and the risks inherent in those cash flows. We believe that this approach isappropriate because it provides a fair value estimate based upon our operating segments’ expected long-termperformance considering the economic and market conditions that generally affect our business.
Additional impairment assessments may be performed on an interim basis if we encounter events or changes incircumstances that would indicate that, more likely than not, the carrying value of goodwill has been impaired. SeeNote 6 to the Consolidated Financial Statements for additional information related to goodwill impairmentconsiderations made during the reported periods.
32
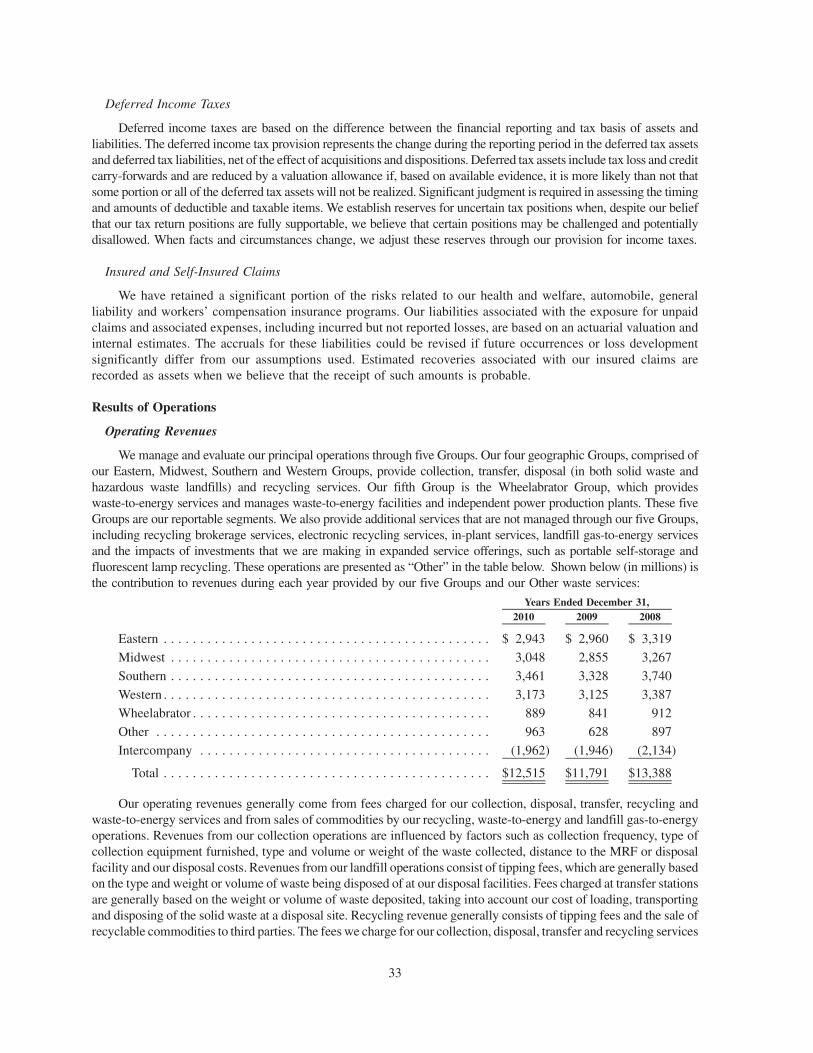
Deferred Income Taxes
Deferred income taxes are based on the difference between the financial reporting and tax basis of assets andliabilities. The deferred income tax provision represents the change during the reporting period in the deferred tax assetsand deferred tax liabilities, net of the effect of acquisitions and dispositions. Deferred tax assets include tax loss and creditcarry-forwards and are reduced by a valuation allowance if, based on available evidence, it is more likely than not thatsome portion or all of the deferred tax assets will not be realized. Significant judgment is required in assessing the timingand amounts of deductible and taxable items. We establish reserves for uncertain tax positions when, despite our beliefthat our tax return positions are fully supportable, we believe that certain positions may be challenged and potentiallydisallowed. When facts and circumstances change, we adjust these reserves through our provision for income taxes.
Insured and Self-Insured Claims
We have retained a significant portion of the risks related to our health and welfare, automobile, generalliability and workers’ compensation insurance programs. Our liabilities associated with the exposure for unpaidclaims and associated expenses, including incurred but not reported losses, are based on an actuarial valuation andinternal estimates. The accruals for these liabilities could be revised if future occurrences or loss developmentsignificantly differ from our assumptions used. Estimated recoveries associated with our insured claims arerecorded as assets when we believe that the receipt of such amounts is probable.
Results of Operations
Operating Revenues
We manage and evaluate our principal operations through five Groups. Our four geographic Groups, comprised ofour Eastern, Midwest, Southern and Western Groups, provide collection, transfer, disposal (in both solid waste andhazardous waste landfills) and recycling services. Our fifth Group is the Wheelabrator Group, which provideswaste-to-energy services and manages waste-to-energy facilities and independent power production plants. These fiveGroups are our reportable segments. We also provide additional services that are not managed through our five Groups,including recycling brokerage services, electronic recycling services, in-plant services, landfill gas-to-energy servicesand the impacts of investments that we are making in expanded service offerings, such as portable self-storage andfluorescent lamp recycling. These operations are presented as “Other” in the table below. Shown below (in millions) isthe contribution to revenues during each year provided by our five Groups and our Other waste services:
2010 2009 2008Years Ended December 31,
Eastern . . . . . . . . . . . . . . . . . . . . . . . . . . . . . . . . . . . . . . . . . . . . . $ 2,943 $ 2,960 $ 3,319
Midwest . . . . . . . . . . . . . . . . . . . . . . . . . . . . . . . . . . . . . . . . . . . . 3,048 2,855 3,267
Southern . . . . . . . . . . . . . . . . . . . . . . . . . . . . . . . . . . . . . . . . . . . . 3,461 3,328 3,740
Western . . . . . . . . . . . . . . . . . . . . . . . . . . . . . . . . . . . . . . . . . . . . . 3,173 3,125 3,387Wheelabrator . . . . . . . . . . . . . . . . . . . . . . . . . . . . . . . . . . . . . . . . . 889 841 912
Other . . . . . . . . . . . . . . . . . . . . . . . . . . . . . . . . . . . . . . . . . . . . . . 963 628 897
Intercompany . . . . . . . . . . . . . . . . . . . . . . . . . . . . . . . . . . . . . . . . (1,962) (1,946) (2,134)
Total . . . . . . . . . . . . . . . . . . . . . . . . . . . . . . . . . . . . . . . . . . . . . $12,515 $11,791 $13,388
Our operating revenues generally come from fees charged for our collection, disposal, transfer, recycling andwaste-to-energy services and from sales of commodities by our recycling, waste-to-energy and landfill gas-to-energyoperations. Revenues from our collection operations are influenced by factors such as collection frequency, type ofcollection equipment furnished, type and volume or weight of the waste collected, distance to the MRF or disposalfacility and our disposal costs. Revenues from our landfill operations consist of tipping fees, which are generally basedon the type and weight or volume of waste being disposed of at our disposal facilities. Fees charged at transfer stationsare generally based on the weight or volume of waste deposited, taking into account our cost of loading, transportingand disposing of the solid waste at a disposal site. Recycling revenue generally consists of tipping fees and the sale ofrecyclable commodities to third parties. The fees we charge for our collection, disposal, transfer and recycling services
33

generally include fuel surcharges, which are indexed to current market costs for fuel. Our waste-to-energy revenues,which are generated by our Wheelabrator Group, are based on the type and weight or volume of waste received at ourwaste-to-energy facilities and IPPs and amounts charged for the sale of energy and steam. Our “Other” revenuesinclude our landfill gas-to-energy operations, Port-O-Let» services, portable self-storage and fluorescent lamprecycling. Intercompany revenues between our operations have been eliminated in the consolidated financialstatements. The mix of operating revenues from our major lines of business is reflected in the table below (in millions):
2010 2009 2008Years Ended December 31,
Collection . . . . . . . . . . . . . . . . . . . . . . . . . . . . . . . . . . . . . . . . . . . $ 8,247 $ 7,980 $ 8,679
Landfill . . . . . . . . . . . . . . . . . . . . . . . . . . . . . . . . . . . . . . . . . . . . . 2,540 2,547 2,955
Transfer . . . . . . . . . . . . . . . . . . . . . . . . . . . . . . . . . . . . . . . . . . . . 1,318 1,383 1,589
Wheelabrator . . . . . . . . . . . . . . . . . . . . . . . . . . . . . . . . . . . . . . . . . 889 841 912Recycling . . . . . . . . . . . . . . . . . . . . . . . . . . . . . . . . . . . . . . . . . . . 1,169 741 1,180
Other . . . . . . . . . . . . . . . . . . . . . . . . . . . . . . . . . . . . . . . . . . . . . . 314 245 207
Intercompany . . . . . . . . . . . . . . . . . . . . . . . . . . . . . . . . . . . . . . . . (1,962) (1,946) (2,134)
Total . . . . . . . . . . . . . . . . . . . . . . . . . . . . . . . . . . . . . . . . . . . . . $12,515 $11,791 $13,388
The following table provides details associated with the period-to-period change in revenues (dollars inmillions) along with an explanation of the significant components of the current period changes:
Amount
As a % ofTotal
Company(a) Amount
As a % ofTotal
Company(a)
Period-to-PeriodChange
2010 vs. 2009
Period-to-PeriodChange
2009 vs. 2008
Average yield(b) . . . . . . . . . . . . . . . . . . . . . . . . . . . $ 724 6.1% $ (528) (3.9)%
Volume . . . . . . . . . . . . . . . . . . . . . . . . . . . . . . . . . . (304) (2.6) (1,078) (8.1)
Internal revenue growth . . . . . . . . . . . . . . . . . . . . . . 420 3.5 (1,606) (12.0)
Acquisitions . . . . . . . . . . . . . . . . . . . . . . . . . . . . . . 240 2.0 97 0.7
Divestitures . . . . . . . . . . . . . . . . . . . . . . . . . . . . . . . (2) — (37) (0.2)
Foreign currency translation. . . . . . . . . . . . . . . . . . . 66 0.6 (51) (0.4)
$ 724 6.1% $(1,597) (11.9)%
(a) Calculated by dividing the amount of current year increase or decrease by the prior year’s total companyrevenue ($11,791 million and $13,388 million for 2010 and 2009, respectively) adjusted to exclude the impactsof current year divestitures ($2 million and $37 million for 2010 and 2009, respectively).
(b) The amounts reported herein represent the changes in our revenue attributable to average yield for the totalCompany. We also analyze the changes in average yield in terms of related-business revenues in order todifferentiate the changes in yield attributable to our pricing strategies from the changes that are caused bymarket-driven price changes in commodities. The following table summarizes changes in revenues fromaverage yield on a related-business basis:
34

Amount
As a % ofRelated
Business(i) Amount
As a % ofRelated
Business(i)
Period-to-PeriodChange
2010 vs. 2009
Period-to-PeriodChange
2009 vs. 2008
Average yield:
Collection, landfill and transfer . . . . . . . . . . . . . $218 2.2% $ 321 3.0%
Waste-to-energy disposal(ii) . . . . . . . . . . . . . . . . 21 5.1 2 0.5
Collection and disposal(ii) . . . . . . . . . . . . . . . . . . . 239 2.3 323 2.9
Recycling commodities . . . . . . . . . . . . . . . . . . . . . 423 58.5 (447) (36.3)
Electricity(ii) . . . . . . . . . . . . . . . . . . . . . . . . . . . . . (7) (2.5) (76) (21.3)
Fuel surcharges and mandated fees . . . . . . . . . . . . 69 18.4 (328) (46.5)
Total . . . . . . . . . . . . . . . . . . . . . . . . . . . . . . . . . . . $724 6.1 $(528) (3.9)
(i) Calculated by dividing the increase or decrease for the current year by the prior-year’s related-businessrevenue, adjusted to exclude the impacts of divestitures for the current year ($2 million and $37 millionfor 2010 and 2009, respectively). The table below summarizes the related-business revenues for eachyear, adjusted to exclude the impacts of divestitures:
2010 2009Denominator
Related-business revenues:
Collection, landfill and transfer . . . . . . . . . . . . . . . . . . . . . . . . . . . . . . $ 9,999 $10,622
Waste-to-energy disposal . . . . . . . . . . . . . . . . . . . . . . . . . . . . . . . . . . . 413 434
Collection and disposal . . . . . . . . . . . . . . . . . . . . . . . . . . . . . . . . . . . . . . 10,412 11,056
Recycling commodities . . . . . . . . . . . . . . . . . . . . . . . . . . . . . . . . . . . . . . 723 1,233
Electricity . . . . . . . . . . . . . . . . . . . . . . . . . . . . . . . . . . . . . . . . . . . . . . . . 279 356
Fuel surcharges and mandated fees . . . . . . . . . . . . . . . . . . . . . . . . . . . . . . 375 706
Total Company . . . . . . . . . . . . . . . . . . . . . . . . . . . . . . . . . . . . . . . . . . . . $11,789 $13,351
(ii) Average revenue growth for yield for “Collection and disposal” excludes all electricity-related revenuesgenerated by our Wheelabrator Group, which are reported as “Electricity” revenues.
Our revenues increased $724 million, or 6.1%, and decreased $1,597 million, or 11.9% for the years endedDecember 31, 2010 and 2009, respectively. The year-over-year change in revenues for both periods has been drivenby (i) market factors, including fluctuations in recyclable commodity prices that favorably impacted revenuegrowth in 2010 and negatively affected revenue growth in 2009; volatility in diesel prices that affects the revenuesprovided by our fuel surcharge program, which favorably contributed to our revenues in 2010 and negativelyaffected our revenues in 2009, and foreign currency translation, which favorably affected revenues from ourCanadian operations in 2010 but negatively impacted our revenues in 2009; (ii) revenue growth from average yieldon our collection and disposal operations in both periods; and (iii) acquisitions. Further affecting revenue changeswere revenue declines due to lower volumes that generally resulted from the continued weakness of the overalleconomic environment, increased pricing, competition and recent trends of waste reduction and diversion byconsumers.
The following provides further details associated with our period-to-period change in revenues.
Average yield
Collection and disposal average yield — This measure reflects the effect on our revenue from the pricingactivities of our collection, transfer, landfill and waste-to-energy disposal operations, exclusive of volume changes.
35

Revenue growth from collection and disposal average yield includes not only base rate changes and environmentaland service fee increases, but also (i) certain average price changes related to the overall mix of services, which aredue to both the types of services provided and the geographic locations where our services are provided; (ii) changesin average price from new and lost business; and (iii) price decreases to retain customers.
In both 2010 and 2009, our revenue growth from collection and disposal average yield demonstrates ourcommitment to our pricing strategies despite the current economic environment. This increase in revenue from yieldwas primarily driven by our collection operations, which experienced yield growth in all lines of business and inevery geographic operating Group. We have found that increasing our yield in today’s market is a challenge giventhe reduced volume levels resulting from the economic slowdown. However, revenue growth from yield on basebusiness and a focus on controlling variable costs have provided margin improvements in our collection line ofbusiness. Additionally, a significant portion of our collection revenues is generated under long-term agreementswith municipalities or similar local or regional authorities. These agreements generally tie pricing adjustments toinflation indices, which have been low in 2010 as compared with 2009 and 2008. Despite this headwind, wecontinue to meet our pricing objective of achieving price increases in the range of 50 to 100 basis points above CPI.We are committed to maintaining pricing discipline in order to improve yield on our base business.
Revenues from our environmental fee, which are included in average yield on collection and disposal,increased by $33 million and $37 million for the years ended December 31, 2010 and 2009, respectively.Environmental fee revenues totaled $251 million in 2010 as compared with $218 million in 2009 and $181 millionin 2008.
Recycling commodities — Increases in the prices of the recycling commodities we process resulted in anincrease in revenues of $423 million in 2010 as compared with 2009. Market prices for recyclable commoditieshave increased significantly from the near-historic lows experienced in late 2008 and early 2009. For the twelvemonths of 2010, overall commodity prices have increased approximately 57% as compared with 2009.
In 2009, lower recycling commodity prices were the principal driver of our revenue decline of $447 million.During the fourth quarter of 2008, we saw a rapid decline in commodity prices from the record-high prices we hadbeen experiencing prior to the decline due to a significant decrease in the demand for commodities bothdomestically and internationally. Commodity demand and prices in the first nine months of 2009 remained wellbelow the demand and prices in the comparable prior-year period.
Electricity — The changes in revenue from yield provided by our waste-to-energy business are largely due tofluctuations in rates we can receive for electricity under our power purchase contracts and in merchant transactions.In most of the markets in which we operate, electricity prices correlate with natural gas prices. We experienceddeclines in revenue from yield at our waste-to-energy facilities of $7 million and $76 million for the years endedDecember 31, 2010 and 2009, respectively. These declines are due to the expiration of certain above-marketcontracts, resulting in greater exposure to market pricing. In 2010, approximately 47% of the waste-to-energygeneration portfolio was subject to market price movements, compared with 46% in 2009 and 24% in 2008. Ourwaste-to-energy facilities’ exposure to market price volatility will continue to increase as additional long-termcontracts expire; however, we are beginning to see an improvement in market pricing. In addition, we haveincreased our hedging activities to better manage this risk.
Fuel surcharges and mandated fees — Revenue predominantly generated by our fuel surcharge programincreased by $69 million and decreased by $328 million for the years ended December 31, 2010 and 2009,respectively. The fluctuation is directly attributed to the fluctuation in the national average prices of diesel fuel thatwe use for our fuel surcharge program. The mandated fees included in this line item are primarily related to the pass-through to customers of fees and taxes assessed by various state, county and municipal governmental agencies at ourlandfills and transfer stations. These mandated fees have not had a significant impact on the comparability ofrevenues for the periods included in the table above.
Volume — Our revenue decline due to volume was $304 million, or 2.6%, for the year ended December 31,2010. This is a notable improvement in the rate of revenue decline from the prior-year period when revenue declinedue to volume was $1,078 million, or 8.1%. Volume declines are generally attributable to economic conditions,increased pricing, competition and recent trends of waste reduction and diversion by consumers.
36

In 2010, our collection business accounted for $254 million of the total volume-related revenue decline. Wehave experienced commercial and residential collection volume declines that we attribute to the overall weakness inthe economy, as well as the effects of pricing, competition and diversion of waste by consumers. Our industrialcollection operations continued to be affected by the current economic environment due to the constructionslowdown across the United States. The overall volume decline in the collection line of business was offset in partby an increase in volumes of $99 million associated with oil spill clean-up activities along the Gulf Coast. Lowerthird-party volumes in our transfer station operations also caused revenue declines in the current-year period, andcan generally be attributed to economic conditions and the effects of pricing and competition. However, in 2010, ourlandfill revenues increased due to higher third-party volumes. This increase was principally due to higher specialwaste volumes in our Midwest and Southern geographic Groups, which were driven in part by our continued focuson our customers and better meeting their needs.
We are pleased with the lessening rate of revenue decline due to lower volumes. However, (i) the continuedweakness of the overall economic environment; (ii) recent trends of waste reduction and diversion by consumers;and (iii) pricing and competition are presenting challenges to maintaining and growing volumes.
In 2009, our collection business accounted for $622 million of the total volume decline. Our industrialcollection operations experienced the most significant revenue declines due to lower volumes, primarily as a resultof the continued slowdown in both residential and commercial construction activities across the United States. Wealso experienced volume declines in our commercial and residential collection lines of businesses in 2009. Weattributed these volume declines to the economy, although at a lesser rate than our industrial line of business sincethey are somewhat recession resistant, as well as to pricing and competition.
In 2009, we also experienced a 16% decline in third-party revenue due to volume at our landfills. This decreasewas most significant in our more economically sensitive special waste and construction and demolition wastestreams, although municipal solid waste streams at our landfills also decreased. Lower third-party volumes in ourtransfer station operations also caused revenue declines and can generally be attributed to economic conditions andthe effects of pricing and competition. Lower volumes in our recycling operations caused declines in revenues of$74 million in 2009. These decreases were attributable to the drastic decline in the domestic and internationaldemand for recyclables in late 2008.
Acquisitions and divestitures — Revenues increased $240 million and $97 million for the years endedDecember 31, 2010 and 2009, respectively, due to acquisitions, principally in (i) the collection and recyclinglines of business in both periods, as well as our waste-to-energy line of business in 2010 and (ii) our “Other”businesses, demonstrating our current focus on identifying strategic growth opportunities in new, complementarylines of business. Divestitures accounted for decreased revenues of $2 million and $37 million for the years endedDecember 31, 2010 and 2009, respectively.
Operating Expenses
Our operating expenses include (i) labor and related benefits (excluding labor costs associated with main-tenance and repairs discussed below), which include salaries and wages, bonuses, related payroll taxes, insuranceand benefits costs and the costs associated with contract labor; (ii) transfer and disposal costs, which include tippingfees paid to third-party disposal facilities and transfer stations; (iii) maintenance and repairs relating to equipment,vehicles and facilities and related labor costs; (iv) subcontractor costs, which include the costs of independenthaulers who transport waste collected by us to disposal facilities and are affected by variables such as volumes,distance and fuel prices; (v) costs of goods sold, which are primarily rebates paid to suppliers associated withrecycling commodities; (vi) fuel costs, which represent the costs of fuel and oil to operate our truck fleet and landfilloperating equipment; (vii) disposal and franchise fees and taxes, which include landfill taxes, municipal franchisefees, host community fees and royalties; (viii) landfill operating costs, which include interest accretion on landfillliabilities, interest accretion on and discount rate adjustments to environmental remediation liabilities and recoveryassets, leachate and methane collection and treatment, landfill remediation costs and other landfill site costs;(ix) risk management costs, which include workers’ compensation and insurance and claim costs; and (x) otheroperating costs, which include, among other costs, equipment and facility rent and property taxes.
37

Our operating expenses increased $583 million, or 8.1%, when comparing 2010 with 2009 and decreased by$1,225 million, or 14.5%, when comparing 2009 with 2008. Operating expenses as a percentage of revenues were62.5% in 2010, 61.4% in 2009 and 63.2% in 2008. The changes in our operating expenses during the years endedDecember 31, 2010 and 2009 can largely be attributed to the following:
Changes in market prices for recyclable commodities — Overall, market prices for recyclable com-modities were approximately 57% higher on average during 2010 than in 2009. The year-over-year increase isthe result of the recovery in recyclable commodity prices from the near-historic lows reached in late 2008 andearly 2009. This increase in market prices was the driver of the current year increase in cost of goods sold,primarily customer rebates, and has also resulted in increased revenues and earnings this year. Whencomparing 2009 with 2008, market prices for recyclable commodities had the opposite effect on our resultsas they declined approximately 39%.
Acquisitions and growth initiatives — In both 2010 and 2009, we experienced cost increases attributableto recently acquired businesses and our various growth and business development initiatives. These costincreases have affected each of the operating cost categories identified in the table below.
Fuel price changes — Higher market prices for fuel caused increases in both our direct fuel costs and oursubcontractor costs for the year ended December 31, 2010, while lower market prices caused decreases in thesecosts for the year ended December 31, 2009. On average, diesel fuel prices increased 21%, to $2.99 per gallonfor 2010 from $2.46 per gallon for 2009; while they decreased in 2009 by 35%, from $3.81 per gallon in 2008.
Canadian exchange rates — When comparing the average exchange rate for the years ended December 31,2010 and 2009, the Canadian exchange rate strengthened by 10%, which increased our expenses in all operatingcost categories. The strengthening of the Canadian dollar increased our total operating expenses by $52 millionfor 2010 as compared with 2009. When comparing 2009 with 2008, the Canadian exchange rate weakened by 7%and decreased our total operating expenses by $40 million.
Volume declines and divestitures — Throughout 2010 and 2009, we experienced volume declines as aresult of the continued weakness of the overall economic environment, pricing, competition and recent trendsof waste reduction and diversion by consumers. Note that the revenue decline due to lower volume moderatedin 2010 as compared with the volume decline in 2009, particularly in the second half of the year. During 2009we also experienced volume declines as a result of divestitures. We continue to manage our fixed costs andreduce our variable costs as we experience volume declines, and have achieved significant cost savings as aresult. These cost decreases have benefited each of the operating cost categories identified in the table below.
The following table summarizes the major components of our operating expenses, including the impact offoreign currency translation, for the years ended December 31 (dollars in millions):
2010Period-to-
Period Change 2009Period-to-
Period Change 2008
Labor and related benefits . . . . . . . . . . . . . $2,300 $ 40 1.8% $2,260 $ (160) (6.6)% $2,420
Transfer and disposal costs . . . . . . . . . . . . 943 6 0.6 937 (111) (10.6) 1,048
Maintenance and repairs . . . . . . . . . . . . . . 1,041 8 0.8 1,033 (41) (3.8) 1,074
Subcontractor costs . . . . . . . . . . . . . . . . . . 770 70 10.0 700 (201) (22.3) 901
Cost of goods sold. . . . . . . . . . . . . . . . . . . 776 288 59.0 488 (324) (39.9) 812
Fuel . . . . . . . . . . . . . . . . . . . . . . . . . . . . . 493 79 19.1 414 (301) (42.1) 715
Disposal and franchise fees and taxes . . . . . 589 11 1.9 578 (30) (4.9) 608
Landfill operating costs . . . . . . . . . . . . . . . 294 72 32.4 222 (69) (23.7) 291
Risk management . . . . . . . . . . . . . . . . . . . 202 (9) (4.3) 211 2 1.0 209
Other . . . . . . . . . . . . . . . . . . . . . . . . . . . . 416 18 4.5 398 10 2.6 388
$7,824 $583 8.1% $7,241 $(1,225) (14.5)% $8,466
38

The period-to-period changes for each category of operating expenses are discussed below.
Labor and related benefits — Our 2010 expenses increased as a result of (i) higher salaries and wages due tomerit increases that were effective in July 2009 for hourly employees and in April 2010 for both salaried and hourlyemployees; (ii) additional expenses incurred for acquisitions and growth opportunities; and (iii) the strengthening ofthe Canadian dollar. These cost increases were offset, in part, by cost savings that have been achieved as volumesdeclined.
When comparing 2009 with 2008, the cost declines were generally a result of (i) headcount and overtimereductions related to volume declines; (ii) effects of foreign currency translation; (iii) a benefit from therestructuring we initiated in January of 2009, although most of these savings were reflected in our selling, generaland administrative expenses; and (iv) cost savings provided by our operational improvement initiatives. These costsavings were offset, in part, by higher hourly wages due to merit increases and increased bonus expense as ourperformance against targets established by our incentive plans was stronger than it had been in 2008.
The comparability of our labor and related benefits costs for the periods presented has also been affected bycosts incurred primarily associated with the withdrawal of certain bargaining units from underfunded multi-employer pension plans. These costs increased 2010 expense by $26 million, 2009 expense by $9 million and 2008expense by $42 million.
Transfer and disposal costs — During 2009 the cost decreases as compared with 2008 were a result of volumedeclines and our continued focus on reducing disposal costs associated with our third-party disposal volumes byimproving internalization. This decrease was also partially due to foreign currency translation.
Maintenance and repairs — Comparing 2009 with 2008, these costs declined as a result of volume declinesand various fleet initiatives that favorably affected our maintenance, parts and supplies costs. These decreases wereoffset partially by cost increases due to differences in the timing and scope of planned maintenance projects at ourwaste-to-energy and landfill gas-to-energy facilities.
Subcontractor costs — The 2010 increase in subcontractor costs is largely the result of oil spill clean-upactivities along the Gulf Coast and is also attributable to higher diesel fuel prices. We incurred $54 million insubcontractor costs related to oil spill clean-up activities this year. When comparing 2009 with 2008, the costdecreases are a result of volume declines, a significant decrease in diesel fuel prices and the effects of foreigncurrency translation.
Cost of goods sold — The cost changes during the years presented are principally due to changes in therecycling commodity rebates we pay to our customers as a result of changes in market prices for recyclablecommodities.
Fuel — The cost changes for 2010 and 2009 are a result of changes in market prices for diesel fuel and volumedeclines.
Disposal and franchise fees and taxes — These cost decreases in 2009 as compared with 2008 are principally aresult of volume declines.
Landfill operating costs — Increases in these costs in the current year were due, in part, to the recognition ofadditional estimated expense associated with environmental remediation liabilities of $50 million at four closedsites during 2010.
The changes in this category for the years presented were also significantly impacted by the changes inU.S. Treasury rates used to estimate the present value of our environmental remediation obligations and recoveryassets. As a result of changes in U.S. Treasury rates, we recognized $2 million of unfavorable adjustments during2010, compared with $35 million of favorable adjustments during 2009 and $33 million of unfavorable adjustmentsduring 2008. Over the course of 2010, the discount rate we use decreased slightly from 3.75% to 3.50%, although itreached as low as 2.50% in September. During 2009, the rate increased from 2.25% to 3.75% and during 2008, therate declined from 4.00% to 2.25%.
39

Risk management — The slight year-over-year decrease in 2010 and the consistent cost levels in 2009 and2008 reflect the success we have had over the last several years in managing these costs, which can be creditedprimarily to our continued focus on safety and reduced accident and injury rates.
Other — The comparison of these costs has been significantly affected by the following:
• In 2010, the increase in costs compared with 2009 was attributable, in part, to (i) our various growth andbusiness development initiatives, (ii) oil spill clean-up activities along the Gulf Coast, and (iii) recentlyacquired businesses. These cost increases were partially offset by an increase in gains recognized from thesale of surplus real estate assets.
• In 2009, we had a significant increase in the property taxes assessed for one of our waste-to-energy facilities.
Selling, General and Administrative
Our selling, general and administrative expenses consist of (i) labor and related benefit costs, which includesalaries, bonuses, related insurance and benefits, contract labor, payroll taxes and equity-based compensation;(ii) professional fees, which include fees for consulting, legal, audit and tax services; (iii) provision for bad debts,which includes allowances for uncollectible customer accounts and collection fees; and (iv) other selling, generaland administrative expenses, which include, among other costs, facility-related expenses, voice and data tele-communication, advertising, travel and entertainment, rentals, postage and printing. In addition, the financialimpacts of litigation settlements generally are included in our “Other” selling, general and administrative expenses.
Our selling, general and administrative expenses increased by $97 million, or 7.1%, when comparing 2010with 2009 and decreased $113 million, or 7.7%, when comparing 2009 with 2008. The current year increase islargely due to (i) increased costs of $52 million during 2010, incurred to support our strategic plan to grow into newmarkets and provide expanded service offerings and (ii) increased costs of $23 million during 2010, resulting fromimprovements we are making to our information technology systems. When comparing 2009 with 2008, thedecrease was due in part to (i) the realization of benefits associated with our January 2009 restructuring and(ii) increased efforts to reduce controllable spending. Our selling, general and administrative expenses as apercentage of revenues were 11.7% in 2010, 11.6% in 2009 and 11.0% in 2008.
The following table summarizes the major components of our selling, general and administrative costs for theyears ended December 31 (dollars in millions):
2010Period-to-
Period Change 2009Period-to-
Period Change 2008
Labor and related benefits . . . . . . . . . . . . . . . $ 845 $70 9.0% $ 775 $ (78) (9.1)% $ 853
Professional fees . . . . . . . . . . . . . . . . . . . . . . 175 8 4.8 167 (1) (0.6) 168
Provision for bad debts . . . . . . . . . . . . . . . . . 45 (9) (16.7) 54 (3) (5.3) 57
Other . . . . . . . . . . . . . . . . . . . . . . . . . . . . . . 396 28 7.6 368 (31) (7.8) 399
$1,461 $97 7.1% $1,364 $(113) (7.7)% $1,477
Labor and related benefits — In 2010, our labor and related benefits costs increased due primarily to (i) highersalaries and hourly wages due to merit increases; (ii) higher compensation costs due to an increase in headcountdriven by our growth initiatives; (iii) additional bonus expense in 2010 because our performance against targetsestablished by our annual incentive plans was stronger in 2010 compared with 2009; (iv) increased contract laborcosts as a result of our current focus on optimizing our information technology systems; (v) increased severancecosts; and (vi) higher non-cash compensation costs incurred for equity awards granted under our long-termincentive plans. During the second quarter of 2009, we reversed all compensation costs previously recognized forour 2008 performance share units based on a determination that it was no longer probable that the targets establishedfor that award would be met. Additionally, stock option equity awards granted during the first quarter of 2010provide for continued vesting for three years following an employee’s retirement, and because retirement-eligibleemployees are not required to provide any future service to vest in these awards, we recognized all of thecompensation expense associated with their awards immediately. We did not incur similar charges in prior yearsbecause this retirement provision was not included in any of the equity awards that were granted in 2009 or in 2008.
40

In 2009, our labor and related benefits costs decreased from 2008 because we realized benefits associated withour January 2009 restructuring. Our labor and related benefits expenses in 2009 were also affected by a significantdecrease in non-cash compensation costs associated with the equity-based compensation provided for by our long-term incentive plans as a result of (i) a decline in the grant-date fair value of our equity awards; (ii) lowerperformance against established targets for certain awards than in the prior year; and (iii) the reversal of allcompensation costs previously recognized for our 2008 performance share units. This decrease in non-cashcompensation costs was offset, in part, by higher costs associated with our salary deferral plan, the costs of whichare directly affected by equity-market conditions. Additionally, contract labor costs incurred for various Corporatesupport functions were lower during 2009 than in 2008.
Professional fees — In 2010, our professional fees increased due to consulting fees, driven primarily byimprovements we are making to our information technology systems and our continued strategic focus to grow intonew markets and provide expanded service offerings. This increase was partially offset by a reduction in legal feesin 2010.
Provision for bad debts — Our provision for bad debts was higher in 2009 and in 2008 as compared with 2010as a result of the Company’s assessment of the weak economic environment in those years and the resulting impactson our collection risk. However, in the latter part of 2009 and during 2010 our collection risk moderated, thusresulting in a lower provision in 2010.
Other — During 2010, we experienced increases in our (i) litigation reserves, (ii) marketing and advertisingcosts, due in part to our strategic plan to grow into new markets and provide expanded service offerings, and(iii) computer costs, due in part to improvements we are making to our information technology systems.
In 2009, our focus on reducing controllable spending resulted in decreases in our advertising, meetings,seminars, and travel and entertainment costs. These lower costs were partially due to the January 2009 restructuring.This decline was offset partially by unfavorable litigation settlements in 2009.
Depreciation and Amortization
Depreciation and amortization includes (i) depreciation of property and equipment, including assets recordedfor capital leases, on a straight-line basis from three to 50 years; (ii) amortization of landfill costs, including thoseincurred and all estimated future costs for landfill development, construction and asset retirement costs arising fromclosure and post-closure, on a units-of-consumption method as landfill airspace is consumed over the totalestimated remaining capacity of a site, which includes both permitted capacity and expansion capacity that meetsour Company-specific criteria for amortization purposes; (iii) amortization of landfill asset retirement costs arisingfrom capping obligations on a units-of-consumption method as airspace is consumed over the estimated capacityassociated with each capping event; and (iv) amortization of intangible assets with a definite life, either using a150% declining balance approach or a straight-line basis over the definitive terms of the related agreements, whichare generally from two to ten years depending on the type of asset.
The following table summarizes the components of our depreciation and amortization costs for the years endedDecember 31 (dollars in millions):
2010
Period-to-PeriodChange 2009
Period-to-PeriodChange 2008
Depreciation of tangible property andequipment . . . . . . . . . . . . . . . . . . . . . . $ 781 $ 2 0.3% $ 779 $ (6) (0.8)% $ 785
Amortization of landfill airspace . . . . . . . 372 14 3.9 358 (71) (16.6) 429
Amortization of intangible assets . . . . . . . 41 12 41.4 29 5 20.8 24
$1,194 $28 2.4% $1,166 $(72) (5.8)% $1,238
The increase in amortization expense of landfill airspace in 2010 is largely due to adjustments to theamortization rates at various landfill sites. These adjustments were principally attributable to increases in costestimates. The decrease in amortization of landfill airspace expense in 2009 is largely due to volume declines as a
41

result of (i) the slowdown in the economy; (ii) our pricing strategy and competition, both of which significantlyreduced our collection volumes; and (iii) the re-direction of waste to third-party disposal facilities in certain regionsdue to either the closure of our own landfills or the current capacity constraints of landfills where we are seeking anexpansion permit. The comparability of our amortization of landfill airspace for the years ended December 31,2010, 2009, and 2008 has also been affected by adjustments recorded in each year for changes in estimates related toour capping, closure and post-closure obligations. During the years ended December 31, 2010, 2009 and 2008,landfill amortization expense was reduced by $13 million, $14 million and $3 million, respectively, for the effects ofthese changes in estimates. In each year, the majority of the reduced expense resulting from the revised estimateswas associated with capping changes that were generally the result of (i) concerted efforts to improve the operatingefficiencies of our landfills and volume declines, both of which have allowed us to delay spending for cappingactivities; (ii) effectively managing the cost of capping material and construction; or (iii) landfill expansions thatresulted in reduced or deferred capping costs.
The increase in amortization expense of intangible assets in 2010 is due to our focus on the growth anddevelopment of our business through acquisitions and other investments. The current year increases are primarilyrelated to the amortization of definite-lived operating permits acquired by our healthcare solutions operations,customer lists acquired by our Southern and Midwest Groups and gas rights acquired by our renewable energyoperations.
Restructuring
In January 2009, we took steps to further streamline our organization by (i) consolidating our Market Areas;(ii) integrating the management of our recycling operations with our other solid waste business; and (iii) realigningour Corporate organization with this new structure in order to provide support functions more efficiently.
Our principal operations are managed through our Groups. Each of our four geographic Groups had beenfurther divided into 45 Market Areas. As a result of our restructuring, the Market Areas were consolidated into25 Areas. We found that our larger Market Areas generally were able to achieve efficiencies through economies ofscale that were not present in our smaller Market Areas, and this reorganization has allowed us to lower costs and tocontinue to standardize processes and improve productivity. In addition, during the first quarter of 2009, respon-sibility for the oversight of day-to-day recycling operations at our material recovery facilities and secondaryprocessing facilities was transferred from our Waste Management Recycle America, or WMRA, organization to ourfour geographic Groups. By integrating the management of our recycling facilities’ operations with our other solidwaste business, we are able to more efficiently provide comprehensive environmental solutions to our customers. Inaddition, as a result of this realignment, we have significantly reduced the overhead costs associated with managingthis portion of our business and have increased the geographic Groups’ focus on maximizing the profitability andreturn on invested capital of our business on an integrated basis.
This restructuring eliminated over 1,500 employee positions throughout the Company. During 2009, werecognized $50 million of pre-tax charges associated with this restructuring, of which $41 million were related toemployee severance and benefit costs. The remaining charges were primarily related to lease obligations forproperty that will no longer be utilized.
In 2010, we recognized $2 million of income related to the reversal of pre-tax restructuring charges.
42

(Income) Expense from Divestitures, Asset Impairments and Unusual Items
The following table summarizes the major components of “(Income) expense from divestitures, assetimpairments and unusual items” for the year ended December 31 for the respective periods (in millions):
2010 2009 2008
Years EndedDecember 31,
Income from divestitures . . . . . . . . . . . . . . . . . . . . . . . . . . . . . . . . . . . . . . . . $ (1) $— $(33)
Asset impairments . . . . . . . . . . . . . . . . . . . . . . . . . . . . . . . . . . . . . . . . . . . . . — 83 4Other . . . . . . . . . . . . . . . . . . . . . . . . . . . . . . . . . . . . . . . . . . . . . . . . . . . . . . . (77) — —
$(78) $83 $(29)
Income from Divestitures — The net gain from divestitures during 2008 was a result of our focus on sellingunderperforming businesses and primarily related to the divestiture of underperforming collection operations in ourSouthern Group.
Asset Impairments — Through December 31, 2008, we capitalized $70 million of accumulated costs asso-ciated with the development of a new waste and recycling revenue management system. A significant portion ofthese costs was specifically associated with the purchase of a license for waste and recycling revenue managementsoftware and the efforts required to develop and configure that software for our use. After a failed pilotimplementation of the software in one of our smallest Market Areas, the development efforts associated withthe revenue management system were suspended in 2007. During 2009, we determined to enhance and improve ourexisting revenue management system and not pursue alternatives associated with the development and imple-mentation of the licensed software. Accordingly, in 2009, we recognized a non-cash charge of $51 million,$49 million of which was recognized during the first quarter of 2009 and $2 million of which was recognized duringthe fourth quarter of 2009, for the abandonment of the licensed software.
We recognized an additional $32 million of impairment charges during 2009, $27 million of which wasrecognized by our Western Group during the fourth quarter of 2009 to fully impair a landfill in California as a resultof a change in our expectations for the future operations of the landfill. The remaining impairment charges wereprimarily attributable to a charge required to write down certain of our investments in portable self-storageoperations to their fair value as a result of our acquisition of a controlling financial interest in those operations.
During 2008, we recognized a $4 million impairment charge, primarily as a result of a decision to close alandfill in our Southern Group.
Other — We filed a lawsuit in March 2008 related to the revenue management software implementation thatwas suspended in 2007 and abandoned in 2009. In April 2010, we settled the lawsuit and received a one-time cashpayment. The settlement resulted in an increase in income from operations for the year ended December 31, 2010 of$77 million.
43

Income From Operations by Reportable Segment
The following table summarizes income from operations by reportable segment for the years endedDecember 31 (dollars in millions):
2010
Period-to-PeriodChange 2009
Period-to-PeriodChange 2008
Reportable segments:
Eastern . . . . . . . . . . . . . . . . . . . . $ 516 $ 33 6.8% $ 483 $ (40) (7.6)% $ 523
Midwest . . . . . . . . . . . . . . . . . . . 533 83 18.4 450 (25) (5.3) 475
Southern . . . . . . . . . . . . . . . . . . . 844 76 9.9 768 (104) (11.9) 872Western . . . . . . . . . . . . . . . . . . . 569 48 9.2 521 (91) (14.9) 612
Wheelabrator . . . . . . . . . . . . . . . 214 (21) (8.9) 235 (88) (27.2) 323
Other . . . . . . . . . . . . . . . . . . . . . . . (135) 1 (0.7) (136) (76) * (60)
Corporate and other . . . . . . . . . . . . (425) 9 (2.1) (434) 77 (15.1) (511)
Total . . . . . . . . . . . . . . . . . . . . . . . $2,116 $229 12.1% $1,887 $(347) (15.5)% $2,234
* Percentage change does not provide a meaningful comparison.
Reportable Segments — The most significant items affecting the results of operations of our four geographicGroups during the three-year period ended December 31, 2010 are summarized below:
• revenue growth from yield on our base business;
• market prices for recyclable commodities reflected significant improvement year-over-year during 2010 anda sharp decline during 2009 as compared with 2008;
• the accretive benefits of recent acquisitions, in particular during 2010 and to a lesser extent during 2009;
• continued volume declines due to economic conditions, increased pricing, competition and recent trends ofwaste reduction and waste diversion by consumers;
• increasing direct and indirect costs for diesel fuel, which outpaced the related revenue growth from our fuelsurcharge program in both 2010 and 2009, although a portion of the 2010 shortfall was reduced during thefourth quarter due, in part, to changes we made in our fuel surcharge program; and
• higher salaries and wages due to annual merit increases that were effective in July 2009 for hourly employeesand in April 2010 for both salaried and hourly employees.
The comparability of each of our geographic Groups’ operating results for the periods was also affected by therestructuring charges recognized during the year ended December 31, 2009.
Other significant items affecting the comparability of our Groups’ results of operations for the years endedDecember 31, 2010, 2009 and 2008 are summarized below:
Eastern — During 2009, the Group recognized (i) an $18 million increase in revenues and income fromoperations associated with an oil and gas lease at one of our landfills; and (ii) a $9 million charge related tobargaining unit employees in New Jersey agreeing to our proposal to withdraw them from an underfundedmultiemployer pension fund.
During 2008, the Group’s operating income was negatively affected by a $14 million charge related to thewithdrawal of certain collective bargaining units from underfunded multiemployer pension plans.
Midwest — The income from operations of our Midwest Group for 2010 was significantly affected by therecognition of charges of $26 million as a result of employees of five bargaining units in Michigan and Ohioagreeing to our proposal to withdraw them from an underfunded multiemployer pension plan.
44

The Group’s 2008 operating results were negatively affected by $44 million of additional operatingexpenses primarily incurred as a result of a labor dispute in Milwaukee, Wisconsin. Included in the labordispute expenses were $32 million in charges related to the withdrawal of certain of the Group’s bargainingunits from underfunded multiemployer pension plans.
Additionally, when comparing the average exchange rate for 2010 with 2009, the Canadian exchange ratestrengthened by 10%, which increased the Group’s income from operations. When comparing the averageexchange rate for 2009 with 2008, the Canadian exchange rate weakened by 7%, which decreased the Group’sincome from operations. The effects of foreign currency translation were the most significant to this Groupbecause substantially all of our Canadian operations are managed by our Midwest Group.
Southern — Additional volumes from oil spill clean-up activities along the Gulf Coast and lower repairand maintenance costs favorably impacted the Group’s 2010 income from operations.
During 2008, the Group’s operating income was favorably affected by $29 million of divestiture gains,offset, in part, by a $3 million landfill impairment charge. Also favorably affecting the comparison of theGroup’s results in 2009 as compared with 2008 was the recognition of $9 million of favorable adjustmentsduring 2009 resulting from changes in estimates associated with our obligations for landfill capping, closureand post-closure. Similar favorable adjustments impacted the Group’s results during 2010.
Western — The Group’s 2010 income from operations includes $12 million of additional “Selling,general and administrative” expense recognized as a result of a litigation settlement.
The Group’s 2009 income from operations includes the recognition of an impairment charge of$27 million as a result of a change in expectations for the future operations of an inactive landfill in California.
Further affecting the comparison of 2010 results with 2009 was the recognition of $7 million of favorableadjustments to landfill amortization expense during 2010 associated with our obligations for landfill capping,closure and post-closure, and a net $5 million of expense recognized for adjustments related to theseobligations during 2009. The unfavorable adjustments during 2009 primarily related to a closed landfill inLos Angeles, California for which the Group recognized additional amortization expense. The additionalexpense in 2009 did not affect the comparison to 2008 because, during 2008, we recognized an unfavorableadjustment at the same landfill which was of a similar magnitude.
Wheelabrator — The decrease in the income from operations of our Wheelabrator Group for the yearended December 31, 2010 as compared to 2009 was driven by an increase in maintenance-related outages ascompared with the prior year, which resulted in decreased electricity generation and increased plant main-tenance costs. These increases are attributable to the acceleration of repair and maintenance expenses at ourfacility in Portsmouth, Virginia that we acquired in April 2010, and expenses at certain of our other facilities.The Group also experienced an increase in litigation settlement costs as compared with 2009. Theseunfavorable items were partially offset by the benefit of increased revenues from the sale of metals.
The comparability of the Group’s 2009 income from operations with 2008 was significantly affected by(i) a decline in market prices for electricity, which had a significant impact on the Group’s results in 2009 dueto the expiration of several long-term energy contracts and short-term pricing arrangements; (ii) an increase incosts for international and domestic business development activities; and (iii) an increase in “Operating”expenses of $11 million as a result of a significant increase in the property taxes assessed for one of ourwaste-to-energy facilities. Exposure to current electricity market prices increased from 24% of total electricityproduction in 2008 to 46% in 2009.
Significant items affecting the comparability of the remaining components of our results of operations for theyears ended December 31, 2010, 2009 and 2008 are summarized below:
Other — Our “Other” income from operations includes (i) the effects of those elements of our in-plantservices, landfill gas-to-energy operations, and third-party subcontract and administration revenues managedby our Upstream», Renewable Energy and Strategic Accounts organizations, respectively, that are notincluded with the operations of our reportable segments; (ii) our recycling and electronic recycling brokerageservices; and (iii) the impacts of investments that we are making in expanded service offerings such as portable
45

self-storage and fluorescent lamp recycling. In addition, our “Other” income from operations reflects theimpacts of non-operating entities that provide financial assurance and self-insurance support for the Groups orfinancing for our Canadian operations and also includes certain year-end adjustments recorded in consol-idation related to the reportable segments that were not included in the measure of segment profit or loss usedto assess their performance for the periods disclosed.
The slight improvement in operating results for our “Other” businesses during 2010 as compared with2009 is due to improvements in our recycling brokerage business as a result of higher recycling commodityprices this year, largely offset by the unfavorable effects of (i) additional costs in the current year to support theCompany’s strategic plan to grow into new markets and provide expanded service offerings and (ii) certainyear-end adjustments recorded in consolidation related to our reportable segments that were not included in themeasure of segment income from operations used to assess their performance for the periods disclosed. For2010, the adjustments were primarily related to $15 million of additional expense recognized for litigationreserves and associated costs in the Southern and Wheelabrator Groups.
The unfavorable change in 2009 operating results compared with 2008 is largely due to (i) the effect thatthe previously discussed lower recycling commodity prices had on our recycling brokerage activities; (ii) anincrease in costs incurred to support the identification and development of new lines of business that willcomplement our core business; (iii) the unfavorable impact lower energy prices during 2009 had on ourlandfill-gas-to-energy operations; and (iv) certain year-end adjustments recorded in consolidation related toour reportable segments that were not included in the measure of segment income from operations used toassess their performance for the periods disclosed.
Corporate and Other — Significant items affecting the comparability of expenses for the periodspresented include:
• a benefit of $128 million when comparing 2010 with 2009 associated with the revenue managementsoftware implementation that was suspended in 2007 and abandoned in 2009, comprised of (i) a current yearbenefit of $77 million resulting from a one-time cash payment from a litigation settlement that occurred inApril 2010 and (ii) $51 million in charges recognized during 2009 for the abandonment of the licensedsoftware;
• the recognition of net charges of $50 million during 2010 for estimates associated with environmentalremediation liabilities at four closed sites;
• the recognition of $34 million of favorable adjustments during 2009 by our closed sites management groupdue to increases in U.S. Treasury rates used to estimate the present value of our environmental remediationobligations and environmental remediation recovery assets, while in 2010 and 2008 the same grouprecognized charges to landfill operating costs of $2 million and $32 million, respectively, due to declinesin U.S. Treasury rates during those periods;
• the recognition of $9 million in restructuring charges during 2009;
• a significant increase in “Selling, general and administrative” expenses during 2010 as result of costincreases related to our equity compensation, consulting fees, bonus expense, annual salary and wageincreases and headcount increases to support the Company’s strategic initiatives; partially offset by afavorable litigation settlement during the third quarter of 2010; and
• a significant decline in “Selling, general and administrative” expenses in 2009 as compared with 2008resulting from workforce reductions associated with the January 2009 restructuring, increased efforts toreduce our controllable spending and lower equity compensation costs.
Renewable Energy Operations
We have extracted value from the waste streams we manage for years, and we are focusing on increasing ourability to do so, particularly in the field of clean and renewable energy. Most significantly, our current operationsproduce renewable energy through the waste-to-energy facilities that are managed by our Wheelabrator Group andour landfill gas-to-energy operations. We are actively seeking opportunities to enhance our existing renewable
46
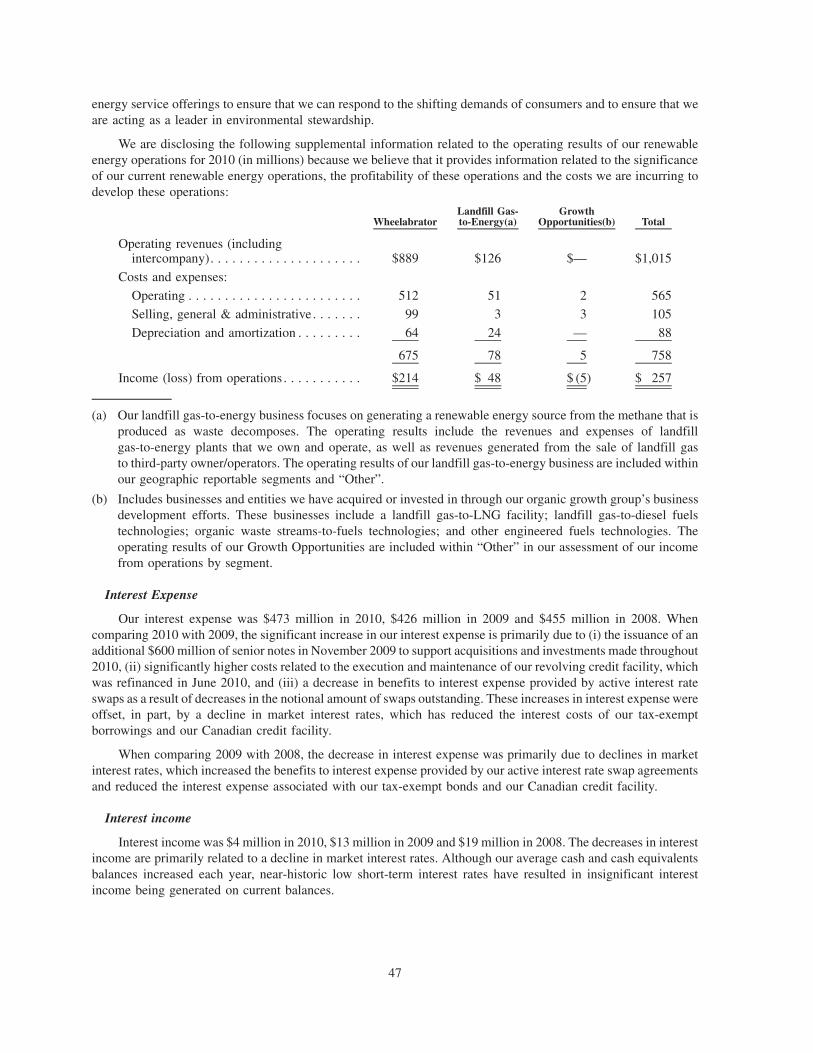
energy service offerings to ensure that we can respond to the shifting demands of consumers and to ensure that weare acting as a leader in environmental stewardship.
We are disclosing the following supplemental information related to the operating results of our renewableenergy operations for 2010 (in millions) because we believe that it provides information related to the significanceof our current renewable energy operations, the profitability of these operations and the costs we are incurring todevelop these operations:
WheelabratorLandfill Gas-to-Energy(a)
GrowthOpportunities(b) Total
Operating revenues (includingintercompany). . . . . . . . . . . . . . . . . . . . . $889 $126 $— $1,015
Costs and expenses:
Operating . . . . . . . . . . . . . . . . . . . . . . . . 512 51 2 565Selling, general & administrative . . . . . . . 99 3 3 105
Depreciation and amortization . . . . . . . . . 64 24 — 88
675 78 5 758
Income (loss) from operations . . . . . . . . . . . $214 $ 48 $ (5) $ 257
(a) Our landfill gas-to-energy business focuses on generating a renewable energy source from the methane that isproduced as waste decomposes. The operating results include the revenues and expenses of landfillgas-to-energy plants that we own and operate, as well as revenues generated from the sale of landfill gasto third-party owner/operators. The operating results of our landfill gas-to-energy business are included withinour geographic reportable segments and “Other”.
(b) Includes businesses and entities we have acquired or invested in through our organic growth group’s businessdevelopment efforts. These businesses include a landfill gas-to-LNG facility; landfill gas-to-diesel fuelstechnologies; organic waste streams-to-fuels technologies; and other engineered fuels technologies. Theoperating results of our Growth Opportunities are included within “Other” in our assessment of our incomefrom operations by segment.
Interest Expense
Our interest expense was $473 million in 2010, $426 million in 2009 and $455 million in 2008. Whencomparing 2010 with 2009, the significant increase in our interest expense is primarily due to (i) the issuance of anadditional $600 million of senior notes in November 2009 to support acquisitions and investments made throughout2010, (ii) significantly higher costs related to the execution and maintenance of our revolving credit facility, whichwas refinanced in June 2010, and (iii) a decrease in benefits to interest expense provided by active interest rateswaps as a result of decreases in the notional amount of swaps outstanding. These increases in interest expense wereoffset, in part, by a decline in market interest rates, which has reduced the interest costs of our tax-exemptborrowings and our Canadian credit facility.
When comparing 2009 with 2008, the decrease in interest expense was primarily due to declines in marketinterest rates, which increased the benefits to interest expense provided by our active interest rate swap agreementsand reduced the interest expense associated with our tax-exempt bonds and our Canadian credit facility.
Interest income
Interest income was $4 million in 2010, $13 million in 2009 and $19 million in 2008. The decreases in interestincome are primarily related to a decline in market interest rates. Although our average cash and cash equivalentsbalances increased each year, near-historic low short-term interest rates have resulted in insignificant interestincome being generated on current balances.
47

Equity in Net Losses of Unconsolidated Entities
During 2010, our “Equity in net losses of unconsolidated entities” was primarily related to our noncontrollinginterest in a limited liability company established to invest in and manage low-income housing properties. Theequity losses generated by the limited liability company were more than offset by tax benefits realized as a result ofthis investment as discussed below in Provision for Income Taxes. Refer to Note 9 to the Consolidated FinancialStatements for more information related to our federal low-income housing investment.
Provision for Income Taxes
We recorded provisions for income taxes of $629 million in 2010, $413 million in 2009 and $669 million in 2008.These tax provisions resulted in an effective income tax rate of approximately 38.5%, 28.1%, and 37.2% for 2010,2009 and 2008, respectively. The comparability of our reported income taxes for the years ended December 31, 2010,2009 and 2008 is primarily affected by (i) variations in our income before income taxes; (ii) the utilization of a capitalloss carry-back; (iii) the realization of state net operating loss and credit carry-forwards; (iv) changes in effective stateand Canadian statutory tax rates; (v) tax audit settlements; and (vi) the impact of federal low-income housing taxcredits. The impacts of these items are summarized below:
• Capital Loss Carry-back — During 2009, we generated a capital loss from the liquidation of a foreignsubsidiary. We determined that the capital loss could be utilized to offset capital gains from 2006 and 2007,which resulted in a reduction to our 2009 “Provision for income taxes” of $65 million.
• State Net Operating Loss and Credit Carry-forwards — During 2010, 2009 and 2008, we released state netoperating loss and credit carry-forwards resulting in a reduction to our “Provision for income taxes” for thoseperiods of $4 million, $35 million and $3 million, respectively.
• Canadian and State Tax Rate Changes — During 2009, the provincial tax rates in Ontario were reduced,which resulted in a $13 million tax benefit as a result of the revaluation of the related deferred tax balances.
During 2010, our current state tax rate increased from 6.25% to 6.75% resulting in an increase to our provisionfor income taxes of $5 million. In addition, our state deferred income taxes increased $37 million to reflect theimpact of changes in the estimated tax rate at which existing temporary differences will be realized. During 2009,our current state tax rate increased from 6.0% to 6.25% and our deferred state tax rate increased from 5.5% to5.75%, resulting in an increase to our income taxes of $3 million and $6 million, respectively. During 2008, ourcurrent state tax rate increased from 5.5% to 6.0%, resulting in an increase to our income taxes of $5 million. Theincreases in these rates are primarily due to changes in state law. The comparison of our effective state tax rateduring the reported periods has also been affected by return-to-accrual adjustments, which increased our“Provision for income taxes” in 2010 and reduced our “Provision for income taxes” in 2009 and 2008.
• Tax Audit Settlements — The settlement of various tax audits resulted in reductions in income tax expense of$8 million for the year ended December 31, 2010, $11 million for the year ended December 31, 2009 and$26 million for the year ended December 31, 2008.
• Federal Low-income Housing Tax Credits — Our federal low-income housing investment and the resultingcredits reduced our provision for income taxes by $26 million for the year ended December 31, 2010. Referto Note 9 to the Consolidated Financial Statements for more information related to our federal low-incomehousing investment.
We expect our 2011 recurring effective tax rate will be approximately 35.7% based on expected income levelsand additional Section 45 tax credits resulting from our investment in a refined coal facility. Specifically, in January2011, we acquired a noncontrolling interest in a limited liability company established to invest in and manage arefined coal facility. The facility’s refinement processes qualify for federal tax credits which we expect to realizethrough 2019 in accordance with Section 45 of the Internal Revenue Code.
The Small Business Jobs Act, signed into law in September 2010, contains a tax incentive package thatincludes a one-year extension through 2010 of the 50 percent bonus, or accelerated, depreciation provision firstenacted in 2008 and subsequently renewed in 2009. The provision had expired at the end of 2009. Under the bonusdepreciation provision, 50 percent of the basis of qualified capital expenditures may be deducted in the year the
48

property is placed in service and the remaining 50 percent deducted under normal depreciation rules. Theacceleration of deductions on 2010 capital expenditures resulting from the bonus depreciation provision had noimpact on our effective tax rate. However, the ability to accelerate depreciation deductions did decrease our 2010cash taxes by $60 million. Taking the accelerated tax depreciation will result in increased cash taxes in futureperiods when the accelerated deductions for these capital expenditures would have otherwise been taken.
In addition, new tax law signed on December 17, 2010 includes an extension of the bonus depreciationallowance through the end of 2011, and increases the amount of qualifying capital expenditures that can bedepreciated immediately from 50 percent to 100 percent. The 100 percent depreciation deduction applies toqualifying property placed in service between September 8, 2010 and December 31, 2011. The passage of theextension of bonus depreciation is estimated to decrease our 2011 cash taxes by approximately $190 million. Thecash tax benefit realized in 2011 will result in increased cash taxes in future periods when the deduction for thesecapital expenditures would have otherwise been realized.
Noncontrolling Interests
Net income attributable to noncontrolling interests was $49 million in 2010, $66 million in 2009 and$41 million in 2008. In each period, these amounts have been principally related to third parties’ equity interests intwo limited liability companies that own three waste-to-energy facilities operated by our Wheelabrator Group.However the comparison of these amounts for the reported periods has been affected by (i) our January 2010acquisition of a controlling financial interest in a portable self-storage business and (ii) the deconsolidation ofcertain capping, closure, post-closure and environmental remediation trusts as a result of our implementation ofauthoritative accounting guidance, effective January 1, 2010, associated with variable interest entities.
Landfill and Environmental Remediation Discussion and Analysis
We owned or operated 266 solid waste and five secure hazardous waste landfills at December 31, 2010 and weowned or operated 268 solid waste and five hazardous waste landfills at December 31, 2009. At December 31, 2010and 2009, the expected remaining capacity, in cubic yards and tonnage of waste that can be accepted at our owned oroperated landfills, is shown below (in millions):
RemainingPermittedCapacity
ExpansionCapacity
TotalCapacity
RemainingPermittedCapacity
ExpansionCapacity
TotalCapacity
December 31, 2010 December 31, 2009
Remaining cubic yards . . . . . 4,793 600 5,393 4,546 739 5,285
Remaining tonnage . . . . . . . . 4,391 603 4,994 4,075 726 4,801
Based on remaining permitted airspace as of December 31, 2010 and projected annual disposal volumes, theweighted average remaining landfill life for all of our owned or operated landfills is approximately 40 years. Manyof our landfills have the potential for expanded disposal capacity beyond what is currently permitted. We monitorthe availability of permitted disposal capacity at each of our landfills and evaluate whether to pursue an expansion ata given landfill based on estimated future waste volumes and prices, remaining capacity and likelihood of obtainingan expansion permit. We are seeking expansion permits at 33 of our landfills that meet the expansion criteriaoutlined in the Critical Accounting Estimates and Assumptions section above. Although no assurances can be madethat all future expansions will be permitted or permitted as designed, the weighted average remaining landfill life forall owned or operated landfills is approximately 45 years when considering remaining permitted airspace,expansion airspace and projected annual disposal volume.
49

The number of landfills we own or operate as of December 31, 2010, segregated by their estimated operatinglives (in years), based on remaining permitted and expansion airspace and projected annual disposal volume, was asfollows:
0 to 5 6 to 10 11 to 20 21 to 40 41+ Total
Owned . . . . . . . . . . . . . . . . . . . . . . . . . . . . . . . 12 7 34 70 87 210
Operated through lease(a) . . . . . . . . . . . . . . . . . 5 5 4 3 9 26Operating contracts(b) . . . . . . . . . . . . . . . . . . . . 10 5 11 4 5 35
Total landfills . . . . . . . . . . . . . . . . . . . . . . . . . . 27 17 49 77 101 271
(a) From an operating perspective, landfills we operate through lease agreements are similar to landfills we ownbecause we own the landfill’s operating permit and will operate the landfill for the entire lease term, which inmany cases is the life of the landfill. We are usually responsible for the capping, closure and post-closureobligations of the landfills we lease.
(b) For operating contracts, the property owner owns the permit and we operate the landfill for a contracted term,which may be the life of the landfill. However, we are generally responsible for capping, closure and post-closure obligations under the operating contracts.
The following table reflects landfill capacity and airspace changes, as measured in tons of waste, for landfillsowned or operated by us during the years ended December 31, 2010 and 2009 (in millions):
RemainingPermittedCapacity
ExpansionCapacity
TotalCapacity
RemainingPermittedCapacity
ExpansionCapacity
TotalCapacity
December 31, 2010 December 31, 2009
Balance, beginning of year . . 4,075 726 4,801 3,979 794 4,773
Acquisitions, divestitures,newly permitted landfillsand closures . . . . . . . . . . . 14 — 14 33 — 33
Changes in expansionspursued(a) . . . . . . . . . . . . . — 120 120 — 83 83
Expansion permitsgranted(b) . . . . . . . . . . . . . 238 (238) — 129 (129) —
Airspace consumed . . . . . . . . (91) — (91) (92) — (92)
Changes in engineeringestimates and other(c) . . . . 155 (5) 150 26 (22) 4
Balance, end of year . . . . . . . 4,391 603 4,994 4,075 726 4,801
(a) Amounts reflected here relate to the combined impacts of (i) new expansions pursued; (ii) increases ordecreases in the airspace being pursued for ongoing expansion efforts; (iii) adjustments for differencesbetween the airspace being pursued and airspace granted and (iv) decreases due to decisions to no longerpursue expansion permits.
(b) We received expansion permits at 13 of our landfills during 2010 and ten of our landfills during 2009,demonstrating our continued success in working with municipalities and regulatory agencies to expand thedisposal capacity of our existing landfills.
(c) Changes in engineering estimates can result in changes to the estimated available remaining capacity of alandfill or changes in the utilization of such landfill capacity, affecting the number of tons that can be placed inthe future. Estimates of the amount of waste that can be placed in the future are reviewed annually by ourengineers and are based on a number of factors, including standard engineering techniques and site-specificfactors such as current and projected mix of waste type; initial and projected waste density; estimated numberof years of life remaining; depth of underlying waste; anticipated access to moisture through precipitation orrecirculation of landfill leachate; and operating practices. We continually focus on improving the utilization of
50

airspace through efforts that include recirculating landfill leachate where allowed by permit; optimizing theplacement of daily cover materials; and increasing initial compaction through improved landfill equipment,operations and training.
The tons received at our landfills in 2010 and 2009 are shown below (tons in thousands):
# ofSites
TotalTons
Tonsper Day
# ofSites
TotalTons
Tonsper Day
2010 2009
Solid waste landfills . . . . . . . . . . . . . . . . . . . 266(a) 91,863 336 268 91,901 337
Hazardous waste landfills . . . . . . . . . . . . . . . 5 667 2 5 1,026 4
271 92,530 338 273 92,927 341
Solid waste landfills closed or divestedduring related year . . . . . . . . . . . . . . . . . . 3 295 4 328
92,825(b) 93,255(b)
(a) In 2010, we developed one landfill, closed two landfills and our contract expired at one landfill.
(b) These amounts include 1.7 million tons at December 31, 2010 and 1.5 million tons at December 31, 2009 thatwere received at our landfills but were used for beneficial purposes and generally were redirected from thepermitted airspace to other areas of the landfill. Waste types that are frequently identified for beneficial useinclude green waste for composting and clean dirt for on-site construction projects.
When a landfill we own or operate receives certification of closure from the applicable regulatory agency, wegenerally transfer the management of the site, including any remediation activities, to our closed sites managementgroup. As of December 31, 2010, our closed sites management group managed 202 closed landfills.
Landfill Assets — We capitalize various costs that we incur to prepare a landfill to accept waste. These costsgenerally include expenditures for land (including the landfill footprint and required landfill buffer property),permitting, excavation, liner material and installation, landfill leachate collection systems, landfill gas collectionsystems, environmental monitoring equipment for groundwater and landfill gas, directly related engineering,capitalized interest, and on-site road construction and other capital infrastructure costs. The cost basis of our landfillassets also includes estimates of future costs associated with landfill capping, closure and post-closure activities,which are discussed further below.
The following table reflects the total cost basis of our landfill assets and accumulated landfill airspaceamortization as of December 31, 2010 and 2009, and summarizes significant changes in these amounts during 2010(in millions):
Cost Basis ofLandfill Assets
AccumulatedLandfill Airspace
Amortization Landfill Assets
December 31, 2009 . . . . . . . . . . . . . . . . . . . . . . . . $12,301 $(6,448) $5,853
Capital additions . . . . . . . . . . . . . . . . . . . . . . . . . . 428 — 428
Asset retirement obligations incurred andcapitalized . . . . . . . . . . . . . . . . . . . . . . . . . . . . . 47 — 47
Acquisitions. . . . . . . . . . . . . . . . . . . . . . . . . . . . . . — — —
Amortization of landfill airspace . . . . . . . . . . . . . . — (372) (372)
Foreign currency translation . . . . . . . . . . . . . . . . . . 70 (19) 51
Asset retirements and other adjustments . . . . . . . . . (69) 47 (22)
December 31, 2010 . . . . . . . . . . . . . . . . . . . . . . . . $12,777 $(6,792) $5,985
As of December 31, 2010, we estimate that we will spend approximately $400 million in 2011, andapproximately $1 billion in 2012 and 2013 combined for the construction and development of our landfill assets.The specific timing of landfill capital spending is dependent on future events and spending estimates are subject to
51
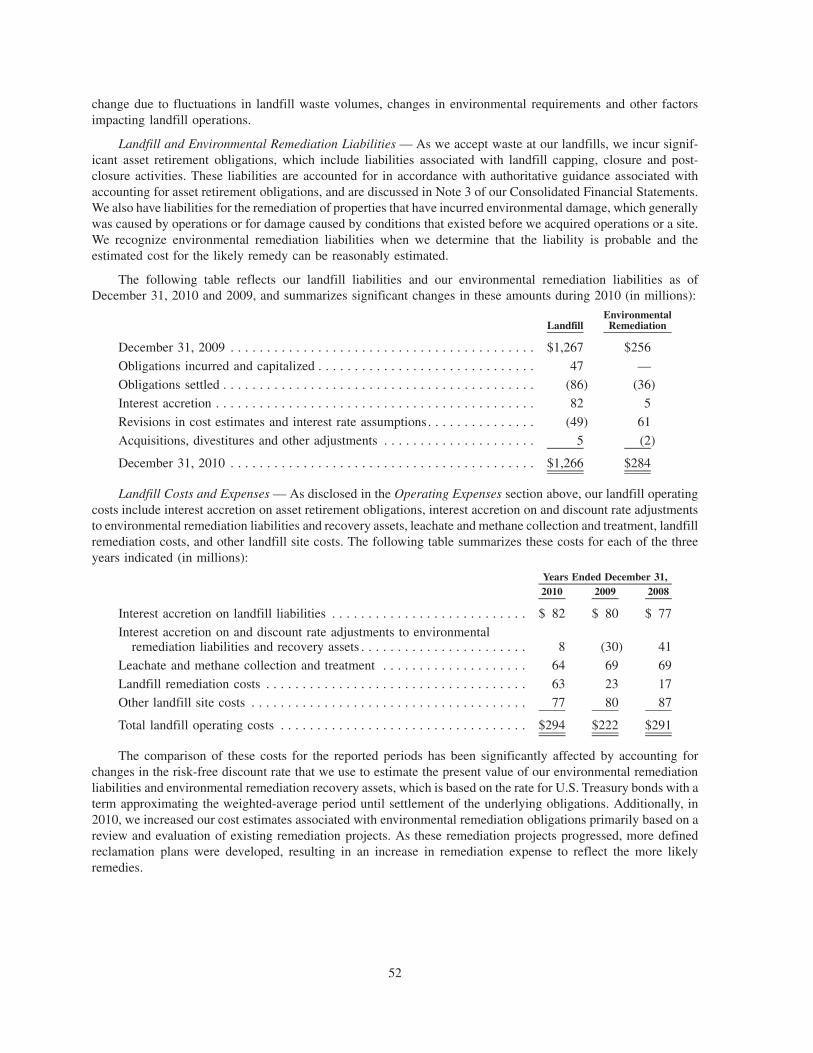
change due to fluctuations in landfill waste volumes, changes in environmental requirements and other factorsimpacting landfill operations.
Landfill and Environmental Remediation Liabilities — As we accept waste at our landfills, we incur signif-icant asset retirement obligations, which include liabilities associated with landfill capping, closure and post-closure activities. These liabilities are accounted for in accordance with authoritative guidance associated withaccounting for asset retirement obligations, and are discussed in Note 3 of our Consolidated Financial Statements.We also have liabilities for the remediation of properties that have incurred environmental damage, which generallywas caused by operations or for damage caused by conditions that existed before we acquired operations or a site.We recognize environmental remediation liabilities when we determine that the liability is probable and theestimated cost for the likely remedy can be reasonably estimated.
The following table reflects our landfill liabilities and our environmental remediation liabilities as ofDecember 31, 2010 and 2009, and summarizes significant changes in these amounts during 2010 (in millions):
LandfillEnvironmentalRemediation
December 31, 2009 . . . . . . . . . . . . . . . . . . . . . . . . . . . . . . . . . . . . . . . . . . $1,267 $256
Obligations incurred and capitalized . . . . . . . . . . . . . . . . . . . . . . . . . . . . . . 47 —
Obligations settled . . . . . . . . . . . . . . . . . . . . . . . . . . . . . . . . . . . . . . . . . . . (86) (36)
Interest accretion . . . . . . . . . . . . . . . . . . . . . . . . . . . . . . . . . . . . . . . . . . . . 82 5
Revisions in cost estimates and interest rate assumptions . . . . . . . . . . . . . . . (49) 61
Acquisitions, divestitures and other adjustments . . . . . . . . . . . . . . . . . . . . . 5 (2)
December 31, 2010 . . . . . . . . . . . . . . . . . . . . . . . . . . . . . . . . . . . . . . . . . . $1,266 $284
Landfill Costs and Expenses — As disclosed in the Operating Expenses section above, our landfill operatingcosts include interest accretion on asset retirement obligations, interest accretion on and discount rate adjustmentsto environmental remediation liabilities and recovery assets, leachate and methane collection and treatment, landfillremediation costs, and other landfill site costs. The following table summarizes these costs for each of the threeyears indicated (in millions):
2010 2009 2008Years Ended December 31,
Interest accretion on landfill liabilities . . . . . . . . . . . . . . . . . . . . . . . . . . . $ 82 $ 80 $ 77
Interest accretion on and discount rate adjustments to environmentalremediation liabilities and recovery assets . . . . . . . . . . . . . . . . . . . . . . . 8 (30) 41
Leachate and methane collection and treatment . . . . . . . . . . . . . . . . . . . . 64 69 69
Landfill remediation costs . . . . . . . . . . . . . . . . . . . . . . . . . . . . . . . . . . . . 63 23 17Other landfill site costs . . . . . . . . . . . . . . . . . . . . . . . . . . . . . . . . . . . . . . 77 80 87
Total landfill operating costs . . . . . . . . . . . . . . . . . . . . . . . . . . . . . . . . . . $294 $222 $291
The comparison of these costs for the reported periods has been significantly affected by accounting forchanges in the risk-free discount rate that we use to estimate the present value of our environmental remediationliabilities and environmental remediation recovery assets, which is based on the rate for U.S. Treasury bonds with aterm approximating the weighted-average period until settlement of the underlying obligations. Additionally, in2010, we increased our cost estimates associated with environmental remediation obligations primarily based on areview and evaluation of existing remediation projects. As these remediation projects progressed, more definedreclamation plans were developed, resulting in an increase in remediation expense to reflect the more likelyremedies.
52

Amortization of landfill airspace, which is included as a component of “Depreciation and amortization”expense, includes the following:
• the amortization of landfill capital costs, including (i) costs that have been incurred and capitalized and(ii) estimated future costs for landfill development and construction required to develop our landfills to theirremaining permitted and expansion airspace; and
• the amortization of asset retirement costs arising from landfill capping, closure and post-closure obligations,including (i) costs that have been incurred and capitalized and (ii) projected asset retirement costs.
Amortization expense is recorded on a units-of-consumption basis, applying cost as a rate per ton. The rate perton is calculated by dividing each component of the amortizable basis of a landfill by the number of tons needed tofill the corresponding asset’s airspace. Landfill capital costs and closure and post-closure asset retirement costs aregenerally incurred to support the operation of the landfill over its entire operating life, and are, therefore, amortizedon a per-ton basis using a landfill’s total airspace capacity. Capping asset retirement costs are attributed to a specificcapping event, and are, therefore, amortized on a per-ton basis using each discrete capping event’s estimatedairspace capacity. Accordingly, each landfill has multiple per-ton amortization rates.
The following table calculates our landfill airspace amortization expense on a per-ton basis:
2010 2009 2008Years Ended December 31,
Amortization of landfill airspace (in millions) . . . . . . . . . . . . . . . . . . . . . . $ 372 $ 358 $ 429
Tons received, net of redirected waste (in millions) . . . . . . . . . . . . . . . . . . 91 92 107
Average landfill airspace amortization expense per ton. . . . . . . . . . . . . . . . $4.08 $3.90 $4.01
Different per-ton amortization rates are applied at each of our 271 landfills, and per-ton amortization rates varysignificantly from one landfill to another due to (i) inconsistencies that often exist in construction costs andprovincial, state and local regulatory requirements for landfill development and landfill capping, closure and post-closure activities; and (ii) differences in the cost basis of landfills that we develop versus those that we acquire.Accordingly, our landfill airspace amortization expense measured on a per-ton basis can fluctuate due to changes inthe mix of volumes we receive across the Company year-over-year. The comparability of our total Companyaverage landfill airspace amortization expense per ton for the years ended December 31, 2010, 2009 and 2008 hasalso been affected by the recognition of reductions to amortization expense for changes in our estimates related toour capping, closure and post-closure obligations. Landfill amortization expense was reduced by $13 million in2010, $14 million in 2009 and $3 million in 2008, for the effects of these changes in estimates. In each year, themajority of the reduced expense resulted from revisions in the estimated timing or cost of capping events that weregenerally the result of (i) concerted efforts to improve the operating efficiencies of our landfills and volumedeclines, both of which have allowed us to delay spending for capping activities; (ii) effectively managing the costof capping material and construction; or (iii) landfill expansions that resulted in reduced or deferred capping costs.
Liquidity and Capital Resources
We continually monitor our actual and forecasted cash flows, our liquidity and our capital resources, enablingus to plan for our present needs and fund unbudgeted business activities that may arise during the year as a result ofchanging business conditions or new opportunities. In addition to our working capital needs for the general andadministrative costs of our ongoing operations, we have cash requirements for: (i) the construction and expansion ofour landfills; (ii) additions to and maintenance of our trucking fleet and landfill equipment; (iii) construction,refurbishments and improvements at waste-to-energy and materials recovery facilities; (iv) the container andequipment needs of our operations; (v) capping, closure and post-closure activities at our landfills; (vi) therepayment of debt and discharging of other obligations; and (vii) investments and acquisitions that we believe willbe accretive and provide continued growth in our business. We also are committed to providing our shareholderswith a return on their investment through our capital allocation program that provides for dividend payments andshare repurchases.
53
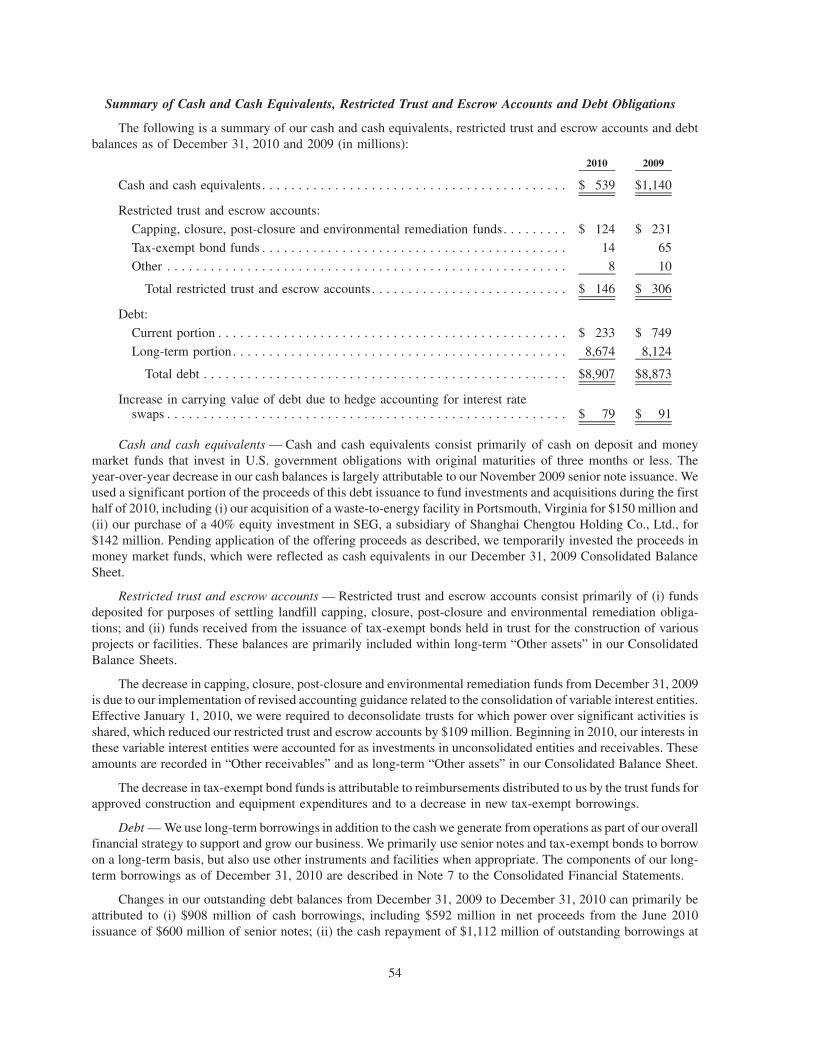
Summary of Cash and Cash Equivalents, Restricted Trust and Escrow Accounts and Debt Obligations
The following is a summary of our cash and cash equivalents, restricted trust and escrow accounts and debtbalances as of December 31, 2010 and 2009 (in millions):
2010 2009
Cash and cash equivalents. . . . . . . . . . . . . . . . . . . . . . . . . . . . . . . . . . . . . . . . . . $ 539 $1,140
Restricted trust and escrow accounts:
Capping, closure, post-closure and environmental remediation funds. . . . . . . . . $ 124 $ 231
Tax-exempt bond funds . . . . . . . . . . . . . . . . . . . . . . . . . . . . . . . . . . . . . . . . . . 14 65Other . . . . . . . . . . . . . . . . . . . . . . . . . . . . . . . . . . . . . . . . . . . . . . . . . . . . . . . 8 10
Total restricted trust and escrow accounts . . . . . . . . . . . . . . . . . . . . . . . . . . . $ 146 $ 306
Debt:
Current portion . . . . . . . . . . . . . . . . . . . . . . . . . . . . . . . . . . . . . . . . . . . . . . . . $ 233 $ 749
Long-term portion. . . . . . . . . . . . . . . . . . . . . . . . . . . . . . . . . . . . . . . . . . . . . . 8,674 8,124
Total debt . . . . . . . . . . . . . . . . . . . . . . . . . . . . . . . . . . . . . . . . . . . . . . . . . . $8,907 $8,873
Increase in carrying value of debt due to hedge accounting for interest rateswaps . . . . . . . . . . . . . . . . . . . . . . . . . . . . . . . . . . . . . . . . . . . . . . . . . . . . . . . $ 79 $ 91
Cash and cash equivalents — Cash and cash equivalents consist primarily of cash on deposit and moneymarket funds that invest in U.S. government obligations with original maturities of three months or less. Theyear-over-year decrease in our cash balances is largely attributable to our November 2009 senior note issuance. Weused a significant portion of the proceeds of this debt issuance to fund investments and acquisitions during the firsthalf of 2010, including (i) our acquisition of a waste-to-energy facility in Portsmouth, Virginia for $150 million and(ii) our purchase of a 40% equity investment in SEG, a subsidiary of Shanghai Chengtou Holding Co., Ltd., for$142 million. Pending application of the offering proceeds as described, we temporarily invested the proceeds inmoney market funds, which were reflected as cash equivalents in our December 31, 2009 Consolidated BalanceSheet.
Restricted trust and escrow accounts — Restricted trust and escrow accounts consist primarily of (i) fundsdeposited for purposes of settling landfill capping, closure, post-closure and environmental remediation obliga-tions; and (ii) funds received from the issuance of tax-exempt bonds held in trust for the construction of variousprojects or facilities. These balances are primarily included within long-term “Other assets” in our ConsolidatedBalance Sheets.
The decrease in capping, closure, post-closure and environmental remediation funds from December 31, 2009is due to our implementation of revised accounting guidance related to the consolidation of variable interest entities.Effective January 1, 2010, we were required to deconsolidate trusts for which power over significant activities isshared, which reduced our restricted trust and escrow accounts by $109 million. Beginning in 2010, our interests inthese variable interest entities were accounted for as investments in unconsolidated entities and receivables. Theseamounts are recorded in “Other receivables” and as long-term “Other assets” in our Consolidated Balance Sheet.
The decrease in tax-exempt bond funds is attributable to reimbursements distributed to us by the trust funds forapproved construction and equipment expenditures and to a decrease in new tax-exempt borrowings.
Debt — We use long-term borrowings in addition to the cash we generate from operations as part of our overallfinancial strategy to support and grow our business. We primarily use senior notes and tax-exempt bonds to borrowon a long-term basis, but also use other instruments and facilities when appropriate. The components of our long-term borrowings as of December 31, 2010 are described in Note 7 to the Consolidated Financial Statements.
Changes in our outstanding debt balances from December 31, 2009 to December 31, 2010 can primarily beattributed to (i) $908 million of cash borrowings, including $592 million in net proceeds from the June 2010issuance of $600 million of senior notes; (ii) the cash repayment of $1,112 million of outstanding borrowings at
54

their scheduled maturities, including the repayment of $600 million of senior notes in August 2010 and; (iii) ourinvestment in an entity that invests in and manages federal low-income housing projects, which increased our debtobligation by $215 million.
As of December 31, 2010, we had (i) $502 million of debt maturing within twelve months, includingU.S.$212 million under our Canadian credit facility and $147 million of 7.65% senior notes that mature in March2011; and (ii) $405 million of fixed-rate tax-exempt borrowings subject to re-pricing within the next twelve months.The amount reported as the current portion of long-term debt as of December 31, 2010 excludes $674 million ofthese amounts because we have the intent and ability to refinance portions of our current maturities on a long-termbasis.
We have credit facilities in place to support our liquidity and financial assurance needs. The following tablesummarizes our outstanding letters of credit (in millions) at December 31, categorized by type of facility:
2010 2009
Revolving credit facility(a) . . . . . . . . . . . . . . . . . . . . . . . . . . . . . . . . . . . . . . . . . $1,138 $1,578
Letter of credit facilities(b) . . . . . . . . . . . . . . . . . . . . . . . . . . . . . . . . . . . . . . . . . 505 371
Other(c) . . . . . . . . . . . . . . . . . . . . . . . . . . . . . . . . . . . . . . . . . . . . . . . . . . . . . . . 237 173
$1,880 $2,122
(a) In June 2010, we entered into a three-year, $2.0 billion revolving credit facility, replacing the $2.4 billionrevolving credit facility that would have matured in August 2011. At December 31, 2010, we had nooutstanding borrowings and $1,138 million of letters of credit issued and supported by the facility. The unusedand available credit capacity was $862 million at December 31, 2010.
(b) As of December 31, 2010, we had an aggregate committed capacity of $505 million under letter of creditfacilities with maturities that extend from June 2013 to June 2015. As of December 31, 2010, no borrowingswere outstanding under these letter of credit facilities and we had no unused or available credit capacity.
(c) These letters of credit are outstanding under various arrangements that do not obligate the counterparty toprovide a committed capacity.
The decrease in the utilization of the revolving credit facility and the increase in the utilization of our letter ofcredit and other facilities is due to the significantly higher costs associated with the $2.0 billion revolving creditfacility that was executed in June 2010.
Summary of Cash Flow Activity
The following is a summary of our cash flows for the years ended December 31 (in millions):2010 2009 2008
Net cash provided by operating activities . . . . . . . . . . . . . . . . . . . . . $ 2,275 $ 2,362 $ 2,575
Net cash used in investing activities . . . . . . . . . . . . . . . . . . . . . . . . . $(1,606) $(1,250) $(1,183)
Net cash used in financing activities. . . . . . . . . . . . . . . . . . . . . . . . . $(1,273) $ (457) $(1,256)
Net Cash Provided by Operating Activities — The most significant items affecting the comparison of ouroperating cash flows for 2010 and 2009 are summarized below:
• Increase in earnings — Our income from operations increased by $229 million on a year-over-year basis,driven, in part, by a favorable cash benefit of $77 million resulting from a litigation settlement in April 2010.This earnings increase was also impacted by (i) the recognition of a $51 million non-cash charge during thefourth quarter of 2009 associated with the abandonment of licensed revenue management software and(ii) the recognition of a $27 million non-cash charge in the fourth quarter of 2009 as a result of a change inexpectations for the future operations of an inactive landfill in California.
55

The comparison of our 2010 and 2009 income from operations was also affected by a $91 million increase innon-cash charges attributable to (i) equity-based compensation expense; (ii) interest accretion on landfillliabilities; (iii) interest accretion and discount rate adjustments on environmental remediation liabilities andrecovery assets; (iv) depreciation and amortization; and (v) the impact of the withdrawal of certainbargaining units from multiemployer pension plans. While the increase in non-cash charges unfavorablyaffected our earnings comparison, there is no impact on net cash provided by operating activities.
• Changes in assets and liabilities, net of effects from business acquisitions and divestitures — Our cash flowfrom operations was negatively impacted in 2010 and favorably impacted in 2009, by changes in ourworking capital accounts. Although our working capital changes may vary from year to year, they aretypically driven by changes in accounts receivable, which are affected by both revenue changes and timingof payments received, and accounts payable changes, which are affected by both cost changes and timing ofpayments. Additionally, the following are other significant items that affected our cash flow from operations:
• Increased income tax payments — Cash paid for income taxes, net of excess tax benefits associated withequity-based transactions, was approximately $86 million higher on a year-over-year basis. The com-parability of our effective tax rates is discussed in the Provision for income taxes section above.
• Increased interest payments — Cash paid for interest was approximately $61 million higher on ayear-over-year basis. This increase is primarily due to (i) the issuance of an additional $600 millionof senior notes in November 2009 to support acquisitions and investments made throughout 2010;(ii) significantly higher costs related to the execution and maintenance of our revolving credit facility,which was refinanced in June 2010; and (iii) a decrease in benefits to interest expense provided by activeinterest rate swaps as a result of decreases in the notional amount of swaps outstanding.
• Settlement of Canadian hedge — In December 2010, our previously existing foreign currency hedgesmatured and we paid cash of $37 million upon settlement. The cash payment from the settlement has beenclassified as a change in accrued liabilities within “Net cash provided by operating activities” in theConsolidated Statement of Cash Flows.
• Liquidation of a foreign subsidiary — We received a $65 million federal tax refund in the third quarter of2010 related to the liquidation of a foreign subsidiary in 2009. The cash proceeds have been classified as achange in other current assets within “Net cash provided by operating activities” in the ConsolidatedStatement of Cash Flows.
The most significant items affecting the comparison of our operating cash flows for 2009 and 2008 aresummarized below:
• Decrease in earnings — Our income from operations, excluding depreciation and amortization, decreasedby $419 million on a year-over-year basis. However, this earnings decline was also impacted by (i) therecognition of a $51 million non-cash charge during the fourth quarter of 2009 associated with theabandonment of licensed revenue management software and (ii) the recognition of a $27 million non-cash charge in the fourth quarter of 2009 as a result of a change in expectations for the future operations of alandfill in California.
Further, approximately $55 million of the year-over-year decrease in earnings is related to the impact ofdivestiture gains and gains on sale of assets for which the cash flow impacts are reflected in investingactivities in the caption “Proceeds from divestitures of businesses and other sales of assets.”
The comparison of our 2009 and 2008 income from operations was also affected by an $86 million decreasein non-cash charges attributable to (i) interest accretion and discount rate adjustments on environmentalremediation liabilities and recovery assets; (ii) equity-based compensation expense; and (iii) interestaccretion on landfill liabilities. While the decrease in non-cash charges favorably affected our earningscomparison, there is no impact on net cash provided by operating activities.
• Change in receivables — There was a significant decrease in the operating cash flows provided by changesin our receivables balances, net of effects of acquisitions and divestitures, when comparing 2009 with 2008.This decrease is primarily attributable to unusual activity in 2008, including (i) the significant decrease in
56

sequential quarter revenues when comparing the fourth quarter of 2008 with the third quarter of 2008, whichwas driven by the decline in the demand and market prices for recyclable commodities; and (ii) the collectionof a $60 million outstanding receivable related to our investments in synthetic fuel production facilities thatprovided us with Section 45K tax credits through 2007.
• Decreased income tax payments — Cash paid for income taxes, net of excess tax benefits associated withequity-based transactions, was approximately $140 million lower on a year-over-year basis. The compa-rability of our effective tax rates is discussed in the Provision for income taxes section above.
• Decreased interest payments — Cash paid for interest was approximately $60 million lower on ayear-over-year basis. This decrease is primarily due to a decline in market interest rates, which (i) increasedthe benefits to our interest costs provided by our active interest rate swap agreements and (ii) reduced theinterest costs associated with our variable-rate tax-exempt debt.
• Decreased bonus payments — Employee bonus payments earned in 2008, which were paid in the firstquarter of 2009, were lower than the bonus payments earned in 2007 but paid in 2008 due to the relativestrength of our financial performance against incentive measures in 2007 as compared with 2008. Theyear-over-year decrease in cash bonuses favorably affected the comparison of our cash flow from operationsby approximately $35 million.
• Termination of interest rate swaps — In December 2009, we elected to terminate interest rate swaps with anotional amount of $350 million that were scheduled to mature in November 2012. Upon termination of theswaps, we received $20 million in cash for their fair value plus accrued interest receivable. The cashproceeds received from the termination of interest rate swap agreements have been classified as a change inother assets within “Net cash provided by operating activities” in the Consolidated Statement of Cash Flows.
• Accounts payable processes — Changes in our accounts payable balances have favorably impacted ouryear-over-year cash flow from operations change by approximately $20 million.
Net Cash Used in Investing Activities — The most significant items affecting the comparison of our investingcash flows for the periods presented are summarized below:
• Acquisitions — Our spending on acquisitions increased from $280 million and $281 million during 2008 and2009, respectively, to $407 million in 2010. During the second quarter of 2010, we paid approximately$150 million to acquire a waste-to-energy facility in Portsmouth, Virginia. We continue to focus on accretiveacquisitions and growth opportunities that will contribute to improved future results of operations andenhance and expand our existing service offerings.
• Capital expenditures — We used $1,104 million during 2010 for capital expenditures, compared with$1,179 million in 2009 and $1,221 million in 2008.
• Net receipts from restricted funds — Net cash received from our restricted trust and escrow accounts, whichare largely generated from the issuance of tax-exempt bonds for our capital needs, contributed $48 million toour investing activities in 2010 compared with $196 million in 2009 and $178 million in 2008. Thesignificant decrease in cash received from our restricted trust and escrow accounts during 2010 is due to adecrease in tax-exempt borrowings.
• Investments in unconsolidated entities — We made $173 million of cash investments in unconsolidatedentities during 2010. These cash investments were primarily related to a $142 million payment made toacquire a 40% equity investment in Shanghai Environment Group, a subsidiary of Shanghai ChengtouHolding Co., Ltd. As a joint venture partner in SEG, we will participate in the operation and management ofwaste-to-energy and other waste services in the Chinese market. SEG will also focus on building newwaste-to-energy facilities in China.
57

Net Cash Used in Financing Activities — The most significant items affecting the comparison of our financingcash flows for the periods presented are summarized below:
• Share repurchases and dividend payments — Our 2010, 2009 and 2008 share repurchases and dividendpayments have been made in accordance with capital allocation programs approved by our Board ofDirectors.
We paid $501 million for share repurchases in 2010, compared with $226 million in 2009 and $410 millionin 2008. We repurchased approximately 15 million, 7 million and 12 million shares of our common stock in2010, 2009 and 2008, respectively. The decline in share repurchases during 2009 is largely attributable to thesuspension of our share repurchases in July 2008 in connection with a proposed acquisition and to the stateof the financial markets and the economy. Given the stabilization of the capital markets and economicconditions, we elected to resume our share repurchases during the third quarter of 2009.
We paid an aggregate of $604 million in cash dividends during 2010, compared with $569 million in 2009and $531 million in 2008. The increase in dividend payments is due to our quarterly per share dividendincreasing from $0.27 in 2008, to $0.29 in 2009 and to $0.315 in 2010, and has been offset in part by areduction in our common stock outstanding as a result of our share repurchase programs.
In December 2010, the Board of Directors announced that it expects future quarterly dividend payments willbe $0.34 per share for dividends declared in 2011. All 2011 share repurchases will be made at the discretionof management, up to $575 million, as approved by the Board of Directors in December 2010, and all actualfuture dividends must first be declared by the Board of Directors at its discretion, with all decisionsdependent on various factors, including our net earnings, financial condition, cash required for futureacquisitions and investments and other factors deemed relevant.
• Proceeds from the exercise of common stock options— The exercise of common stock options and the relatedexcess tax benefits generated a total of $54 million of financing cash inflows during 2010 compared with$20 million during 2009 and $37 million in 2008.
• Net debt repayments — Net debt repayments were $204 million in 2010, net debt borrowings were$414 million in 2009 and net debt repayments were $260 million in 2008. The following summarizesour most significant cash borrowings and debt repayments made during each year (in millions):
2010 2009 2008Years Ended December 31,
Borrowings:
Revolving credit facility . . . . . . . . . . . . . . . . . . . . . . . . . . . . $ — $ — $ 350
Canadian credit facility . . . . . . . . . . . . . . . . . . . . . . . . . . . . . 316 364 581
Senior notes . . . . . . . . . . . . . . . . . . . . . . . . . . . . . . . . . . . . . 592 1,385 594
$ 908 $ 1,749 $ 1,525
Repayments:
Revolving credit facility . . . . . . . . . . . . . . . . . . . . . . . . . . . . $ — $ (310) $ (371)
Canadian credit facility . . . . . . . . . . . . . . . . . . . . . . . . . . . . . (372) (395) (634)
Senior notes . . . . . . . . . . . . . . . . . . . . . . . . . . . . . . . . . . . . . (600) (500) (633)
Tax exempt bonds. . . . . . . . . . . . . . . . . . . . . . . . . . . . . . . . . (52) (65) (19)Tax exempt project bonds . . . . . . . . . . . . . . . . . . . . . . . . . . . (39) (39) (67)
Capital leases and other debt. . . . . . . . . . . . . . . . . . . . . . . . . (49) (26) (61)
$(1,112) $(1,335) $(1,785)
Net borrowings (repayments) . . . . . . . . . . . . . . . . . . . . . . . . . . $ (204) $ 414 $ (260)
This summary excludes the impacts of non-cash borrowings and debt repayments. During the year endedDecember 31, 2010, we had a $215 million non-cash increase in our debt obligations as a result of the
58

issuance of a note payable in return for a noncontrolling interest in a limited liability company established toinvest in and manage low-income housing properties. This investment is discussed in detail in Note 9. Forthe years ended December 31, 2009 and 2008, these non-cash financing activities were primarily associatedwith our tax-exempt bond financings. Proceeds from tax-exempt bond issuances, net of principal repay-ments made directly from trust funds, were $105 million in 2009 and $169 million in 2008.
• Other — Net cash provided by other financing activities was $18 million in 2010 while net cash used inother financing activities was $50 million in 2009 and $43 million in 2008. These activities are primarilyattributable to changes in our accrued liabilities for checks written in excess of cash balances due to thetiming of cash deposits or payments. The cash provided by these activities in 2010 was offset, in part, by$13 million of financing costs paid to execute our new $2.0 billion revolving credit facility.
Summary of Contractual Obligations
The following table summarizes our contractual obligations as of December 31, 2010 and the anticipated effectof these obligations on our liquidity in future years (in millions):
2011 2012 2013 2014 2015 Thereafter Total
Recorded Obligations:Expected environmental liabilities(a)
Capping, closure and post-closure . . . . . . . . . $105 $116 $ 96 $102 $107 $1,943 $ 2,469
Environmental remediation . . . . . . . . . . . . . . 43 37 21 30 24 141 296
148 153 117 132 131 2,084 2,765
Debt payments(b),(c),(d) . . . . . . . . . . . . . . . . 511 614 203 459 452 6,600 8,839Unrecorded Obligations:(e)
Non-cancelable operating lease obligations . . 82 76 62 51 40 215 526
Estimated unconditional purchaseobligations(f) . . . . . . . . . . . . . . . . . . . . . . 85 84 58 21 16 238 502
Anticipated liquidity impact as ofDecember 31, 2010 . . . . . . . . . . . . . . . . $826 $927 $440 $663 $639 $9,137 $12,632
(a) Environmental liabilities include capping, closure, post-closure and environmental remediation costs. The amountsincluded here reflect environmental liabilities recorded in our Consolidated Balance Sheet as of December 31, 2010without the impact of discounting and inflation. Our recorded environmental liabilities for capping, closure andpost-closure will increase as we continue to place additional tons within the permitted airspace at our landfills.
(b) The amounts reported here represent the scheduled principal payments related to our long-term debt, excludingrelated interest. Refer to Note 7 to the Consolidated Financial Statements for information regarding interest rates.
(c) Our debt obligations as of December 31, 2010 include $405 million of tax-exempt bonds subject to re-pricingwithin the next twelve months, which is prior to their scheduled maturities. If the re-offerings of the bonds areunsuccessful, then the bonds can be put to us, requiring immediate repayment. We have classified the anticipatedcash flows for these contractual obligations based on the scheduled maturity of the borrowing for purposes of thisdisclosure. For additional information regarding the classification of these borrowings in our ConsolidatedBalance Sheet as of December 31, 2010, refer to Note 7 to the Consolidated Financial Statements.
(d) Our recorded debt obligations include non-cash adjustments associated with discounts, premiums and fairvalue adjustments for interest rate hedging activities. These amounts have been excluded here because theywill not result in an impact to our liquidity in future periods.
(e) Our unrecorded obligations represent operating lease obligations and purchase commitments from which weexpect to realize an economic benefit in future periods. We have also made certain guarantees, as discussed inNote 11 to the Consolidated Financial Statements, that we do not expect to materially affect our current orfuture financial position, results of operations or liquidity.
59

(f) Our unconditional purchase obligations are for various contractual obligations that we generally incur in theordinary course of our business. Certain of our obligations are quantity driven. For these contracts, we haveestimated our future obligations based on the current market values of the underlying products or services.Accordingly, the amounts reported in the table are not necessarily indicative of our actual cash flowobligations. See Note 11 to the Consolidated Financial Statements for discussion of the nature and termsof our unconditional purchase obligations.
Liquidity Impacts of Uncertain Tax Positions
As discussed in Note 9 of our Consolidated Financial Statements, we have liabilities associated withunrecognized tax benefits and related interest. These liabilities are primarily included as a component of long-term “Other liabilities” in our Consolidated Balance Sheet because the Company generally does not anticipate thatsettlement of the liabilities will require payment of cash within the next twelve months. We are not able toreasonably estimate when we would make any cash payments required to settle these liabilities, but do not believethat the ultimate settlement of our obligations will materially affect our liquidity.
Off-Balance Sheet Arrangements
We are party to guarantee arrangements with unconsolidated entities as discussed in the Guarantees section ofNote 11 to the Consolidated Financial Statements. These arrangements have not materially affected our financialposition, results of operations or liquidity during the year ended December 31, 2010 nor are they expected to have amaterial impact on our future financial position, results of operations or liquidity.
Inflation
While inflationary increases in costs, including the cost of diesel fuel, have affected our operating margins inrecent years, we believe that inflation generally has not had, and in the near future is not expected to have, anymaterial adverse effect on our results of operations. However, as of December 31, 2010, over 35% of our collectionrevenues are generated under long-term agreements with price adjustments based on various indices intended tomeasure inflation. Additionally, management’s estimates associated with inflation have had, and will continue tohave, an impact on our accounting for landfill and environmental remediation liabilities.
New Accounting Pronouncements
Multiple-Deliverable Revenue Arrangements — In October 2009, the FASB amended authoritative guidanceassociated with multiple-deliverable revenue arrangements. This amended guidance addresses the determination ofwhen individual deliverables within an arrangement may be treated as separate units of accounting and modifies themanner in which consideration is allocated across the separately identifiable deliverables. The amendments toauthoritative guidance associated with multiple-deliverable revenue arrangements became effective for the Com-pany on January 1, 2011. The new accounting standard may be applied either retrospectively for all periodspresented or prospectively to arrangements entered into or materially modified after the date of adoption. We do notexpect that the adoption of this guidance will have a material impact on our consolidated financial statements.
However, our adoption of this guidance may significantly impact our accounting and reporting for futurerevenue arrangements to the extent they are material.
Item 7A. Quantitative and Qualitative Disclosures About Market Risk.
In the normal course of business, we are exposed to market risks, including changes in interest rates, Canadiancurrency rates and certain commodity prices. From time to time, we use derivatives to manage some portion of theserisks. Our derivatives are agreements with independent counterparties that provide for payments based on a notionalamount. As of December 31, 2010, all of our derivative transactions were related to actual or anticipated economicexposures. We are exposed to credit risk in the event of non-performance by our derivative counterparties. However, wemonitor our derivative positions by regularly evaluating our positions and the creditworthiness of the counterparties.
60

Interest Rate Exposure — Our exposure to market risk for changes in interest rates relates primarily to ourfinancing activities, although our interest costs can also be significantly affected by our on-going financialassurance needs, which are discussed in the Financial Assurance and Insurance Obligations section of Item 1.
As of December 31, 2010, we had $8.8 billion of long-term debt when excluding the impacts of accounting forfair value adjustments attributable to interest rate derivatives, discounts and premiums. The effective interest rates ofapproximately $1.8 billion of our outstanding debt obligations are subject to change during 2011. The most significantcomponents of our variable-rate debt obligations are (i) $500 million of “receive fixed, pay variable” interest rateswaps associated with outstanding fixed-rate senior notes; (ii) $611 million of tax-exempt bonds that are subject tore-pricing on either a daily or weekly basis through a remarketing process; (iii) $405 million of tax-exempt bonds withterm interest rate periods that are subject to re-pricing within twelve months; and (iv) $215 million of outstandingadvances under our Canadian Credit Facility. As of December 31, 2009, the effective interest rates of approximately$3.0 billion of our outstanding debt obligations were subject to change within twelve months.
The decrease in outstanding debt obligations exposed to variable interest rates in 2010 is generally a result of a$600 million decrease in the notional amount of active interest rate swaps and decreases in our variable-rate tax-exempt bonds. The decline in our variable-rate debt obligations has reduced the potential volatility to our operatingresults and cash flows that results from fluctuations in market interest rates. We currently estimate that a 100 basispoint increase in the interest rates of our outstanding variable-rate debt obligations would increase our 2011 interestexpense by approximately $13 million.
Our remaining outstanding debt obligations have fixed interest rates through either the scheduled maturity ofthe debt or, for certain of our “fixed-rate” tax exempt bonds, through the end of a term interest rate period thatexceeds twelve months. In addition, as of December 31, 2010, we have forward-starting interest rate swaps with anotional amount of $525 million. The fair value of our fixed-rate debt obligations and various interest rate derivativeinstruments can increase or decrease significantly if market interest rates change.
We have performed sensitivity analyses to determine how market rate changes might affect the fair value of ourmarket risk-sensitive derivatives and related positions. These analyses are inherently limited because they reflect asingular, hypothetical set of assumptions. Actual market movements may vary significantly from our assumptions.An instantaneous, one percentage point increase in interest rates across all maturities and applicable yield curvesattributable to these instruments would have decreased the fair value of our combined debt and interest ratederivative positions by approximately $658 million at December 31, 2010.
We are also exposed to interest rate market risk because we have significant cash and cash equivalent balancesas well as assets held in restricted trust funds and escrow accounts. These assets are generally invested in highquality, liquid instruments including money market funds that invest in U.S. government obligations with originalmaturities of three months or less. Because of the short terms to maturity of these investments, we believe that ourexposure to changes in fair value due to interest rate fluctuations is insignificant.
Commodity Price Exposure — In the normal course of our business, we are subject to operating agreementsthat expose us to market risks arising from changes in the prices for commodities such as diesel fuel; recyclablematerials, including aluminum, old corrugated cardboard and old newsprint; and electricity, which generallycorrelates with natural gas prices in many of the markets where we operate. With the exception of electricitycommodity derivatives, which are discussed below, we generally have not entered into derivatives to hedge the risksassociated with changes in the market prices of these commodities during the three years ended December 31, 2010.Alternatively, we attempt to manage these risks through operational strategies that focus on capturing our costs inthe prices we charge our customers for the services provided. Accordingly, as the market prices for thesecommodities increase or decrease, our revenues also increase or decrease.
During 2010, approximately 47% of the electricity revenue at our waste-to-energy facilities was subject tocurrent market rates, and we currently expect that nearly 54% of our electricity revenues at our waste-to-energyfacilities will be at market rates by the end of 2011. Our exposure to variability associated with changes in marketprices for electricity has increased because several long-term power purchase agreements have expired. The energymarkets have changed significantly since the expiring contracts were executed and we have found that medium- andlong-term electricity contracts are less favorable in the current environment. As we renegotiate our power-purchaseagreements, we expect that a more substantial portion of our energy sales at our waste-to-energy facilities andlandfill gas-to-energy plants will be based on current market rates. Accordingly, in 2010 we implemented a more
61

actively managed energy program, which includes a hedging strategy intended to decrease the exposure of ourrevenues to volatility due to market prices for electricity. Refer to Note 8 of the Consolidated Financial Statementsfor additional information regarding our electricity commodity derivatives.
Currency Rate Exposure — From time to time, we use currency derivatives to mitigate the impact of currencytranslation on cash flows of intercompany Canadian-currency denominated debt transactions. Our foreign currencyderivatives have not materially affected our financial position or results of operations for the periods presented. Inaddition, while changes in foreign currency exchange rates could significantly affect the fair value of our foreigncurrency derivatives, we believe these changes in fair value would not have a material impact to the Company. Refer toNote 8 of the Consolidated Financial Statements for additional information regarding our foreign currency derivatives.
62

Item 8. Financial Statements and Supplementary Data.
INDEX TO
CONSOLIDATED FINANCIAL STATEMENTS
Page
Management’s Report on Internal Control Over Financial Reporting . . . . . . . . . . . . . . . . . . . . . . . . . . . . . 64
Reports of Independent Registered Public Accounting Firm . . . . . . . . . . . . . . . . . . . . . . . . . . . . . . . . . . . 65
Consolidated Balance Sheets as of December 31, 2010 and 2009 . . . . . . . . . . . . . . . . . . . . . . . . . . . . . . . 67Consolidated Statements of Operations for the Years Ended December 31, 2010, 2009 and 2008 . . . . . . . . 68
Consolidated Statements of Cash Flows for the Years Ended December 31, 2010, 2009 and 2008 . . . . . . . 69
Consolidated Statements of Changes in Equity for the Years Ended December 31, 2010, 2009 and 2008 . . 70
Notes to Consolidated Financial Statements . . . . . . . . . . . . . . . . . . . . . . . . . . . . . . . . . . . . . . . . . . . . . . . 72
63

MANAGEMENT’S REPORT ON INTERNAL CONTROLOVER FINANCIAL REPORTING
Management of the Company, including the Chief Executive Officer and the Chief Financial Officer, isresponsible for establishing and maintaining adequate internal control over financial reporting, as defined inRules 13a-15(f) and 15d-15(f) of the Securities Exchange Act of 1934, as amended. Our internal controls weredesigned to provide reasonable assurance as to (i) the reliability of our financial reporting; (ii) the reliability of thepreparation and presentation of the consolidated financial statements for external purposes in accordance withaccounting principles generally accepted in the United States; and (iii) the safeguarding of assets from unauthorizeduse or disposition.
We conducted an evaluation of the effectiveness of our internal control over financial reporting as ofDecember 31, 2010 based on the Internal Control — Integrated Framework issued by the Committee of SponsoringOrganizations of the Treadway Commission. Through this evaluation, we did not identify any material weaknessesin our internal controls. There are inherent limitations in the effectiveness of any system of internal control overfinancial reporting; however, based on our evaluation, we have concluded that our internal control over financialreporting was effective as of December 31, 2010.
The effectiveness of our internal control over financial reporting has been audited by Ernst & Young LLP, anindependent registered public accounting firm, as stated in their report which is included herein.
64

REPORT OF INDEPENDENT REGISTERED PUBLIC ACCOUNTING FIRM
The Board of Directors and Stockholders of Waste Management, Inc.
We have audited Waste Management, Inc.’s internal control over financial reporting as of December 31, 2010,based on criteria established in Internal Control-Integrated Framework issued by the Committee of SponsoringOrganizations of the Treadway Commission (the COSO criteria). Waste Management, Inc.’s management isresponsible for maintaining effective internal control over financial reporting, and for its assessment of theeffectiveness of internal control over financial reporting included in the accompanying Management’s Report onInternal Control Over Financial Reporting. Our responsibility is to express an opinion on the company’s internalcontrol over financial reporting based on our audit.
We conducted our audit in accordance with the standards of the Public Company Accounting Oversight Board(United States). Those standards require that we plan and perform the audit to obtain reasonable assurance aboutwhether effective internal control over financial reporting was maintained in all material respects. Our auditincluded obtaining an understanding of internal control over financial reporting, assessing the risk that a materialweakness exists, testing and evaluating the design and operating effectiveness of internal control based on theassessed risk, and performing such other procedures as we considered necessary in the circumstances. We believethat our audit provides a reasonable basis for our opinion.
A company’s internal control over financial reporting is a process designed to provide reasonable assuranceregarding the reliability of financial reporting and the preparation of financial statements for external purposes inaccordance with generally accepted accounting principles. A company’s internal control over financial reportingincludes those policies and procedures that (1) pertain to the maintenance of records that, in reasonable detail,accurately and fairly reflect the transactions and dispositions of the assets of the company; (2) provide reasonableassurance that transactions are recorded as necessary to permit preparation of financial statements in accordancewith generally accepted accounting principles, and that receipts and expenditures of the company are being madeonly in accordance with authorizations of management and directors of the company; and (3) provide reasonableassurance regarding prevention or timely detection of unauthorized acquisition, use, or disposition of the company’sassets that could have a material effect on the financial statements.
Because of its inherent limitations, internal control over financial reporting may not prevent or detectmisstatements. Also, projections of any evaluation of effectiveness to future periods are subject to the risk thatcontrols may become inadequate because of changes in conditions, or that the degree of compliance with thepolicies or procedures may deteriorate.
In our opinion, Waste Management, Inc. maintained, in all material respects, effective internal control overfinancial reporting as of December 31, 2010, based on the COSO criteria.
We also have audited, in accordance with the standards of the Public Company Accounting Oversight Board(United States), the consolidated balance sheets of Waste Management, Inc. as of December 31, 2010 and 2009, andthe related consolidated statements of operations, cash flows, and changes in equity for each of the three years in theperiod ended December 31, 2010, and our report dated February 17, 2011 expressed an unqualified opinion thereon.
ERNST & YOUNG LLP
Houston, TexasFebruary 17, 2011
65

REPORT OF INDEPENDENT REGISTERED PUBLIC ACCOUNTING FIRM
The Board of Directors and Stockholders of Waste Management, Inc.
We have audited the accompanying consolidated balance sheets of Waste Management, Inc. (the “Company”)as of December 31, 2010 and 2009, and the related consolidated statements of operations, cash flows, and changesin equity for each of the three years in the period ended December 31, 2010. These financial statements are theresponsibility of the Company’s management. Our responsibility is to express an opinion on these financialstatements based on our audits.
We conducted our audits in accordance with the standards of the Public Company Accounting Oversight Board(United States). Those standards require that we plan and perform the audit to obtain reasonable assurance aboutwhether the financial statements are free of material misstatement. An audit includes examining, on a test basis,evidence supporting the amounts and disclosures in the financial statements. An audit also includes assessing theaccounting principles used and significant estimates made by management, as well as evaluating the overallfinancial statement presentation. We believe that our audits provide a reasonable basis for our opinion.
In our opinion, the financial statements referred to above present fairly, in all material respects, theconsolidated financial position of Waste Management, Inc. at December 31, 2010 and 2009, and the consolidatedresults of its operations and its cash flows for each of the three years in the period ended December 31, 2010, inconformity with U.S. generally accepted accounting principles.
As discussed in Note 2 to the consolidated financial statements, effective January 1, 2009, the Companyadopted certain provisions of ASC Topic 810, “Consolidation” related to noncontrolling interests in consolidatedfinancial statements. Additionally, effective January 1, 2010, the Company adopted certain provisions of ASC Topic810, “Consolidation” related to the consolidation of variable interest entities.
We also have audited, in accordance with the standards of the Public Company Accounting Oversight Board(United States), Waste Management, Inc.’s internal control over financial reporting as of December 31, 2010, basedon criteria established in Internal Control-Integrated Framework issued by the Committee of Sponsoring Orga-nizations of the Treadway Commission and our report dated February 17, 2011 expressed an unqualified opinionthereon.
ERNST & YOUNG LLP
Houston, TexasFebruary 17, 2011
66

WASTE MANAGEMENT, INC.
CONSOLIDATED BALANCE SHEETS(In Millions, Except Share and Par Value Amounts)
2010 2009December 31,
ASSETSCurrent assets:
Cash and cash equivalents . . . . . . . . . . . . . . . . . . . . . . . . . . . . . . . . . . . . . . . . . . . . . . . . . . . $ 539 $ 1,140Accounts receivable, net of allowance for doubtful accounts of $26 and $31, respectively . . . . . . . 1,510 1,408Other receivables. . . . . . . . . . . . . . . . . . . . . . . . . . . . . . . . . . . . . . . . . . . . . . . . . . . . . . . . . . 146 119Parts and supplies . . . . . . . . . . . . . . . . . . . . . . . . . . . . . . . . . . . . . . . . . . . . . . . . . . . . . . . . . 130 110Deferred income taxes . . . . . . . . . . . . . . . . . . . . . . . . . . . . . . . . . . . . . . . . . . . . . . . . . . . . . . 40 116Other assets . . . . . . . . . . . . . . . . . . . . . . . . . . . . . . . . . . . . . . . . . . . . . . . . . . . . . . . . . . . . . 117 117
Total current assets . . . . . . . . . . . . . . . . . . . . . . . . . . . . . . . . . . . . . . . . . . . . . . . . . . . . . . 2,482 3,010Property and equipment, net of accumulated depreciation and amortization of $14,690 and $13,994,
respectively . . . . . . . . . . . . . . . . . . . . . . . . . . . . . . . . . . . . . . . . . . . . . . . . . . . . . . . . . . . . . 11,868 11,541Goodwill . . . . . . . . . . . . . . . . . . . . . . . . . . . . . . . . . . . . . . . . . . . . . . . . . . . . . . . . . . . . . . . . . 5,726 5,632Other intangible assets, net . . . . . . . . . . . . . . . . . . . . . . . . . . . . . . . . . . . . . . . . . . . . . . . . . . . . 295 238Other assets . . . . . . . . . . . . . . . . . . . . . . . . . . . . . . . . . . . . . . . . . . . . . . . . . . . . . . . . . . . . . . . 1,105 733
Total assets . . . . . . . . . . . . . . . . . . . . . . . . . . . . . . . . . . . . . . . . . . . . . . . . . . . . . . . . . . . . $21,476 $21,154
LIABILITIES AND EQUITYCurrent liabilities:
Accounts payable . . . . . . . . . . . . . . . . . . . . . . . . . . . . . . . . . . . . . . . . . . . . . . . . . . . . . . . . . $ 692 $ 567Accrued liabilities . . . . . . . . . . . . . . . . . . . . . . . . . . . . . . . . . . . . . . . . . . . . . . . . . . . . . . . . . 1,100 1,128Deferred revenues . . . . . . . . . . . . . . . . . . . . . . . . . . . . . . . . . . . . . . . . . . . . . . . . . . . . . . . . . 460 457Current portion of long-term debt . . . . . . . . . . . . . . . . . . . . . . . . . . . . . . . . . . . . . . . . . . . . . . 233 749
Total current liabilities . . . . . . . . . . . . . . . . . . . . . . . . . . . . . . . . . . . . . . . . . . . . . . . . . . . . 2,485 2,901Long-term debt, less current portion . . . . . . . . . . . . . . . . . . . . . . . . . . . . . . . . . . . . . . . . . . . . . . 8,674 8,124Deferred income taxes . . . . . . . . . . . . . . . . . . . . . . . . . . . . . . . . . . . . . . . . . . . . . . . . . . . . . . . . 1,662 1,509Landfill and environmental remediation liabilities . . . . . . . . . . . . . . . . . . . . . . . . . . . . . . . . . . . . . 1,402 1,357Other liabilities . . . . . . . . . . . . . . . . . . . . . . . . . . . . . . . . . . . . . . . . . . . . . . . . . . . . . . . . . . . . . 662 672
Total liabilities . . . . . . . . . . . . . . . . . . . . . . . . . . . . . . . . . . . . . . . . . . . . . . . . . . . . . . . . . 14,885 14,563
Commitments and contingenciesEquity:
Waste Management, Inc. stockholders’ equity:Common stock, $0.01 par value; 1,500,000,000 shares authorized; 630,282,461 shares issued . . . 6 6Additional paid-in capital . . . . . . . . . . . . . . . . . . . . . . . . . . . . . . . . . . . . . . . . . . . . . . . . . . 4,528 4,543Retained earnings . . . . . . . . . . . . . . . . . . . . . . . . . . . . . . . . . . . . . . . . . . . . . . . . . . . . . . . 6,400 6,053Accumulated other comprehensive income . . . . . . . . . . . . . . . . . . . . . . . . . . . . . . . . . . . . . . 230 208Treasury stock at cost, 155,235,711 and 144,162,063 shares, respectively . . . . . . . . . . . . . . . . . (4,904) (4,525)
Total Waste Management, Inc. stockholders’ equity . . . . . . . . . . . . . . . . . . . . . . . . . . . . . . 6,260 6,285Noncontrolling interests . . . . . . . . . . . . . . . . . . . . . . . . . . . . . . . . . . . . . . . . . . . . . . . . . . . . . 331 306
Total equity . . . . . . . . . . . . . . . . . . . . . . . . . . . . . . . . . . . . . . . . . . . . . . . . . . . . . . . . . . . . 6,591 6,591
Total liabilities and equity . . . . . . . . . . . . . . . . . . . . . . . . . . . . . . . . . . . . . . . . . . . . . . . . . . . . . $21,476 $21,154
See notes to Consolidated Financial Statements.
67

WASTE MANAGEMENT, INC.
CONSOLIDATED STATEMENTS OF OPERATIONS(In Millions, Except per Share Amounts)
2010 2009 2008Years Ended December 31,
Operating revenues. . . . . . . . . . . . . . . . . . . . . . . . . . . . . . . . . . . . . . . . . . . . $12,515 $11,791 $13,388
Costs and expenses:
Operating . . . . . . . . . . . . . . . . . . . . . . . . . . . . . . . . . . . . . . . . . . . . . . . . . 7,824 7,241 8,466
Selling, general and administrative . . . . . . . . . . . . . . . . . . . . . . . . . . . . . . 1,461 1,364 1,477
Depreciation and amortization . . . . . . . . . . . . . . . . . . . . . . . . . . . . . . . . . . 1,194 1,166 1,238
Restructuring . . . . . . . . . . . . . . . . . . . . . . . . . . . . . . . . . . . . . . . . . . . . . . (2) 50 2
(Income) expense from divestitures, asset impairments and unusual items. . (78) 83 (29)
10,399 9,904 11,154
Income from operations . . . . . . . . . . . . . . . . . . . . . . . . . . . . . . . . . . . . . . . . 2,116 1,887 2,234
Other income (expense):
Interest expense . . . . . . . . . . . . . . . . . . . . . . . . . . . . . . . . . . . . . . . . . . . . (473) (426) (455)
Interest income . . . . . . . . . . . . . . . . . . . . . . . . . . . . . . . . . . . . . . . . . . . . . 4 13 19
Equity in net losses of unconsolidated entities . . . . . . . . . . . . . . . . . . . . . . (21) (2) (4)
Other, net . . . . . . . . . . . . . . . . . . . . . . . . . . . . . . . . . . . . . . . . . . . . . . . . . 5 1 3
(485) (414) (437)
Income before income taxes . . . . . . . . . . . . . . . . . . . . . . . . . . . . . . . . . . . . . 1,631 1,473 1,797
Provision for income taxes . . . . . . . . . . . . . . . . . . . . . . . . . . . . . . . . . . . . . . 629 413 669
Consolidated net income . . . . . . . . . . . . . . . . . . . . . . . . . . . . . . . . . . . . . . . 1,002 1,060 1,128
Less: Net income attributable to noncontrolling interests . . . . . . . . . . . . . . 49 66 41
Net income attributable to Waste Management, Inc. . . . . . . . . . . . . . . . . . . . $ 953 $ 994 $ 1,087
Basic earnings per common share . . . . . . . . . . . . . . . . . . . . . . . . . . . . . . . . . $ 1.98 $ 2.02 $ 2.21
Diluted earnings per common share . . . . . . . . . . . . . . . . . . . . . . . . . . . . . . . $ 1.98 $ 2.01 $ 2.19
Cash dividends declared per common share. . . . . . . . . . . . . . . . . . . . . . . . . . $ 1.26 $ 1.16 $ 1.08
See notes to Consolidated Financial Statements.
68

WASTE MANAGEMENT, INC.
CONSOLIDATED STATEMENTS OF CASH FLOWS(In Millions)
2010 2009 2008Years Ended December 31,
Cash flows from operating activities:Consolidated net income . . . . . . . . . . . . . . . . . . . . . . . . . . . . . . . . . . . . . . . . . . . . . . . $ 1,002 $ 1,060 $ 1,128Adjustments to reconcile consolidated net income to net cash provided by operating
activities:Depreciation and amortization . . . . . . . . . . . . . . . . . . . . . . . . . . . . . . . . . . . . . . . . . 1,194 1,166 1,238Deferred income tax (benefit) provision. . . . . . . . . . . . . . . . . . . . . . . . . . . . . . . . . . . 154 (94) 150Interest accretion on landfill liabilities . . . . . . . . . . . . . . . . . . . . . . . . . . . . . . . . . . . . 82 80 77Interest accretion on and discount rate adjustments to environmental remediation
liabilities and recovery assets . . . . . . . . . . . . . . . . . . . . . . . . . . . . . . . . . . . . . . . . 8 (30) 41Provision for bad debts . . . . . . . . . . . . . . . . . . . . . . . . . . . . . . . . . . . . . . . . . . . . . . 41 48 50Equity-based compensation expense . . . . . . . . . . . . . . . . . . . . . . . . . . . . . . . . . . . . . 36 30 48Equity in net losses of unconsolidated entities, net of dividends . . . . . . . . . . . . . . . . . . 20 2 1Net gain from disposal of assets . . . . . . . . . . . . . . . . . . . . . . . . . . . . . . . . . . . . . . . . (22) (13) (33)Effect of (income) expense from divestitures, asset impairments and unusual items . . . . (1) 83 (29)Excess tax benefits associated with equity-based transactions . . . . . . . . . . . . . . . . . . . . (9) (4) (7)Change in operating assets and liabilities, net of effects of acquisitions and divestitures:
Receivables . . . . . . . . . . . . . . . . . . . . . . . . . . . . . . . . . . . . . . . . . . . . . . . . . . . . (159) 29 216Other current assets . . . . . . . . . . . . . . . . . . . . . . . . . . . . . . . . . . . . . . . . . . . . . . . 47 (4) (9)Other assets . . . . . . . . . . . . . . . . . . . . . . . . . . . . . . . . . . . . . . . . . . . . . . . . . . . . (3) 20 5Accounts payable and accrued liabilities . . . . . . . . . . . . . . . . . . . . . . . . . . . . . . . . (57) 51 (183)Deferred revenues and other liabilities . . . . . . . . . . . . . . . . . . . . . . . . . . . . . . . . . . (58) (62) (118)
Net cash provided by operating activities . . . . . . . . . . . . . . . . . . . . . . . . . . . . . . . . . . . 2,275 2,362 2,575
Cash flows from investing activities:Acquisitions of businesses, net of cash acquired . . . . . . . . . . . . . . . . . . . . . . . . . . . . . (407) (281) (280)Capital expenditures . . . . . . . . . . . . . . . . . . . . . . . . . . . . . . . . . . . . . . . . . . . . . . . . (1,104) (1,179) (1,221)Proceeds from divestitures of businesses (net of cash divested) and other sales of
assets . . . . . . . . . . . . . . . . . . . . . . . . . . . . . . . . . . . . . . . . . . . . . . . . . . . . . . . . . 44 28 112Net receipts from restricted trust and escrow accounts . . . . . . . . . . . . . . . . . . . . . . . . . 48 196 178Investments in unconsolidated entities . . . . . . . . . . . . . . . . . . . . . . . . . . . . . . . . . . . . (173) (21) (9)Other . . . . . . . . . . . . . . . . . . . . . . . . . . . . . . . . . . . . . . . . . . . . . . . . . . . . . . . . . . (14) 7 37
Net cash used in investing activities . . . . . . . . . . . . . . . . . . . . . . . . . . . . . . . . . . . . . . . (1,606) (1,250) (1,183)
Cash flows from financing activities:New borrowings . . . . . . . . . . . . . . . . . . . . . . . . . . . . . . . . . . . . . . . . . . . . . . . . . . . 908 1,749 1,525Debt repayments . . . . . . . . . . . . . . . . . . . . . . . . . . . . . . . . . . . . . . . . . . . . . . . . . . . (1,112) (1,335) (1,785)Common stock repurchases . . . . . . . . . . . . . . . . . . . . . . . . . . . . . . . . . . . . . . . . . . . (501) (226) (410)Cash dividends . . . . . . . . . . . . . . . . . . . . . . . . . . . . . . . . . . . . . . . . . . . . . . . . . . . . (604) (569) (531)Exercise of common stock options . . . . . . . . . . . . . . . . . . . . . . . . . . . . . . . . . . . . . . 54 20 37Excess tax benefits associated with equity-based transactions . . . . . . . . . . . . . . . . . . . . 9 4 7Distributions paid to noncontrolling interests . . . . . . . . . . . . . . . . . . . . . . . . . . . . . . . (45) (50) (56)Other . . . . . . . . . . . . . . . . . . . . . . . . . . . . . . . . . . . . . . . . . . . . . . . . . . . . . . . . . . 18 (50) (43)
Net cash used in financing activities . . . . . . . . . . . . . . . . . . . . . . . . . . . . . . . . . . . . . . . (1,273) (457) (1,256)
Effect of exchange rate changes on cash and cash equivalents . . . . . . . . . . . . . . . . . . . . . 3 5 (4)
Increase (decrease) in cash and cash equivalents . . . . . . . . . . . . . . . . . . . . . . . . . . . . . . (601) 660 132Cash and cash equivalents at beginning of year . . . . . . . . . . . . . . . . . . . . . . . . . . . . . . . 1,140 480 348
Cash and cash equivalents at end of year . . . . . . . . . . . . . . . . . . . . . . . . . . . . . . . . . . . $ 539 $ 1,140 $ 480
See notes to Consolidated Financial Statements.
69

WASTE MANAGEMENT, INC.
CONSOLIDATED STATEMENTS OF CHANGES IN EQUITY(In Millions, Except Shares in Thousands)
TotalComprehensive
Income Shares Amounts
AdditionalPaid-InCapital
RetainedEarnings
AccumulatedOther
ComprehensiveIncome(Loss) Shares Amounts
NoncontrollingInterests
Common Stock Treasury Stock
Waste Management, Inc. Stockholders’ Equity
Balance, December 31, 2007 . . . . $6,102 630,282 $ 6 $4,542 $5,080 $ 229 (130,164) $(4,065) $310Comprehensive Income:Consolidated net income . . . . . . 1,128 $1,128 — — — 1,087 — — — 41Other comprehensive income
(loss), net of taxes:Unrealized gains resulting from
changes in fair value ofderivative instruments, net oftaxes of $25 . . . . . . . . . . 40 40 — — — — 40 — — —
Realized gains on derivativeinstruments reclassified intoearnings, net of taxes of$24 . . . . . . . . . . . . . . . (39) (39) — — — — (39) — — —
Unrealized losses on marketablesecurities, net of taxes of$4 . . . . . . . . . . . . . . . . (18) (18) — — — — (7) — — (11)
Foreign currency translationadjustments . . . . . . . . . . . (127) (127) — — — — (127) — — —
Change in funded status ofdefined benefit planliabilities, net of taxes of$5 . . . . . . . . . . . . . . . . (8) (8) — — — — (8) — — —
Other comprehensive income(loss) . . . . . . . . . . . . . . . . (152) (152)
Comprehensive income . . . . . . . 976 $ 976
Cash dividends declared . . . . . . (531) — — — (531) — — — —Equity-based compensation
transactions, including dividendequivalents, net of taxes . . . . . 106 — — 16 (4) — 2,995 94 —
Common stock repurchases . . . . (410) — — — — — (12,390) (410) —Distributions paid to
noncontrolling interests . . . . . (56) — — — — — — — (56)Cumulative effect of change in
accounting principle . . . . . . . (1) — — — (1) — — — —Other . . . . . . . . . . . . . . . . . (1) — — — — — 12 — (1)
Balance, December 31, 2008 . . . . $6,185 630,282 $ 6 $4,558 $5,631 $ 88 (139,547) $(4,381) $283Comprehensive Income:Consolidated net income . . . . . . 1,060 $1,060 — — — 994 — — — 66Other comprehensive income
(loss), net of taxes:Unrealized losses resulting from
changes in fair value ofderivative instruments, net oftaxes of $13 . . . . . . . . . . (21) (21) — — — — (21) — — —
Realized losses on derivativeinstruments reclassified intoearnings, net of taxes of$21 . . . . . . . . . . . . . . . 32 32 — — — — 32 — — —
Unrealized gains on marketablesecurities, net of taxes of$2 . . . . . . . . . . . . . . . . 10 10 — — — — 4 — — 6
Foreign currency translationadjustments . . . . . . . . . . . 99 99 — — — — 99 — — —
Change in funded status ofdefined benefit planliabilities, net of taxes of$4 . . . . . . . . . . . . . . . . 6 6 — — — — 6 — — —
Other comprehensive income(loss) . . . . . . . . . . . . . . . . 126 126
Comprehensive income . . . . . . . 1,186 $1,186
Cash dividends declared . . . . . . (569) — — — (569) — — — —Equity-based compensation
transactions, including dividendequivalents, net of taxes . . . . . 64 — — (15) (3) — 2,610 82 —
Common stock repurchases . . . . (226) — — — — — (7,237) (226) —Distributions paid to
noncontrolling interests . . . . . (50) — — — — — — — (50)Other . . . . . . . . . . . . . . . . . 1 — — — — — 12 — 1
Balance, December 31, 2009 . . . . $6,591 630,282 $ 6 $4,543 $6,053 $ 208 (144,162) $(4,525) $306
70

TotalComprehensive
Income Shares Amounts
AdditionalPaid-InCapital
RetainedEarnings
AccumulatedOther
ComprehensiveIncome(Loss) Shares Amounts
NoncontrollingInterests
Common Stock Treasury Stock
Waste Management, Inc. Stockholders’ Equity
Balance, December 31, 2009 . . . . $6,591 630,282 $ 6 $4,543 $6,053 $ 208 (144,162) $(4,525) $306Comprehensive Income:Consolidated net income . . . . . . 1,002 $1,002 — — — 953 — — — 49Other comprehensive income
(loss), net of taxes:Unrealized losses resulting from
changes in fair value ofderivative instruments, net oftaxes of $28 . . . . . . . . . . (43) (43) — — — — (43) — — —
Realized losses on derivativeinstruments reclassified intoearnings, net of taxes of$12 . . . . . . . . . . . . . . . 18 18 — — — — 18 — — —
Unrealized gains on marketablesecurities, net of taxes of$2 . . . . . . . . . . . . . . . . 3 3 — — — — 3 — — —
Foreign currency translationadjustments . . . . . . . . . . . 49 49 — — — — 49 — — —
Change in funded status ofdefined benefit planliabilities, net of taxes of$3 . . . . . . . . . . . . . . . . (5) (5) — — — — (5) — — —
Other comprehensive income(loss) . . . . . . . . . . . . . . . . 22 22
Comprehensive income . . . . . . . 1,024 $1,024
Cash dividends declared . . . . . . (604) — — — (604) — — — —Equity-based compensation
transactions, including dividendequivalents, net of taxes . . . . . 104 — — (15) (2) — 3,832 121 —
Common stock repurchases . . . . (501) — — — — — (14,920) (501) —Distributions paid to
noncontrolling interests . . . . . (45) — — — — — — — (45)Noncontrolling interests in
acquired businesses . . . . . . . . 52 — — — — — — — 52Deconsolidation of variable
interest entities . . . . . . . . . . (31) — — — — — — — (31)Other . . . . . . . . . . . . . . . . . 1 — — — — — 14 1 —
Balance, December 31, 2010 . . . . $6,591 630,282 $ 6 $4,528 $6,400 $ 230 (155,236) $(4,904) $331
See notes to Consolidated Financial Statements.
71
WASTE MANAGEMENT, INC.
CONSOLIDATED STATEMENTS OF CHANGES IN EQUITY — (Continued)(In Millions, Except Shares in Thousands)

WASTE MANAGEMENT, INC.
NOTES TO CONSOLIDATED FINANCIAL STATEMENTSYears Ended December 31, 2010, 2009 and 2008
1. Business
The financial statements presented in this report represent the consolidation of Waste Management, Inc., aDelaware corporation; Waste Management’s wholly-owned and majority-owned subsidiaries; and certain variableinterest entities for which Waste Management or its subsidiaries are the primary beneficiary as described in Note 20.Waste Management is a holding company and all operations are conducted by its subsidiaries. When the terms “theCompany,” “we,” “us” or “our” are used in this document, those terms refer to Waste Management, Inc., itsconsolidated subsidiaries and consolidated variable interest entities. When we use the term “WM,” we are referringonly to Waste Management, Inc., the parent holding company.
We are the leading provider of comprehensive waste management services in North America. Our subsidiariesprovide collection, transfer, recycling, and disposal services. We are also a leading developer, operator and owner ofwaste-to-energy and landfill gas-to-energy facilities in the United States. Our customers include residential,commercial, industrial, and municipal customers throughout North America.
We manage and evaluate our principal operations through five Groups. Our four geographic Groups,comprised of our Eastern, Midwest, Southern and Western Groups, provide collection, transfer, disposal (in bothsolid waste and hazardous waste landfills) and recycling services. Our fifth Group is the Wheelabrator Group,which provides waste-to-energy services and manages waste-to-energy facilities and independent power productionplants. We also provide additional services that are not managed through our five Groups, which are presented inthis report as “Other.” Additional information related to our segments can be found in Note 21.
2. Accounting Changes and Reclassifications
Accounting Changes
Consolidation of Variable Interest Entities — In June 2009, the Financial Accounting Standards Board, orFASB, issued revised authoritative guidance associated with the consolidation of variable interest entities. The newguidance primarily uses a qualitative approach for determining whether an enterprise is the primary beneficiary of avariable interest entity, and is, therefore, required to consolidate the entity. This new guidance generally defines theprimary beneficiary as the entity that has (i) the power to direct the activities of the variable interest entity that canmost significantly impact the entity’s performance and (ii) the obligation to absorb losses and the right to receivebenefits from the variable interest entity that could be significant from the perspective of the entity. The newguidance also requires that we continually reassess whether we are the primary beneficiary of a variable interestentity rather than conducting a reassessment only upon the occurrence of specific events.
As a result of our implementation of this guidance, effective January 1, 2010, we deconsolidated certaincapping, closure, post-closure and environmental remediation trusts because we share power over significantactivities of these trusts with others. Our financial interests in these entities are discussed in Note 20. Thedeconsolidation of these trusts has not materially affected our financial position, results of operations or cash flowsduring the periods presented.
Business Combinations — In December 2007, the FASB issued revisions to the authoritative guidanceassociated with business combinations. This guidance clarified and revised the principles for how an acquirerrecognizes and measures identifiable assets acquired, liabilities assumed, and any noncontrolling interest in theacquiree. This guidance also addressed the recognition and measurement of goodwill acquired in businesscombinations and expanded disclosure requirements related to business combinations. Effective January 1,2009, we adopted the FASB’s revised guidance associated with business combinations. The portions of thisguidance that relate to business combinations completed before January 1, 2009 did not have a material impact onour consolidated financial statements. Further, business combinations completed subsequent to January 1, 2009,which are discussed in Note 19, have not been material to our financial position, results of operations or cash flows.However, to the extent that future business combinations are material, our adoption of the FASB’s revisedauthoritative guidance associated with business combinations may significantly impact our accounting andreporting for future acquisitions, principally as a result of (i) expanded requirements to value acquired assets,
72

liabilities and contingencies at their fair values when such amounts can be determined and (ii) the requirement thatacquisition-related transaction and restructuring costs be expensed as incurred rather than capitalized as a part of thecost of the acquisition.
Noncontrolling Interests in Consolidated Financial Statements — In December 2007, the FASB issuedauthoritative guidance that established accounting and reporting standards for noncontrolling interests in subsid-iaries and for the de-consolidation of a subsidiary. The guidance also established that a noncontrolling interest in asubsidiary is an ownership interest in the consolidated entity that should be reported as equity in the consolidatedfinancial statements. We adopted this guidance on January 1, 2009. The presentation and disclosure requirements ofthis guidance, which must be applied retrospectively for all periods presented, resulted in reclassifications to ourprior period consolidated financial information and the remeasurement of our 2008 effective tax rate, which isdiscussed in Note 9.
Fair Value Measurements — In September 2006, the FASB issued authoritative guidance associated with fairvalue measurements. This guidance defined fair value, established a framework for measuring fair value, andexpanded disclosures about fair value measurements. In February 2008, the FASB delayed the effective date of theguidance for all non-financial assets and non-financial liabilities, except those that are measured at fair value on arecurring basis. Accordingly, we adopted this guidance for assets and liabilities recognized at fair value on arecurring basis effective January 1, 2008 and adopted the guidance for non-financial assets and liabilities measuredon a non-recurring basis effective January 1, 2009. The application of the fair value framework did not have amaterial impact on our consolidated financial position, results of operations or cash flows.
Employers’ Accounting for Defined Benefit Pension and Other Post-retirement Plans — In September 2006,the FASB issued revisions to the authoritative guidance associated with the accounting and reporting of post-retirement benefit plans. This guidance required companies to recognize the overfunded or underfunded status oftheir defined benefit pension and other post-retirement plans as an asset or liability and to recognize changes in thatfunded status through comprehensive income in the year in which the changes occur. We adopted these recognitionprovisions effective December 31, 2006. The FASB’s revised guidance also required companies to measure thefunded status of defined benefit pension and other post-retirement plans as of their year-end reporting date. Thesemeasurement date provisions were effective for us as of December 31, 2008. We applied the measurementprovisions by measuring our benefit obligations as of September 30, 2007, our prior measurement date, andrecognizing a pro-rata share of net benefit costs for the transition period from October 1, 2007 to December 31, 2008as a cumulative effect of change in accounting principle in retained earnings as of December 31, 2008. Theapplication of the recognition and measurement provisions of this revised authoritative guidance did not have amaterial impact on our financial position or results of operations for the periods presented.
Subsequent Events — We have evaluated subsequent events through the date and time the financial statementswere issued. No material subsequent events have occurred since December 31, 2010 that required recognition ordisclosure in our current period financial statements.
Reclassifications
Certain minor reclassifications have been made to our prior period consolidated financial information in orderto conform to the current year presentation.
3. Summary of Significant Accounting Policies
Principles of Consolidation
The accompanying Consolidated Financial Statements include the accounts of WM, its wholly-owned andmajority-owned subsidiaries and certain variable interest entities for which we have determined that we are theprimary beneficiary. All material intercompany balances and transactions have been eliminated. Investments inentities in which we do not have a controlling financial interest are accounted for under either the equity method orcost method of accounting, as appropriate.
73
WASTE MANAGEMENT, INC.
NOTES TO CONSOLIDATED FINANCIAL STATEMENTS — (Continued)

Estimates and Assumptions
In preparing our financial statements, we make numerous estimates and assumptions that affect the accountingfor and recognition and disclosure of assets, liabilities, equity, revenues and expenses. We must make theseestimates and assumptions because certain information that we use is dependent on future events, cannot becalculated with a high degree of precision from data available or simply cannot be readily calculated based ongenerally accepted methods. In some cases, these estimates are particularly difficult to determine and we mustexercise significant judgment. In preparing our financial statements, the most difficult, subjective and complexestimates and the assumptions that present the greatest amount of uncertainty relate to our accounting for landfills,environmental remediation liabilities, asset impairments, deferred income taxes, and reserves associated with ourinsured and self-insured claims. Each of these items is discussed in additional detail below. Actual results coulddiffer materially from the estimates and assumptions that we use in the preparation of our financial statements.
Cash and Cash Equivalents
Cash and cash equivalents consist primarily of cash on deposit and money market funds that invest inU.S. government obligations with original maturities of three months or less.
Concentrations of Credit Risk
Financial instruments that potentially subject us to concentrations of credit risk consist primarily of cash andcash equivalents, investments held within our trust funds and escrow accounts, accounts receivable and derivativeinstruments. We make efforts to control our exposure to credit risk associated with these instruments by (i) placingour assets and other financial interests with a diverse group of credit-worthy financial institutions; (ii) holding high-quality financial instruments while limiting investments in any one instrument; and (iii) maintaining strict policiesover credit extension that include credit evaluations, credit limits and monitoring procedures, although generally wedo not have collateral requirements for credit extensions. We also control our exposure associated with tradereceivables by discontinuing service, to the extent allowable, to non-paying customers. However, our overall creditrisk associated with trade receivables is limited due to the large number of geographically diverse customers weservice. At December 31, 2010 and 2009, no single customer represented greater than 5% of total accountsreceivable.
Trade and Other Receivables
Our receivables are recorded when billed or when cash is advanced and represent claims against third partiesthat will be settled in cash. The carrying value of our receivables, net of the allowance for doubtful accounts,represents the estimated net realizable value. We estimate our allowance for doubtful accounts based on historicalcollection trends; type of customer, such as municipal or commercial; the age of outstanding receivables; andexisting economic conditions. If events or changes in circumstances indicate that specific receivable balances maybe impaired, further consideration is given to the collectibility of those balances and the allowance is adjustedaccordingly. Past-due receivable balances are written off when our internal collection efforts have been unsuc-cessful. Also, we recognize interest income on long-term interest-bearing notes receivable as the interest accruesunder the terms of the notes.
Landfill Accounting
Cost Basis of Landfill Assets — We capitalize various costs that we incur to make a landfill ready to acceptwaste. These costs generally include expenditures for land (including the landfill footprint and required landfillbuffer property); permitting; excavation; liner material and installation; landfill leachate collection systems; landfillgas collection systems; environmental monitoring equipment for groundwater and landfill gas; and directly relatedengineering, capitalized interest, on-site road construction and other capital infrastructure costs. The cost basis ofour landfill assets also includes asset retirement costs, which represent estimates of future costs associated withlandfill capping, closure and post-closure activities. These costs are discussed below.
74
WASTE MANAGEMENT, INC.
NOTES TO CONSOLIDATED FINANCIAL STATEMENTS — (Continued)

Capping, Closure and Post-Closure Costs — Following is a description of our asset retirement activities andour related accounting:
• Capping — Involves the installation of flexible membrane liners and geosynthetic clay liners, drainage andcompacted soil layers and topsoil over areas of a landfill where total airspace capacity has been consumed.Capping asset retirement obligations are recorded on a units-of-consumption basis as airspace is consumedrelated to the specific capping event with a corresponding increase in the landfill asset. Each capping event isaccounted for as a discrete obligation and recorded as an asset and a liability based on estimates of thediscounted cash flows and capacity associated with each capping event.
• Closure — Includes the construction of the final portion of methane gas collection systems (when required),demobilization and routine maintenance costs. These are costs incurred after the site ceases to accept waste,but before the landfill is certified as closed by the applicable state regulatory agency. These costs are accruedas an asset retirement obligation as airspace is consumed over the life of the landfill with a correspondingincrease in the landfill asset. Closure obligations are accrued over the life of the landfill based on estimates ofthe discounted cash flows associated with performing closure activities.
• Post-Closure — Involves the maintenance and monitoring of a landfill site that has been certified closed bythe applicable regulatory agency. Generally, we are required to maintain and monitor landfill sites for a30-year period. These maintenance and monitoring costs are accrued as an asset retirement obligation asairspace is consumed over the life of the landfill with a corresponding increase in the landfill asset. Post-closure obligations are accrued over the life of the landfill based on estimates of the discounted cash flowsassociated with performing post-closure activities.
We develop our estimates of these obligations using input from our operations personnel, engineers andaccountants. Our estimates are based on our interpretation of current requirements and proposed regulatory changesand are intended to approximate fair value. Absent quoted market prices, the estimate of fair value is based on thebest available information, including the results of present value techniques. In many cases, we contract with thirdparties to fulfill our obligations for capping, closure and post-closure. We use historical experience, professionalengineering judgment and quoted and actual prices paid for similar work to determine the fair value of theseobligations. We are required to recognize these obligations at market prices whether we plan to contract with thirdparties or perform the work ourselves. In those instances where we perform the work with internal resources, theincremental profit margin realized is recognized as a component of operating income when the work is performed.
Once we have determined the capping, closure and post-closure costs, we inflate those costs to the expectedtime of payment and discount those expected future costs back to present value. During the years endedDecember 31, 2010, 2009 and 2008, we inflated these costs in current dollars until the expected time of paymentusing an inflation rate of 2.5%. We discount these costs to present value using the credit-adjusted, risk-free rateeffective at the time an obligation is incurred, consistent with the expected cash flow approach. Any changes inexpectations that result in an upward revision to the estimated cash flows are treated as a new liability anddiscounted at the current rate while downward revisions are discounted at the historical weighted-average rate of therecorded obligation. As a result, the credit-adjusted, risk-free discount rate used to calculate the present value of anobligation is specific to each individual asset retirement obligation. The weighted-average rate applicable to ourasset retirement obligations at December 31, 2010 is between 6.0% and 8.0%, the range of the credit-adjusted, risk-free discount rates effective since we adopted the FASB’s authoritative guidance related to asset retirementobligations in 2003. We expect to apply a credit-adjusted, risk-free discount rate of 5.5% to liabilities incurred in thefirst quarter of 2011.
We record the estimated fair value of capping, closure and post-closure liabilities for our landfills based on thecapacity consumed through the current period. The fair value of capping obligations is developed based on ourestimates of the airspace consumed to date for each capping event and the expected timing of each capping event.The fair value of closure and post-closure obligations is developed based on our estimates of the airspace consumedto date for the entire landfill and the expected timing of each closure and post-closure activity. Because these
75
WASTE MANAGEMENT, INC.
NOTES TO CONSOLIDATED FINANCIAL STATEMENTS — (Continued)

obligations are measured at estimated fair value using present value techniques, changes in the estimated cost ortiming of future capping, closure and post-closure activities could result in a material change in these liabilities,related assets and results of operations. We assess the appropriateness of the estimates used to develop our recordedbalances annually, or more often if significant facts change.
Changes in inflation rates or the estimated costs, timing or extent of future capping and closure and post-closure activities typically result in both (i) a current adjustment to the recorded liability and landfill asset; and (ii) achange in liability and asset amounts to be recorded prospectively over either the remaining capacity of the relateddiscrete capping event or the remaining permitted and expansion airspace (as defined below) of the landfill. Anychanges related to the capitalized and future cost of the landfill assets are then recognized in accordance with ouramortization policy, which would generally result in amortization expense being recognized prospectively over theremaining capacity of the capping event or the remaining permitted and expansion airspace of the landfill, asappropriate. Changes in such estimates associated with airspace that has been fully utilized result in an adjustmentto the recorded liability and landfill assets with an immediate corresponding adjustment to landfill airspaceamortization expense.
During the years ended December 31, 2010, 2009 and 2008, adjustments associated with changes in ourexpectations for the timing and cost of future capping, closure and post-closure of fully utilized airspace resulted in$13 million, $14 million and $3 million in net credits to landfill airspace amortization expense, respectively, withthe majority of these credits resulting from revised estimates associated with capping changes. In managing ourlandfills, our engineers look for ways to reduce or defer our construction costs, including capping costs. The benefitrecognized in these years was generally the result of (i) concerted efforts to improve the operating efficiencies of ourlandfills and volume declines, both of which have allowed us to delay spending for capping activities; (ii) effectivelymanaging the cost of capping material and construction; or (iii) landfill expansions that resulted in reduced ordeferred capping costs.
Interest accretion on capping, closure and post-closure liabilities is recorded using the effective interestmethod and is recorded as capping, closure and post-closure expense, which is included in “Operating” costs andexpenses within our Consolidated Statements of Operations.
Amortization of Landfill Assets — The amortizable basis of a landfill includes (i) amounts previouslyexpended and capitalized; (ii) capitalized landfill capping, closure and post-closure costs; (iii) projections offuture purchase and development costs required to develop the landfill site to its remaining permitted and expansioncapacity; and (iv) projected asset retirement costs related to landfill capping, closure and post-closure activities.
Amortization is recorded on a units-of-consumption basis, applying expense as a rate per ton. The rate per tonis calculated by dividing each component of the amortizable basis of a landfill by the number of tons needed to fillthe corresponding asset’s airspace. For landfills that we do not own, but operate through operating or leasearrangements, the rate per ton is calculated based on expected capacity to be utilized over the lesser of thecontractual term of the underlying agreement or the life of the landfill.
We apply the following guidelines in determining a landfill’s remaining permitted and expansion airspace:
• Remaining Permitted Airspace — Our engineers, in consultation with third-party engineering consultantsand surveyors, are responsible for determining remaining permitted airspace at our landfills. The remainingpermitted airspace is determined by an annual survey, which is then used to compare the existing landfilltopography to the expected final landfill topography.
• Expansion Airspace — We also include currently unpermitted expansion airspace in our estimate ofremaining permitted and expansion airspace in certain circumstances. First, to include airspace associatedwith an expansion effort, we must generally expect the initial expansion permit application to be submitted
76
WASTE MANAGEMENT, INC.
NOTES TO CONSOLIDATED FINANCIAL STATEMENTS — (Continued)

within one year, and the final expansion permit to be received within five years. Second, we must believe thesuccess of obtaining the expansion permit is likely, considering the following criteria:
• Personnel are actively working on the expansion of an existing landfill, including efforts to obtain land useand local, state or provincial approvals;
• It is likely that the approvals will be received within the normal application and processing time periodsfor approvals in the jurisdiction in which the landfill is located;
• We have a legal right to use or obtain land to be included in the expansion plan;
• There are no significant known technical, legal, community, business, or political restrictions or similarissues that could impair the success of such expansion;
• Financial analysis has been completed, and the results demonstrate that the expansion has a positivefinancial and operational impact; and
• Airspace and related costs, including additional closure and post-closure costs, have been estimated basedon conceptual design.
For unpermitted airspace to be initially included in our estimate of remaining permitted and expansionairspace, the expansion effort must meet all of the criteria listed above. These criteria are evaluated by our field-based engineers, accountants, managers and others to identify potential obstacles to obtaining the permits. Once theunpermitted airspace is included, our policy provides that airspace may continue to be included in remainingpermitted and expansion airspace even if these criteria are no longer met, based on the facts and circumstances of aspecific landfill. In these circumstances, continued inclusion must be approved through a landfill-specific reviewprocess that includes approval by our Chief Financial Officer and a review by the Audit Committee of our Board ofDirectors on a quarterly basis. Of the 33 landfill sites with expansions at December 31, 2010, 14 landfills requiredthe Chief Financial Officer to approve the inclusion of the unpermitted airspace. Eight of these landfills requiredapproval by our Chief Financial Officer because of community or political opposition that could impede theexpansion process. The remaining six landfills required approval primarily due to the permit application processesnot meeting the one- or five-year requirements.
When we include the expansion airspace in our calculations of remaining permitted and expansion airspace,we also include the projected costs for development, as well as the projected asset retirement costs related tocapping, closure and post-closure of the expansion in the amortization basis of the landfill.
Once the remaining permitted and expansion airspace is determined in cubic yards, an airspace utilizationfactor, or AUF, is established to calculate the remaining permitted and expansion capacity in tons. The AUF isestablished using the measured density obtained from previous annual surveys and is then adjusted to account forsettlement. The amount of settlement that is forecasted will take into account several site-specific factors includingcurrent and projected mix of waste type, initial and projected waste density, estimated number of years of liferemaining, depth of underlying waste, anticipated access to moisture through precipitation or recirculation oflandfill leachate, and operating practices. In addition, the initial selection of the AUF is subject to a subsequentmulti-level review by our engineering group, and the AUF used is reviewed on a periodic basis and revised asnecessary. Our historical experience generally indicates that the impact of settlement at a landfill is greater later inthe life of the landfill when the waste placed at the landfill approaches its highest point under the permitrequirements.
After determining the costs and remaining permitted and expansion capacity at each of our landfills, wedetermine the per ton rates that will be expensed as waste is received and deposited at the landfill by dividing thecosts by the corresponding number of tons. We calculate per ton amortization rates for each landfill for assetsassociated with each capping event, for assets related to closure and post-closure activities and for all other costscapitalized or to be capitalized in the future. These rates per ton are updated annually, or more often, as significantfacts change.
77
WASTE MANAGEMENT, INC.
NOTES TO CONSOLIDATED FINANCIAL STATEMENTS — (Continued)

It is possible that actual results, including the amount of costs incurred, the timing of capping, closure and post-closure activities, our airspace utilization or the success of our expansion efforts could ultimately turn out to besignificantly different from our estimates and assumptions. To the extent that such estimates, or related assump-tions, prove to be significantly different than actual results, lower profitability may be experienced due to higheramortization rates or higher expenses, or higher profitability may result if the opposite occurs. Most significantly, ifit is determined that expansion capacity should no longer be considered in calculating the recoverability of a landfillasset, we may be required to recognize an asset impairment or incur significantly higher amortization expense. If itis determined that the likelihood of receiving an expansion permit has become remote, the capitalized costs relatedto the expansion effort are expensed immediately.
Environmental Remediation Liabilities
We are subject to an array of laws and regulations relating to the protection of the environment. Under currentlaws and regulations, we may have liabilities for environmental damage caused by operations, or for damage causedby conditions that existed before we acquired a site. These liabilities include potentially responsible party (“PRP”)investigations, settlements, and certain legal and consultant fees, as well as costs directly associated with siteinvestigation and clean up, such as materials, external contractor costs and incremental internal costs directlyrelated to the remedy. We provide for expenses associated with environmental remediation obligations when suchamounts are probable and can be reasonably estimated. We routinely review and evaluate sites that requireremediation and determine our estimated cost for the likely remedy based on a number of estimates andassumptions.
Where it is probable that a liability has been incurred, we estimate costs required to remediate sites based onsite-specific facts and circumstances. We routinely review and evaluate sites that require remediation, consideringwhether we were an owner, operator, transporter, or generator at the site, the amount and type of waste hauled to thesite and the number of years we were associated with the site. Next, we review the same type of information withrespect to other named and unnamed PRPs. Estimates of the costs for the likely remedy are then either developedusing our internal resources or by third-party environmental engineers or other service providers. Internallydeveloped estimates are based on:
• Management’s judgment and experience in remediating our own and unrelated parties’ sites;
• Information available from regulatory agencies as to costs of remediation;
• The number, financial resources and relative degree of responsibility of other PRPs who may be liable forremediation of a specific site; and
• The typical allocation of costs among PRPs, unless the actual allocation has been determined.
Estimating our degree of responsibility for remediation is inherently difficult. We recognize and accrue for anestimated remediation liability only when we determine that such liability is both probable and reasonablyestimable. Determining the method and ultimate cost of remediation requires that a number of assumptions bemade. There can sometimes be a range of reasonable estimates of the costs associated with the investigation of theextent of environmental impact and identification of likely site-remediation alternatives. In these cases, we use theamount within a range that constitutes our best estimate. If no amount within the range appears to be a betterestimate than any other, we use the amount that is the low end of such range. If we used the high ends of such ranges,our aggregate potential liability would be approximately $150 million higher than the $284 million recorded in theConsolidated Financial Statements as of December 31, 2010. Our ultimate responsibility may differ materially fromcurrent estimates. It is possible that technological, regulatory or enforcement developments, the results ofenvironmental studies, the inability to identify other PRPs, the inability of other PRPs to contribute to thesettlements of such liabilities, or other factors could require us to record additional liabilities. Our ongoing review ofour remediation liabilities could result in revisions to our accruals that could cause upward or downwardadjustments to income from operations. These adjustments could be material in any given period.
78
WASTE MANAGEMENT, INC.
NOTES TO CONSOLIDATED FINANCIAL STATEMENTS — (Continued)

Where we believe that both the amount of a particular environmental remediation liability and the timing of thepayments are reliably determinable, we inflate the cost in current dollars (by 2.5% at both December 31, 2010 and2009) until the expected time of payment and discount the cost to present value using a risk-free discount rate,which is based on the rate for United States Treasury bonds with a term approximating the weighted average perioduntil settlement of the underlying obligation. We determine the risk-free discount rate and the inflation rate on anannual basis unless interim changes would significantly impact our results of operations. For remedial liabilitiesthat have been discounted, we include interest accretion, based on the effective interest method, in “Operating”costs and expenses in our Consolidated Statements of Operations. The following table summarizes the impacts ofrevisions in the risk-free discount rate applied to our environmental remediation liabilities and recovery assetsduring the reported periods (in millions) and the risk-free discount rate applied as of each reporting date:
2010 2009 2008Years Ended December 31,
Charge (reduction) to Operating expenses(a) . . . . . . . . . . . . . . . . . . . . . . . $ 2 $ (35) $ 33
Risk-free discount rate applied to environmental remediation liabilities andrecovery assets . . . . . . . . . . . . . . . . . . . . . . . . . . . . . . . . . . . . . . . . . . . 3.50% 3.75% 2.25%
(a) In 2009, $9 million of the reduction in “Operating” expenses was attributable to noncontrolling interests, andin 2008, $6 million of the charge to “Operating” expenses was attributable to noncontrolling interests.
The portion of our recorded environmental remediation liabilities that has never been subject to inflation ordiscounting, as the amounts and timing of payments are not readily determinable, was $81 million at December 31,2010 and $44 million at December 31, 2009. Had we not inflated and discounted any portion of our environmentalremediation liability, the amount recorded would have increased by $15 million and $20 million at December 31,2010 and 2009, respectively.
Property and Equipment (exclusive of landfills, discussed above)
We record property and equipment at cost. Expenditures for major additions and improvements are capitalizedand maintenance activities are expensed as incurred. We depreciate property and equipment over the estimateduseful life of the asset using the straight-line method. We assume no salvage value for our depreciable property andequipment. When property and equipment are retired, sold or otherwise disposed of, the cost and accumulateddepreciation are removed from our accounts and any resulting gain or loss is included in results of operations as anoffset or increase to operating expense for the period.
The estimated useful lives for significant property and equipment categories are as follows (in years):Useful Lives
Vehicles — excluding rail haul cars . . . . . . . . . . . . . . . . . . . . . . . . . . . . . . . . . . . . . . . . 3 to 10
Vehicles — rail haul cars . . . . . . . . . . . . . . . . . . . . . . . . . . . . . . . . . . . . . . . . . . . . . . . 10 to 20
Machinery and equipment — including containers . . . . . . . . . . . . . . . . . . . . . . . . . . . . . 3 to 30
Buildings and improvements — excluding waste-to-energy facilities . . . . . . . . . . . . . . . . 5 to 40
Waste-to-energy facilities and related equipment . . . . . . . . . . . . . . . . . . . . . . . . . . . . . . up to 50
Furniture, fixtures and office equipment . . . . . . . . . . . . . . . . . . . . . . . . . . . . . . . . . . . . 3 to 10
We include capitalized costs associated with developing or obtaining internal-use software within furniture,fixtures and office equipment. These costs include direct external costs of materials and services used in developingor obtaining the software and internal costs for employees directly associated with the software developmentproject. As of December 31, 2010, capitalized costs for software placed in service, net of accumulated depreciation,were $44 million. In addition, our furniture, fixtures and office equipment includes $51 million as of December 31,2010 and $46 million as of December 31, 2009 for costs incurred for software under development.
79
WASTE MANAGEMENT, INC.
NOTES TO CONSOLIDATED FINANCIAL STATEMENTS — (Continued)

Leases
We lease property and equipment in the ordinary course of our business. Our most significant lease obligationsare for property and equipment specific to our industry, including real property operated as a landfill, transfer stationor waste-to-energy facility. Our leases have varying terms. Some may include renewal or purchase options,escalation clauses, restrictions, penalties or other obligations that we consider in determining minimum leasepayments. The leases are classified as either operating leases or capital leases, as appropriate.
Operating Leases (excluding landfills discussed below) — The majority of our leases are operating leases.This classification generally can be attributed to either (i) relatively low fixed minimum lease payments as a resultof real property lease obligations that vary based on the volume of waste we receive or process or (ii) minimum leaseterms that are much shorter than the assets’ economic useful lives. Management expects that in the normal course ofbusiness our operating leases will be renewed, replaced by other leases, or replaced with fixed asset expenditures.Our rent expense during each of the last three years and our future minimum operating lease payments for each ofthe next five years for which we are contractually obligated as of December 31, 2010 are disclosed in Note 11.
Capital Leases (excluding landfills discussed below) — Assets under capital leases are capitalized usinginterest rates determined at the inception of each lease and are amortized over either the useful life of the asset or thelease term, as appropriate, on a straight-line basis. The present value of the related lease payments is recorded as adebt obligation. Our future minimum annual capital lease payments are included in our total future debt obligationsas disclosed in Note 7.
Landfill Leases — From an operating perspective, landfills that we lease are similar to landfills we ownbecause generally we own the landfill’s operating permit and will operate the landfill for the entire lease term, whichin many cases is the life of the landfill. As a result, our landfill leases are generally capital leases. The mostsignificant portion of our rental obligations for landfill leases is contingent upon operating factors such as disposalvolumes and often there are no contractual minimum rental obligations. Contingent rental obligations are expensedas incurred. For landfill capital leases that provide for minimum contractual rental obligations, we record thepresent value of the minimum obligation as part of the landfill asset, which is amortized on a units-of-consumptionbasis over the shorter of the lease term or the life of the landfill.
Acquisitions
We generally recognize assets acquired and liabilities assumed in business combinations, including contingentassets and liabilities, based on fair value estimates as of the date of acquisition.
Contingent Consideration — In certain acquisitions, we agree to pay additional amounts to sellers contingentupon achievement by the acquired businesses of certain negotiated goals, such as targeted revenue levels, targeteddisposal volumes or the issuance of permits for expanded landfill airspace. For acquisitions completed in 2009 and2010, we have recognized liabilities for these contingent obligations based on their estimated fair value at the dateof acquisition with any differences between the acquisition-date fair value and the ultimate settlement of theobligations being recognized as an adjustment to income from operations. For acquisitions completed before 2009,these obligations were recognized as incurred and accounted for as an adjustment to the initial purchase price of theacquired assets.
Acquired Assets and Assumed Liabilities — Assets and liabilities arising from contingencies such as pre-acquisition environmental matters and litigation are recognized at their acquisition-date fair value when theirrespective fair values can be determined. If the fair values of such contingencies cannot be determined, they arerecognized at the acquisition date if the contingencies are probable and an amount can be reasonably estimated.Acquisition-date fair value estimates are revised as necessary and accounted for as an adjustment to income fromoperations if, and when, additional information regarding these contingencies becomes available to further defineand quantify assets acquired and liabilities assumed.
80
WASTE MANAGEMENT, INC.
NOTES TO CONSOLIDATED FINANCIAL STATEMENTS — (Continued)

Beginning in 2009, all acquisition-related transaction costs have been expensed as incurred. For acquisitionscompleted before 2009, direct costs incurred for a business combination were accounted for as part of the cost of theacquired business.
Goodwill and Other Intangible Assets
Goodwill is the excess of our purchase cost over the fair value of the net assets of acquired businesses. We donot amortize goodwill, but as discussed in the “Asset Impairments” section below, we assess our goodwill forimpairment at least annually.
Other intangible assets consist primarily of customer contracts, customer lists, covenants not-to-compete,licenses, permits (other than landfill permits, as all landfill-related intangible assets are combined with landfilltangible assets and amortized using our landfill amortization policy), and other contracts. Other intangible assets arerecorded at cost and are generally amortized using either a 150% declining balance approach or a straight-line basisas we determine appropriate. Customer contracts and customer lists are typically amortized over ten years.Covenants not-to-compete are amortized over the term of the non-compete covenant, which is generally two to fiveyears. Licenses, permits and other contracts are amortized over the definitive terms of the related agreements. If theunderlying agreement does not contain definitive terms and the useful life is determined to be indefinite, the asset isnot amortized.
Asset Impairments
We monitor the carrying value of our long-lived assets for potential impairment and test the recoverability ofsuch assets whenever events or changes in circumstances indicate that their carrying amounts may not berecoverable. These events or changes in circumstances are referred to as impairment indicators. If an impairmentindicator occurs, we perform a test of recoverability by comparing the carrying value of the asset or asset group to itsundiscounted expected future cash flows. If cash flows cannot be separately and independently identified for asingle asset, we will determine whether an impairment has occurred for the group of assets for which we can identifythe projected cash flows. If the carrying values are in excess of undiscounted expected future cash flows, wemeasure any impairment by comparing the fair value of the asset or asset group to its carrying value. Fair value isgenerally determined by considering (i) internally developed discounted projected cash flow analysis of the asset orasset group; (ii) actual third-party valuations; and/or (iii) information available regarding the current market forsimilar assets. If the fair value of an asset or asset group is determined to be less than the carrying amount of the assetor asset group, an impairment in the amount of the difference is recorded in the period that the impairment indicatoroccurs and is included in the “(Income) expense from divestitures, asset impairments and unusual items” line itemin our Consolidated Statement of Operations. Estimating future cash flows requires significant judgment andprojections may vary from the cash flows eventually realized, which could impact our ability to accurately assesswhether an asset has been impaired.
There are additional considerations for impairments of landfills and goodwill, as described below.
Landfills — Certain impairment indicators require significant judgment and understanding of the wasteindustry when applied to landfill development or expansion projects. For example, a regulator may initially deny alandfill expansion permit application though the expansion permit is ultimately granted. In addition, managementmay periodically divert waste from one landfill to another to conserve remaining permitted landfill airspace.Therefore, certain events could occur in the ordinary course of business that are not necessarily consideredindicators of impairment of our landfill assets due to the unique nature of the waste industry.
Goodwill — At least annually, we assess our goodwill for impairment. We assess whether an impairmentexists by comparing the fair value of each operating segment to its carrying value, including goodwill. We use acombination of two valuation methods, a market approach and an income approach, to estimate the fair value of ouroperating segments. Fair value computed by these two methods is arrived at using a number of factors, includingprojected future operating results, economic projections, anticipated future cash flows, comparable marketplacedata and the cost of capital. There are inherent uncertainties related to these factors and to our judgment in applying
81
WASTE MANAGEMENT, INC.
NOTES TO CONSOLIDATED FINANCIAL STATEMENTS — (Continued)

them to this analysis. However, we believe that these two methods provide a reasonable approach to estimating thefair value of our operating segments.
The market approach estimates fair value by measuring the aggregate market value of publicly-tradedcompanies with similar characteristics to our business as a multiple of their reported cash flows. We then apply thatmultiple to our operating segments’ cash flows to estimate their fair values. We believe that this approach isappropriate because it provides a fair value estimate using valuation inputs from entities with operations andeconomic characteristics comparable to our operating segments.
The income approach is based on the long-term projected future cash flows of our operating segments. Wediscount the estimated cash flows to present value using a weighted-average cost of capital that considers factorssuch as the timing of the cash flows and the risks inherent in those cash flows. We believe that this approach isappropriate because it provides a fair value estimate based upon our operating segments’ expected long-termperformance considering the economic and market conditions that generally affect our business.
Additional impairment assessments may be performed on an interim basis if we encounter events or changes incircumstances that would indicate that, more likely than not, the carrying value of goodwill has been impaired.Refer to Note 6 for additional information related to goodwill impairment considerations made during the reportedperiods.
Restricted Trust and Escrow Accounts
As of December 31, 2010, our restricted trust and escrow accounts consist principally of (i) funds deposited forpurposes of settling landfill capping, closure, post-closure and environmental remediation obligations; and (ii) fundsreceived from the issuance of tax-exempt bonds held in trust for the construction of various projects or facilities. Asof December 31, 2010 and 2009, we had $146 million and $306 million, respectively, of restricted trust and escrowaccounts, which are primarily included in long-term “Other assets” in our Consolidated Balance Sheets. Thedecrease in restricted trust and escrow accounts from December 31, 2009 is due to our implementation of revisedaccounting guidance related to the consolidation of variable interest entities. Additional information can be found inNote 2 and Note 20.
Capping, Closure, Post-Closure and Environmental Remediation Funds — At several of our landfills, weprovide financial assurance by depositing cash into restricted trust funds or escrow accounts for purposes of settlingcapping, closure, post-closure and environmental remediation obligations. Balances maintained in these trust fundsand escrow accounts will fluctuate based on (i) changes in statutory requirements; (ii) future deposits made tocomply with contractual arrangements; (iii) the ongoing use of funds for qualifying closure, post-closure andenvironmental remediation activities; (iv) acquisitions or divestitures of landfills; and (v) changes in the fair valueof the financial instruments held in the trust fund or escrow accounts.
Tax-Exempt Bond Funds — We obtain funds from the issuance of industrial revenue bonds for the constructionof collection and disposal facilities and for equipment necessary to provide waste management services. Proceedsfrom these arrangements are directly deposited into trust accounts, and we do not have the ability to use the funds inregular operating activities. Accordingly, these borrowings are treated as non-cash financing activities and areexcluded from our Consolidated Statements of Cash Flows. As our construction and equipment expenditures aredocumented and approved by the applicable bond trustee, the funds are released and we receive a cashreimbursement. These cash reimbursements are reported in the Consolidated Statements of Cash Flows as aninvesting activity when the cash is released from the trust funds. Generally, the funds are fully expended within afew years of the debt issuance. When the debt matures, we repay our obligation with cash on hand and the debtrepayments are included as a financing activity in the Consolidated Statements of Cash Flows.
Foreign Currency
We have operations in Canada. The functional currency of our Canadian subsidiaries is Canadian dollars. Theassets and liabilities of our foreign operations are translated to U.S. dollars using the exchange rate at the balance
82
WASTE MANAGEMENT, INC.
NOTES TO CONSOLIDATED FINANCIAL STATEMENTS — (Continued)

sheet date. Revenues and expenses are translated to U.S. dollars using the average exchange rate during the period.The resulting translation difference is reflected as a component of comprehensive income.
Derivative Financial Instruments
We primarily use derivative financial instruments to manage our risk associated with fluctuations in interestrates, foreign currency exchange rates and market prices for electricity. We use interest rate swaps to maintain astrategic portion of our long-term debt obligations at variable, market-driven interest rates. In 2009, we entered intointerest rate derivatives in anticipation of senior note issuances planned for 2010 through 2014 to effectively lock ina fixed interest rate for those anticipated issuances. Foreign currency exchange rate derivatives are used to hedge ourexposure to changes in exchange rates for anticipated cash transactions between WM Holdings and its Canadiansubsidiaries. We use electricity commodity derivatives to mitigate the variability in our revenues and cash flowscaused by fluctuations in the market prices for electricity.
We obtain current valuations of our interest rate, foreign currency and electricity commodity hedginginstruments from third-party pricing models. The estimated fair values of derivatives used to hedge risks fluctuateover time and should be viewed in relation to the underlying hedged transaction and the overall management of ourexposure to fluctuations in the underlying risks. The fair value of derivatives is included in other current assets, otherlong-term assets, accrued liabilities or other long-term liabilities, as appropriate. Any ineffectiveness present ineither fair value or cash flow hedges is recognized immediately in earnings without offset. There was no significantineffectiveness in 2010, 2009 or 2008.
• Interest Rate Derivatives — Our “receive fixed, pay variable” interest rate swaps associated with out-standing fixed-rate senior notes have been designated as fair value hedges for accounting purposes.Accordingly, derivative assets are accounted for as an increase in the carrying value of our underlyingdebt obligations and derivative liabilities are accounted for as a decrease in the carrying value of ourunderlying debt instruments. These fair value adjustments are deferred and recognized as an adjustment tointerest expense over the remaining term of the hedged instruments. Treasury locks and forward-startingswaps executed in 2009 were designated as cash flow hedges for accounting purposes. Unrealized changes inthe fair value of these derivative instruments are recorded in “Accumulated other comprehensive income”within the equity section of our Consolidated Balance Sheets. The associated balance in other compre-hensive income will be reclassified to earnings as the hedged cash flows occur. The impacts of our use ofinterest rate derivatives on the carrying value of our debt, accumulated other comprehensive income andinterest expense are discussed in Note 8.
• Foreign Currency Derivatives — Our foreign currency derivatives have been designated as cash flow hedgesfor accounting purposes, which results in the unrealized changes in the fair value of the derivativeinstruments being recorded in “Accumulated other comprehensive income” within the equity section ofour Consolidated Balance Sheets. The associated balance in other comprehensive income is reclassified toearnings as the hedged cash flows affect earnings. In each of the periods presented, these derivatives haveeffectively mitigated the impacts of the hedged transactions, resulting in immaterial impacts to our results ofoperations for the periods presented.
• Electricity Commodity Derivatives — Our “receive fixed, pay variable” electricity commodity swaps havebeen designated as cash flow hedges for accounting purposes. The effective portion of the electricitycommodity swap gains or losses is initially reported as a component of “Accumulated other comprehensiveincome” within the equity section of our Consolidated Balance Sheets and subsequently reclassified intoearnings when the forecasted transactions affect earnings. These derivatives have not had a material impactto our financial statements for the periods presented.
Insured and Self-Insured Claims
We have retained a significant portion of the risks related to our health and welfare, automobile, generalliability and workers’ compensation insurance programs. The exposure for unpaid claims and associated expenses,
83
WASTE MANAGEMENT, INC.
NOTES TO CONSOLIDATED FINANCIAL STATEMENTS — (Continued)

including incurred but not reported losses, generally is estimated with the assistance of external actuaries and byfactoring in pending claims and historical trends and data. The gross estimated liability associated with settlingunpaid claims is included in “Accrued liabilities” in our Consolidated Balance Sheets if expected to be settledwithin one year, or otherwise is included in long-term “Other liabilities.” Estimated insurance recoveries related torecorded liabilities are reflected as current “Other receivables” or long-term “Other assets” in our ConsolidatedBalance Sheets when we believe that the receipt of such amounts is probable.
Revenue Recognition
Our revenues are generated from the fees we charge for waste collection, transfer, disposal and recyclingservices and the sale of recycled commodities, electricity, steam and landfill gas. The fees charged for our servicesare generally defined in our service agreements and vary based on contract-specific terms such as frequency ofservice, weight, volume and the general market factors influencing a region’s rates. The fees we charge for ourservices generally include fuel surcharges, which are intended to pass through to customers increased direct andindirect costs incurred because of changes in market prices for fuel. We generally recognize revenue as services areperformed or products are delivered. For example, revenue typically is recognized as waste is collected, tons arereceived at our landfills or transfer stations, recycling commodities are delivered or as kilowatts are delivered to acustomer by a waste-to-energy facility or independent power production plant.
We bill for certain services prior to performance. Such services include, among others, certain residentialcontracts that are billed on a quarterly basis and equipment rentals. These advance billings are included in deferredrevenues and recognized as revenue in the period service is provided.
Capitalized Interest
We capitalize interest on certain projects under development, including internal-use software and landfillexpansion projects, and on certain assets under construction, including operating landfills, landfill gas-to-energyprojects and waste-to-energy facilities. During 2010, 2009 and 2008, total interest costs were $490 million,$443 million and $472 million, respectively, of which $17 million in each year was capitalized. The interestcapitalized in 2009 and 2008 was primarily for landfill construction costs. In 2010, interest was capitalizedprimarily for landfill construction costs and landfill gas-to-energy construction projects.
Income Taxes
The Company is subject to income tax in the United States, Canada and Puerto Rico. Current tax obligationsassociated with our provision for income taxes are reflected in the accompanying Consolidated Balance Sheets as acomponent of “Accrued liabilities,” and the deferred tax obligations are reflected in “Deferred income taxes.”
Deferred income taxes are based on the difference between the financial reporting and tax basis of assets andliabilities. The deferred income tax provision represents the change during the reporting period in the deferred taxassets and deferred tax liabilities, net of the effect of acquisitions and dispositions. Deferred tax assets include taxloss and credit carry-forwards and are reduced by a valuation allowance if, based on available evidence, it is morelikely than not that some portion or all of the deferred tax assets will not be realized. Significant judgment isrequired in assessing the timing and amounts of deductible and taxable items. We establish reserves for uncertaintax positions when, despite our belief that our tax return positions are fully supportable, we believe that certainpositions may be challenged and potentially disallowed. When facts and circumstances change, we adjust thesereserves through our provision for income taxes.
To the extent interest and penalties may be assessed by taxing authorities on any underpayment of income tax,such amounts have been accrued and are classified as a component of income tax expense in our ConsolidatedStatements of Operations.
84
WASTE MANAGEMENT, INC.
NOTES TO CONSOLIDATED FINANCIAL STATEMENTS — (Continued)

Contingent Liabilities
We estimate the amount of potential exposure we may have with respect to claims, assessments and litigationin accordance with accounting principles generally accepted in the United States. We are party to pending orthreatened legal proceedings covering a wide range of matters in various jurisdictions. It is difficult to predict theoutcome of litigation, as it is subject to many uncertainties. Additionally, it is not always possible for managementto make a meaningful estimate of the potential loss or range of loss associated with such contingencies.
Supplemental Cash Flow Information
Cash paid during the year (in millions): 2010 2009 2008Years Ended December 31,
Interest, net of capitalized interest and periodic settlements from interestrate swap agreements . . . . . . . . . . . . . . . . . . . . . . . . . . . . . . . . . . . . . . $477 $416 $478
Income taxes . . . . . . . . . . . . . . . . . . . . . . . . . . . . . . . . . . . . . . . . . . . . . . 547 466 603
Non-cash investing and financing activities are excluded from the Consolidated Statements of Cash Flows. Forthe years ended December 31, 2009 and 2008, non-cash activities included proceeds from tax-exempt borrowings,net of principal payments made directly from trust funds, of $105 million and $169 million, respectively. During theyear ended December 31, 2010, we also had a $215 million non-cash increase in our debt obligations as a result ofthe issuance of a note payable in return for a noncontrolling interest in a limited liability company established toinvest in and manage low-income housing properties. This investment is discussed in detail in Note 9.
4. Landfill and Environmental Remediation Liabilities
Liabilities for landfill and environmental remediation costs are presented in the table below (in millions):
LandfillEnvironmentalRemediation Total Landfill
EnvironmentalRemediation Total
December 31, 2010 December 31, 2009
Current (in accrued liabilities) . . . . $ 105 $ 43 $ 148 $ 125 $ 41 $ 166
Long-term . . . . . . . . . . . . . . . . . . 1,161 241 1,402 1,142 215 1,357
$1,266 $284 $1,550 $1,267 $256 $1,523
85
WASTE MANAGEMENT, INC.
NOTES TO CONSOLIDATED FINANCIAL STATEMENTS — (Continued)

The changes to landfill and environmental remediation liabilities for the years ended December 31, 2009 and2010 are reflected in the table below (in millions):
LandfillEnvironmentalRemediation
December 31, 2008 . . . . . . . . . . . . . . . . . . . . . . . . . . . . . . . . . . . . . . . . . . $1,218 $299
Obligations incurred and capitalized . . . . . . . . . . . . . . . . . . . . . . . . . . . . 39 —
Obligations settled . . . . . . . . . . . . . . . . . . . . . . . . . . . . . . . . . . . . . . . . . (80) (43)
Interest accretion . . . . . . . . . . . . . . . . . . . . . . . . . . . . . . . . . . . . . . . . . . 80 6
Revisions in cost estimates and interest rate assumptions(a) . . . . . . . . . . . 5 (7)
Acquisitions, divestitures and other adjustments . . . . . . . . . . . . . . . . . . . 5 1
December 31, 2009 . . . . . . . . . . . . . . . . . . . . . . . . . . . . . . . . . . . . . . . . . . 1,267 256
Obligations incurred and capitalized . . . . . . . . . . . . . . . . . . . . . . . . . . . . 47 —
Obligations settled . . . . . . . . . . . . . . . . . . . . . . . . . . . . . . . . . . . . . . . . . (86) (36)
Interest accretion . . . . . . . . . . . . . . . . . . . . . . . . . . . . . . . . . . . . . . . . . . 82 5
Revisions in cost estimates and interest rate assumptions(a)(b) . . . . . . . . . (49) 61
Acquisitions, divestitures and other adjustments . . . . . . . . . . . . . . . . . . . 5 (2)
December 31, 2010 . . . . . . . . . . . . . . . . . . . . . . . . . . . . . . . . . . . . . . . . . . $1,266 $284
(a) The amounts reported for our environmental remediation liabilities include the impacts of revisions in the risk-free discount rates used to measure these obligations. The significant fluctuations in the applicable discountrates during the reported periods and the effects of those changes are discussed in Note 3. Additionally in 2010,we increased our cost estimates associated with environmental remediation obligations, primarily based on areview and evaluation of existing remediation projects. As these remediation projects progressed, more definedreclamation plans were developed, resulting in an increase in the required obligation to reflect the more likelyremedies.
(b) The amount reported for our landfill liabilities includes a reduction of approximately $50 million related to ouryear-end annual review of landfill capping, closure and post-closure obligations.
Our recorded liabilities as of December 31, 2010 include the impacts of inflating certain of these costs based onour expectations for the timing of cash settlement and of discounting certain of these costs to present value.Anticipated payments of currently identified environmental remediation liabilities as measured in current dollarsare $43 million in 2011; $37 million in 2012; $21 million in 2013; $30 million in 2014; $24 million in 2015; and$141 million thereafter.
At several of our landfills, we provide financial assurance by depositing cash into restricted trust funds orescrow accounts for purposes of settling capping, closure, post-closure and environmental remediation obligations.Generally, these trust funds are established to comply with statutory requirements and operating agreements and weare the sole beneficiary of the restricted balances. However, certain of the funds have been established for the benefitof both the Company and the host community in which we operate.
The fair value of trust funds and escrow accounts for which we are the sole beneficiary was $124 million atDecember 31, 2010 and $231 million as of December 31, 2009. As discussed in Note 20, effective January 1, 2010,we deconsolidated the trusts for which power over significant activities of the trust is shared, which reduced ourrestricted trust and escrow accounts by $109 million as of January 1, 2010. Beginning in 2010, our interests in thesevariable interest entities have been accounted for as investments in unconsolidated entities and receivables. The fairvalue of our investment in these entities was $103 million as of December 31, 2010. These amounts are included in“Other receivables” and as long-term “Other assets” in our Consolidated Balance Sheet.
86
WASTE MANAGEMENT, INC.
NOTES TO CONSOLIDATED FINANCIAL STATEMENTS — (Continued)

5. Property and Equipment
Property and equipment at December 31 consisted of the following (in millions):2010 2009
Land . . . . . . . . . . . . . . . . . . . . . . . . . . . . . . . . . . . . . . . . . . . . . . . . . . . . . . . $ 651 $ 632Landfills . . . . . . . . . . . . . . . . . . . . . . . . . . . . . . . . . . . . . . . . . . . . . . . . . . . . . 12,777 12,301Vehicles . . . . . . . . . . . . . . . . . . . . . . . . . . . . . . . . . . . . . . . . . . . . . . . . . . . . . 3,588 3,660Machinery and equipment . . . . . . . . . . . . . . . . . . . . . . . . . . . . . . . . . . . . . . . . 3,454 3,251Containers . . . . . . . . . . . . . . . . . . . . . . . . . . . . . . . . . . . . . . . . . . . . . . . . . . . 2,277 2,264Buildings and improvements . . . . . . . . . . . . . . . . . . . . . . . . . . . . . . . . . . . . . . 3,064 2,745Furniture, fixtures and office equipment . . . . . . . . . . . . . . . . . . . . . . . . . . . . . . 747 682
26,558 25,535Less accumulated depreciation on tangible property and equipment . . . . . . . . . (7,898) (7,546)Less accumulated landfill airspace amortization . . . . . . . . . . . . . . . . . . . . . . . . (6,792) (6,448)
$11,868 $11,541
Depreciation and amortization expense, including amortization expense for assets recorded as capital leases,was comprised of the following for the years ended December 31 (in millions):
2010 2009 2008
Depreciation of tangible property and equipment . . . . . . . . . . . . . . . . . $ 781 $ 779 $ 785Amortization of landfill airspace . . . . . . . . . . . . . . . . . . . . . . . . . . . . . 372 358 429
Depreciation and amortization expense . . . . . . . . . . . . . . . . . . . . . . . . $1,153 $1,137 $1,214
6. Goodwill and Other Intangible Assets
Goodwill was $5,726 million as of December 31, 2010 compared with $5,632 million as of December 31,2009. The $94 million increase in our goodwill during 2010 was primarily related to consideration paid foracquisitions in excess of net assets acquired of $77 million and accounting for foreign currency translation.
We incurred no impairment of goodwill as a result of our annual, fourth quarter goodwill impairment tests in2010, 2009 or 2008. Additionally, we did not encounter any events or changes in circumstances that indicated thatan impairment was more likely than not during interim periods in 2010, 2009 or 2008. However, there can be noassurance that goodwill will not be impaired at any time in the future.
Our other intangible assets as of December 31, 2010 and 2009 were comprised of the following (in millions):Customer
Contracts andCustomer
Lists
CovenantsNot-to-
Compete
Licenses,Permits
and Other Total
December 31, 2010Intangible assets . . . . . . . . . . . . . . . . . . . . . . . . . . . $228 $ 64 $147 $ 439Less accumulated amortization . . . . . . . . . . . . . . . . (87) (31) (26) (144)
$141 $ 33 $121 $ 295
December 31, 2009Intangible assets . . . . . . . . . . . . . . . . . . . . . . . . . . . $197 $ 63 $ 93 $ 353Less accumulated amortization . . . . . . . . . . . . . . . . (68) (29) (18) (115)
$129 $ 34 $ 75 $ 238
Amortization expense for other intangible assets was $41 million for 2010, $29 million for 2009, and$24 million for 2008. At December 31, 2010, we had $41 million of intangible assets that are not subject toamortization, which are primarily operating permits that do not have stated expirations or that have routine,
87
WASTE MANAGEMENT, INC.
NOTES TO CONSOLIDATED FINANCIAL STATEMENTS — (Continued)

administrative renewal processes. Additional information related to intangible assets acquired through 2010business combinations is included in Note 19. As of December 31, 2010, expected annual amortization expenserelated to intangible assets is $43 million in 2011; $39 million in 2012; $34 million in 2013; $26 million in 2014;and $22 million in 2015.
7. Debt
The following table summarizes the major components of debt at December 31 (in millions) and provides thematurities and interest rates of each major category as of December 31:
2010 2009
Revolving credit facility . . . . . . . . . . . . . . . . . . . . . . . . . . . . . . . . . . . . . . . . . . . $ — $ —Letter of credit facilities . . . . . . . . . . . . . . . . . . . . . . . . . . . . . . . . . . . . . . . . . . . — —Canadian credit facility (weighted average effective interest rate of 2.2% at
December 31, 2010 and 1.3% at December 31, 2009) . . . . . . . . . . . . . . . . . . . 212 255Senior notes and debentures, maturing through 2039, interest rates ranging from
4.75% to 7.75% (weighted average interest rate of 6.5% at December 31, 2010and 6.8% at December 31, 2009). . . . . . . . . . . . . . . . . . . . . . . . . . . . . . . . . . . 5,452 5,465
Tax-exempt bonds maturing through 2039, fixed and variable interest ratesranging from 0.3% to 7.4% (weighted average interest rate of 3.1% atDecember 31, 2010 and 3.5% at December 31, 2009) . . . . . . . . . . . . . . . . . . . 2,696 2,749
Tax-exempt project bonds, principal payable in periodic installments, maturingthrough 2029, fixed and variable interest rates ranging from 0.3% to 5.4%(weighted average interest rate of 2.5% at December 31, 2010 and 3.1% atDecember 31, 2009) . . . . . . . . . . . . . . . . . . . . . . . . . . . . . . . . . . . . . . . . . . . . 116 156
Capital leases and other, maturing through 2050, interest rates up to 12% . . . . . . 431 248
$8,907 $8,873Less current portion . . . . . . . . . . . . . . . . . . . . . . . . . . . . . . . . . . . . . . . . . . . . . . 233 749
$8,674 $8,124
Debt Classification
As of December 31, 2010, we had (i) $502 million of debt maturing within twelve months, includingU.S.$212 million under our Canadian credit facility and $147 million of 7.65% senior notes that mature inMarch 2011; and (ii) $405 million of fixed-rate tax-exempt borrowings subject to re-pricing within the next twelvemonths. Under accounting principles generally accepted in the United States, this debt must be classified as currentunless we have the intent and ability to refinance it on a long-term basis. We have the intent and ability to refinance$674 million of this debt on a long-term basis. We have classified the remaining $233 million as current obligationsas of December 31, 2010.
As of December 31, 2010, we also have $565 million of variable-rate tax-exempt bonds and $46 million ofvariable-rate tax-exempt project bonds. The interest rates on these bonds are reset on either a daily or weekly basisthrough a remarketing process. If the remarketing agent is unable to remarket the bonds, the remarketing agent canput the bonds to us. These bonds are supported by letters of credit guaranteeing repayment of the bonds in this event.We classified these borrowings as long-term in our Consolidated Balance Sheet at December 31, 2010 because theborrowings are supported by letters of credit issued under our three-year, $2.0 billion revolving credit facility, whichis long-term.
Access to and Utilization of Credit Facilities
Revolving Credit Facility — In June 2010, we entered into a three-year, $2.0 billion revolving credit facility,replacing the $2.4 billion credit facility that would have matured in August 2011. This facility provides us withcredit capacity to be used for either cash borrowings or to support letters of credit. At December 31, 2010, we had no
88
WASTE MANAGEMENT, INC.
NOTES TO CONSOLIDATED FINANCIAL STATEMENTS — (Continued)
outstanding borrowings and $1,138 million of letters of credit issued and supported by the facility. The unused andavailable credit capacity of the facility was $862 million as of December 31, 2010.
Letter of Credit Facilities — As of December 31, 2010, we had an aggregate committed capacity of$505 million under letter of credit facilities with maturities that extend from June 2013 to June 2015. Thesefacilities are currently being used to back letters of credit issued to support our bonding and financial assuranceneeds. Our letters of credit generally have terms providing for automatic renewal after one year. In the event of anunreimbursed draw on a letter of credit, the amount of the draw paid by the letter of credit provider generallyconverts into a term loan for the remaining term of the respective facility. Through December 31, 2010, we had notexperienced any unreimbursed draws on letters of credit under these facilities. As of December 31, 2010, noborrowings were outstanding under these letter of credit facilities and we had no unused or available credit capacity.
Canadian Credit Facility — In November 2005, Waste Management of Canada Corporation, one of ourwholly-owned subsidiaries, entered into a credit facility agreement to facilitate WM’s repatriation of accumulatedearnings and capital from its Canadian subsidiaries. As of December 31, 2010, the agreement provides availablecredit capacity of up to C$340 million and matures in November 2012.
As of December 31, 2010, we had U.S.$216 million of principal (U.S.$212 million net of discount)outstanding under this credit facility. The proceeds we initially received represented the net present value ofthe principal amount of the advances based on the term outstanding, and the debt was initially recorded based on thenet proceeds received. The advances have a weighted average effective interest rate of 2.2% at December 31, 2010,which is being amortized to interest expense with a corresponding increase in our recorded debt obligation using theeffective interest method. During the year ended December 31, 2010, we increased the carrying value of the debt forthe recognition of U.S.$3 million of interest expense. A total of U.S.$56 million of net advances under the facilitymatured during 2010 and were repaid with available cash. Accounting for changes in the Canadian currencytranslation rate increased the carrying value of these borrowings by U.S.$10 million during 2010.
Debt Borrowings and Repayments
The significant changes in our debt balances from December 31, 2009 to December 31, 2010 are related to thefollowing:
Senior Notes — In June 2010, we issued $600 million of 4.75% senior notes due June 2020. The net proceedsfrom the debt issuance were $592 million. We used the proceeds together with cash on hand to repay $600 million of7.375% senior notes that matured in August 2010.
The remaining change in the carrying value of our senior notes from December 31, 2009 to December 31, 2010is principally due to accounting for our fixed-to-floating interest rate swap agreements, which are accounted for asfair value hedges resulting in all fair value adjustments being reflected as a component of the carrying value of theunderlying debt. For additional information regarding our interest rate derivatives, refer to Note 8.
Tax-Exempt Bonds — Tax-exempt bonds are used as a means of accessing low-cost financing for capitalexpenditures. The proceeds from these debt issuances may only be used for the specific purpose for which themoney was raised, which is generally to finance expenditures for landfill construction and development, equipment,vehicles and facilities in support of our operations. Proceeds from bond issues are held in trust until such time as weincur qualified expenditures, at which time we are reimbursed from the trust funds. During the year endedDecember 31, 2010, $52 million of our tax-exempt bonds were repaid with available cash.
Tax-Exempt Project Bonds — Tax-exempt project bonds have been used by our Wheelabrator Group tofinance the development of waste-to-energy facilities. These facilities are integral to the local communities theyserve, and, as such, are supported by long-term contracts with multiple municipalities. The bonds generally haveperiodic amortizations that are supported by the cash flow of each specific facility being financed. During the yearended December 31, 2010, we repaid $39 million of our tax-exempt project bonds with available cash.
Capital Leases and Other — The significant increase in our capital leases and other debt obligations in 2010 isprimarily related to our federal low-income housing investment discussed in Note 9, which increased our debt
89
WASTE MANAGEMENT, INC.
NOTES TO CONSOLIDATED FINANCIAL STATEMENTS — (Continued)

obligations by $215 million. This increase was offset by $49 million of repayments of various borrowings at theirscheduled maturities.
Scheduled Debt and Capital Lease Payments — Scheduled debt and capital lease payments for the next fiveyears are as follows: $511 million in 2011; $614 million in 2012; $203 million in 2013; $459 million in 2014; and$452 million in 2015. Our recorded debt and capital lease obligations include non-cash adjustments associated withdiscounts, premiums and fair value adjustments for interest rate hedging activities, which have been excluded fromthese amounts because they will not result in cash payments.
Secured Debt
Our debt balances are generally unsecured, except for $30 million of the tax-exempt project bonds outstandingat December 31, 2010 that were issued by certain subsidiaries within our Wheelabrator Group. These bonds aresecured by the related subsidiaries’ assets, which have a carrying value of $295 million, and the related subsidiaries’future revenue.
Debt Covenants
Our revolving credit facility and certain other financing agreements contain financial covenants. The mostrestrictive of these financial covenants are contained in our revolving credit facility. The following table sum-marizes the requirements of these financial covenants, as defined by the revolving credit facility:
Interest coverage ratio . . . . . . . . . . . . . . . . . . . . . . . . . . . . . . . . . . . . . . . . . . . . . . . . H 2.75 to 1
Total debt to EBITDA . . . . . . . . . . . . . . . . . . . . . . . . . . . . . . . . . . . . . . . . . . . . . . . . G 3.5 to 1
Our revolving credit facility and senior notes also contain certain restrictions intended to monitor our level ofindebtedness, types of investments and net worth. We monitor our compliance with these restrictions, but do notbelieve that they significantly impact our ability to enter into investing or financing arrangements typical for ourbusiness. As of December 31, 2010 and December 31, 2009, we were in compliance with the covenants andrestrictions under all of our debt agreements.
8. Derivative Instruments and Hedging Activities
The following table summarizes the fair values of derivative instruments recorded in our Consolidated BalanceSheet as of December 31 (in millions):
Derivatives Designated as Hedging Instruments Balance Sheet Location 2010 2009December 31,
Interest rate contracts . . . . . . . . . . . . . . . . . . . . . . . . . Current other assets $ 1 $13
Interest rate contracts . . . . . . . . . . . . . . . . . . . . . . . . . Long-term other assets 37 32
Total derivative assets $38 $45
Interest rate contracts . . . . . . . . . . . . . . . . . . . . . . . . . Current accrued liabilities $11 $—
Foreign exchange contracts . . . . . . . . . . . . . . . . . . . . Current accrued liabilities — 18
Electricity commodity contracts . . . . . . . . . . . . . . . . . Current accrued liabilities 1 —
Interest rate contracts . . . . . . . . . . . . . . . . . . . . . . . . . Long-term accrued liabilities 13 —
Foreign exchange contracts . . . . . . . . . . . . . . . . . . . . Long-term accrued liabilities 3 —
Total derivative liabilities $28 $18
For information related to the methods used to measure our derivative assets and liabilities at fair value, refer toNote 18.
90
WASTE MANAGEMENT, INC.
NOTES TO CONSOLIDATED FINANCIAL STATEMENTS — (Continued)

Interest Rate Derivatives
Interest Rate Swaps
We use interest rate swaps to maintain a portion of our debt obligations at variable market interest rates. As ofDecember 31, 2010, we had approximately $5.4 billion in fixed-rate senior notes outstanding. The interestpayments on $500 million, or 9%, of these senior notes have been swapped to variable interest rates to protect thedebt against changes in fair value due to changes in benchmark interest rates. As of December 31, 2009, we hadapproximately $5.4 billion in fixed-rate senior notes outstanding, of which $1.1 billion, or 20%, had been swappedto variable interest rates. The significant terms of our interest rate swap agreements as of December 31, 2010 and2009 are summarized in the table below (in millions):
As ofNotionalAmount Receive Pay Maturity Date
December 31, 2010 . . . . $ 500 Fixed 5.00%-7.65% Floating 0.10%-4.69% Through March 15, 2018
December 31, 2009 . . . . $1,100 Fixed 5.00%-7.65% Floating 0.05%-4.64% Through March 15, 2018
The decrease in the notional amount of our interest rate swaps from December 31, 2009 to December 31, 2010was due to the scheduled maturity of interest rate swaps with a notional amount of $600 million in August 2010.
We have designated our interest rate swaps as fair value hedges of our fixed-rate senior notes. Fair value hedgeaccounting for interest rate swap contracts increased the carrying value of debt instruments by $79 million as ofDecember 31, 2010 and $91 million as of December 31, 2009. The following table summarizes the fair valueadjustments from interest rate swap agreements at December 31 (in millions):
Increase in Carrying Value of Debt Due to HedgeAccounting for Interest Rate Swaps 2010 2009
December 31,
Senior notes:
Active swap agreements . . . . . . . . . . . . . . . . . . . . . . . . . . . . . . . . . . . . . . . . . . . . . . . $38 $32
Terminated swap agreements . . . . . . . . . . . . . . . . . . . . . . . . . . . . . . . . . . . . . . . . . . . . 41 59
$79 $91
Gains or losses on the derivatives as well as the offsetting losses or gains on the hedged items attributable to ourinterest rate swaps are recognized in current earnings. We include gains and losses on our interest rate swaps asadjustments to interest expense, which is the same financial statement line item where offsetting gains and losses onthe related hedged items are recorded. The following table summarizes the impact of changes in the fair value of ourinterest rate swaps and the underlying hedged items on our results of operations (in millions):
Years EndedDecember 31,
Statement of OperationsClassification
Gain (Loss) onSwap
Gain (Loss) onFixed-Rate Debt
2010 Interest expense $ 6 $ (6)
2009 Interest expense $ (60) $ 60
2008 Interest expense $120 $(120)
We also recognize the impacts of (i) net periodic settlements of current interest on our active interest rate swapsand (ii) the amortization of previously terminated interest rate swap agreements as adjustments to interest expense.
91
WASTE MANAGEMENT, INC.
NOTES TO CONSOLIDATED FINANCIAL STATEMENTS — (Continued)

The following table summarizes the impact of periodic settlements of active swap agreements and the impact ofterminated swap agreements on our results of operations (in millions):
Decrease to Interest Expense Due to HedgeAccounting for Interest Rate Swaps 2010 2009 2008
Years EndedDecember 31,
Periodic settlements of active swap agreements(a) . . . . . . . . . . . . . . . . . . . . . . $29 $46 $ 8
Terminated swap agreements(b) . . . . . . . . . . . . . . . . . . . . . . . . . . . . . . . . . . . . 18 19 42
$47 $65 $50
(a) These amounts represent the net of our periodic variable-rate interest obligations and the swap counterparties’fixed-rate interest obligations. The significant decline in the benefit from active swaps when comparing 2010with 2009 is due to a decrease in the notional amount of swaps outstanding, offset, in part, by a decline in three-month LIBOR rates. The increase in the benefit from active swaps from 2008 to 2009 is due to a significantdecline in three-month LIBOR rates.
(b) In 2008, this amount included a $10 million net reduction in interest expense associated with the earlyretirement of $244 million of 8.75% senior notes. At December 31, 2010, $12 million (on a pre-tax basis) of thecarrying value of debt associated with terminated swap agreements is scheduled to be reclassified as areduction to interest expense over the next twelve months.
Treasury Rate Locks
During the third quarter of 2009, we entered into Treasury rate locks with a total notional amount of$200 million to hedge the risk of changes in semi-annual interest payments for a portion of the senior notes that theCompany planned to issue in June 2010. The Treasury rate locks were terminated in the second quarter of 2010contemporaneously with the actual issuance of senior notes, and we paid cash of $7 million upon settlement. In2009, we recognized pre-tax and after-tax gains of $4 million and $2 million, respectively, to other comprehensiveincome for changes in the fair value of these Treasury rate locks. In 2010, we recognized pre-tax and after-tax lossesof $11 million and $7 million, respectively, to other comprehensive income for changes in the fair value of theseTreasury rate locks. There was no significant ineffectiveness associated with these hedges during 2009 or 2010.
At December 31, 2010 and 2009, our “Accumulated other comprehensive income” included $16 million and$14 million, respectively, of deferred losses, net of taxes associated with the Treasury rate locks mentioned aboveand with Treasury rate locks that had been executed in previous years in anticipation of senior note issuances. Thesedeferred losses are reclassified to interest expense over the life of the related senior note issuances, which extendthrough 2032. Pre-tax amounts of $8 million, $9 million and $6 million were reclassified out of accumulated othercomprehensive income and into interest expense in 2010, 2009 and 2008, respectively. As of December 31, 2010,$7 million (on a pre-tax basis) is scheduled to be reclassified into interest expense over the next twelve months.
Forward-Starting Interest Rate Swaps
The Company currently expects to issue fixed-rate debt in March 2011, November 2012 and March 2014 andhas executed forward-starting interest rate swaps for these anticipated debt issuances with notional amounts of$150 million, $200 million and $175 million, respectively. We entered into the forward-starting interest rate swapsduring the fourth quarter of 2009 to hedge the risk of changes in the anticipated semi-annual interest payments dueto fluctuations in the forward ten-year LIBOR swap rate. Each of the forward-starting swaps has an effective date ofthe anticipated date of debt issuance and a tenor of ten years.
We have designated our forward-starting interest rate swaps as cash flow hedges. As of December 31, 2010, thefair value of these interest rate derivatives is comprised of $11 million of current liabilities and $13 million of long-term liabilities. We recognized pre-tax and after-tax losses of $33 million and $20 million, respectively, to othercomprehensive income for changes in the fair value of our forward-starting interest rate swaps during the year endedDecember 31, 2010. There was no ineffectiveness associated with these hedges during the year ended December 31,
92
WASTE MANAGEMENT, INC.
NOTES TO CONSOLIDATED FINANCIAL STATEMENTS — (Continued)

2010. The reclassification of deferred losses into earnings will begin when related forecasted senior note issuancesoccur and will continue over the life of the related senior note issuances, which are expected to extend through 2024.
As of December 31, 2009, the fair value of these interest rate derivatives was comprised of $9 million of long-term assets. We recognized pre-tax and after-tax gains of $9 million and $5 million, respectively, to othercomprehensive income for changes in the fair value of our forward-starting interest rate swaps during the year endedDecember 31, 2009. There was no ineffectiveness associated with these hedges during the year ended December 31,2009.
Credit-Risk Features
Certain of our interest rate derivative instruments contain provisions related to the Company’s credit rating. Ifthe Company’s credit rating were to fall to specified levels below investment grade, the counterparties have theability to terminate the derivative agreements, resulting in immediate settlement of all affected transactions. As ofDecember 31, 2010, we had not experienced any credit events that would trigger these provisions. The net liabilitiesof our derivative instruments with credit-risk-related features were immaterial as of December 31, 2010.
Foreign Exchange Derivatives
We use foreign currency exchange rate derivatives to hedge our exposure to changes in exchange rates foranticipated intercompany cash transactions between WM Holdings and its Canadian subsidiaries. We had foreigncurrency forward contracts outstanding as of December 31, 2010 and 2009 for anticipated cash flows associatedwith outstanding debt arrangements with these wholly-owned subsidiaries.
As of December 31, 2009, the hedged cash flows included C$370 million of principal payments andC$22 million of interest payments scheduled for December 31, 2010. The intercompany note and related forwardcontracts matured as scheduled in December 2010 and we paid cash of $37 million to settle the forward contracts.
In December 2010, we also executed a new C$370 million intercompany debt arrangement and entered intonew forward contracts for the related principal and interest cash flows. The total notional value of the forwardcontracts is C$401 million. Scheduled interest payments are as follows: C$10 million on November 30, 2011,C$11 million on November 30, 2012 and C$10 million on October 31, 2013. The principal is scheduled to be repaidon October 31, 2013. We designated these forward contracts as cash flow hedges.
Gains or losses on the underlying hedged items attributable to foreign currency exchange risk are recognized incurrent earnings. We include gains and losses on our foreign currency forward contracts as adjustments to otherincome and expense, which is the same financial statement line item where offsetting gains and losses on the relatedhedged items are recorded. The following table summarizes the pre-tax impacts of our foreign currency cash flowderivatives on our results of operations and comprehensive income (in millions):
Years EndedDecember 31,
Amount of Gain or(Loss) Recognized
in OCI onDerivatives
(Effective Portion)
Statement ofOperations
Classification
Amount of Gain or(Loss) Reclassifiedfrom AOCI into
Income(Effective Portion)
2010 $(22) Other income (expense) $(18)
2009 $(47) Other income (expense) $(47)
2008 $ 65 Other income (expense) $ 72
Amounts reported in other comprehensive income and accumulated other comprehensive income are reportednet of tax. Adjustments to other comprehensive income for changes in the fair value of our foreign currency cashflow hedges resulted in the recognition of an after tax-loss of $14 million during the year ended December 31, 2010;an after-tax loss of $28 million during the year ended December 31, 2009; and an after-tax gain of $40 millionduring the year ended December 31, 2008. Adjustments for the reclassification of gains or (losses) fromaccumulated other comprehensive income into income were $(11) million during the year ended December 31,2010; $(28) million during the year ended December 31, 2009; $44 million during the year ended December 31,
93
WASTE MANAGEMENT, INC.
NOTES TO CONSOLIDATED FINANCIAL STATEMENTS — (Continued)

2008. Ineffectiveness has been included in other income and expense during each of the reported periods. There wasno significant ineffectiveness associated with these hedges during the years ended December 31, 2010, 2009 or2008.
Electricity Commodity Derivatives
As a result of the expiration of certain long-term, above-market electricity contracts at our waste-to-energyfacilities, we use short-term “receive fixed, pay variable” electricity commodity swaps to mitigate the variability inour revenues and cash flows caused by fluctuations in the market prices for electricity. The swaps executed in 2010hedged 672,360 megawatt hours, or approximately 26%, of our Wheelabrator Group’s 2010 merchant electricitysales and are expected to hedge about 1 million megawatt hours, or 33%, of the Group’s 2011 merchant electricitysales. There was no significant ineffectiveness associated with these cash flow hedges during 2010. All financialstatement impacts associated with these derivatives were immaterial for the year ended December 31, 2010.
9. Income Taxes
Provision for Income Taxes
Our “Provision for income taxes” consisted of the following (in millions):
2010 2009 2008Years Ended December 31,
Current:
Federal . . . . . . . . . . . . . . . . . . . . . . . . . . . . . . . . . . . . . . . . . . . . . . . . $354 $407 $436
State . . . . . . . . . . . . . . . . . . . . . . . . . . . . . . . . . . . . . . . . . . . . . . . . . . 99 74 52
Foreign . . . . . . . . . . . . . . . . . . . . . . . . . . . . . . . . . . . . . . . . . . . . . . . . 22 26 31
475 507 519
Deferred:
Federal . . . . . . . . . . . . . . . . . . . . . . . . . . . . . . . . . . . . . . . . . . . . . . . . 85 (45) 126
State . . . . . . . . . . . . . . . . . . . . . . . . . . . . . . . . . . . . . . . . . . . . . . . . . . 64 (35) 27
Foreign . . . . . . . . . . . . . . . . . . . . . . . . . . . . . . . . . . . . . . . . . . . . . . . . 5 (14) (3)
154 (94) 150
Provision for income taxes . . . . . . . . . . . . . . . . . . . . . . . . . . . . . . . . . . . . $629 $413 $669
The U.S. federal statutory income tax rate is reconciled to the effective rate as follows:
2010 2009 2008Years Ended December 31,
Income tax expense at U.S. federal statutory rate . . . . . . . . . . . . . . . . . . . . 35.00% 35.00% 35.00%
State and local income taxes, net of federal income tax benefit . . . . . . . . . 4.50 3.75 3.63
Miscellaneous federal tax credits . . . . . . . . . . . . . . . . . . . . . . . . . . . . . . . . (1.67) (1.15) (0.60)
Noncontrolling interests . . . . . . . . . . . . . . . . . . . . . . . . . . . . . . . . . . . . . . (1.05) (1.56) (0.80)
Taxing authority audit settlements and other tax adjustments . . . . . . . . . . . 0.54 (2.89) (0.99)
Nondeductible costs relating to acquired intangibles . . . . . . . . . . . . . . . . . 0.11 0.18 0.79
Tax rate differential on foreign income . . . . . . . . . . . . . . . . . . . . . . . . . . . (0.39) (0.24) (0.03)Cumulative effect of change in tax rates . . . . . . . . . . . . . . . . . . . . . . . . . . 1.74 (0.49) —
Utilization of capital loss . . . . . . . . . . . . . . . . . . . . . . . . . . . . . . . . . . . . . — (4.44) —
Other . . . . . . . . . . . . . . . . . . . . . . . . . . . . . . . . . . . . . . . . . . . . . . . . . . . . (0.25) (0.09) 0.23
Provision for income taxes . . . . . . . . . . . . . . . . . . . . . . . . . . . . . . . . . . . . 38.53% 28.07% 37.23%
94
WASTE MANAGEMENT, INC.
NOTES TO CONSOLIDATED FINANCIAL STATEMENTS — (Continued)

The comparability of our income taxes for the reported periods has been primarily affected by variations in ourincome before income taxes, tax audit settlements, changes in effective state and Canadian statutory tax rates,realization of state net operating loss and credit carry-forwards, utilization of a capital loss carry-back andmiscellaneous federal tax credits. For financial reporting purposes, income before income taxes showing domesticand foreign sources was as follows (in millions) for the years ended December 31, 2010, 2009 and 2008:
2010 2009 2008Years Ended December 31,
Domestic . . . . . . . . . . . . . . . . . . . . . . . . . . . . . . . . . . . . . . . . . . . . . . $1,517 $1,396 $1,693
Foreign . . . . . . . . . . . . . . . . . . . . . . . . . . . . . . . . . . . . . . . . . . . . . . . . 114 77 104
Income before income taxes . . . . . . . . . . . . . . . . . . . . . . . . . . . . . . . . $1,631 $1,473 $1,797
Tax Audit Settlements — The Company and its subsidiaries file income tax returns in the United States,Canada and Puerto Rico, as well as various state and local jurisdictions. We are currently under audit by the IRS andfrom time to time we are audited by other taxing authorities. Our audits are in various stages of completion.
In the fourth quarter of 2010, we effectively settled an IRS audit for the 2009 tax year as well as various statetax audits. In addition, during the third quarter of 2010, we finalized audits in Canada through 2005. The settlementof these tax audits resulted in a reduction to our “Provision for income taxes” of $8 million, or $0.02 per dilutedshare, for the year ended December 31, 2010.
During 2009, we settled the IRS audit for the 2008 tax year as well as various state tax audits. The settlement ofthese tax audits resulted in a reduction to our “Provision for income taxes” of $11 million, or $0.02 per diluted share,for the year ended December 31, 2009.
During 2008, we settled IRS audits for the 2006 and 2007 tax years as well as various state tax audits. Inaddition, we settled the majority of the issues with respect to Canadian audits for the tax years 2002 through 2005.The settlement of these tax audits resulted in a reduction to our “Provision for income taxes” of $26 million, or$0.05 per diluted share, for the year ended December 31, 2008.
We are currently in the examination phase of IRS audits for the tax years 2010 and 2011 and expect these auditsto be completed within the next 12 and 24 months, respectively. We participate in the IRS’s Compliance AssuranceProgram, which means we work with the IRS throughout the year in order to resolve any material issues prior to thefiling of our year-end tax return. We are also currently undergoing audits by various state and local jurisdictions thatdate back to 2000. In the third quarter of 2010, we finalized audits in Canada through the 2005 tax year and are notcurrently under audit for any subsequent tax years.
Effective State Tax Rate Change — During 2010, our current state tax rate increased from 6.25% to 6.75%resulting in an increase to our provision for income taxes of $5 million. In addition, our state deferred income taxesincreased $37 million to reflect the impact of changes in the estimated tax rate at which existing temporarydifferences will be realized. During 2009, our current state tax rate increased from 6.0% to 6.25% and our deferredstate tax rate increased from 5.5% to 5.75%, resulting in an increase to our income taxes of $3 million and$6 million, respectively. During 2008, our current state tax rate increased from 5.5% to 6.0%, resulting in anincrease to our income taxes of $5 million. The increases in these rates are primarily due to changes in state law. Thecomparison of our effective state tax rate during the reported periods has also been affected by return-to-accrualadjustments, which increased our “Provision for income taxes” in 2010 and reduced our “Provision for incometaxes” in 2009 and 2008.
Canada Statutory Tax Rate Change — During 2009, the provincial tax rates in Ontario were reduced, whichresulted in a $13 million tax benefit as a result of the revaluation of the related deferred tax balances.
State Net Operating Loss and Credit Carry-Forwards — During 2010, 2009, and 2008, we released state netoperating loss and credit carry-forwards resulting in a reduction to our “Provision for income taxes” for thoseperiods of $4 million, $35 million and $3 million, respectively.
95
WASTE MANAGEMENT, INC.
NOTES TO CONSOLIDATED FINANCIAL STATEMENTS — (Continued)

Capital Loss Carry-Back — During 2009, we generated a capital loss from the liquidation of a foreignsubsidiary. We determined that the capital loss could be utilized to offset capital gains from 2006 and 2007, whichresulted in a reduction to our 2009 “Provision for income taxes” of $65 million.
Federal Low-income Housing Tax Credits — In April 2010, we acquired a noncontrolling interest in a limitedliability company established to invest in and manage low-income housing properties. Our consideration for thisinvestment totaled $221 million, which was comprised of a $215 million note payable and an initial cash payment of$6 million. The entity’s low-income housing investments qualify for federal tax credits that are expected to berealized through 2020 in accordance with Section 42 of the Internal Revenue Code.
We account for our investment in this entity using the equity method of accounting, and we recognize a chargeto “Equity in net losses of unconsolidated entities,” within our Consolidated Statement of Operations, for reductionsin the value of our investment. The value of our investment decreases as the tax credits are generated and utilized.During the year ended December 31, 2010, we recognized a total of $19 million of losses for reductions in the valueof our investment. We also recognized $5 million of interest expense related to this investment during 2010.However, our tax provision for the year ended December 31, 2010 was reduced by $26 million (including$16 million of tax credits) as a result of this investment, which more than offset the pre-tax expense realized duringthe period.
Unremitted Earnings in Foreign Subsidiaries — At December 31, 2010, remaining unremitted earnings inforeign operations were approximately $644 million, which are considered permanently invested and, therefore, noprovision for U.S. income taxes has been accrued for these unremitted earnings.
Deferred Tax Assets (Liabilities)
The components of the net deferred tax assets (liabilities) at December 31 are as follows (in millions):
2010 2009December 31,
Deferred tax assets:
Net operating loss, capital loss and tax credit carry-forwards . . . . . . . . . . . . . . . $ 179 $ 259
Landfill and environmental remediation liabilities . . . . . . . . . . . . . . . . . . . . . . . 60 54
Miscellaneous and other reserves . . . . . . . . . . . . . . . . . . . . . . . . . . . . . . . . . . . 202 176
Subtotal . . . . . . . . . . . . . . . . . . . . . . . . . . . . . . . . . . . . . . . . . . . . . . . . . . . . 441 489
Valuation allowance . . . . . . . . . . . . . . . . . . . . . . . . . . . . . . . . . . . . . . . . . . . . . (132) (139)
Deferred tax liabilities:
Property and equipment . . . . . . . . . . . . . . . . . . . . . . . . . . . . . . . . . . . . . . . . (1,045) (941)
Goodwill and other intangibles . . . . . . . . . . . . . . . . . . . . . . . . . . . . . . . . . . . (886) (802)
Net deferred tax liabilities . . . . . . . . . . . . . . . . . . . . . . . . . . . . . . . . . . . . . $(1,622) $(1,393)
At December 31, 2010, we had $27 million of federal net operating loss, or NOL, carry-forwards and$1.3 billion of state NOL carry-forwards. The federal and state NOL carry-forwards have expiration dates throughthe year 2030. We also have a $76 million capital loss carry-forward that expires in 2014. In addition, we have$39 million of state tax credit carry-forwards at December 31, 2010.
We have established valuation allowances for uncertainties in realizing the benefit of certain tax loss and creditcarry-forwards and other deferred tax assets. While we expect to realize the deferred tax assets, net of the valuationallowances, changes in estimates of future taxable income or in tax laws may alter this expectation. The valuationallowance decreased $7 million in 2010 due to changes in our gross deferred tax assets due to changes in state NOLand credit carry-forwards.
96
WASTE MANAGEMENT, INC.
NOTES TO CONSOLIDATED FINANCIAL STATEMENTS — (Continued)
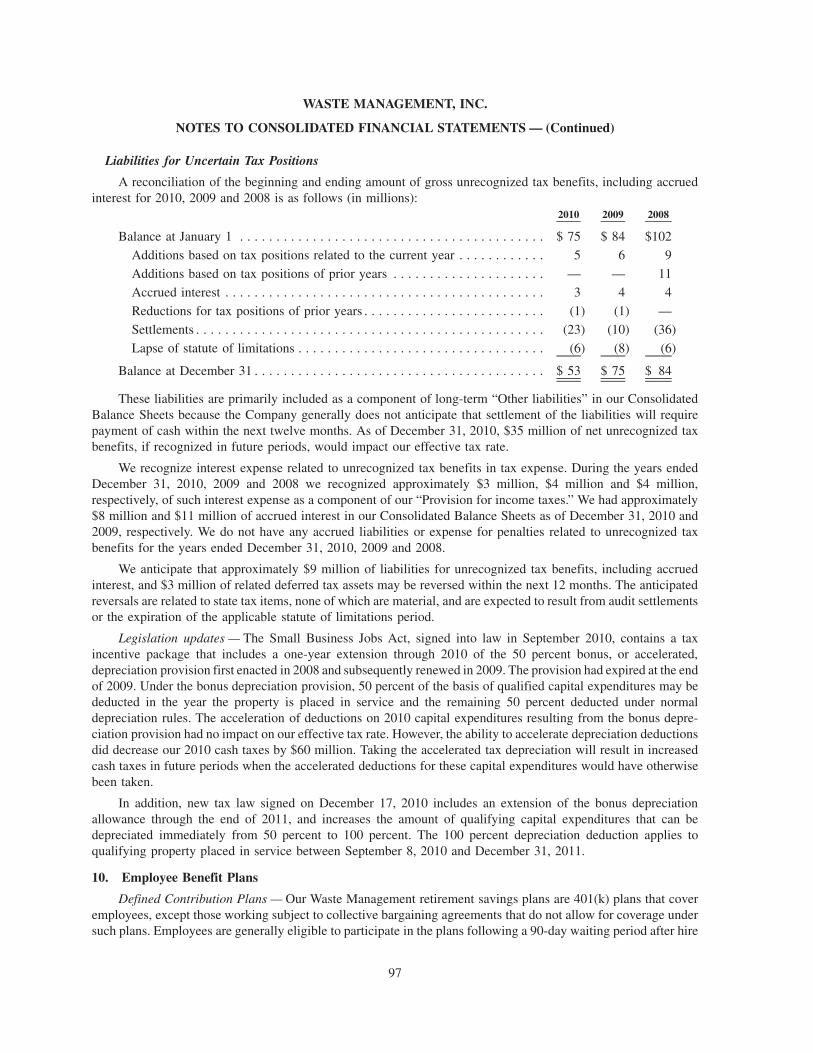
Liabilities for Uncertain Tax Positions
A reconciliation of the beginning and ending amount of gross unrecognized tax benefits, including accruedinterest for 2010, 2009 and 2008 is as follows (in millions):
2010 2009 2008
Balance at January 1 . . . . . . . . . . . . . . . . . . . . . . . . . . . . . . . . . . . . . . . . . . $ 75 $ 84 $102
Additions based on tax positions related to the current year . . . . . . . . . . . . 5 6 9
Additions based on tax positions of prior years . . . . . . . . . . . . . . . . . . . . . — — 11
Accrued interest . . . . . . . . . . . . . . . . . . . . . . . . . . . . . . . . . . . . . . . . . . . . 3 4 4
Reductions for tax positions of prior years . . . . . . . . . . . . . . . . . . . . . . . . . (1) (1) —
Settlements . . . . . . . . . . . . . . . . . . . . . . . . . . . . . . . . . . . . . . . . . . . . . . . . (23) (10) (36)
Lapse of statute of limitations . . . . . . . . . . . . . . . . . . . . . . . . . . . . . . . . . . (6) (8) (6)
Balance at December 31 . . . . . . . . . . . . . . . . . . . . . . . . . . . . . . . . . . . . . . . . $ 53 $ 75 $ 84
These liabilities are primarily included as a component of long-term “Other liabilities” in our ConsolidatedBalance Sheets because the Company generally does not anticipate that settlement of the liabilities will requirepayment of cash within the next twelve months. As of December 31, 2010, $35 million of net unrecognized taxbenefits, if recognized in future periods, would impact our effective tax rate.
We recognize interest expense related to unrecognized tax benefits in tax expense. During the years endedDecember 31, 2010, 2009 and 2008 we recognized approximately $3 million, $4 million and $4 million,respectively, of such interest expense as a component of our “Provision for income taxes.” We had approximately$8 million and $11 million of accrued interest in our Consolidated Balance Sheets as of December 31, 2010 and2009, respectively. We do not have any accrued liabilities or expense for penalties related to unrecognized taxbenefits for the years ended December 31, 2010, 2009 and 2008.
We anticipate that approximately $9 million of liabilities for unrecognized tax benefits, including accruedinterest, and $3 million of related deferred tax assets may be reversed within the next 12 months. The anticipatedreversals are related to state tax items, none of which are material, and are expected to result from audit settlementsor the expiration of the applicable statute of limitations period.
Legislation updates — The Small Business Jobs Act, signed into law in September 2010, contains a taxincentive package that includes a one-year extension through 2010 of the 50 percent bonus, or accelerated,depreciation provision first enacted in 2008 and subsequently renewed in 2009. The provision had expired at the endof 2009. Under the bonus depreciation provision, 50 percent of the basis of qualified capital expenditures may bededucted in the year the property is placed in service and the remaining 50 percent deducted under normaldepreciation rules. The acceleration of deductions on 2010 capital expenditures resulting from the bonus depre-ciation provision had no impact on our effective tax rate. However, the ability to accelerate depreciation deductionsdid decrease our 2010 cash taxes by $60 million. Taking the accelerated tax depreciation will result in increasedcash taxes in future periods when the accelerated deductions for these capital expenditures would have otherwisebeen taken.
In addition, new tax law signed on December 17, 2010 includes an extension of the bonus depreciationallowance through the end of 2011, and increases the amount of qualifying capital expenditures that can bedepreciated immediately from 50 percent to 100 percent. The 100 percent depreciation deduction applies toqualifying property placed in service between September 8, 2010 and December 31, 2011.
10. Employee Benefit Plans
Defined Contribution Plans — Our Waste Management retirement savings plans are 401(k) plans that coveremployees, except those working subject to collective bargaining agreements that do not allow for coverage undersuch plans. Employees are generally eligible to participate in the plans following a 90-day waiting period after hire
97
WASTE MANAGEMENT, INC.
NOTES TO CONSOLIDATED FINANCIAL STATEMENTS — (Continued)

and may contribute as much as 25% of their annual compensation, subject to annual contribution limitationsestablished by the IRS. Under our largest retirement savings plan, we match, in cash, 100% of employeecontributions on the first 3% of their eligible compensation and match 50% of employee contributions on thenext 3% of their eligible compensation, resulting in a maximum match of 4.5%. Both employee and Companycontributions vest immediately. Charges to “Operating” and “Selling, general and administrative” expenses for ourdefined contribution plans were $55 million in 2010, $50 million in 2009 and $59 million in 2008.
Defined Benefit Plans — Certain of the Company’s subsidiaries sponsor pension plans that cover employeesnot otherwise covered by the Waste Management retirement savings plans. These employees are members ofcollective bargaining units. In addition, Wheelabrator Technologies Inc., a wholly-owned subsidiary, sponsors apension plan for its former executives and former Board members. As of December 31, 2010, the combined benefitobligation of these pension plans was $81 million, and the plans had $60 million of plan assets, resulting in anunfunded benefit obligation for these plans of $21 million.
In addition, WM Holdings and certain of its subsidiaries provided post-retirement health care and otherbenefits to eligible employees. In conjunction with our acquisition of WM Holdings in July 1998, we limitedparticipation in these plans to participating retired employees as of December 31, 1998. The unfunded benefitobligation for these plans was $45 million at December 31, 2010.
Our accrued benefit liabilities for our defined benefit pension and other post-retirement plans are $66 millionas of December 31, 2010 and are included as components of “Accrued liabilities” and long-term “Other liabilities”in our Consolidated Balance Sheet.
We are a participating employer in a number of trustee-managed multiemployer, defined benefit pension plansfor employees who participate in collective bargaining agreements. Contributions of $35 million in 2010,$34 million in 2009 and $35 million in 2008 were charged to operations for our subsidiaries’ ongoing participationin these defined benefit plans. Our portion of the projected benefit obligation, plan assets and unfunded liability ofthe multiemployer pension plans is not material to our financial position. However, the failure of participatingemployers to remain solvent could affect our portion of the plans’ unfunded liability. Specific benefit levelsprovided by union pension plans are not negotiated with or known by the employer contributors.
In connection with our ongoing renegotiations of various collective bargaining agreements, we may discussand negotiate for the complete or partial withdrawal from one or more of these pension plans. If we elect towithdraw from these plans, we may incur expenses associated with our obligations for unfunded vested benefits atthe time of the withdrawal. As discussed in Note 11, in 2010, 2009 and 2008, we recognized aggregate charges of$26 million, $9 million and $39 million, respectively, to “Operating” expenses for the withdrawal of certainbargaining units from multiemployer pension plans.
11. Commitments and Contingencies
Financial Instruments — We have obtained letters of credit, performance bonds and insurance policies andhave established trust funds and issued financial guarantees to support tax-exempt bonds, contracts, performance oflandfill capping, closure and post-closure requirements, environmental remediation, and other obligations. Lettersof credit generally are supported by our revolving credit facility and other credit facilities established for thatpurpose. These facilities are discussed further in Note 7. We obtain surety bonds and insurance policies from anentity in which we have a noncontrolling financial interest. We also obtain insurance from a wholly-ownedinsurance company, the sole business of which is to issue policies for us. In those instances where our use offinancial assurance from entities we own or have financial interests in is not allowed, we have available alternativefinancial assurance mechanisms.
Management does not expect that any claims against or draws on these instruments would have a materialadverse effect on our consolidated financial statements. We have not experienced any unmanageable difficulty inobtaining the required financial assurance instruments for our current operations. In an ongoing effort to mitigate
98
WASTE MANAGEMENT, INC.
NOTES TO CONSOLIDATED FINANCIAL STATEMENTS — (Continued)

risks of future cost increases and reductions in available capacity, we continue to evaluate various options to accesscost-effective sources of financial assurance.
Insurance — We carry insurance coverage for protection of our assets and operations from certain risksincluding automobile liability, general liability, real and personal property, workers’ compensation, directors’ andofficers’ liability, pollution legal liability and other coverages we believe are customary to the industry. Ourexposure to loss for insurance claims is generally limited to the per incident deductible under the related insurancepolicy. Our exposure, however, could increase if our insurers are unable to meet their commitments on a timelybasis.
We have retained a significant portion of the risks related to our automobile, general liability and workers’compensation insurance programs. For our self-insured retentions, the exposure for unpaid claims and associatedexpenses, including incurred but not reported losses, is based on an actuarial valuation and internal estimates. Theaccruals for these liabilities could be revised if future occurrences or loss development significantly differ from ourassumptions used. As of December 31, 2010, our general liability insurance program carried self-insuranceexposures of up to $2.5 million per incident and our workers’ compensation insurance program carried self-insurance exposures of up to $5 million per incident. As of December 31, 2010, our auto liability insurance programincluded a per-incident base deductible of $5 million, subject to additional deductibles of $4.8 million in the$5 million to $10 million layer. Self-insurance claims reserves acquired as part of our acquisition of WM Holdingsin July 1998 were discounted at 3.50% at December 31, 2010, 3.75% at December 31, 2009 and 2.25% atDecember 31, 2008. The changes to our net insurance liabilities for the three years ended December 31, 2010 aresummarized below (in millions):
Gross ClaimsLiability
ReceivablesAssociated with
Insured Claims(a)Net Claims
Liability
Balance, December 31, 2007 . . . . . . . . . . . . . . . . . . . . $ 571 $(214) $ 357
Self-insurance expense (benefit) . . . . . . . . . . . . . . . . 169 (28) 141
Cash (paid) received . . . . . . . . . . . . . . . . . . . . . . . . (209) 51 (158)
Balance, December 31, 2008 . . . . . . . . . . . . . . . . . . . . 531 (191) 340
Self-insurance expense (benefit) . . . . . . . . . . . . . . . . 184 (32) 152
Cash (paid) received . . . . . . . . . . . . . . . . . . . . . . . . (174) 29 (145)
Balance, December 31, 2009 . . . . . . . . . . . . . . . . . . . . 541 (194) 347
Self-insurance expense (benefit) . . . . . . . . . . . . . . . . 179 (38) 141
Cash (paid) received . . . . . . . . . . . . . . . . . . . . . . . . (197) 62 (135)
Balance, December 31, 2010(b) . . . . . . . . . . . . . . . . . . $ 523 $(170) $ 353
Current portion at December 31, 2010 . . . . . . . . . . . $ 142 $ (43) $ 99
Long-term portion at December 31, 2010 . . . . . . . . . $ 381 $(127) $ 254
(a) Amounts reported as receivables associated with insured claims are related to both paid and unpaid claimsliabilities.
(b) We currently expect substantially all of our recorded obligations to be settled in cash in the next five years.
The Directors’ and Officers’ Liability Insurance policy we choose to maintain covers only individual executiveliability, often referred to as “Broad Form Side A,” and does not provide corporate reimbursement coverage, oftenreferred to as “Side B.” The Side A policy covers directors and officers directly for loss, including defense costs,when corporate indemnification is unavailable. Side A-only coverage cannot be exhausted by payments to theCompany, as the Company is not insured for any money it advances for defense costs or pays as indemnity to theinsured directors and officers.
99
WASTE MANAGEMENT, INC.
NOTES TO CONSOLIDATED FINANCIAL STATEMENTS — (Continued)

We do not expect the impact of any known casualty, property, environmental or other contingency to have amaterial impact on our financial condition, results of operations or cash flows.
Operating Leases — Rental expense for leased properties was $121 million during 2010 and $114 millionduring both 2009 and 2008. Minimum contractual payments due for our operating lease obligations are $82 millionin 2011, $76 million in 2012, $62 million in 2013, $51 million in 2014 and $40 million in 2015.
Our minimum contractual payments for lease agreements during future periods is significantly less thancurrent year rent expense due to short-term leases and because our significant lease agreements at landfills havevariable terms based either on a percentage of revenue or a rate per ton of waste received.
Other Commitments
• Share Repurchases — In December 2010, we entered into plans under SEC Rule 10b5-1 to effect marketpurchases of our common stock during the first quarter of 2011. See Note 15 for additional informationrelated to these arrangements.
• Fuel Supply — We have purchase agreements expiring at various dates through 2011 that require us topurchase minimum amounts of wood waste, anthracite coal waste (culm) and conventional fuels at ourindependent power production plants. These fuel supplies are used to produce steam that is sold to industrialand commercial users and electricity that is sold to electric utilities, which is generally subject to the termsand conditions of long-term contracts. Our purchase agreements have been established based on the plants’anticipated fuel supply needs to meet the demands of our customers under these long-term electricity salecontracts. Under our fuel supply take-or-pay contracts, we are generally obligated to pay for a minimumamount of waste or conventional fuel at a stated rate even if such quantities are not required in our operations.
• Disposal — We have several agreements expiring at various dates through 2052 that require us to dispose ofa minimum number of tons at third-party disposal facilities. Under these put-or-pay agreements, we arerequired to pay for the agreed upon minimum volumes regardless of the actual number of tons placed at thefacilities. We generally fulfill our minimum contractual obligations by disposing of volumes collected in theordinary course of business at these disposal facilities.
• Waste Paper — We are party to a waste paper purchase agreement that requires us to purchase a minimumnumber of tons of waste paper. The cost per ton we pay is based on market prices. We currently expect tofulfill our purchase obligations by 2013.
• Royalties — We have various arrangements that require us to make royalty payments to third partiesincluding prior land owners, lessors or host communities where our operations are located. Our obligationsgenerally are based on per ton rates for waste actually received at our transfer stations, landfills orwaste-to-energy facilities.
Our unconditional obligations are established in the ordinary course of our business and are structured in amanner that provides us with access to important resources at competitive, market-driven rates. Our actual futureobligations under these outstanding agreements are generally quantity driven, and, as a result, our associatedfinancial obligations are not fixed as of December 31, 2010. For these contracts, we have estimated our futureobligations based on the current market values of the underlying products or services. Our estimated minimumobligations for the above-described purchase obligations are $85 million in 2011, $84 million in 2012, $58 millionin 2013, $21 million in 2014 and $16 million in 2015. We currently expect the products and services provided bythese agreements to continue to meet the needs of our ongoing operations. Therefore, we do not expect theseestablished arrangements to materially impact our future financial position, results of operations or cash flows.
Guarantees — We have entered into the following guarantee agreements associated with our operations:
• As of December 31, 2010, WM Holdings has fully and unconditionally guaranteed all of WM’s seniorindebtedness, including its senior notes, revolving credit agreement and certain letter of credit facilities,which matures through 2039. WM has fully and unconditionally guaranteed all of the senior indebtedness of
100
WASTE MANAGEMENT, INC.
NOTES TO CONSOLIDATED FINANCIAL STATEMENTS — (Continued)

WM Holdings, which matures through 2026. Performance under these guarantee agreements would berequired if either party defaulted on their respective obligations. No additional liabilities have been recordedfor these guarantees because the underlying obligations are reflected in our Consolidated Balance Sheets.See Note 23 for further information.
• WM and WM Holdings have guaranteed the tax-exempt bonds and other debt obligations of theirsubsidiaries. If a subsidiary fails to meet its obligations associated with its debt agreements as they comedue, WM or WM Holdings will be required to perform under the related guarantee agreement. No additionalliabilities have been recorded for these guarantees because the underlying obligations are reflected in ourConsolidated Balance Sheets. See Note 7 for information related to the balances and maturities of our tax-exempt bonds.
• We have guaranteed certain financial obligations of unconsolidated entities. The related obligations, whichmature through 2020, are not recorded on our Consolidated Balance Sheets. As of December 31, 2010, ourmaximum future payments associated with these guarantees are approximately $11 million. We do notbelieve that it is likely that we will be required to perform under these guarantees.
• Certain of our subsidiaries have guaranteed the market or contractually-determined value of certainhomeowners’ properties that are adjacent to certain of our landfills. These guarantee agreements extendover the life of the respective landfill. Under these agreements, we would be responsible for the difference, ifany, between the sale value and the guaranteed market or contractually-determined value of the home-owners’ properties. Generally, it is not possible to determine the contingent obligation associated with theseguarantees, but we do not believe that these contingent obligations will have a material effect on ourfinancial position, results of operations or cash flows.
• We have indemnified the purchasers of businesses or divested assets for the occurrence of specified eventsunder certain of our divestiture agreements. Other than certain identified items that are currently recorded asobligations, we do not believe that it is possible to determine the contingent obligations associated with theseindemnities. Additionally, under certain of our acquisition agreements, we have provided for additionalconsideration to be paid to the sellers if established financial targets are achieved post-closing. Foracquisitions completed subsequent to January 1, 2009, we have recognized liabilities for these contingentobligations based on an estimate of the fair value of these contingencies at the time of acquisition. Foracquisitions completed before January 1, 2009, the costs associated with any additional considerationrequirements are accounted for as incurred. Contingent obligations related to indemnifications arising fromour divestitures and contingent consideration provided for by our acquisitions are not expected to be materialto our financial position, results of operations or cash flows.
• WM and WM Holdings guarantee the service, lease, financial and general operating obligations of certain oftheir subsidiaries. If such a subsidiary fails to meet its contractual obligations as they come due, theguarantor has an unconditional obligation to perform on its behalf. No additional liability has been recordedfor service, financial or general operating guarantees because the subsidiaries’ obligations are properlyaccounted for as costs of operations as services are provided or general operating obligations as incurred. Noadditional liability has been recorded for the lease guarantees because the subsidiaries’ obligations areproperly accounted for as operating or capital leases, as appropriate.
We currently do not believe it is reasonably likely that we would be called upon to perform under theseguarantees and do not believe that any of the obligations would have a material effect on our financial position,results of operations or cash flows.
Environmental Matters — A significant portion of our operating costs and capital expenditures could becharacterized as costs of environmental protection, as we are subject to an array of laws and regulations relating tothe protection of the environment. Under current laws and regulations, we may have liabilities for environmentaldamage caused by our operations, or for damage caused by conditions that existed before we acquired a site. Inaddition to remediation activity required by state or local authorities, such liabilities include PRP investigations.
101
WASTE MANAGEMENT, INC.
NOTES TO CONSOLIDATED FINANCIAL STATEMENTS — (Continued)
The costs associated with these liabilities can include settlements, certain legal and consultant fees, as well asincremental internal and external costs directly associated with site investigation and clean-up.
Estimating our degree of responsibility for remediation is inherently difficult. We recognize and accrue for anestimated remediation liability when we determine that such liability is both probable and reasonably estimable.Determining the method and ultimate cost of remediation requires that a number of assumptions be made. There cansometimes be a range of reasonable estimates of the costs associated with the investigation of the extent ofenvironmental impact and identification of likely site-remediation alternatives. In these cases, we use the amountwithin the range that constitutes our best estimate. If no amount within a range appears to be a better estimate thanany other, we use the amount that is the low end of such range. If we used the high ends of such ranges, our aggregatepotential liability would be approximately $150 million higher than the $284 million recorded in the ConsolidatedFinancial Statements as of December 31, 2010. Our ongoing review of our remediation liabilities, in light ofrelevant internal and external facts and circumstances, could result in revisions to our accruals that could causeupward or downward adjustments to income from operations. These adjustments could be material in any givenperiod.
As of December 31, 2010, we had been notified that we are a PRP in connection with 75 locations listed on theEPA’s National Priorities List, or NPL. Of the 75 sites at which claims have been made against us, 17 are sites weown. Each of the NPL sites we own was initially developed by others as a landfill disposal facility. At each of thesefacilities, we are working in conjunction with the government to characterize or remediate identified site problems,and we have either agreed with other legally liable parties on an arrangement for sharing the costs of remediation orare working toward a cost-sharing agreement. We generally expect to receive any amounts due from otherparticipating parties at or near the time that we make the remedial expenditures. The other 58 NPL sites, which wedo not own, are at various procedural stages under the Comprehensive Environmental Response, Compensation andLiability Act of 1980, as amended, known as CERCLA or Superfund.
The majority of these proceedings involve allegations that certain of our subsidiaries (or their predecessors)transported hazardous substances to the sites, often prior to our acquisition of these subsidiaries. CERCLAgenerally provides for liability for those parties owning, operating, transporting to or disposing at the sites.Proceedings arising under Superfund typically involve numerous waste generators and other waste transportationand disposal companies and seek to allocate or recover costs associated with site investigation and remediation,which costs could be substantial and could have a material adverse effect on our consolidated financial statements.At some of the sites at which we have been identified as a PRP, our liability is well defined as a consequence of agovernmental decision and an agreement among liable parties as to the share each will pay for implementing thatremedy. At other sites, where no remedy has been selected or the liable parties have been unable to agree on anappropriate allocation, our future costs are uncertain.
Litigation — In April 2002, two former participants in the ERISA plans of WM Holdings filed a lawsuit in theU.S. District Court for the District of Columbia in a case entitled William S. Harris, et al. v. James E. Koenig, et al.The lawsuit named as defendants WM Holdings; the members of WM Holdings’ Board of Directors prior to July1998; the administrative and investment committees of WM Holdings’ ERISA plans and their individual members;WM’s retirement savings plan; the investment committees of WM’s plan and its individual members; and StateStreet Bank & Trust, the trustee and investment manager of the ERISA plans. The lawsuit attempts to increase therecovery of a class of ERISA plan participants based on allegations related to both the events alleged in, and thesettlements relating to, the securities class action against WM Holdings that was settled in 1998 and the securitiesclass action against WM that was settled in 2001. During the second quarter of 2010, the Court dismissed certainclaims against individual defendants, including all claims against each of the current members of our Board ofDirectors. Mr. Simpson, our Chief Financial Officer, is a named defendant in these actions by virtue of hismembership on the WM ERISA plan Investment Committee at that time. Recently, plaintiffs dismissed all claimsrelated to the settlement of the securities class action against WM that was settled in 2001, and the court certified alimited class of participants who may bring claims on behalf of the plan, but not individually. All of the remainingdefendants intend to continue to defend themselves vigorously.
102
WASTE MANAGEMENT, INC.
NOTES TO CONSOLIDATED FINANCIAL STATEMENTS — (Continued)

Two separate wage and hour lawsuits were commenced in October 2006 and March 2007, respectively, that arepending against certain of our subsidiaries in California, each seeking class certification. The actions werecoordinated to proceed in San Diego County Superior Court. Both lawsuits make the same general allegations thatthe defendants failed to comply with certain California wage and hour laws, including allegedly failing to providemeal and rest periods and failing to properly pay hourly and overtime wages. We have executed a settlementagreement in connection with this matter; however, such settlement remains subject to final court approval andother contingencies.
Additionally, in July 2008, we were named as a defendant in a purported class action in the Circuit Court ofBullock County, Alabama, which was subsequently removed to the United States District Court for the NorthernDistrict of Alabama. This suit pertains to our fuel and environmental charge and generally alleges that such chargeswere not properly disclosed, were unfair, and were contrary to contract. We filed a motion to dismiss that waspartially granted during the third quarter of 2010, resulting in dismissal of the plaintiffs’ RICO and national classaction claims. We deny the claims in all of these actions and intend to continue to oppose class certification and willvigorously defend these matters. Given the inherent uncertainties of litigation, the ultimate outcome of these casescannot be predicted at this time, nor can possible damages, if any, be reasonably estimated.
From time to time, we also are named as defendants in personal injury and property damage lawsuits, includingpurported class actions, on the basis of having owned, operated or transported waste to a disposal facility that isalleged to have contaminated the environment or, in certain cases, on the basis of having conducted environmentalremediation activities at sites. Some of the lawsuits may seek to have us pay the costs of monitoring of allegedlyaffected sites and health care examinations of allegedly affected persons for a substantial period of time even whereno actual damage is proven. While we believe we have meritorious defenses to these lawsuits, the ultimateresolution is often substantially uncertain due to the difficulty of determining the cause, extent and impact of allegedcontamination (which may have occurred over a long period of time), the potential for successive groups ofcomplainants to emerge, the diversity of the individual plaintiffs’ circumstances, and the potential contribution orindemnification obligations of co-defendants or other third parties, among other factors.
As a large company with operations across the United States and Canada, we are subject to variousproceedings, lawsuits, disputes and claims arising in the ordinary course of our business. Many of these actionsraise complex factual and legal issues and are subject to uncertainties. Actions filed against us include commercial,customer, and employment-related claims, including, as noted above, purported class action lawsuits related to ourcustomer service agreements and purported class actions involving federal and state wage and hour and other laws.The plaintiffs in some actions seek unspecified damages or injunctive relief, or both. These actions are in variousprocedural stages, and some are covered in part by insurance. We currently do not believe that any such actions willultimately have a material adverse impact on our consolidated financial statements.
WM’s charter and bylaws require indemnification of its officers and directors if statutory standards of conducthave been met and allow the advancement of expenses to these individuals upon receipt of an undertaking by theindividuals to repay all expenses if it is ultimately determined that they did not meet the required standards ofconduct. Additionally, WM has entered into separate indemnification agreements with each of the members of itsBoard of Directors as well as its President and Chief Executive Officer, and its Chief Financial Officer. TheCompany may incur substantial expenses in connection with the fulfillment of its advancement of costs andindemnification obligations in connection with current actions involving former officers of the Company or itssubsidiaries or other actions or proceedings that may be brought against its former or current officers, directors andemployees.
Item 103 of the SEC’s Regulation S-K requires disclosure of certain environmental matters when a govern-mental authority is a party to the proceedings, or such proceedings are known to be contemplated, unless wereasonably believe that the matter will result in no monetary sanctions, or in monetary sanctions, exclusive of
103
WASTE MANAGEMENT, INC.
NOTES TO CONSOLIDATED FINANCIAL STATEMENTS — (Continued)

interest and costs, of less than $100,000. The following matters pending as of December 31, 2010 are disclosed inaccordance with that requirement:
On April 4, 2006, the EPA issued a Notice of Violation (“NOV”) to Waste Management of Hawaii, Inc., anindirect wholly-owned subsidiary of WM, and to the City and County of Honolulu for alleged violations of thefederal Clean Air Act, based on alleged failure to submit certain reports and design plans required by the EPA, andthe failure to begin and timely complete the installation of a gas collection and control system (“GCCS”) for theWaimanalo Gulch Sanitary Landfill on Oahu. The EPA has also indicated that it will seek penalties and injunctiverelief as part of the NOV enforcement for elevated landfill temperatures that were recorded after installation of theGCCS. The parties have been in confidential settlement negotiations. Pursuant to an indemnity agreement, anypenalty assessed will be paid by the Company, and not by the City and County of Honolulu.
The Massachusetts Attorney General’s Office has commenced investigations into allegations of violations ofthe Clean Air Act, the Clean Water Act, solid waste regulations and permits at Wheelabrator Group facilities inSaugus and North Andover, Massachusetts. The Attorney General’s Office is also considering intervening in twoprivate lawsuits alleging potential claims under the Massachusetts False Claims Act. No formal enforcement actionhas been brought against the Company, although we potentially could be subject to sanctions, including require-ments to pay monetary penalties. We are cooperating with the Attorney General’s office in the investigations.
Multiemployer, Defined Benefit Pension Plans — Over 20% of our workforce is covered by collectivebargaining agreements, which are with various union locals across the United States. As a result of some of theseagreements, certain of our subsidiaries are participating employers in a number of trustee-managed multiemployer,defined benefit pension plans for the affected employees. One of the most significant multiemployer pension plansin which we participate is the Central States Southeast and Southwest Areas Pension Plan (“Central States PensionPlan”), which has reported that it adopted a rehabilitation plan as a result of its actuarial certification for the planyear beginning January 1, 2008. The Central States Pension Plan is in “critical status,” as defined by the PensionProtection Act of 2006.
In connection with our ongoing renegotiation of various collective bargaining agreements, we may discuss andnegotiate for the complete or partial withdrawal from one or more of these pension plans. We recognized charges to“Operating” expenses of $26 million in 2010, $9 million in 2009 and $39 million in 2008 associated with thewithdrawal of certain bargaining units from underfunded multiemployer pension plans. Our partial withdrawalfrom the Central States Pension Plan accounted for all of our 2010 charges and $35 million of our 2008 charges. Weare still negotiating and litigating final resolutions of our withdrawal liability for these previous withdrawals, whichcould be materially higher than the charges we have recognized. We do not believe that our withdrawals from themultiemployer plans, individually or in the aggregate, will have a material adverse effect on our financial conditionor liquidity. However, depending on the number of employees withdrawn in any future period and the financialcondition of the multiemployer plans at the time of withdrawal, such withdrawals could materially affect our resultsof operations in the period of the withdrawal.
Tax Matters — We are currently in the examination phase of IRS audits for the tax years 2010 and 2011 andexpect these audits to be completed within the next 12 and 24 months, respectively. We participate in the IRS’sCompliance Assurance Program, which means we work with the IRS throughout the year in order to resolve anymaterial issues prior to the filing of our year-end tax return. We are also currently undergoing audits by various stateand local jurisdictions that date back to 2000. In the third quarter of 2010, we finalized audits in Canada through the2005 tax year and are not currently under audit for any subsequent tax years. To provide for certain potential taxexposures, we maintain a liability for unrecognized tax benefits, the balance of which management believes isadequate. Results of audit assessments by taxing authorities are not currently expected to have a material adverseimpact on our results of operations or cash flows.
12. Restructuring
2009 Restructuring — In January 2009, we took steps to further streamline our organization by (i) consol-idating many of our Market Areas; (ii) integrating the management of our recycling operations with our other solid
104
WASTE MANAGEMENT, INC.
NOTES TO CONSOLIDATED FINANCIAL STATEMENTS — (Continued)

waste business; and (iii) realigning our Corporate organization with this new structure in order to provide supportfunctions more efficiently.
Our principal operations are managed through our Groups, which are discussed in Note 21. Each of our fourgeographic Groups had been further divided into 45 Market Areas. As a result of our restructuring, the Market Areaswere consolidated into 25 Areas. We found that our larger Market Areas generally were able to achieve efficienciesthrough economies of scale that were not present in our smaller Market Areas, and this reorganization has allowedus to lower costs and to continue to standardize processes and improve productivity. In addition, during the firstquarter of 2009, responsibility for the oversight of day-to-day recycling operations at our material recovery facilitiesand secondary processing facilities was transferred from our Waste Management Recycle America, or WMRA,organization to our four geographic Groups. By integrating the management of our recycling facilities’ operationswith our other solid waste business, we are able to more efficiently provide comprehensive environmental solutionsto our customers. In addition, as a result of this realignment, we have significantly reduced the overhead costsassociated with managing this portion of our business and have increased the geographic Groups’ focus onmaximizing the profitability and return on invested capital of our business on an integrated basis.
This reorganization eliminated over 1,500 employee positions throughout the Company. During 2009, werecognized $50 million of pre-tax charges associated with this restructuring, of which $41 million were related toemployee severance and benefit costs. The remaining charges were primarily related to operating lease obligationsfor property that will no longer be utilized. The following table summarizes the charges recognized in 2009 for thisrestructuring by each of our reportable segments and our Corporate and Other organizations (in millions):
Eastern. . . . . . . . . . . . . . . . . . . . . . . . . . . . . . . . . . . . . . . . . . . . . . . . . . . . . . . . . . . . . . . . . . $12
Midwest . . . . . . . . . . . . . . . . . . . . . . . . . . . . . . . . . . . . . . . . . . . . . . . . . . . . . . . . . . . . . . . . . 11
Southern . . . . . . . . . . . . . . . . . . . . . . . . . . . . . . . . . . . . . . . . . . . . . . . . . . . . . . . . . . . . . . . . 10
Western . . . . . . . . . . . . . . . . . . . . . . . . . . . . . . . . . . . . . . . . . . . . . . . . . . . . . . . . . . . . . . . . . 6
Wheelabrator . . . . . . . . . . . . . . . . . . . . . . . . . . . . . . . . . . . . . . . . . . . . . . . . . . . . . . . . . . . . . 1
Corporate and Other . . . . . . . . . . . . . . . . . . . . . . . . . . . . . . . . . . . . . . . . . . . . . . . . . . . . . . . . 10
Total . . . . . . . . . . . . . . . . . . . . . . . . . . . . . . . . . . . . . . . . . . . . . . . . . . . . . . . . . . . . . . . . . . . $50
In 2010, we recognized $2 million of income related to the reversal of pre-tax restructuring charges. ThroughDecember 31, 2010, we had paid all of the employee severance and benefit costs incurred as a result of thisrestructuring.
2008 Restructuring — The $2 million of restructuring expenses recognized during 2008 was related to areorganization of customer service functions in our Western Group and the realignment of certain operations in ourSouthern Group.
13. (Income) Expense from Divestitures, Asset Impairments and Unusual Items
The following table summarizes the major components of “(Income) expense from divestitures, assetimpairments and unusual items” for the year ended December 31 for the respective periods (in millions):
2010 2009 2008
Years EndedDecember 31,
Income from divestitures . . . . . . . . . . . . . . . . . . . . . . . . . . . . . . . . . . . . . . . . $ (1) $— $(33)
Asset impairments . . . . . . . . . . . . . . . . . . . . . . . . . . . . . . . . . . . . . . . . . . . . . — 83 4
Other . . . . . . . . . . . . . . . . . . . . . . . . . . . . . . . . . . . . . . . . . . . . . . . . . . . . . . . (77) — —
$(78) $83 $(29)
105
WASTE MANAGEMENT, INC.
NOTES TO CONSOLIDATED FINANCIAL STATEMENTS — (Continued)

Income from Divestitures — The net gain from divestitures during 2008 was a result of our focus on sellingunderperforming businesses and primarily related to the divestiture of underperforming collection operations in ourSouthern Group.
Asset Impairments — Through December 31, 2008, we capitalized $70 million of accumulated costs asso-ciated with the development of a new waste and recycling revenue management system. A significant portion ofthese costs was specifically associated with the purchase of a license for waste and recycling revenue managementsoftware and the efforts required to develop and configure that software for our use. After a failed pilotimplementation of the software in one of our smallest Market Areas, the development efforts associated withthe revenue management system were suspended in 2007. During 2009, we determined to enhance and improve ourexisting revenue management system and not pursue alternatives associated with the development and imple-mentation of the licensed software. Accordingly, in 2009, we recognized a non-cash charge of $51 million,$49 million of which was recognized during the first quarter of 2009 and $2 million of which was recognized duringthe fourth quarter of 2009, for the abandonment of the licensed software.
We recognized an additional $32 million of impairment charges during 2009, $27 million of which wasrecognized by our Western Group during the fourth quarter of 2009 to fully impair a landfill in California as a resultof a change in our expectations for the future operations of the landfill. The remaining impairment charges wereprimarily attributable to a charge required to write down certain of our investments in portable self-storageoperations to their fair value as a result of our acquisition of a controlling financial interest in those operations.
During 2008, we recognized a $4 million impairment charge, primarily as a result of a decision to close alandfill in our Southern Group.
Other — We filed a lawsuit in March 2008 related to the revenue management software implementation thatwas suspended in 2007 and abandoned in 2009. In April 2010, we settled the lawsuit and received a one-time cashpayment. The settlement resulted in an increase in income from operations for the year ended December 31, 2010 of$77 million.
14. Accumulated Other Comprehensive Income
The components of accumulated other comprehensive income, which is included as a component of WasteManagement, Inc. stockholders’ equity, were as follows (in millions):
2010 2009 2008December 31,
Accumulated unrealized loss on derivative instruments, net of taxes of $20for 2010, $4 for 2009 and $12 for 2008 . . . . . . . . . . . . . . . . . . . . . . . . . . $ (33) $ (8) $ (19)
Accumulated unrealized gain (loss) on marketable securities, net of taxes of$3 for 2010, $1 for 2009 and $1 for 2008. . . . . . . . . . . . . . . . . . . . . . . . . 5 2 (2)
Foreign currency translation adjustments . . . . . . . . . . . . . . . . . . . . . . . . . . . 261 212 113
Funded status of post-retirement benefit obligations, net of taxes of $4 for2010, $1 for 2009 and $5 for 2008 . . . . . . . . . . . . . . . . . . . . . . . . . . . . . . (3) 2 (4)
$230 $208 $ 88
15. Capital Stock, Share Repurchases and Dividends
Capital Stock
As of December 31, 2010, we have 475.0 million shares of common stock issued and outstanding. We have1.5 billion shares of authorized common stock with a par value of $0.01 per common share. The Board of Directorsis authorized to issue preferred stock in series, and with respect to each series, to fix its designation, relative rights(including voting, dividend, conversion, sinking fund, and redemption rights), preferences (including dividends and
106
WASTE MANAGEMENT, INC.
NOTES TO CONSOLIDATED FINANCIAL STATEMENTS — (Continued)
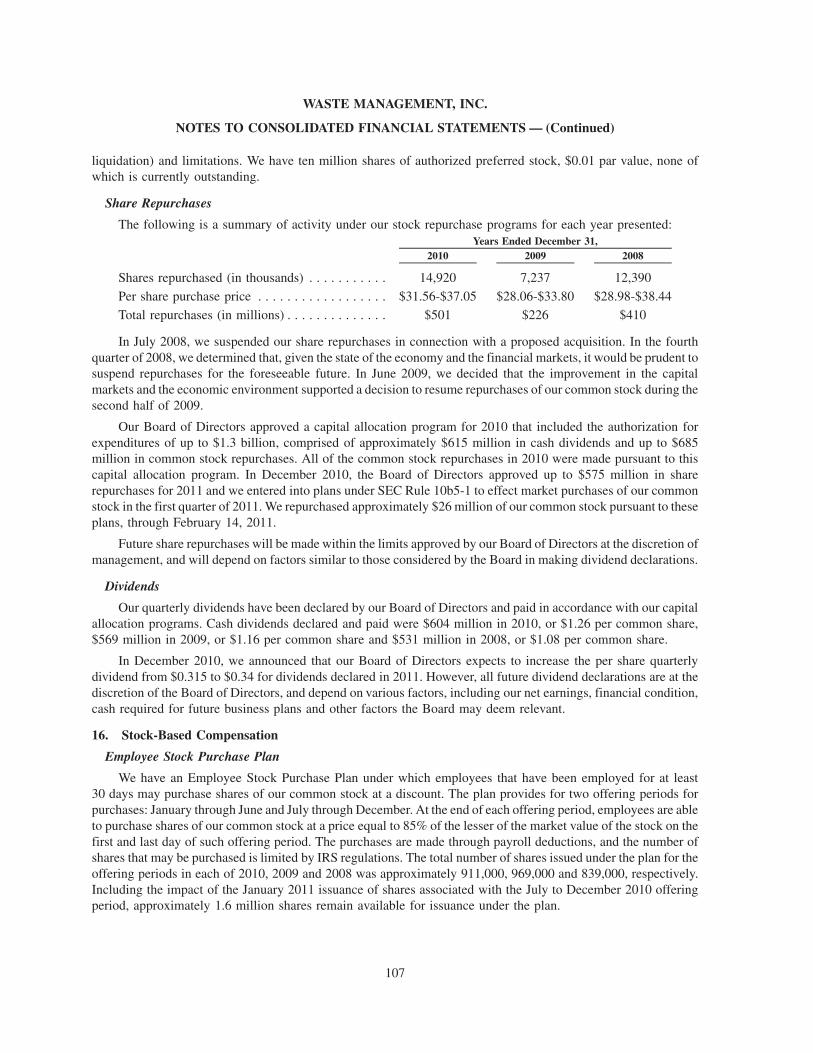
liquidation) and limitations. We have ten million shares of authorized preferred stock, $0.01 par value, none ofwhich is currently outstanding.
Share Repurchases
The following is a summary of activity under our stock repurchase programs for each year presented:
2010 2009 2008Years Ended December 31,
Shares repurchased (in thousands) . . . . . . . . . . . 14,920 7,237 12,390
Per share purchase price . . . . . . . . . . . . . . . . . . $31.56-$37.05 $28.06-$33.80 $28.98-$38.44
Total repurchases (in millions) . . . . . . . . . . . . . . $501 $226 $410
In July 2008, we suspended our share repurchases in connection with a proposed acquisition. In the fourthquarter of 2008, we determined that, given the state of the economy and the financial markets, it would be prudent tosuspend repurchases for the foreseeable future. In June 2009, we decided that the improvement in the capitalmarkets and the economic environment supported a decision to resume repurchases of our common stock during thesecond half of 2009.
Our Board of Directors approved a capital allocation program for 2010 that included the authorization forexpenditures of up to $1.3 billion, comprised of approximately $615 million in cash dividends and up to $685million in common stock repurchases. All of the common stock repurchases in 2010 were made pursuant to thiscapital allocation program. In December 2010, the Board of Directors approved up to $575 million in sharerepurchases for 2011 and we entered into plans under SEC Rule 10b5-1 to effect market purchases of our commonstock in the first quarter of 2011. We repurchased approximately $26 million of our common stock pursuant to theseplans, through February 14, 2011.
Future share repurchases will be made within the limits approved by our Board of Directors at the discretion ofmanagement, and will depend on factors similar to those considered by the Board in making dividend declarations.
Dividends
Our quarterly dividends have been declared by our Board of Directors and paid in accordance with our capitalallocation programs. Cash dividends declared and paid were $604 million in 2010, or $1.26 per common share,$569 million in 2009, or $1.16 per common share and $531 million in 2008, or $1.08 per common share.
In December 2010, we announced that our Board of Directors expects to increase the per share quarterlydividend from $0.315 to $0.34 for dividends declared in 2011. However, all future dividend declarations are at thediscretion of the Board of Directors, and depend on various factors, including our net earnings, financial condition,cash required for future business plans and other factors the Board may deem relevant.
16. Stock-Based Compensation
Employee Stock Purchase Plan
We have an Employee Stock Purchase Plan under which employees that have been employed for at least30 days may purchase shares of our common stock at a discount. The plan provides for two offering periods forpurchases: January through June and July through December. At the end of each offering period, employees are ableto purchase shares of our common stock at a price equal to 85% of the lesser of the market value of the stock on thefirst and last day of such offering period. The purchases are made through payroll deductions, and the number ofshares that may be purchased is limited by IRS regulations. The total number of shares issued under the plan for theoffering periods in each of 2010, 2009 and 2008 was approximately 911,000, 969,000 and 839,000, respectively.Including the impact of the January 2011 issuance of shares associated with the July to December 2010 offeringperiod, approximately 1.6 million shares remain available for issuance under the plan.
107
WASTE MANAGEMENT, INC.
NOTES TO CONSOLIDATED FINANCIAL STATEMENTS — (Continued)

Accounting for our Employee Stock Purchase Plan increased annual compensation expense by approximately$7 million, or $4 million net of tax, for 2010 and by $6 million, or $4 million net of tax, for both 2009 and 2008.
Employee Stock Incentive Plans
We grant equity and equity-based awards to our officers, employees and independent directors. TheCompany’s 2004 Stock Incentive Plan, which authorized the issuance of up to 34 million shares of our commonstock, terminated by its terms in May 2009, at which time our stockholders approved our 2009 Stock Incentive Plan.The 2009 Plan provides for the issuance of up to 26.2 million shares of our common stock. As of December 31,2010, approximately 16.0 million shares remain available for issuance under the 2009 Plan. We currently utilizetreasury shares to meet the needs of our equity-based compensation programs.
Pursuant to the 2009 Plan, we have the ability to issue stock options, stock appreciation rights and stockawards, including restricted stock, restricted stock units, or RSUs, and performance share units, or PSUs. The termsand conditions of equity awards granted under the 2009 Plan are determined by the Management Development andCompensation Committee of our Board of Directors.
The Company grants equity awards to certain key employees as part of its long-term incentive plan, or LTIP.The annual LTIP awards granted in 2008 and 2009 included a combination of RSUs and PSUs. In 2010, were-introduced stock options as a component of equity compensation, and key employees were granted a combi-nation of PSUs and stock options. Beginning in 2008, the annual LTIP award made to the Company’s seniorleadership team, which generally includes the Company’s executive officers, was comprised solely of PSUs. Wecontinued this practice in 2009; however, in 2010, the annual LTIP award to the Company’s senior leadership teamincluded a combination of PSUs and stock options. During the reported periods, the Company has also grantedrestricted stock units and stock options to employees working on key initiatives; in connection with new hires andpromotions; and to field-based managers.
Restricted Stock Units — A summary of our RSUs is presented in the table below (units in thousands):
Units
WeightedAverage
FairValue Units
WeightedAverage
FairValue Units
WeightedAverage
FairValue
2010 2009 2008Years Ended December 31,
Unvested, beginning of year. . . . . . . . . . . . . . . . . 1,030 $30.76 1,121 $33.46 1,124 $32.58
Granted. . . . . . . . . . . . . . . . . . . . . . . . . . . . . . . . 8 $34.25 369 $23.66 359 $33.33
Vested(a). . . . . . . . . . . . . . . . . . . . . . . . . . . . . . . (428) $35.37 (412) $31.49 (338) $30.41
Forfeited . . . . . . . . . . . . . . . . . . . . . . . . . . . . . . . (24) $26.54 (48) $32.81 (24) $33.22
Unvested, end of year . . . . . . . . . . . . . . . . . . . . . 586 $27.61 1,030 $30.76 1,121 $33.46
(a) The total fair market value of the shares issued upon the vesting of RSUs during the years ended December 31,2010, 2009 and 2008 was $14 million, $13 million and $11 million, respectively.
RSUs provide award recipients with dividend equivalents during the vesting period, but the units may not bevoted or sold until time-based vesting restrictions have lapsed. RSUs provide for three-year cliff vesting. Unvestedunits are subject to forfeiture in the event of voluntary or for-cause termination. RSUs are subject to pro-rata vestingupon an employee’s retirement or involuntary termination other than for cause and become immediately vested inthe event of an employee’s death or disability.
Compensation expense associated with RSUs is measured based on the grant-date fair value of our commonstock and is recognized on a straight-line basis over the required employment period, which is generally the vestingperiod. Compensation expense is only recognized for those awards that we expect to vest, which we estimate basedupon an assessment of current period and historical forfeitures.
108
WASTE MANAGEMENT, INC.
NOTES TO CONSOLIDATED FINANCIAL STATEMENTS — (Continued)
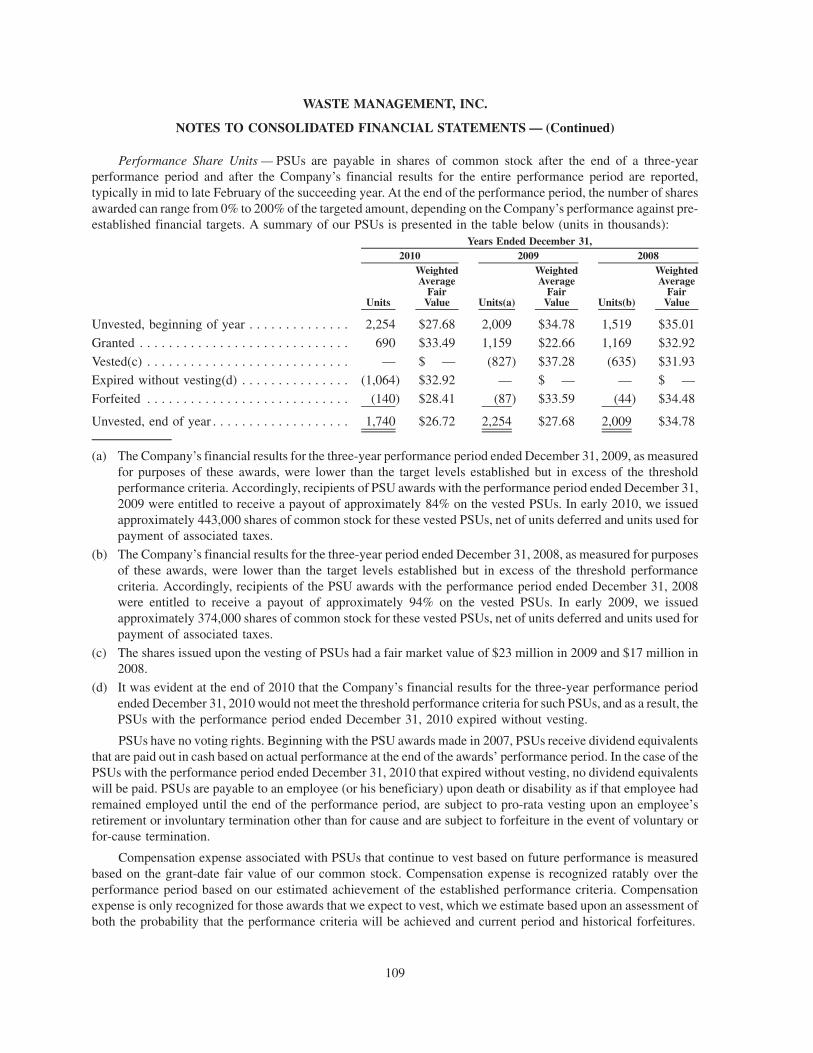
Performance Share Units — PSUs are payable in shares of common stock after the end of a three-yearperformance period and after the Company’s financial results for the entire performance period are reported,typically in mid to late February of the succeeding year. At the end of the performance period, the number of sharesawarded can range from 0% to 200% of the targeted amount, depending on the Company’s performance against pre-established financial targets. A summary of our PSUs is presented in the table below (units in thousands):
Units
WeightedAverage
FairValue Units(a)
WeightedAverage
FairValue Units(b)
WeightedAverage
FairValue
2010 2009 2008Years Ended December 31,
Unvested, beginning of year . . . . . . . . . . . . . . 2,254 $27.68 2,009 $34.78 1,519 $35.01
Granted . . . . . . . . . . . . . . . . . . . . . . . . . . . . . 690 $33.49 1,159 $22.66 1,169 $32.92
Vested(c) . . . . . . . . . . . . . . . . . . . . . . . . . . . . — $ — (827) $37.28 (635) $31.93Expired without vesting(d) . . . . . . . . . . . . . . . (1,064) $32.92 — $ — — $ —
Forfeited . . . . . . . . . . . . . . . . . . . . . . . . . . . . (140) $28.41 (87) $33.59 (44) $34.48
Unvested, end of year . . . . . . . . . . . . . . . . . . . 1,740 $26.72 2,254 $27.68 2,009 $34.78
(a) The Company’s financial results for the three-year performance period ended December 31, 2009, as measuredfor purposes of these awards, were lower than the target levels established but in excess of the thresholdperformance criteria. Accordingly, recipients of PSU awards with the performance period ended December 31,2009 were entitled to receive a payout of approximately 84% on the vested PSUs. In early 2010, we issuedapproximately 443,000 shares of common stock for these vested PSUs, net of units deferred and units used forpayment of associated taxes.
(b) The Company’s financial results for the three-year period ended December 31, 2008, as measured for purposesof these awards, were lower than the target levels established but in excess of the threshold performancecriteria. Accordingly, recipients of the PSU awards with the performance period ended December 31, 2008were entitled to receive a payout of approximately 94% on the vested PSUs. In early 2009, we issuedapproximately 374,000 shares of common stock for these vested PSUs, net of units deferred and units used forpayment of associated taxes.
(c) The shares issued upon the vesting of PSUs had a fair market value of $23 million in 2009 and $17 million in2008.
(d) It was evident at the end of 2010 that the Company’s financial results for the three-year performance periodended December 31, 2010 would not meet the threshold performance criteria for such PSUs, and as a result, thePSUs with the performance period ended December 31, 2010 expired without vesting.
PSUs have no voting rights. Beginning with the PSU awards made in 2007, PSUs receive dividend equivalentsthat are paid out in cash based on actual performance at the end of the awards’ performance period. In the case of thePSUs with the performance period ended December 31, 2010 that expired without vesting, no dividend equivalentswill be paid. PSUs are payable to an employee (or his beneficiary) upon death or disability as if that employee hadremained employed until the end of the performance period, are subject to pro-rata vesting upon an employee’sretirement or involuntary termination other than for cause and are subject to forfeiture in the event of voluntary orfor-cause termination.
Compensation expense associated with PSUs that continue to vest based on future performance is measuredbased on the grant-date fair value of our common stock. Compensation expense is recognized ratably over theperformance period based on our estimated achievement of the established performance criteria. Compensationexpense is only recognized for those awards that we expect to vest, which we estimate based upon an assessment ofboth the probability that the performance criteria will be achieved and current period and historical forfeitures.
109
WASTE MANAGEMENT, INC.
NOTES TO CONSOLIDATED FINANCIAL STATEMENTS — (Continued)

Stock Options — Prior to 2005, stock options were the primary form of equity-based compensation we grantedto our employees. In 2010, the Management Development and Compensation Committee decided to re-introducestock options as a component of our LTIP awards. All of our previously granted stock option awards have vested,with the exception of any grants pursuant to the reload feature discussed in footnote (a) to the table below. The stockoptions will vest in 25% increments on the first two anniversaries of the date of grant and the remaining 50% willvest on the third anniversary. The exercise price of the options is the fair market value of our common stock on thedate of grant, and the options have a term of 10 years. A summary of our stock options is presented in the table below(shares in thousands):
Shares
WeightedAverageExercise
Price Shares
WeightedAverageExercise
Price Shares
WeightedAverageExercise
Price
2010 2009 2008Years Ended December 31,
Outstanding, beginning of year . . . . . . . . . . . . 8,800 $25.98 11,045 $26.97 14,620 $29.33
Granted(a) . . . . . . . . . . . . . . . . . . . . . . . . . . . 3,901 $33.56 1 $27.90 6 $35.27
Exercised(b) . . . . . . . . . . . . . . . . . . . . . . . . . . (2,454) $25.17 (1,285) $30.20 (1,506) $24.95
Forfeited or expired . . . . . . . . . . . . . . . . . . . . (290) $32.88 (961) $39.62 (2,075) $45.09
Outstanding, end of year(c) . . . . . . . . . . . . . . . 9,957 $28.95 8,800 $25.98 11,045 $26.97
Exercisable, end of year(d) . . . . . . . . . . . . . . . 6,286 $26.25 8,798 $25.98 11,044 $26.97
(a) Although we stopped granting stock options from 2005 through 2009, some of our previously issued andoutstanding options have a reload feature that provides for the automatic grant of a new stock option when theexercise price of the existing stock option is paid using already owned shares of common stock. The new optionis for the same number of shares used as payment of the exercise price.
(b) The aggregate intrinsic value of stock options exercised during the years ended December 31, 2010, 2009 and2008 was $25 million, $12 million and $16 million, respectively.
(c) Stock options outstanding as of December 31, 2010 have a weighted average remaining contractual term of4.66 years and an aggregate intrinsic value of $79 million based on the market value of our common stock onDecember 31, 2010.
(d) The aggregate intrinsic value of stock options exercisable as of December 31, 2010 was $67 million.
We received cash proceeds of $54 million, $20 million and $37 million during the years ended December 31,2010, 2009 and 2008, respectively, from our employees’ stock option exercises. We also realized tax benefits fromthese stock option exercises during the years ended December 31, 2010, 2009 and 2008 of $10 million, $5 millionand $6 million, respectively. These amounts have been presented as cash inflows in the “Cash flows from financingactivities” section of our Consolidated Statements of Cash Flows.
Exercisable stock options at December 31, 2010, were as follows (shares in thousands):
Range of Exercise Prices SharesWeighted Average
Exercise PriceWeighted AverageRemaining Years
$19.61-$20.00 . . . . . . . . . . . . . . . . . . . . . . . . . . . . . . . 1,169 $19.61 2.18
$20.01-$30.00 . . . . . . . . . . . . . . . . . . . . . . . . . . . . . . . 4,969 $27.59 2.20
$30.01-$39.93 . . . . . . . . . . . . . . . . . . . . . . . . . . . . . . . 148 $33.94 1.73
$19.61-$39.93 . . . . . . . . . . . . . . . . . . . . . . . . . . . . . . . 6,286 $26.25 2.19
All unvested stock options granted in 2010 shall become exercisable upon the award recipient’s death ordisability. In the event of a recipient’s retirement, stock options shall continue to vest pursuant to the originalschedule set forth in the award agreement. If the recipient is terminated by the Company without cause, the recipient
110
WASTE MANAGEMENT, INC.
NOTES TO CONSOLIDATED FINANCIAL STATEMENTS — (Continued)

shall be entitled to exercise all 2010 stock options outstanding and exercisable prior to such termination. Alloutstanding stock options, whether exercisable or not, are forfeited upon termination with cause.
We account for our employee stock options under the fair value method of accounting using a Black-Scholesmethodology to measure stock option expense at the date of grant. The fair value of the stock options at the date ofgrant is amortized to expense over the vesting period. The following table presents the assumptions used to valueemployee stock options granted during the year ended December 31, 2010 under the Black-Scholes valuationmodel:
Expected option life . . . . . . . . . . . . . . . . . . . . . . . . . . . . . . . . . . . . . . . . . . . . . . . . . . . . 5.7 years
Expected volatility . . . . . . . . . . . . . . . . . . . . . . . . . . . . . . . . . . . . . . . . . . . . . . . . . . . . . 24.8%
Expected dividend yield . . . . . . . . . . . . . . . . . . . . . . . . . . . . . . . . . . . . . . . . . . . . . . . . . 3.8%
Risk-free interest rate . . . . . . . . . . . . . . . . . . . . . . . . . . . . . . . . . . . . . . . . . . . . . . . . . . . 2.9%
The Company bases its expected option life on the expected exercise and termination behavior of its optioneesand an appropriate model of the Company’s future stock price. The expected volatility assumption is derived fromthe historical volatility of the Company’s common stock over the most recent period commensurate with theestimated expected life of the Company’s stock options, combined with other relevant factors including impliedvolatility in market-traded options on the Company’s stock. The dividend yield is the annual rate of dividends pershare over the exercise price of the option as of the grant date.
For the years ended December 31, 2010, 2009 and 2008, we recognized $28 million, $22 million, and$42 million, respectively, of compensation expense associated with RSU, PSU and stock option awards as acomponent of “Selling, general and administrative” expenses in our Consolidated Statement of Operations. Our“Provision for income taxes” for the years ended December 31, 2010, 2009 and 2008 includes related deferredincome tax benefits of $11 million, $9 million and $16 million, respectively. We have not capitalized any equity-based compensation costs during the years ended December 31, 2010, 2009 and 2008.
Compensation expense recognized in 2009 was significantly less than expense recognized in 2008 primarilydue to the Company’s determination that it was no longer probable that the targets established for PSUs granted in2008 would be met. Accordingly, during the second quarter of 2009, we recognized an adjustment to “Selling,general and administrative” expenses for the reversal of all previously recognized compensation expense associatedwith this award. Additionally, we did not recognize any compensation expense in 2010 associated with the PSUsgranted in 2008. These PSUs expired without vesting on December 31, 2010. As of December 31, 2010, we estimatethat a total of approximately $40 million of currently unrecognized compensation expense will be recognized infuture periods for unvested RSU, PSU and stock option awards issued and outstanding. Unrecognized compensationexpense associated with all unvested awards currently outstanding is expected to be recognized over a weightedaverage period of approximately two years.
Non-Employee Director Plans
Our non-employee directors currently receive annual grants of shares of our common stock, payable in twoequal installments, under the 2009 Plan described above. Prior to 2008, our directors received deferred stock unitsand were allowed to elect to defer a portion of their cash compensation in the form of deferred stock units, to be paidout in shares of our common stock at the termination of board service, pursuant to our 2003 Directors’ DeferredCompensation Plan. In late 2007, each member of the Board of Directors elected to receive payment of shares forhis deferred stock units at the end of December 2008 and recognized taxable income on such payment. The Board ofDirectors terminated the 2003 Directors’ Plan in 2009 and, as a result, no shares remain available for issuance underthat plan.
111
WASTE MANAGEMENT, INC.
NOTES TO CONSOLIDATED FINANCIAL STATEMENTS — (Continued)

17. Earnings Per Share
Basic and diluted earnings per share were computed using the following common share data (shares inmillions):
2010 2009 2008Years Ended December 31,
Number of common shares outstanding at year-end . . . . . . . . . . . . . . . . . . 475.0 486.1 490.7
Effect of using weighted average common shares outstanding . . . . . . . . . . 5.2 5.1 1.4
Weighted average basic common shares outstanding . . . . . . . . . . . . . . . . . 480.2 491.2 492.1
Dilutive effect of equity-based compensation awards and othercontingently issuable shares. . . . . . . . . . . . . . . . . . . . . . . . . . . . . . . . . . 2.0 2.4 3.3
Weighted average diluted common shares outstanding . . . . . . . . . . . . . . . . 482.2 493.6 495.4
Potentially issuable shares. . . . . . . . . . . . . . . . . . . . . . . . . . . . . . . . . . . . . 12.8 13.2 15.1
Number of anti-dilutive potentially issuable shares excluded from dilutedcommon shares outstanding . . . . . . . . . . . . . . . . . . . . . . . . . . . . . . . . . . 0.3 0.3 0.8
18. Fair Value Measurements
Assets and Liabilities Accounted for at Fair Value
Authoritative guidance associated with fair value measurements provides a framework for measuring fairvalue and establishes a fair value hierarchy that prioritizes the inputs used to measure fair value, giving the highestpriority to unadjusted quoted prices in active markets for identical assets or liabilities (Level 1 inputs) and the lowestpriority to unobservable inputs (Level 3 inputs).
We use valuation techniques that maximize the use of observable inputs and minimize the use of unobservableinputs. In measuring the fair value of our assets and liabilities, we use market data or assumptions that we believemarket participants would use in pricing an asset or liability, including assumptions about risk when appropriate.Our assets and liabilities that are measured at fair value on a recurring basis include the following (in millions):
Total
QuotedPrices in
ActiveMarkets(Level 1)
SignificantOther
ObservableInputs
(Level 2)
SignificantUnobservable
Inputs(Level 3)
Fair Value Measurements atDecember 31, 2010 Using
Assets:
Cash equivalents . . . . . . . . . . . . . . . . . . . . . . . . . . $468 $468 $— $—
Available-for-sale securities . . . . . . . . . . . . . . . . . . 148 148 — —
Interest in available-for-sale securities ofunconsolidated entities . . . . . . . . . . . . . . . . . . . . 103 103 — —
Interest rate derivatives . . . . . . . . . . . . . . . . . . . . . . 38 — 38 —
Total assets. . . . . . . . . . . . . . . . . . . . . . . . . . . . . $757 $719 $38 $—
Liabilities:
Interest rate derivatives . . . . . . . . . . . . . . . . . . . . . . $ 24 $ — $24 $—
Foreign currency derivatives . . . . . . . . . . . . . . . . . . 3 — 3 —
Electricity commodity derivatives . . . . . . . . . . . . . . 1 — 1 —
Total liabilities . . . . . . . . . . . . . . . . . . . . . . . . . . $ 28 $ — $28 $—
112
WASTE MANAGEMENT, INC.
NOTES TO CONSOLIDATED FINANCIAL STATEMENTS — (Continued)
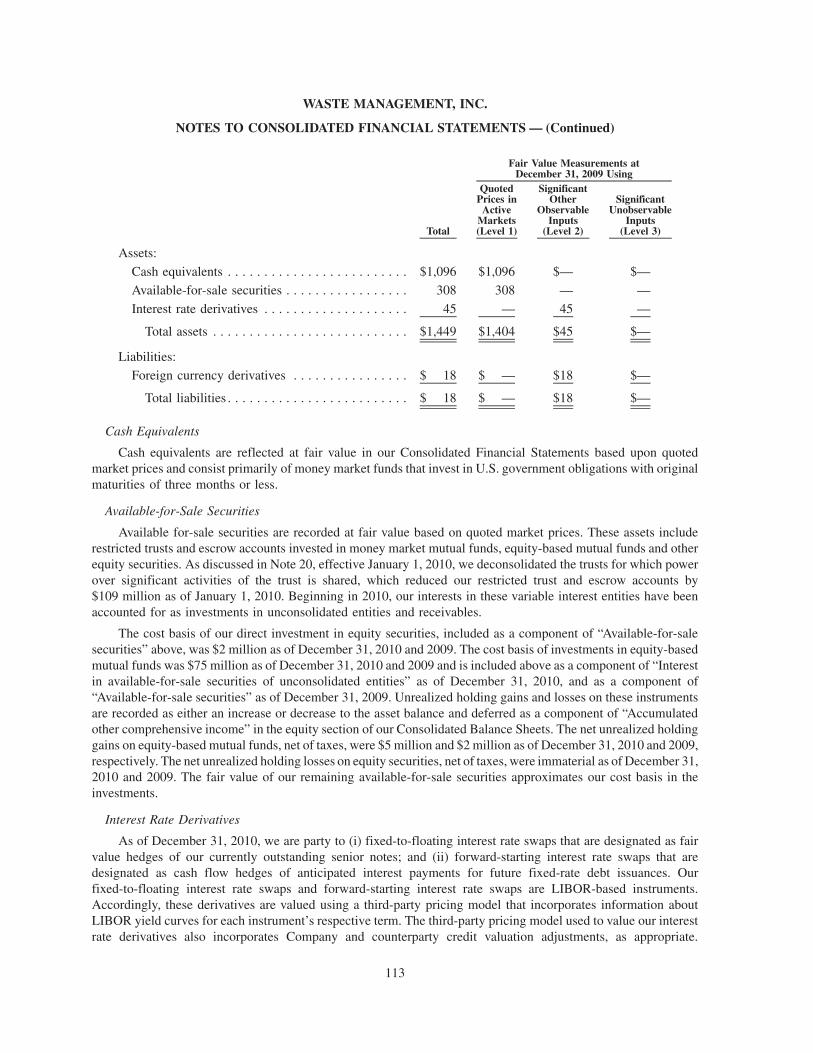
Total
QuotedPrices in
ActiveMarkets(Level 1)
SignificantOther
ObservableInputs
(Level 2)
SignificantUnobservable
Inputs(Level 3)
Fair Value Measurements atDecember 31, 2009 Using
Assets:
Cash equivalents . . . . . . . . . . . . . . . . . . . . . . . . . $1,096 $1,096 $— $—
Available-for-sale securities . . . . . . . . . . . . . . . . . 308 308 — —
Interest rate derivatives . . . . . . . . . . . . . . . . . . . . 45 — 45 —
Total assets . . . . . . . . . . . . . . . . . . . . . . . . . . . $1,449 $1,404 $45 $—
Liabilities:
Foreign currency derivatives . . . . . . . . . . . . . . . . $ 18 $ — $18 $—
Total liabilities . . . . . . . . . . . . . . . . . . . . . . . . . $ 18 $ — $18 $—
Cash Equivalents
Cash equivalents are reflected at fair value in our Consolidated Financial Statements based upon quotedmarket prices and consist primarily of money market funds that invest in U.S. government obligations with originalmaturities of three months or less.
Available-for-Sale Securities
Available for-sale securities are recorded at fair value based on quoted market prices. These assets includerestricted trusts and escrow accounts invested in money market mutual funds, equity-based mutual funds and otherequity securities. As discussed in Note 20, effective January 1, 2010, we deconsolidated the trusts for which powerover significant activities of the trust is shared, which reduced our restricted trust and escrow accounts by$109 million as of January 1, 2010. Beginning in 2010, our interests in these variable interest entities have beenaccounted for as investments in unconsolidated entities and receivables.
The cost basis of our direct investment in equity securities, included as a component of “Available-for-salesecurities” above, was $2 million as of December 31, 2010 and 2009. The cost basis of investments in equity-basedmutual funds was $75 million as of December 31, 2010 and 2009 and is included above as a component of “Interestin available-for-sale securities of unconsolidated entities” as of December 31, 2010, and as a component of“Available-for-sale securities” as of December 31, 2009. Unrealized holding gains and losses on these instrumentsare recorded as either an increase or decrease to the asset balance and deferred as a component of “Accumulatedother comprehensive income” in the equity section of our Consolidated Balance Sheets. The net unrealized holdinggains on equity-based mutual funds, net of taxes, were $5 million and $2 million as of December 31, 2010 and 2009,respectively. The net unrealized holding losses on equity securities, net of taxes, were immaterial as of December 31,2010 and 2009. The fair value of our remaining available-for-sale securities approximates our cost basis in theinvestments.
Interest Rate Derivatives
As of December 31, 2010, we are party to (i) fixed-to-floating interest rate swaps that are designated as fairvalue hedges of our currently outstanding senior notes; and (ii) forward-starting interest rate swaps that aredesignated as cash flow hedges of anticipated interest payments for future fixed-rate debt issuances. Ourfixed-to-floating interest rate swaps and forward-starting interest rate swaps are LIBOR-based instruments.Accordingly, these derivatives are valued using a third-party pricing model that incorporates information aboutLIBOR yield curves for each instrument’s respective term. The third-party pricing model used to value our interestrate derivatives also incorporates Company and counterparty credit valuation adjustments, as appropriate.
113
WASTE MANAGEMENT, INC.
NOTES TO CONSOLIDATED FINANCIAL STATEMENTS — (Continued)

Counterparties to our interest rate derivatives are financial institutions who participate in our $2.0 billion revolvingcredit facility. Valuations of our interest rate derivatives may fluctuate significantly from period-to-period due tovolatility in underlying interest rates, which are driven by market conditions and the scheduled maturities of thederivatives. Refer to Note 8 for additional information regarding our interest rate derivatives.
Foreign Currency Derivatives
Our foreign currency derivatives are valued using a third-party pricing model that incorporates informationabout forward Canadian dollar exchange prices as of the reporting date. The third-party pricing model used to valueour foreign currency derivatives also incorporates Company and counterparty credit valuation adjustments, asappropriate. Counterparties to these contracts are financial institutions who participate in our $2.0 billion revolvingcredit facility. Valuations may fluctuate significantly from period-to-period due to volatility in the Canadian dollarto U.S. dollar exchange rate. Refer to Note 8 for additional information regarding our foreign currency derivatives.
Fair Value of Debt
At both December 31, 2010 and 2009, the carrying value of our debt was approximately $8.9 billion. Thecarrying value of our debt includes adjustments for both the unamortized fair value adjustments related toterminated hedge arrangements and fair value adjustments of debt instruments that are currently hedged.
The estimated fair value of our debt was approximately $9.2 billion at December 31, 2010 and approximately$9.3 billion at December 31, 2009. The estimated fair value of our senior notes is based on quoted market prices.The carrying value of remarketable debt approximates fair value due to the short-term nature of the interest rates.The fair value of our other debt is estimated using discounted cash flow analysis, based on rates we would currentlypay for similar types of instruments.
Although we have determined the estimated fair value amounts using available market information andcommonly accepted valuation methodologies, considerable judgment is required in interpreting market data todevelop the estimates of fair value. Accordingly, our estimates are not necessarily indicative of the amounts that we,or holders of the instruments, could realize in a current market exchange. The use of different assumptions and/orestimation methodologies could have a material effect on the estimated fair values. The fair value estimates arebased on information available as of December 31, 2010 and December 31, 2009. These amounts have not beenrevalued since those dates, and current estimates of fair value could differ significantly from the amounts presented.
19. Acquisitions and Divestitures
Acquisitions
We continue to pursue the acquisition of businesses that are accretive to our solid waste operations and enhanceand expand our existing service offerings. We have seen the greatest opportunities for realizing superior returnsfrom tuck-in acquisitions, which are primarily the purchases of collection operations that enhance our existing routestructures and are strategically located near our existing disposal operations.
In 2010, we acquired businesses primarily related to our collection and waste-to-energy operations. Totalconsideration, net of cash acquired, for acquisitions was $427 million, which included $379 million in cashpayments, $20 million in contributed assets, a liability for additional cash payments with an estimated fair value of$23 million, and assumed liabilities of $5 million. The additional cash payments are contingent upon achievementby the acquired businesses of certain negotiated goals, which generally included targeted revenues. At the date ofacquisition, our estimated maximum obligations for the contingent cash payments were $23 million. As ofDecember 31, 2010, we had paid $8 million of this contingent consideration. In 2010, we also paid $20 million ofcontingent consideration associated with acquisitions completed in 2009.
The allocation of purchase price was primarily to “Property and equipment,” which had an estimated fair valueof $279 million; “Other intangible assets,” which had an estimated fair value of $98 million; and “Goodwill” of$77 million. Goodwill is primarily a result of expected synergies from combining the acquired businesses with ourexisting operations and is tax deductible.
114
WASTE MANAGEMENT, INC.
NOTES TO CONSOLIDATED FINANCIAL STATEMENTS — (Continued)

In 2009, we acquired businesses primarily related to our collection operations. Total consideration, net of cashacquired, for acquisitions was $329 million, which included $259 million in cash payments, a liability for additionalcash payments with an estimated fair value of $46 million, and assumed liabilities of $24 million. The additionalcash payments are contingent upon achievement by the acquired businesses of certain negotiated goals, whichgenerally included targeted revenues. At the date of acquisition, our estimated obligations for the contingent cashpayments were between $42 million and $56 million. As of December 31, 2009, we had paid $15 million of thiscontingent consideration. In 2009, we also paid $7 million of contingent consideration associated with acquisitionscompleted in 2008.
The allocation of purchase price was primarily to “Property and equipment,” which had an estimated fair valueof $102 million; “Other intangible assets,” which had an estimated fair value of $105 million; and “Goodwill” of$125 million. Goodwill is primarily a result of expected synergies from combining the acquired businesses with ourexisting operations and is tax deductible.
Our 2009 acquisitions included the purchase of the remaining equity interest in one of our portable self-storageinvestments, increasing our equity interest in this entity from 50% to 100%. As a result of this acquisition, werecognized a $4 million loss for the remeasurement of the fair value of our initial equity investment, which wasdetermined to be $5 million. This loss was recognized as a component of “(Income) expense from divestitures, assetimpairments and unusual items” in our Statement of Operations.
In 2008, we completed several acquisitions for a cost, net of cash acquired, of $280 million.
Divestitures
The aggregate sales price for divestitures of operations was $1 million in 2010, $1 million in 2009 and$59 million in 2008. The proceeds from these sales were comprised substantially of cash. We recognized net gainson these divestitures of $1 million in 2010 and $33 million in 2008. The impact to our 2009 income from operationsof gains and losses on divestitures was less than $1 million. These divestitures were made as part of our initiative toimprove or divest certain underperforming and non-strategic operations.
20. Variable Interest Entities
Following is a description of our financial interests in variable interest entities that we consider significant,including (i) those for which we have determined that we are the primary beneficiary of the entity and, therefore,have consolidated the entities into our financial statements; and (ii) those that represent a significant interest in anunconsolidated entity.
Consolidated Variable Interest Entities
Waste-to-Energy LLCs — In June 2000, two limited liability companies were established to purchase interestsin existing leveraged lease financings at three waste-to-energy facilities that we lease, operate and maintain. Weown a 0.5% interest in one of the LLCs (“LLC I”) and a 0.25% interest in the second LLC (“LLC II”). John HancockLife Insurance Company owns 99.5% of LLC I and 99.75% of LLC II is owned by LLC I and the CIT Group. In2000, Hancock and CIT made an initial investment of $167 million in the LLCs, which was used to purchase thethree waste-to-energy facilities and assume the seller’s indebtedness. Under the LLC agreements, the LLCs shall bedissolved upon the occurrence of any of the following events: (i) a written decision of all members of the LLCs;(ii) December 31, 2063; (iii) a court’s dissolution of the LLCs; or (iv) the LLCs ceasing to own any interest in thewaste-to-energy facilities.
Income, losses and cash flows of the LLCs are allocated to the members based on their initial capital accountbalances until Hancock and CIT achieve targeted returns; thereafter, we will receive 80% of the earnings of each ofthe LLCs and Hancock and CIT will be allocated the remaining 20% proportionate to their respective equityinterests. All capital allocations made through December 31, 2010 have been based on initial capital accountbalances as the target returns have not yet been achieved.
115
WASTE MANAGEMENT, INC.
NOTES TO CONSOLIDATED FINANCIAL STATEMENTS — (Continued)
Our obligations associated with our interests in the LLCs are primarily related to the lease of the facilities. Inaddition to our minimum lease payment obligations, we are required to make cash payments to the LLCs fordifferences between fair market rents and our minimum lease payments. These payments are subject to adjustmentbased on factors that include the fair market value of rents for the facilities and lease payments made through there-measurement dates. In addition, we may also be required under certain circumstances to make capitalcontributions to the LLCs based on differences between the fair market value of the facilities and definedtermination values as provided for in the underlying lease agreements, although we believe the likelihood of theoccurrence of these circumstances is remote.
We have determined that we are the primary beneficiary of the LLCs and consolidate these entities in ourConsolidated Financial Statements because (i) all of the equity owners of the LLCs are considered related parties forpurposes of applying this accounting guidance; (ii) the equity owners share power over the significant activities ofthe LLCs; and (iii) we are the entity within the related party group whose activities are most closely associated withthe LLCs.
As of December 31, 2010, our Consolidated Balance Sheet includes $319 million of net property andequipment associated with the LLCs’ waste-to-energy facilities and $240 million in noncontrolling interestsassociated with Hancock’s and CIT’s interests in the LLCs. As of December 31, 2010, all debt obligations of theLLCs have been paid in full and, therefore, the LLCs have no liabilities. During the years ended December 31, 2010,2009, and 2008, we recognized expense of $50 million, $50 million and $41 million, respectively, for Hancock’sand CIT’s noncontrolling interests in the LLCs’ earnings. The LLCs’ earnings relate to the rental income generatedfrom leasing the facilities to our subsidiaries, reduced by depreciation expense. The LLCs’ rental income iseliminated in WM’s consolidation.
Significant Unconsolidated Variable Interest Entities
Trusts for Capping, Closure, Post-Closure or Environmental Remediation Obligations — We have significantfinancial interests in trust funds that were created to settle certain of our capping, closure, post-closure orenvironmental remediation obligations. We have determined that we are not the primary beneficiary of certain ofthese trust funds because power over the trusts’ significant activities is shared.
The deconsolidation of these variable interest entities as of January 1, 2010, in accordance with the new FASBguidance discussed in Note 2, decreased our restricted trust and escrow accounts by $109 million; increasedinvestments in unconsolidated entities by $27 million; increased receivables, principally long-term, by $51 million;and decreased noncontrolling interests by $31 million. Beginning in 2010, our interests in these variable interestentities have been accounted for as investments in unconsolidated entities and receivables. These amounts arerecorded in “Other receivables” and as long-term “Other assets” in our Consolidated Balance Sheet. Ourinvestments and receivables related to the trusts had a fair value of $105 million as of January 1, 2010 and$103 million as of December 31, 2010. We continue to reflect our interests in the unrealized gains and losses onmarketable securities held by these trusts as a component of accumulated other comprehensive income. Thedeconsolidation of these variable interest entities has not materially affected our financial position, results ofoperations or cash flows for the periods presented.
As the party with primary responsibility to fund the related capping, closure, post-closure or environmentalremediation activities, we are exposed to risk of loss as a result of potential changes in the fair value of the assets ofthe trust. The fair value of trust assets can fluctuate due to (i) changes in the market value of the investments held bythe trusts; and (ii) credit risk associated with trust receivables. Although we are exposed to changes in the fair valueof the trust assets, we currently expect the trust funds to continue to meet the statutory requirements for which theywere established.
Investment in Federal Low-income Housing Tax Credits — In April 2010, we acquired a noncontrollinginterest in a limited liability company established to invest in and manage low-income housing properties. Alongwith the other equity investor, we support the operations of the entity in exchange for a pro-rata share of the taxcredits it generates. Our target return on the investment is guaranteed and, therefore, we do not believe that we have
116
WASTE MANAGEMENT, INC.
NOTES TO CONSOLIDATED FINANCIAL STATEMENTS — (Continued)

any material exposure to loss. Our consideration for this investment totaled $221 million, which was comprised of a$215 million note payable and an initial cash payment of $6 million. At December 31, 2010, our investment balancewas $202 million. We determined that we are not the primary beneficiary of this entity as we do not have the powerto direct the entity’s activities. Accordingly, we account for this investment under the equity method of accountingand do not consolidate the entity. Additional information related to this investment is discussed in Note 9.
21. Segment and Related Information
We currently manage and evaluate our operations primarily through our Eastern, Midwest, Southern, Westernand Wheelabrator Groups. These five Groups are presented below as our reportable segments. Our four geographicoperating Groups provide collection, transfer, disposal (in both solid waste and hazardous waste landfills) andrecycling services. Our fifth Group is the Wheelabrator Group, which provides waste-to-energy services andmanages waste-to-energy facilities and independent power production plants. We serve residential, commercial,industrial, and municipal customers throughout North America. The operations not managed through our fiveoperating Groups are presented herein as “Other.”
117
WASTE MANAGEMENT, INC.
NOTES TO CONSOLIDATED FINANCIAL STATEMENTS — (Continued)

Summarized financial information concerning our reportable segments for the respective years endedDecember 31 is shown in the following table (in millions):
GrossOperatingRevenues
IntercompanyOperating
Revenues(c)
NetOperatingRevenues
Incomefrom
Operations(d),(e)
Depreciationand
Amortization
CapitalExpenditures
(f)
TotalAssets(g),(h)
2010Eastern . . . . . . . . . . . . . . $ 2,943 $ (508) $ 2,435 $ 516 $ 270 $ 201 $ 4,272
Midwest . . . . . . . . . . . . . 3,048 (453) 2,595 533 275 203 4,929
Southern . . . . . . . . . . . . 3,461 (403) 3,058 844 269 230 3,256
Western . . . . . . . . . . . . . 3,173 (438) 2,735 569 210 223 3,715
Wheelabrator . . . . . . . . . 889 (125) 764 214 64 38 2,574
Other(a) . . . . . . . . . . . . . 963 (35) 928 (135) 50 182 1,744
14,477 (1,962) 12,515 2,541 1,138 1,077 20,490
Corporate and Other(b) . . — — — (425) 56 90 1,679
Total . . . . . . . . . . . . . . . $14,477 $(1,962) $12,515 $2,116 $1,194 $1,167 $22,169
2009Eastern . . . . . . . . . . . . . . $ 2,960 $ (533) $ 2,427 $ 483 $ 276 $ 216 $ 4,326
Midwest . . . . . . . . . . . . . 2,855 (426) 2,429 450 261 218 4,899
Southern . . . . . . . . . . . . 3,328 (431) 2,897 768 274 242 3,250
Western . . . . . . . . . . . . . 3,125 (412) 2,713 521 226 195 3,667
Wheelabrator . . . . . . . . . 841 (123) 718 235 57 11 2,266
Other(a) . . . . . . . . . . . . . 628 (21) 607 (136) 29 128 1,112
13,737 (1,946) 11,791 2,321 1,123 1,010 19,520
Corporate and Other(b) . . — — — (434) 43 66 2,281
Total . . . . . . . . . . . . . . . $13,737 $(1,946) $11,791 $1,887 $1,166 $1,076 $21,801
2008Eastern . . . . . . . . . . . . . . $ 3,319 $ (599) $ 2,720 $ 523 $ 284 $ 318 $ 4,372
Midwest . . . . . . . . . . . . . 3,267 (475) 2,792 475 287 296 4,626
Southern . . . . . . . . . . . . 3,740 (493) 3,247 872 294 303 3,218
Western . . . . . . . . . . . . . 3,387 (428) 2,959 612 238 295 3,686
Wheelabrator . . . . . . . . . 912 (92) 820 323 56 24 2,359
Other(a) . . . . . . . . . . . . . 897 (47) 850 (60) 32 81 873
15,522 (2,134) 13,388 2,745 1,191 1,317 19,134
Corporate and Other(b) . . — — — (511) 47 45 1,676
Total . . . . . . . . . . . . . . . $15,522 $(2,134) $13,388 $2,234 $1,238 $1,362 $20,810
(a) Our “Other” net operating revenues and “Other” income from operations include (i) the effects of thoseelements of our in-plant services, landfill gas-to-energy operations, and third-party subcontract and admin-istration revenues managed by our Upstream», Renewable Energy and Strategic Accounts organizations,respectively, that are not included with the operations of our reportable segments; (ii) our recycling brokerageand electronic recycling services; and (iii) the impacts of investments that we are making in expanded serviceofferings such as portable self-storage and fluorescent lamp recycling. In addition, our “Other” income from
118
WASTE MANAGEMENT, INC.
NOTES TO CONSOLIDATED FINANCIAL STATEMENTS — (Continued)
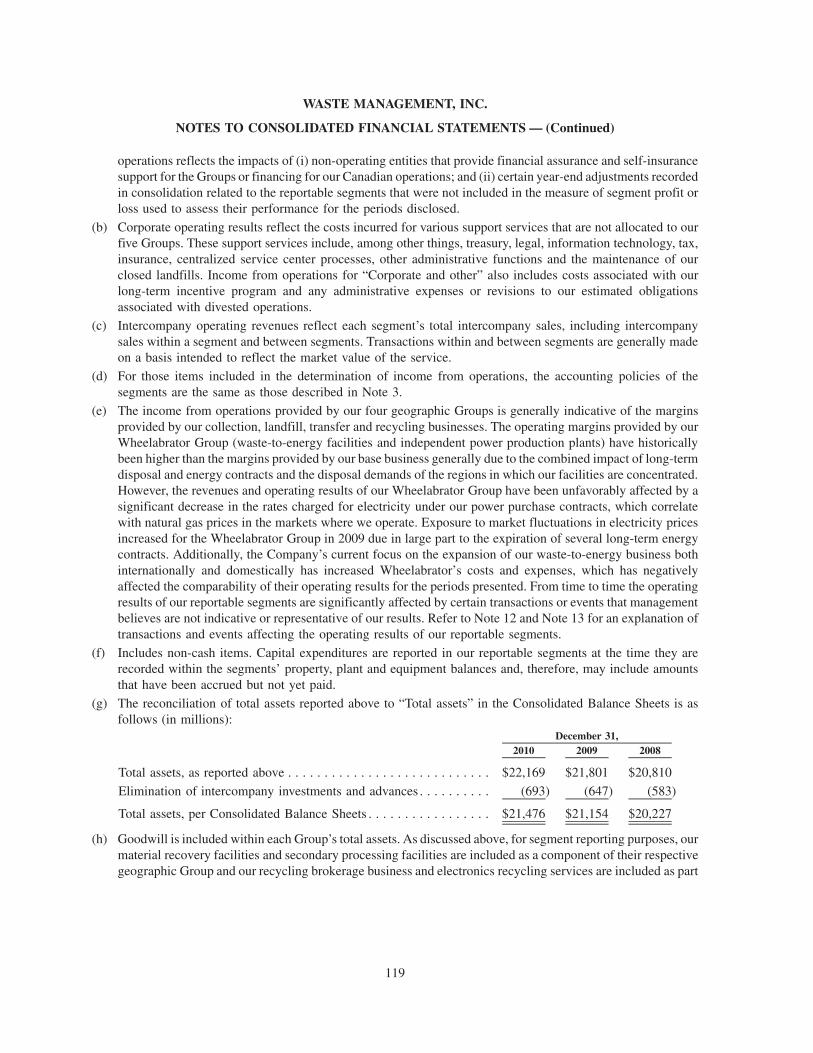
operations reflects the impacts of (i) non-operating entities that provide financial assurance and self-insurancesupport for the Groups or financing for our Canadian operations; and (ii) certain year-end adjustments recordedin consolidation related to the reportable segments that were not included in the measure of segment profit orloss used to assess their performance for the periods disclosed.
(b) Corporate operating results reflect the costs incurred for various support services that are not allocated to ourfive Groups. These support services include, among other things, treasury, legal, information technology, tax,insurance, centralized service center processes, other administrative functions and the maintenance of ourclosed landfills. Income from operations for “Corporate and other” also includes costs associated with ourlong-term incentive program and any administrative expenses or revisions to our estimated obligationsassociated with divested operations.
(c) Intercompany operating revenues reflect each segment’s total intercompany sales, including intercompanysales within a segment and between segments. Transactions within and between segments are generally madeon a basis intended to reflect the market value of the service.
(d) For those items included in the determination of income from operations, the accounting policies of thesegments are the same as those described in Note 3.
(e) The income from operations provided by our four geographic Groups is generally indicative of the marginsprovided by our collection, landfill, transfer and recycling businesses. The operating margins provided by ourWheelabrator Group (waste-to-energy facilities and independent power production plants) have historicallybeen higher than the margins provided by our base business generally due to the combined impact of long-termdisposal and energy contracts and the disposal demands of the regions in which our facilities are concentrated.However, the revenues and operating results of our Wheelabrator Group have been unfavorably affected by asignificant decrease in the rates charged for electricity under our power purchase contracts, which correlatewith natural gas prices in the markets where we operate. Exposure to market fluctuations in electricity pricesincreased for the Wheelabrator Group in 2009 due in large part to the expiration of several long-term energycontracts. Additionally, the Company’s current focus on the expansion of our waste-to-energy business bothinternationally and domestically has increased Wheelabrator’s costs and expenses, which has negativelyaffected the comparability of their operating results for the periods presented. From time to time the operatingresults of our reportable segments are significantly affected by certain transactions or events that managementbelieves are not indicative or representative of our results. Refer to Note 12 and Note 13 for an explanation oftransactions and events affecting the operating results of our reportable segments.
(f) Includes non-cash items. Capital expenditures are reported in our reportable segments at the time they arerecorded within the segments’ property, plant and equipment balances and, therefore, may include amountsthat have been accrued but not yet paid.
(g) The reconciliation of total assets reported above to “Total assets” in the Consolidated Balance Sheets is asfollows (in millions):
2010 2009 2008December 31,
Total assets, as reported above . . . . . . . . . . . . . . . . . . . . . . . . . . . . $22,169 $21,801 $20,810
Elimination of intercompany investments and advances . . . . . . . . . . (693) (647) (583)
Total assets, per Consolidated Balance Sheets . . . . . . . . . . . . . . . . . $21,476 $21,154 $20,227
(h) Goodwill is included within each Group’s total assets. As discussed above, for segment reporting purposes, ourmaterial recovery facilities and secondary processing facilities are included as a component of their respectivegeographic Group and our recycling brokerage business and electronics recycling services are included as part
119
WASTE MANAGEMENT, INC.
NOTES TO CONSOLIDATED FINANCIAL STATEMENTS — (Continued)

of our “Other” operations. The following table shows changes in goodwill during 2009 and 2010 by reportablesegment (in millions):
Eastern Midwest Southern Western Wheelabrator Other Total
Balance, December 31, 2008 . . . . . . . . . $1,488 $1,300 $643 $1,208 $788 $35 $5,462Acquired goodwill . . . . . . . . . . . . . . . . 10 45 36 7 — 27 125Divested goodwill, net of assets
held-for-sale . . . . . . . . . . . . . . . . . . . 2 — — — — — 2Translation adjustments . . . . . . . . . . . . . — 37 — 6 — — 43
Balance, December 31, 2009 . . . . . . . . . 1,500 1,382 679 1,221 788 62 5,632Acquired goodwill . . . . . . . . . . . . . . . . 4 17 4 20 — 32 77Divested goodwill, net of assets
held-for-sale . . . . . . . . . . . . . . . . . . . — — — — — — —Translation and other adjustments . . . . . — 15 — 2 — — 17
Balance, December 31, 2010 . . . . . . . . . $1,504 $1,414 $683 $1,243 $788 $94 $5,726
The table below shows the total revenues by principal line of business (in millions):
2010 2009 2008Years Ended December 31,
Collection . . . . . . . . . . . . . . . . . . . . . . . . . . . . . . . . . . . . . . . . . . . $ 8,247 $ 7,980 $ 8,679
Landfill . . . . . . . . . . . . . . . . . . . . . . . . . . . . . . . . . . . . . . . . . . . . . 2,540 2,547 2,955
Transfer . . . . . . . . . . . . . . . . . . . . . . . . . . . . . . . . . . . . . . . . . . . . 1,318 1,383 1,589
Wheelabrator . . . . . . . . . . . . . . . . . . . . . . . . . . . . . . . . . . . . . . . . . 889 841 912
Recycling . . . . . . . . . . . . . . . . . . . . . . . . . . . . . . . . . . . . . . . . . . . 1,169 741 1,180
Other(a) . . . . . . . . . . . . . . . . . . . . . . . . . . . . . . . . . . . . . . . . . . . . 314 245 207
Intercompany(b) . . . . . . . . . . . . . . . . . . . . . . . . . . . . . . . . . . . . . . (1,962) (1,946) (2,134)
Operating revenues . . . . . . . . . . . . . . . . . . . . . . . . . . . . . . . . . . . . $12,515 $11,791 $13,388
(a) The “Other” line-of-business includes landfill gas-to-energy operations, Port-O-Let» services, portable self-storage and fluorescent lamp recycling.
(b) Intercompany revenues between lines of business are eliminated within the Consolidated Financial Statementsincluded herein.
Net operating revenues relating to operations in the United States and Puerto Rico, as well as Canada are asfollows (in millions):
2010 2009 2008Years Ended December 31,
United States and Puerto Rico . . . . . . . . . . . . . . . . . . . . . . . . . . . . $11,784 $11,137 $12,621
Canada . . . . . . . . . . . . . . . . . . . . . . . . . . . . . . . . . . . . . . . . . . . . . 731 654 767
Total . . . . . . . . . . . . . . . . . . . . . . . . . . . . . . . . . . . . . . . . . . . . . . . $12,515 $11,791 $13,388
120
WASTE MANAGEMENT, INC.
NOTES TO CONSOLIDATED FINANCIAL STATEMENTS — (Continued)

Property and equipment (net) relating to operations in the United States and Puerto Rico, as well as Canada areas follows (in millions):
2010 2009 2008December 31,
United States and Puerto Rico . . . . . . . . . . . . . . . . . . . . . . . . . . . . $10,558 $10,251 $10,355
Canada . . . . . . . . . . . . . . . . . . . . . . . . . . . . . . . . . . . . . . . . . . . . . 1,310 1,290 1,047
Total . . . . . . . . . . . . . . . . . . . . . . . . . . . . . . . . . . . . . . . . . . . . . . . $11,868 $11,541 $11,402
22. Quarterly Financial Data (Unaudited)
The following table summarizes the unaudited quarterly results of operations for 2010 and 2009 (in millions,except per share amounts):
FirstQuarter
SecondQuarter
ThirdQuarter
FourthQuarter
2010Operating revenues . . . . . . . . . . . . . . . . . . . . . . . . . . . . . . . $2,935 $3,158 $3,235 $3,187
Income from operations . . . . . . . . . . . . . . . . . . . . . . . . . . . 412 586 544 574
Consolidated net income . . . . . . . . . . . . . . . . . . . . . . . . . . . 192 258 258 294
Net income attributable to Waste Management, Inc. . . . . . . 182 246 244 281Basic earnings per common share . . . . . . . . . . . . . . . . . . . . 0.37 0.51 0.51 0.59
Diluted earnings per common share . . . . . . . . . . . . . . . . . . . 0.37 0.51 0.51 0.59
2009Operating revenues . . . . . . . . . . . . . . . . . . . . . . . . . . . . . . . $2,810 $2,952 $3,023 $3,006
Income from operations . . . . . . . . . . . . . . . . . . . . . . . . . . . 372 534 525 456
Consolidated net income . . . . . . . . . . . . . . . . . . . . . . . . . . . 170 267 292 331
Net income attributable to Waste Management, Inc. . . . . . . 155 247 277 315
Basic earnings per common share . . . . . . . . . . . . . . . . . . . . 0.31 0.50 0.56 0.65
Diluted earnings per common share . . . . . . . . . . . . . . . . . . . 0.31 0.50 0.56 0.64
Basic and diluted earnings per common share for each of the quarters presented above is based on therespective weighted average number of common and dilutive potential common shares outstanding for each quarterand the sum of the quarters may not necessarily be equal to the full year basic and diluted earnings per commonshare amounts.
Our operating revenues normally tend to be somewhat higher in the summer months, primarily due to thetraditional seasonal increase in the volume of construction and demolition waste. The volumes of industrial andresidential waste in certain regions where we operate also tend to increase during the summer months. Our secondand third quarter revenues and results of operations typically reflect these seasonal trends, although we saw asignificantly weaker seasonal volume increase during 2009 than we generally experience. Additionally, from timeto time, our operating results are significantly affected by certain transactions or events that management believesare not indicative or representative of our results. The following significant items have affected the comparison ofour operating results during the periods presented:
First Quarter 2010
• Income from operations was negatively affected by the recognition of a $28 million charge to “Operating”expenses incurred by our Midwest Group as a result of bargaining unit employees in Michigan and Ohioagreeing to our proposal to withdraw them from an under-funded multiemployer pension plan. This chargereduced diluted earnings per share for the quarter by $0.04.
121
WASTE MANAGEMENT, INC.
NOTES TO CONSOLIDATED FINANCIAL STATEMENTS — (Continued)

• The severe winter weather experienced in early 2010 reduced our revenues and increased our overtime andlandfill operating costs, causing an estimated decrease in our diluted earnings per share of $0.02.
.
Second Quarter 2010
• Income from operations was positively affected by the recognition of a pre-tax cash benefit of $77 milliondue to the settlement of a lawsuit related to the abandonment of revenue management software, which had afavorable impact of $0.10 on our diluted earnings per share.
• Income from operations was negatively affected by (i) the recognition of a pre-tax non-cash charge of$39 million related to increases in our environmental remediation reserves principally related to two closedlandfill sites; and (ii) the recognition of an $8 million unfavorable adjustment to “Operating” expenses due toa decrease from 3.75% to 3.0% in the discount rate used to estimate the present value of our environmentalremediation obligations and recovery assets. These items decreased the quarter’s “Net Income attributable toWaste Management, Inc.” by $30 million, or $0.06 per diluted share.
• Our “Provision for income taxes” for the quarter was increased by the recognition of a tax charge of$37 million principally related to refinements in estimates of our deferred state income taxes, which had anegative impact of $0.08 on our diluted earnings per share.
Third Quarter 2010
• Income from operations was negatively affected by (i) the recognition of pre-tax, non-cash chargesaggregating $16 million related to remediation and closure costs at four closed sites; and (ii) the recognitionof a $6 million unfavorable adjustment to “Operating” expenses due to a decrease from 3.0% to 2.5% in thediscount rate used to estimate the present value of our environmental remediation obligations and recoveryassets. These items decreased the quarter’s “Net Income attributable to Waste Management, Inc.” by$14 million, or $0.03 per diluted share.
• Our “Provision for income taxes” for the quarter was increased by the recognition of net tax charges of$4 million due to adjustments relating to the finalization of our 2009 tax returns, partially offset by favorabletax audit settlements, which, combined, had a negative impact of $0.01 on our diluted earnings per share.
Fourth Quarter 2010
• Income from operations was positively affected by (i) a $29 million decrease to “Depreciation andamortization” expense for adjustments associated with changes in our expectations for the timing andcost of future capping, closure and post-closure of fully utilized airspace; and (ii) the recognition of a$12 million favorable adjustment to “Operating” expenses due to an increase from 2.5% to 3.5% in thediscount rate used to estimate the present value of our environmental remediation obligations and recoveryassets. These items increased the quarter’s “Net Income attributable to Waste Management, Inc.” by$25 million, or $0.05 per diluted share.
• Income from operations was negatively affected by the recognition of pre-tax litigation charges of$31 million, which had an unfavorable impact of $0.04 on our diluted earnings per share.
• Our “Provision for income taxes” for the quarter was reduced by $9 million as a result of (i) the recognitionof a benefit of $6 million due to tax audit settlements; and (ii) the realization of state net operating loss andcredit carry-forwards of $3 million. This decrease in taxes positively affected the quarter’s diluted earningsper common share by $0.02.
First Quarter 2009
• Income from operations was positively affected by the recognition of a $10 million favorable adjustment to“Operating” expenses due to an increase from 2.25% to 2.75% in the discount rate used to estimate the
122
WASTE MANAGEMENT, INC.
NOTES TO CONSOLIDATED FINANCIAL STATEMENTS — (Continued)

present value of our environmental remediation obligations. This reduction to “Operating” expenses resultedin a corresponding increase in “Net income attributable to noncontrolling interests” of $2 million. Thediscount rate adjustment increased the quarter’s “Net income attributable to Waste Management, Inc.” by$5 million, or $0.01 per diluted share.
• Income from operations was negatively affected by a non-cash charge of $49 million related to theabandonment of revenue management software, which reduced “Net income attributable to Waste Man-agement, Inc.” by $30 million, or $0.06 per diluted share. Additionally, we recognized $38 million ofcharges related to our January 2009 restructuring, which reduced “Net income attributable to WasteManagement, Inc.” by $23 million, or $0.05 per diluted share.
Second Quarter 2009
• Income from operations was positively affected by the recognition of a $22 million favorable adjustment to“Operating” expenses due to an increase from 2.75% to 3.50% in the discount rate used to estimate thepresent value of our environmental remediation obligations and recovery assets. This reduction to “Oper-ating” expenses resulted in a corresponding increase in “Net income attributable to noncontrolling interests”of $6 million. Additionally, our “Selling, general and administrative” expenses were reduced by $8 millionas a result of the reversal of all compensation costs previously recognized for our 2008 performance shareunits based on a determination that it is no longer probable that the targets established for that award will bemet. These items increased the quarter’s “Net income attributable to Waste Management, Inc.” by$15 million, or $0.03 per diluted share.
• Income from operations was negatively affected by (i) a $9 million charge to “Operating” expenses for awithdrawal of bargaining unit employees from an underfunded, multiemployer pension fund; (ii) $5 millionof charges related to our January 2009 restructuring; and (iii) a $2 million impairment charge recognized byour Southern Group due to a change in expectations for the operating life of a landfill. These items decreasedthe quarter’s “Net income attributable to Waste Management, Inc.” by $10 million, or $0.02 per dilutedshare.
Third Quarter 2009
• Income from operations was negatively affected by $3 million of charges related to our January 2009restructuring. This charge negatively affected “Net income attributable to Waste Management, Inc.” for thequarter by $2 million.
• Our “Provision for income taxes” for the quarter was reduced by $19 million primarily as a result of thefinalization of our 2008 tax returns and tax audit settlements, which positively affected “Diluted earnings percommon share” by $0.04.
Fourth Quarter 2009
• Income from operations was positively affected by (i) an $18 million increase in the revenues of our EasternGroup for payments received under an oil and gas lease at one of our landfills; and (ii) a $22 million decreaseto “Depreciation and amortization” expense for adjustments associated with changes in our expectations forthe timing and cost of future capping, closure and post-closure of fully utilized airspace. These itemsincreased the quarter’s “Net income attributable to Waste Management, Inc.” by $24 million, or $0.05 perdiluted share.
• Income from operations was negatively affected by (i) a $27 million impairment charge recognized by ourWestern Group as a result in a change in expectations for the future operations of an inactive landfill inCalifornia; (ii) a $12 million increase to “Selling, general and administrative” expenses for several legalmatters; (iii) a $4 million impairment charge required to write-down certain of our investments in portableself-storage operations to their fair value as a result of our acquisition of a controlling financial interest inthose operations; (iv) $4 million of charges related to our January 2009 restructuring; and (v) a $2 million
123
WASTE MANAGEMENT, INC.
NOTES TO CONSOLIDATED FINANCIAL STATEMENTS — (Continued)

impairment charge related to the abandonment of revenue management software. These items decreased thequarter’s “Net income attributable to Waste Management, Inc.” by $29 million, or $0.06 per diluted share.
• Our “Provision for income taxes” for the quarter was reduced by $111 million as a result of (i) the liquidationof a foreign subsidiary, which generated a capital loss that could be utilized to offset capital gains generatedin previous years; (ii) the realization of state net operating loss and credit carry-forwards; (iii) a reduction inprovincial tax rates in Ontario, Canada, which resulted in the revaluation of related deferred tax balances;and (iv) tax audit settlements. This significant decrease in taxes resulted in an effective tax rate of 4.9% forthe fourth quarter of 2009 and positively affected the quarter’s “Diluted earnings per common share” by$0.23.
23. Condensed Consolidating Financial Statements
WM Holdings has fully and unconditionally guaranteed all of WM’s senior indebtedness. WM has fully andunconditionally guaranteed all of WM Holdings’ senior indebtedness. None of WM’s other subsidiaries haveguaranteed any of WM’s or WM Holdings’ debt. As a result of these guarantee arrangements, we are required topresent the following condensed consolidating financial information (in millions):
124
WASTE MANAGEMENT, INC.
NOTES TO CONSOLIDATED FINANCIAL STATEMENTS — (Continued)

CONDENSED CONSOLIDATING BALANCE SHEETS
December 31, 2010
WMWM
HoldingsNon-Guarantor
Subsidiaries Eliminations Consolidated
ASSETSCurrent assets:
Cash and cash equivalents . . . . . . . . . . . $ 465 $ — $ 74 $ — $ 539
Other current assets . . . . . . . . . . . . . . . . 4 1 1,938 — 1,943
469 1 2,012 — 2,482
Property and equipment, net . . . . . . . . . . . — — 11,868 — 11,868
Investments in and advances to affiliates . . 10,757 13,885 2,970 (27,612) —
Other assets . . . . . . . . . . . . . . . . . . . . . . . 91 12 7,023 — 7,126
Total assets . . . . . . . . . . . . . . . . . . . . $11,317 $13,898 $23,873 $(27,612) $21,476
LIABILITIES AND EQUITYCurrent liabilities:
Current portion of long-term debt . . . . . . $ — $ 1 $ 232 $ — $ 233
Accounts payable and other currentliabilities . . . . . . . . . . . . . . . . . . . . . . 93 17 2,142 — 2,252
93 18 2,374 — 2,485
Long-term debt, less current portion. . . . . . 4,951 596 3,127 — 8,674
Other liabilities . . . . . . . . . . . . . . . . . . . . . 13 — 3,713 — 3,726
Total liabilities . . . . . . . . . . . . . . . . . . 5,057 614 9,214 — 14,885
Equity:
Stockholders’ equity . . . . . . . . . . . . . . . 6,260 13,284 14,328 (27,612) 6,260
Noncontrolling interests . . . . . . . . . . . . . — — 331 — 331
6,260 13,284 14,659 (27,612) 6,591
Total liabilities and equity . . . . . . . . . $11,317 $13,898 $23,873 $(27,612) $21,476
125
WASTE MANAGEMENT, INC.
NOTES TO CONSOLIDATED FINANCIAL STATEMENTS — (Continued)

December 31, 2009
WMWM
HoldingsNon-Guarantor
Subsidiaries Eliminations Consolidated
ASSETSCurrent assets:
Cash and cash equivalents . . . . . . . . . . . $ 1,093 $ — $ 47 $ — $ 1,140Other current assets . . . . . . . . . . . . . . . . 24 1 1,845 — 1,870
1,117 1 1,892 — 3,010
Property and equipment, net . . . . . . . . . . . — — 11,541 — 11,541
Investments in and advances to affiliates . . 10,174 12,770 2,303 (25,247) —
Other assets . . . . . . . . . . . . . . . . . . . . . . . 62 17 6,524 — 6,603
Total assets . . . . . . . . . . . . . . . . . . . . $11,353 $12,788 $22,260 $(25,247) $21,154
LIABILITIES AND EQUITYCurrent liabilities:
Current portion of long-term debt . . . . . . $ 580 $ 35 $ 134 $ — $ 749
Accounts payable and other currentliabilities . . . . . . . . . . . . . . . . . . . . . . 90 17 2,045 — 2,152
670 52 2,179 — 2,901
Long-term debt, less current portion. . . . . . 4,398 601 3,125 — 8,124
Other liabilities . . . . . . . . . . . . . . . . . . . . . — — 3,538 — 3,538
Total liabilities . . . . . . . . . . . . . . . . . . 5,068 653 8,842 — 14,563
Equity:
Stockholders’ equity . . . . . . . . . . . . . . . 6,285 12,135 13,112 (25,247) 6,285
Noncontrolling interests . . . . . . . . . . . . . — — 306 — 306
6,285 12,135 13,418 (25,247) 6,591
Total liabilities and equity . . . . . . . . . $11,353 $12,788 $22,260 $(25,247) $21,154
126
WASTE MANAGEMENT, INC.
NOTES TO CONSOLIDATED FINANCIAL STATEMENTS — (Continued)
CONDENSED CONSOLIDATING BALANCE SHEETS (Continued)

CONDENSED CONSOLIDATING STATEMENTS OF OPERATIONS
WMWM
HoldingsNon-Guarantor
Subsidiaries Eliminations Consolidated
Year Ended December 31, 2010Operating revenues . . . . . . . . . . . . . . . . . . . $ — $ — $12,515 $ — $12,515
Costs and expenses . . . . . . . . . . . . . . . . . . . — — 10,399 — 10,399
Income from operations . . . . . . . . . . . . . . . . — — 2,116 — 2,116
Other income (expense):
Interest income (expense) . . . . . . . . . . . . . (324) (38) (107) — (469)
Equity in subsidiaries, net of taxes . . . . . . 1,149 1,172 — (2,321) —
Equity in net losses of unconsolidatedentities and other, net . . . . . . . . . . . . . . — — (16) — (16)
825 1,134 (123) (2,321) (485)
Income before income taxes . . . . . . . . . . . . . 825 1,134 1,993 (2,321) 1,631
Provision for (benefit from) income taxes . . . (128) (15) 772 — 629
Consolidated net income . . . . . . . . . . . . . . . 953 1,149 1,221 (2,321) 1,002
Less: Net income attributable tononcontrolling interests . . . . . . . . . . . . . . — — 49 — 49
Net income attributable to WasteManagement, Inc. . . . . . . . . . . . . . . . . . . $ 953 $1,149 $ 1,172 $(2,321) $ 953
Year Ended December 31, 2009Operating revenues . . . . . . . . . . . . . . . . . . . $ — $ — $11,791 $ — $11,791
Costs and expenses . . . . . . . . . . . . . . . . . . . — — 9,904 — 9,904
Income from operations . . . . . . . . . . . . . . . . — — 1,887 — 1,887
Other income (expense):
Interest income (expense) . . . . . . . . . . . . . (268) (41) (104) — (413)
Equity in subsidiaries, net of taxes . . . . . . 1,157 1,182 — (2,339) —
Equity in net losses of unconsolidatedentities and other, net . . . . . . . . . . . . . . — — (1) — (1)
889 1,141 (105) (2,339) (414)
Income before income taxes . . . . . . . . . . . . . 889 1,141 1,782 (2,339) 1,473
Provision for (benefit from) income taxes . . . (105) (16) 534 — 413
Consolidated net income . . . . . . . . . . . . . . . 994 1,157 1,248 (2,339) 1,060
Less: Net income attributable tononcontrolling interests . . . . . . . . . . . . . . — — 66 — 66
Net income attributable to WasteManagement, Inc. . . . . . . . . . . . . . . . . . . $ 994 $1,157 $ 1,182 $(2,339) $ 994
127
WASTE MANAGEMENT, INC.
NOTES TO CONSOLIDATED FINANCIAL STATEMENTS — (Continued)

WMWM
HoldingsNon-Guarantor
Subsidiaries Eliminations Consolidated
Year Ended December 31, 2008Operating revenues . . . . . . . . . . . . . . . . . . . $ — $ — $13,388 $ — $13,388
Costs and expenses . . . . . . . . . . . . . . . . . . . — — 11,154 — 11,154
Income from operations . . . . . . . . . . . . . . . . — — 2,234 — 2,234
Other income (expense):
Interest income (expense) . . . . . . . . . . . . . (274) (40) (122) — (436)
Equity in subsidiaries, net of taxes . . . . . . 1,254 1,278 — (2,532) —
Equity in net losses of unconsolidatedentities and other, net . . . . . . . . . . . . . . — — (1) — (1)
980 1,238 (123) (2,532) (437)
Income before income taxes . . . . . . . . . . . . . 980 1,238 2,111 (2,532) 1,797
Provision for (benefit from) income taxes . . . (107) (16) 792 — 669
Consolidated net income . . . . . . . . . . . . . . . 1,087 1,254 1,319 (2,532) 1,128
Less: Net income attributable tononcontrolling interests . . . . . . . . . . . . . . — — 41 — 41
Net income attributable to WasteManagement, Inc. . . . . . . . . . . . . . . . . . . $1,087 $1,254 $ 1,278 $(2,532) $ 1,087
128
WASTE MANAGEMENT, INC.
NOTES TO CONSOLIDATED FINANCIAL STATEMENTS — (Continued)
CONDENSED CONSOLIDATING STATEMENTS OF OPERATIONS (Continued)

CONDENSED CONSOLIDATING STATEMENTS OF CASH FLOWS
WMWM
HoldingsNon-Guarantor
Subsidiaries Eliminations Consolidated
Year Ended December 31, 2010Cash flows from operating activities:
Consolidated net income . . . . . . . . . . . . . $ 953 $ 1,149 $ 1,221 $(2,321) $ 1,002Equity in earnings of subsidiaries, net of
taxes . . . . . . . . . . . . . . . . . . . . . . . . . . (1,149) (1,172) — 2,321 —Other adjustments . . . . . . . . . . . . . . . . . . 44 (3) 1,232 — 1,273
Net cash provided by (used in) operatingactivities . . . . . . . . . . . . . . . . . . . . . . . . . (152) (26) 2,453 — 2,275
Cash flows from investing activities:Acquisition of businesses, net of cash
acquired . . . . . . . . . . . . . . . . . . . . . . . — — (407) — (407)Capital expenditures . . . . . . . . . . . . . . . . — — (1,104) — (1,104)Proceeds from divestitures of businesses
(net of cash divested) and other salesof assets . . . . . . . . . . . . . . . . . . . . . . . — — 44 — 44
Net receipts from restricted trust andescrow accounts and other, net . . . . . . . (5) — (134) — (139)
Net cash provided by (used in) investingactivities . . . . . . . . . . . . . . . . . . . . . . . . . (5) — (1,601) — (1,606)
Cash flows from financing activities:New borrowings . . . . . . . . . . . . . . . . . . . 592 — 316 — 908Debt repayments . . . . . . . . . . . . . . . . . . . (617) (35) (460) — (1,112)Common stock repurchases . . . . . . . . . . . (501) — — — (501)Cash dividends . . . . . . . . . . . . . . . . . . . . (604) — — — (604)Exercise of common stock options. . . . . . 54 — — — 54Distributions paid to noncontrolling
interests and other . . . . . . . . . . . . . . . . (6) — (12) — (18)(Increase) decrease in intercompany and
investments, net. . . . . . . . . . . . . . . . . . 611 61 (672) — —
Net cash provided by (used in) financingactivities . . . . . . . . . . . . . . . . . . . . . . . . . (471) 26 (828) — (1,273)
Effect of exchange rate changes on cashand cash equivalents . . . . . . . . . . . . . . . . — — 3 — 3
Decrease in cash and cash equivalents . . . . . (628) — 27 — (601)Cash and cash equivalents at beginning of
period . . . . . . . . . . . . . . . . . . . . . . . . . . . 1,093 — 47 — 1,140
Cash and cash equivalents at end ofperiod . . . . . . . . . . . . . . . . . . . . . . . . . . . $ 465 $ — $ 74 $ — $ 539
129
WASTE MANAGEMENT, INC.
NOTES TO CONSOLIDATED FINANCIAL STATEMENTS — (Continued)

WMWM
HoldingsNon-Guarantor
Subsidiaries Eliminations Consolidated
Year Ended December 31, 2009Cash flows from operating activities:
Consolidated net income . . . . . . . . . . . . . $ 994 $ 1,157 $ 1,248 $(2,339) $ 1,060Equity in earnings of subsidiaries, net of
taxes . . . . . . . . . . . . . . . . . . . . . . . . . . (1,157) (1,182) — 2,339 —Other adjustments . . . . . . . . . . . . . . . . . . 26 (3) 1,279 — 1,302
Net cash provided by (used in) operatingactivities . . . . . . . . . . . . . . . . . . . . . . . . . (137) (28) 2,527 — 2,362
Cash flows from investing activities:Acquisitions of businesses, net of cash
acquired . . . . . . . . . . . . . . . . . . . . . . . — — (281) — (281)Capital expenditures . . . . . . . . . . . . . . . . — — (1,179) — (1,179)Proceeds from divestitures of businesses
(net of cash divested) and other salesof assets . . . . . . . . . . . . . . . . . . . . . . . — — 28 — 28
Net receipts from restricted trust andescrow accounts and other, net . . . . . . . — — 182 — 182
Net cash used in investing activities. . . . . — — (1,250) — (1,250)
Cash flows from financing activities:New borrowings . . . . . . . . . . . . . . . . . . . 1,385 — 364 — 1,749Debt repayments . . . . . . . . . . . . . . . . . . . (810) — (525) — (1,335)Common stock repurchases . . . . . . . . . . . (226) — — — (226)Cash dividends . . . . . . . . . . . . . . . . . . . . (569) — — — (569)Exercise of common stock options. . . . . . 20 — — — 20Distributions paid to noncontrolling
interests and other . . . . . . . . . . . . . . . . 3 — (99) — (96)(Increase) decrease in intercompany and
investments, net. . . . . . . . . . . . . . . . . . 977 28 (1,005) — —
Net cash provided by (used in) financingactivities . . . . . . . . . . . . . . . . . . . . . . . . . 780 28 (1,265) — (457)
Effect of exchange rate changes on cashand cash equivalents . . . . . . . . . . . . . . . . — — 5 — 5
Increase in cash and cash equivalents . . . . . 643 — 17 — 660Cash and cash equivalents at beginning of
period . . . . . . . . . . . . . . . . . . . . . . . . . . . 450 — 30 — 480
Cash and cash equivalents at end ofperiod . . . . . . . . . . . . . . . . . . . . . . . . . . . $ 1,093 $ — $ 47 $ — $ 1,140
130
WASTE MANAGEMENT, INC.
NOTES TO CONSOLIDATED FINANCIAL STATEMENTS — (Continued)
CONDENSED CONSOLIDATING STATEMENTS OF CASH FLOWS (Continued)

WMWM
HoldingsNon-Guarantor
Subsidiaries Eliminations Consolidated
Year Ended December 31, 2008Cash flows from operating activities:
Consolidated net income . . . . . . . . . . . . . $ 1,087 $ 1,254 $ 1,319 $(2,532) $ 1,128Equity in earnings of subsidiaries, net of
taxes . . . . . . . . . . . . . . . . . . . . . . . . . . (1,254) (1,278) — 2,532 —Other adjustments . . . . . . . . . . . . . . . . . . (22) (16) 1,485 — 1,447
Net cash provided by (used in) operatingactivities . . . . . . . . . . . . . . . . . . . . . . . . . (189) (40) 2,804 — 2,575
Cash flows from investing activities:Acquisition of businesses, net of cash
acquired . . . . . . . . . . . . . . . . . . . . . . . — — (280) — (280)Capital expenditures . . . . . . . . . . . . . . . . — — (1,221) — (1,221)Proceeds from divestitures of businesses
(net of cash divested) and other salesof assets . . . . . . . . . . . . . . . . . . . . . . . — — 112 — 112
Net receipts from restricted trust andescrow accounts and other, net . . . . . . . . (2) — 208 — 206
Net cash used in investing activities . . . . . . (2) — (1,181) — (1,183)
Cash flows from financing activities:New borrowings . . . . . . . . . . . . . . . . . . . 944 — 581 — 1,525Debt repayments . . . . . . . . . . . . . . . . . . . (760) (244) (781) — (1,785)Common stock repurchases . . . . . . . . . . . (410) — — — (410)Cash dividends . . . . . . . . . . . . . . . . . . . . (531) — — — (531)Exercise of common stock options. . . . . . 37 — — — 37Distributions paid to noncontrolling
interests and other . . . . . . . . . . . . . . . . 7 — (99) — (92)(Increase) decrease in intercompany and
investments, net. . . . . . . . . . . . . . . . . . 938 284 (1,290) 68 —
Net cash provided by (used in) financingactivities . . . . . . . . . . . . . . . . . . . . . . . . . 225 40 (1,589) 68 (1,256)
Effect of exchange rate changes on cashand cash equivalents . . . . . . . . . . . . . . . . — — (4) — (4)
Increase in cash and cash equivalents . . . . . 34 — 30 68 132Cash and cash equivalents at beginning of
period . . . . . . . . . . . . . . . . . . . . . . . . . . . 416 — — (68) 348
Cash and cash equivalents at end ofperiod . . . . . . . . . . . . . . . . . . . . . . . . . . . $ 450 $ — $ 30 $ — $ 480
131
WASTE MANAGEMENT, INC.
NOTES TO CONSOLIDATED FINANCIAL STATEMENTS — (Continued)
CONDENSED CONSOLIDATING STATEMENTS OF CASH FLOWS (Continued)

24. New Accounting Pronouncements (Unaudited)
Multiple-Deliverable Revenue Arrangements — In October 2009, the FASB amended authoritative guidanceassociated with multiple-deliverable revenue arrangements. This amended guidance addresses the determination ofwhen individual deliverables within an arrangement may be treated as separate units of accounting and modifies themanner in which consideration is allocated across the separately identifiable deliverables. The amendments toauthoritative guidance associated with multiple-deliverable revenue arrangements became effective for the Com-pany on January 1, 2011. The new accounting standard may be applied either retrospectively for all periodspresented or prospectively to arrangements entered into or materially modified after the date of adoption. We do notexpect that the adoption of this guidance will have a material impact on our consolidated financial statements.However, our adoption of this guidance may significantly impact our accounting and reporting for future revenuearrangements to the extent they are material.
132
WASTE MANAGEMENT, INC.
NOTES TO CONSOLIDATED FINANCIAL STATEMENTS — (Continued)

Item 9. Changes in and Disagreements With Accountants on Accounting and Financial Disclosure.
None.
Item 9A. Controls and Procedures.
Effectiveness of Controls and Procedures
Our management, with the participation of our principal executive and financial officers, has evaluated theeffectiveness of our disclosure controls and procedures in ensuring that the information required to be disclosed inreports that we file or submit under the Securities Exchange Act of 1934, as amended, is recorded, processed,summarized and reported within the time periods specified in the SEC’s rules and forms, including ensuring thatsuch information is accumulated and communicated to management (including the principal executive andfinancial officers) as appropriate to allow timely decisions regarding required disclosure. Based on such evaluation,our principal executive and financial officers have concluded that such disclosure controls and procedures wereeffective as of December 31, 2010 (the end of the period covered by this Annual Report on Form 10-K).
Management’s Report on Internal Control Over Financial Reporting
Management’s report on our internal control over financial reporting can be found in Item 8, FinancialStatements and Supplementary Data, of this report. Ernst & Young LLP, an independent registered publicaccounting firm, has audited the effectiveness of our internal control over financial reporting as of December 31,2010 as stated in their report, which appears in Item 8 of this report.
Changes in Internal Control over Financial Reporting
Management, together with our CEO and CFO, evaluated the changes in our internal control over financialreporting during the quarter ended December 31, 2010. We determined that there were no changes in our internalcontrol over financial reporting during the quarter ended December 31, 2010 that have materially affected, or arereasonably likely to materially affect, our internal control over financial reporting.
Item 9B. Other Information.
None.
PART III
Item 10. Directors, Executive Officers and Corporate Governance.
The information required by this Item is incorporated by reference to the Company’s definitive ProxyStatement for its 2011 Annual Meeting of Stockholders, to be held May 13, 2011.
We have adopted a code of ethics that applies to our CEO, CFO and Chief Accounting Officer, as well as otherofficers, directors and employees of the Company. The code of ethics, entitled “Code of Conduct,” is posted on ourwebsite at http://www.wm.com under the section “Corporate Governance” within the “Investor Relations” tab.
Item 11. Executive Compensation.
The information required by this Item is set forth in the 2011 Proxy Statement and is incorporated herein byreference.
Item 12. Security Ownership of Certain Beneficial Owners and Management and Related StockholderMatters.
The information required by this Item is set forth in the 2011 Proxy Statement and is incorporated herein byreference.
Item 13. Certain Relationships and Related Transactions, and Director Independence.
The information required by this Item is set forth in the 2011 Proxy Statement and is incorporated herein byreference.
133

Item 14. Principal Accounting Fees and Services.
The information required by this Item is set forth in the 2011 Proxy Statement and is incorporated herein byreference.
PART IV
Item 15. Exhibits, Financial Statement Schedules
(a) (1) Consolidated Financial Statements:
Reports of Independent Registered Public Accounting Firm
Consolidated Balance Sheets as of December 31, 2010 and 2009
Consolidated Statements of Operations for the years ended December 31, 2010, 2009 and 2008
Consolidated Statements of Cash Flows for the years ended December 31, 2010, 2009 and 2008
Consolidated Statements of Changes in Equity for the years ended December 31, 2010, 2009 and2008
Notes to Consolidated Financial Statements
(a) (2) Consolidated Financial Statement Schedules:
Schedule II — Valuation and Qualifying Accounts
All other schedules have been omitted because the required information is not significant or is included in thefinancial statements or notes thereto, or is not applicable.
(b) Exhibits:
The exhibit list required by this Item is incorporated by reference to the Exhibit Index filed as part of thisreport.
134

SIGNATURES
Pursuant to the requirements of Section 13 or 15(d) of the Securities Exchange Act of 1934, the Registrant hasduly caused this Report to be signed on its behalf by the undersigned, thereunto duly authorized.
WASTE MANAGEMENT, INC.
By: /s/ DAVID P. STEINER
David P. SteinerPresident, Chief Executive Officer and Director
Date: February 17, 2011
Pursuant to the requirements of the Securities Exchange Act of 1934, this report has been signed below by thefollowing persons on behalf of the Registrant and in the capacities and on the dates indicated.
Signature Title Date
/s/ DAVID P. STEINER
David P. Steiner
President, Chief Executive Officer and Director(Principal Executive Officer)
February 17, 2011
/s/ ROBERT G. SIMPSON
Robert G. Simpson
Senior Vice President and Chief FinancialOfficer (Principal Financial Officer)
February 17, 2011
/s/ GREG A. ROBERTSON
Greg A. Robertson
Vice President and Chief Accounting Officer(Principal Accounting Officer)
February 17, 2011
/s/ PASTORA SAN JUAN CAFFERTY
Pastora San Juan Cafferty
Director February 17, 2011
/s/ FRANK M. CLARK
Frank M. Clark
Director February 17, 2011
/s/ PATRICK W. GROSS
Patrick W. Gross
Director February 17, 2011
/s/ JOHN C. POPE
John C. Pope
Chairman of the Board and Director February 17, 2011
/s/ W. ROBERT REUM
W. Robert Reum
Director February 17, 2011
/s/ STEVEN G. ROTHMEIER
Steven G. Rothmeier
Director February 17, 2011
/s/ THOMAS H. WEIDEMEYER
Thomas H. Weidemeyer
Director February 17, 2011
135
REPORT OF INDEPENDENT REGISTERED PUBLIC ACCOUNTING FIRM
The Board of Directors and Stockholders of Waste Management, Inc
We have audited the consolidated financial statements of Waste Management, Inc. as of December 31, 2010and 2009, and for each of the three years in the period ended December 31, 2010, and have issued our report thereondated February 17, 2011 (included elsewhere in this Form 10-K). Our audits also included the financial statementschedule listed in Item 15(a)(2) of this Form 10-K. This schedule is the responsibility of the Company’smanagement. Our responsibility is to express an opinion based on our audits.
In our opinion, the financial statement schedule referred to above, when considered in relation to the basicfinancial statements taken as a whole, presents fairly in all material respects the information set forth therein.
ERNST & YOUNG LLP
Houston, TexasFebruary 17, 2011
136

WASTE MANAGEMENT, INC.
SCHEDULE II — VALUATION AND QUALIFYING ACCOUNTS(In Millions)
BalanceBeginning of
Year
Charged(Credited) to
Income
AccountsWritten
Off/Use ofReserve Other(a)
BalanceEnd ofYear
2008 — Reserves for doubtful accounts(b) . . . . . . $47 $50 $(56) $ (2) $39
2009 — Reserves for doubtful accounts(b) . . . . . . $39 $48 $(57) $ 2 $32
2010 — Reserves for doubtful accounts(b) . . . . . . $32 $41 $(47) $ 1 $27
2008 — Merger and restructuring accruals(c) . . . . $ 4 $ 2 $ (4) $— $ 2
2009 — Merger and restructuring accruals(c) . . . . $ 2 $50 $(42) $— $10
2010 — Merger and restructuring accruals(c) . . . . $10 $ (2) $ (5) $— $ 3
(a) The “Other” activity is related to reserves for doubtful accounts of acquired businesses, reserves associatedwith dispositions of businesses, reserves reclassified to operations held-for-sale, and reclassifications amongreserve accounts.
(b) Includes reserves for doubtful accounts receivable and notes receivable.
(c) Included in accrued liabilities in our Consolidated Balance Sheets. These accruals represent employeeseverance and benefit costs and transitional costs.
137

INDEX TO EXHIBITS
ExhibitNo. Description
3.1 — Third Restated Certificate of Incorporation [Incorporated by reference to Exhibit 3.1 toForm 10-Q for the quarter ended June 30, 2010].
3.2 — Amended and Restated Bylaws [Incorporated by reference to Exhibit 3.2 to Form 8-K datedMay 11, 2010].
4.1 — Specimen Stock Certificate [Incorporated by reference to Exhibit 4.1 to Form 10-K for the yearended December 31, 1998].
4.2 — Indenture for Subordinated Debt Securities dated February 3, 1997, among the Registrant andThe Bank of New York Mellon Trust Company, N.A. (the current successor to Texas CommerceBank National Association), as trustee [Incorporated by reference to Exhibit 4.1 to Form 8-Kdated February 7, 1997].
4.3 — Indenture for Senior Debt Securities dated September 10, 1997, among the Registrant and TheBank of New York Mellon Trust Company, N.A. (the current successor to Texas CommerceBank National Association), as trustee [Incorporated by reference to Exhibit 4.1 to Form 8-Kdated September 10, 1997].
4.4 — Officers’ Certificate delivered pursuant to Section 301 of the Indenture dated September 10,1997 by and between Waste Management, Inc. and The Bank of New York MellonTrust Company, N.A., as Trustee, establishing the terms and form of Waste Management,Inc.’s 4.75% Senior Notes due 2020 [Incorporated by reference to Exhibit 4.1 to Form 10-Q forthe quarter ended June 30, 2010].
4.5 — Guarantee Agreement by Waste Management Holdings, Inc. in favor of The Bank of New YorkMellon Trust Company, N.A., as Trustee for the holders of Waste Management, Inc.’s4.75% Senior Notes due 2020 [Incorporated by reference to Exhibit 4.2 to Form 10-Q forthe quarter ended June 30, 2010].
4.6* — Schedule of Officers’ Certificates delivered pursuant to Section 301 of the Indenture datedSeptember 10, 1997 establishing the terms and form of Waste Management, Inc.’s Senior Notes.Waste Management and its subsidiaries are parties to debt instruments that have not been filedwith the SEC under which the total amount of securities authorized does not exceed 10% of thetotal assets of Waste Management and its subsidiaries on a consolidated basis. Pursuant toparagraph 4(iii)(A) of Item 601(b) of Regulation S-K, Waste Management agrees to furnish acopy of such instruments to the SEC upon request.
10.1† — 2009 Stock Incentive Plan [Incorporated by reference to Appendix B to the Proxy Statement onSchedule 14A filed March 25, 2009].
10.2† — 2005 Annual Incentive Plan [Incorporated by reference to Appendix D to the Proxy Statementon Schedule 14A filed April 8, 2004].
10.3† — Employee Stock Purchase Plan [Incorporated by reference to Appendix A to the ProxyStatement on Schedule 14A filed March 25, 2009].
10.4† — Waste Management, Inc. 409A Deferral Savings Plan. [Incorporated by reference toExhibit 10.4 to Form 10-K for the year ended December 31, 2006].
10.5† — 1993 Stock Incentive Plan [Incorporated by reference to Exhibit 10.2 to Form 10-K for the yearended December 31, 1998].
10.6† — 2000 Stock Incentive Plan [Incorporated by reference to Appendix B to the Proxy Statement onSchedule 14a filed April 6, 2000].
10.7† — 2004 Stock Incentive Plan [Incorporated by reference to Appendix C to Proxy Statement onSchedule 14A filed April 8, 2004].
138

ExhibitNo. Description
10.8 — $2 Billion Revolving Credit Agreement dated as of June 22, 2010 by and among WasteManagement, Inc. and Waste Management Holdings, Inc. and certain banks party thereto, Bankof America, N.A., as Administrative Agent, JPMorgan Chase Bank, N.A. and Barclays Capital,as Syndication Agents, Deutsche Bank Securities Inc. and The Royal Bank of Scotland PLC, asDocumentation Agents, BNP Paribas and Citibank, N.A., as Co-Documentation Agents andJ.P. Morgan Securities Inc., Banc of America Securities LLC and Barclays Capital, as LeadArrangers and Joint Bookrunners [Incorporated by reference to Exhibit 10.1 to Form 10-Q forthe quarter ended June 30, 2010].
10.9 — CDN $410,000,000 Credit Facility Credit Agreement by and between Waste Management ofCanada Corporation (as Borrower), Waste Management, Inc. and Waste Management Holdings,Inc. (as Guarantors), BNP Paribas Securities Corp. and Scotia Capital (as Lead Arrangers andBook Runners) and Bank of Nova Scotia (as Administrative Agent) and the Lenders from timeto time party to the Agreement dated as of November 30, 2005. [Incorporated by reference toExhibit 10.32 to Form 10-K for the year ended December 31, 2005].
10.10 — First Amendment Agreement dated as of December 21, 2007 to a Credit Agreement dated as ofNovember 30, 2005 by and between Waste Management of Canada Corporation as borrower,Waste Management, Inc. and Waste Management Holdings, Inc. as guarantors, the lenders fromtime to time party thereto and the Bank of Nova Scotia as Administrative Agent [Incorporatedby reference to Exhibit 10.28 to Form 10-K for the year ended December 31, 2007].
10.11† — Employment Agreement between the Company and Cherie C. Rice dated August 26, 2005[Incorporated by reference to Exhibit 10.1 to Form 8-K dated August 26, 2005].
10.12† — Employment Agreement between the Company and Greg A. Robertson dated August 1, 2003[Incorporated by reference to Exhibit 10.2 to Form 10-Q for the quarter ended June 30, 2004].
10.13† — Employment Agreement between the Company and Lawrence O’Donnell III dated January 21,2000 [Incorporated by reference to Exhibit 10.1 to Form 10-Q for the quarter ended March 31,2000].
10.14† — Agreement for Termination of Employment dated June 1, 2010 between Waste Management,Inc. and Lawrence O’Donnell, III [Incorporated by reference to Exhibit 10.1 to Form 8-K datedJune 1, 2010.]
10.15† — Employment Agreement between the Company and Puneet Bhasin dated December 7, 2009[Incorporated by reference to Exhibit 10.12 to Form 10-K for the year ended December 31,2009].
10.16† — Employment Agreement between the Company and Duane C. Woods dated October 20, 2004[Incorporated by reference to Exhibit 10.2 to Form 8-K dated October 20, 2004].
10.17† — Employment Agreement between the Company and David Steiner dated as of May 6, 2002[Incorporated by reference to Exhibit 10.1 to Form 10-Q for the quarter ended March 31, 2002].
10.18† — Employment Agreement between the Company and James E. Trevathan dated as of June 1, 2000[Incorporated by reference to Exhibit 10.20 to Form 10-K for the year ended December 31,2000].
10.19† — Employment Agreement between Recycle America Alliance, L.L.C. and Patrick DeRuedadated as of August 4, 2005 [Incorporated by reference to Exhibit 10.1 to Form 8-K datedAugust 4, 2005].
10.20† — Employment Agreement between the Company and Robert G. Simpson dated as of October 20,2004 [Incorporated by reference to Exhibit 10.1 to Form 8-K dated October 20, 2004].
10.21† — Employment Agreement between the Company and Barry H. Caldwell dated as ofSeptember 23, 2002 [Incorporated by reference to Exhibit 10.24 to Form 10-K for the yearended December 31, 2002].
10.22† — Employment Agreement between the Company and David Aardsma dated June 16, 2005[Incorporated by reference to Exhibit 10.1 to Form 8-K dated June 16, 2005].
139

ExhibitNo. Description
10.23† — Employment Agreement between the Company and Rick L Wittenbraker dated as ofNovember 10, 2003 [Incorporated by reference to Exhibit 10.30 to Form 10-K for the yearended December 31, 2003].
10.24† — Employment Agreement between Wheelabrator Technologies Inc. and Mark A. Weidman datedMay 11, 2006. [Incorporated by reference to Exhibit 10.1 to Form 8-K dated May 11, 2006].
10.25† — Employment Agreement between the Company and Jeff Harris dated December 1, 2006.[Incorporated by reference to Exhibit 10.1 to Form 8-K dated December 1, 2006].
10.26† — Employment Agreement between the Company and Michael Jay Romans dated January 25,2007. [Incorporated by reference to Exhibit 10.1 to Form 8-K dated January 25, 2007].
10.27† — Employment Agreement between Waste Management, Inc. and Brett Frazier dated July 13,2007 [Incorporated by reference to Exhibit 10.1 to Form 8-K dated July 13, 2007].
10.28† — Form of 2010 Performance Share Unit Award Agreement [Incorporated by reference toExhibit 10.1 to Form 8-K dated March 9, 2010].
10.29† — Form of 2010 Stock Option Award Agreement [Incorporated by reference to Exhibit 10.2 toForm 8-K dated March 9, 2010].
10.30† — Form of 2009 Performance Share Unit Award Agreement [Incorporated by reference toExhibit 10.1 to Form 8-K dated February 24, 2009].
10.31† — Form of 2008 Performance Share Unit Award Agreement [Incorporated by reference toExhibit 10.1 to Form 8-K dated February 26, 2008].
12.1* — Computation of Ratio of Earnings to Fixed Charges.
21.1* — Subsidiaries of the Registrant.
23.1* — Consent of Independent Registered Public Accounting Firm.
31.1* — Certification Pursuant to Rule 13a-14(a) and 15d-14(a) under the Securities Exchange Act of1934, as amended, of David P. Steiner, President and Chief Executive Officer.
31.2* — Certification Pursuant to Rule 13a-14(a) and 15d-14(a) under the Securities Exchange Act of1934, as amended, of Robert G. Simpson, Senior Vice President and Chief Financial Officer.
32.1* — Certification Pursuant to 18 U.S.C. §1350 of David P. Steiner, President and Chief ExecutiveOfficer.
32.2* — Certification Pursuant to 18 U.S.C. §1350 of Robert G. Simpson, Senior Vice President andChief Financial Officer.
101.INS** — XBRL Instance Document.
101.SCH** — XBRL Taxonomy Extension Schema Document.
101.CAL** — XBRL Taxonomy Extension Calculation Linkbase Document.
101.DEF** — XBRL Taxonomy Extension Definition Linkbase Document.
101.LAB** — XBRL Taxonomy Extension Label Linkbase Document.
101.PRE** — XBRL Taxonomy Extension Presentation Linkbase Document.
* Filed herewith.
** Furnished herewith.
† Denotes management contract or compensatory plan or arrangement.
140

BOARD OF DIRECTORS
PASTORA SAN JUAN CAFFERTY (A, N)Professor EmeritaSchool of Social Service AdministrationUniversity of Chicago
FRANK M. CLARK, JR. (A, C)Chairman and Chief Executive OfficerComEd
PATRICK W. GROSS (A, N)ChairmanThe Lovell Group
JOHN C. POPE (A, C, N)Non-Executive Chairman of the BoardWaste Management, Inc.
W. ROBERT REUM (A, C)Chairman, President,and Chief Executive OfficerAmsted Industries Incorporated
STEVEN G. ROTHMEIER (A, C)Chairman and Chief Executive OfficerGreat Northern Capital
DAVID P. STEINERPresident and Chief Executive OfficerWaste Management, Inc.
THOMAS H. WEIDEMEYER (C, N)Retired Senior Vice Presidentand Chief Operating OfficerUnited Parcel Service, Inc.
A - Audit CommitteeC - Compensation CommitteeN - Nominating and Governance Committee
OFFICERS
DAVID P. STEINERPresident and Chief Executive Officer
DAVID A. AARDSMASenior Vice President,Sales and Marketing
PUNEET BHASINSenior Vice Presidentand Chief Information Officer
BARRY H. CALDWELLSenior Vice President,Government Affairs andCorporate Communications
GRACE M. COWANSenior Vice President,Customer Experience
BRETT W. FRAZIERSenior Vice President,Eastern Group
JEFF M. HARRISSenior Vice President,Midwest Group
M. JAY ROMANSSenior Vice President, People
CARL V. RUSHSenior Vice President,Organic Growth
ROBERT G. SIMPSONSenior Vice Presidentand Chief Financial Officer
JAMES E. TREVATHANSenior Vice President,Southern Group
RICK L WITTENBRAKERSenior Vice President,General Counsel andChief Compliance Officer
DUANE C. WOODSSenior Vice President,Western Group
PATRICK J. DERUEDAPresidentWM Recycle America, L.L.C.
MARK A. WEIDMANPresidentWheelabrator Technologies Inc.
DON P. CARPENTERVice President, Tax
CHERIE C. RICEVice President, Financeand Treasurer
GREG A. ROBERTSONVice President andChief Accounting Officer
LINDA J. SMITHCorporate Secretary
CORPORATE HEADQUARTERS
Waste Management, Inc.1001 Fannin, Suite 4000Houston, Texas 77002Telephone: (713) 512-6200Facsimile: (713) 512-6299
INDEPENDENT AUDITORS
Ernst & Young LLP5 Houston Center, Suite 12001401 McKinney StreetHouston, Texas 77010(713) 750-1500
COMPANY STOCK
The Company’s common stock is traded on the New York Stock Exchange (NYSE) under the symbol “WM.” The number of holders of record of common stock based on the transfer records of the Company at February 14, 2011 was approximately 13,900. Based on security position listings, the Company believes it had at that date approximately 321,000 beneficial owners.
TRANSFER AGENT AND REGISTRAR
BNY Mellon Shareowner Services480 Washington BoulevardJersey City, New Jersey 07310(800) 969-1190
INVESTOR RELATIONS
Security analysts, investment professionals,and shareholders should direct inquiries toInvestor Relations at the corporate addressor call (713) 512-6574.
ANNUAL MEETING
The annual meeting of the shareholders of the Company is scheduled to be held at 11:00 a.m. on May 13, 2011 at:The Maury Myers Conference CenterWaste Management, Inc.1021 Main StreetHouston, Texas 77002
WEB SITE
www.wm.com
Corporate Information
Printed on 30% post-consumer recycled paper

1001 Fannin, Suite 4000 • Houston, Texas 77002www.wm.com