solute transport in undisturbed columns of an aggregated tropical soil: preferential flow effects1
TRANSCRIPT

Solute Transport in Undisturbed Columns of an AggregatedTropical Soil: Preferential Flow Effects1
M. S. SEYFRIED AND P. S. C. RAO2
ABSTRACTSolute breakthrough curves (BTC) resulting from miscible dis-
placement of 'H2O in undisturbed soil columns under a range ofsoil-water tensions were evaluated in terms of the mobile-immobile(MIM) water model and the convective-dispersive (CD) model. TheBTC performed under tensions >O.I kPa were approximately sym-metric in shape and accurately described by the CD model, whereasBTC performed under tensions of 0 or 0.1 kPa were quite asym-metric and better described by the MIM model. Application of ten-sion resulted in about a 10- to 20-fold decrease in hydraulic con-ductivity \K(8)} with relatively little change in soil-water content (9).Highly asymmetric BTC were attributed to bypassing or preferentialflow along macropores. Thus, in terms of model selection, bypassingwas significant only when soil-water contents were at or very nearsaturation. Rhodamine B dye patterns obtained under saturated con-ditions showed that soil-water flow (and thus convective transport)
1 Approved for publication as Florida Agric. Exp. Stn. JournalSeries no. 8104. Received 3 Dec. 1986.
2 Postdoctoral Research Associate and Professor, respectively, SoilScience Dep., Univ. of Florida, Gainesville, FL 32611. The seniorauthor is now Postdoctoral Research Associate at Plant Science Dep.,Univ. of Delaware, Newark, DE 19717.
was confined to small regions within the columns. However, easilyidentifiable, discrete channels were not observed in these regions. Itappears that flow was conducted via a series of relatively large pores,or continuous pore sequences. Application of tension appears to havedisconnected the most rapidly conducting pore sequences, thus re-ducing the asymmetry in measured BTC and compressing the dye"solute front." Even so, dye patterns showed that flow was veryheterogeneous, as was also evidenced by high dispersion coefficientsin the 'H,O experiments. Comparison of the frequency distributionsof field-measured saturated hydraulic conductivity values and mea-sured rainfall intensities indicated that saturated conditions, andhence significant bypassing, are not expected to occur in this soilunder field conditions. Observation of water table response to rain-fall events supports this conclusion. From these experiments, weconclude that field-scale models based on the CD model may ade-quately represent solute movement in soil at this field site.
Additional Index Words: bypassing, macropores, tritiated water,dyes, model evaluation, mobile-immobile water, convective-disper-sive model, field-scale models.
Seyfried, M.S., and P.S.C. Rao. 1987. Solute transport in undis-turbed columns of an aggregated tropical soil: Preferential flow ef-fects. Soil Sci. Soc. Am. J. 51:1434-1444.
SEYFRIED & RAO: SOLUTE TRANSPORT IN A TROPICAL SOIL 1435
THROUGHOUT THE HUMID TROPICS , which OCCUPYabout 10% of the earth's land surface (Sanchez
et al., 1982), there is a potential for considerable lossof plant nutrients by leaching. Because improved cropyields in this region are largely dependent on bettersoil fertility management (Sanchez et al., 1982), thedevelopment of ways to quantitatively describe andpredict nutrient leaching losses is important.
In recent years, management-level models, designedto describe solute movement under field conditions,have been developed (e.g., Rao et al., 1981; Rose etal., 1982). These models are based on simplificationsof the convective-dispersive model for solute trans-port and do not account for situations in which thereis bypassing or preferential flow along macropores.Other models have been developed to remedy this,but they often require parameters that are difficult toestimate (Addiscott, 1977; Beven and Clark, 1986;Germann et al., 1986).
Efforts to infer the importance of bypassing in soilsfrom standard soil descriptions have not been suc-cessful in a quantitative sense (Bouma, 1981). Thedifficulty stems from the fact that bypassing is depen-dent on pore continuity and the rate of water additionrelative to the soil matrix (nonmacropore region) hy-draulic conductivity, both of which are difficult to as-sess (Bouma, 1981, Beven and Germann, 1982). Forthese reasons, quantitative assessment of bypassing hasfocused on the measurement of soil hydraulic prop-erties (Bouma and Anderson, 1973) and the move-ment of tracers (Bouma, 1981; White, 1985).
This study was conducted near Turrialba, CostaRica, and is part of a larger project investigating nu-trient movement under different cropping systems inthe humid tropics. Nutrient leaching loss was sus-pected to be important due to the large excess of pre-cipitation over pan evapotranspiration (ET) of about264 cm yr"1 (Forsythe, 1974). Bypassing was consid-ered to be a potentially important process at the sitebecause no ponding or runoff was observed from ex-perimental plots during intense rainfall events.
The primary objective of this study was to deter-mine if bypassing should be considered in attempts toquantitatively describe nutrient leaching losses at thesite. A second objective was to investigate the natureof the porous network that is responsible for observedhydraulic behavior.
THEORYThe convective-dispersive (CD) model of solute transport
in porous media has been well established as an effectivedescriptor of solute movement in homogeneous porous me-dia (Biggar and Nielsen, 1962). The equation for steady-statewater flow conditions can be written in terms of the follow-ing five dimensionless parameters: relative concentration (Q,Peclet number (P), pore volume (T), relative distance (X),and the retardation factor (RF). These are denned as follows:
T = v0t/L,X=z/L,
P = vJL/D,C = (Ch - C,)/(C0 ~ Q,
RF = 1 + p KD/6,
[1][2][3][4][5]
where v,, is the pore-water velocity (cm h ') equal to Darcyflux (q, cm h~') divided by the soil-water content (6, mLcm"3); L is the column length (cm); z is the position (cm);t is time (h); D is the dispersion coefficient (cm2 h~'); C0 andC,, are the influent and effluent solution concentrations (mgmL~'), respectively; C, is the initial soil solution concentra-tion; ph is the soil bulk density (g cm~3); and KD (mL g~')is the sorption coefficient.
Assuming one-dimensional, steady-state water flow,RF (dC/dT) = (l/P^C/dX2) - dC/dX. [6]
Of the five parameters, C, X, and T, can be determineddirectly by independent measurement, and RF can be esti-mated using data from batch sorption experiments as de-scribed in the next section.
Note that v,n which appears in the expressions for P andr, is defined as (q/6), which implies that all soil-water par-ticipates in convective transport of the solute. This is a com-mon feature between the CD model and the simplified, field-level models mentioned previously. It is not an appropriatedescriptor of convective transport when there is bypassingbecause soil-water flux is effectively limited to a small por-tion of the total soil water (i.e., that within macropores).
Another model for solute movement, referred to as themobile-immobile (MIM) water model in this paper, was de-veloped by van Genuchten and Wierenga (1976) to accom-modate this situation. In this model, two soil-water regionsare explicitly differentiated, with all convective transport as-sumed to occur in the mobile region and transport in theimmobile region restricted to diffusion.
As with the CD model, the MIM model can be describedin terms of dimensionless variables. The additional varia-bles required are
0 = (6m + f p h KD) I (0 + Ph KD), [7]a = aL/q, [8]
c, = (Cm - Q/(C0 - Q, [9]and
c2 = (Cim - C,)/(C0 - C,), [10]where Cm and C,-,,, refer to soil solution concentrations inthe mobile and immobile regions; 6m is the mobile watercontent (mL cm~3);/is the fraction of sorption sites in themobile region; and a (h~') is an empirical mass transfercoefficient. The MIM model for one-dimensional, steady-state water flow conditions can be stated as follows:0 RF (dcJdT) + (1 - 0) RF dc2/dT
= (l/P^cJdX2) - dcJdX [11]and
(1 - 0) RF (dCz/OT) = co (c, - c2). [12]The variables P and T in Eq. [11] and [12] are defined interms of the mobile pore-water velocity v,,, = (q/6m\ as op-posed to v,,, in Eq. [1] and [3].
MATERIALS AND METHODSSoil Characteristics and Management
The soil studied is an Institute clay loam (fine-loamy,mixed, isohyperthermic, Typic Dystropept) located at CA-TIE (Centre Agricola Tropical de Investigations y Ensen-anzas) near Turrialba, Costa Rica. It is derived from allu-vium deposited from the surrounding mountains, which areprimarily of volcanic origin. Very little soil profile devel-opment was evident except for an accumulation of organicmatter at the surface. Soil textures are clay loam throughout.Aguirre (1971) described the structure as weak, subangular

1436 SOIL SCI. SOC. AM. J., VOL. 51, 1987
blocky with peds ranging from 0.5 to 2.0 cm in diameternear the surface and becoming increasingly less pronouncedwith depth. The site is nearly level and the soil is consideredto be moderately well-drained (Aguirre, 1971).
Miscible Displacement ExperimentsSoil columns were taken from two experimental plots lo-
cated about 100 m apart. One plot (Plot 1) had been plantedto maize (Zea mays L.) for 6 yr prior to column removal,while the other plot (Plot 2) was planted to a mixture ofcacao (Theobroma cacao), laurel (Cordia alliodora), andplantain (Musa paradisiaca), and had been under continu-ous management for 5 yr. No tillage was performed on eitherplot during that time and no machinery entered either plot.
Five undisturbed soil columns were collected from theseplots at two depths (0-30 and 75-105 cm). Columns num-bered 1, 2, and 3 (Table 1) were taken from Plot 1 and thosenumbered 4 and 5 were taken from Plot 2.
In order to collect undisturbed columns, a pit was dugisolating a pedestal of soil with a diameter slightly largerthan that of the column (10-9 cm). Bevelled polyvinyl chlo-ride (PVC) pipe lined with petroleum jelly was then incre-mentally forced over the soil pedestal (McVoy, 1985).
An apparatus (Fig. 1) similar to that described by Hillel(1971) was used for the displacement experiments. The frit-ted glass endplates fitted to both column ends had a bubblingpressure of 4.0 kPa. Influent solution was changed by meansof a switch valve. Residual solution was flushed from theinlet endplate via the flushing port. The hydraulic potential,as measured by manometers, was controlled at the inlet bya Mariotte device, and the outlet by a hanging water column.Effluent was collected in a fraction collector. Air vents wereopened to permit desaturation.
All unsaturated displacements were conducted under aunit hydraulic gradient. This resulted in a uniform matricpotential (and 6) within the soil column. The measured qvalues were therefore equivalent to K(6). All saturated dis-placements were also conducted under a unit hydraulic po-tential gradient except for two cases, shown in Fig. 2a and2b, in which the gradient was less than unity (q < KM)-
The 3H2O activity in the influent solution was about 259Bq mLr1 in a 0.01 M CaCl2 solution. The 3H2O activity ineffluent fractions was assayed using liquid scintillation tech-niques.
The CD and MIM models were fitted to the measuredsolute breakthrough curves (ETC). The program CFITIM(van Genuchten, 1981), based on nonlinear, least sum ofsquares criteria for goodness of fit, was used. For both models,the boundary conditions assumed were constant concentra-tion at the inlet end and a semi-infinite column.
Rhodamine B dye displacements were performed usingthe same columns after the 3H2O displacements. The in-fluent dye concentration (in 0.01 M CaQ2 solution) was 2g L~'. The amount of dye solution displaced ranged from0.05 to 0.32 pore volumes (Table 1). Upon cessation of dye
Table 1. Experimental conditions for displacement.
Columnno.
1
2345
Columnlength
cm12.5
15.012.512.012.5
Depth
Surface
SubsoilSurfaceSubsoilSurface
Tension Tensionof 'H of dye
displacement displacementm a
0.0, 0.1, 0.5,1.0, 2.00.0, 1.00.0, 1.00.0, 1.00.0, 1.0
1.0
0.00.01.0-
Porevolume
displacement!
0.32
0.050.130.19-
solution infiltration, cross sections were cut at 1 -cm intervalsand photographed. Selected cross sections were reproducedin pen and ink.
The experimental conditions under which all displace-ments were performed are summarized in Table 1.
Field MeasurementsThe depth to the water table was measured in perforated,
2.54-cm diam PVC pipe. Measurements were made severaltimes each week. Rainfall was measured daily at the site.Infiltration measurements were made with a double-ring in-filtrometer (Bertrand, 1965) at 24, approximately evenlyspaced, locations on an adjacent 56- by 32-m plot. The di-mensions of the inner and outer rings were 31 and 60 cm,respectively.
Batch Adsorption ExperimentsAdsorption isotherms for 3H2O were determined using two
different batch techniques under slightly different condi-tions. The first method is similar to that described by Daoand Lavy (1978). The soil used in this method was takenfrom Column 3 after the displacement experiments had beenperformed and the soil oven-dried for pore volume deter-mination. A solution of 0.01 M CaCl2 and 3H2O was addedto soil in a soil/solution ratio of 2:1 (g g~'), which was sim-ilar to conditions of the column experiment. After equili-bration overnight, soil solution was extracted by centrifu-gation, which forced the equilibrated solution through holesat the bottom of the vials containing the soil-solution (Daoand Lavy, 1978).
In the second method, similar to that of Green et al. (1980),the same solutions were added to air-dried soil from a por-tion of Column 3 not used in the displacement experiments.The soil/solution ratios were 1:2. After addition of solutionsoil samples were shaken overnight, centrifuged, and the su-pernatent solution analyzed for 3H activity. Concentrationsof 3H ranged from 25.9 to 259 Bq mL~' in both experiments,
t The number of pore volumes displaced during the dye application.
Fig. 1. Schematic illustration of the apparatus used to obtain break-through curves. The components are: (1) Mariotte device, (2)hanging water column, (3) fritted glass endplate, (4) manometer,(5) air vents, (6) flushing port, (7) three-way valve, and (8) fractioncollector.

SEYFRIED & RAO: SOLUTE TRANSPORT IN A TROPICAL SOIL 1437
which was approximately the range of concentrations mea-sured in the column effluent in the miscible displacementexperiments.
In both methods, the amount of 3H adsorbed by the soilwas calculated from the differences in 3H2O concentrationsof initial and equilibrium solutions. These sorption data werefitted to linear isotherms using least-squares methods andthe sorption coefficient, KD, values were estimated.
RESULTS AND DISCUSSIONHydraulic Parameters
The effects of Darcy flux, (q) volumetric soil-watercontent (0), and soil-water tension (h, kPa) on 3H2OETC are shown in Fig. 2 through 6. With two excep-tions, all BTC were measured under conditions of unithydraulic potential gradient so that, in those cases, thehydraulic conductivity [K(6\ cm h~'] was equal to q;K(6) values are shown for the other two cases (see Fig.2a, b).
The K(6) values were extremely high considering thatthe clay content of the soil was >30%. The combi-nation of high clay content and high saturated hy-draulic conductivity (ATsat) is frequently indicative offlow along macropores (Bouma and Anderson, 1973;McKeague et al., 1982). Saturated soil-water contents(Os) are also fairly high.
About a two orders of magnitude decrease in K(ff)was observed as h increased from 0 to 2 kPa (Fig. 2).This was accompanied by a relatively modest decrease(0.05 mL cm"3) in 9. Similar trends in K(6) were ob-served in the other columns (Fig. 3-6). This indicatedeither that (i) few discrete, large (>0.5-mm radius)pores conducted large volumes of water rapidly under
1.0
C/C00.6
0.2
1.0
C/C0
0.6
0.2
1.0
h = 0.19=0.57
!9.5
h=0.56 = 0.55
= 5.9
0.6C/C0
0.2
h = I .O6 = 0.531=1.2
1.0 2.0 3.0PORE VOLUME
1.0 2.0 3.0PORE VOLUME
Fig. 2. (a-f) The effect of soil-water tension (h, kPa), soil-watercontent (0, mL cm"1), and Darcy flux (q, cm h ') on the elutionof tritiated water in Column 1. The continuous line represents thebest fit of the MIM model in a, b, and c, and of the CD modelin d, e, and f.
saturated conditions; or (ii) water held in large poresserved to "connect" a number of pores that conductedwater rapidly.
The series of tensions of Fig. 2 illustrates the tran-sition between saturated and unsaturated conditionsfor the surface soil. Preliminary investigations withsubsoil columns show a qualitatively similar pattern.This similarity between subsoil and topsoil is con-firmed in subsequent comparisons between saturatedand unsaturated conditions (Fig. 3-6).
Qualitative Evaluation of Breakthrough CurvesIn general, BTC shapes changed dramatically as h
was increased. Breakthrough curves obtained undersaturated conditions were asymmetric, characterizedby very early appearance of tracer in the effluent anda slow approach of effluent relative concentrationtoward 1.0 (referred to as "tailing"). This behavior hasbeen observed in undisturbed soil columns (Andersonand Bouma, 1977; White et al., 1984), and has beeninferred from field studies of solute movement (Wildand Babiker, 1976). Such asymmetric BTC indicatethat solute was conducted relatively rapidly throughthe soil columns by a small fraction of the total soilwater. The rapidly conducting fraction of the soil waterin other soils has been related to interaggregate regions(Nkedi-Kizza et al., 1982), interped regions (Andersonand Bouma, 1977), and discrete macropores (Kan-chanasut et al., 1978).
Unsaturated BTC were markedly more symmetric,with a later arrival of tracer in the effluent and lesstailing. This trend was not reversed as tension wasincreased to 2 kPa. These results differ from earlierstudies that have shown that tailing in BTC increasedwith increases in h (Nielsen and Biggar, 1961; Gaudetet al., 1977). Apparently the pore network in the In-stitute soil is sufficiently interconnected that drainageof large pores does not result in the isolation of stag-nant regions in the column. It should be noted thatNielsen and Biggar (1961) and Gaudet et al. (1977)performed their experiments in packed sand columnsat relatively low soil-water contents. Lower soil-watercontents enhance the possibility that stagnant regionswill be isolated in the soil. In this respect, our resultsare similar to those of Elrick and French (1966). Theycompared saturated and unsaturated flow in undis-turbed columns and found that dispersion decreasedwith application of tension, although marked asym-metry during saturated flow was not observed.
The observed change in BTC shape with increasingh can be explained by the concomitant decrease in qand/or by changes in the effective (i.e., conducting)pore geometry. In general, bypassing is enhanced byincreasing q at a given 6 because there is less time fordiffusive transfer into stagnant regions. At the sametime, increasing h changes the effective pore geometryby draining larger pores that may be responsible forthe observed bypassing.
Both effects were operative in this study, but theimpact on the effective pore geometry was dominant.This is illustrated in Fig. 2. When q was reduced andthe soil remained saturated (Fig. 2a and b), the BTCshape was only slightly altered. However, when dis-placement on the same column was performed under

1438 SOIL SCI. SOC. AM. J., VOL. 51, 1987
unsaturated conditions at approximately the same q(Fig. 2b vs. 2d and e), there was a considerable changein ETC shape. As discussed below, these trends werereflected in the models and parameters used to de-scribe the ETC.
Quantitative Evaluation of Breakthrough CurvesAll ETC were fitted to both the MIM and CD
models. In general, curve fits fell into two groups; sat-urated and unsaturated, with the 0.1-kPa run (Fig. 2c)intermediate. The parameter values obtained are dis-cussed according to these groups.
Unsaturated Breakthrough CurvesTwo dimensionless parameters, P and RF, are re-
quired in the CD model. The best fit (least sum ofsquares) was obtained by allowing both parameters tovary. The solid line in all the unsaturated ETC, exceptthe 0.1-kPa run, represents the calculated best fit usingthe CD model (Fig. 2-6). In general, the agreementwas excellent. The estimated parameter values and as-sociated 95% confidence intervals shown in Table 2appear to be independent of the depth from which thecolumns were sampled. Peclet numbers (P) rangedfrom 2 to 14 and RF values from 1.10 to 1.18. Dis-i.o
0.6C/C0
0.2
h = 0.08 = 0.60
= 28.7
1.0 2.0 3.0 1.0 2.0 3.0PORE VOLUME PORE VOLUME
Fig. 3. (a and b) Effect of soil-water tension (h, kPa), soil-watercontent (0, mL cm"-1), and Darcy flux (cm h"1) on elution of tri-tiated water in Column 2. The solid lines in a and b represent thebest fit of the MIM and CD models, respectively.
1.0
0.6
0.2
C/Cn 1.0
0.2
1.0PORE
2.0VOLUME
Fig. 4. (a and b) The effect of soil-water tension (h, kPa), soil-watercontent (0, mL cm"3), and Darcy flux (q, cm h~') on elution oftritiated water in Column 3. The solid lines in a and b representthe best fit of the MIM and CD models, respectively.
persion coefficients (D) calculated using these P valueswere high relative to those measured in sieved, packedcolumns, but this is expected for undisturbed columns(McMahon and Thomas, 1974; Cassel et at., 1975). Itindicates that there was a relatively wide range of pore-water velocities within the soil columns.
The RF values obtained were high considering thattritium is frequently assumed to be nonadsorbed (RF= 1.0). Tritium sorption has been noted by severalworkers (Mansell et al., 1973; Wierenga et al., 1975;van de Pol et al., 1977; Nkedi-Kizza et al., 1982) andhas been associated with hydroxyl exchange with claylattice hydroxyls (Stewart and Baker, 1973).
The area above the measured ETC was calculatedfor several of the unsaturated BTC to estimate RFvalues (Pandey and Gupta, 1984). The RF values cal-
c/o.
0.2
1.0PORE VOLUME
3.0
Fig. 5. (a and b) The effect of soil-water tension (h, kPa), soil-watercontent (0, mL cm~3), and Darcy flux (q, cm h~') on elution oftritiated water in Column 4. The solid lines represent the best fitof the MIM and CD models in a and b, respectively.
C/C,
0.2 '
1.0 2.0PORE VOLUME
Fig. 6 (a and b) The effect of soil-water tension (h, kPa), soil-watercontent (0, mL cm~3), and Darcy flux (q, cm h"') on the elutionof tritiated water in Column 5. The solid lines represent the bestfit of the MIM and CD models in a and b, respectively.

SEYFRIED & RAO: SOLUTE TRANSPORT IN A TROPICAL SOIL 1439
culated in this manner agreed closely with those ob-tained by curve-fitting. Since the fit between calculatedand measured curves was excellent in every case, thisresult confirms the finding of van Genuchten and Par-ker (1984), that mass balance is preserved with themathematical solution and boundary conditions usedin curve-fitting.
An independent check of RF can be obtained frommeasurement of adsorption in batch isotherms. Thebatch isotherms obtained using both methods de-scribed in the previous section were essentially iden-tical. Both isotherms were linear (r2 >0.994) with aKD value of 0.133 ± 0.0046 mL g~'. This KD value issignificantly larger than those obtained from valuesderived from fitted parameters (Table 2). Discrepan-cies between batch and column-measured adsorptionparameters have been noted by others (Nkedi-Kizzaet al., 1982). The value of RF calculated using thebatch-derived KD value (including a coarse fragmentcontent of 3.9% in the column) is 1.26, which is slightlyhigher than that obtained from curve fitting (1.17).This discrepancy is likely due to differences in the con-dition of the soil when the experiments were per-formed. The batch isotherms were conducted on air-dried or oven-dried soil, whereas the columns werenever air-dried.
When all unsaturated ETC, except the 0.1-kPa run,were fitted to the MIM model either extremely higho> values (>35) or ft values of 1 were obtained. Frominspection, it is clear that Eq. [11] and [12] are indis-tinguishable from Eq. [6] when ft = I, and use of theMIM model is not justified. The effect of high <o valuesis less clear, but implies extremely rapid mass transferbetween mobile and immobile soil-water regions,which effectively eliminates the need to make a dis-tinction between them. This will be discussed in greaterdetail in the next section.
Saturated Breakthrough CurvesThe 0.1-kPa run (Fig. 2c) will be included in this
part of the discussion because it more closely resem-bles the saturated ETC than the other unsaturatedETC. The saturated ETC were poorly described by theCD model because of the very rapid rise in relativeconcentration and the obvious leftward position shift.
Table 2. Convection-dispersive (CD) model parameter values.
Column no. A
kPa1 0.5
1 1.0
1 2.0
2 1.0
3 1.0
4 1.0
5 1.0
P
2.28(0.06)t4.45(0.31)6.62
(0.17)13.5(0.76)13.1(0.49)
12.2(0.57)7.01
(0.36)
RF
1.10(0.01)1.12
(0.02)1.17
(0.01)1.12
(0.01)1.18
(0.01)1.16
(0.01)1.18
(0.01)
KDmL g-'
0.043(0.006)0.053(0.008)0.069
(0.002)0.062(0.005)0.080(0.002)0.071(0.003)0.079
(0.005)
D
cm2 h-'60.9(0.02)6.44
(0.17)0.58
(0.01)2.52
(0.13)3.78(0.14)1.65
(0.07)5.81
(0.18)
Use of the MIM model requires specification of fourdimensionless parameters: P, RF, ft, and w. Althoughit is possible to allow all four parameters to vary si-multaneously, the resultant parameter estimation isrelatively imprecise. One value, RF, should be con-sistent with those derived from the unsaturated (CDmodel) ETC. This value was accordingly taken fromthe unsaturated ETC and fixed during parameter es-timation using the saturated ETC.
In every case, very close agreement between mea-sured and calculated ETC was obtained. In general,the parameter values in Table 3 indicate the followingthree trends: (i) very small P values corresponding toextremely large D values; (ii) 18 values on the order of0.23 to 0.84; and (iii) o> values ranging from 0.08 to3.89.
In interpreting the physical significance of the P val-ues estimated by curve-fitting the CD and the MIMmodels to the measured ETC, it should be recognizedthat these models may be solved subject to several setsof boundary conditions (i.e., solute concentration orflux specified at the inlet and outlet). Problems asso-ciated with the use of these solutions in terms of con-serving mass and the reasons for the differences in thecalculated ETC have been discussed in detail by vanGenuchten and Parker (1984) and Parlange et al.(1985). These authors have noted that the ETC cal-culated by these solutions diverge, especially when P<5. As evident from the data presented in Table 3,the P values estimated by fitting the MIM model tothe measured data are very small (P <1); thus, onlya qualitative interpretation of the D values calculatedfrom these P values is possible. Very small P valuesare indicative of an extremely broad range in pore-water velocities in the mobile water region. This sug-gests that the compartmentalization of soil water intoonly two regions, as assumed in the MIM model, wasinsufficient to account for the range of pore-water ve-locities encountered. It is possible that the MIM modelcan be extended to consider gradations of soil-watermobility. Skopp et al. (1981) have applied this ap-proach, but to only two soil-water regions, each withan average pore-water velocity. Morisawa et al. (1986)evaluated a model where the soil water was dividedinto three regions: immobile, moderately mobile, andTable 3. Mobile-immobile water (MIM) model parameter values.
Columnno.
1 (fast)
1 (slow)
1 (0.1kPa)
2
3
4
5
P
0.29(O.Ol)f0.86(0.05)1.11
(0.03)0.43(0.03)0.55(0.03)0.76(0.30)0.14
(0.02)
RF
1.12
1.12
1.12
1.13
1.17
1.15
1.17
0
0.76(0.03)0.43(0.04)0.84
(0.04)0.34(0.03)0.34
(0.03)0.23
(0.05)0.45
(0.11)
u
1.02(0.39)2.46
(0.45)0.08
(0.03)3.84
(0.48)2.99
(0.48)0.16(0.03)3.89
(2.53)
D
cm2 h"1
2515
150
437
1643
2758
3497
7525
ESR
cm0.18
0.61
0.51
0.18
0.19
0.86
0.15
*
0.81
0.47
0.89
0.37
0.38
0.26
0.51
t Numbers in parentheses are the 95% confidence intervals associated withthe estimated value.
t Numbers in parentheses are the 95% confidence intervals associated withthe estimated value.
1440 SOIL SCI. SOC. AM. J., VOL. 51, 1987
rapidly mobile. White et al. (1986) have used thetransfer function model (TFM), developed by Jury(1982), to analyze ETC similar to the saturated ETCpresented here. The TFM model considers the pore-water velocity distribution to be a continuous (usuallylog-normal) function. Viewed in this perspective theMIM model may be considered to represent an ex-treme, bimodal, pore-water velocity distribution.
The parameter ft is related to the mobile water frac-tion, $ (where <t> = 6m/0s) through the expression $ =[(RF ft) - /(RF - 1)]. Note that, for a nonadsprbedsolute (RF = 1), <t> = /3. As a first approximation, ftcan be considered to be a measure of $ in these ex-periments because RF is close to 1. A more refinedestimate of $ is obtained if some assumptions con-cerning/are made. Recall that/was denned as thefraction of sorption sites in the mobile region. If thedistribution of sorption sites is independent of loca-tion in soil-water regions, then/ = 3> when the soil issaturated and $ = /3. However, it seems reasonableto expect that proportionately more sorption sites willbe found in immobile than mobile regions, becausethe pores in immobile regions should be smaller andtherefore have more exposed surface area. This rea-soning has been used to justify the assumption that/= 0 (Nkedi-Kizza et al., 1982), which leads to $ = ftRF. Thus, in soils with positive adsorption, $ valuesare expected to be larger than the ft values. The $values in Table 3 were calculated assuming that / =$/2, which is an intermediate estimate.
The results in Table 3 indicate that $ values of 0.25to 0.50 are generally consistent with the parametersfitted with the MIM model. These values are surpris-ingly high in light of the large changes in K (0) that
10 15
resulted from relatively small changes in 6. An inde-pendent estimate of $ can be obtained by assumingthat water held at field capacity is immobile (Addis-cott et al., 1978). In this case, such an approach yieldsestimates of $ of approximately 0.156, which is dis-tinctly lower than those obtained from curve-fitting.When this value was fixed along with RF, the resultantP values were increased, w values were decreased, andthe goodness of fit was substantially reduced. Thesefitted curves were too angular, displaying a more rapidrise in effluent concentration with greater tailing thanthe measured ETC. The difficulty of obtaining inde-pendent estimates of $ has been noted by others (Ad-discott et al., 1978).
The parameter u> is somewhat more difficult to in-terpret, as it is not directly related to any specific soilcharacteristic or property. However, work by Rao etal. (1980a) has shown that w can be used to success-fully calculate interaggregate concentrations during dif-fusion into spherical aggregates of known volume. Insubsequent work (Rao et al., 1982) it was demon-strated that porous media composed of different sizesand shapes of aggregates could be approximated by asingle "equivalent" spherical aggregate size on a vol-ume-weighted basis. This work has recently been ex-tended to miscible displacement studies by van Gen-uchten (1985).
Using analytical solutions for flow through porousmedia composed of immobile regions of known ge-ometry, van Genuchten (1985) was able to express uin terms of an average sphere or other aggregate shape.This technique was applied to the saturated ETC todetermine the effective spherical radius (ESR) con-sistent with the fitted parameter values. The param-eters shown in Table 3 indicate that the soil may be
10 isCM
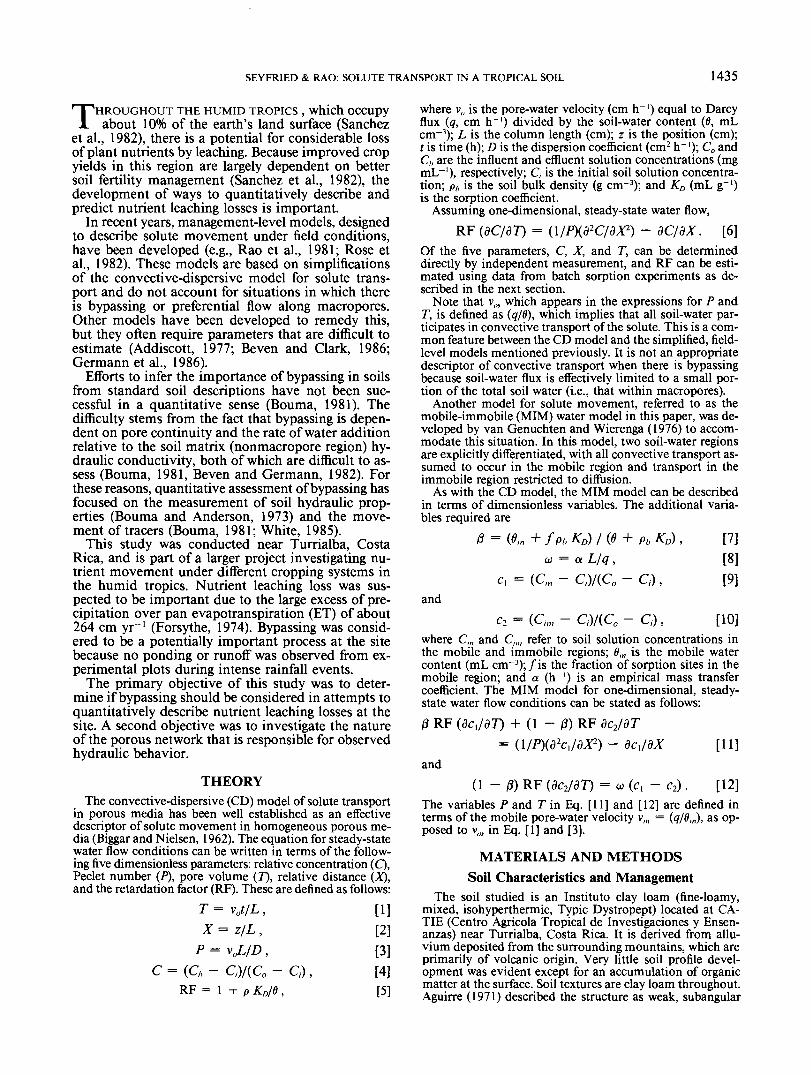
Fig. 7. Rhodamine B dye staining pattern in Column 1 resultingfrom displacement under a soil-water tension of 1 kPa.
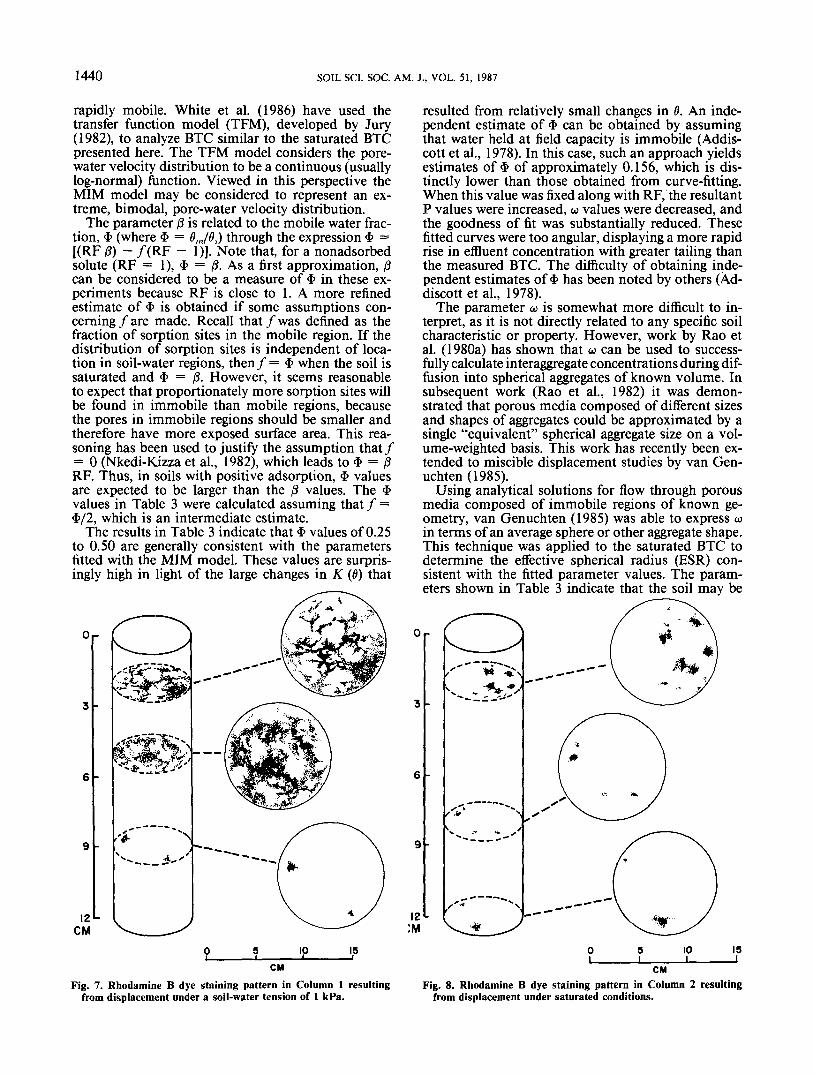
CMFig. 8. Rhodamine B dye staining pattern in Column 2 resulting
from displacement under saturated conditions.

SEYFRIED & RAO: SOLUTE TRANSPORT IN A TROPICAL SOIL 1441
considered to be composed of spherical aggregates of0.15- to 0.86-cm radius.
Another way of considering the effect of aggregatesize on the effective pore geometry was presented byRao et al. (1980b). They showed that, when the ag-gregate size is small enough relative to the pore-watervelocity, a condition of near-equilibrium will be es-tablished and the CD model should be appropriate.For spherical aggregates, the condition of near-equi-librium is valid when
[Z>,L(l-<I>)/a2v20.3]>l [13]where De is the diffusion coefficient (cm2 h~'), a is theaggregate radius (cm), and L is the column length(Passioura, 1971; Rao et al., 1980b). Taking ESR tobe 0.5 cm leads to a critical v0 of 1.6 cm h~', whichis generally less than the v0 values of the unsaturatedruns (v0 « 2q in these columns). Thus, spherical re-gions of immobile water could exist in the columnsbut their effect on solute transport would be "masked"as high dispersion.
Based on the model parameter analysis, some in-ferences concerning the nature of the effective poregeometry of the Institute soil can be made. The largeATsa, values measured in conjunction with stronglyasymmetric BTC indicate that water was conductedrelatively rapidly through some portion of the soilwhen saturated. The large reduction in K(ff) and BTCasymmetry that resulted from application of 0.1 to 0.5kPa of tension suggests that soil water was rapidlyconducted via macropores (Luxmoore, 1981; Ger-mann and Beven, 1981). However, the extremely lowP values and $ values of 0.25 to 0.50 under saturatedconditions suggest that there were several such regions
Or
12CM
10 15
CM
Fig. 9. Rhodamine B dye staining pattern in Column 3 resultingfrom displacement under saturated conditions.
of varying conductivities. The model parameter val-ues obtained are consistent with fairly large regions ofimmobile water. If spherical immobile regions are as-sumed, for example, they would have radii of 0.15 to0.86 cm.
Although immobile regions were described in termsof spherical aggregates, the MIM model specifies nopore geometry and numerous other possibilities exist.Rhodamine B dye was used to better determine theactual effective pore geometry.
Dye ExperimentsDyes have frequently been used to visually inves-
tigate the nature of flow paths through the soil (Boumaand Dekker, 1978; Omoti and Wild, 1979; McVoy,1985). This approach permits the observation of theconducting pathways and thereby the relating of waterand solute flow to observable structural features orbiochannels. The basic assumption made in inter-preting dye patterns is that the more solution thatpasses a given point, the more darkly stained that pointwill be. Thus, stained regions are interpreted as beingregions of relatively fast flow, and the unstained re-gions to be of relatively slow flow.
It is important that this fairly simplistic approachnot be extrapolated far in terms of correlation of dyepatterns with BTC. In the first place, Rhodamine Bdye is sorbed to the soil much more strongly thantritium (McVoy, 1985), so that dispersion is appar-ently reduced. Second, the dye is not instantaneouslyand reversibly desorbed as tritium is assumed to be.And third, visual evaluation of color is qualitative, sothat quantification of the amount of dye at a locationis not possible.
Or
12CM
,~" f ^ •*>.' *f *- I"•i •?•»' #
10 15CM
Fig. 10. Rhodamine B dye staining pattern in Column 4 resultingfrom displacement under a soil-water tension of 1 kPa.
1442 SOIL SCI. SOC. AM. J., VOL. 51, 1987
Given these qualifications, four important obser-vations can be made from the dye patterns illustratedin Fig. 7 through 10. First, no significant staining ofthe column edges was observed in Columns 1, 2, and3, and the staining on the edge of Column 4 was notas intense as in the internal portions of the column.From these observations we conclude that observedBTC were not strongly affected by preferential flowalong the column boundary.
Second, although specific stained regions that musthave been responsible for the very early appearanceof tracer in the effluent were easily identified, with oneexception (Column 1), they were not obviously asso-ciated with discrete biochannels or structural features.Even with the segmented column at hand, it was verydifficult to determine exactly which pores were con-ducting, since, in every case, many visible pores werestained. In addition, it was difficult to trace individualpore sequences along the length of the column becausethey meandered considerably across the column. Om-oti and Wild (1979) and McVoy (1985) have madesimilar observations.
Third, where structural units were relatively strongas in Column 1, there was preferential flow aroundthem. The structural units isolated in Column 1 rangedin radius from about 0.3 to 1.2 cm, which is somewhathigher than the range of values calculated from thecurve-fit parameters. The fact that these units wereidentified during unsaturated flow, which was well de-scribed by the CD model, indicates that movementinto and out of those units was sufficiently rapid thatbypassing was not indicated in the BTC. This obser-vation probably accounts for the generally greater dis-persion observed in undisturbed columns and fieldstudies.
Fourth, the nature of the soil in the stained regionsdoes not appear much different in the saturated andunsaturated columns. This is evidence that, rather thandraining a few discrete large pores, the application oftension drains regions of the soil that serve to "con-nect" pore sequences.
The main difference between saturated and unsat-urated dye patterns is that the "solute front" is morecompressed in the unsaturated columns. Note that thenumber of pore volumes of dye solution applied to allcolumns was approximately the same (Table 1), butthe extent of staining in the unsaturated runs was morestrongly weighted toward the inlet end of the column.
These observations compliment the results of BTCanalysis and hydraulic property measurement in theprevious section. It appears that the highly asymmet-ric BTC and high Ksai measured under saturated con-ditions were due to rapid transport in a restricted re-gion of the columns. These regions are bettercharacterized as conducting pore sequences than asdiscrete macropores, and their identification in the fieldwould be very difficult. There appears to be a numberof such pore sequences that range widely in conduc-tivity. Application of tension "disconnects" the largesteffective pore sequences and therefore results in re-duced BTC tailing and K(ff). Immobile regions weregenerally characterized as regions between conductingpore sequences as opposed to easily identifiable, phys-ically controlled regions. When displacement occurredunder tension, flow in the conducting regions was slow
0 1.0 2.0
Rainfall Intensity Ccm/hr) sat (cm/hr)
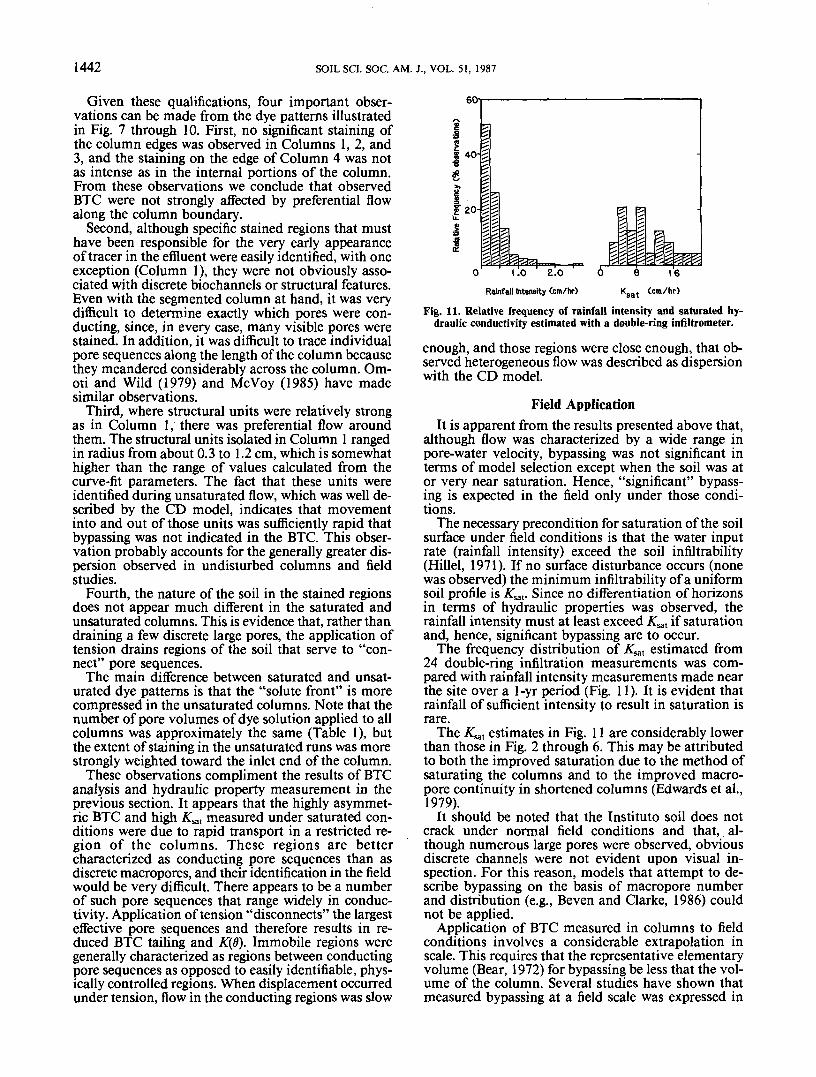
Fig. 11. Relative frequency of rainfall intensity and saturated hy-draulic conductivity estimated with a double-ring infiltrometer.
enough, and those regions were close enough, that ob-served heterogeneous flow was described as dispersionwith the CD model.
Field ApplicationIt is apparent from the results presented above that,
although flow was characterized by a wide range inpore-water velocity, bypassing was not significant interms of model selection except when the soil was ator very near saturation. Hence, "significant" bypass-ing is expected in the field only under those condi-tions.
The necessary precondition for saturation of the soilsurface under field conditions is that the water inputrate (rainfall intensity) exceed the soil insurability(Hillel, 1971). If no surface disturbance occurs (nonewas observed) the minimum infiltrability of a uniformsoil profile is ATsat. Since no differentiation of horizonsin terms of hydraulic properties was observed, therainfall intensity must at least exceed Ksal if saturationand, hence, significant bypassing are to occur.
The frequency distribution of #sat estimated from24 double-ring infiltration measurements was com-pared with rainfall intensity measurements made nearthe site over a 1-yr period (Fig. 11). It is evident thatrainfall of sufficient intensity to result in saturation israre.
The ATsa, estimates in Fig. 11 are considerably lowerthan those in Fig. 2 through 6. This may be attributedto both the improved saturation due to the method ofsaturating the columns and to the improved macro-pore continuity in shortened columns (Edwards et al.,1979).
It should be noted that the Institute soil does notcrack under normal field conditions and that, al-though numerous large pores were observed, obviousdiscrete channels were not evident upon visual in-spection. For this reason, models that attempt to de-scribe bypassing on the basis of macropore numberand distribution (e.g., Beven and Clarke, 1986) couldnot be applied.
Application of BTC measured in columns to fieldconditions involves a considerable extrapolation inscale. This requires that the representative elementaryvolume (Bear, 1972) for bypassing be less that the vol-ume of the column. Several studies have shown thatmeasured bypassing at a field scale was expressed in

SEYFRIED & RAO: SOLUTE TRANSPORT IN A TROPICAL SOIL 1443
undisturbed soil columns (Bouma and Wosten, 1979;Omoti and Wild, 1979; White, 1985). If significantbypassing at a scale larger than column dimension isto occur, there must be some means by which soilwater-movement is concentrated. It is possible, for ex-ample, that rainwater passing through the plant can-opy is concentrated enough that the intensity of waterinput is locally greater than the infiltrability and there-fore induces bypassing.
The daily water table measurements provided someevidence that such concentration of flow did not oc-cur. Rapid rise of the water table in response to rain-fall events have been cited as evidence of bypassing(Thomas and Phillips, 1979; Germann, 1986). Thetime resolution of the water table and rainfall mea-surements at the site was not sufficient to be certainthat bypassing did not occur, but all rises of the watertable observed could be explained in terms of Green-Ampt infiltration. In addition, all rainfall events thatcaused water table rises were large enough to exceedfield capacity.
ACKNOWLEDGMENTWe thank Dr. Carlos Burgos of CATIE, who provided
experimental plots, and his assistant, Carlos Arya, who didthe infiltration measurements. We also thank Dr. John Ewel,who kindly provided the rainfall intensity data, and RonJessup for his much appreciated advice.

1444 SOIL SCI. SOC. AM. J., VOL. 51, 1987