solubilization of organic dyes in surfactant micelles
TRANSCRIPT

3
Solubilization of Organic Dyes in Surfactant Micelles
Master of Science Thesis in the Master Degree Programme Materials and
Nanotechnology
RAJDEEP SINGH
Department of Chemical and Biological Engineering
Division of Applied Surface Chemistry
CHALMERS UNIVERSITY OF TECHNOLOGY
Gothenburg, Sweden, 2012

Solubilization of Organic Dyes in Surfactant Micelles
RAJDEEP SINGH
© RAJDEEP SINGH, 2012.
Department of Chemical and Biological Engineering
Division of Applied Surface Chemistry
Chalmers University of Technology
SE-412 96 Göteborg
Sweden
Telephone: +46 (0)31-772 1000
Göteborg, Sweden 2012
Cover: The effect of surfactant concentration on dye solubilization (left to right). The
solubilization starts at around critical micelle concentration of each surfactant and increases
almost linearly at higher concentrations.

Solubilization of Organic Dyes in Surfactant Micelles
RAJDEEP SINGH
Department of Chemical and Biological Engineering
Chalmers University of Technology
ABSTRACT
In this study, the solubilization of two organic dyes, Sudan I (1-Phenylazo-2-naphtol) and
Quinizarin (1,4-Dihydroxyanthraquinone), was studied in the presence of different types of
surfactants (2 polymerics, 2 nonionics, 2 anionic, and one cationic) using UV-Vis
spectroscopy. The effects of temperature, pH and addition of different electrolytes (NaCl,
Na2CO3, NaI, NaOH, NaSCN) on dye solubilization were investigated mainly for Berol 535
(C11EO5), DTAB (C12 quaternary ammonium bromide) and SDS (C12 sodium sulphate). The
effect of mixed micelles of different surfactants (DTAB:Berol 535 and SDS:Berol 535) on
dye solubilization at different concentrations of NaCl was also studied. No synergy effect was
observed for the solubilization of dyes in the binary mixture of surfactant micelles. The results
showed that the solubilization of both dyes in the surfactant micelles increased with the
temperature and addition of salt. However, the anionic surfactant (SDS) precipitated in the
solution at high salt concentration (>20 g/l) and room temperature due to its high Krafft point
and this had an adverse effect on dye solubilization. This was overcome by adding a nonionic
surfactant to the solution or increasing the temperature. The absorbance spectrum of both dyes
in surfactant micelles was similar to that obtained in ethanol and water/ethanol. This
suggested that both dyes are located in rather polar region of the micelles (palisade region)
and close to the surfactants head groups.
Keywords: Solubilization, organic dye, surfactants (cationic, anionic, nonionic, and
polymeric), micelle, mixed micelle
Table of Contents 1. Introduction ......................................................................................................................................... 1
1.1 Objective........................................................................................................................................ 1
2. Background .......................................................................................................................................... 2
2.1 Surfactants ..................................................................................................................................... 2
2.1.1 Micelle formation ................................................................................................................... 3
2.1.2 Krafft temperature ................................................................................................................. 5
2.1.3 Cloud point ............................................................................................................................. 6
2.1.4 Solubilization of surfactants ................................................................................................... 6
2.1.5 Mixed micelles ........................................................................................................................ 7
2.1.6 Physical-chemical properties .................................................................................................. 9
2.2 Dyes ............................................................................................................................................. 10
3. Experimental (Materials and methods) ............................................................................................. 11
3.1 Materials ...................................................................................................................................... 11
3.1.1 Sudan I (1-Phenylazo-2-naphtol) .......................................................................................... 11
3.1.2 Quinizarin (1,4-Dihydroxyanthraquinone) ........................................................................... 12
3.2 Experimental methods ................................................................................................................ 13
3.2.1 Absorption measurement .................................................................................................... 13
3.2.2 Solubilization measurements ............................................................................................... 14
3.2.3 Determine the excess amount of dye .................................................................................. 14
3.2.4 CMC measurements ............................................................................................................. 15
3.2.5 Krafft temperature ............................................................................................................... 15
3.2.6 Cloud point ........................................................................................................................... 15
3.2.7 Temperature effect .............................................................................................................. 15
3.2.8 The effect of pH on solubilization ........................................................................................ 15
4. Results and Discussion ...................................................................................................................... 17
4.1. Physical-chemical properties of surfactants .............................................................................. 17
4.2 Excess amount of dye .................................................................................................................. 19
4.3 Solubilization power .................................................................................................................... 20
4.4 Temperature effect ..................................................................................................................... 24
4.5 Kinetics ........................................................................................................................................ 26
4.6 Solubilization in mixed micelles .................................................................................................. 27
4.6.1 The binary mixture of Berol 535 and DTAB .......................................................................... 28
4.6.2 The binary mixture of Berol 535 and SDS ............................................................................. 29

4.6.3 Mixing Berol 535 with SDBS ................................................................................................. 31
4.7 Location of dye in micelle ............................................................................................................ 32
4.8 pH-effect ...................................................................................................................................... 34
4.9 Electrolyte effect ......................................................................................................................... 37
5. Conclusions ........................................................................................................................................ 40
6. Future studies .................................................................................................................................... 41
7. References ......................................................................................................................................... 42
Acknowledgements ............................................................................................................................... 45
1
1. Introduction Solubilization of water-insoluble materials in the surfactant aqueous solution is important in
many industrial applications such as detergency, emulsion polymerization, enhanced oil
recovery, drug delivery and textile dyeing [1-3]. The surfactant aggregates known as micelles
are responsible for the solubilization of the hydrophobic substances in water [4]. Therefore,
surfactants that start to aggregate into micelles at low concentrations, are good candidates for
this purpose.
Among different effective parameters, the effect of temperature and electrolyte concentration
on solubilization is very high. An increase in temperature and addition of electrolytes
increases the solubilization [1].
1.1 Objective The aim of this project was to study the effects of the surfactant chemical structure (anionic,
cationic or nonionic), surfactant concentration, surfactant mixture, temperature, pH and
addition of salt on the solubilization of the two organic dyes in aqueous solution.
The main objective of this work was to make a systematic study on solubilization of two
organic dyes (Quinizarin with anthraquinone structure and Sudan I with azo structure) in
surfactant micellar solution. For this reason, a series of surfactants with different types of
polar head groups were investigated. The solubilization of dyes in the mixed micelles of ionic
surfactants with a nonionic surfactant at different salt concentrations was determined.
A minor part of this study deals with the location of the dye molecule in a surfactant micelle
and kinetics of solubilization.

2
2. Background In this section some background is given regarding surfactants, solubilization, dyes and
instrumental techniques.
2.1 Surfactants Surface active agents, also known as surfactants, refer to molecules that are active at
surfaces. A surfactant is characterized by its tendency to adsorb at surfaces and interfaces. An
interface is a boundary between any two immiscible phases whereas a surface is an interface
where one phase is a gas [1,5].
There are five different interfaces:
Solid-vapour surface
Solid-liquid
Solid-solid
Liquid-vapour surface
Liquid-liquid
Since nature always favors lower free energy, one can guess why surfactants adsorb at
interfaces. The driving force for a surfactant to adsorb at an interface is of course to reduce
the free energy of that specific phase boundary [5].
Surfactants are amphiphilic molecules consisting of a non-polar, hydrophobic tail and a
polar, hydrophilic head group (Figure 2.1). The hydrophobic tail is usually a branched or
linear long-chain hydrocarbon residue with a chain length in the range of 8-18 carbon atoms.
The polar head group can be either ionic or non-ionic [1,4,5].
Figure 2.1 A typical illustration of a surfactant molecule [5]
Depending on the charge of the polar head group, surfactants are classified as anionic
(negatively charged), cationic (positively charged), zwitterionic (both positively and
negatively charged groups) or nonionic (non-charged) [1,4,5].

3
When a surfactant is dissolved in an aqueous environment, the hydrophobic tail interacts
weakly with the water molecules using van der Waals forces. On the other hand, the
hydrophilic head interacts strongly with the water molecules using dipole-dipole or ion-dipole
forces. Surfactants are water soluble because of this strong interaction with the water
molecules [4]. However, the much weaker van der Waals forces breaks the much stronger
hydrogen bonds between water molecules. The surfactants are therefore forced to the
interfaces of the system, where the hydrophobic tails get oriented in a way to keep minimum
contact with water [1,4].
2.1.1 Micelle formation
Surfactants have limits to how much they can lower the surface and interfacial tension. At a
certain surfactant concentration in a system when all interfaces and surfaces are occupied by
surfactant unimers (free surfactant), the surfactant unimers in the bulk start to aggregate into
micelles. This specific concentration is called the critical micelle concentration (CMC). They
start to aggregate since they do not want the hydrophobic tails to be in contact with water. So
instead micelles are formed with the hydrophobic tails pointing inwards and the hydrophilic
head groups pointing outwards towards the water, as can be seen in Figure 2.2. In that way the
free energy of the system is reduced. Surfactants behave differently depending on if they are
present in micelles or as surfactant unimers in the solution. Surfactant unimers are the only
surface active of the two, so they are the one responsible of decreasing the interfacial and
surface tension. Micelles are not surface active. They just act as reservoirs for the surface
active surfactant unimers [5].
Figure 2.2 A typical illustration of a spherical micelle [5]

4
Micelles are not necessarily spherical as they are usually portrayed. They can also be
cylindrical, just a bilayer, reversed etc. It is the critical packing parameter (CPP) that governs
the shape of the micelles. CPP is a dimensionless number defined as:
Eq. (1)
Where v is the volume of the hydrophobic tail, a is the area of the hydrophobic head and l
being the length of the hydrophobic tail. An illustration of CPP can be seen in Figure 2.3 [5].
Figure 2.3 The concept of CPP [5]
Spherical micelles will be formed as long as CPP is not higher than 1/3 [4,5]. Figure 2.4
illustrates how the aggregate structures depend on the CPP.
This explains why surfactants with
1) straight hydrophobic tails tend to form spherical micelles
2) branched hydrophobic tails tend to form cylindrical micelles which aggregates further
into hexagonal structures
3) double hydrophobic tails tend to form lamellar phases and reversed structures
Simply the volume of the hydrophobic tails gets larger which leads to a higher CPP [5].

5
Figure 2.4 The CPP of different structures [5]
2.1.2 Krafft temperature
The Krafft temperature, or Krafft point, is the temperature at which the solubility of a
surfactant starts to increase dramatically. At this temperature, the solubility of the surfactant
unimers becomes high enough to start to form micelles. Below this temperature, no micelles
will form, no matter how much surfactant unimers are added. The Krafft temperature depends
very much on the head group and counter ion of the surfactant. Adding salt usually increases
the Krafft temperature [5]. Figure 2.5 illustrates the phenomenon.

6
Figure 2.5 Krafft temperature [5]
2.1.3 Cloud point
Nonionic surfactants containing oxyethylene groups are very much affected by the
temperature. While heating a nonionic surfactant solution, it becomes turbid at a specific
temperature range. The solution becomes “cloudy”. The temperature range is called the cloud
point, or cloud temperature. Clouding is really a phase separation into two micellous
solutions; one with a high concentration of surfactants, and one with a low concentration of
surfactants. The cloud point depends very much on the polyoxyethylene chain length of the
surfactant, a longer chain corresponds to a higher cloud point [5].
2.1.4 Solubilization of surfactants
Solubilization is defined as the spontaneous dissolving of an insoluble substance in a solvent
to form a thermodynamically stable isotropic solution with the help of surfactants [1]. In other
words, a substance (e.g. hydrophobic compound) that is usually insoluble in a solvent (e.g.
water) becomes soluble with the help of surfactants. Below the CMC of the surfactant, the
solubility (amount of substance that is incorporated in the solution) is slightly higher than in
the pure insoluble solvent. However, just above the CMC, the solubility increases
dramatically. And by adding even more surfactant, the solubility increases in a linear fashion,
which can be seen in Figure 2.6. This is because micelles are formed which can accommodate
the insoluble substance [4].

7
Figure 2.6 Amount of material solubilized as a function of concentration of surfactant
solution [1]
2.1.5 Mixed micelles
Surfactant mixtures form micelles consisting of all surfactant species present. The CMC
value of the mixture depends on how the CMC values of the single surfactants differs. When
there is no net interaction between the surfactants the CMC value of the mixture can be
calculated with Eq. (2).
Eq. (2)
where x1 is the mole fraction of surfactant 1, x2 is the mole fraction of surfactant 2, CMC1 is
the CMC value of surfactant 1, CMC2 is the CMC value of surfactant 2. If there is a big
difference (CMC2/CMC1=0.01), where 2 represents a very hydrophobic surfactant, only a
small amount of the very hydrophobic surfactant is needed for the CMC value to be decreased
significantly (synergy). This is consistent with Eq. (2) and shown in Figure 2.7 [5].

8
Figure 2.7 CMC value of the mixture as a function of surfactant composition depending on
the difference in CMC of the single surfactants [5]
The simple explanation for this behavior is that the more surface active material,
hydrophobic surfactant, will as it literately says be more surface active and consequently to a
higher extent adsorb at the interfaces. In other words, the interfaces will be occupied by the
hydrophobic surfactant to a higher extent which lowers the CMC. To have single hydrophobic
surfactants in the water is not good regarding the free energy of the system. That is why
micelles start to form earlier than when less hydrophobic surfactants are in the system [5].
However, in many systems, surfactants of different kinds are mixed, for example mixtures of
anionic and nonionic surfactants; anionic and cationic surfactants. In the former, the nonionic
surfactants shield the repulsion between the anionic head groups in the micelle and so there is
a net charge between the different surfactants, whereas in the latter, the anionic and cationic
surfactants interact because of their opposite charges. In the mentioned examples, there is an
attraction between the surfactants and basically the higher the attraction, the lower the CMC
value of the system [4,5]. Mixing of surfactants in a formulation may also have some other
advantages, such as lowering the Krafft temperature and increasing the cloud point of the
system [6].
Detergents consist of a mixture of ionic and nonionic surfactants. Ionic surfactants are
usually too hydrophilic to give efficient soil removal, unlike nonionic surfactants that are
usually too hydrophobic. So by mixing the different surfactants an optimum in soil removal is
reached around equal amounts of the two surfactants. This is shown in Figure 2.8 [5].

9
Figure 2.8 Oily soil removal as a function of C12E4 content in a mixture with the hydrophilic
anionic surfactant sodium octylbenzene sulfonate [5]
2.1.6 Physical-chemical properties
Many physical-chemical properties change drastically at the CMC. Figure 2.9 illustrates how
some of the physical-chemical properties behave around the CMC for an ionic surfactant.
At low concentrations of surfactant, most properties are similar to that of an electrolyte with
one big exception, the surface tension. The surface tension decreases as surfactant
concentration increases until the CMC is reached. As illustrated in Figure 2.9, the osmotic
pressure and surface tension stay constant after the CMC. The turbidity (light scattering) and
solubilization are examples of two properties that increase after CMC [4,5].
Figure 2.9 The change in physical-chemical properties of the aqueous solution by increasing
the concentration of surfactant in the solution [5]

10
The physical-chemical properties of ionic surfactants can be very much affected by
electrolytes. Strong electrolytes virtually completely dissociate into ions. The charge of head
groups is neutralized by the adsorption of oppositely charged ions. Thus, the repulsion
between the head groups is reduced. This leads to a denser packing of the surfactants in the
interfaces.
There are several different methods to measure the CMC. The two most widely used are the
surface tension and conductometry measurements. Solubilization of a dye and fluorescence
spectroscopy can also be used in this regards. The conductivity can be measured only for
ionic surfactant in the absence of electrolytes [4,5].
2.2 Dyes
A dye is usually a colored organic compound that is used to color a substrate, e.g. fabric,
paper or plastic in a permanent way. Thus, it should be able to resist outer forces which can be
caused by washing, rubbing etc. The dye must have some specific groups that create bonds to
the substrate. The dye has an affinity to the substrate to which it is applied to and is applied in
an aqueous solution [7].
Pigments are usually mistaken for dyes. Both are colorants, however, the difference is that
pigments consist of small particles that are insoluble in the media they are applied, whereas
dyes are applied in the form of a solution where they are soluble [7,8]. So, pigments need
additional compounds to attach to the substrate [8]. More information can be found in the
books Synthetic Dyes [7] and Color Chemistry [8].

11
3. Experimental (Materials and methods)
3.1 Materials Acetone (>99.5%), chloroform (99%), cyclohexane (99%), dichloromethane (>99.5%),
diethyl ether (99%), hexane (99%), methanol (99%), toluene (99%), Sudan I (97%),
Quinizarin (>98%), citric acid (99%), sodium bicarbonate (99%), sodium carbonate (99%),
sodium chloride (99%), sodium hydroxide (97%), sodium iodide (99.5%), sodium phosphate
dibasic (99%), sodium thiocyanate (98%), 4-dodecylsulfonic acid (technical grade),
dodecyltrimethylammonium bromide (99%), nonylphenyl etoxylate 9, pluronic F127,
pluronic P123, propylene glycol monopropyl ether (99%) and sodium dodecyl sulphate (99%)
were all purchased from Sigma-Aldrich. Ethanol (99.5%) was provided by Kemetyl. The
chemical structure of the surfactants is shown in Table 1. DTAB, IGEPAL CO-630, SDBS
and SDS were also purchased from Sigma and nonionic surfactant, Berol 535, was obtained
from Akzo Nobel.
Table 1. Used surface active species
Abbreviation
Name Structure
Berol 535 Penta(ethylene glycol)
monoundecyl ether
DTAB Dodecyltrimethylammo
nium bromide
IGEPAL CO-
630
Nonylphenyl etoxylate 9
(NP-EO9)
SDBS 4-Dodecylsulfonic acid
SDS Sodium dodecyl
sulphate
Pluronic
F127
Pluronic F127
(EO100PO64EO100)
Pluronic
P123
Pluronic P123
(EO20PO70EO20)
3.1.1 Sudan I (1-Phenylazo-2-naphtol)
Sudan I is a synthetic organic red azo dye mainly used in the industry as a colorant (coloring
products such as textiles, waxes, polishes and oils) [9]. Azo dyes contains the functional

12
group R1-N=N-R2. The solubility of Sudan I in water (21 °C) at room temperature was around
0.16 mg/l. The chemical structure of Sudan I is shown I in Figure 3.1. Sudan I exists as a
mixture of two tautomers that are in equilibrium, the azo form and the hydrazone form
(Figure 3.2). The ratio of the tautomers depends on the properties of the solvent in which has
been used for the solubilization of the dye [10].
Figure 3.1 Chemical structure of Sudan I
Figure 3.2 The azo-hydrazone equilibrium of Sudan I [10]
3.1.2 Quinizarin (1,4-Dihydroxyanthraquinone)
Quinizarin is a red anthraquinone derivative used for dyeing of textiles [11,12]. The
solubility of Quinizarin in water (21 °C) at room temperature was around 0.2 mg/l. The
chemical structure of Quinizarin is shown in Figure 3.3. Quinizarin also exist as a mixture of
two tautomers that are in equilibrium, 1,4-Dihydroxy-9,10-antraquinone and 9,10-Dihydroxy-
1,4-antraquinone (Figure 3.4) [11].

13
Figure 3.3 Chemical structure of Quinizarin
Figure 3.4 The tautomer equilibrium of Quinizarin
3.2 Experimental methods
3.2.1 Absorption measurement
The absorption spectra of the solutions were recorded using a double beam UV-Vis
spectrophotometer (GBC 920, Australia) with a matched pair of quartz cuvettes (1 cm in
optical path length).
In a UV-Vis Spectrophotometer, light from the near ultraviolet (UV) and visible (vis) range
of the spectrum (200-800 nm) interacts with the molecules. The light excites electrons from a
ground state to an excited state. The light loses intensity as it goes through the sample and the
absorbance of the sample is defined as
(
) Eq. (3)
where I0 is the intensity before passing through the sample and I is the intensity after passing
through the sample.

14
The absorbance is important because it is directly proportional to the concentration, c, of the
light absorbing compound in the sample according to Lambert-Beer’s law (Eq. (4))
Eq. (4)
where ε is the molar absorptivity (or extinction coefficient), c is the concentration and l is the
optical path-length [13].
3.2.2 Solubilization measurements
High concentrated dye solution in acetone was transferred to the glass vials and acetone was
evaporated. Aqueous solutions of a specific surfactant covering a range of concentrations
below and above its critical micelle concentration (CMC) were prepared using Milli-Q water
and added to the vials containing the excess amount of dye. The samples were then shaken for
at least 16 hours at room temperature (21 °C) on a RS 10 basic shaker (210 rpm from Skafte
Medlab). The non-solubilized dye was filtered off using Millipore Millex Syringe Filters with
a PVDF Membrane (pore size of 0.22 µm). The first 2 ml of filtrate was discarded in order to
avoid the dilution effect as a result of adsorption on the membrane. The filtrate was finally
diluted with an equal volume of ethanol and an appropriate volume of 50% aqueous ethanol
solution. The concentrations of solubilized dye were determined from the absorbance of the
solutions at the wavelength of maximum absorption, λmax, with the help of each dye
calibration curve in 50% aqueous ethanol solution.
The solubilization power, Se, of a surfactant is defined as the number of moles of solubilized
dye per mole of micellar surfactant (Eq. (5)).
Eq. (5)
where Sw is the molar solubility of the dye in the aqueous system, SCMC is the molar solubility
of the dye at CMC, Csurf is the molar concentration of the surfactant [1,14]. The solubilization
power of a specific surfactant can thus be determined by calculating the slope of its solubility
curve after CMC.
3.2.3 Determine the excess amount of dye
To determine the amount of dye that would be considered as excess in the solubilization
measurements, different amounts of dye was added to different series of aqueous DTAB
solutions covering a broad range of concentrations below and above its CMC. An excess
amount of dye was considered as dye concentration above which there would not be any
changes in the slope of straight line in solubilization curve after CMC.
15
3.2.4 CMC measurements
The CMC measurements were conducted using the Du Noüy ring method on a Sigma 70
tensiometer. Known concentrations of specific surfactant solutions were added until the
surface tension of the liquid did not decrease anymore (the surfactant unimers start to
aggregate into micelles). Most of the measurements were carried out at room temperature.
The platinum ring was washed with ethanol and cleaned before each new series of
measurements by flaming (Bunsen burner) in order to get rid of any residual deposits [15].
The vials were washed several times with ethanol and water before each new series of
measurements.
3.2.5 Krafft temperature
An aqueous surfactant solution (1 wt%) was heated to form a clear solution. The solution
was placed in a refrigerator for 24 h. The temperature of the precipitated systems was slowly
increased under constant stirring. The conductance was monitored by a CDM 210
conductometer (Radiometer, France) equipped with a thermocouple that was immersed in the
solution. The Krafft temperature was taken as the temperature at which the conductance vs.
temperature plot showed an abrupt change in slope. The Krafft temperature of surfactant
solutions with high amount of NaCl salt (10, 20 g/l) was determined by the naked eye as
conductance vs. temperature plot did not show an abrupt change in slope.
3.2.6 Cloud point
The cloud point is the temperature at which a nonionic surfactant solution turns turbid due to
the separation into one more concentrated micellar phase and one more dilute surfactant
solution [5]. An aqueous solution of the nonionic surfactants (1 wt.%) was first heated in an
oil bath under stirring until the solution turned completely cloudy. The system then slowly
cooled down under stirring and the temperature was monitored. When the cloud point
temperature is reached, the turbid solution dramatically turns clear which was observed by the
naked eye.
3.2.7 Temperature effect
An excess amount of dye was put in a flask with 100 ml of the surfactant solution (1wt.%).
The flask was put in an oil bath under stirring at 25 °C for 16 h. The sample (around 3 ml)
was extracted and the solubilization was measured. The temperature of the system was then
increased. This procedure was repeated at different temperature (35, 45, 55, 65 and 75 °C).
3.2.8 The effect of pH on solubilization
To investigate the pH effect on the solubilization of the two dyes, six different buffer
solutions were prepared and used for making the surfactant solutions. The pH was in the
range of 3.07-11.77. The composition of these buffers has been summarized in Table 2.

16
Table 2. Preparation of the different buffer solutions
Buffer solution pH
Citric acid (0.0077M) - Na2HPO4 (0.004M) 3.07
Citric acid (0.0047M) - Na2HPO4 (0.01M) 5.27
Citric acid (0.0017M) - Na2HPO4 (0.016M) 7.14
NaHCO3 (0.01M) 8.23
Na2CO3 (0.01M) 10.85
NaOH (0.01M) 11.77

17
4. Results and Discussion In this section the different results from the experimental work are presented and discussed.
4.1. Physical-chemical properties of surfactants The CMC value of all surfactants used is reported in Table 3. The Krafft temperature and cloud
point are also reported for ionic and nonionic surfactants, respectively. Some of the values are from
the literatures.
Table 3. Physical-chemical properties of surfactants
Surfactant Molecular
weight
CMC (mM)
at 22°C
Krafft temp.*
Cloud
point*
g/mol °C °C
Berol 535 392.57 0.28,
0.25 [29]
- 28
27 [16]
DTAB 308.34 13,
14 [20]
20 [24]
-
IGEPAL CO-630 617 0.1,
0.08 [18]
- 53,
52-56 [17]
SDBS 348.48 3,
3 [19]
12,
27.6 [25,26]
-
SDS 288.38 6.4,
8-9 [21]
12,
14-15 [22,23]
-
Pluronic F127 12600 4-11 [28] - -
Pluronic P123 5750 0.07 [27] - -
* The range of uncertainty was 0.5°C
As can be seen from Table 3, the CMC values of nonionic surfactants (Berol 535 and
IGEPAL CO-630) were much lower than CMC values of ionic surfactants (DTAB, SDS,
SDBS). The CMC of Berol 535 at room temperature was in good agreement with the value
given by the manufacturer (0.1 g/l). The CMC of IGEPAL CO-630 was slightly higher than
the reported value in literature (0.05-0.08 mM) [18]. We should not put so much emphasis on
the obtained values for DTAB and SDS, since we had a minimum in the surface tension
curve. This minimum is caused by some surface active impurities in the surfactant, e.g.
dodecanol in the case of SDS. When the CMC is reached, surfactant micelles start to
solubilize the surface active impurities and they leave the interfaces. Therefore, the surface
tension increases a bit until all impurities have left the interfaces [5]. However, the obtained
values for SDS and DTAB are quite close to the reported values (8-9 mM and 14 mM,
respectively) [20,21].

18
The Krafft temperature of both anionic surfactants (SDS and SDBS) was around 12 °C. The
effect of salt concentration on Krafft temperature of SDS, SDBS and a mixture of SDS and
Berol 535 was shown in Table 4.
Table 4. The effect of salt concentration on the Krafft temperature of anionic surfactants
Solution Added NaCl
[g/l]
Krafft temp.
[°C]
SDS(10g/l) 0 11.5-12.5
10 19.5-20.5
20 22.5-23.5
50 30
SDS(10g/l)80:20Berol
535 (10g/l)
0 <0
10 14.5-15.5
20 18-19
50 23-24
SDBS(10g/l) 0 11-12
10 21-22
20 36-37
50 -
The obtained Krafft temperature for SDS was somewhat lower than the reported value in the
literature (14-15 °C) [22,23]. The Krafft temperature increased when salt was present in the
solutions as mentioned in the literature [5]. As can be seen in Table 4, the Krafft temperature
of SDBS was more sensitive to salt content than that of SDS which can be due to the presence
of one aromatic ring in its chemical structure. However, the Krafft temperature measurement
was not performed for SDBS at 50g/l of NaCl.
The CMC values of Berol 535 were also determined at higher temperatures. The CMC
values were decreased by increasing the temperature as nonionic surfactant becomes more
hydrophobic due to a conformational change in the ethylene oxide groups from a large to a
low dipole moment [5]. However, since the cloud point of this surfactant was around 28 °C,
the obtained results could not be trusted and considered as the true values and we preferred
not to report them here.
The effect of salt concentration on cloud point of Berol 535 and IGEPAL CO-630 was
shown in Figure 4.1.

19
Figure 4.1 The effect of salt concentration on the cloud point of two nonionic surfactants
The obtained cloud points of Berol 535 (28 °C) and IGEPAL CO-630 (53°C), were in good
agreement with the reported value in the literature [16,17]. As shown in Figure 4.1, the cloud
point of Berol 535 was much lower than the cloud point of IGEPAL CO-630. This was
consistent with the polyoxyethylene chain length in Berol 535 (~5) and in IGEPAL CO-630
(~9). As mentioned in the background, a longer polyoxyethylene chain means a higher cloud
point. The addition of salt to the solutions depressed the cloud point in a linear fashion which
was also illustrated in Figure 4.1. IGEPAL CO-630 was more sensitive to salt (almost twice
as sensitive as Berol 535). This might also have to do with the polyoxyethylene chain length.
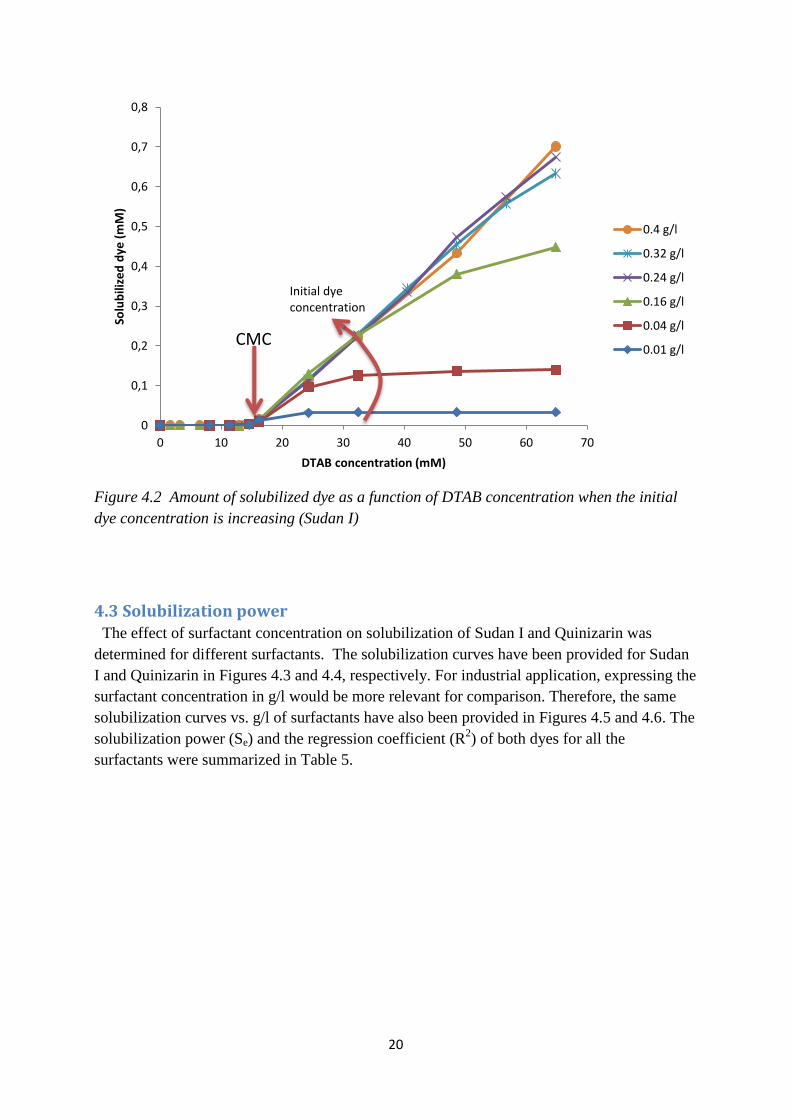
4.2 Excess amount of dye The effect of dye initial concentration on solubilization of Sudan I in the presence of DTAB
was shown in Figure 4.2. The onset of solubilization of dye was at CMC of the surfactant and
this clearly showed that surfactant micelles were responsible for dye solubilization. When the
initial dye concentration was as low as 0.01 g/l, the solubilized amount of dye in surfactant
micelles reached to a plateau at surfactant concentration above the CMC. By increasing the
dye initial concentration the solubilization curve became more linear after CMC. Therefore,
the dye initial concentration greater than 0.4 g/l of Sudan I can be considered as excess
amount of dye. This value for Quinizarin was also determined and it was 0.02 g/l. Obviously,
Sudan I had higher solubilization in surfactant micelles than that of Quinizarin which can be
explained by their different chemical structures.
53 50
47
39 28 25 24
20
y = -0,2771x + 52,751 R² = 0,996
y = -0,1529x + 27,149 R² = 0,9847
0
10
20
30
40
50
60
0 10 20 30 40 50 60
Clo
ud
po
int
(°C
)
NaCl (g/l)
IGEPAL CO-630 (10g/l)
Berol 535 (10g/l)
20
Figure 4.2 Amount of solubilized dye as a function of DTAB concentration when the initial
dye concentration is increasing (Sudan I)
4.3 Solubilization power The effect of surfactant concentration on solubilization of Sudan I and Quinizarin was
determined for different surfactants. The solubilization curves have been provided for Sudan
I and Quinizarin in Figures 4.3 and 4.4, respectively. For industrial application, expressing the
surfactant concentration in g/l would be more relevant for comparison. Therefore, the same
solubilization curves vs. g/l of surfactants have also been provided in Figures 4.5 and 4.6. The
solubilization power (Se) and the regression coefficient (R2) of both dyes for all the
surfactants were summarized in Table 5.
0
0,1
0,2
0,3
0,4
0,5
0,6
0,7
0,8
0 10 20 30 40 50 60 70
Solu
bili
zed
dye
(m
M)
DTAB concentration (mM)
0.4 g/l
0.32 g/l
0.24 g/l
0.16 g/l
0.04 g/l
0.01 g/l
Initial dye concentration
CMC

21
Figure 4.3 Solubility of Sudan I as a function of surfactant concentration.
Figure 4.4 Solubility of Quinizarin as a function of surfactant concentration.
0
0,1
0,2
0,3
0,4
0,5
0,6
0 10 20 30 40 50 60
Solu
bili
zed
dye
(m
M)
Surfactant concentration (mM)
P123
IGEPAL CO-630
Berol 535
SDS
DTAB
SDBS
F127
0
0,01
0,02
0,03
0,04
0,05
0,06
0,07
0 10 20 30 40 50 60 70
Solu
bili
zed
dye
(m
M)
Surfactant concentration (mM)
P123
Berol 535
IGEPAL Q CO-630
SDS
DTAB
SDBS
F127

22
Table 5. Solubilization power of the dyes in the surfactant micelles
Surfactant Solubilization power
Sudan I
Solubilization power
Quinizarin
Se R2 Se R
2
Berol 535 0.0138 0.9987 0.0019 0.9926
DTAB 0.0135 0.9996 0.0009 0.9997
IGEPAL CO-630 0.0148 0.9998 0.0014 1
SDBS 0.0031 0.9998 0.0005 0.9995
SDS 0.0118 0.9977 0.0014 0.9993
Pluronic F127 0.0028 0.9912 0.0002 0.8082
Pluronic P123 0.1363 0.9963 0.0103 0.9917
The results showed that the solubility of the dyes increased with the surfactant concentration
regardless of the surfactant type. The onset of solubilization of the dyes was around the CMC
of each surfactant, as previously mentioned in the background. This was due to micelle
formation and the accommodation of dye molecules within these micelles [4].
Table 5 showed that the solubilization power depended on both surfactant and dye chemical
structures. The solubilization power of the different surfactants for Sudan I was at least 6
times higher than those values for Quinizarin. In other words, Sudan I can be accommodated
in the surfactant micelles better. In a previous study, it was shown that the amount of
solubilized dye decreased with the size of the dye molecule [14]. In this study, however, the
dye with almost the same molecular weight showed completely different results. In this
respects, the dye structure with higher flexibility for accommodating in the surfactant micelles
would be solubilized more. Sudan I with an azo structure can rotate around the azo bond and
has more conformational freedom than Quinizarin with its anthraquinone structure [30].
For Sudan I, the solubilization power increased in the order: Pluronic F127 < SDBS < SDS <
DTAB < Berol 535 < IGEPAL CO-630 < Pluronic P123, whereas for Quinizarin it increased
in the order of: Pluronic F127 < SDBS < DTAB < SDS = IGEPAL CO-630 < Berol 535 <
Pluronic P123. The higher solubilization power of the nonionic surfactants (Berol 535 and
IGEPAL CO-630) was not only a consequence of the interaction between the dyes and
micelles, but also the fraction of surfactant in micellar form. At a specific concentration, the
nonionic surfactants have a higher molar fraction in micellar form compared to ionic
surfactants, due to their much lower CMC [31].

23
Figure 4.5 Amount of solubilized dye as a function of surfactant concentration (g/l) (Sudan I)
Figure 4.6 Amount of solubilized dye as a function of surfactant concentration (g/l)
(Quinizarin)
Both polymeric surfactants (Pluronic P123 and F127) have very high molecular weights and
therefore, there would be a big difference if solubilization power would be expressed as the
solubilized dye per g/l of surfactant (Compare Figure 4.3 with 4.5 and Figure 4.4 with 4.6).
In this respect, normal ionic or nonionic surfactants would have a better solubilization power.
0
0,1
0,2
0,3
0,4
0,5
0,6
0 5 10 15 20
Solu
bili
zed
dye
(m
M)
Surfactant concentration (g/l)
Berol 535
SDS
IGEPAL CO-630
P123
DTAB
SDBS
F127
0
0,01
0,02
0,03
0,04
0,05
0,06
0,07
0 5 10 15 20 25
Solu
bili
zed
dye
(m
M)
Surfactant concentration (g/l)
Berol 535
SDS
IGEPAL CO-630
P123
DTAB
SDBS
F127

24
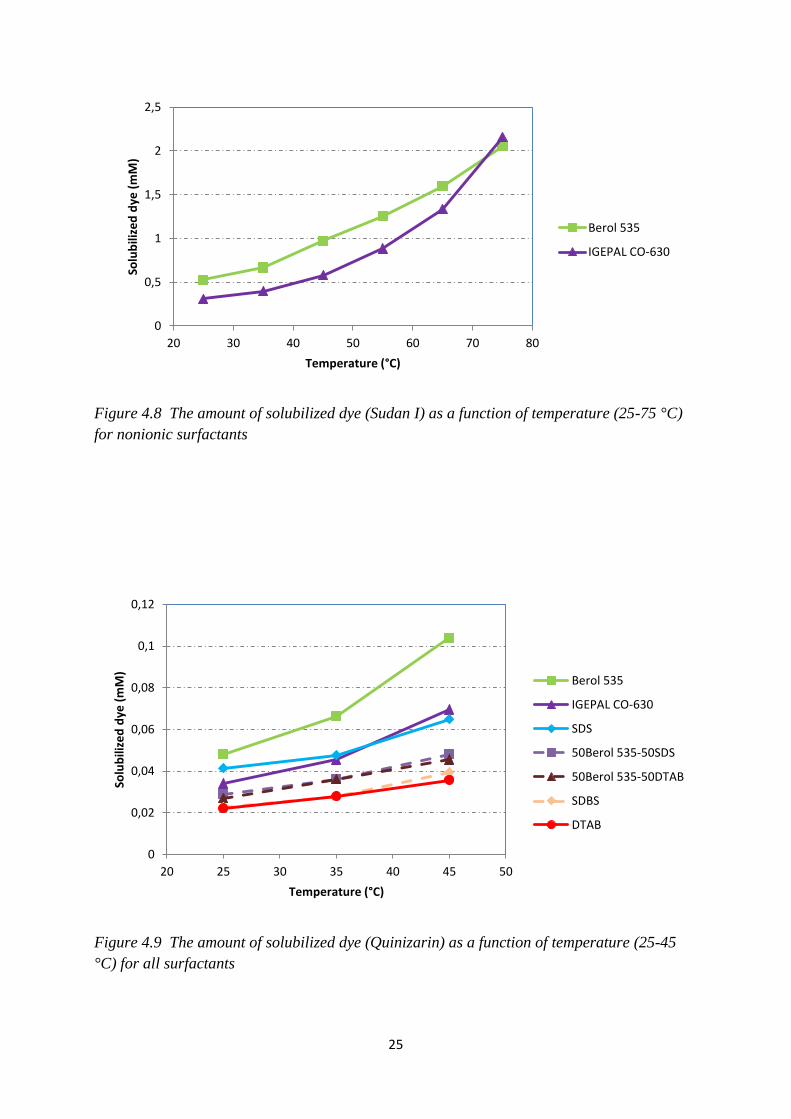
4.4 Temperature effect The effect of temperature on dye solubilization can be seen in Figures 4.7-4.10. The amount
of solubilized dye as a function of temperature showed a constant increase and nonionic
surfactants (Berol 535 and IGEPAL CO-630) were affected more than other ionic surfactants.
For ionic surfactants, the amount of solubilized dye was raised with the temperature basically
because of an increased thermal agitation which increases the available space for
solubilization in the micelle [1]. The ethylene oxide (EO) units of nonionic surfactants were
dehydrated with the temperature. The area of the hydrophilic head groups is consequently
decreased leading to a higher CPP. The nonionic micelles are probably getting bigger and can
accommodate more dye [32]. However, the amount of solubilized dye for IGEPAL CO-630
was higher than Berol 535 at 75 °C as can be seen in Figure 4.8 and Figure 4.10. This showed
that Berol 535 had almost reached its precipitation point and its solubility would then
decrease to a great extent. Therefore, there would be a deviation in solubilization rate at high
temperatures for nonionic surfactants with shorter polyoxyethylene chain length.
The effect of temperature on solubilization of mixture of surfactants (DTAB 50:50 Berol 535
and SDS 50:50 Berol 535) also showed the same trend.
Figure 4.7 The amount of solubilized dye (Sudan I) as a function of temperature (25-45 °C)
for all surfactants
0
0,1
0,2
0,3
0,4
0,5
0,6
0,7
0,8
0,9
1
20 25 30 35 40 45 50
Solu
bili
zed
dye
(m
M)
Temperature (°C)
Berol 535
IGEPAL CO-630
SDS
DTAB
50Berol 535-50SDS
50Berol 535-50DTAB
SDBS
25
Figure 4.8 The amount of solubilized dye (Sudan I) as a function of temperature (25-75 °C)
for nonionic surfactants
Figure 4.9 The amount of solubilized dye (Quinizarin) as a function of temperature (25-45
°C) for all surfactants
0
0,5
1
1,5
2
2,5
20 30 40 50 60 70 80
Solu
bili
zed
dye
(m
M)
Temperature (°C)
Berol 535
IGEPAL CO-630
0
0,02
0,04
0,06
0,08
0,1
0,12
20 25 30 35 40 45 50
Solu
bili
zed
dye
(m
M)
Temperature (°C)
Berol 535
IGEPAL CO-630
SDS
50Berol 535-50SDS
50Berol 535-50DTAB
SDBS
DTAB

26
Figure 4.10 The amount of solubilized dye (Quinizarin) as a function of temperature (25-75
°C) for nonionic surfactants
4.5 Kinetics The kinetic of solubilization at room temperature has been shown for Sudan I and Quinizarin
in Figure 4.11 and Figure 4.12, respectively. The rate of solubilization of both dyes in the
presence of DTAB, SDS and Berol 535 was very fast and the solubilization reached to its
maximum value at around 8 h for DTAB and Berol 535. However, the time 23h was
considered as an equilibrium point for all three surfactants.
The amount of solubilized dye in Figure 4.11 is in agreement with Figure 4.5 for the
different surfactant solutions. In case of solubilization of Quinizarin (Figure 4.12), the
solubilized amount of dye in Berol 535 micellar solution was slightly less than the results of
the previous experiments (see, Figure 4.6).
0
0,02
0,04
0,06
0,08
0,1
0,12
0,14
0,16
0,18
20 30 40 50 60 70 80
Solu
bili
zed
dye
(m
M)
Temperature (°C)
Berol 535
IGEPAL CO-630

27
Figure 4.11 The amount of solubilized dye as a function of time (Sudan I)
Figure 4.12 The amount of solubilized dye as a function of time (Quinizarin)
4.6 Solubilization in mixed micelles The solubilization of the mixture of surfactants in the presence and absence of salt (NaCl)
and a hydrotrope (PGPE) has been investigated in this section.
0
0,05
0,1
0,15
0,2
0,25
0,3
0,35
0,4
0 20 40 60 80 100
Solu
bili
zed
dye
(m
M)
Time (h)
Berol 535 (10g/l)
SDS (10g/l)
DTAB (10g/l)
0
0,005
0,01
0,015
0,02
0,025
0,03
0,035
0,04
0 20 40 60 80 100
Solu
bili
zed
dye
(m
M)
Time (h)
SDS (10g/l)
Berol 535 (10g/l)
DTAB (10g/l)

28
4.6.1 The binary mixture of Berol 535 and DTAB
The solubilization of Sudan I and Quinizarin in the binary mixture of Berol 535 and DTAB
were illustrated in Figure 4.13 and Figure 4.14, respectively. The effect of addition of NaCl at
different concentrations was also presented in these figures.
There is usually a synergy effect for the CMC of surfactant mixtures (mixture of nonionic
and ionic surfactant) [5]. However, no synergy effect in solubilization for any of the mixtures
was observed. As shown in Figure 4.13, the addition of PGPE (10 g/l) to the mixture had
almost no effect at all for Sudan I, even though PGPE is a hydrotrope (substance that improve
the solubility, without having any significant surface activity) [4]. Adding salt on the other
hand, made a big impact on the amount of solubilized dye. As mentioned in the background,
by adding salt, the electrostatic repulsion between the ionic head groups decreases (acts as
counter ions). This means that the CPP increases and we can get elongated and bigger
micelles that can accommodate more dye. The CMC also drops, which means that more
micelles will be presented in the solution. More micelles usually improve the solubilization
[5]. It was a relatively big difference in amount of solubilized dye for the DTAB solution and
DTAB + NaCl (10 g/l) solution. However, by adding even more salt, the effect was not as
dramatic. By adding more salt, the ionic surfactant might start to precipitate in the system.
Further, salt was more effective, the higher the composition of DTAB was in the solution.
This was expected, since addition of salt to a nonionic surfactant, e.g. Berol 535, had only a
negligible effect on amount of solubilized dye while the solubilization in the presence of an
ionic surfactant like DTAB was more sensitive to addition of salt.
Figure 4.13 The amount of solubilized dye (Sudan I) as a function of surfactant composition
0
0,05
0,1
0,15
0,2
0,25
0,3
0,35
0,4
0,45
0 0,2 0,4 0,6 0,8 1
Solu
bili
zed
dye
[m
M]
Surfactant composition in solution, xBerol 535
DTAB+NaCl(50g/l)
DTAB+NaCl(20g/l)
DTAB+NaCl(10g/l)
DTAB
DTAB+PGPE(10g/l)

29
Figure 4.14 The amount of solubilized dye (Quinizarin) as a function of surfactant
composition
4.6.2 The binary mixture of Berol 535 and SDS
The solubilization of Sudan I and Quinizarin in the binary mixture of Berol 535 and SDS
were illustrated in Figure 4.15 and Figure 4.16, respectively. The effect of addition of NaCl at
different concentrations was also presented in these figures. The same trend as solubilization
of these dyes in the presence of DTAB was observed. There was not any synergy effect and
the solubilization increased by addition of salt. However, SDS was more sensitive to addition
of salt and its Krafft temperature was also increased to above the room temperature (see Table
4). Thus, the low amount of solubilized dye for SDS at 20 and 50 g/l salt was due to the high
Krafft temperature of the SDS solutions. By adding salt to SDS solution, SDS started to
precipitate and the amount of solubilized dye decreased to a high extent. For the Krafft
temperature of the SDS with 20 g/l salt solution was around room temperature and since
precipitation is a slow process, especially at room temp, the amount of solubilized dye
dropped over time. The results also show that in a binary mixture of SDS and Berol 535, even
addition of low amount of a nonionic surfactant increased the solubility of anionic surfactant
even in the presence of high salt content (50g/l) and no precipitation can be observed in the
system. Although, there was not any synergy effect on binary mixture of surfactants,
surfactants cooperatively solubilized the dye molecules in mixed micelles and the Krafft
temperature of the system was lowered and solubility of both surfactants in the system was
increased.
0
0,005
0,01
0,015
0,02
0,025
0,03
0,035
0,04
0,045
0 0,2 0,4 0,6 0,8 1
Solu
bili
zed
dye
[m
M]
Surfactant composition in solution, xBerol 535
DTAB+NaCl(50g/l)
DTAB+NaCl(20g/l)
DTAB+NaCl(10g/l)
DTAB

30
Figure 4.15 The amount of solubilized dye (Sudan I) as a function of surfactant composition
Figure 4.16 The amount of solubilized dye (Quinizarin) as a function of surfactant
composition
0
0,05
0,1
0,15
0,2
0,25
0,3
0,35
0,4
0,45
0,5
0 0,2 0,4 0,6 0,8 1
Solu
bili
zed
dye
[m
M]
Surfactant composition in solution, xBerol 535
SDS+NaCl(10g/l)
SDS+NaCl(20g/l)
SDS
SDS+NaCl(50g/l)
48h
72h
24h
0
0,005
0,01
0,015
0,02
0,025
0,03
0,035
0,04
0,045
0,05
0 0,2 0,4 0,6 0,8 1
Solu
bili
zed
dye
[m
M]
Surfactant composition in solution, xBerol 535
SDS+NaCl(50g/l)
SDS+NaCl(20g/l)
SDS+NaCl(10g/l)
SDS

31
4.6.3 Mixing Berol 535 with SDBS
A synergy effect for the solubilization has been reported when the anionic surfactant had a
benzene ring between the ionic head group and hydrophobic tail (e.g. SDBS) and when a
nonionic surfactant with a long ethylene oxide chain was used (at least 15 EO) [33,34]. Thus,
SDBS was mixed with Berol 535 to see if there is any synergy effect in solubilization of
Sudan I and Quinizarin. The results were illustrated in Figure 4.17 and Figure 4.18. As
shown in Figure 4.17 and Figure 4.18, there was again no synergy effect for the solubilization
when SDBS was used. Hence, no further experiments with SDBS were conducted and we
concluded that the synergistic effect in solubilization of materials was also dependent to the
structure of solubilisate (dyes).
Figure 4.17 The amount of solubilized dye (Sudan I) as a function of surfactant composition
0
0,05
0,1
0,15
0,2
0,25
0,3
0,35
0 0,2 0,4 0,6 0,8 1
Solu
bili
zed
dye
[m
M]
Surfactant composition in solution, xBerol 535
SDBS (10g/l)

32
Figure 4.18 The amount of solubilized dye (Quinizarin) as a function of surfactant
composition
4.7 Location of dye in micelle For understanding the location dye in the surfactant micelles, the UV-Vis absorption spectra
of dyes in surfactants micelles and in solvents with different polarity were recorded and
compared. The dyes have a similar surrounding as the hydrophobic inner core of the micelles
when the dyes are dissolved in non-polar solvents (solvents with a low polarity index). If they
are instead dissolved in more polar solvents (solvents with a higher polarity index), that
simulates the surrounding of the semi-polar outer part of the micelles [14]. So by comparing
the shapes of the spectra for Sudan I and Quinizarin in the different solvents with the
surfactant solutions, the location is determined. The polarity indexes for the solvents are listed
in Table 6. The spectra for Sudan I and Quinizarin in solvents and surfactant solutions were
shown in Figure 4.19 and Figure 4.20.
0
0,005
0,01
0,015
0,02
0,025
0,03
0,035
0,04
0 0,2 0,4 0,6 0,8 1
Solu
bili
zed
dye
[m
M]
Surfactant composition in solution, xBerol 535
SDBS (10g/l)

33
Figure 4.19 Absorption spectra for Sudan I in different solvents and surfactant solutions
Figure 4.20 Absorption spectra for Quinizarin in different solvents and surfactant solutions
The spectrum of both dyes in DTAB and SDS was very similar to that of 50% aqueous
ethanol, indicating that dyes are located in a relatively polar media. Thus, they should have
been located in the outer part, near the hydrophilic head groups of the micelles. The dye
spectrum in the presence of Berol 535 looked quite different from other surfactant solutions as
Berol solution was turbid at room temperature and could not be used for comparison.
The wavelength of maximum absorption, λmax, for Sudan I and Quinizarin in the different
solvents and aqueous surfactant solutions together with their polarity indexes were listed in
Table 6.
0
0,1
0,2
0,3
0,4
0,5
0,6
0,7
350 450 550 650
Ab
sorb
ance
Wavelength (nm)
W50:50Et
Chloroform
SDS
Berol 535
Ethanol
DTAB
Hexane
0
0,05
0,1
0,15
0,2
0,25
0,3
0,35
0,4
350 450 550 650
Ab
sorb
ance
Wavelenght (nm)
Berol 535
Hexane
Chloroform
Ethanol
50W:50Et
SDS
DTAB

34
Table 6. The wavelength of maximum absorption (λmax) for Sudan I and Quinizarin in different
solvents and aqueous surfactant solutions
λmax for Sudan I
(nm)
λmax for Quinizarin
(nm)
Polarity index
[35]
Hexane 460-462 483-484 0
Cyclohexane 484 0.2
Toluene 476 483 2.4
Diethyl ether 466-468 479 2.8
Dichloromethane 477-478 481 3.1
Chloroform 480-483 483-484 4.1
Acetone 470-472 475 5.1
Methanol 477 5.1
Ethanol 476-478 479-481 5.2
Ethanol50:50Water 484-486 478-480
Berol 535 475-478 470
DTAB 484-486 483
SDS 486-488 483
4.8 pH-effect The effect of pH on solubilization of dyes was shown in Figure 4.21 and Figure 4.22. There
was not a noticeable change in the absorption of dye-surfactant solution at different pH,
except for DTAB. The absorbance of the dye solutions in the presence of the cationic
surfactant (DTAB) was increased to a great extent at pH greater than 8.
Figure 4.21 The amount of solubilized dye (Sudan I) as a function of pH
0
0,2
0,4
0,6
0,8
1
1,2
1,4
1,6
1,8
0 2 4 6 8 10 12 14
Solu
bili
zed
dye
(m
M)
pH
DTAB (10g/l)
Berol 535 (10g/l)
SDS(10g/l)
Blank

35
Figure 4.22 The absorbance as a function of pH (Quinizarin)
This change in absorbance of the solution was at the same λmax for Sudan I (Figure 4.23),
while the change in both absorbance and λmax was observed for Quinizarin (Figure 4.24).
Therefore, the calibration curve in 50 wt.% ethanol:water could not be used for determining
the amount of solubilized Quinizarin at pH>8. It should be noted that the λmax of Quinizarin
solutions had a bathochromic shift (from 480 to 550 nm) in alkaline condition.
Figure 4.23 Absorption spectra of Sudan I when DTAB was used as surfactants
0
0,1
0,2
0,3
0,4
0,5
0,6
0,7
0,8
0,9
0 2 4 6 8 10 12 14
Ab
sorb
ance
pH
DTAB
Berol 535
SDS
Blank
0
0,5
1
1,5
2
2,5
300 400 500 600 700
Ab
sorb
ance
Wavelength (nm)
pH 10,85 dil8
pH 11,77 dil20
pH 8,23 dil8
pH 7,14 dil8
pH 5,27 dil8
pH 3,07 dil8

36
Figure 4.24 The bathochromic shift of Quinizarin when DTAB was used as surfactant
Photos from dye samples in glass vials showing the effect of pH on color change of
Quinizarin (in the absence and presence of DTAB) were presented in Figure 4.25 and Figure
4.26. As can be seen here, there is a bathochromic shift for the Quinizarin solution even in the
absence of any surfactant. The absorbance of light at wavelengths around 550-600 nm leads
to the appearance of violet and blue to the eye, which can be seen in these figures.
The reason why such a bathochromic shift can be observed in Quinizarin solutions at pH>8
can be explained by dominating a new form of tautomers in the system. In alkaline condition,
hydroxyl ions can polarize the –OH groups in Quinizarin and therefore a new form of
tautomers is made which is more stable and soluble in water [36]. Quinizarin can be used as
an optical pH sensor in alkaline conditions as it has been reported in another paper [12].
The fact that the change in absorbance of the Sudan I alkaline solution was at the same λmax
and it did not show any red or blue shift was another evidence that dye molecule is located
inside micelles just below the surface and close to the surfactant head groups as it can sense
the presence of alkaline condition. This needs further investigation.
0
0,1
0,2
0,3
0,4
0,5
0,6
0,7
0,8
0,9
300 350 400 450 500 550 600 650 700
Ab
sorb
ance
Wavelenght (nm)
pH 11,77
pH 10,85
pH 8,23
pH 7,14
pH 5,27
pH 3,07

37
Figure 4.25 The effect of pH on color change of Quinizarin solution in the presence of
DTAB. pH has been increased from left to right.
Figure 4.26 The effect of pH on color change of Quinizarin solution in the absence of any
surfactant. pH has been increased from left to right.
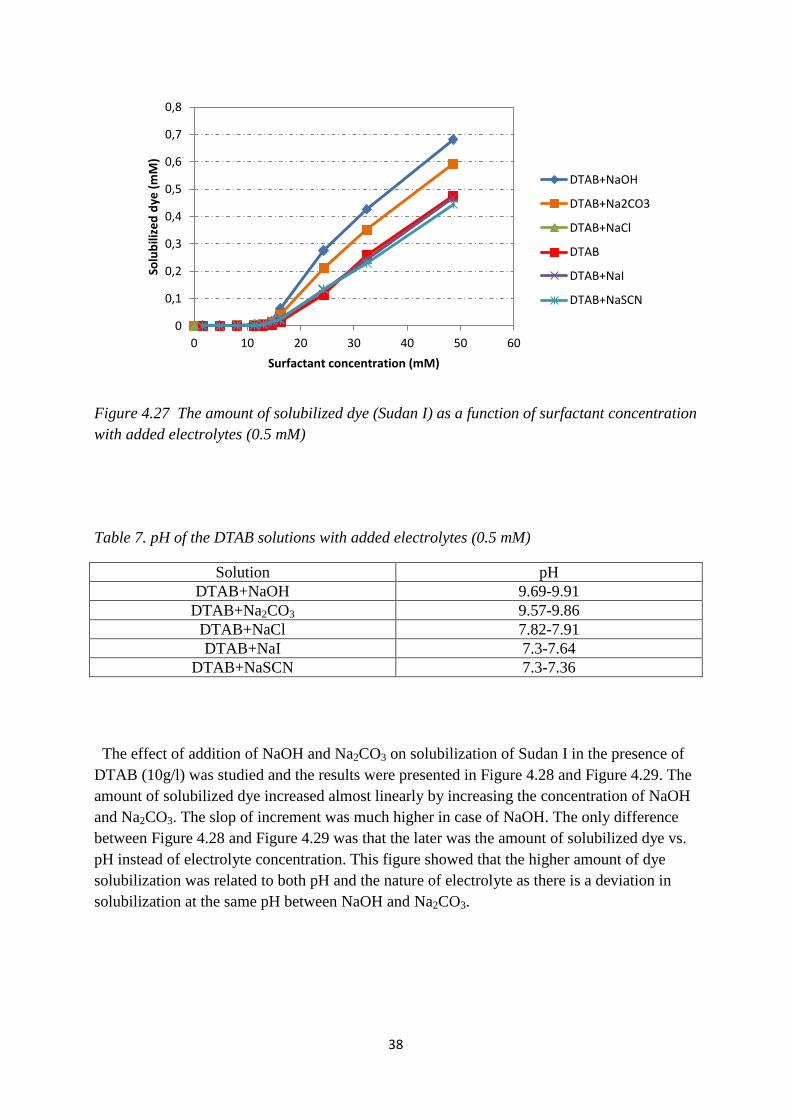
4.9 Electrolyte effect The solubilization of dye in DTAB aqueous solution was studied by adding a small amount
of different electrolytes (0.5 mM) to the solution Figure 4.27. The pH of the different solution
was also listed in Table 7. The figure showed that the CMC of DTAB did not change so much
by adding 0.5 mM of different electrolytes. However, the solubilization of Sudan I increased
to some extent for a couple of electrolytes (NaOH and Na2CO3 because of the increase in pH
as previously mentioned). The addition of NaCl did not affect the solubilization, whereas the
addition of NaI and NaSCN slightly decreased the solubilization of Sudan I. The addition of
higher amounts of electrolytes (NaCl, NaI, NaSCN) would probably increase the
solubilization as they cause micellar growth. This has been shown for NaCl in section 4.6.
38
Figure 4.27 The amount of solubilized dye (Sudan I) as a function of surfactant concentration
with added electrolytes (0.5 mM)
Table 7. pH of the DTAB solutions with added electrolytes (0.5 mM)
Solution pH
DTAB+NaOH 9.69-9.91
DTAB+Na2CO3 9.57-9.86
DTAB+NaCl 7.82-7.91
DTAB+NaI 7.3-7.64
DTAB+NaSCN 7.3-7.36
The effect of addition of NaOH and Na2CO3 on solubilization of Sudan I in the presence of
DTAB (10g/l) was studied and the results were presented in Figure 4.28 and Figure 4.29. The
amount of solubilized dye increased almost linearly by increasing the concentration of NaOH
and Na2CO3. The slop of increment was much higher in case of NaOH. The only difference
between Figure 4.28 and Figure 4.29 was that the later was the amount of solubilized dye vs.
pH instead of electrolyte concentration. This figure showed that the higher amount of dye
solubilization was related to both pH and the nature of electrolyte as there is a deviation in
solubilization at the same pH between NaOH and Na2CO3.
0
0,1
0,2
0,3
0,4
0,5
0,6
0,7
0,8
0 10 20 30 40 50 60
Solu
bili
zed
dye
(m
M)
Surfactant concentration (mM)
DTAB+NaOH
DTAB+Na2CO3
DTAB+NaCl
DTAB
DTAB+NaI
DTAB+NaSCN

39
Figure 4.28 The amount of solubilized dye (Sudan I) as a function of electrolyte
concentration (NaOH and Na2CO3)
Figure 4.29 The amount of solubilized dye (Sudan I) as a function of pH
y = 0,5386x + 0,2098 R² = 0,9995
y = 0,0719x + 0,3647 R² = 0,9814
0
1
2
3
4
5
6
0 2 4 6 8 10 12
Solu
bili
zed
dye
(m
M)
Electrolyte conc. (mM)
DTAB(10g/l)+NaOH
DTAB(10g/l)+Na2CO3
0
1
2
3
4
5
6
9 10 11 12 13
Solu
bili
zed
dye
(m
M)
pH
DTAB(10g/l)+NaOH
DTAB(10g/l)+Na2CO3

40
5. Conclusions
The conclusion remarks can be summarized as follows:
- The solubilization power, Se, of Sudan I with azo structure in the presence of all surfactants
was almost 6 times higher than that of Quinizarin. This showed the importance of the
chemical structure of solubilisate in solubilization process.
- The polymeric surfactant Pluronic P123, and other conventional nonionic surfactants
(IGEPAL CO-630 and Berol 535) showed the highest solubilization power (mol/mol) for both
dyes (Sudan I and Qunizarin). Nonionic surfactants with low CMC values probably had larger
micelle size and dye molecules were able to accommodate within their micelles better and
more.
- The amount of solubilized dye in the micelles was increased by temperature. This was
generally attributed to higher thermal agitation of dye molecules and easier accommodation in
surfactant micelles. In case of nonionic surfactants, the hydrophobicity of surfactant
molecules increases by increasing the temperature as their polyoxyethylene chains become
less soluble at elevated temperatures.
- The binary mixture of surfactants (DTAB:Berol 535 and SDS:Berol 535) did not show any
synergistic effect on solubilization of dyes.
- Addition of NaCl (10, 20 and 50 g/l) to the binary mixture of surfactants had generally a
positive effect on the amount of solubilized dye. That was due to increasing the size of
micelles (higher aggregation number) at high salt concentration. However, the addition of salt
increased the Krafft temperature of ionic surfactant (SDS) and caused precipitation of
surfactant at room temperature and, therefore, had a negative influence on dye solubilization
which could be overcome by increasing the temperature of the system or addition of low
amount of nonionic surfactants.
- The absorption spectra of both dyes in surfactant micelles were similar to that of 50%
aqueous ethanol, indicating that dyes are located in a relatively polar media (palisade region
of micelles).
- The solubilization of both dyes in the presence of cationic surfactant (DTAB) was increased
at alkaline pH (>8). Other surfactants (anionic and nonionic) did not show any similar effect.

41
6. Future studies For future work, it would be of interest to study the followings:
- The size and shape of surfactant micelles and mixed micelles in order to have a better
understanding about the change in the shape and size of micelles by increasing the
temperature and addition of electrolytes
- Further investigation of dye solubilization in cationic surfactant micelles in alkaline
condition especially for Sudan I
- Study the effect of more electrolytes and hydrotropes at different concentration on
solubilization of surfactants.
- Study the solubilization of dyes in surfactant vesicles, microemulsion, and etc.

42
7. References
[1] M.J. Rosen, Surfactants and Interfacial Phenomena, 3rd
Ed., Wiley, New York, 2004.
[2] S.S. Shah, K. Naeem, S.W.H. Shah, and G.M. Laghari. (2000). Differential absorbance
measurements of amphiphilic hemicyanine dyes, solubilization study in anionic surfactant. Colloids
and Surfaces A: Physiochem. Eng. Aspects 168, p. 77-85
[3] R. Hosseinzadeh, R. Maleki, A.A. Matin and Y. Nikkhahi. (2008). Spectrophotometric study of
anionic azo-dye light yellow (X6G) interaction with surfactants and its micellar solubilization in
cathionic surfactant micelles. Spectrochimica Acta Part A 69, p 1183-1187
[4] T.F. Tadros, Applied Surfactants: Principles and Applications, Wiley, New York, 2005.
[5] K. Holmberg, B. Jönsson, B. Kronberg and B. Lindman. Surfactants and Polymers in Aqueous
Solution, 2nd
Ed., Wiley, Chichester, 2003.
[6] H. Guo, Z, Liu, S. Yang and C. Sun. (2009). The feasibility of enhanced soil washing of p-
nitrochlorobenzene (pNCB) with SDBS/Tween80 mixed surfactants. Journal of Hazardous Materials
170, p. 1236-1241
[7] G.R. Chatwal, Synthetic Dyes, Himalaya Publishing House, Mumbai, 2009.
[8] H. Zollinger, Color Chemistry: Syntheses, Properties and Applications of Organic Dyes and
Pigments, 3rd
Ed., Wiley, Zurich, 2003
[9] D. Meiju, H. Xiaogang, Z. Zihao and W. Shougou. (2006). Determination of Sudan I in hot chili
powder by using an activated glassy carbon electrode. Food Chemistry 105, p. 883-888
[10] R. Rebane, I. Leito, S. Yurchenko and K. Herodes. (2010). A review of analytical techniques for
determination of Sudan I-IV dyes in food matrixes. Journal of Chromatography A, 1217, p. 2747-
2757
[11] V.Y. Fain, B.E. Zaitsev and M.A. Ryabov. (2006). Tautomerism of Athraquinones: III.
Tautomerization and Rotational Isomerization as Processes Responsible for the Appearance of
Several π1,π*-Bands in the Absorption Spectra of Hydroxy-Substituted Quinones. Russian Journal of
Organic Chemistry, Vol. 42, No. 10, p 1464-1468
[12] S. Rouhani and S. Salimi. (2008). Optical pH Sensor Based on Quinizarin for Alkaline pH
Regions. Prog. Colar Colarants Coat, p. 11-17
[13] D.C. Harris, Quantitative Chemical Analysis, 7th
Ed., W. H. Freeman and Company, New York,
2007.
[14] T-S. Choi, Y. Shimizu, H. Shirai and K. Hamada. (2000). Solubilization of disperse dyes in
cathionic gemini surfactant micelles. Dyes and Pigments 45, p 145-152
[15] R. Maikokera and H.M. Kwaambwa. (2007). Interfacial properties and fluoresence of a
coagulating protein extracted from Moringa oleifera seeds and its interaction with sodium dodecyl
sulphate. Colloids and Surfaces B: Biointerfaces, Vol. 55, p. 173-178

43
[16] P. Mukherjee, S.K. Padhan, S. Dash, S. Patel and B.K. Mishra. (2011). Clouding behavior in
surfactant systems. Advances in Colloid and Interface Science 162, p. 59-70
[17] Product Data Sheet IGEPAL CO-630. (2010). http://www.rhodia.com (2011-11-28).
[18] M.N. Berbaran-Santos. (2009). Surfactant Adsorption Parameters from Surface Tension
Measurements. Journal of Chemical Education, Vol. 86
[19] H.M. Vale and T.F. McKenna. Adsorption of Sodium Dodecyl Sulfate and Sodium Dodecyl
Benzenesulfonate on Poly(Vinyl Chloride) Latexes
[20] M.A. Bahri, M. Hoebeke, A. Grammenos, L. Delanaye, N. Vandewalle and A. Seret. (2006).
Investigation of SDS, DTAB and CTAB micelle microviscosities by electron spin resonance.
Colloids and Surfaces A: Physiochem. Eng. Aspects 290, p. 206-212
[21] R.Y. Talman and G. Atun. (2006). Effects of cathionic and anionic surfactants on the adsorption
of toluidine blue onto fly ash. Colloids and Surfaces A: Physiochem. Eng. Aspects 281, p.15-22
[22] T. Hikota, M. Nakamura, S. Machida and K. Meguro. (1971). Properties of Aqueous Solution of
Sodium Cyclododecyl Sulfate. Journal of the American Oil Chemists’ Society, Vol. 48, p. 784-786
[23] C. Vautier-Giongo and B.L. Bales. (2003). Estimate of the Ionization Degree of Ionic Micelles
Based on Krafft Temperature Measurements. Journal of Physical Chemistry B, Vol. 107, No. 23
[24] D.F. Evans, A. Yamauchi, R. Roman and E.Z. Casassa. (1982). Micelles Formation in
Ethylammonium Nitrate, a Low-Melting Fused Salt. Journal of Colloid and Interface Science, Vol.
88, p. 89-96
[25] C. Noïk, M. Baviére and D. Defives. (1987). Anionic Surfactant Precipitation in Hard Water.
Journal of Colloid and Interface Science, Vol. 115, p. 36-45
[26] S. Segota, S. Heimer and D. Tezak. (2006). New Catanionic mixtures of
dodecyldimethylammonium bromide/sodium dodecylbenzenesulphonate/water: I. Surface properties
of dispersed particles. Colloids and Surfaces A: Physiochem. Eng. Aspects 274, p. 91-99
[27] Y-L. Su and H-Z. Liu. (2003). Temperature-Dependent Solubilization of PEO-PPO-PEO Block
Copolymers and Their Application for Extraction Trace Organics from Aqueous Solutions. Korean
Journal of Chemical Engineering, Vol. 20, p. 343-346
[28] Safety Data Sheet Pluronic F-127. (2011). http://www.sigmaaldrich.com (2012-01-06)
[29] Private communication with Research and Development of Akzo Nobel company, Stenungsund,
Sweden
[30] A.R. Lang, (Ed.), Dyes and Pigments: New Research, Nova Science Publisher, New York, 2009.
[31] C.O. Rangel-Yagui, H.W.L. Hsu, A. Pessoa-Jr and L.C. Tavares. (2005). Micellar solubilization
of ibuprofen – influence of surfactant head groups on the extent of solubilization. Brazilian Journal
of Pharmaceutical Sciences, Vol. 41

44
[32] M.M. Swe, L.E. Yu, K-C. Hung and B-H. Chen. (2006). Solubilization of Selected Polycyclic
Aromatic Compounds by Nonionic Surfactants. Journal of Surfactants and Detergents, Vol. 9, Qtr. 3
[33] Y. Muto, M. Asada, A. Takasawa, K. Esumi and K. Meguro. (1987). The Efficiency of
Solubilization in Mixed Micelles of Nonionic and Anionic Surfactants. Journal of Colloid and
Interface Science, Vol. 124.
[34] N. Nishikido. (1977). Mixed Micelles of Polyoxyethylene-Type Nonionic and Anionic
Surfactants in Aqueous Solutions. Journal of Colloid and Interface Science, Vol. 60.
[35] R.K. Boyd, C. Basic and R.A. Bethem, Trace Quantitative Analysis by Mass Spectrometery,
Wiley, Chichester, 2008.
[36] Y.G. Sidir, I. Sidir, H. Berber and E. Tasal. (2011). UV-spectral changes for some azo
compounds in the presence of different solvents. Journal of Molecular Liquids, Vol. 162, p. 148-154

45
Acknowledgements First of all I would like to thank my amazing supervisor Ali Tehrani who has provided me with
excellent help, discussions and support throughout the project.
I would also like to thank my examiner Prof. Krister Holmberg for the discussions we have had and
for always being available.
I would like to thank Ali Reza Movahedi for providing me with different salts and for being awesome.
I would like to thank everyone at the Division of Applied Surface Chemistry for making me feel
welcome.
Finally, I would like to thank my family for all their support.