solid waste management plan february 6, 2017 city of roanoke
TRANSCRIPT

City of Roanoke
Solid Waste Management Plan
February 6, 2017

Table of ContentsExecutive Summary.............................................................................................................................. 1
Existing................................................................................................................................................. 1
Solid Waste Collection.............................................................................................................................. 1
Recycling................................................................................................................................................... 2
Disposal..................................................................................................................................................... 3
Composting/Mulching.............................................................................................................................. 3
Litter Control.............................................................................................................................................3
Primary Goals....................................................................................................................................... 4
Policy....................................................................................................................................................5
Introduction......................................................................................................................................... 7
1.1 Legislation........................................................................................................................................... 7
1.2 Authority............................................................................................................................................. 7
1.3 Purpose............................................................................................................................................... 7
1.4 Planning Area...................................................................................................................................... 8
1.5 Planning Period................................................................................................................................... 8
2.0 Background Information..................................................................................................................... 8
2.1 Status of Solid Waste nationally......................................................................................................... 8
2.2 Current System................................................................................................................................... 9
2.3 Waste Management Needs Identified.............................................................................................. 10
2.4 Solid Waste Management Mission Statement .................................................................................10
2.4.1 Strategies for Meeting Solid Waste Management Objectives....................................................... 10
3.0 Demographic Data............................................................................................................................ 11
3.1 Location............................................................................................................................................ 11
3.2 Population......................................................................................................................................... 12
4.0 Waste Generation and Composition.................................................................................................12
4.1 Existing Conditions............................................................................................................................ 12
4.2 Waste Generation Projections.......................................................................................................... 13
5.0 Existing Solid Waste Management System....................................................................................... 13
5.1 Services Provided.............................................................................................................................. 13
5.2 Collection.......................................................................................................................................... 14
5.2.1 Residential Garbage Collection...................................................................................................... 14
5.2.2 Bulky Waste................................................................................................................................... 14
5.2.3 Brush.............................................................................................................................................. 15
5.2.4 Central Business District Refuse Collection....................................................................................15
5.2.5 Commercial Collections Outside of the CBD.................................................................................. 15
5.2.6 Household Hazardous Waste......................................................................................................... 15
5.2.7 Electronics......................................................................................................................................16
5.2.8 Equipment and Personnel..............................................................................................................16
5.2.9 Commercial Haulers....................................................................................................................... 17
5.2.10 Litter Collection............................................................................................................................17
5.2.11 Materials Not collected by the City..............................................................................................18
5.3 Disposal............................................................................................................................................. 18
5.3.1 Roanoke Valley Resource Authority...............................................................................................18
5.3.1.1 Tinker Creek Transfer Station..................................................................................................... 19
5.3.1.2 Salem Transfer Station................................................................................................................ 19
5.3.1.3 Smith Gap Landfill – Permit 555................................................................................................. 20
5.3.1.4 Rail Haul...................................................................................................................................... 20
5.3.1.5 Roanoke Valley Resource Authority Fees................................................................................... 20
5.3.1.6 Residential Delivery and Disposal............................................................................................... 20
5.3.2 Alternative Disposal Solutions …………………………………………………………………………………………………. 20
5.3.2.1 Republic Services Transfer Station and Materials Recovery Facility ……………………………………….20
5.3.2.2 LCM Transfer Station ……………………………………………………………………………………………………………..21
5.3.3 Previously Operated Landfills ………………………………………………………………………………………………….. 21
5.3.3.1 Rutrough Road Landfill …………………………………………………………………………………………………………. 21
5.3.3.2 Other Previously Operated Solid Waste Facilities …………………………………………………………………. 22
5.3.4 Central Archive ……………………………………………………………………………………………………………………….. 22
5.4 Recycling........................................................................................................................................... 23

5.4.1 Existing Program............................................................................................................................ 23
5.4.2 Recycling Goals.............................................................................................................................. 24
5.4.2.1 Strategic Goals – Comprehensive Plan .......................................................................................24
5.4.3 Recycling Tonnage......................................................................................................................... 25
5.4.4 Recycling Cost Avoidance...............................................................................................................25
5.4.5 Federal, State and Partnerships..................................................................................................... 26
5.4.6 Strategic Goals - Budget.................................................................................................................26
5.4.7 Internet-Based Support................................................................................................................. 27
5.4.8 DEQ Yearly Recycling Report..........................................................................................................27
5.5 Composting/Mulch........................................................................................................................... 27
5.6 Public Outreach.................................................................................................................................28
5.6.1 Web-Site Outreach........................................................................................................................ 28
5.6.2 Social Media/Free Apps................................................................................................................. 29
5.6.3 City Solid Waste and Recycling Brochures..................................................................................... 29
5.6.4 Leadership College......................................................................................................................... 29
5.6.5 Events and Volunteer Programs.................................................................................................... 29
5.6.6 Litter Control.................................................................................................................................. 29
5.6.7 Performance Monitor.................................................................................................................... 30
6.0 Budget............................................................................................................................................... 30
6.1 Expenditure.......................................................................................................................................30
6.2 Revenues...........................................................................................................................................31
7.0 Waste management Hierarchy......................................................................................................... 31
7.1 Source Reduction.............................................................................................................................. 32
7.2 Reuse................................................................................................................................................ 33
7.3 Recycling........................................................................................................................................... 33
7.4 Resource Recovery and Incineration................................................................................................ 33
7.5 Landfilling..........................................................................................................................................34
8.0 Goals and Objectives of Program......................................................................................................34
8.1 Collections.........................................................................................................................................34
8.2 Disposal............................................................................................................................................. 34
8.3 Recycling........................................................................................................................................... 34

8.4 Leaf Disposal..................................................................................................................................... 35
9.0 Collection Schedule...........................................................................................................................35
10.0 Funding........................................................................................................................................... 35
11.0 Public Participation and Final Plan Adoption ……………………………………………………………………………..35

Appendices
Appendix 1.4 Maps ……………………………………………………………………………..………………………………. 37
Appendix 3.2 Demographic Profile and Population Projections ………………..…………………………. 38
Appendix 4A Waste Generation Projections (PRM’s) ……………………………………….…………………… 41
Appendix 4B Waste Generation Projections ………………………………………………………….……………… 42
Appendix 4.2 RVRA Tonnage Projections ……………………………………………………………………………….43
Appendix 5.3.1 RVRA Articles of Incorporation ……………………………………………………………..……… 44
Appendix 5.3.1.3 Map – Smith Gap Landfill ……………………………………………………………………..…… 51
Appendix 5.3.1.5 RVRA Waste Disposal Fees and Charges ………………………………………………..….. 52
Appendix 5.3.3.2 City of Roanoke Landfill Inventory …………………………………………………………..… 53
Appendix 5.4.8 Annual DEQ Report………………………………………………………………………………………. 67
Appendix 5.6.3 Sample Brochures and Calendars ………………………………………………………………….77
Appendix 5.6.7 Performance Monitor ……………………………………………………………………………………79
Appendix 8.1 Collection Systems Goals …………………………………………………………………………………. 80
Appendix 8.2 Disposal Systems Goals …………………………………………………………………………………… 80
Appendix 8.3 Recycling System Goals …………………………………………………………………………………. …81
Appendix 8.4 Leaf Disposal System Goals …………………………………………………………………………….… 81
Appendix 8.5 Collection Schedule System Goals …………………………………………………………….. ……..81
Appendix 11 Public Participation and Final Plan Adoption ………………………………………………….…..82

1
City of Roanoke
Solid Waste Management Plan
Update – 2017
Executive Summary
The following Solid Waste Management plan for the City of Roanoke, Virginia is
submitted in accordance with 9VAC 20-130-10et seq. The City represents a single-
entity region for the purposes of filing and administering the plan, and for being
accountable for its implementation.
The City’s solid waste collection, disposal and recycling programs fall under the
umbrella of the City’s Public Works Department, Solid Waste Management Division. In
2000, the City started a major overhaul of its program by implementing more automation
and more efficient routes. In 2015, the City continued this automated collection
program expansion to include an automated single stream recycling program. In 2014,
the City introduced the first sealed compactor program. This program includes five
sealed compactors strategically located within the Central Business District.
Existing
Solid Waste Collection – The City provides collection to its residential and small
business customers. It collects from approximately 42,000 households and some small
businesses integrated into the residential collection routes. The Central Business
District (CBD) is serviced by a unique sealed compactor program. Residents and
businesses have access to these compactors twenty-four (24) hours a day, seven (7)
days a week. The remaining commercial/business waste is collected by private sectors
haulers. The City also provides weekly curbside bulk collection which includes bulky
items like furniture, white goods and brush. The majority of the residential waste is
collected by the City at the curb with automated collection vehicles. Residents are
provided with one 96 gallon cart, free of charge. Assistance is provided for the elderly
and physically challenged. Some back alley and side yard collection is still conducted
but on a limited basis. Citizens are not charged for this service as it is paid for out of the
general fund. Businesses in the Central Business District (CBD) are charged by usage
of the compactor on a monthly basis. First two uses of the compactor per week are
free; subsequent other uses are $1.00. Recycling drop-off at the compactor sites is also

2
free. The City also has 18 front-loading dumpster locations serving various City
departments, located at such places as the Police Department, City Jail, City Hall, Court
house and other municipal buildings. These sites are currently serviced through a
contract with Waste Management Inc.
Recycling - The City provides curbside collection of recyclables to its residents and
small business partners, along with City schools using a single stream recycling
automated collection program. Each household is provided one Hawaii Light Blue 96
gallon recycling cart. These carts are equipped with radio identification tags (RFID)
which are embedded into the handle. When they are delivered they are assigned to the
household. At time of collection, containers can be tracked electronically. The
collection process is divided into “A” and “B” weeks. Each January a calendar/brochure
is mailed to each household which gives the day that the collection will take place. This
information is also provided on the City’s web site as well as posted on the City’s social
media pages. The materials collected are newspapers, junk mail, magazines, shredded
paper, computer paper, chipboard (cereal, cake, pasta), gift boxes and corrugated
boxes; plus aluminum and tin cans, plastic containers ( #1 through #7) as well as all
glass containers.
In 2008, following the economic down-turn the City of Roanoke ended their long term
recycling contract with Cycle-Systems. For almost one year, the City had to transport
its recycling to a facility operated by Montgomery Regional Solid Waste Authority in the
town of Christiansburg, Virginia. During this time, the City sought a bid for the
processing of its recycling. Recycling Disposal Solutions was awarded the contract in
2009 for the processing of the then current dual-stream recycling program. Following
another bid solicitation process in 2014, Recycling Disposal Solutions was awarded the
bid for the processing of the new single stream recycling program. Also in 2014, the
City applied for and received a grant for the assistance in marketing the new single
stream recycling program from an organization called Recycling Partnerships. This
grant was in the amount of $179,000 and was for both in-kind services as well as actual
dollars.
The City reported to the Department of Environmental Quality a recycling rate of 45% in
2009, 52% in 2010, 56% in 2011, 40% in 2012, 35% in 2013 and 35.6 % in 2014. The
downward trend was attributed to the loss of one large recycling vendor namely Cycle-
Systems.
The Roanoke Valley Resource Authority (RVRA) also operates a drop off collection
center at the Tinker Creek Transfer Station - accepting newspapers, clear glass and
metal cans (aluminum/steel). The RVRA also accepts white goods and other scrap

3
metal and all types of batteries for recycling. Once a month on the third Saturday, they
conduct a household hazardous waste day for all valley residents.
Disposal – Trash collected in the City by the City is taken to the Roanoke Valley
Resource Authority Tinker Creek Transfer Station, Permit 546, which is located at 1020
Hollins Road, where it is loaded on to rail cars and transported to the Smith Gap landfill,
Permit 555, located in Roanoke County. The transfer station was permitted in 1992 and
the landfill permitted in 1993. The waste collected in the City by private commercial
haulers, or handled directly by the business or industrial generators is generally taken to
the same transfer station.
Composting/Mulching - The City eliminated the collection of loose leaves in the fall
several years ago. It continues to offer a fall biodegradable bag leaf collection program.
A current contract with Rockydale Quarries transports these biodegradable bags to a
staging area located off of Old Mountain Road located in the northeast part of the City.
Bags are staged on this property until spring when Rockydale moves the bags to their
large facility off of Welcome Valley Road in the southern part of the City, where they are
combined with after-market fines of a quarry process to make a compost material. The
City does not treat its leaves prior to disposal. The composting system is privatized and
not under City oversight.
Litter Control - Most of the litter control programs in the City come under the oversight
of either the Solid Waste Management or Transportation Divisions of the Public Works
Department. The City’s Parks and Recreation Department likewise is engaged in litter
control in the City Parks. Programs include the following:
Big Belly Solar Powered Trash Compactors – The Solid Waste Management Division of the Public Works Department manages 41 Big Belly Solar Compactors that are positioned throughout the City. Big Belly compactors effectively control pedestrian litter while their 3:1 compaction rate maximizes collection efficiencies.
Metal Pedestrian Litter Containers – Solid Waste Management manages over 100 heavy-duty metal pedestrian litter containers (in addition to the aforementioned Big Belly solar compactors). Parks and Recreation has over 400similar litter containers deployed in parks, sport activity fields, recreation areas, and public spaces.
Adopt-A-Street Program: This program is coordinated by the Transportation Division of the Public Works Department. They provide trash bags, safety vests and bag collection at the end of the event. Neighborhood groups, businesses, service organizations, scouts and residents participate in the program. The City posts signs and the collection is four times per year minimum.
Sheriff’s Department - Inmate Program: This program collects the most litter of allthe activities in the City. It is coordinated by the Transportation Division.

4
Central Business District Crew: The Stormwater Division maintains a threeperson crew in the Central Business District from 6:00am to 2:30pm five daysper week to keep litter off the sidewalks, streets and alleys.
City Mowing Operations: All mowing operations are tasked with the collection oflitter and trash before mowing can begin. This is coordinated by theTransportation Division.
Street Sweeping: The Storm Water Division of the Public Works Departmentcoordinates all street sweeping.
Storm Water Management Plan: Provides for the education of the public relativeto the impact of litter on water quality. All storm water catch basins are labeledwith a request to protect waterways from pollution. Following a high waterevent, the Storm Water Division and the Solid Waste Management Divisioncoordinates efforts to collect all wood debris that accumulates along the lowwater bridges.
Clean Valley Council: Sponsors Clean Valley Day in the spring and a FallWaterways clean-up in the fall. These two programs account for an average of60 tons of debris and litter collected throughout the Roanoke Valley. Residents,neighborhood organizations, civic groups as well as businesses come togetherto collect litter and trash.
Other: The City also works with the more that 30 neighborhood organizations andgroups for additional trash and litter cleanups.
Primary Goals
The primary goals developed by the City for the Solid Waste Management program
under the City plan of 2016-2036 are summarized below. The existing system is well
developed and serves the community well. Thus, the goals remain the same, but seek
continuous improvements to the existing system with a strong emphasis on source
reduction, reuse and recycling.
These goals grew out of the Division’s mission statement, which states the following:
“Solid Waste Management will provide quality solid waste, recyclable and waste
reduction services to our customers by utilizing the most cost efficient means. We are
committed to service excellence, effective programs, a safe and healthy environment, a
progressive recycling program and landfill alternatives.”
These goals also grew out of the Vision 2001 – 2020 Comprehensive Plan whichremains the City’s vision today, and outlines the following policy and action items underthe chapter on Public Services:

5
Policy
PS P5 – Recycling: recycling and resource recovery will be promoted as a regional solid
waste management tool. Roanoke will be known as a City that recycles all recyclable
material where feasible.
Action Items
*A12 – Develop and expand recycling and educational programs that promote its
use.
*A16 – Pursue regional efforts for solid waste management and recycling
The goals and objectives for the City over the next 20 years (2017-2037) include the
following:
Collection
Expand educational efforts to collection, to provide information to the citizens on
container placement, acceptable and unacceptable waste and scheduling.
Continue to automate collection (single stream recycling) to the maximum degreepossible with existing financing.
Evaluate the CBD for improvements to collection systems which may includeexpanding the sealed compactor program.
Recycling
Continue to be a steward for the Vision 2001 – 2020 mission which states that“Roanoke will be known as a city that recycles all recyclable material, wherefeasible.”
Continue to aggressively promote source reduction and recycling as a way tosave costs and to increase landfill life expectancy.
Encourage better participation by the businesses in reporting their sourcereduction and recycling efforts annually.
Consider the construction and operation of a regional clean materials recoveryfacility (MRF) possibly operated by the Roanoke Valley Resource Authority(RVRA) or other regional entity. The City has formed a contract with RecyclingDisposal Solutions (RDS) to handle and process all single stream recyclingcollections at their Korte Street site location.

6
Disposal
Continue to promote source reduction and recycling as a means to increase thelife expectancy of the Smith Gap Landfill.
Continue to support the operations of the RVRA transfer station through activeparticipation in the RVRA.
Treatment
No treatment programs are proposed.
Litter Control
Continue to promote aggressive litter control programs as are currently in place.
In summary, in conjunction with its membership in the Roanoke Valley Resource
Authority, its affiliation with Recycling Disposal Solutions, and its support of the Clean
Valley Council, the City has established one of the more comprehensive and effective
integrated solid waste management programs in the Commonwealth of Virginia. Waste
reduction, reuse, recycling and disposal programs have been established that exceed
current regulatory mandates. For instance, the City conducts curbside single stream
recycling, has a long-term membership in the Roanoke Valley Resource Authority
(RVRA) for disposal in a subtitle D compliant landfill facility, and participates in a
successful yard waste mulching program sponsored by the RVRA, a fall bagged leaf
collection program where the leaves are transported to a composting program
developed by Rockydale Quarry, and a monthly household hazardous waste collection
day sponsored by the RVRA.
The City’s recycling program has grown significantly over the past decade, and is
currently attaining a 62.6% recycling rate as reported to DEQ for 2015. The recycling
rate is broad-based, meaning that it is tolerant of fluctuations in any one component of
the program, and can absorb changes without threatening the City’s ability to meet the
25% mandate.
Disposal activities over the planning period and beyond are secure with the Roanoke
Valley Resource Authority and collection has become more efficient with the advent of
automation. It would appear that the City can focus its efforts on education, promoting
reduction in the waste stream, and encouraging more recycling.

7
INTRODUCTION
1.1 LegislationThe following solid waste management plan has been prepared in accordance with the
Virginia Waste Management Board’s, Regulations for Solid Waste Management
Planning, amendment 1, 9VAC 20-130-10etseq., effective date August 1, 2001.
1.2 Authority (9 VAC 20-130-20)The regulations were promulgated pursuant to Chapter 14 (Sec.10.1-1400 et seq. ) and
specifically Sections 10.1-1402, 10.1-1411 and 10.1-1413 of Title 10.1 of the Code of
Virginia which authorized the Virginia Waste Management Board to promulgate and
enforce such regulations as may be necessary to carry out its duties and power, and the
intent of the Virginia Waste Management Act and the federal acts.
1.3 Purpose (9 VAC 20-130-40)The purpose of the regulations as generally stated in 9 VAC 20-130-40 and elsewherein the regulations is to:
1. Establish minimum solid waste management standards and planningrequirements for protection of public health, public safety, the environment, andnatural resources throughout the Commonwealth;
2. Require the development of a comprehensive and integrated solid wastemanagement plan that addresses all components of the solid waste hierarchyestablished by the United States Environmental Protection Agency (EPA) asembraced by the Commonwealth as follows:
Source Reduction (most desirable activity)
Reuse
Recycling
Resource Recovery (waste-to-energy)
Incineration
Landfilling (least desirable activity)3. Promote local and regional planning that provides for environmentally sound and
compatible solid waste management with the most effective and efficient use ofavailable resources;
4. Establish procedures and rules for designation of regional boundaries for theSolid Waste Management Plan;
5. Establish state, local government, or regional responsibility for meeting andmaintaining the minimum recycling rates of 25%;
6. Establish the requirement to withhold permits for failure to comply with theregulations;
7. Provide a method to request reasonable variance or exemptions from theregulations; and

8
8. Provide for reporting and assessment of solid waste management in theCommonwealth.
1.4 Planning AreaThe Planning area for this solid waste management plan is the City of Roanoke,
Virginia. Appendix 1.4(a) provides a location map of the City within Virginia. The City
represents a single-entity region for the purposes of filing and administering the plan,
and for being accountable for its implementation. Appendix 1.4(b) includes a map that
displays the City divided into collection days. SWM divides the City to the east and west
by its major transportation corridor - I581; to the north and south by Norfolk Southern
railroad tracks. Moving clockwise, SWM’s regularly scheduled collection begins in the
northeast on Monday and ends with the southwest quadrant on Thursdays. Please see
Appendix 1.4.
1.5 Planning PeriodThe planning period for this solid waste management plan is 20 years from 2017-2037.
2.0 Background InformationThis SWMP contains the most recent resolutions adopted by City Council in June of
2016 pertaining to the City’s renewal of its membership within the Roanoke Valley
Resource Authority, and the addition of the City of Salem as a new RVRA member.
2.1 Status of Solid Waste NationallyBased upon the 2014 EPA report Advancing Sustainable Materials management Fact
Sheet, the EPA uses this information to measure the success of waste reduction and
recycling programs across the country and characterize the national waste stream.
These facts and figures are current through calendar year 2014. In 2014, the United
States generated about 258 million tons (U.S. short tons unless specified) of municipal
solid waste (MSW). Over 89 million tons of MSW were recycled and composted,
equivalent to a 34.6 percent recycling rate. In addition, over 33 million tons of MSW
were combusted with energy recovery and 136 million tons were landfilled.
Recycling and composting of MSW results in greenhouse gas (GHG) emissions
reduction. In 2014, the 89 million tons of MSW recycled and composted provided an
annual reduction of over 181 million metric tons of carbon dioxide equivalent (MMTCO2
E) emissions, comparable to the annual emissions from over 38 million passenger cars.
As the title for the annual report suggests, EPA is thinking beyond waste. Sustainable
Materials Management (SMM) refers to the use and reuse of materials in the most
productive and sustainable way across their entire life cycle. SMM conserves
resources, reduces waste, slows climate change and minimizes the environmental
impacts of the materials we use.

9
In 2014, about 66.4 million tons of MSW were recycled, 23 million tons were
composted, 33.1 million tons were combusted with energy recovery and 136 million tons
were landfilled. In 2014, the rate of lead-acid battery recycling was about 99 percent
(2.81 million tons). The rate of corrugated box recycling was over 89 percent (27.3
million tons); over 61 percent (21.1 million tons) of yard trimmings were composted.
About 135.9 million tons of MSW (52.6 percent) were landfilled in 2014. Three
materials had composting or recycling rates that rose from 2013 to 2014 – yard
trimmings, selected consumer electronics and food. In 2014, the rate of yard trimmings
composted was 61.1 percent (21.1 million tons), up from 60.2 percent (20.6 million
tons). The rate of yard trimmings composted was 51.7 percent in the year 2000. In
2014, the rate of selected consumer electronics recycling was 41.7 percent (1.4 million
tons) up from 37.8 percent in 2013 (1.3 million tons). This was a further increase from
the year 2000, when selected consumer electronics were recycled at 10.0 percent. In
2014, the rate of food composting was 5.1 percent (1.94 million tons), up from 5.0
percent in 2013 (1.84 million tons). The rate of food composting was 2.2 percent in the
year 2000. For additional information from the EPA study, please visit: https://www.epa.gov/sites/production/files/2016-11/documents/2014_smmfactsheet_508.pdf
2.2 Current SystemSummary of the current Solid Waste Management System is provided below and
discussed in greater detail in Section 5.0
Trash
Collection - Public Collection by City from the curb 90%Collection by the City from the alleys 7%Collection of physically and topographically challenged 3%All collections one time/weekCentral Business District must transport trash to noted sealed compactor
Collection – Private Commercial Hauler (Waste Management, Allied Waste,
First Piedmont, Tidy Services are the primary companies.)
Disposal Roanoke Valley Resource Authority (Members include
City of Roanoke, Town of Vinton, Roanoke County, and
the City of Salem)
Smith Gap Landfill – Bradshaw Rd (permit #165, Acreage
800-1200, Life Expectancy 50+years)

10
RECYCLING
Collection – Public Single Stream Recycling (Newspaper, junk mail,
magazines, computer and shredded paper, chipboard and
corrugated cardboard, plastics (#1 - #7), aluminum and tin
cans, glass bottles (any color)
Collection – Private Waste Management, Allied Waste, First Piedmont
Processing Facility Recycling Disposal Solutions – Korte Street
Leaf Collection Biodegradable Paper Bags (3 weeks in fall & 1 week in
spring)
Composted at Rockydale Quarries
2.3 Waste Management Needs IdentifiedSolid Waste Management’s continued emphasis is to:
Maximize landfill life expectancy through a comprehensive solid waste
management program that focuses on source reduction, reuse, and recycling.
Educate both the public and private sectors on (1) the importance and benefits of
recycling, source reduction and reuse and, (2) how comprehensive solid waste
management will protect the environment and reduce waste transport and
disposal costs.
Continuously explore the market for recyclable materials in order to find the most
cost-effective means for recycling certain materials, and to continuously search
for effective means of managing other solid wastes.
2.4 Solid Waste Management Division’s Mission StatementWe will provide quality solid waste, recyclable and waste reduction services to our
customers by utilizing the most cost efficient means. We are committed to service
excellence, effective programs, a safe and healthy environment, administering rules and
regulations, and landfilling alternatives.
2.4.1 Strategies for Meeting Solid Waste Management Objectives

11
Solid Waste – Continue to offer an automated collection program for our residents and
small business owners. Those residents who for topographical reasons cannot move
their container to the street will be offered alley service. Those residents who are
physically challenged shall be offered back door service for both trash and recycling.
The Central Business District area has been offered a unique and innovative sealed
compactor program which includes five compactors strategically located throughout the
sealed compactor zone, where residential property owners or businesses can dispose
of their trash 24 hours a day, seven days a week.
Recycling – In October of 2015, the City of Roanoke introduced a single stream
recycling program to all residents, schools and small businesses. This program has
been successful and has doubled our recycling collections while reducing solid waste
collections proportionately.
The Central Business District area offers free recycling to all businesses and
residences. Drop-off areas located within the sealed compactor enclosure allow for the
continuous drop off of recycling 24 hours a day, seven days a week.
Household Hazardous Waste – The City of Roanoke is a member of the Roanoke
Valley Resource Authority (RVRA); the RVRA offers a household hazardous waste
collection day on the third Saturday of every month.
Leaf Collection – The City of Roanoke offers biodegradable paper bagged leaf
collection in the fall for three designated weeks. Leaves bagged in biodegradable paper
bags are collected and transported to Rockydale quarries where they are blended with
quarry fines to produce a compost product.
Compost/Mulch – The City of Roanoke, as a charter member of the Roanoke Valley
Resource Authority, offers residents free mulch as part of the recycling program. The
City collects brush on a weekly basis; RVRA grinds the brush into mulch. Mulch is
available for residents to pick up and use for gardening purposes.
3.0 DEMOGRAPHIC DATA
3.1 LOCATION
The city of Roanoke is located in the southwestern portion of Virginia in the Roanoke
Valley, western Virginia’s center for industry, trade, health, education, travel,
conventions and entertainment. The City limits are contained within the borders of
Roanoke County with the City of Salem lying directly to the west and the Town of Vinton
lying to the east.

12
Roanoke is located midway between New York, New York and Atlanta, Georgia on
Interstate 81, 168 miles west of the state capitol in Richmond, Virginia. The city is the
center of Virginia’s largest metropolitan area in the western half of the state and is the
4th largest metropolitan region in the state (behind Northern Virginia, Hampton Roads,
and the Greater Richmond area). The Roanoke, Virginia metropolitan statistical area
(MSA) includes the counties of Franklin (south), Craig (west to the West Virginia
border), and Botetourt (north). The City lies between the Blue Ridge Mountains and the
Allegheny Highlands along a major transportation corridor giving it ready access to
approximately two-thirds of the total population of the nation within a radius of 500
miles. The total land area of the City is 43 square miles.
3.2 POPULATION
Please see Appendix 3.2: this Demographic Profile provides a projected analysis of the population in Roanoke city based upon U.S. Census Bureau data. For additional demographic information, please visit: www.virginialmi.com/report_center/community_profiles/5104000770.pdf
4.0 Waste Generation Projections and Analysis
Waste Generation Comparisons
The tables in Appendix 4 show the projected waste generation in the City over the next
20 year period. Appendix 4A depicts waste tonnages recycled within the reporting
jurisdiction and reported annually to VDEQ. Appendix 4B is a sum of the tonnage
projections based on SWM’s performance monitor of the activities that the Division is
directly involved in, combined with the total tons projected in Appendix 4A. Projecting
the City’s total waste generation is difficult; although the tonnage collected by SWM is
stable, tons of recyclable material for the VDEQ report is volatile as demonstrated by
the 2014 (33,938) and 2015 (64,588) tonnages of PRM’s. Reasons for volatility include
the private sectors resistance or reluctance to report recyclable material for the VDEQ
report, and tonnages that should be reported but are hauled outside of the MSA. As
such, in order to project tonnages through 2037, 2014 and 2015 PRM tonnages were
averaged and increased 1% annually. Likewise, waste collected by SWM is projected to
increase 1% annually based upon population projections.
4.1 Existing Conditions (2016)
Waste is collected in the City by the City and multiple private sector haulers. The City
collects primarily from the residential and Central Business District sectors, while the
private haulers collect from the business and commercial sector and from various City
sites which use dumpsters for collection. All City collected waste and most privately

13
collected waste is taken to the Tinker Creek Transfer Station located on a 22 acre
parcel located at 1020 Hollins Road and then hauled via rail to the Smith Gap landfill.
The Smith Gap landfill is located in southwest Roanoke County, east of State Route 622
and encompasses approximately 1,200 acres of which 800 acres are dedicated to the
landfill and 95.4 acres permitted for disposal. Both facilities are owned and operated by
the Roanoke Valley Resource Authority (RVRA) of which the City is a member. The
City cannot require all waste generated within its boundaries to be disposed of at the
RVRA facilities; however, it should be noted that the City of Salem became a member of
the RVRA on July 1, 2016.
4.2 Waste Generation Projections
Actual waste generation data is based upon actual of waste transferred at RVRA and
City of Salem transfer stations in 2015. Since the City of Salem has become a member
of the RVRA, tons transferred at the Salem station were combined for simplicity.
Projections through 2037 for SWM planning purposes are calculated upon a 1% annual
increase. Please see Appendix 4.2.
5.0 Existing Solid Waste Management System
5.1 Services Provided
The Solid Waste Division is responsible for managing the City’s integrated solid waste
system. Some of the primary functions include:
Serving on the Roanoke Valley Resource Authority Board of Directors
Interface with Clean Valley Council.
Collection of residential and small business’s solid waste and recycling.
Collection of solid waste and recycling within the Central Business District by
providing sealed compactors zones.
Collection of recycling from City schools.
Collection of brush from residential properties.
Monitoring and enforcement of the Solid Waste Ordinances.
Providing public information on all aspects of the system, including a
comprehensive web site as well as social media outlets.

14
Coordinating with other City departments and divisions such as Facilities and
Parks and Recreation to promote recycling in all City buildings as well as parks.
Tracking commercial sector recycling by using the annual DEQ report.
Interface through the use of the assembly permit process any event coordinators
to assure that all events provide for adequate solid waste removal.
Handle all biodegradable bagged leaf collections.
5.2 Collection
5.2.1 Residential Garbage Collection
The City’s Solid Waste Division collects household waste from all single-family
residences using full-automated collection containers and vehicles, staffed with city
personnel. Approximately 90% of households are collected using automated trucks.
The City also provides 7% of our resident’s alley collection service using semi-
automated packer trucks, as well as 3% of our residents get back door service as a
physically challenged customer. The City has divided the collection program into four
zones, each one serviced one day per week, (Monday, Tuesday, Wednesday and
Thursday. Each resident is provided a 96 gallon container free of charge. Residents
place their trash container, bulky waste and brush out to the curb for collection. Single
stream recycling is collected following an “A” week or “B” week schedule.
The City has identified the following benefits to automated collection:
Back injuries of City employees have been reduced because employees are no
longer lifting trash containers.
Fully automated collection trucks require only one driver/operator instead of a
driver and two sanitation workers.
An integral part of the automated refuse and recycling collection system is that all
trash and recycling be placed in specially designated containers - because each
container is the same type and color for either trash (Dark Blue) or recycling
(Light Blue) collections. Both bulk and brush must be placed for collection to the
curb on the same day as regularly scheduled trash and recycling collection.
Allows for a very effective and efficient collection service.
5.2.2 Bulky Waste

15
City crews collect residential bulky waste once per week. Each residence can put out
up to three (3) bulk items each week. Bulky waste must be placed at the curb by
7:00am prior to the day of collection. Acceptable bulky items include household
appliances, furniture, mattresses and box springs. When placing refrigerators out to the
curb the doors must be removed and placed next to the appliance. Two tires per
household can also be placed out for collection each week.
5.2.3 Brush
City crews collect brush each week from residents who place said brush to the curb.
Brush is broken out into small and large piles. A small pile is one the is 4’x4’x4’ and a
large pile is 6’x6’x6’. Residents who wish to dispose of smaller piles of brush or
shrubbery are encouraged to place these piles into the dark blue trash container.
Branches are asked to be cut into 4’ of 6’ lengths and no wider than 3” in diameter.
Treated lumber and old railroad ties are not taken to the mulch grinding area of the
RVRA. These materials must be taken to the transfer station for hauling to the landfill.
Brush cut by private landscapers for a fee cannot be collected by the City.
5.2.4 Central Business District Refuse Collection
The City initiated a sealed compactor program within the Central Business District in
2013. Since then, the program has expanded to five (5) compactors. These five
locations are strategically located allowing businesses and residences access to them
24 hours a day, seven days a week. All five locations accept both trash and recycling.
The program allows for the first two uses of the compactor for free for the disposal of
trash. Following the first two uses for a week the user is then charged a $1.00 per
compaction. Recycling is free to all.
5.2.5 Commercial Collections Outside of the CBD
The City collects from a limited number of commercial businesses outside of the CBD.
These small businesses are collected as part of residential collection routes, once per
week. Recycling is also offered as part of the collection program.
5.2.6 Household Hazardous Waste
The Roanoke Valley Resource Authority sponsors a monthly collection of household
hazardous waste on the 3rd Saturday of every month. The following items are accepted:
Latex and oil paints
Aerosol cans of any kind

16
Paint-related products, such as paint thinner, stains, turpentine, polyurethane,
polishes and acetone
Automotive products, including motor oil, brake fluid, antifreeze and gasoline
Any type of battery
Propane gas cylinders (20 and 30 pound)
Mercury
Gardening supplies including pesticides, insecticides, herbicides and fertilizers
Household cleaners such as bleach, oven cleaners, bathroom cleaners, and any
other corrosive or acid cleaner
PCB’s
Fluorescent bulbs
Those items NOT accepted are tires, explosives, medical waste or radioactive
waste including smoke detectors
5.2.7 Electronics
Presently the City does not have a formal electronics waste collection program. The
City is expected to have an in-house electronics recycling program by the end of 2016.
5.2.8 Equipment and Personnel
The City operates their collection system with 56 personnel consisting of 13
administrative staff and 32 Solid Waste Equipment Operators and 11 Sanitation
Workers. The collection system has 51 vehicles assigned to it as follows:
Automated trucks (One Arm Bandits) 18 trucks 1 operator per route
Semi-Automated trucks (Rear Load) 18 trucks 1 operator and 2 workers
Knuckleboom trucks 5 trucks 1 operator per route
Miscellaneous (Pickups) 10 vehicles
The extensive fleet is maintained by the City’s Fleet Management Division. Costs for
repairs over the last several years can be summarized as follows:
Fiscal year Costs % of Annual Change

17
09/10 $769,598
10/11 $715,340 - 7%
11/12 $767,670 + 7%
12/13 $773,318 +.03%
13/14 $807,008 + 4%
The FY13/14 repair costs were split between the equipment categories as follows:
Automated Trucks 93.0%
Semi-Automated Trucks 6.0%
Knuckleboom Trucks 0.5%
Miscellaneous 0.5%
5.2.9 Commercial Haulers
There are four primary commercial trash haulers operating independently within the
City. These companies collect waste from the commercial and industrial sectors, and
are not franchised by the City. The City does not track the waste that is collected by
these companies, as it is difficult to obtain this information from the haulers which
consider this type of information as “proprietary”. The RVRA’s Tinker Creek Transfer
Station categorizes the private haulers separately and identifies them as commercial in
their records. As previously mentioned some of the commercially collected waste may
not be brought to the Tinker Creek Transfer Station but brought to other transfer
stations or MRF’s such as Allied Waste in Roanoke. As mentioned earlier, the City of
Salem has joined the RVRA – all waste that formerly was transferred there will now be
transferred at RVRA.
The commercial operated companies are:
Waste Management
First Piedmont
Allied Waste
Tidy Services
5.2.10 Litter Collection

18
Litter prevention and the Adopt-A-Street program are handled by the City’s
Transportation Division. Parks and Recreation sponsors an Adopt-A-Park program.
The City also partners with the local Sheriff’s department to use inmates for litter
cleanup.
5.2.11 Materials Not Collected by the City
The City does not collect
Contractor and lawn maintenance service waste, including tree pruning, land
clearing, construction, demolition and remodeling operations
Homeowner generated remodeling materials
Debris from land clearing
Automotive bodies and parts, drive trains and like materials
Hot ashes and other hot burnt items
Hazardous materials
Rocks, dirt, sand, bricks and concrete
Tree stumps and root balls
Drums or tanks that are not cut in half and triple rinsed
Lawnmowers filled with gas or oil
Motorcycles, mopeds or automotive parts
Paint and other liquids
5.3 Disposal
5.3.1 Roanoke Valley Resource Authority
On July 29, 1975, the City of Roanoke, the County of Roanoke and the town of Vinton
entered into an agreement to form the Roanoke Valley Regional Solid Waste
Management Board (Board) to provide for the operation of a regional sanitary landfill,
known as the Rutrough Road landfill, Permit 165. On October 23, 1991, the Board, the
City, Roanoke County, and the Town of Vinton, agreed to establish the Roanoke Valley
Resource Authority (Authority or RVRA) for the purpose of siting and permitting a new
regional landfill and transfer station.

19
On December 3, 1991, the Board of Supervisors of Roanoke County further made the
new Authority official through the passing of a resolution which authorized the
membership of the City of Roanoke and the Town of Vinton in the Roanoke Valley
Resource Authority, which under the same resolution had its name changed to the
Roanoke Valley Resource Authority.
On July 1, 2016 the members of the Roanoke Valley Resource Authority welcomed
the newest member of the RVRA, the City of Salem. The Amended Articles of
Incorporation are included in Appendix 5.3.1.
5.3.1.1 Tinker Creek Transfer Station
The Tinker Creek Transfer Station is located on a 22 acre parcel at 1020 Hollins
Road, south of Orange Avenue, within the corporate limits of the City of Roanoke.
The facility was permitted in 1992 as Permit 546 with the service area defined as the
City of Roanoke, County of Roanoke, Town of Vinton and the City of Salem. The
facility has a peak capacity of 1600 tons per day, accepting an average load of 641
tons per day of solid waste from private collection vehicles, business, citizens and
municipal collection vehicles from the service area.
The transfer station consists of a main building with enclosed tipping floor, a rail car
capping shed, offices within the main building, dumpster area, recycle area, scale
house, two scales, parking area, rail car siding and access roads. The collection
vehicles enter the facility from Hollins Road, travel across the entrance scales and
then enter the tipping floor building at the north end. The vehicles discharge the
loads on the concrete tipping floor, exit the building on the south end and proceed to
the exit gates on the property and across the scales again as necessary. The solid
waste on the tipping floor is moved to two open pits located above the top of the rail
cars which are loaded with a knuckle boom. Each rail car can hold up to 85 tons of
waste. At the end of the day, all waste that has been collected and loaded in the 1-
12 rail cars are transported by Norfolk Southern railroad 33 miles on the Waste Line
Express to the off-loading stations at the Smith Gap Landfill. This station contains a
large rotary dumper which elevates the rail car, turning it on its side to discharge the
waste onto the tipping floor. Large loaders push the waste into large off-road dump
trucks which transport the waste to the working face of the landfill.
5.3.1.2 Salem Transfer Station
In July of 2016, the City of Salem’s Transfer Station became part of the Roanoke
Valley Resource Authority (RVRA). This second transfer station is located at 1271
Indiana Street, Salem VA. 24153. Presently all trash that is taken in at the Salem
Transfer Station is loaded daily into walking trailers and transported to the Tinker

20
Creek Station at the end of every day. At the RVRA, the trash is unloaded and
placed into the Tinker Creek rail cars to be transported to the Smith Gap landfill.
5.3.1.3 Smith Gap Landfill – Permit 555
The Smith Gap Landfill was permitted on June 25, 1993 as Permit 555. The facility is
located in southwest Roanoke county, east of State Route 622, on a tract known as
Smith Gap. (Appendix 5.3.1.3 illustrates the location). The facility encompasses
approximately 1,200 acres of which 800 acres is dedicated to the landfill and
associated facilities, i.e. roads, sediment ponds, leachate handling facilities, borrow
areas, etc.
5.3.1.4 Rail Haul
The RVRA holds a 25 year agreement with Norfolk-Southern Railroad to transport
waste by rail to the Smith Gap landfill. This agreement expires June 30, 2018. At the
end of the 25 year period, the contract can be automatically renewed in 5-year
increments for another 25 years, Thus, rail haul is secure through the planning
period.
5.3.1.5 Roanoke Valley Resource Authority Fees
See Appendix 5.3.1.5 – RVRA Waste Disposal Fees and Charges.
5.3.1.6 Residential Delivery and Disposal
Residents of the City can bring twelve loads per year directly to the Tinker Creek
Transfer Station for no charge. The residents must have proof of residency through
the City and have no larger than a ¾ ton pickup truck. Materials accepted include
furniture, appliances, carpet, yard waste, brush shrubbery, household debris and
household garbage. Materials that are not accepted include waste generated by
work performed for pay by the homeowner, shingles, rock and dirt, and hazardous
materials. Tires must be paid for.
5.3.2 Alternative Disposal Options
5.3.2.1 Republic Services Transfer Station and Materials Recovery Facility
Republic Services operates a transfer station and materials recovery facility under
Permit By Rule 105 originally issued on August 21, 1996 with last amendment issued
on September 2, 1997. According to the DEQ permit, the facility consists of truck
scales, covered tipping area with concrete pad, baler for recyclables, and bins for
storage. The permit states that the facility will receive 350 tons per day of solid waste

21
located at 341 24th Street, N.W. and was opened in 1996. The facility recycles
cardboard and recycled approximately 6,300 tons in 2003. This data was provided to
the City for use in preparation of the report to DEQ.
Republic Services also uses the facility as a transfer station where waste collected by
Republic Services is tipped on to the floor and pushed into large transfer trailers.
Approximately 10 trailers are filled per day of operation. In 2003, 55,200 tons were
shipped out of this facility to the Allied Waste landfill in Brunswick County. Republic
Services estimated that approximately 40% or 22,080 tons of this waste originated in
the City although no records are actually kept.
5.3.2.2 LCM Transfer Station
LCM Corporation (LCM) operates a transfer station in the City under permit number
PBR 136 issued on December 8, 1998. The facility is located at 3321 Shenandoah
Avenue, N.W. The facility consists of two units: an enclosed area for storage of
sealed roll-off containers and two box trailers. LCM uses the transfer station strictly
for processing its materials for shipping. No other entity can use the facility and
garbage is not handled. According to DEQ Form 50-25 for 2003 the following
materials were handled:
5 cy industrial waste
142 cy asbestos
2 cy petroleum contaminated soil
33 cy petroleum contaminated absorbentsThe waste was shipped primarily out of state for disposal.
5.3.3 Previously Operated Landfills
5.3.3.1 Rutrough Road Landfill
The City of Roanoke was a member of the Roanoke Valley Regional Solid Waste
Management Board (Board) which operated the Roanoke Regional Sanitary Landfill
also known as the Rutrough Road Landfill. The Rutrough Road Landfill is located in
the County of Roanoke south of the Roanoke River, north of Route 618 at the border of
Roanoke and Bedford counties. The location of the landfill is identified on the site map
(Figure 8) excerpted from the United States Geological Survey (USGS) Hardy and
Stewartsville 7.5 minute quadrangles, photorevised 1972, 1984 respectively. Pertinent
information relative to the facility includes the following:

22
PERMIT NUMBER: 165
FACILITY NAME: Roanoke Regional Landfill (Rutrough Road Landfill)
OWNER/OPERATOR: Roanoke County, Virginia
CLASS: Closed Solid Waste Facility
TYPE: Sanitary Landfill (Lined/Unlined)
TOTAL SITE AREA: 274 Acres
WASTE DISPOSAL AREA: 60 Acres (44 additional acres closed prior to 1988)
ADJOINING LAND USE: Rural and forested (National Park Service), sparsely
populated (upgradient)
The landfill was originally permitted in 1974. The landfill was closed in 1994-95.
5.3.3.2 Other Previously Operated Solid Waste Facilities
Appendix 5.3.3.2 contains a report entitled, “City of Roanoke Landfill Inventory,”
dated February, 1991 which summarizes information collected during the inventory of
the City’s landfills. All facilities owned by the City were closed prior to 1988 and are
not under post closure surveillance.
5.3.4 Central Archive
Records of all closed and active solid waste disposal sites within the City are
maintained at the office of the City of Roanoke, Division of Solid Waste, 1802
Courtland Road, N.E., Roanoke, VA 24012 (540-853-6848). Information on the
Roanoke Valley Resource Authority disposal facilities is kept at the offices of the
Roanoke Valley Resource Authority at 1020 Hollins Road, Roanoke, VA 24012 (540-
857-5050).
The files kept by the City constitute the central archive and operating record for all
permitted landfills within the City. Documentation on new landfills (should there be
any in the future), recycling and composting activities, and closure and post closure
care is also kept in this location. All correspondence to and all correspondence from
DEQ is kept in the same files.
In addition, the Solid Waste Management Plan prepared by the City will serve as a
central archive and summary of solid waste collection, disposal, and recycling
activities within the City. The plan will be revised as appropriate during the planning

23
period and the revised plan will be submitted to DEQ for review and approval.
5.4 Recycling
5.4.1 Existing Program
The City offers a single stream recycling program to all of its residents, small business
operators as well as all city schools. Each household receives one free 96 gallon
Hawaii Light Blue Recycling cart, which is recorded into a database. These containers
also come equipped with a Radio Identification Tag (RFID). The City has contracted
with Sonrai Systems out of Naperville, Illinois to assist in managing the location of these
containers.
The recycling program is divided into an “A” week or “B” week collection program.
Residents are mailed a yearly recycling calendar, explaining details of not only the
recycling program but all of the other collections that the City provides. The City also
has an interactive web site that residents can go to. All they do is go to the web site
and click on single stream recycling and enter their address; a map will download and
show them what week they are collected on.
The collection of single stream recycling includes newspapers, junk mail, magazines,
computer paper, shredded paper, chipboard (cereal, cake & pasta box’s), corrugated,
aluminum and tin cans, all plastic containers ( #1 through #7) as well as glass bottles.
Single stream recycling is also provided to those residents and businesses who bring
their recycling to the five sealed compactor locations. City Schools are collected twice a
week for single stream recycling.
Commercial contractors also provide paper and cardboard collections to their
commercial customers.
Within the City is a major recycling processor, Recycling Disposal Solutions. This
company has two locations within the Roanoke Valley. One located on Enon Drive in
Roanoke County and the second facility is located on Korte Street in the city of
Roanoke. RDS’s main facility is located in Portsmouth, Virginia.
Currently the City has a ten (10) year contract with RDS for the processing of recycling
at a cost of $34.55 per ton.

24
The City maintains a monthly spread sheet to track recyclables collected.
The Roanoke Valley Resource Authority also operates a drop off collection center at the
Tinker Creek Transfer Station which collects newspapers, junk mail, magazines,
aluminum and tin cans, plastic and glass containers. They also accept metal goods as
well as vegetative waste that is ground up mulch and offered to residents for free.
5.4.2 Recycling Goals
The City maintains its required 25% recycling rate which is a regulatory goal of the
Department of Environmental Quality.
The City takes their role as a recycling provider very seriously. Prior to the introduction
of single stream recycling, the City spent almost three years planning the
implementation of single stream recycling. The City recognizes that the old motto holds
true, “Recycling is never meant to make money”. They recognize that recycling is only
one portion of a very detailed environmental plan, which began at least twelve years
ago. The City has partnered with Virginia Tech to train staff in a program called
Environmental Sustainability Management System (ESMS). This program looks at all
aspects of the City’s environmental impact. Staff meets regularly to look at carbon
footprints, energy savings, recycling measures and sustainability efforts throughout the
City.
5.4.2.1 Strategic Goals - Comprehensive Plan
The comprehensive plan entitled “Vision 2001-2020”, although developed in 2001,
continues to be the standard of reference; the plan outlines the following policy and
action items under the chapter on Public Services:
Policy
PS P5 – Recycling: recycling and resource recovery will be promoted as a regional solid
waste management tool. Roanoke will be known as a City that recycles all recyclable
material where feasible.
Action Items
A12 Develop and expand recycling and educational programs that promote its use.
A13 Consider developing a staffed recycling center with a household hazardous waste
component.
A16 Pursue regional efforts for solid waste management and recycling.

25
5.4.3 Recycling Tonnages
The following spreadsheet reflects overall tonnages of the dual stream recycling
program which began in July of 2005 as well as the transition to single stream recycling
in October of 2015. Notice that 2016 recycling tonnages increased nearly 60% from
2015 to 2016; and 85% over 2014.
*SS denotes Single Stream
2016
SS2015 2014 2013 2012 2011 2010 2009 2008 2007 2006 2005
Jan 407 252 266 251 243 248 223 263 258 235 241 228
Feb 428 134 222 222 241 219 135 219 213 182 196 207
Mar 501 276 248 223 240 269 256 214 209 248 256 242
Apr 412 259 263 243 224 218 237 224 239 174 205 214
May 457 222 246 282 273 229 219 229 255 226 213 219
Jun 500 216 218 226 262 264 266 245 237 207 227 233
Jul 418 220 462 218 230 161 214 238 240 228 208 196
Aug 506 214 219 241 209 226 202 193 229 234 239 232
Sep 472 213 280 232 222 226 210 202 235 199 232 229
Oct 463SS
503 290 281 271 229 203 204 232 216 203 197
Nov 449SS
410 209 193 259 275 248 216 219 209 222 214
Dec 520SS
535269 283 257 280 238 279 288 238 245 229
Total 5533 3460 2996 2905 2936 3172 2930 2936 2861 2602 3116 2415
5.4.4 Recycling Cost Avoidance
The City of Roanoke understands the value of recycling. It adheres to the saying that
recycling never makes money, but it does have a savings in cost avoidance.

26
As previously stated the City of Roanoke as a member of the Roanoke Valley Resource
Authority has a solid waste tipping fee of $49.50 per ton. Having secured a 10 year
contract with Recycling Disposal Solutions, the City’s recycling tipping fee is $34.55 per
ton. The saving to the city is $14.95 per ton, which is referred to as cost avoidance,
Year 2008 and 2009, The City had a “No charge” tipping rate for recycling
* Year 2010 to 2014, The City was billed $19.00 per ton for Paper and $37.00 per ton for
Bottles and Cans on a dual stream program
Fiscal Year Solid Waste
(tons)
Recycling
(tons)
Cost Avoidance
2008 47,060.41 2,861.7 $128,776.59
2009 42,798.70 2,936.6 $132,873.00
2010 42,667.81 2,930.2 $69,873.02
2011 40,055.51 3,172.1 $72,836.89
2012 39,644.83 2,936.4 $71,732.26
2013 41,137.74 2,905.0 $75,597.45
2014 39,573.71 2,996.0 $75,623.24
5.4.5 Federal, State and Local Partnerships
The City partnered with a company called Cycle Systems for disposal of recyclables
until the contract ended in 2008, at the request of Cycle Systems due to the downward
turn of the economy. In 2009 and 2010, the City undertook a contract with the
Montgomery Regional Solid Waste Authority, Christiansburg, Virginia for the disposal of
recyclables. Finally in 2011 a new contract was formed with Recycling Disposal
Solutions (RDS), Portsmouth, Virginia. RDS opened a new facility on Enon Drive in
Roanoke County to handle the City’s dual stream recycling program. In 2015, RDS
opened a new facility within the City (Korte Street) to handle the new single stream
recycling program.
5.4.6 Strategic Goals - Budget
Annually, during the budgeting process, the Solid Waste Division must outline strategic
goals for their program. In fiscal year 2010, the City of Roanoke began a new process
for creating a budget. This new process is called Budgeting for Outcomes (BFO).

27
When the BFO process was originally introduced in 2010, seven (7) priority areas were
developed and approved by City Council. These priority areas include:
Economy
Education
Good Government
Human Services
Infrastructure
Livability
Safety
Each priority team is comprised of a facilitator and as many as 8 to 10 team members.
They meet for several weeks during the budget process and review the offers submitted
to the priority. Solid Waste Management developed eight offers, which include Trash
Collection, Recycling Collection, Central Business District Sealed Compactor Program,
Physically Challenged and Topography Collection Service, Containers and Distribution,
Bulk Collection and Brush and Bagged Leaf Collection. Each of the eight offers has
their own unique Executive Summary, each has its own unique impact to the priority
that the offer best satisfies, and each offer breaks down the cost of the program. Offers
are “ranked’ by the priority team and are either funded or not funded.
5.4.7 Internet-Based Support
The Solid Waste Management Division is included on the City’s web site. The City also
supports a very strong social media page. Solid Waste Management maintains both
under their own webmaster. Citizens can obtain information relative to collection and
recycling and provide comments to the Division via the sites.
5.4.8 DEQ Yearly Recycling Report
The City has maintained a yearly report to DEQ on their recycling program. This report
is submitted every April. Please see Appendix 5.4.8 - Annual DEQ Report.
5.5 Composting/Mulch
Several years ago, the City provided their own leaf composting operations;
unfortunately the city property that was being used for this operation was sold. The City
then looked to outsource this operation and formed a partnership with Rockydale

28
Quarries that are located within the City. The City transports the biodegradable bagged
leaves to Rockydale where they are combined with a rocky dust material (fine) to form a
compost material.
For the past several years the City has been collecting approximately 250 to 300 tons
per year.
The City encourages and promotes “Cut It and Leave It” for grass clippings and as well
as leaf mulching in the fall.
The City also collects and transports brush to the Tinker Creek Transfer Station where it
is ground into mulch. Citizens can take pick-up truck loads of free mulch, as long as
they bring a tarp to properly cover and secure the mulch.
If a City tree falls, the City’s Urban Forestry Division will cut the tree up and mulch the
branches. Woodchips from this activity are available free of charge to the citizens.
5.6 Public Outreach
There are public-outreach elements of every aspect of the City’s integrated solid waste
system. This section summarizes the various elements of the public outreach and
education programs that the City is involved in.
5.6.1 Web-Site Outreach
The City’s Solid Waste Management web site is a “one-stop” source of information on
virtually all of its solid waste services. The site includes the following information:
Contact Information
Hours
Emergency Announcements
General information of Waste Collection
Solid Waste Collection
Services Offered
Recycling
Bulk and Brush Collection
Leaf Collection

29
Composting and Mulch Mowing
Household Hazardous Waste
Holiday Collection Schedule
5.6.2 Social Media/Free Apps
The City also uses Facebook and Twitter to get information out to the general public.
Citizens can download the iRoanoke app to report issues.
5.6.3 City Solid Waste and Recycling Brochures
The City’s office of Communications publishes a recycling calendar brochure each year
in December. It is sent to all residents the week following the Christmas Holiday. This
brochure contains information on recycling collections, including when recycling is
collected; solid waste, bulk and brush collections as well as information regarding the
monthly Household Hazardous Waste collection day held on the 3rd Saturday of every
month. See Appendix 5.6.3 for sample brochures.
5.6.4 Leadership College
The City sponsors a Leadership College whereby residents sign up for classes
administered by various City Departments or Divisions. Citizens who attend Leadership
College have the opportunity to learn more about their City government. The Solid
Waste Management Division falls under the Public Works Department.
5.6.5 Events and Volunteer Programs
The Solid Waste Management Division participates in several special events each year,
including Clean Valley Day, Earth Day, Public Works Week and Fall Waterways Clean-
Up. The Solid Waste Management Division also attends individual neighborhood
association meetings. Each of these events provides an opportunity to disseminate
materials, talk to people one-on-one to answer questions and promote good waste
management practices, and to hear from the general public and their interests and
needs.
5.6.6 Litter Control
The City encourages all neighborhoods to conduct annual cleaning events and will
assist as necessary. Additionally, the City utilizes a clean-up crew handled by the
Sheriff’s department. This clean-up crew consists of city inmates.

30
Litter control is handled by the Transportation Division of the City, through the Adopt-A-
Street program as well as the Parks and Recreation Department through an Adopt-A-
Park program.
5.6.7 Performance Monitor
To continuously evaluate the Solid Waste Management Division, the City has developed
a performance monitoring protocol. Data is collected from different categories and
logged into a monthly spreadsheet. A sample of a performance monitor form is
included in Appendix 5.6.7.
6.0 Budget
6.1 Expenditure
The City’s budget for its solid waste management services for FY2015-2016 was
$7,309,473. This includes all operating costs, collection costs, administrative costs as
well as tipping fees. The following table indicates the solid waste budget relative to the
total City budget for FY 2012 through FY 2016.
TOTAL CITY AND SOLID WASTE BUDGETS
FY2012 THROUGH FY2016
FY2012 FY2013 FY2014 FY2015 FY2016
Total City Budget $258,697,000 $252,920,000 $260,033,000 $260,147,000 $272,051,000
Refuse Collection and
Disposal $6,405,052 $6,257,189 $6,449,403 $6,734,726 $7,309,473
% Refuse budget/Total
Budget 2.48% 2.47% 2.48% 3% 3%
%Change in Total City Budget 2.11% 2.23% 2.81% .0004% 4%
% Change in Refuse Budget 2.15% 2.31% 3.07% 4% 8%
Population 97,764 98,465 99,320 99,428 101,416
Solid Waste Budget $/person $65.52 $63.55 $64.94 $67.73 $72.07
Tonnage - City Collected 39,644 41,137 39,573 40,245 38,377
Solid Waste Budget$/ton $161.56 $152.10 $162.97 $167.34 $190.46

31
Category FY2012 FY2013 FY2014 FY2015 FY2016
Operating
Expenses Expenditures
Fuel $432,225 $452,103 $421,793 $284,560 $266,575
Tipping Fees $2,033,960 $2,095,770 $2,093,769 $2,180,238 $2,193,998
Category FY2012 FY2013 FY2014 FY2015 FY2016
Temporary Labor $215,039 $282,087 $238,041 $231,936 $248,950
Expendable
Equipment $9,018 $5,903 $9,859 $13,781 $13,737
Condo
Reimbursement $64,731 $51,997 $68,057 $77,092 $73,669
Recycling Tipping
Fees $59,693 $75,051 $77,277 $72,575 $141,488*
CBD Compactors $0.00 $0.00 $15,000 $21,750 $36,000
Total $2,814,669 $2,990,215 $2,923,793 $2,881,932 $2,974,417
% Annual Change 5.22% 8% 2% 2% 3%
*Beginning of Single Stream
6.2 Revenues
The only revenue generated for Solid Waste services are from the Roanoke Valley Resource
Authority to the City for a host fee for the transfer station. These fees are placed into the
general funds.
The City of Roanoke’s Solid Waste and Recycling programs are paid for by the General Fund.
No fees are charged to either the homeowner or small businesses.
7.0 Waste Management Hierarchy
Under 9 VAC 20-130-30, the following policy is set forth:
“It is the policy of the Virginia Waste Management Board to require each region
designated pursuant to 9 VAC 20 -130 – 180 through 9 VAC 20-130-220, as well as
each city, county and town not part of such a region, to develop comprehensive and

32
integrated solid waste management plans that, at a minimum, consider and address all
components of the following hierarchy:
1. Source Reduction
2. Reuse
3. Recycling
4. Resource Recovery (waste to energy)
5. Incineration
6. Landfilling
Section 9 VAC 20-130-150.6, also addresses this requirement by stating:
“The local government or regional solid waste management plan shall include data and
analyses of the following type for each jurisdiction. Each item below shall be in a
separate section and labeled as to content:
7.1 Source Reduction
Source reduction refers to any change in the design, manufacture, purchase, or use of
materials or products (including packaging) to reduce their amount or toxicity before
they become municipal solid waste. Source reduction can help reduce waste disposal
and handling costs, conserve resources, and reduce pollution. Previously discussed
the trends in source reduction nationally noting that the reduction of yard waste in
landfills is the most significant source reduction activity at the moment as localities and
states ban yard waste from landfills.
The City has continued an in-house audit and education program in their Public Works
Service Center to track various products used and to assure appropriate disposal of any
waste generated from their use. This education program is part of the Environmental
Sustainability Management System (ESMS). This program began with the help of
Virginia Tech. Several city employees have taken the complete course.
Another in-house program is a very active recycling program within the City schools.
Several years ago the schools began a zero-waste program, meaning that their goal
was not to have any waste at all. The City’s Solid Waste Management Division collects
recycling twice a week from all city schools. The schools also have attempted to
maintain a food composting program; however, they currently do not have a vendor that
33
will collect the food waste. Roanoke City Schools aggressively are seeking another
vendor.
The City requests information annually from its business sector relative to recycling
activities. This exercise in and of itself can serve as an educational tool as the
businesses and industries compile the data and consider the expense of their disposal
programs, including source reduction.
7.2 Reuse
Reuse is similar to source reduction as it prevents materials from entering the waste
stream, but involves separating a given solid waste materials from the waste stream
and using it, without processing or changing its form, other than size reduction, for the
same or another end use. Examples of reuse include such activities as swap shops or
thrift stores, clothing collection centers, pallet reuse, the use of refillable bottles and one
of the newest movements is the neighborhood swap sessions. This is where neighbors
will exchange items with neighbors who have no more use of the item for free.
Currently there are several reuse centers available throughout the City:
Rescue Mission
Good Will industries
Habitat for Humanities
Salvation Army
American Red Cross
7.3 Recycling
Recycling is the process of separating a given waste material from the waste stream
and processing it so that it may be used again as a raw material for a product, which
may or may not be similar to the original product. Section 5.4 discusses the recycling
activities being implemented in the City.
7.4 Resource Recovery and Incineration
Resource recovery refers to a system that provides for collection, separation, recycling
and recovery of energy from solid wastes, including disposal of non-recoverable waste
residues. Incineration means the controlled combustion of solid waste for disposal.
34
According to the EPA burning MSW can generate energy while reducing the amount of
waste by up to 90 percent in volume and 75% in weight. Presently, there are no plans
to implement either a Resource Recovery or an incineration system in the City.
7.5 Landfilling
Landfilling is the primary mechanism for solid waste disposal used by the City. Section
5.3 outlined the City’s disposal activities in detail. The City uses the RVRA Tinker
Creek Transfer Station and Smith Gap landfill. The landfill is projected to have a
remaining life of 50 plus years.
8.0 Goals and Objectives of Program
The following section outlines the goals and objectives for the City’s solid waste
management program over the course of the next 20 years (2017 – 2037). The City
maintains a very progressive solid waste program; a program that offers its customers
weekly collection of trash, bulk, brush and bi-monthly collection of single stream
recycling.
In conjunction with its membership in the Roanoke Valley Resource Authority, and its
affiliation with Recycling Disposal Solutions for the processing of single stream
recycling, along with the collection of bagged leafs in the Fall and Spring with a further
partnership with Rockydale Quarry for the composting of the leaf material. The City
has established one of the most comprehensive and effective integrated solid waste
management programs in the Commonwealth of Virginia.
With the implementation of a single stream recycling program in the fall of 2015, the City
has attained a self-imposed goal, to make the City’s recycling program “second to
none”. The tonnage has virtually doubled, the participation has almost tripled and the
program continues to grow.
8.1 Collections
See Appendix 8.1
8.2 Disposal
See Appendix 8.2
8.3 Recycling
See Appendix 8.3
35
8.4 Leaf Disposal
See Appendix 8.4
9.0 Collection Schedule
See Appendix 8.5
10.0 Funding
The City funds the current solid waste management program primarily through the
General Fund. Some income is brought in through a small fee charged to business and
residents who utilize the sealed compactor program located within the Central Business
District. Impact to the Solid Waste Management budget can come from increases in
tipping fees from both the Roanoke Valley Resource Authority for trash tipping fees. as
well as from the Recycling Disposal Solutions for the recycling tipping fees. The budget
is also impacted by equipment failures, as well as repair costs.
11.0 Public Participation and Final Plan Adoption
The City’s Public Works Department and Solid Waste Division seek input from citizens
when modifying existing programs or developing new programs. The City’s web site is
user friendly and allows contact with the department relative to programming and
information. The City also participates in the Clean Valley Council a significant arm of
the public outreach efforts in the Valley.
Regarding the City’s Solid Waste Management Plan, the City advertised for public
comments on January 5 and January 12, 2017 and held a public hearing on January 17,
2017 in accordance with the City’s protocol. City Council adopted the plan on February
17, 2017. A copy of the advertisement, letter on public hearing, and final resolution are
included in Appendix 11. The City’s SWMP is available to be viewed by clicking a link
on the Solid Waste Management Division’s webpage; www.roanokeva.gov/solidwaste.
The Public Works Department and the Solid Waste Division will be tasked with
implementation of the plan and interface with the public. Annually, the Department will
report to City Council relative to the status of the plan, its programs and potential future
activities.

36
THIS PAGE LEFT BLANK INTENTIONALLY

37
Appendix 1.4
Figure (a)
Figure (b)

38
Appendix 3.2 – Demographic Profile and Population Projections Appendix
3.2 –
Demo
graph
ic
Profil
e and
Popul
ation
Proje
ction
s

39

40
Appendix 3.2 (continued)
Appendix 3.2 (continued)

41
Appendix 3.2 (continued)
City of Roanoke, Virginia
Population Projections
For the period 2017 - 2037
Year Actual Projected Data Source for 2016 projections
2015 99,897 Census
2016 99,286 Projected at .9938837
2017 98,679 Projected at .9938837
2018 98,075 Projected at .9938837
2019 97,475 Projected at .9938837
2020 99,286 US Census Bureau Projection
2021 99,475 Projected at 1.001901
2022 99,664 Projected at 1.001901
2023 99,853 Projected at 1.001901
2024 100,043 Projected at 1.001901
2025 100,233 Projected at 1.001901
2026 100,424 Projected at 1.001901
2027 100,614 Projected at 1.001901
2028 100,806 Projected at 1.001901
2029 100,997 Projected at 1.001901
2030 101,172 US Census Bureau Projection
2031 101,321 Projected at 1.001470
2032 101,470 Projected at 1.001470
2033 101,619 Projected at 1.001470
2034 101,768 Projected at 1.001470
2035 101,918 Projected at 1.001470
2036 102,067 Projected at 1.001470
2037 102,218 Projected at 1.001470

42
Appendix 4A
Year Paper Metal Plastic Glass Tires Batteries Electronics C&M
% 11% 65% 0% 0% 5% 0% 6% 1% 1% 0% 0% 0% 0% 0% 3% 7% 1%
2014 33,938 3,571 22,181 159 0 1,844 0 1,872 193 329 6 28 50 83 0 900 2,382 340
% 2% 28% 0% 0% 7% 0% 4% 0% 0% 0% 0% 0% 0% 0% 0% 57% 0%
2015 64,588 1,297 18,289 211 0 4,589 0 2,310 174 288 2 13 105 7 0 0 37,050 253
2016 49,263 2,434 20,235 185 0 3,216 0 2,091 184 308 4 21 77 45 0 450 19,716 297
2017 49,756 2,458 20,438 187 0 3,249 0 2,112 185 311 4 21 78 45 0 455 19,913 300
2018 50,253 2,483 20,642 189 0 3,281 0 2,133 187 315 4 21 79 46 0 459 20,112 303
2019 50,756 2,508 20,848 191 0 3,314 0 2,154 189 318 4 21 80 46 0 464 20,313 306
2020 51,263 2,533 21,057 192 0 3,347 0 2,176 191 321 4 22 80 47 0 468 20,516 309
2021 51,776 2,558 21,267 194 0 3,380 0 2,198 193 324 4 22 81 47 0 473 20,722 312
2022 52,294 2,584 21,480 196 0 3,414 0 2,219 195 327 4 22 82 48 0 478 20,929 315
2023 52,817 2,610 21,695 198 0 3,448 0 2,242 197 331 5 22 83 48 0 482 21,138 318
2024 53,345 2,636 21,912 200 0 3,483 0 2,264 199 334 5 22 84 48 0 487 21,349 321
2025 53,878 2,662 22,131 202 0 3,518 0 2,287 201 337 5 23 85 49 0 492 21,563 324
2026 54,417 2,689 22,352 204 0 3,553 0 2,310 203 341 5 23 85 49 0 497 21,779 328
2027 54,961 2,716 22,576 206 0 3,588 0 2,333 205 344 5 23 86 50 0 502 21,996 331
2028 55,511 2,743 22,801 208 0 3,624 0 2,356 207 347 5 23 87 50 0 507 22,216 334
2029 56,066 2,770 23,030 210 0 3,661 0 2,380 209 351 5 24 88 51 0 512 22,439 338
2030 56,627 2,798 23,260 213 0 3,697 0 2,403 211 354 5 24 89 51 0 517 22,663 341
2031 57,193 2,826 23,492 215 0 3,734 0 2,427 213 358 5 24 90 52 0 522 22,890 344
2032 57,765 2,854 23,727 217 0 3,771 0 2,452 215 362 5 24 91 53 0 528 23,118 348
2033 58,342 2,883 23,965 219 0 3,809 0 2,476 217 365 5 25 92 53 0 533 23,350 351
2034 58,926 2,912 24,204 221 0 3,847 0 2,501 220 369 5 25 93 54 0 538 23,583 355
2035 59,515 2,941 24,446 223 0 3,886 0 2,526 222 373 5 25 93 54 0 544 23,819 358
2036 60,110 2,970 24,691 226 0 3,925 0 2,551 224 376 5 25 94 55 0 549 24,057 362
2037 60,711 3,000 24,938 228 0 3,964 0 2,577 226 380 5 26 95 55 0 555 24,298 366
1% increase annually
1% increase annually
1% increase annually
Principal Recyclable Materials (PRMs)
Collected and Transferred by Non-City Entities
Reported to VDEQ
1% increase annually
1% increase annually
1% increase annually
1% increase annually
1% increase annually
1% increase annually
1% increase annually
1% increase annually
1% increase annually
1% increase annually
1% increase annually
1% increase annually
1% increase annually
1% increase annually
1% increase annually
1% increase annually
1% increase annually
1% increase annually
Projection Comments
Actual
Actual
Projected as AVG plus 1% increase annually
INOP
MV
Other:
OCC
Other:
Organic
Recycled
Amount
(tons)
Single
Stream
Yard
Waste
Waste
Wood
Used
Oil
Used Oil
Filters
Used
Antifreeze

43
Appendix 4B
TOTAL
Total
Year Bulk Brush Dual CBD
% 36.0% 0.2% 7.1% 2.9% 51.3% 0.6% 4.1% 0.2% 48.7% 53.7%
2016 (Actual) 36,427 186 7,197 2,978 51,805 648.7 4,147 221 49,263 101,068
2017 36,204 188 7,269 3,008 51,736 4,844 223 49,756 101,492
2018 35,983 190 7,342 3,038 51,670 4,892 225 50,253 101,924
2019 36,342 192 7,415 3,069 52,187 4,941 228 50,756 102,943
2020 36,706 194 7,489 3,099 52,709 4,991 230 51,263 103,972
2021 36,776 196 7,564 3,130 52,939 5,040 232 51,776 104,715
2022 36,845 198 7,640 3,162 53,170 5,091 235 52,294 105,464
2023 36,916 200 7,716 3,193 53,404 5,142 237 52,817 106,220
2024 36,986 202 7,793 3,225 53,639 5,193 239 53,345 106,983
2025 37,056 204 7,871 3,257 53,875 5,245 242 53,878 107,754
2026 37,126 206 7,950 3,290 54,114 5,298 244 54,417 108,531
2027 37,197 208 8,029 3,323 54,355 5,351 247 54,961 109,316
2028 37,268 210 8,110 3,356 54,597 5,404 249 55,511 110,108
2029 37,339 212 8,191 3,390 54,841 5,458 252 56,066 110,907
2030 37,712 214 8,273 3,424 55,389 5,513 254 56,627 112,016
2031 37,767 216 8,355 3,458 55,622 5,568 257 57,193 112,814
2032 37,823 219 8,439 3,492 55,856 5,623 259 57,765 113,620
2033 37,879 221 8,523 3,527 56,092 5,680 262 58,342 114,434
2034 37,934 223 8,609 3,563 56,329 5,737 264 58,926 115,255
2035 37,990 225 8,695 3,598 56,569 5,794 267 59,515 116,084
2036 38,046 227 8,782 3,634 56,811 5,852 270 60,110 116,921
2037 38,102 230 8,869 3,671 57,054 5,910 272 60,711 117,766
Projected
PRM
Reported to
VDEQ
City of Roanoke, Virginia
Waste Generation Projections - By Material Type
For the Period 2017 - 2037
Refuse
Collected
Central
Business
District
Trash
Collected
by City
Single
Stream
Trash Recycling
Waste
Generation
Projections
(tons)
Trash collected in the City by the City is depicted in the gray area above. Recycling collected in the City
by the City is displayed in the first 3 green columns above. The projected decrease/increase in trash is
based upon USCB population projections (see Appendix 3B). Principal Recyclable Materials (PRM’s)
generated within the SWPU and recycled are reported to VDEQ are recorded as well. Projected total
waste generation is the sum of trash collected by the City and the projected PRM’s reported to VDEQ.
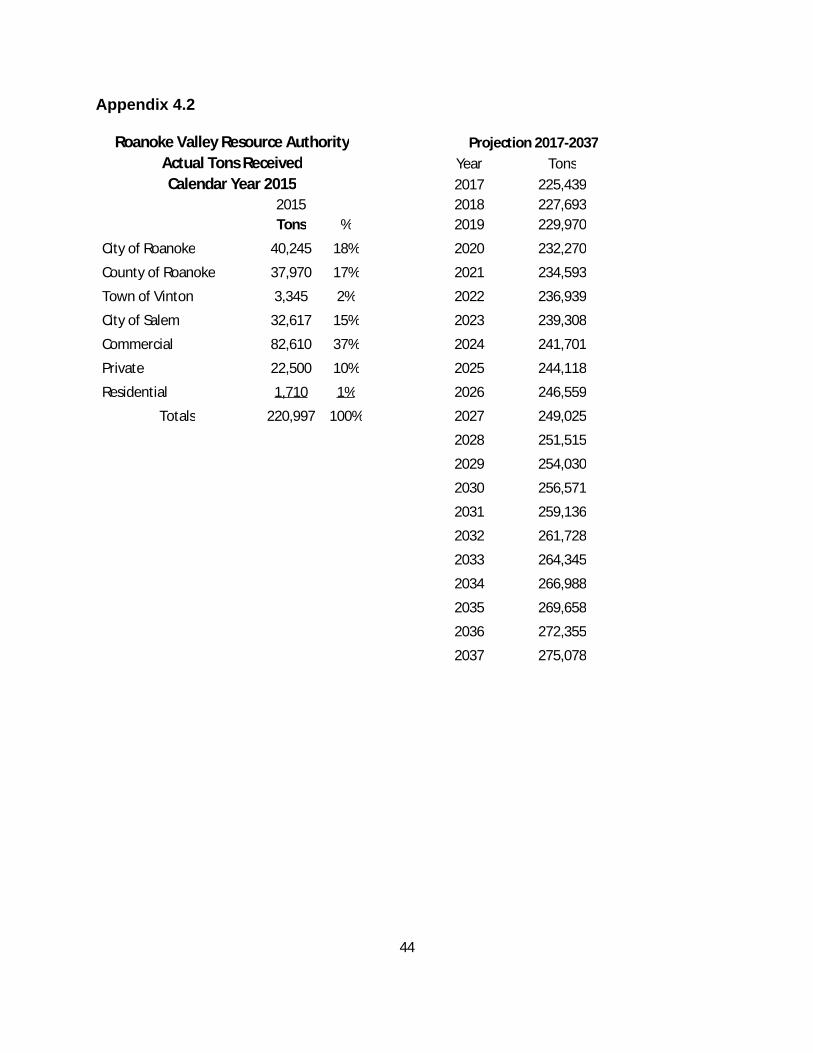
44
Appendix 4.2
Roanoke Valley Resource Authority Projection 2017-2037
Actual Tons Received Year Tons
Calendar Year 2015 2017 225,439
2015 2018 227,693
Tons % 2019 229,970
City of Roanoke 40,245 18% 2020 232,270
County of Roanoke 37,970 17% 2021 234,593
Town of Vinton 3,345 2% 2022 236,939
City of Salem 32,617 15% 2023 239,308
Commercial 82,610 37% 2024 241,701
Private 22,500 10% 2025 244,118
Residential 1,710 1% 2026 246,559
Totals 220,997 100% 2027 249,025
2028 251,515
2029 254,030
2030 256,571
2031 259,136
2032 261,728
2033 264,345
2034 266,988
2035 269,658
2036 272,355
2037 275,078

45
Appendix 5.3.1

46
Appendix 5.3.1 (continued)

47
Appendix 5.3.1 (Continued)

48
Appendix 5.3.1 (continued)

49
Appendix 5.3.1 (continued)

50
Appendix 5.3.1 (continued)

51
Appendix 5.3.1 (continued)

52
Appendix 5.3.1.3 – Smith Gap Landfill 8484 Bradshaw Road, Salem VA

53
Appendix 5.3.1.5 – RVRA Waste Disposal Fees and Charges

54
Appendix 5.3.3.2

55
Appendix 5.3.3.2 (continued)

56
Appendix 5.3.3.2 (continued)

57
Appendix 5.3.3.2 (continued)

58
Appendix 5.3.3.2 (continued)

59

60
Appendix 5.3.3.2 (continued)
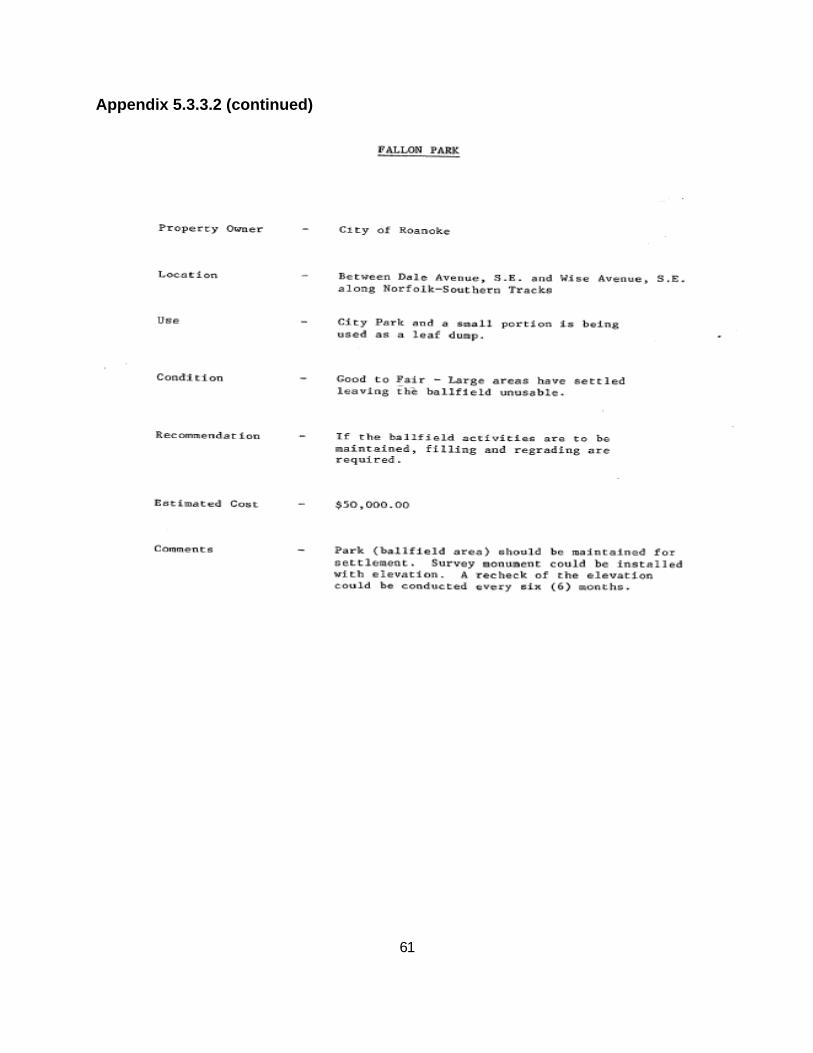
61
Appendix 5.3.3.2 (continued)
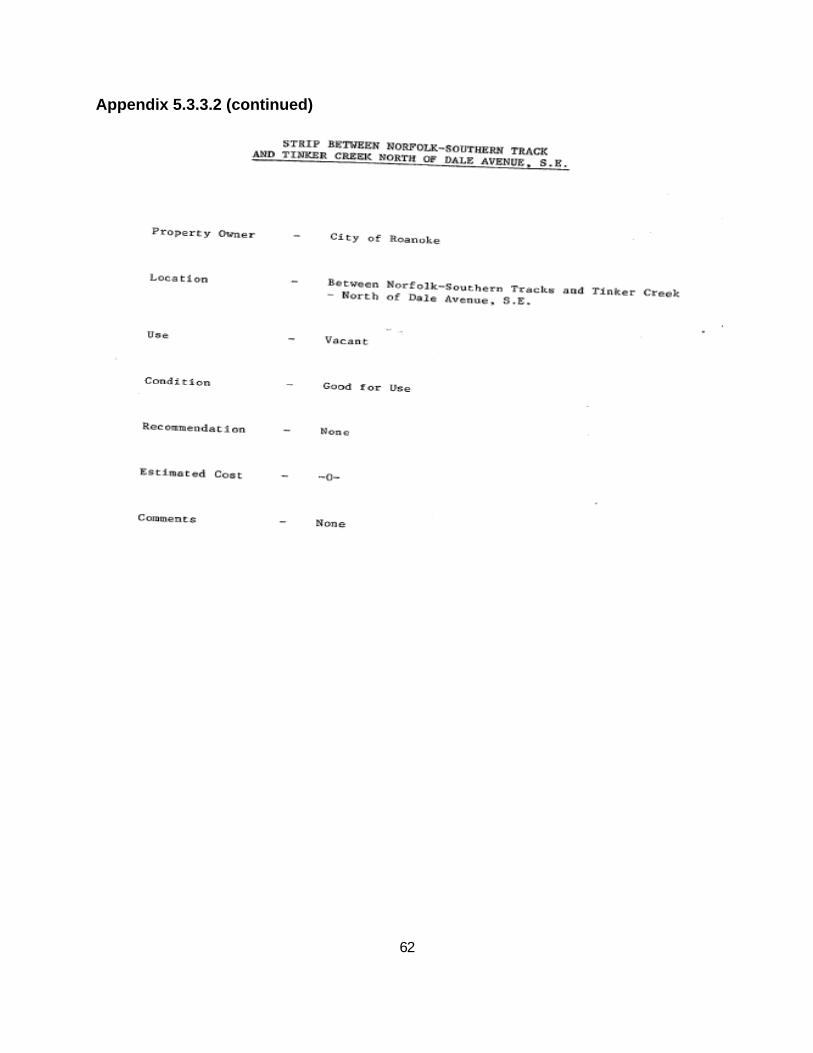
62
Appendix 5.3.3.2 (continued)

63
Appendix 5.3.3.2 (continued)
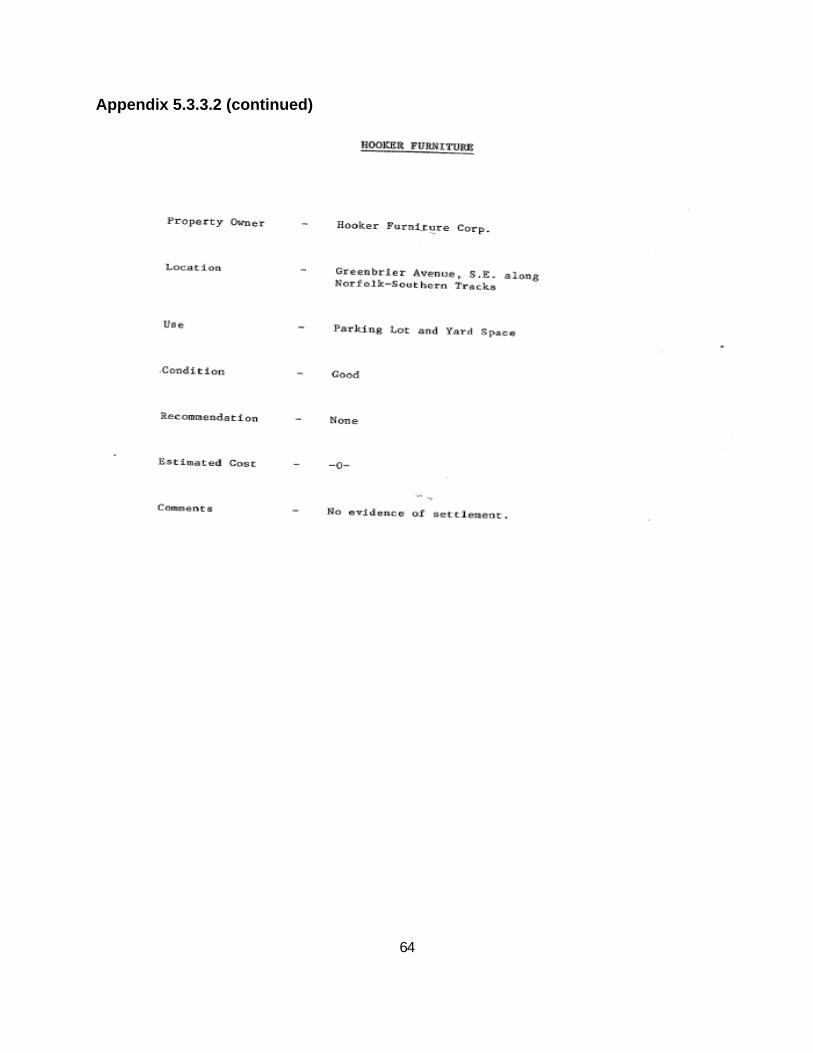
64
Appendix 5.3.3.2 (continued)

65
Appendix 5.3.3.2 (continued)

66
Appendix 5.3.3.2 (continued)

67
Appendix 5.3.3.2 (continued)

68
Appendix 5.4.8 – Annual DEQ Report

69
Appendix 5.4.8 (continued)

70
Appendix 5.4.8 (continued)

71
Appendix 5.4.8 (continued)
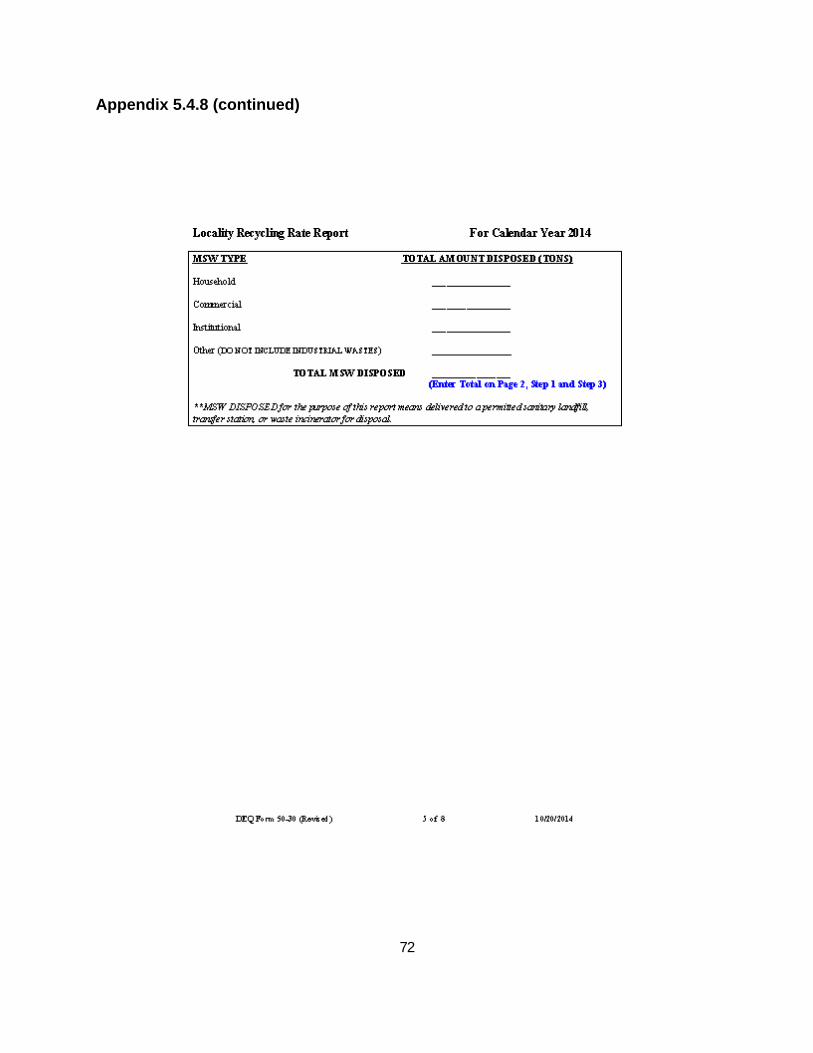
72
Appendix 5.4.8 (continued)

73
Appendix 5.4.8 (continued)

74
Appendix 5.4.8 (continued)

75
Appendix 5.4.8 (continued)

76
Appendix 5.4.8 (continued)
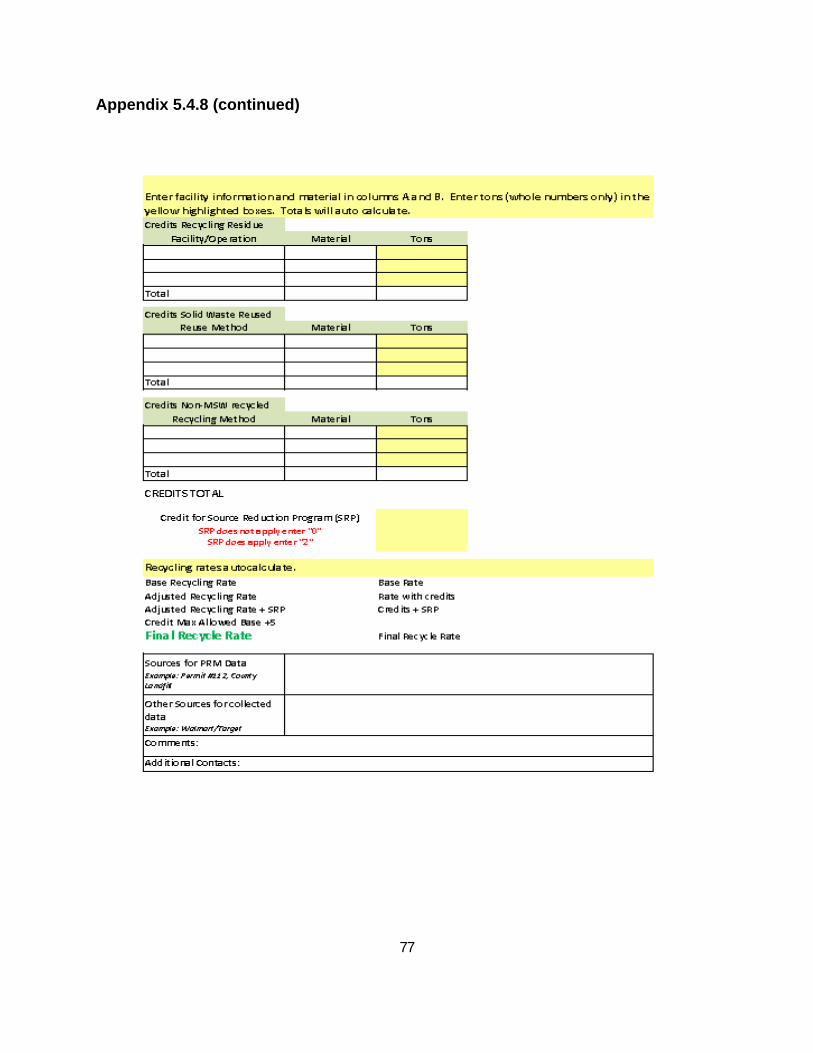
77
Appendix 5.4.8 (continued)

78
Appendix 5.6.3 Sample Brochures and Calendars
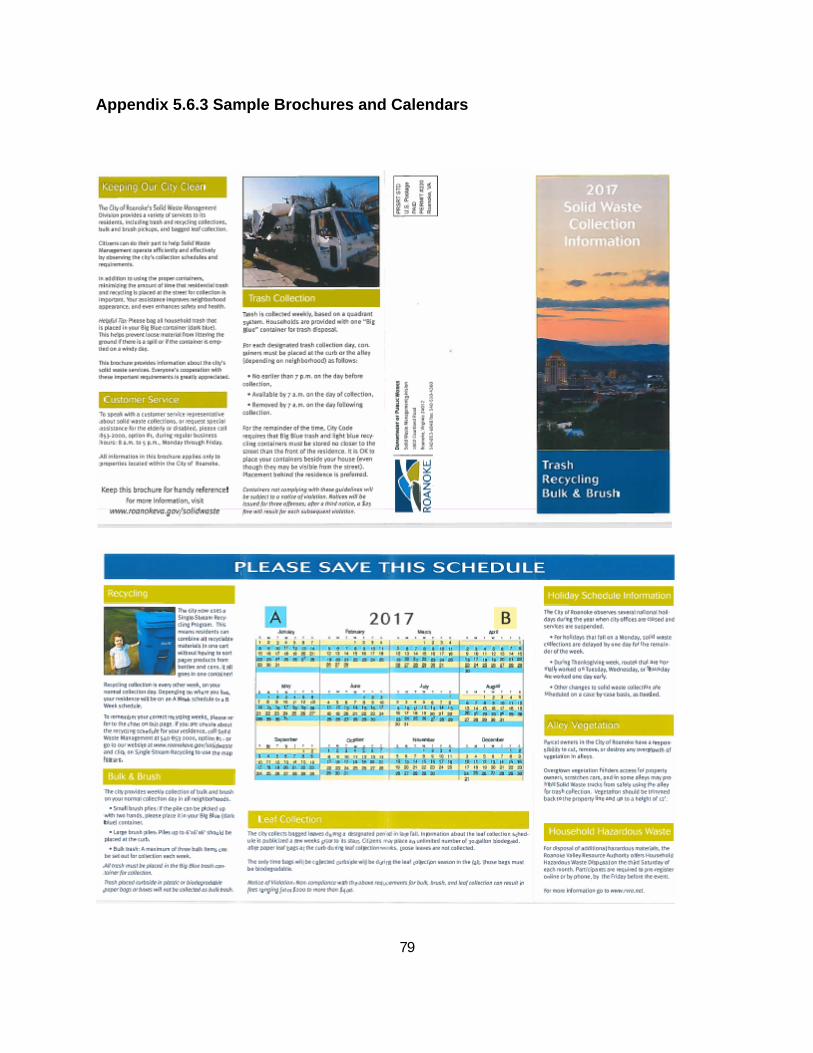
79
Appendix 5.6.3 Sample Brochures and Calendars

80
Appendix 5.6.7 Performance Monitor

81
Appendix 8.1
ITEM 2017 GOAL ACTION ITEM SCHEDULE ESTIMATED COST
C-1
Increase curbside
collection
percentages
Continue to look for
opportunities to replace alley
with curbside collection On-Going Included in budget
C-2
Unique and
innovative
collection solutions
for the CBD area
Continue to listen to our
customers needs. Be
proactive in forming solution
concepts. On-Going Included in budget
C-3 Litter prevention
Expand the Big Belly solar
compactor program On-Going
Big Belly solar compactors
are purchased with CIP funds
TABLE 1
COLLECTION SYSTEM
GOALS AND ACTION ITEMS
Appendix 8.2
ITEM 2017 GOAL ACTION ITEM SCHEDULE ESTIMATED COST
D-1
Reduce trash
tonnages
transferred to the
RVRA
Promote and encourage
recycling options. Educate
citizenry on the benefits of
recycling. On-Going
The City's Sustainability and
Outreach Coordinator has
funds allocated to education,
marketing, and outreach
D-2 Mandated recycling
Communicate with politicians
in support of legislature that
mandates recycling As needed N/A
GOALS AND ACTION ITEMS
TABLE 2
DISPOSAL SYSTEM
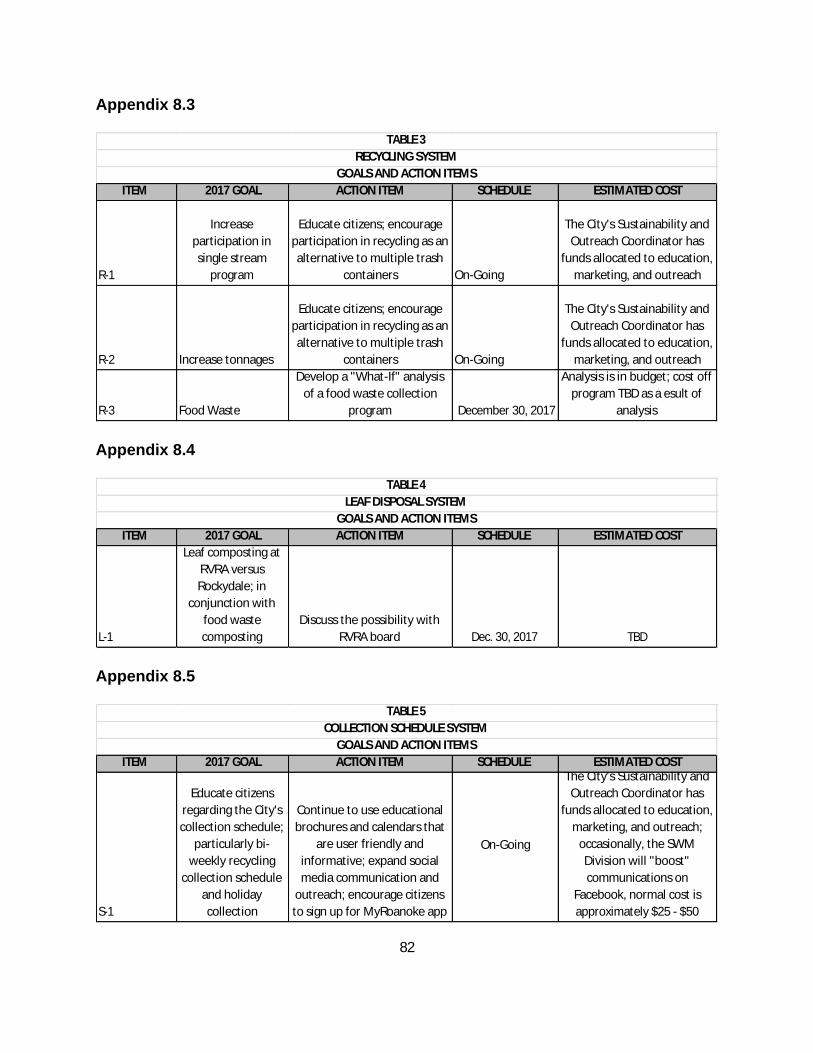
82
Appendix 8.3
ITEM 2017 GOAL ACTION ITEM SCHEDULE ESTIMATED COST
R-1
Increase
participation in
single stream
program
Educate citizens; encourage
participation in recycling as an
alternative to multiple trash
containers On-Going
The City's Sustainability and
Outreach Coordinator has
funds allocated to education,
marketing, and outreach
R-2 Increase tonnages
Educate citizens; encourage
participation in recycling as an
alternative to multiple trash
containers On-Going
The City's Sustainability and
Outreach Coordinator has
funds allocated to education,
marketing, and outreach
R-3 Food Waste
Develop a "What-If" analysis
of a food waste collection
program December 30, 2017
Analysis is in budget; cost off
program TBD as a esult of
analysis
TABLE 3
RECYCLING SYSTEM
GOALS AND ACTION ITEMS
Appendix 8.4
ITEM 2017 GOAL ACTION ITEM SCHEDULE ESTIMATED COST
L-1
Leaf composting at
RVRA versus
Rockydale; in
conjunction with
food waste
composting
Discuss the possibility with
RVRA board Dec. 30, 2017 TBD
TABLE 4
LEAF DISPOSAL SYSTEM
GOALS AND ACTION ITEMS
Appendix 8.5
ITEM 2017 GOAL ACTION ITEM SCHEDULE ESTIMATED COST
S-1
Educate citizens
regarding the City's
collection schedule;
particularly bi-
weekly recycling
collection schedule
and holiday
collection
Continue to use educational
brochures and calendars that
are user friendly and
informative; expand social
media communication and
outreach; encourage citizens
to sign up for MyRoanoke app
On-Going
The City's Sustainability and
Outreach Coordinator has
funds allocated to education,
marketing, and outreach;
occasionally, the SWM
Division will "boost"
communications on
Facebook, normal cost is
approximately $25 - $50
TABLE 5
COLLECTION SCHEDULE SYSTEM
GOALS AND ACTION ITEMS

83
Appendix 11 – Notice of Public Hearing
NOTICE OF PUBLIC HEARING
CITY OF ROANOKE
SOLID WASTE MANAGEMENT PLAN
Notice is hereby given that the Council of the City of Roanoke will hold a Public Hearing on Tuesday,
January 17, 2017, at 7:00 p.m., or as soon thereafter as the matter may be heard, in the Council
Chamber in the Noel C. Taylor Municipal Building, 215 Church Avenue, S.W., Roanoke, Virginia, for the
purpose of receiving comments on the City’s proposed Solid Waste Management Plan. All persons shall
be afforded an opportunity to speak and state their views concerning all aspects of the Solid Waste
Management Plan within such reasonable time limits as shall be established by City Council. Persons
desiring to speak on behalf of others must have their names placed on the agenda in accordance with
regular procedures of the Roanoke City Council. Written comments of interested persons will be
received by the City Clerk at any time prior to the hearing.
The purpose of the Solid Waste Management Plan is to address source reduction, reuse, recycling,
resource recovery (waste-to-energy), incineration and landfilling of residential, commercial, and
industrial solid waste generated within the City of Roanoke. Public participation in the development of
the Solid Waste Management Plan is required by 9VAC20-130-130, Public Participation, of Chapter 130,
Solid Waste Planning and Recycling Regulations, of the Virginia Administrative Code (1990), as amended.
Complete copies of the proposed Solid Waste Management Plan are available for public inspection in
the Office of the City Clerk, Room 456, Municipal Building, 215 Church Avenue, S.W. Comments will be
accepted in writing through January 13, 2017, at the Solid Waste Management Department, 1802
Courtland Road, N.W., Roanoke, Virginia 24012.
Citizens who desire to speak at the meeting should contact the City Clerk’s office at (540) 853-2541.
Individuals with a disability needing an accommodation should contact the City Clerk’s office by Friday,
January 13, 2017. For further information about the meeting or to comment on or inquire about the
proposed Solid Waste Management Plan, contact the Solid Waste Management Department at (540)
853-2448.
Given under my hand this __23____ day of ___December____, 2016.
Stephanie M. Moon Reynolds
City Clerk.
84
Appendix 11 – City Council Resolution
85

86