solid strategy, confident execution lehman brothers 2003 high yield conference march 21, 2003 kevin...
Post on 21-Dec-2015
216 views
TRANSCRIPT

Solid Strategy, Confident Execution
Lehman Brothers 2003 High Yield Conference
March 21, 2003
Kevin DeNicolaSenior Vice President and CFO

2
Safe Harbor Language
Statements in this presentation relating to matters that are not historical facts are forward-looking statements. These forward-looking statements are just predictions or expectations and are subject to risks and uncertainties. Actual results could differ materially, based on factors including but not limited to the cyclical nature of the chemical and refining industries; availability, cost and volatility of raw materials and utilities; governmental regulatory actions and political unrest; global economic conditions; industry production capacity and operating rates; the supply/demand balance for Lyondell's and its joint ventures' products; competitive products and pricing pressures; access to capital markets; and technological developments and other risk factors. For more detailed information about the factors that could cause our actual results to differ materially, please refer to Lyondell Chemical Company’s Annual Report on Form 10-K for the year ended December 31, 2002, filed in March 2003.

3
Lyondell Has Built a Balanced Portfolio
Lyondell
IC&D
LCR
Equistar
Commodity Leverage-- A leading North American producer of ethylene, propylene
and polyethylene-- Low cost position based on feedstock flexibility and scale
Stability & Growth-- A leading global producer of PO and derivatives-- Process technology strength
Cash Generation-- Unique capability to refine heavy crude oils-- Contractually stable business; strong cash flow generator
($ MM)
Revenues EBITDALyondell
OwnershipIC&D $3,262 $410 100.0%Equistar 5,537 256 70.5LCR 3,392 362 58.75
2002

4
The Recent Years Have Been a Period of Optimization
Mid 1990’s
Formation years
LCR Contract and JV
Equistar JV
IC&D Acquisition
1999-2002Position and Optimize
Portfolio Adjustments
Capacity Rationalization
Project Reorientation
Organization Effectiveness– Best practices
– Organization design

5
0102030405060708090
1998 2002
Lyondell Equistar
0
30
60
90
120
150
180
Lyondell Equistar PO11 Spending
Processes and Systems Have Steadily Improved the Capital Utilization Within the Enterprise
$MM
1999 2002
Capital Spending Days of Working Capital*
* Based on accounts receivable (including those sold), inventories and accounts payable as of 12/31, and fourth-quarter days of sales

6
A Snapshot of Operating Metrics Highlights the Success
0
10
20
30
40
50
60
70
80
90
LYO/EQU EQU LYO/EQU Polymers
Safety Downtime Environment Quality
% Improvement*
* 1998 to 2002

7
A Brief Portfolio Review
IC&D
LCR
Equistar

8
Our Propylene Oxide and Derivatives Business (IC&D) Benefits from a Strong Position
PG33%
Merchant PO33%
Deicer6%
P-Solvents10%
BDO18%
Bayer45%
ProductCapacityPosition
MarketGrowth
Merchant PO 1
PG 1 Moderate
BDO 2 High
P-Solvents 2 Low
Deicers 1 Low
PO 4-5%/yr
Lyondell55%
Lyondell PO Capacity
Source: LYO databook and SRI Post PO-11 Project

9
PO Technology Development
H2
OxidationOxygen
PropylenePropylene Oxide
H2O
Peroxidation
Direct PO
EB
IC4
H2
Oxygen
Oxidation
Propylene
Epoxidation
H2O
Styrene
MTBE
Propylene Oxide
Cumene Cumene
Chlorohydrin
Electricity
SaltChlor-Alkali Chlorohydrin
Propylene
PO

10
LCR Important Cash Generator
Operating Reliability and Crude Deliveries Drive Performance
1 4Q01: Scheduled maintenance turnaround
0
50
100
150
200
250
300
1Q00 2Q00 3Q00 4Q00 1Q01 2Q01 3Q01 4Q01 1Q02 2Q02 3Q02 Q402
0
20
40
60
80
100
120
140CSA Spot Mkt EBITDA
MB/day $MM
1

11
Refining Spreads Have Increased By $4-5/Bbl
$0.0
$2.0
$4.0
$6.0
$8.0
$10.0
$12.0
3/2/
1 R
efin
ing
Sp
read
($/
Bb
l)
WTI Crude Oil Refining Margin
Source: Platt’s

12
Equistar is a Leading Ethylene Producer
#2 in North America
Competitive position based on feedstock flexibility
1991 2002
Top 5 North America
Shell9%
Dow9%
Equistar15%Nova
8%
Union Carbide7%
Exxon7%
Dow/Carbide20%
ExxonMobil13%
ChevronPhillips10%
Nova 8%
40%
66%
Source: CMAI

13
$0
$500
$1,000
$1,500
$2,000
$2,500
$3,000
2002 1995 Margins¹ 1988 Margins¹
LCR IC&D Equistar
Significant Cash and Earnings Generation in Up-Cycle
Cycle EBITDA Potential
1 1988/1995 Chem Data/CMAI margins for Ethylene, Polyethylene and Styrene applied to current capacities and ownership Note: Assumes current capital structure; 160MM shares
($MM)
$6.20/share
$1.35/share

14
Equistar Capability
NGL
37%
Liquid
63%
N. American Industry
(ex. Equistar)
NGL
78%
Liquid
22%
Liquid Cracking Provides an Advantage
Source: CMAI and Lyondell.
Ethane - Light Naphtha Cost of Ethylene Spread
0
1
2
3
4
5
6
7
1987
1988
1989
1990
1991
1992
1993
1994
1995
1996
1997
1998
1999
2000
2001
2002
¢/lb
eth
yle
ne Average
Liquid Cracking Variable Cost Advantage
Source: ChemData,

15
The Oil/Gas Price Ratio has Moved in FavorThe Oil/Gas Price Ratio has Moved in Favorof Liquid Feedstockof Liquid Feedstock
0
5
10
15
02-Jan 02-Apr 02-Jul 02-Oct 03-Jan 03-Feb 03-Mar
Oil/
Ga
s
Oil/Gas Ratio
Energy Value Parity
CMAI -3/03
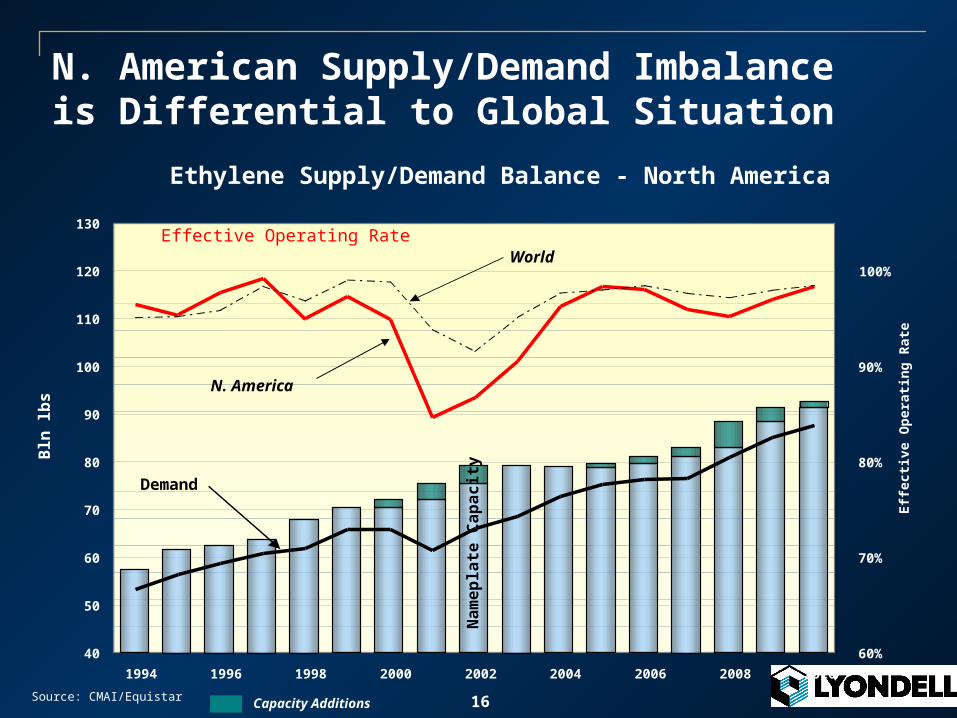
16
Ethylene Supply/Demand Balance - North America
40
50
60
70
80
90
100
110
120
130
1994 1996 1998 2000 2002 2004 2006 2008 2010
Bln
lb
s
60%
70%
80%
90%
100%
Eff
ecti
ve O
per
atin
g R
ate
Na
me
pla
te C
ap
ac
ity
Effective Operating Rate
Source: CMAI/Equistar
Demand
World
N. American Supply/Demand Imbalance is Differential to Global Situation
N. America
Capacity Additions

17
Effective Ethylene Operating Rates Move Effective Ethylene Operating Rates Move Toward 95% Early in 2003Toward 95% Early in 2003
U.S. Ethylene Supply/Demand
Quarterly - 2002 > 2004
CMAI-2/03
2002 20032002 2003
12000
14000
16000
18000
20000
Q1 Q2 Q3 Q4 Q1 Q2 Q3 Q4 2004QtrlyAvg
Millio
ns
Ca
pa
cit
y L
bs
70
75
80
85
90
95
100
Op
era
tin
g R
ate
, %
Effective Capacity Downtime Operating Rate

18
0
5
10
15
20
25
30
35
40
02-Jan 02-Apr 02-Jul 02-Oct 03-Jan 03-Feb 03-Mar
$/B
l
0
1
2
3
4
5
6
7
8
9
10
$/M
n B
tu
Ethylene Cash CostNat Gas ($/MM BTU)WTI ($/Bbl)
CMAI -3/03
As Energy Rose Ethylene Cash Cost As Energy Rose Ethylene Cash Cost Increased AccordinglyIncreased Accordingly

19
Market Prices Have Increased in Recent Months
Price Increases
Jan. Feb.
EQUISTAR
Ethylene 2.25 ¢/lb 1.75 ¢/lb
Propylene 2.0 ¢/lb 2.0 ¢/lb
Polyethylene 2.5 ¢/lb 2.5 ¢/lb
MEG 2.0 ¢/lb 4.5 ¢/lb
LYONDELL
Styrene 2.0 ¢/lb 5.5 ¢/lb

20
Typically It Has Taken Time to Move These Increases Through The Supply Chain: $3 Bbl Impact At Equistar
(30)
(20)
(10)
0
EB
ITD
A I
mp
act
( $
MM
/mo
)
Hours Days Weeks Months
Naphtha Impact
NGLs Follow
Petro -chemicals
Rise
FuelCo-Products
Rise
Polymers/ Derivatives
Rise

21
Our Financial Strategy is Unchanged
Maintain Sufficient Liquidity
Repay Debt

22
We Have Maintained Significant Liquidity
Lyondell Equistar
Cash & ST Investments* $330MM $27MM
Revolver* $350MM $450MM
Total Liquidity $680MM $477MM
1 1
1 – does not include 12/31 amounts committed against letters of credit : (LYO-$49MM, Equ-$16MM) * As of 12/31/2002

23
1 Capitalization = debt + book value of equity + minority interest
De-leveraging Will Benefit All Stakeholders
Impact of Lyondell debt reduction at constant capitalization1:
Debt Reduction
$1B $2B
Debt to capitalization 54% 36%
Avoided interest expense $100MM/Yr $200MM/Yr
Earnings improvement 40¢/share 80¢/share
Share price improvement atconstant capitalization $6/share $12/share
