solid state lidar for ubiquitous 3d sensingon-demand.gputechconf.com/gtc/2016/presentation/s... ·...
TRANSCRIPT
© 2016 Quanergy Systems, Inc.
Solid State LiDAR for Ubiquitous 3D Sensing
Louay Eldada, Ph.D. CEO, Co-founder
Quanergy Systems
April 6, 2016

2 © 2016 Quanergy Systems, Inc.
• Disruptive Technologies: – Solid State 3D LiDAR sensors – Embedded processors (GPU) – Inertial Measurement Units (IMU)
New Paradigm in 3D Sensing
• Advanced Systems: – Autonomous Vehicles – Smart Homes, Smart Security – Robots, Drones, 3D-Aware Devices
• Smart Solutions: – Daily-updated cm-accurate Global 3D Map – GPS-free Navigation through SLAM – Smart IoT
3 © 2016 Quanergy Systems, Inc.
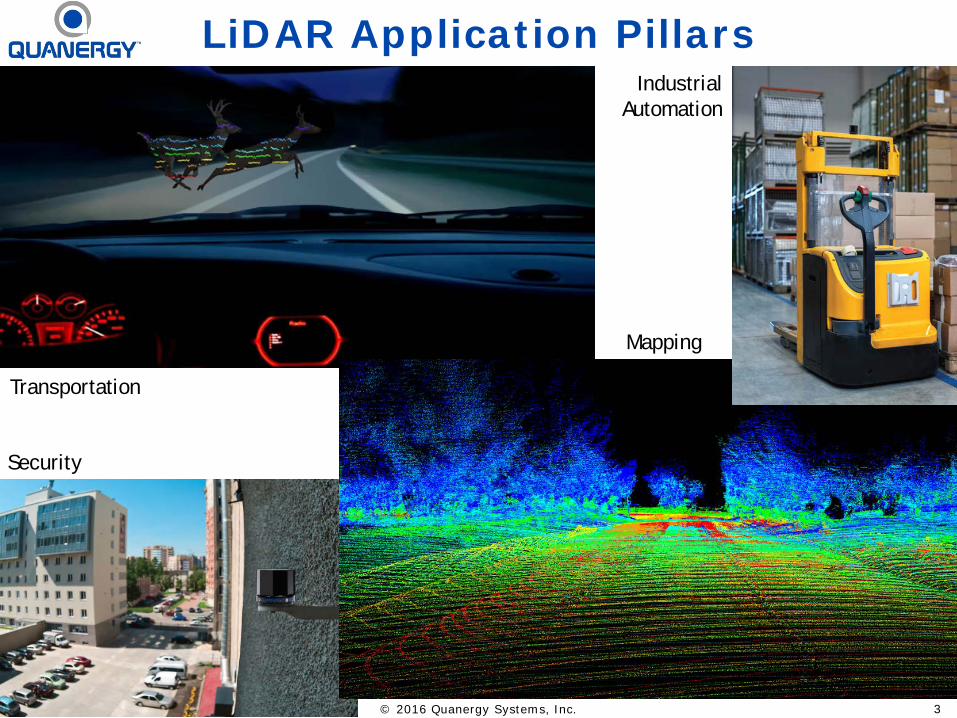
LiDAR Application Pillars
Transportation
Industrial Automation
Mapping
Security

4 © 2016 Quanergy Systems, Inc.
Some LiDAR Applications
3D Mapping & Navigation Safe & Autonomous Vehicles Fleets
Industrial (Mining, Logistics, etc.) Smart Homes 3D-Aware Smart Devices
3D LiDAR sensors enable safety and efficiency in areas unserved due to:
(1) COST (2) PERFORMANCE (3) RELIABILITY (4) SIZE (5) WEIGHT (6) POWER
Terrestrial & Aerial Robotics Smart Cities
5 © 2016 Quanergy Systems, Inc.
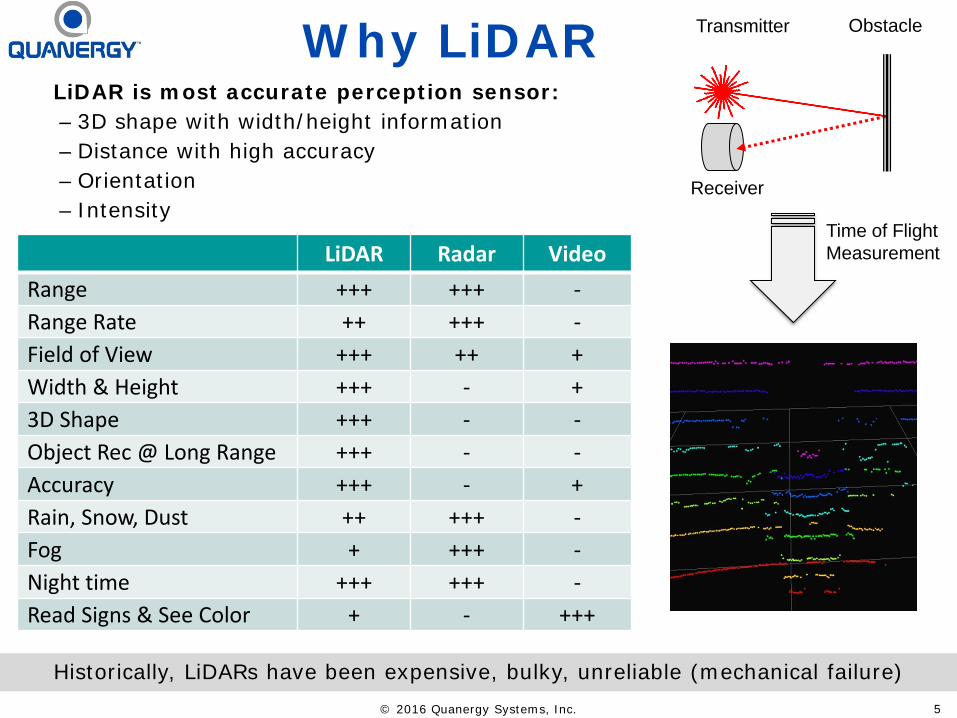
Why LiDAR LiDAR is most accurate perception sensor: – 3D shape with width/height information – Distance with high accuracy – Orientation – Intensity
Transmitter
Receiver
Obstacle
Time of Flight Measurement LiDAR Radar Video
Range +++ +++ - Range Rate ++ +++ - Field of View +++ ++ + Width & Height +++ - + 3D Shape +++ - - Object Rec @ Long Range +++ - - Accuracy +++ - + Rain, Snow, Dust ++ +++ - Fog + +++ - Night time +++ +++ - Read Signs & See Color + - +++
Historically, LiDARs have been expensive, bulky, unreliable (mechanical failure)

6 © 2016 Quanergy Systems, Inc.
Quanergy vs. Traditional LiDAR
Traditional Solution Expensive, Large, Heavy, High Power, Low Performance, Low Reliability, Mechanical LiDAR
Quanergy Solution Low Cost, Compact, Lightweight,
Low Power, High Performance, High Reliability, Solid State LiDAR

7 © 2016 Quanergy Systems, Inc.
Quanergy LiDAR Roadmap
Gen 1 Mechanical (Mark VIII – M8)
Gen 2 Solid State
(S3 MCM)
Gen 3 Solid State
(S3 ASIC)
Volume Pricing: Gen 1: <$1,000 Gen 2: <$250 Gen 3: <$100
All Solid State

8 © 2016 Quanergy Systems, Inc.
Quanergy LiDARs Designs focus simultaneously on cost, performance, reliability, size, weight, power consumption Gen 1: Mechanical LiDAR (M8) Gen 2 & 3: Solid State LiDAR (S3)
8 Patents Pending 15 Patents in preparation
covering Gen 1, 2 & 3

9 © 2016 Quanergy Systems, Inc.
Quanergy S3 LiDAR 60
mm

10 © 2016 Quanergy Systems, Inc.
S3 Operation Principle
Overlaid far-field patterns for various steering angles
Transmitter OPA (Optical Phased Array) Photonic IC with far field radiation pattern (laser spot)
OPA
Far Field Spot

11 © 2016 Quanergy Systems, Inc.
OPA Operation Principle
• OPA stands for Optical Phased Array
• Optical analog of Phased Array Radar
• An optical phased array has multiple optical antenna elements that are fed equal-intensity coherent signals
• Variable phase control is used at each element to generate a far-field radiation pattern and point it in a desired direction
1xN Splitter
Phase Shifters
Laser

12 © 2016 Quanergy Systems, Inc.
S3 Unique Capabilities Software-controlled in real time:
• Adjustable window within total available field of view
• Arbitrary distribution of points in point cloud; point density within a frame not necessarily uniform (e.g., denser distribution around horizon in vehicle)
• Random access for maximum SNR at receiver
• Largest VFOV (matches 120 HFOV)
• Zoom in & out for coarse & fine view
• Adjustable frame rate based on situation analysis
• Directional range enhancement based on location in pre-existing map (e.g., maximum forward range on highway, maximum sideways range at intersection)

13 © 2016 Quanergy Systems, Inc.
Today’s ADAS Use Various Sensors
Lane Keeping
Adaptive Cruise Control & Traffic Jam Assist
Parking Assist
Cross Traffic Alert & Intersection Collision Avoidance
Front/Rear Collision Avoidance
Blind Spot Detection
Object Detection, Tracking, Classification
Scene Capture & Accident Reconstruction
Autonomous Emergency Braking & Emergency Steer Assist

14 © 2016 Quanergy Systems, Inc.
Autonomous Vehicle Sensors
Quanergy

15 © 2016 Quanergy Systems, Inc.
Autonomous Car Sensing Systems
Video Perception
for Semi Autonomy
Mechanical LiDAR Perception
for Autonomy
Solid State LiDAR Perception
for Autonomy
8 video cameras 2 LiDARs 2 LiDARs with video
6 radars 8 video cameras 2 radars
12 U/S sensors 6 radars
12 U/S sensors
Total: 26 sensors Total: 28 sensors Total: 4 sensors
ASP: $4,000 ASP: $6,000-$20,000 ASP: $1,000
• LiDAR only acceptable sensor for object detection in autonomous cars operating in all environments, including urban areas with pedestrians (not just highways)
• Sensors that detect and help avoid collision with 99% of objects (pedestrians, cyclists, vehicles, etc.) are unacceptable in fully autonomous cars – goal: 10 9’s
• When LiDARs are mission critical, as in autonomous cars, they cannot have moving parts and replace sensors in today’s sensing suite; must be solid state

16 © 2016 Quanergy Systems, Inc.
S3 LiDAR – Launched at CES 2016 • Two S3 LiDARs installed in grill of Mercedes-
Benz GLE450 AMG Coupe (Daimler gift) • Sensors invisible behind IR-transparent fascia
(built by Delphi) • Pedestrians in front of vehicle detected and
point cloud displayed in real time

17 © 2016 Quanergy Systems, Inc.
Tegra X1 Based Automotive System
• Real-time object detection, tracking and classification is important in ADAS and critical in Autonomous Vehicles
• Tegra X1 (256-core Maxwell GPU, 8-core 64-bit CPU) is preferred processor for neural network deep learning in 3D sensing applications. GPU parallel cores are leveraged to: – Rapidly train neural networks using large training sets – Perform classification and prediction on trained sensors
Tegra X1

18 © 2016 Quanergy Systems, Inc.
Nvidia DRIVE PX for AV • An autonomous vehicle (AV) needs to know its location accurately, recognize objects
around it, and continuously calculate the optimal path for a safe driving experience
• The situational and contextual awareness of the car and its surroundings demands a powerful computing system such as DRIVE PX that can merge data from LiDARS, cameras, other sensors, and navigation sources, while figuring out the safest path in real-time
• DRIVE PX combines deep learning, sensor fusion, scenario analysis, decision making, and triggering action
• DRIVE PX enables self-driving applications to be developed faster and more accurately
• Key features of the platform include: – Dual NVIDIA Tegra® X1 processors deliver a combined 2.3 TFLOPS – Interfaces for up to 12 cameras, radar, lidar, and ultrasonic sensors – Rich middleware for graphics, computer vision, and deep learning – Periodic software/OS updates

19 © 2016 Quanergy Systems, Inc.
DRIVE PX 2
Nvidia’s DRIVE PX 2 Module: up to 8 TFLOPS

20 © 2016 Quanergy Systems, Inc.
Autonomous Driving Based on Deep Learning Vehicle Configuration
● 4 Quanergy LiDARs on 4 corners of vehicle 480,000 samples/sec per LiDAR (frame rate 1-1000 frames/sec in S3) 1,920,000 samples/sec for 4 LiDARs
● 4 surround view video cameras on 4 corners of vehicle, soon to be integrated with LiDAR 240,000 points/sec per camera (8,000 points/frame, 30 frames/sec) 960,000 points/sec for 4 cameras
● GPS with 2-3 m positioning accuracy
● IMU (Inertial Measurement Unit) includes accelerometer and gyroscope
● Car sensors: speed of wheels, turning angles of wheels, etc.

21 © 2016 Quanergy Systems, Inc.
Autonomous Driving Based on Deep Learning Perception Pipeline
1. Vehicle LiDAR Raw Input Corrected point cloud using IMU, and video frames
2. Occupancy Map Created using LiDAR-video sensor fusion, probabilistic map informs which voxels are likely occupied
3. Object Detection – Occupancy Grid Detection and Tracking Run LiDAR and video output into a neural network that was trained to recognize and classify objects (cars, bikes, pedestrians, etc.)
4. Localization Determine position by registering within a pre-existing HD map, localize in a lane: use GPS, place car in lane, compensate for errors of GPS (GPS accuracy: several meters, accuracy needed: several cm)
5. Path Planning Run algorithms to perform path/motion planning, taking into consideration car kinematics, decide whether to stay in lane or switch lanes
6. Navigation After intensive computation, if decision is to take action, actuation in near-real time of vehicle controls to ensure safety and comfort

22 © 2016 Quanergy Systems, Inc.
Global Positioning of Point Clouds
Nvidia data collected with Quanergy LiDAR sensors
Vehicle LiDAR Raw Data

23 © 2016 Quanergy Systems, Inc.
Global Positioning of Point Clouds
Nvidia data collected with Quanergy LiDAR sensors
Object Detection – Occupancy Grid Detection and Tracking

24 © 2016 Quanergy Systems, Inc.
Global Positioning of Point Clouds
Nvidia data collected with Quanergy LiDAR sensors
Path Planning

25 © 2016 Quanergy Systems, Inc.
LiDAR-Video Fusion & Deep Learning CES 2016 nVidia Booth
Robotics Trends | All You Need to Know About Self-Driving Cars from CES By Brad Templeton, Autonomous Vehicle Expert – January 12, 2016 An Nvidia demo in pedestrian detection combined a Quanergy LIDAR and Nvidia cameras. In the demo, they had water jets able to simulate rain, in which case it was the vision that failed and the LIDAR which kept detecting the pedestrians. Quanergy’s LIDAR looks at the returns from objects and is able to tell returns from raindrops (which are more dispersed) from returns off of solid objects.

26 © 2016 Quanergy Systems, Inc.
3D Composite Point Cloud
Color Coding: Height

27 © 2016 Quanergy Systems, Inc.
Color Coding: Height
3D Composite Point Cloud

28 © 2016 Quanergy Systems, Inc.
3D Composite Point Cloud
Color Coding: Reflectivity (Intensity vs. Distance)

29 © 2016 Quanergy Systems, Inc.
Global Positioning of Point Clouds
Overlay of LiDAR Point Cloud on Satellite Imagery

30 © 2016 Quanergy Systems, Inc.
Point Cloud Library (PCL) Steps – 3D Object Perception Pipeline –
Clustering Object Classification

31 © 2016 Quanergy Systems, Inc.
Sensing and Perception
Quanergy Perception Software
Car Motion Model
Camera Sensor Data
Navigation Map
3D - Local Map
3D - Global Map
Tracked Objects
LiDAR data
IMU / GPS data
Vehicle data
Context

32 © 2016 Quanergy Systems, Inc.
Quanergy 3D Perception Software
Data Formatting
Data Filtering
Ground Plane
Removal
Object Detection
Object Clustering
Classification Tracking
Outputs: – 5-30Hz PCL point cloud – PCL of clustered objects – Object list with boundaries – Object tracks
Formats: – PCL/ROS (today) – ADTF (roadmap)

33 © 2016 Quanergy Systems, Inc.
LiDAR Software / Global 3D-Map
QUANERGY LiDAR MAP
CLOUD
MAP ASSIST
QUANERGY SYSTEM PLATFORM
PROCESSOR
LiDAR SW
SENSORS
MAP FEEDBACK

34 © 2016 Quanergy Systems, Inc.
Some Partners

35 © 2016 Quanergy Systems, Inc.
Q&A
Quanergy Systems, Inc. Proprietary Rights Statement This document contains proprietary information belonging to Quanergy Systems, Inc.. This document is protected by copyright and trademark laws and is not to be used, in whole or in part, in any way without the express written consent of Quanergy Systems, Inc.
Louay Eldada +1-408-245-9500
[email protected] www.quanergy.com
Quanergy Sites: Silicon Valley (HQ) Detroit Ottawa Stuttgart Dubai Shanghai Tokyo