solid-state lasers: a graduate text technology of this class of lasers. for historical reasons,...
TRANSCRIPT

Solid-State Lasers:A Graduate Text
Walter KoechnerMichael Bass
Springer

Solid-State Lasers
SpringerNew YorkBerlinHeidelbergHong KongLondonMilanParisTokyo

Advanced Texts in Physics
This program of advanced texts covers a broad spectrum of topics that are ofcurrent and emerging interest in physics. Each book provides a comprehensiveand yet accessible introduction to a field at the forefront of modern research. Assuch, these texts are intended for senior undergraduate and graduate students atthe M.S. and Ph.D. levels; however, research scientists seeking an introduction toparticular areas of physics will also benefit from the titles in this collection.

Walter KoechnerMichael Bass
Solid-State Lasers
A Graduate Text
With 252 Figures
1Springer

Walter Koechner Michael BassFibertek, Inc. School of Optics/CREOL510 Herndon Parkway University of Central FloridaHerndon, VA 20170 Orlando, FL 32816USA USA
Cover illustration: Diode-pumped ND: YAG slab laser with positive branch unstable resonator andvariable reflectivity output coupler (adapted from Figure 5.24, page 182).
Library of Congress Cataloging-in-Publication DataKoechner, Walter, 1937–
Solid state lasers : a graduate text / Walter Koechner, Michael Bass.p. cm.—(Advanced texts in physics)
Includes bibliographical references and index.ISBN 0-387-95590-9 (alk. paper)1. Solid-state lasers. I. Bass, Michael, 1939–. II. Title III. Series.
TA1705 .K633 2003621.36′61—dc21 2002030568
ISBN 0-387-95590-9 Printed on acid-free paper.
c© 2003 Springer-Verlag New York, Inc.All rights reserved. This work may not be translated or copied in whole or in part without the writtenpermission of the publisher (Springer-Verlag New York, Inc., 175 Fifth Avenue, New York, NY 10010,USA), except for brief excerpts in connection with reviews or scholarly analysis. Use in connectionwith any form of information storage and retrieval, electronic adaptation, computer software, or bysimilar of dissimilar methodology now known or hereafter developed is forbidden.The use in this publication of trade names, trademarks, service marks, and similar terms, even if theyare not identified as such, is not to be taken as an expression of opinion as to whether or not they aresubject to proprietary rights.
Printed in the United States of America.
9 8 7 6 5 4 3 2 1 SPIN 10893625
www.springer-ny.com
Springer-Verlag New York Berlin HeidelbergA member of BertelsmannSpringer Science+Business Media GmbH

Preface
This college textbook describes the theory, operating characteristics, and designfeatures of solid-state lasers. The book is intended for students who want to famil-iarize themselves with solid-state lasers beyond the level of a general textbook.
Although the book is aimed at students who are thinking of entering this fas-cinating field, it might also be used by practicing scientists and engineers whoare changing their technical direction and want to learn more about this particu-lar class of lasers. After studying the material presented in this book, the readershould be able to follow the scientific and technical literature and have an under-standing of the basic principles and engineering issues of solid-state lasers, as wellas an appreciation of the subtleties, richness of design, and operating possibilitiesafforded by these systems.
Solid-state lasers and systems represent a one-billion dollar industry, and theyare the dominant class of lasers for research, industrial, medical, and militaryapplications. Given the importance of solid-state lasers, a graduate text is requiredthat deals explicitly with these devices.
Following the demonstration of the first laser over 40 years ago, an extraordi-nary number of different types of lasers have been invented using a wide varietyof active media and pump techniques to create an inversion. As a sign of a matur-ing industry, laser research and engineering has developed into many specializeddisciplines depending on the laser medium (solid-state, semiconductor, neutral orionized gas, liquid) and excitation mechanism (optical pumping, electric current,gas discharge, chemical reaction, electron beam).
The development of solid-state systems represents a multidisciplinary effortand is the result of the interaction of professionals from many branches of scienceand engineering, such as spectroscopy, solid-state and laser physics, optical de-sign, and electronic and mechanical engineering. Today, solid-state laser systemsare very sophisticated devices, and the field has developed so far that it is difficultfor a professional to enter it without prior familiarization with the basic conceptsand technology of this class of lasers.
For historical reasons, solid-state lasers describe a class of lasers in which ac-tive ions in crystal or glass host materials are optically pumped to create a pop-ulation inversion. Other types of lasers that employ solid-state gain media aresemiconductor lasers and optical fiber lasers and amplifiers. However, since theselasers employ very specialized technologies and design principles, they are usu-ally treated separately from conventional bulk solid-state lasers.
The design and performance characteristics of laser diode arrays are discussedin this book because these devices are employed as pump sources for solid-state
v

vi Preface
lasers. Fiber lasers are very similar to conventional solid-state lases as far as theactive material and pump source is concerned. However, they are radically dif-ferent with respect to beam confinement, mode structure, coupling of pump andlaser beams, and the design of optical components.
The content and structure of this textbook follow closely the book by Wal-ter Koechner entitled Solid-State Laser Engineering which is currently in its 5thedition. In this college text the material has been streamlined by deleting cer-tain engineering and hardware-related details, and more emphasis is placed ona tutorial presentation of the material. Also, each chapter includes tutorial exer-cises prepared by Professor Michael Bass to help the student reinforce the dis-cussions in the text. A complete solutions manual for instructors is available [email protected].
After a historical overview, the books starts with a review of the basic conceptsof laser physics (chapter 1), followed by an overview of the different classes andproperties of solid-state laser materials (chapter 2). Analytical expressions of thethreshold condition, and gain and output of laser oscillators are derived in chap-ter 3. An oscillator followed by one or more amplifiers is a common architecturein pulsed solid-state laser systems to boost output energy. Energy storage and gainof amplifiers is discussed in chapter 4. Beam divergence and line width of an os-cillator are strongly dependent on the spatial and longitudinal mode structure ofthe resonator. Resonator configuration and characteristics are presented in chap-ter 5. Different pump source configurations for transferring pump radiation to theactive medium are discussed in chapter 6. Thermal gradients set up as a result ofheat removal from the active medium have a profound impact on beam qualityand output power limitations. Thermal effects and cooling techniques are treatedin chapter 7. The output from a laser can be changed temporally or spectrally byQ-switching, mode-locking, and frequency conversion via nonlinear phenomena.These techniques are discussed in the last three chapters.
We would like to thank Judy Eure and Renate Koechner for typing the newmaterial and the editor, Dr. Hans Koelsch, for suggesting a college text on thesubject of solid-state lasers. We also thank Prof. D. Hagan for suggestions relatedto the nonlinear optics exercises and Drs. Bin Chen and Jun Dong and Mrs. HongShun and Teyuan Chung for testing the exercises.
Special thanks are due to our wives Renate Koechner and Judith Bass, whohave been very patient and supportive throughout this project.
Herndon, Virginia Walter KoechnerOrlando, Florida Michael BassSeptember 2002

Contents
Preface v
Introduction Overview of the History, Performance Characteristics,and Applications of Solid-State Lasers 1
Major Milestones in the Development of Solid-State Lasers . . . . . 1Typical Performance Parameters and Applications . . . . . . . . . . 7
1 Energy Transfer Between Radiation and Atomic Transitions 12
1.1 Optical Amplification . . . . . . . . . . . . . . . . . . . . . 121.2 Interaction of Radiation with Matter . . . . . . . . . . . . . . 15
1.2.1 Blackbody Radiation . . . . . . . . . . . . . . . . . 151.2.2 Boltzmann’s Statistics . . . . . . . . . . . . . . . . 161.2.3 Einstein’s Coefficients . . . . . . . . . . . . . . . . 171.2.4 Phase Coherence of Stimulated Emission . . . . . . 20
1.3 Absorption and Optical Gain . . . . . . . . . . . . . . . . . 211.3.1 Atomic Lineshapes . . . . . . . . . . . . . . . . . . 211.3.2 Absorption by Stimulated Transitions . . . . . . . . 251.3.3 Population Inversion . . . . . . . . . . . . . . . . . 28
1.4 Creation of a Population Inversion . . . . . . . . . . . . . . . 301.4.1 The Three-Level System . . . . . . . . . . . . . . . 311.4.2 The Four-Level System . . . . . . . . . . . . . . . . 331.4.3 The Metastable Level . . . . . . . . . . . . . . . . . 34
1.5 Laser Rate Equations . . . . . . . . . . . . . . . . . . . . . 351.5.1 Three-Level System . . . . . . . . . . . . . . . . . 361.5.2 Four-Level System . . . . . . . . . . . . . . . . . . 39
Summary . . . . . . . . . . . . . . . . . . . . . . . . . . . . . . . 40References . . . . . . . . . . . . . . . . . . . . . . . . . . . . . . 41Exercises . . . . . . . . . . . . . . . . . . . . . . . . . . . . . . . 41
2 Properties of Solid-State Laser Materials 44
2.1 Overview . . . . . . . . . . . . . . . . . . . . . . . . . . . 452.1.1 Host Materials . . . . . . . . . . . . . . . . . . . . 462.1.2 Active Ions . . . . . . . . . . . . . . . . . . . . . . 48
2.2 Ruby . . . . . . . . . . . . . . . . . . . . . . . . . . . . . . 542.3 Nd : YAG . . . . . . . . . . . . . . . . . . . . . . . . . . . 57
vii

viii Contents
2.4 Nd : Glass . . . . . . . . . . . . . . . . . . . . . . . . . . . 602.4.1 Laser Properties . . . . . . . . . . . . . . . . . . . 60
2.5 Nd : YLF . . . . . . . . . . . . . . . . . . . . . . . . . . . . 632.6 Nd : YVO4 . . . . . . . . . . . . . . . . . . . . . . . . . . . 652.7 Er : Glass . . . . . . . . . . . . . . . . . . . . . . . . . . . 672.8 Yb : YAG . . . . . . . . . . . . . . . . . . . . . . . . . . . 682.9 Alexandrite . . . . . . . . . . . . . . . . . . . . . . . . . . 702.10 Ti : Sapphire . . . . . . . . . . . . . . . . . . . . . . . . . . 72Summary . . . . . . . . . . . . . . . . . . . . . . . . . . . . . . . 74References . . . . . . . . . . . . . . . . . . . . . . . . . . . . . . 75Exercises . . . . . . . . . . . . . . . . . . . . . . . . . . . . . . . 76
3 Laser Oscillator 78
3.1 Operation at Threshold . . . . . . . . . . . . . . . . . . . . 803.2 Gain Saturation . . . . . . . . . . . . . . . . . . . . . . . . 843.3 Circulating Power . . . . . . . . . . . . . . . . . . . . . . . 863.4 Oscillator Performance Model . . . . . . . . . . . . . . . . . 88
3.4.1 Conversion of Input to Output Energy . . . . . . . . 883.4.2 Laser Output . . . . . . . . . . . . . . . . . . . . . 95
3.5 Relaxation Oscillations . . . . . . . . . . . . . . . . . . . . 1023.6 Examples of Laser Oscillators . . . . . . . . . . . . . . . . . 106
3.6.1 Lamp-Pumped cw Nd : YAG Laser . . . . . . . . . . 1073.6.2 Diode Side-Pumped Nd : YAG Laser . . . . . . . . . 1113.6.3 End-Pumped Systems . . . . . . . . . . . . . . . . 115
Summary . . . . . . . . . . . . . . . . . . . . . . . . . . . . . . . 118References . . . . . . . . . . . . . . . . . . . . . . . . . . . . . . 119Exercises . . . . . . . . . . . . . . . . . . . . . . . . . . . . . . . 119
4 Laser Amplifier 121
4.1 Pulse Amplification . . . . . . . . . . . . . . . . . . . . . . 1224.2 Nd : YAG Amplifiers . . . . . . . . . . . . . . . . . . . . . . 1274.3 Nd : Glass Amplifiers . . . . . . . . . . . . . . . . . . . . . 1354.4 Depopulation Losses . . . . . . . . . . . . . . . . . . . . . 141
4.4.1 Amplified Spontaneous Emission . . . . . . . . . . 1414.4.2 Prelasing and Parasitic Modes . . . . . . . . . . . . 144
4.5 Self-Focusing . . . . . . . . . . . . . . . . . . . . . . . . . 144Summary . . . . . . . . . . . . . . . . . . . . . . . . . . . . . . . 147References . . . . . . . . . . . . . . . . . . . . . . . . . . . . . . 147Exercises . . . . . . . . . . . . . . . . . . . . . . . . . . . . . . . 148
5 Optical Resonator 149
5.1 Transverse Modes . . . . . . . . . . . . . . . . . . . . . . . 1495.1.1 Intensity Distribution . . . . . . . . . . . . . . . . . 1505.1.2 Characteristics of a Gaussian Beam . . . . . . . . . 154

Contents ix
5.1.3 Resonator Configurations . . . . . . . . . . . . . . . 1565.1.4 Stability of Laser Resonators . . . . . . . . . . . . . 1605.1.5 Higher Order Modes . . . . . . . . . . . . . . . . . 1615.1.6 Diffraction Losses . . . . . . . . . . . . . . . . . . 1625.1.7 Active Resonator . . . . . . . . . . . . . . . . . . . 1645.1.8 Mode-Selecting Techniques . . . . . . . . . . . . . 166
5.2 Longitudinal Modes . . . . . . . . . . . . . . . . . . . . . . 1695.2.1 The Fabry–Perot Interferometer . . . . . . . . . . . 1695.2.2 Laser Resonator . . . . . . . . . . . . . . . . . . . 1725.2.3 Longitudinal Mode Control . . . . . . . . . . . . . 175
5.3 Unstable Resonators . . . . . . . . . . . . . . . . . . . . . . 178Summary . . . . . . . . . . . . . . . . . . . . . . . . . . . . . . . 183References . . . . . . . . . . . . . . . . . . . . . . . . . . . . . . 183Exercises . . . . . . . . . . . . . . . . . . . . . . . . . . . . . . . 184
6 Optical Pump Systems 187
6.1 Pump Sources . . . . . . . . . . . . . . . . . . . . . . . . . 1876.1.1 Flashlamps . . . . . . . . . . . . . . . . . . . . . . 1876.1.2 Continuous Arc Lamps . . . . . . . . . . . . . . . . 1966.1.3 Laser Diodes . . . . . . . . . . . . . . . . . . . . . 198
6.2 Pump Radiation Transfer Methods . . . . . . . . . . . . . . 2136.2.1 Side-Pumping with Lamps . . . . . . . . . . . . . . 2146.2.2 Side-Pumping with Diodes . . . . . . . . . . . . . . 2206.2.3 End-Pumped Lasers . . . . . . . . . . . . . . . . . 2306.2.4 Face-Pumped Disks . . . . . . . . . . . . . . . . . 238
Summary . . . . . . . . . . . . . . . . . . . . . . . . . . . . . . . 241References . . . . . . . . . . . . . . . . . . . . . . . . . . . . . . 242Exercises . . . . . . . . . . . . . . . . . . . . . . . . . . . . . . . 243
7 Thermo-Optic Effects 245
7.1 Cylindrical Geometry . . . . . . . . . . . . . . . . . . . . . 2487.1.1 Temperature Distribution . . . . . . . . . . . . . . . 2497.1.2 Thermal Stresses . . . . . . . . . . . . . . . . . . . 2517.1.3 Photoelastic Effects . . . . . . . . . . . . . . . . . 2537.1.4 Thermal Lensing . . . . . . . . . . . . . . . . . . . 2557.1.5 Stress Birefringence . . . . . . . . . . . . . . . . . 2587.1.6 Compensation of Thermally Induced Optical
Distortions . . . . . . . . . . . . . . . . . . . . . . 2637.2 Slab and Disk Geometries . . . . . . . . . . . . . . . . . . . 265
7.2.1 Rectangular-Slab Laser . . . . . . . . . . . . . . . . 2657.2.2 Slab Laser with Zigzag Optical Path . . . . . . . . . 2687.2.3 Disk Amplifiers . . . . . . . . . . . . . . . . . . . 270
7.3 End-Pumped Configurations . . . . . . . . . . . . . . . . . . 271Summary . . . . . . . . . . . . . . . . . . . . . . . . . . . . . . . 276

x Contents
References . . . . . . . . . . . . . . . . . . . . . . . . . . . . . . 277Exercises . . . . . . . . . . . . . . . . . . . . . . . . . . . . . . . 278
8 Q-Switching 279
8.1 Q-Switch Theory . . . . . . . . . . . . . . . . . . . . . . . 2808.1.1 Continuously Pumped, Repetitively
Q-Switched Systems . . . . . . . . . . . . . . . . . 2848.2 Mechanical Devices . . . . . . . . . . . . . . . . . . . . . . 2888.3 Electro-Optical Q-Switches . . . . . . . . . . . . . . . . . . 2898.4 Acousto-Optic Q-Switches . . . . . . . . . . . . . . . . . . 295
8.4.1 Device Characteristics . . . . . . . . . . . . . . . . 3008.5 Passive Q-Switch . . . . . . . . . . . . . . . . . . . . . . . 302Summary . . . . . . . . . . . . . . . . . . . . . . . . . . . . . . . 305References . . . . . . . . . . . . . . . . . . . . . . . . . . . . . . 306Exercises . . . . . . . . . . . . . . . . . . . . . . . . . . . . . . . 306
9 Mode-Locking 308
9.1 Pulse Formation . . . . . . . . . . . . . . . . . . . . . . . . 3089.2 Passive Mode-Locking . . . . . . . . . . . . . . . . . . . . 315
9.2.1 Liquid Dye Saturable Absorber . . . . . . . . . . . . 3169.2.2 Kerr Lens Mode-Locking . . . . . . . . . . . . . . . 317
9.3 Active Mode-Locking . . . . . . . . . . . . . . . . . . . . . 3229.3.1 AM Modulation . . . . . . . . . . . . . . . . . . . 3229.3.2 FM Modulation . . . . . . . . . . . . . . . . . . . . 325
9.4 Picosecond Lasers . . . . . . . . . . . . . . . . . . . . . . . 3269.4.1 AM Mode-Locking . . . . . . . . . . . . . . . . . . 3279.4.2 FM Mode-Locking . . . . . . . . . . . . . . . . . . 329
9.5 Femtosecond Lasers . . . . . . . . . . . . . . . . . . . . . . 3319.5.1 Laser Materials . . . . . . . . . . . . . . . . . . . . 3319.5.2 Resonator Design . . . . . . . . . . . . . . . . . . . 332
Summary . . . . . . . . . . . . . . . . . . . . . . . . . . . . . . . 336References . . . . . . . . . . . . . . . . . . . . . . . . . . . . . . 337Exercises . . . . . . . . . . . . . . . . . . . . . . . . . . . . . . . 337
10 Nonlinear Devices 339
10.1 Nonlinear Optics . . . . . . . . . . . . . . . . . . . . . . . 34010.1.1 Second-Order Nonlinearities . . . . . . . . . . . . . 34110.1.2 Third-Order Nonlinearities . . . . . . . . . . . . . . 343
10.2 Harmonic Generation . . . . . . . . . . . . . . . . . . . . . 34510.2.1 Basic Equations of Second-Harmonic Generation . . 34510.2.2 Index Matching . . . . . . . . . . . . . . . . . . . . 34810.2.3 Parameters Affecting the Doubling Efficiency . . . . 35410.2.4 Intracavity Frequency Doubling . . . . . . . . . . . 35810.2.5 Third-Harmonic Generation . . . . . . . . . . . . . 360

Contents xi
10.3 Parametric Oscillators . . . . . . . . . . . . . . . . . . . . . 36310.3.1 Performance Modeling . . . . . . . . . . . . . . . . 36510.3.2 Quasi-Phase-Matching . . . . . . . . . . . . . . . . 372
10.4 Raman Laser . . . . . . . . . . . . . . . . . . . . . . . . . 37410.5 Optical Phase Conjugation . . . . . . . . . . . . . . . . . . . 379Summary . . . . . . . . . . . . . . . . . . . . . . . . . . . . . . . 384References . . . . . . . . . . . . . . . . . . . . . . . . . . . . . . 385Exercises . . . . . . . . . . . . . . . . . . . . . . . . . . . . . . . 386
A Conversion Factors and Constants 387
B Definition of Symbols 391
C Partial Solutions to the Exercises 397
Index 405

This page intentionally left blank

Introduction
Overview of the History, PerformanceCharacteristics, and Applications ofSolid-State Lasers
Major Milestones in the Development of Solid-State LasersTypical Performance Parameters and Applications
In this Introduction we will provide a short overview of the important milestonesin the development of solid-state lasers, discuss the range of performance pa-rameters possible with these lasers, and mention major applications. Besides thecompactness and benign operating features, it was the enormous flexibility in de-sign and output characteristics which led to the success of solid-state lasers overthe last 40 years.
Major Milestones in the Development of Solid-State Lasers
Historically, the search for lasers began as an extension of stimulated ampli-fication techniques employed in the microwave region. Masers, coined fromMicrowave Amplification by Stimulated Emission of Radiation, served as sen-sitive preamplifiers in microwave receivers. In 1954 the first maser was built byC. Townes and utilized the inversion population between two molecular levels ofammonia to amplify radiation at a wavelength around 1.25 cm.
In 1955 an optical excitation scheme for masers was simultaneously proposedby N. Bloembergen, A.M. Prokorov, and N.G. Basov. A few years later, maserswere mostly built using optically pumped ruby crystals. In 1958 A. Schawlow andC. Townes proposed extending the maser principle to optical frequencies and theuse of a Fabry–Perot resonator for feedback. However, they did not find a suitablematerial or the means of exciting it to the required degree of population inversion.
This was accomplished by T. Maiman who built the first laser in 1960. It was apink ruby crystal (sapphire with trivalent chromium impurities), optically pumped
1
2 Introduction
by a helical flashlamp that surrounded the cylindrical laser crystal. The parallelends of the ruby crystal were silvered, with a small hole at one end for observingthe radiation. The reflective surfaces comprised the optical resonator. The outputwavelength was 694 nm. It was T. Maiman who coined the name “laser,” in anal-ogy to maser, as an abbreviation of Light Amplification by Stimulated Emissionof Radiation.
In early ruby laser systems the output consisted of a series of irregular spikes,stretching over the duration of the pump pulse. A key discovery made by R.W.Hellwarth in 1961 was a method called Q-switching for concentrating the out-put from the ruby laser into a single pulse. The Q-switch is an optical shutterwhich prevents laser action during the flashlamp pulse, therefore the populationinversion can reach large values. If the shutter is suddenly opened, stored energywill be released in a time characterized by a few round trips between the res-onator mirrors. Hellwarth initially proposed a Kerr cell, a device which rotatesthe plane of polarization when voltage is applied. This Q-switch, which consistedof a cell filled with nitrobenzene, required very high voltages for Q-switching;it was soon replaced by spinning one of the resonator mirrors. A further refine-ment was the insertion of a spinning prism between the fixed mirrors of the res-onator.
The earliest application of the laser was in active range-finding by measuringthe time of flight of a laser pulse reflected from a target. Investigations in thisdirection started immediately after the discovery of the ruby laser. Four yearslater, fully militarized rangefinders containing a flashlamp-pulsed ruby laser witha spinning prism Q-switch went into production. For about 10 years ruby-basedrangefinders were manufactured; afterward the ruby laser was replaced by themore efficient neodymium doped yttrium aluminum garnet (Nd : YAG) laser.
Beside the use in range finders, the ruby laser was basically a research tooland, for the next 15 years, ruby lasers became the standard high-power radiationsource in the visible region for research at university, government, and industriallaboratories. Applications in an industrial environment were rare, in large partdue to the low-pulse repetition rate of the ruby laser (a pulse every few seconds),high cost of the equipment, and the unfamiliarity of the industry with this newradiation source. Some of the specialized applications included drilling holes indiamonds that are used as dies for drawing wires, or spot welding in vacuumthrough the glass envelope of vacuum tubes. Another application was stress anal-ysis by means of double pulse holography, in which surface deformation due tostress or temperature is measured interferometrically between two pulses.
The discovery of the ruby laser triggered an intensive search for other ma-terials, and in rapid succession laser action in other solids, gases, semiconduc-tors, and liquids was demonstrated. Following the discovery of the ruby laser, thenext solid-state material was uranium-doped calcium fluoride which was lasedin late 1960. The first solid-state neodymium laser was calcium tungstate dopedwith neodymium ions. This laser, discovered in 1961, was used in research facil-ities for a number of years until yttrium aluminate garnet, as a host material forneodymium, was discovered.
Introduction 3
In 1961, E. Snitzer demonstrated the first neodymium glass laser. SinceNd : glass could be made in much larger dimensions and with better qualitythan ruby, it promised to deliver much higher energies. It was quickly realizedthat high energy, short pulses produced from large Nd : glass lasers possessed thepotential to heat matter to thermonuclear temperatures, thus generating energy insmall controlled explosions. Large budgets have been devoted to the developmentand installation of huge Nd : glass laser systems which became the world-widesystems of choice for laser fusion research and weapons simulation. The mostpowerful of these systems, the NOVA laser, completed in 1985, produced 100 kJof energy in a 2.5 ns pulse. Systems with energies ten times larger are currentlyunder construction.
Using a ruby laser, P.A. Franken demonstrated second harmonic generation incrystal quartz in 1961. Generation of harmonics is caused by the nonlinear behav-ior of the refractive index in the presence of a very high electric field strength. Theconversion of the fundamental wavelength to the second harmonics was extremelysmall because the interaction length of the beams was only a few wavelengths andthe nonlinearity of quartz is very low.
Soon after these first nonlinear optics experiments were conducted it was re-alized that efficient nonlinear interactions require a means of achieving phase-velocity matching of the interacting waves over a distance of many wavelengths.Within a year, two basic approaches to achieve efficient harmonic generation werepublished in the literature. One approach, namely the use of birefringence to off-set dispersion, is still the preferred method for most nonlinear processes in usetoday. Efficient harmonic generation was soon achieved in birefringence com-pensated potassium dihydrogen phosphate (KDP) crystals, a crystal which is stillemployed today for the generation of the third harmonic of large Nd : glass lasers.The other method, namely the use of a periodic modulation of the sign of thenonlinear coefficient to restore the optical phase, could only be realized 30 yearslater. In the early 1990s, lithographic processing techniques enabled the fabrica-tion of quasi-phase-matched small crystals using electric field poling of lithiumniobate.
In 1962 the idea of parametric amplification and generation of tunable light wasconceived, and a few years later the first experiment demonstrating parametricgain was achieved. Commercial parametric oscillators based on lithium niobatewere introduced in 1971. Damage of the nonlinear material and the appearanceof tunable dye lasers led to a decline in interest in optical parametric oscillators(OPOs) for almost 20 years. The discovery of damage-resistant nonlinear crystalswith large nonlinear coefficients in the early 1990s revived interest in OPOs, andtoday tunable solid-state lasers covering the wavelength range from the visibleto the near-infrared have found widespread applications in spectroscopy, remotesensing, and wherever a tunable radiation source is required.
The possibility of laser action in a semiconductor was explored rather early.Initially, intrinsic semiconductors pumped by an electron beam or by optical ra-diation were considered. However, at the end of 1962, several groups succeededin producing pulsed output from gallium–arsenide p–n junctions cooled to cryo-
4 Introduction
genic temperatures. About 10 years later, continuous operation at room tempera-ture was achieved.
The first optical fiber amplifier was demonstrated in 1963 using a 1 m longneodymium-doped glass fiber wrapped around a flashlamp. However, the con-cept received little attention until the 1980s when low-loss optical fibers becameavailable and the fiber-optic communications industry explored these devices foramplification of signals.
In 1964 the best choice of a host for neodymium ions, namely yttrium alu-minum garnet (YAG), was discovered by J. Geusic. Since that time, Nd : YAGremains the most versatile and widely used active material for solid-state lasers.Nd : YAG has a low threshold which permits continuous operation, and the hostcrystal has good thermal, mechanical, and optical properties and can be grownwith relative ease.
An immediate application was the replacement of ruby with Nd : YAG in mili-tary rangefinders. Since the system efficiency was about a factor of 10 higher withNd : YAG as compared to ruby, the weight of storage capacitors and batteries wasdrastically reduced. This allowed the transition from a tripod-mounted unit, thesize of a briefcase, to a hand-held device only slightly larger than a binocular.
Continuously pumped, repetitively Q-switched Nd : YAG lasers were the firstsolid-state lasers which found applications in a production environment, mainly inthe semiconductor industry for resistor trimming, silicon scribing, and marking.The early systems were pumped with tungsten filament lamps and Q-switchedwith a rotating polygon prism. Reliability was a big issue because lamp-life wasshort—on the order of 40 hours—and the bearings of the high-speed motorsemployed in the rotating Q-switches did wear out frequently. The mechanicalQ-switches were eventually replaced by acousto-optic Q-switches, and kryptonarc lamps replaced tungsten filament lamps.
Up to this point, solid-state lasers were capable of generating very impressivepeak powers, but average power was still limited to a few watts or at most a fewtens of watts. However, at the end of the 1960s, continuously pumped Nd : YAGlasers with multihundred watts output power became commercially available.
During the first years of laser research, a particular effort was directed towardgeneration of short pulses from Nd : glass and ruby lasers. With Q-switching, sev-eral round trips are required for radiation to build up. Given the length of the res-onator and available gain of these early systems, the pulses were on the order of 10to 20 ns. The next step toward shorter pulses was a technique called cavity dump-ing, whereby the radiation in the resonator, as it reached its peak, was quicklydumped by a fast Q-switch. Pulses with a duration on the order of one roundtrip (a few nanoseconds) in the resonator could be generated with this method. In1965, a technique termed “mode-locking” was invented. Mode-locking is a tech-nique whereby passive loss modulation, with a fast response saturable absorber,or by active loss of frequency modulation, a fixed relationship among the phasesof the longitudinal modes is enforced. With either passive or active mode-locking,pulses much shorter than a resonator round trip time can be generated; typically,pulses are on the order of 20 to 100 ps.

Introduction 5
By the end of the 1960s, most of the important inventions with regard to solid-state laser technology had been made. Nd : YAG and Nd : glass proved clearlysuperior over many other solid-state laser materials; short-pulse generation bymeans of Q-switching and mode-locking, as well as frequency conversion withharmonic generators and parametric oscillators, was well understood. Xenon-filled flashlamps and krypton arc lamps had been developed as pump sources andlaser diodes were recognized as an ideal pump source, but due to a lack of suitabledevices the technology could not be implemented.
To gain wider acceptance in manufacturing processes, the reliability of the lasersystems needed improvement and the operation of the lasers had to be simplified.During the 1970s, efforts concentrated on engineering improvements, such as anincrease in component and system lifetime and reliability. The early lasers oftenworked poorly and had severe reliability problems. At the component level, dam-age resistant optical coatings and high-quality laser crystals had to be developed;and the lifetime of flash lamps and arc lamps had to be drastically improved.On the system side, the problems requiring solutions were associated with waterleaks, corrosion of metal parts by the cooling fluid, deterioration of seals and otherparts in the pump cavity due to the ultraviolet radiation of the flashlamps, arcingwithin the high-voltage section of the laser, and contamination of optical surfacescaused by the environment.
The application of solid-state lasers for military tactical systems proceededalong a clear path since there is no alternative for rangefinders, target illuminators,and designators. At the same time construction of large Nd : glass lasers began atmany research facilities. Also solid-state lasers were readily accepted as versatileresearch tools in many laboratories.
Much more difficult and rather disappointing at first was the acceptance of thesolid-state lasers for industrial and medical applications. Despite improvement insystems reliability and performance, it took more than two decades of develop-ment and engineering improvements before solid-state lasers moved in any num-bers out of the laboratory and onto the production floor or into instruments usedin medical procedures. Often applications that showed technical feasibility in thelaboratory were not suitable for production because of economic reasons, suchas high operating costs or limited processing speeds. Also, other laser systemsprovided strong competition for a relatively small market. The CO2 laser provedto be a simpler and more robust system for many industrial and medical appli-cations. Also, the argon ion laser was readily accepted and preferred over solid-state lasers for retinal photocoagulation. The dye laser was the system of choicefor tunable laser sources. The entry of solid-state lasers into manufacturing pro-cesses started with very specialized applications, either for working with difficultmaterials, such as titanium, or for difficult machining operations, such as drillingholes in slanted surfaces; for example, in jet fuel nozzles or for precision materialremoval required in the semiconductor and electronics industry.
In the latter part of the 1970s, and into the 1980s, a number of tunable laserswere discovered, such as alexandrite, titanium-doped sapphire, and chromium-doped fluoride crystals. The most important tunable laser, Ti : sapphire, discov-
6 Introduction
ered in the mid-1980s, is tunable between 660 and 980 nm. This laser must bepumped with another laser in the blue–green wavelength region. Alexandrite,first operated in 1979, has a smaller tunable output but can be flashlamp-pumped.Chromium-doped fluoride crystals such as lithium strontium aluminum fluorideand lithium calcium aluminum fluoride are of interest because they can be pumpedwith laser diodes.
In the late 1980s, the combination of broad band tunable lasers in combina-tion with ultrafast modulation techniques, such as Kerr lens mode-locking, led tothe development of mode-locked lasers with pulse widths on the order of femto-seconds. The pulse width limit of a mode-locked laser is inversely proportional tothe bandwidth of the laser material. For neodymium-based lasers, the lower limitfor the pulse width is a few picoseconds. Laser media with a much larger gainbandwidth, such as Ti : sapphire, can produce much shorter pulses compared toneodymium lasers.
Over the years, the performance of diode lasers has been constantly improvedas new laser structures and new material growth and processing techniques weredeveloped. This led to devices with longer lifetimes, lower threshold currents, andhigher output powers. In the 1970s, diode lasers capable of continuous operationat room temperature were developed. In the mid-1980s, with the introduction ofepitaxial processes and a greatly increased sophistication in the junction struc-ture of GaAs devices, laser diodes became commercially available with outputpowers of several watts. These devices had sufficient power to render them usefulfor the pumping of Nd : YAG lasers. The spectral match of the diode laser outputwith the absorption of neodymium lasers results in a dramatic increase in systemefficiency, and a reduction of the thermal load of the solid-state laser material.Military applications and the associated research and development funding pro-vided the basis for exploring this new technology. Since the early laser diodeswere very expensive, their use as pump sources could only be justified wherediode pumping provided an enabling technology. Therefore the first applicationsfor diode-pumped Nd : YAG lasers were for space and airborne platforms, wherecompactness and power consumption is of particular importance.
As diode lasers became less expensive, these pump sources were incorpo-rated into smaller commercial solid-state lasers. At this point, laser diode-pumpedsolid-state lasers began their rapid evolution that continues today. Diode pump-ing offers significant improvements in overall systems efficiency, reliability, andcompactness. In addition, diode pumping has added considerable variety to thedesign possibilities of solid-state lasers. In many cases laser diode arrays werenot just a replacement for flashlamps or arc lamps, but provided means for de-signing completely new laser configurations.They also led to the exploration ofseveral new laser materials. Radiation from laser diodes can be collimated; thisprovides great flexibility of designing solid-state lasers with regard to the shapeof the laser medium and orientation of the pump beam. In end-pumped lasers, thepump beam and resonator axis are collinear which led to highly efficient laserswith excellent beam quality. In monolithic lasers, the active crystal also providesthe resonator structure leading to lasers with high output stability and excellent
Introduction 7
spatial and temporal beam quality. New laser materials, such as Yb : YAG andNd : YVO4, that could not be pumped efficiently with flashlamps, are very muchsuited to laser diode pumping.
In this historical perspective we could sketch only briefly those developmentsthat had a profound impact on the technology of solid-state lasers. Laser emissionhas been obtained from hundreds of solid-state crystals and glasses. However,most of these lasers are of purely academic interest. There is a big differencebetween laser research and the commercial laser industry, and there are manyreasons why certain lasers did not find their way into the market or disappearedquickly after their introduction. Most of the lasers that did not leave the labora-tory were inefficient, low in power, difficult to operate or, simply, less practicalto use than other already established systems. Likewise, many pump schemes,laser configurations, and resonator designs did not come into use because of theircomplexity and commensurate high manufacturing and assembly costs or theirdifficulty in maintaining performance.
Typical Performance Parameters and Applications
Solid-state lasers provide the most versatile radiation source in terms of outputcharacteristics when compared to other laser systems. A large range of outputparameters, such as average and peak power, pulse width, pulse repetition rate,and wavelength, can be obtained with these systems.
Today we find solid-state lasers in industry as tools in many manufacturingprocesses, in hospitals and in doctors’ offices as radiation sources for therapeutic,aesthetic, and surgical procedures, in research facilities as part of the diagnosticinstrumentation, and in military systems as rangefinders, target designators, andinfrared countermeasure systems. The flexibility of solid-state lasers stems fromthe fact that:
• The size and shape of the active material can be chosen to achieve a particularperformance.
• Different active materials can be selected with different gain, energy storage,and wavelength properties.
• The output energy can be increased by adding amplifiers.• A large number of passive and active components are available to shape the
spectral, temporal, and spatial profile of the output beam.
In this section we will illustrate the flexibility of these systems and indicate themajor applications that are based on particular performance characteristics.
Average Output Power. The majority of solid-state lasers available commer-cially have output powers below 20 W. The systems are continuously pumped,typically equipped with a Q-switch, and often combined with a wavelength con-verter. Continuously pumped, repetitively Q-switched lasers generate a continu-ous stream of short pulses at repetition rates between 5 and 100 kHz depending

8 Introduction
on the material. Since the peak power of each pulse is at least three orders of mag-nitude above the average power, breakdown of reflective surfaces and subsequentmaterial removal by melting and vaporization is facilitated.
The electronics and electrical industry represents the largest market for applica-tions such as soldering, wire bonding and stripping, scribing of wavers, memoryrepair, resistor and integrated circuit trimming. In addition, industry-wide, theselasers found uses for marking of parts, precision spot and seam welding, and forgeneral micromachining tasks. In the medical fields solid-state lasers have foundapplications in ophthomology for vision correction and photocoagulation, skinresurfacing, and as replacements for scalpels in certain surgical procedures. Inbasic research, solid-state lasers are used in scientific and biomedical instrumen-tation, Raman and laser-induced breakdown spectroscopy. Application for theselasers are far too broad and diverse to provide a comprehensive listing here.
Higher power solid-state lasers with output powers up to 5 kW are mainlyemployed in metals working, such as seam and spot welding, cutting, drilling,and surface treatment. In particular, systems with output powers of a few hun-dred watts have found widespread applications in the manufacturing process. Thehigher power levels allow for faster processing speed and working with thickermaterials.
At the low end of the power scale are very small lasers with output powerstypically less than 1 W. These lasers are pumped by diode lasers and have inmost cases the resonator mirrors directly coated onto the crystal surfaces. Theneodymium-doped crystals are typically only a few millimeters in size. Theselasers have an extremely stable, single frequency output and are employed in in-terferometric instruments, spectroscopic systems, and instruments used in analyt-ical chemistry. They also serve as seed lasers for larger laser systems.
The majority of solid-state lasers with outputs up to 20 W are pumped withdiode arrays, whereas systems at the multihundred watt level are for the most partpumped by arc lamps because of the high cost of laser diode arrays, althoughdiode-pumped systems with up to 5 kW of output power are on the market.
Peak Power. Pulsed systems with pulsewidths on the order of 100 µs and ener-gies of several joules are employed in manufacturing processes for hole drilling.The peak power of these systems is on the order of several tens of kilowatts. Sub-stantially higher peak powers are obtained with solid-state lasers that are pulse-pumped and Q-switched. For example, military systems such as rangefinders andtarget designators have output energies of 10 to 200 mJ and pulsewidths of 10to 20 ns. Peak power for these systems is on the order of several megawatts.Laser generated plasmas investigated in research facilities require peak powersin the gigawatt regime. Typically, lasers for this work have output energies ofseveral joules and pulsewidths of a few nanoseconds. The highest peak powersfrom solid-state lasers are generated in huge Nd : glass lasers employed for iner-tial confinement fusion experiments. The largest of these systems had an energyoutput around 100 kJ and pulsewidth of 1 ns which resulted in a peak power of100 TW.

Introduction 9
Pulse Width. Solid-state lasers can span the range from continuous operationto pulses as short as one cycle of the laser frequency which is on the order of1 fs. Long pulses in the milli- and microsecond regime are generated by adjust-ing the length of the pump pulse. Hole drilling and surface hardening of metals istypically performed with pulses around 100 µs in duration. Continuously pumpedQ-switched Nd : YAG lasers generate pulses with pulsewidths on the order of hun-dreds of nanoseconds.
A reduction in pulsewidth is achieved in lasers that are pulse-pumped andQ-switched. These lasers have pulsewidths from a few nanoseconds to about20 ns. All military rangefinders and target designators fall into this category. Thepulsewidth of pulse-pumped Q-switched lasers is shorter than their continuouslypumped counterparts because a higher gain is achieved in pulse-pumped systems.The technique of mode-locking the longitudinal modes provides a means of gener-ating pulses in the picosecond regime with neodymium lasers. Since pulsewidthand gain-bandwidth are inversely related, even shorter pulses are obtained withtunable lasers due to their broad spectrum. For example, with Ti : sapphire lasers,pulses in the femtosecond regime are generated. These short pulses enable re-searchers, for example, to study dynamic processes that occur during chemicalreactions.
Pulse Repetition Rate. At the low end are lasers employed in inertial fusion ex-periments. In these systems laser pulses are single events with a few experimentsconducted each day because the heat generated during each pulse has to be dissi-pated between shots. Also, some hand-held rangefinders for surveillance purposesare single-shot devices. Most military rangefinders and target designators operateat 20 pulses per second. Welders and drillers, if they are pulse-pumped, gener-ate pulses at a repetition rate of a few hundred pulses per second. Continuouslypumped and Q-switched lasers provide a continuous train of pulses between 5and 100 kHz. A large number of materials-processing applications fall into thismode of operation. Mode-locking generates pulses with repetition rates of sev-eral hundred megahertz. These systems are mainly used in photochemistry or inspecialized materials processing application. In the latter application, material isremoved by ablation that prevents heat from penetrating the surrounding area.
Linewidth. The linewidth of a laser is the result of the gain-bandwidth of thelaser material and the number of longitudinal modes oscillating within the res-onator. The output of a typical laser is comprised of many randomly fluctuatinglongitudinal modes, each mode representing a spectral line within the bandwidthof the output beam. The typical linewidth of an Nd : YAG laser is on the order of10 GHz or 40 pm. Compared to the wavelength, lasers are very narrow-bandwidthradiation sources, and therefore for most applications the linewidth of the laser isnot important. Exceptions are applications of the laser in coherent radar systemsor in interferometric devices. Also, in lasers that operate at peak powers close tothe damage threshold of optical components, it is beneficial to restrict operationto a single longitudinal mode to avoid power spikes as a result of the randomsuperposition of the output from several modes.
10 Introduction
Single mode operation of solid-state lasers is most readily achieved with smallmonolithic devices, having resonators which are so short as to allow only onelongitudinal mode to oscillate. Only a few lasers, such as used in interferometersdesigned for gravitational wave detection, require close to quantum noise-limitedperformance. Careful temperature and vibration control combined with feedbacksystems have reduced the bandwidth of these lasers to a few kilohertz.
Spectral Range. A direct approach to tunable output is the use of a tunable laser,such as Ti : sapphire or the alexandrite laser. However, these sources are limitedto the spectral region between 600 and 900 nm.The most well-developed and ef-ficient lasers, such as the neodymium-based systems, are essentially fixed wave-length radiation sources with output around 1 µm. Nonlinear crystals employedin harmonic generators will produce second, third, and fourth harmonics, thusproviding output in the visible and ultraviolet spectrum. Tunable spectral cov-erage can be obtained from optical parametric oscillators that convert a portionof the output beam into two beams at longer wavelength. Depending on the re-gion over which tunable output is desired, the optical parametric oscillator canbe pumped directly with the fundamental beam of the laser or with one of itsharmonics.
The limits of the spectral range for solid-state lasers in the ultraviolet region isreached by quadrupled neodymium lasers at around 266 nm. The longest wave-length at useful power levels is produced around 4 µm by neodymium or erbiumlasers operating at 1 or 2 µm, that are shifted to the longer wavelength with op-tical parametric oscillators. The limits at the short and long wavelengths are de-termined mainly by a lack of nonlinear crystals with a sufficiently high-damagethreshold or nonlinear coefficient.
Many industrial, medical, and military applications require a different wave-length than the fundamental output available from standard lasers. For ex-ample, most materials have higher absorption at shorter wavelengths, thereforefrequency-doubled neodymium lasers are often preferred over fundamental op-eration. Also, the smallest spot size diameter that can be achieved from a laseris proportional to the wavelength. The fine structures of integrated circuits andsemiconductor devices require operation of the laser at the shortest wavelengthpossible. Also, by matching the wavelength of a laser to the peak absorptionof a specific material, the top layer of a multilayer structure can be removedselectively without damage to the layers underneath.
All Nd : glass lasers employed in inertial confinement fusion experiments areoperated at the third harmonic, i.e., 352 nm, because the shorter wavelength ismore optimum for pellet compression compared to the fundamental output. Med-ical applications require solid-state lasers operating in a specific spectral rangefor control of the absorption depth of the radiation in the skin, tissue, or bloodvessels. Frequency agility is required from lasers employed in instruments usedfor absorption measurements, spectroscopy, sensing devices, analytical chemistry,etc. A fixed or tunable laser in conjunction with harmonic generators and/or anoptical parametric oscillator is usually employed to meet these requirements.
Introduction 11
Military rangefinders need to operate in a region that does not cause eye dam-age because most of the time these systems are employed in training exercises.A wavelength of 1.5 µm poses the least eye hazard. This wavelength is obtainedfrom Q-switched erbium lasers or from neodymium lasers that are wavelength-shifted with an optical parametric oscillator or Raman cell. Lasers designed todefeat missile threats, so-called infrared countermeasure lasers, have to operatein the 2 to 4 µm region. Output in this spectral range can be obtained fromneodymium or erbium lasers, wavelength-shifted with one or two optical para-metric amplifiers.
Spatial Beam Characteristics. Virtually all laser applications benefit from adiffraction-limited beam. Such a beam has the lowest beam divergence and pro-duces the smallest spot if focused by a lens. However, there is a trade-off betweenoutput power and beam quality. Lasers in the multihundred or kilowatt outputrange employed for metal cutting or welding applications have beams that aremany times diffraction-limited. On the other hand, lasers that are employed formicromachining applications and semiconductor processing, where a minimumspot size and kerf-width is essential, are mostly operated very close to the diffrac-tion limit.
Future Trends. The replacements of flashlamps and arc lamps with laser diodearrays will continue even for large solid-state lasers because the increase in sys-tems efficiency, beam quality and reliability, is compelling. Also, the push forsolid-state lasers, with ever higher average output powers will continue. Conceptsfor lasers at the 100 kW level are already being developed. Most smaller lasershave output beams that are close to the diffraction limit. A particular challenge isto improve the beam quality of solid-state lasers with output powers in the multi-hundred or kilowatt regime.
The trend for smaller lasers, certainly for military lasers, is toward systemswhich do not require liquid cooling. Also, the search continues for new nonlin-ear crystals with high-damage thresholds and large nonlinear coefficients, par-ticularly for the infrared and ultraviolet regions. Even with diode pumping, solid-state lasers are not particularly efficient radiation sources, converting at best about10% of electric input into useful output. Further improvements in the efficiencyof diode pump sources as a result of refinements in diode structure and process-ing techniques, coupled with a further optimization of laser materials and designs,could increase the efficiency of solid-state lasers to about 20 or 30%.

1
Energy Transfer Between Radiationand Atomic Transitions
1.1 Optical Amplification
1.2 Interaction of Radiation with Matter
1.3 Absorption and Optical Gain
1.4 Creation of a Population Inversion
1.5 Laser Rate Equations
References
Exercises
In this chapter we shall outline the basic ideas underlying the operation of solid-state lasers. In-depth treatments of laser physics can be found in [1], [2].
1.1 Optical Amplification
To understand the operation of a laser we have to know some of the principlesgoverning the interaction of radiation with matter.
Atomic systems such as atoms, ions, and molecules can exist only in discreteenergy states. A change from one energy state to another, called a transition, isassociated with either the emission or the absorption of a photon. The wavelengthof the absorbed or emitted radiation is given by Bohr’s frequency relation
E2 − E1 = hν21, (1.1)
where E2 and E1 are two discrete energy levels, ν21 is the frequency, and h isPlanck’s constant. An electromagnetic wave whose frequency ν21 corresponds toan energy gap of such an atomic system can interact with it. To the approximationrequired in this context, a laser medium can be considered an ensemble of very
12

1.1. Optical Amplification 13
many identical atomic systems. At thermal equilibrium, the lower energy statesin the medium are more heavily populated than the higher energy states. A waveinteracting with the laser system will raise the atoms (ions, molecules) from lowerto higher energy levels and thereby experience absorption.
The operation of a laser requires that the energy equilibrium of a laser materialbe changed such that more atoms (ions, molecules) populate higher rather thanlower energy states. This is achieved by an external pump source that supplies theenergy required to transfer atoms (ions, molecules) from a lower energy level to ahigher one. The pump energy thereby causes a “population inversion.” An electro-magnetic wave of appropriate frequency, incident on the “inverted” laser material,will be amplified because the incident photons cause the atoms (ions, molecules)in the higher level to drop to a lower level and thereby emit additional photons.As a result, energy is extracted from the atomic system and supplied to the radia-tion field. The release of the stored energy by interaction with an electromagneticwave is based on stimulated or induced emission.
Stated very briefly, when a material is excited in such a way as to providemore atoms (or molecules) in a higher energy level than in some lower level, thematerial will be capable of amplifying radiation at the frequency correspondingto the energy level difference. The acronym “laser” derives its name from thisprocess: “Light Amplification by Stimulated Emission of Radiation.”
A quantum mechanical treatment of the interaction between radiation and mat-ter demonstrates that the stimulated emission is, in fact, completely indistinguish-able from the stimulating radiation field. This means that the stimulated radia-tion has the same directional properties, same polarization, same phase, and samespectral characteristics as the stimulating emission. These facts are responsiblefor the extremely high degree of coherence which characterizes the emission fromlasers. The fundamental nature of the induced or stimulated emission process wasalready described by Albert Einstein and Max Planck.
Common to all laser amplifiers are at least two elements: a laser medium inwhich a population inversion among atoms, ions, or molecules can be achieved,and a pump process to supply energy to the system in order to maintain a nonequi-librium state. For a laser oscillator, additionally a feedback mechanism is requiredfor radiation to build up. Typically, two mirrors facing each other provide thisfeedback.
Whether a population inversion occurs within atoms, ions, or molecules, andwhether the pump energy supplied to the medium is in the form of optical radia-tion, electrical current, kinetic energy due to electron impact in a gas discharge,or an exothermic reaction, depends on the type of laser and the type of activemedium, i.e., solid-state, liquid, semiconductor, or gas.
Given below are a few examples of different laser media and excitationmethods.
In solid-state lasers, the subject treated in this book, the active medium is acrystal or glass host doped with a relatively small percentage of ions from the rareearth, actinide, or iron groups of the periodic table. The energy levels and asso-

14 1. Energy Transfer Between Radiation and Atomic Transitions
ciated transition frequencies result from the different quantum energy levels ofallowed states of the electrons orbiting the nuclei of atoms. Population inversionoccurs within inner, incomplete electron shells of ions embedded in the crystallineor glass host. Excitation is by means of pump radiation from a light source suchas a flashlamp, continuous-wave (cw) arc lamp, or diode laser. Pump radiationabsorbed by the active ions raises the electrons to higher energy levels.
In a liquid or dye laser, the active medium is an organic dye in a liquid sol-vent. Intense optical pumping creates a population inversion of electron transi-tions within the dye molecule.
In semiconductor lasers, also referred to as injection lasers, radiation is emit-ted as a consequence of carrier injection in a forward-biased semiconductor p–njunction. Since the junction defines a diode, the laser is commonly called a diodelaser. Energy levels in a semiconductor are defined by the conduction band andthe valence band separated by a band gap. The p–n junction is made of p-typesemiconductor material which accepts electrons (or produces holes or positivecarriers) and n-type material which is a donor of excess electrons (or negativecarriers). The n-type material with a large electron density in the conduction bandis brought into intimate contact with the p-type material with a large hole densityin the valence band. In a forward biased p–n junction, current will flow, electronsin the n-type material are injected into the p-type region, while positive holesfrom the p-region are injected into the n-type region. When an electron meets apositive hole, they recombine, the electron transitions from the conduction bandto the valence band, emitting a photon equal to the band gap energy. From a laserpoint of view, injected electrons in the p-type region (so-called minority carri-ers) and holes injected into the n-region represent a population inversion. Diodelasers are used as pump sources for solid-state lasers; therefore their design andperformance characteristics will be discussed later in this book.
In gases, the various particles have the mobility to excite higher energy levelsby collision. In most common gas lasers, inversion is achieved by passing currentthrough the gas to create a discharge. The active species can be a neutral atomsuch as in the helium–neon laser or an ion such as in the argon ion laser. The mosttypical of the neutral atomic gas lasers is the He–Ne laser. When an He atom,excited to a higher state by electric discharge, collides with an Ne atom in theground state, the excitation energy of the He is transferred to Ne, and as a resultthe distribution of Ne atoms at the higher energy state increases. Lasing action isthe result of electron transitions in the neutral atom Ne.
In molecular gas lasers the transition between the energy levels of a moleculeis exploited for laser action. For example, in a CO2 laser, the multiatom moleculeCO2 exhibits energy levels that arise from the vibrational and rotational motionsof the molecule as a whole. Since CO2 is a triatomic linear molecule, it has a sym-metrical stretching and two bending vibration modes. In the vibrational–rotationalmolecular lasers, such as CO2, the motion of the molecule rather than electronictransitions are responsible for laser action. Pump energy to raise the molecules tohigher energy levels is provided by the electrical energy of a gas discharge.

1.2. Interaction of Radiation with Matter 15
In some molecular lasers, a population inversion is achieved on electronic tran-sitions within the molecule, rather than on vibrational–rotational energy levels.An example is the excimer laser. An excimer, which is a contraction of an exciteddimer, is a molecule consisting of two atoms that can exist only in the excitedstate. Population inversion involves transitions between different electronic statesof the diatomic molecule. An example of this family of lasers is the xenon fluoridelaser.
In the lasers discussed so far, electrical energy is used to drive the pump mech-anism which creates a population inversion. In chemical lasers a population inver-sion is directly produced by an exothermic reaction of two gases. In the heliumfluoride and deuterium fluoride laser, the gases enter a chamber through a setof nozzles. As soon as they are mixed together they react and a fraction of thechemical energy released in the exothermic reaction goes into excitation of themolecules to form vibrationally excited HF or DF.
1.2 Interaction of Radiation with Matter
Many of the properties of a laser may be readily discussed in terms of the absorp-tion and emission processes which take place when an atomic system interactswith a radiation field. In the first decade of the last century Planck described thespectral distribution of thermal radiation, and in the second decade Einstein, bycombining Planck’s law and Boltzmann statistics, formulated the concept of stim-ulated emission. Einstein’s discovery of stimulated emission provided essentiallyall of the theory necessary to describe the physical principle of the laser.
1.2.1 Blackbody Radiation
When electromagnetic radiation in an isothermal enclosure, or cavity, is in ther-mal equilibrium at temperature T , the distribution of radiation density �(ν) dν,contained in a bandwidth dν, is given by Planck’s law
�(ν) dν = 8πν2 dν
c3
hν
ehν/kT − 1, (1.2)
where �(ν) is the radiation density per unit frequency [J s/cm3], k is Boltzmann’sconstant, and c is the velocity of light. The spectral distribution of thermal ra-diation vanishes at ν = 0 and ν → ∞, and has a peak which depends on thetemperature.
The factor
8πν2
c3= pn (1.3)
in (1.2) gives the density of radiation modes per unit volume and unit frequencyinterval. The factor pn can also be interpreted as the number of degrees of freedom

16 1. Energy Transfer Between Radiation and Atomic Transitions
associated with a radiation field, per unit volume, per unit frequency interval. Theexpression for the mode density pn [modes s/cm3] plays an important role inconnecting the spontaneous and the induced transition probabilities.
For a uniform, isotropic radiation field, the following relationship is valid
W = �(ν)c
4, (1.4)
where W is the blackbody radiation [W/cm2] which will be emitted from an open-ing in the cavity of the blackbody. Many solids radiate like a blackbody. There-fore, the radiation emitted from the surface of a solid can be calculated from (1.4).
According to the Stefan–Boltzmann equation, the total blackbody radiation is
W = σT 4, (1.5)
where σ = 5.68 × 10⁻¹² W/cm2 K4. The emitted radiation W has a maximumwhich is obtained from Wien’s displacement law
λmax
µm= 2893
T/K. (1.6)
For example, a blackbody at a temperature of 5200 K has its radiation peak at5564 A, which is about the center of the visible spectrum.
1.2.2 Boltzmann’s Statistics
According to a basic principle of statistical mechanics, when a large collection ofsimilar atoms is in thermal equilibrium at temperature T, the relative populationsof any two energy levels E1 and E2, such as the ones shown in Fig. 1.1, must berelated by the Boltzmann ratio
N2
N1= exp
(−(E2 − E1)
kT
), (1.7)
FIGURE 1.1. Two energy levels with population N1, N2 and degeneracies g1, g2, respec-tively.

1.2. Interaction of Radiation with Matter 17
where N1 and N2 are the number of atoms in the energy levels E1 and E2, re-spectively. For energy gaps large enough that E2 − E1 = hν21 � kT , the ratiois close to zero, and there will be very few atoms in the upper energy level atthermal equilibrium. The thermal energy kT at room temperature (T ≈ 300 K)corresponds to an energy gap hν with ν ≈ 6 × 10¹² Hz, which is equivalent inwavelength to λ ≈ 50µm. Therefore, for any energy gap whose transition fre-quency ν21 lies in the near-infrared or visible regions, the Boltzmann exponentwill be very small at normal temperatures. The number of atoms in any upperlevel will then be very small compared to the lower levels. For example, in rubythe ground level E1 and the upper laser level E2 are separated by an energy gapcorresponding to a wavelength of λ ≈ 0.69µm. Since h = 6.6 × 10⁻³⁴ W s2,then E2 − E1 = hν = 2.86 × 10⁻¹⁹ W s. With k = 1.38 × 10⁻²³ W s K andT = 300 K, it follows that N2/N1 ≈ exp(−69). Therefore at thermal equilibriumvirtually all the ions will be in the ground level.
Equation (1.7) is valid for atomic systems having only nondegenerate levels. Ifthere are gi different states of the atom corresponding to the energy Ei , then gi isdefined as the degeneracy of the i th energy level.
We recall that atomic systems, such as atoms, ions, and molecules, can existonly in certain stationary states, each of which corresponds to a definite valueof energy and thus specifies an energy level. When two or more states have thesame energy, the respective level is called degenerate, and the number of stateswith the same energy is the multiplicity of the level. All states of the same energylevel will be equally populated, therefore the number of atoms in levels 1 and 2is N1 = g1 N ′
1 and N2 = g2 N ′2, where N ′
1 and N ′2 refer to the population of any
of the states in levels 1 and 2, respectively. It follows then from (1.7) that thepopulations of the energy levels 1 and 2 are related by the formula
N2
N1= g2
g1
N ′2
N ′1
= g2
g1exp
(−(E2 − E1)
kT
). (1.8)
At absolute zero temperature, Boltzmann’s statistics predict that all atoms will bein the ground state. Thermal equilibrium at any temperature requires that a statewith a lower energy be more densely populated than a state with a higher energy.Therefore N2/N1 is always less than unity for E2 > E1 and T > 0. This meansthat optical amplification is not possible in thermal equilibrium.
1.2.3 Einstein’s Coefficients
We can most conveniently introduce the concept of Einstein’s A and B coeffi-cients by loosely following Einstein’s original derivation. To simplify the discus-sion, let us consider an idealized material with just two nondegenerate energylevels, 1 and 2, having populations of N1 and N2, respectively. The total numberof atoms in these two levels is assumed to be constant
N1 + N2 = Ntot. (1.9)
18 1. Energy Transfer Between Radiation and Atomic Transitions
Radiative transfer between the two energy levels, which differ by E2−E1 = hν21,is allowed. The atom can transfer from state E2 to the ground state E1 by emittingenergy; conversely, transition from state E1 to E2 is possible by absorbing energy.The energy removed or added to the atom appears as quanta of hν21. We canidentify three types of interaction between electromagnetic radiation and a simpletwo-level atomic system.
Absorption. If a quasi-monochromatic electromagnetic wave of frequency ν21passes through an atomic system with energy gap hν21, then the population of thelower level will be depleted at a rate proportional both to the radiation density�(ν) and to the population N1 of that level
∂N1
∂t= −B12�(ν)N1, (1.10)
where B12 is a constant of proportionality with dimensions cm3/s2 J.The product B12�(ν) can be interpreted as the probability per unit frequency
that transitions are induced by the effect of the field.
Spontaneous Emission. After an atom has been raised to the upper level by ab-sorption, the population of the upper level 2 decays spontaneously to the lowerlevel 1 at a rate proportional to the upper level population
∂N2
∂t= −A21 N2, (1.11)
where A21 is a constant of proportionality with dimension s−1. The quantity A21,being a characteristic of the pair of energy levels in question, is called the sponta-neous transition probability because this coefficient gives the probability that anatom in level 2 will spontaneously change to a lower level 1 within a unit of time.
Spontaneous emission is a statistical function of space and time. With a largenumber of spontaneously emitting atoms there is no phase relationship betweenthe individual emission processes; the quanta emitted are incoherent. Spontaneousemission is characterized by the lifetime of the electron in the excited state, afterwhich it will spontaneously return to the lower state and radiate away the energy.This can occur without the presence of an electromagnetic field.
Equation (1.11) has a solution
N2(t) = N2(0) exp
(−t
τ21
), (1.12)
where τ21 is the lifetime for spontaneous radiation of level 2. This radiation life-time is equal to the reciprocal of the Einstein coefficient,
τ21 = A−121 . (1.13)
In general, the reciprocal of the transition probability of a process is called itslifetime.
1.2. Interaction of Radiation with Matter 19
Stimulated Emission. Emission takes place not only spontaneously but also un-der stimulation by electromagnetic radiation of the appropriate frequency. In thiscase, the atom gives up a quantum to the radiation field by “induced emission”according to
∂N2
∂t= −B21�(ν21)N2, (1.14)
where B21 again is a constant of proportionality.Radiation emitted from an atomic system in the presence of external radia-
tion consists of two parts. That part whose intensity is proportional to A21 is thespontaneous radiation; its phase is independent of that of the external radiation.The part whose intensity is proportional to �(ν)B21 is the stimulated radiation;its phase is the same as that of the stimulating external radiation. The probabilityof induced transition is proportional to the energy density of external radiation incontrast to spontaneous emission.
The quantum that is emitted to the field by the induced emission is coherentwith it. The useful parameter for laser action is the B21 coefficient; the A21 coef-ficient represents a loss term and introduces into the system photons that are notphase-related to the incident photon flux of the electric field. Thus the spontaneousprocess represents a noise source in a laser.
If we combine absorption, spontaneous, and stimulated emission, as expressedby (1.10), (1.11), and (1.14) we can write, for the change of the upper- and lower-level populations in our two-level model,
∂N1
∂t= −∂N2
∂t= B21�(ν)N2 − B12�(ν)N1 + A21 N2. (1.15)
The relation
∂N1
∂t= −∂N2
∂t(1.16)
follows from (1.9).In thermal equilibrium, the number of transitions per unit time from E1 to E2
must be equal to the number of transitions from E2 to E1. Certainly, in thermalequilibrium
∂N1
∂t= ∂N2
∂t= 0. (1.17)
Therefore we can write
N2 A21Spontaneousemission
+ N2�(ν)B21Stimulatedemission
= N1�(ν)B12Absorption
. (1.18)
Using the Boltzmann equation (1.8) for the ratio N2/N1, we then write the aboveexpression as

20 1. Energy Transfer Between Radiation and Atomic Transitions
�(ν21) = (A21/B21)
(g1/g2)(B12/B21) exp(hν21/kT )− 1. (1.19)
Comparing this expression with the blackbody radiation law (1.2), we see that
A21
B21= 8πν2hν
c3and B21 = g1 B12
g2. (1.20)
The relations between the A’s and B’s are known as Einstein’s relations. Thefactor 8πν2/c3 in (1.20) is the mode density pn given by (1.3).
In solids the speed of light is c = c0/n, where n is the index of refraction andc0 is the speed of light in vacuum.
For a simple system with no degeneracy, that is, one in which g1 = g2, wesee that B21 = B12. Thus, the Einstein coefficients for stimulated emission andabsorption are equal. If the two levels have unequal degeneracy, the probabilityfor stimulated absorption is no longer the same as that for stimulated emission.
1.2.4 Phase Coherence of Stimulated Emission
The stimulated emission provides a phase-coherent amplification mechanism foran applied signal. The signal extracts from the atoms a response that is directlyproportional to, and phase-coherent with, the electric field of the stimulating sig-nal. Thus the amplification process is phase-preserving. The stimulated emissionis, in fact, completely indistinguishable from the stimulating radiation field. Thismeans that the stimulated emission has the same directional properties, same po-larization, same phase, and same spectral characteristics as the stimulating emis-sion. These facts are responsible for the extremely high degree of coherencethat characterizes the emission from lasers. The proof of this fact is beyond thescope of this elementary introduction, and requires a quantum mechanical treat-ment of the interaction between radiation and matter. However, the concept of in-duced transition, or the interaction between a signal and an atomic system, can bedemonstrated, qualitatively, with the aid of the classical electron-oscillator model.
Electromagnetic radiation interacts with matter through the electric charges inthe substance. Consider an electron that is elastically bound to a nucleus. One canthink of electrons and ions held together by spring-type bonds which are capableof vibrating around equilibrium positions. An applied electric field will causea relative displacement between the electron and nucleus from their equilibriumposition. They will execute an oscillatory motion about their equilibrium position.Therefore, the model exhibits an oscillatory or resonant behavior and a responseto an applied field. Since the nucleus is so much heavier than the electron, weassume that only the electron moves. The most important model for understandingthe interaction of light and matter is that of the harmonic oscillator. We take asour model a single electron, assumed to be bound to its equilibrium position by alinear restoring force. We may visualize the electron as a point of mass suspendedby springs. Classical electromagnetic theory asserts that any oscillating electric

1.3. Absorption and Optical Gain 21
charge will act as a miniature antenna or dipole and will continuously radiateaway electromagnetic energy to its surroundings.
1.3 Absorption and Optical Gain
In this section we will develop the quantitative relations that govern the absorptionand amplification processes in substances. This requires that we increase the real-ism of our mathematical model by introducing the concept of atomic lineshapes.Therefore, the important features and the physical processes that lead to differentatomic lineshapes will be considered first.
1.3.1 Atomic Lineshapes
In deriving Einstein’s coefficients we have assumed a monochromatic wave withfrequency ν21 acting on a two-level system with an infinitely sharp energy gaphν21. We will now consider the interaction between an atomic system having afinite transition linewidth �ν and a signal with a bandwidth dν.
Before we can obtain an expression for the transition rate for this case, it isnecessary to introduce the concept of the atomic lineshape function g(ν, ν0). Thedistribution g(ν, ν0), centered at ν0, is the equilibrium shape of the linewidth-broadened transitions. Suppose that N2 is the total number of ions in the upperenergy level considered previously. The spectral distribution of ions per unit fre-quency is then
N (ν) = g(ν, ν0)N2. (1.21)
If we integrate both sides over all frequencies we have, to obtain N2 as a result,∫ ∞
0N (ν) dν = N2
∫ ∞
0g(ν, ν0) dν = N2. (1.22)
Therefore, the lineshape function must be normalized to unity∫ ∞
0g(ν, ν0) dν = 1. (1.23)
If we know the function g(ν, ν0), we can calculate the number of atoms N (ν) dνin level 1 which are capable of absorbing in the frequency range ν to ν + dν, orthe number of atoms in level 2 which are capable of emitting in the same range.
From (1.21) we have
N (ν) dν = g(ν, ν0) dν N2. (1.24)
From the foregoing it follows that g(ν, ν0) can be defined as the probability ofemission or absorption per unit frequency. Therefore g(ν) dν is the probabilitythat a given transition will result in an emission (or absorption) of a photon with
22 1. Energy Transfer Between Radiation and Atomic Transitions
energy between hν and h(ν + dν). The probability that a transition will occurbetween ν = 0 and ν = ∞ has to be 1.
It is clear from the definition of g(ν, ν0) that we can, for example, rewrite (1.11)in the form
−∂N2
∂t= A21 N2g(ν, ν0) dν, (1.25)
where N2 is the total number of atoms in level 2 and ∂N2/∂t is the number ofphotons spontaneously emitted per second between ν and ν + dν.
The linewidth and lineshape of an atomic transition depends on the cause of linebroadening. Optical frequency transitions in gases can be broadened by lifetime,collision, or Doppler broadening, whereas transitions in solids can be broadenedby lifetime, dipolar or thermal broadening, or by random inhomogeneities. Allthese linewidth-broadening mechanisms lead to two distinctly different atomiclineshapes, the homogeneously and the inhomogeneously broadened line.
The Homogeneously Broadened Line
The essential feature of a homogeneously broadened atomic transition is that ev-ery atom has the same atomic lineshape and frequency response, so that a signalapplied to the transition has exactly the same effect on all atoms in the collection.This means that within the linewidth of the energy level each atom has the sameprobability function for a transition.
Differences between homogeneously and inhomogeneously broadened transi-tions show up in the saturation behavior of these transitions. This has a majoreffect on the laser operation. The important point about a homogeneous lineshapeis that the transition will saturate uniformly under the influence of a sufficientlystrong signal applied anywhere within the atomic linewidth.
Mechanisms which result in a homogeneously broadened line are lifetimebroadening, collision broadening, dipolar broadening, and thermal broadening.
Lifetime Broadening. This type of broadening is caused by the decay mecha-nisms of the atomic system. Spontaneous emission or fluorescence has a radiativelifetime. Broadening of the atomic transition due to this process is related to thefluorescence lifetime τ21 by �ωaτ21 = 1, where ωa is the bandwidth.
Actually, physical situations in which the lineshape and linewidth are deter-mined by the spontaneous emission process itself are vanishingly rare. Sincethe natural or intrinsic linewidth of an atomic line is extremely small, it is thelinewidth that would be observed from atoms at rest without interaction with oneanother.
Collision Broadening. Collision of radiating particles (atoms or molecules) withone another and the consequent interruption of the radiative process in a randommanner leads to broadening. Since an atomic collision interrupts either the emis-sion or the absorption of radiation, the long wave train that otherwise would bepresent becomes truncated. The atom restarts its motion after the collision witha completely random initial phase. After the collision, the process is restarted

1.3. Absorption and Optical Gain 23
without memory of the phase of the radiation prior to the collision. The resultof frequent collisions is the presence of many truncated radiative or absorptiveprocesses.
Since the spectrum of a wave train is inversely proportional to the length of thetrain, the linewidth of the radiation in the presence of collision is greater than thatof an individual uninterrupted process.
Collision broadening is observed in gas lasers operated at higher pressures,hence the name pressure broadening. At higher pressures, collisions between gasatoms limit their radiative lifetime. Collision broadening, therefore, is quite sim-ilar to lifetime broadening, in that the collisions interrupt the initial state of theatoms.
Dipolar Broadening. Dipolar broadening arises from interactions between themagnetic or electric dipolar fields of neighboring atoms. This interaction leads toresults very similar to collision broadening, including a linewidth that increaseswith increasing density of atoms. Since dipolar broadening represents a kind ofcoupling between atoms, so that excitation applied to one atom is distributed orshared with other atoms, dipolar broadening is a homogeneous broadening mech-anism.
Thermal Broadening. Thermal broadening is brought about by the effect of thethermal lattice vibrations on the atomic transition. The thermal vibrations of thelattice surrounding the active ions modulate the resonance frequency of each ionat a very high frequency. This frequency modulation represents a coupling mech-anism between the ions, therefore a homogeneous linewidth is obtained. Thermalbroadening is the mechanism responsible for the linewidth of the ruby laser andNd : YAG laser.
The lineshape of homogeneous broadening mechanisms lead to a Lorentzianlineshape for atomic response. For the normalized Lorentz distribution, the equa-tion
g(ν) =(�ν
2π
)[(ν − ν0)
2 +(�ν
2
)2]−1
(1.26)
is valid. Here, ν0 is the center frequency and �ν is the width between the half-power points of the curve. The factor �ν/2π assures normalization of the areaunder the curve according to (1.23). The peak value for the Lorentz curve is
g(ν0) = 2
π�ν. (1.27)
The Inhomogeneously Broadened Line
Mechanisms which cause inhomogeneous broadening tend to displace the cen-ter frequencies of individual atoms, thereby broadening the overall response of acollection without broadening the response of individual atoms. Different atomshave slightly different resonance frequencies on the same transition, for example,

24 1. Energy Transfer Between Radiation and Atomic Transitions
owing to Doppler shifts. As a result, the overall response of the collection is broad-ened. An applied signal at a given frequency within the overall linewidth interactsstrongly only with those atoms whose shifted resonance frequencies lie close tothe signal frequency. The applied signal does not have the same effect on all theatoms in an inhomogeneously broadened collection.
Since, in an inhomogeneously broadened line, interaction occurs only withthose atoms whose resonance frequencies lie close to the applied signal frequency,a strong signal will eventually deplete the upper-laser level in a very narrow fre-quency interval. The signal will eventually “burn a hole” in the atomic absorp-tion curve. Examples of inhomogeneous frequency-shifting mechanisms includeDoppler broadening and broadening due to crystal inhomogeneities.
Doppler Broadening. The apparent resonance frequencies of atoms undergoingrandom motions in a gas are shifted randomly so that the overall frequency re-sponse of the collection of atoms is broadened. A particular atom moving witha velocity component ν relative to an observer in the z-direction will radiate ata frequency measured by the observer as ν0(1 + v/c). When these velocities areaveraged, the resulting lineshape is Gaussian. Doppler broadening is one formof inhomogeneous broadening since each atom emits a different frequency ratherthan one atom having a probability distribution for emitting any frequency withinthe linewidth. In the actual physical situation, the Doppler line is best visualizedas a packet of homogeneous lines of width �νn, which superimpose to give theobserved Doppler shape. The He–Ne laser has a Doppler-broadened linewidth.Most visible and near-infrared gas laser transitions are inhomogeneously broad-ened by Doppler effects.
Line Broadening Due to Crystal Inhomogeneities. Solid-state lasers may beinhomogeneously broadened by crystalline defects. This happens only at low tem-peratures where the lattice vibrations are small. Random variations of disloca-tions, lattice strains, and so forth, may cause small shifts in the exact energy levelspacings and transition frequencies from ion to ion. Like Doppler broadening,these variations do not broaden the response on an individual atom, but they docause the exact resonance frequencies of different atoms to be slightly different.Thus random crystal imperfection can be a source of inhomogeneous broadeningin a solid-state laser crystal.
A good example of an inhomogeneously broadened line occurs in the fluores-cence of neodymium-doped glass. As a result of the so-called glassy state, thereare variations, from rare earth site to rare earth site, in the relative atomic positionsoccupied by the surrounding lattice ions. This gives rise to a random distributionof static crystalline fields acting on the rare earth ions. Since the line shifts cor-responding to such crystal-field variations are larger, generally speaking, than thewidth contributed by other factors associated with the transition, an inhomoge-neous line results.
The inhomogeneous-broadened linewidth can be represented by a Gaussian fre-quency distribution. For the normalized distribution, the equation
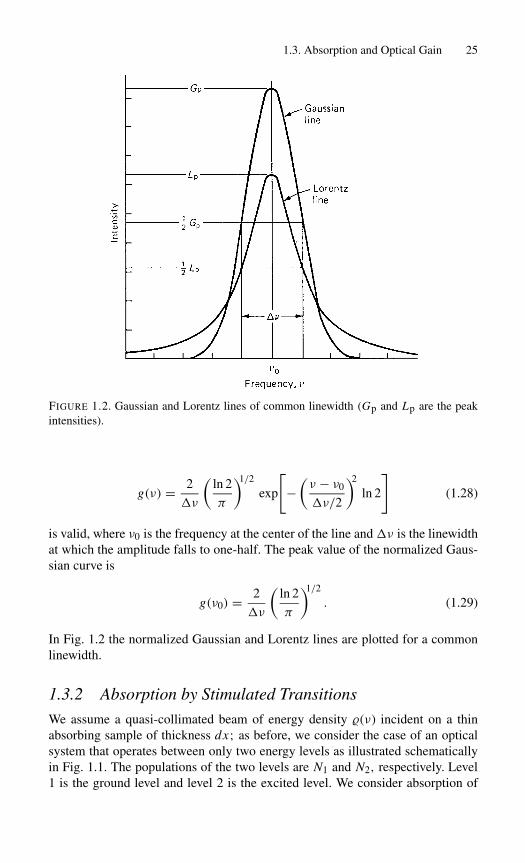
1.3. Absorption and Optical Gain 25
FIGURE 1.2. Gaussian and Lorentz lines of common linewidth (Gp and Lp are the peakintensities).
g(ν) = 2
�ν
(ln 2
π
)1/2
exp
[−(ν − ν0
�ν/2
)2
ln 2
](1.28)
is valid, where ν0 is the frequency at the center of the line and�ν is the linewidthat which the amplitude falls to one-half. The peak value of the normalized Gaus-sian curve is
g(ν0) = 2
�ν
(ln 2
π
)1/2
. (1.29)
In Fig. 1.2 the normalized Gaussian and Lorentz lines are plotted for a commonlinewidth.
1.3.2 Absorption by Stimulated Transitions
We assume a quasi-collimated beam of energy density �(ν) incident on a thinabsorbing sample of thickness dx; as before, we consider the case of an opticalsystem that operates between only two energy levels as illustrated schematicallyin Fig. 1.1. The populations of the two levels are N1 and N2, respectively. Level1 is the ground level and level 2 is the excited level. We consider absorption of

26 1. Energy Transfer Between Radiation and Atomic Transitions
radiation in the material and emission from the stimulated processes but neglectthe spontaneous emission. From (1.15) and (1.20) we obtain
−∂N1
∂t= �(ν)B21
(g2
g1N1 − N2
). (1.30)
As we recall, this relation was obtained by considering infinitely sharp energylevels separated by hν21 and a monochromatic wave of frequency ν21.
We will now consider the interaction between two linewidth-broadened energylevels with an energy separation centered at ν0, and a half-width of �ν charac-terized by g(ν, ν0) and a signal with center frequency νs and bandwidth dν. Thesituation is shown schematically in Fig. 1.3. The spectral width of the signal isnarrow, as compared to the linewidth-broadened transition. If N1 and N2 are thetotal number of atoms in levels 1 and 2, then the number of atoms capable ofinteracting with a radiation of frequency νs and bandwidth dν are(
g2
g1N1 − N2
)g(νs, ν0) dν. (1.31)
The net change of atoms in energy level 1 can be expressed in terms of energydensity �(ν) dν by multiplying both sides of (1.30) with photon energy hν anddividing by the volume V . We will further express the populations N1 and N2 aspopulation densities n1 and n2.
Equation (1.30) now becomes
− ∂
∂t[�(νs) dν] = �(νs) dν B21hνg(νs, ν0)
(g2
g1n1 − n2
). (1.32)
FIGURE 1.3. Linewidth-broadened atomic transition line centered at ν0 and narrow-bandsignal centered at νs.

1.3. Absorption and Optical Gain 27
This equation gives the net rate of absorbed energy in the frequency interval dνcentered around νs. In an actual laser system the wavelength of the emitted radi-ation, corresponding to the signal bandwidth dν in our model, is very narrow ascompared to the natural linewidth of the material. Ruby, for example, has a flu-orescence linewidth of 5 A, whereas the linewidth of the laser output is typically0.1 to 0.01 A. The operation of a laser, therefore, can be fairly accurately charac-terized as the interaction of linewidth-broadened energy levels with a monochro-matic wave. The photon density of a monochromatic radiation of frequency ν0can then be represented by a delta function δ(ν − ν0). After integrating (1.32)in the interval dν, we obtain, for a monochromatic signal of frequency νs and alinewidth-broadened transition,
−∂�(νs)
∂t= �(νs)B21hνsg(νs, ν0)
(g2
g1n1 − n2
). (1.33)
The signal will travel through the material of thickness dx in time dt = dx/c =(n0/c0) dx . Then, as the wave advances from x to x + dx , the decrease of energyin the beam is
−∂�(νs)
∂x= hνs�(νs)g(νs, ν0)B21
(g2
g1n1 − n2
)1
c. (1.34)
Integration of (1.34) gives
�(νs)
�0(νs)= exp
[−hνsg(νs, ν0)B21
(g2
g1n1 − n2
)x
c
]. (1.35)
If we introduce an absorption coefficient α0(νs),
α0(νs) =(
g2
g1n1 − n2
)σ21(νs), (1.36)
where
σ21(νs) = hνsg(νs, ν0)B21
c. (1.37)
Then we can write (1.35) as
�(νs) = �0(νs) exp[−α0(νs)x]. (1.38)
Equation (1.38) is the well-known exponential absorption equation for the ther-mal equilibrium condition n1g2/g1 > n2. The energy of the radiation decreasesexponentially with the depth of penetration into the substance. The maximumpossible absorption occurs when all atoms exist in the ground state n1. For equalpopulation of the energy states n1 = (g1/g2)n2, the absorption is eliminated andthe material is transparent. The parameter σ21 is the cross section for the radiativetransition 2 → 1. The cross section for stimulated emission σ is related to theabsorption cross section σ12 by the ratio of the level degeneracies,
28 1. Energy Transfer Between Radiation and Atomic Transitions
σ
σ12= g1
g2. (1.39)
The cross section is a very useful parameter to which we will refer in the followingchapters. If we replace B21 by the Einstein relation (1.20), we obtain σ21 in a formwhich we will find most useful:
σ(νs) = A21λ20
8πn20
g(νs, ν0). (1.40)
As we will see later, the gain for the radiation building up in a laser resonatorwill be highest at the center of the atomic transitions. Therefore, in lasers weare mostly dealing with stimulated transitions which occur at the center of thelinewidth.
If we assume ν ≈ νs ≈ ν0, we obtain, for the spectral stimulated emissioncross section at the center of the atomic transition for a Lorentzian lineshape,
σ = A21λ20
4π2n20�ν
, (1.41)
and for a Gaussian lineshape,
σ = A21λ20
4πn20�ν
(ln 2
π
)1/2
. (1.42)
Here we have introduced into (1.40) the peak values of the lineshape function, asgiven in (1.27) and (1.29) for the Lorentzian and Gaussian curves, respectively.For example, in the case of the R1 line of ruby, where λ0 = 6.94 × 10⁻⁵ cm,n0 = 1.76, τ21 = (1/A21) = 3 ms, and �ν = 11 cm−1 one finds, accordingto (1.41), σ = 4.0 × 10⁻²⁰ cm2. In comparing this value with the data providedin Table 2.2 (page 58), we have to distinguish between the spectroscopic crosssection and the effective stimulated emission cross section. (This will be discussedin Section 2.3.1 for the case of Nd : YAG.) The effective stimulated emission crosssection is the spectroscopic cross section times the occupancy of the upper laserlevel relative to the entire manifold population. In ruby, the upper laser level issplit into two sublevels, therefore the effective stimulated emission cross sectionis about half of the value calculated from (1.41).
1.3.3 Population Inversion
According to the Boltzmann distribution (1.7), in a collection of atoms at thermalequilibrium there are always fewer atoms in a higher-lying level E2 than in alower level E1. Therefore the population difference N1 − N2 is always positive,which means that the absorption coefficient α0(νs) in (1.36) is positive and theincident radiation is absorbed (Fig. 1.4).

1.3. Absorption and Optical Gain 29
FIGURE 1.4. Relative populations in two energy levels as given by the Boltzmann relationfor thermal equilibrium.
Suppose that it were possible to achieve a temporary situation such that thereare more atoms in an upper energy level than in a lower energy level. The normallypositive population difference on that transition then becomes negative, and thenormal stimulated absorption, as seen from an applied signal on that transition, iscorrespondingly changed to stimulated emission or amplification of the appliedsignal. That is, the applied signal gains energy as it interacts with the atoms andhence is amplified. The energy for this signal amplification is supplied by theatoms involved in the interaction process. This situation is characterized by anegative absorption coefficient α(νs) according to (1.36). From (1.34) it followsthat ∂�(ν)/∂x > 0.
The essential condition for amplification is that there are more atoms in anupper energy level than in a lower energy level; i.e., for amplification,
N2 > N1 if E2 > E1, (1.43)
as illustrated in Fig. 1.5. The resulting negative sign of the population difference(N2 − g2 N1/g1) on that transition is called a population inversion. Populationinversion is clearly an abnormal situation; it is never observed at thermal equi-librium. The point at which the population of both states is equal is called the“inversion threshold.”
Stimulated absorption and emission processes always occur side by side inde-pendently of the population distribution among the levels. So long as the popula-tion of the higher energy level is smaller than that of the lower energy level, thenumber of absorption transitions is larger than that of the emission transitions, sothat there is an overall attenuation of the radiation. When the numbers of atomsin both states are equal, the number of emissions becomes equal to the number

30 1. Energy Transfer Between Radiation and Atomic Transitions
FIGURE 1.5. Inverted population difference required for optical amplification.
of absorptions; the material is then transparent to the incident radiation. As soonas the population of the higher level becomes larger than that of the lower level,emission processes predominate and the radiation is enhanced collectively duringpassage through the material. To produce an inversion requires a source of energyto populate a specified energy level; we call this energy the pump energy.
In Section 1.4 we will discuss the type of energy level structure an atomic sys-tem must possess in order to make it possible to generate an inversion. Techniquesby which the ions of a solid-state laser can be raised or pumped into upper energylevels are discussed in Section 6.1. Depending on the atomic system involved, aninverted population condition may be obtainable only on a transient basis, yield-ing pulsed laser action; or it may be possible to maintain the population inversionon a steady-state basis, yielding cw laser action.
The total amount of energy which is supplied by the atoms to the light wave is
E = �Nhν, (1.44)
where �N is the total number of atoms which are caused to drop from the upperto the lower energy level during the time the signal is applied. If laser action isto be maintained, the pumping process must continually replenish the supply ofupper-state atoms. The size of the inverted population difference is reduced notonly by the amplification process but also by spontaneous emission that alwaystends to return the energy level populations to their thermal equilibrium values.
1.4 Creation of a Population Inversion
We are concerned in this section with how the necessary population inversionfor laser action is obtained in solid-state lasers. We can gain considerable under-

1.4. Creation of a Population Inversion 31
standing on how laser devices are pumped and how their population densities areinverted by studying some simplified but fairly realistic models.
The discussion up to this point has been based on a hypothetical 2 ↔ 1 tran-sition and has not been concerned with how the levels 2 and 1 fit into the energylevel scheme of the atom. This detached point of view must be abandoned whenone tries to understand how laser action takes place in a solid-state medium. Asalready noted, the operation of the laser depends on a material with narrow en-ergy levels between which electrons can make transitions. Usually these levelsare due to impurity ions in a host crystal. The pumping and laser processes inreal laser systems typically involve a very large number of energy levels, withcomplex excitation processes and cascaded relaxation processes among all theselevels. Operation of an actual laser material is properly described only by a many-level energy diagram. The main features can be understood, however, through thefamiliar three- or four-level idealizations of Figs. 1.6 and 1.7. More detailed en-ergy level diagrams of some of the most important solid-state laser materials arepresented in Chapter 2.
1.4.1 The Three-Level System
Figure 1.6 shows a diagram that can be used to explain the operation of an op-tically pumped three-level laser, such as ruby. Initially, all ions of the laser ma-terial are in the lowest level 1. Excitation is supplied to the solid by radiation offrequencies that produce absorption into the broad band 3. Thus, the pump lightraises ions from the ground state to the pump band, level 3. In general, the “pump-ing” band, level 3, is actually made up of a number of bands, so that the opticalpumping can be accomplished over a broad spectral range. Most of the excitedions are transferred by fast radiationless transitions into the intermediate sharplevel 2. In this process the energy lost by the electron is transferred to the lattice.
FIGURE 1.6. Simplified energy level diagram of a three-level laser.

32 1. Energy Transfer Between Radiation and Atomic Transitions
Finally, the electron returns to the ground level by the emission of a photon. It isthis last transition that is responsible for the laser action. If pumping intensity isbelow laser threshold, atoms in level 2 predominantly return to the ground stateby spontaneous emission. Ordinary fluorescence acts as a drain on the populationof level 2. After the pump radiation is extinguished, level 2 is emptied by fluores-cence at a rate that varies from material to material. In ruby, at room temperature,the lifetime of level 2 is 3 ms. When the pump intensity is above laser threshold,the decay from the fluorescent level consists of stimulated as well as spontaneousradiation; the stimulated radiation produces the laser output beam. Since the ter-minal level of the laser transition is the highly populated ground state, a veryhigh population must be reached in the E2 level before the 2 → 1 transition isinverted.
It is necessary, in general, that the rate of radiationless transfer from the upper-most level to the level at which the laser action begins is fast compared with theother spontaneous transition rates in a three-level laser. Therefore, the lifetime ofthe E2 state should be large in comparison with the relaxation time of the 3 → 2transition, that is,
τ21 � τ32. (1.45)
The number of ions N3 in level E3 is then negligible compared with the numberof ions in the other two states, i.e., N3 � N1, N2. Therefore,
N1 + N2 ≈ Ntot. (1.46)
A vital aspect of the three-level system is that the ions are in effect pumped di-rectly from level 1 into the metastable level 2 with only a momentary pause asthey pass through level 3. With these conditions, we can calculate as if only twolevels were present. In order that an equal population is achieved between the E2and E1 levels, one-half of all ions must be excited to the E2 level:
N2 = N1 = Ntot
2. (1.47)
In order to maintain a specified amplification, the population of the second levelmust be larger than that of the first level. In most cases that are of practical im-portance, however, the necessary inversion (N2 − N1) is small compared with thetotal number of all ions. The pump power necessary for maintaining this inversionis also small compared with the power necessary for achieving equal populationof the levels.
The disadvantage of a three-level system is that more than half of the ions inthe ground state must be raised to the metastable level E2. There are thus manyions present to contribute to the spontaneous emission. Moreover, each of theions which participate in the pump cycle transfer energy into the lattice from theE3 → E2 transition. This transition is normally radiationless, the energy beingcarried into the lattice by phonons.

1.4. Creation of a Population Inversion 33
1.4.2 The Four-Level System
The four-level laser system, which is characteristic of the rare earth ions in glassor crystalline host materials, is illustrated in Fig. 1.7. Note that a characteristic ofthe three-level laser material is that the laser transition takes place between theexcited laser level 2 and the final ground state 1, the lowest energy level of thesystem. This leads to low efficiency. The four-level system avoids this disadvan-tage. The pump transition extends again from the ground state (now level E0) toa wide absorption band E3. As in the case of the three-level system, the ions soexcited will proceed rapidly to the sharply defined level E2. The laser transition,however, proceeds now to a fourth, terminal level E1, which is situated above theground state E0. From here the ion undergoes a rapid nonradiative transition tothe ground level. In a true four-level system, the terminal laser level E1 will beempty. To qualify as a four-level system a material must possess a relaxation timebetween the terminal laser level and the ground level which is fast compared tothe fluorescence lifetime, that is, τ10 � τ21. In addition, the terminal laser levelmust be far above the ground state so that its thermal population is small. Theequilibrium population of the terminal laser level 1 is determined by the relation
N1
N0= exp
(−�E
kT
), (1.48)
where�E is the energy separation between level 1 and the ground state, and T isthe operating temperature of the laser material. If �E � kT, then N1/N0 � 1,and the intermediate level will always be relatively empty. In some laser materialsthe energy gap between the lower laser level and the ground state is relativelysmall and, therefore, they must be cooled to function as four-level lasers. In a four-level system an inversion of the 2 → 1 transition can occur even with vanishinglysmall pump power, and the high pump rate, necessary to maintain equilibrium
FIGURE 1.7. Simplified energy level diagram of a four-level laser.

34 1. Energy Transfer Between Radiation and Atomic Transitions
population in the aforementioned three-level system, is no longer needed. In themost favorable case, the relaxation times of the 3 → 2 and 1 → 0 transitions inthe four-level system are short compared with the spontaneous emission lifetimeof the laser transition τ21. Hence we can also carry out the calculations as if onlythe E1 and E2 states were populated.
1.4.3 The Metastable Level
After this brief introduction to the energy level structure of solid-state lasers wecan ask the question, “What energy level scheme must a solid possess to makeit a useful laser?” As we have seen in the previous discussion, the existenceof a metastable level is of paramount importance for laser action to occur. Therelatively long lifetime of the metastable level provides a mechanism by whichinverted population can be achieved. Most transitions of ions show rapid non-radiative decay, because the coupling of the internal atomic oscillations to thesurrounding lattice is strong. Radiative decay processes can occur readily, butmost have short lifetimes and broad linewidths. Only a few transitions of selectedions in solids turn out to be decoupled from the lattice vibrations. These transi-tions have a radiative decay that leads to relatively long lifetimes.
In typical laser systems with energy levels, such as illustrated by Figs. 1.6 and1.7, the 3 → 2 transition frequencies, as well as the 1 → 0 transition frequen-cies, all fall within the frequency range of the vibration spectrum of the hostcrystal lattice. Therefore, all these transitions can relax extremely rapidly by di-rect nonradiative decay, that is, by emitting a phonon to the lattice vibrations,with τ32, τ10 ≈ 10−8 to 10−11 s. However, the larger 3 → 0, 3 → 1, 2 → 0,and 2 → 1 energy gaps in these ions often correspond to transition frequenciesthat are higher than the highest possible vibration frequency of the crystal lat-tice. Such transitions cannot relax via simple single-phonon spontaneous emissionsince the lattice simply cannot accept phonons at those high frequencies. Thesetransitions must then relax either by radiative (photon) emission or by multiple-phonon processes. Since both these processes are relatively weak compared todirect single-phonon relaxation, the high-frequency transitions will have muchslower relaxation rates (τ21 ≈ 10−5 to 10−3 s in many cases). Therefore, the vari-ous levels lumped into level 3 will all relax mostly into level 2 while level 2 itselfis metastable and long-lived because there are no other levels located close belowit into which it can decay directly.
The existence of metastable levels follows from quantum mechanical consid-erations that will not be discussed here. However, for completeness we will atleast explain the term “forbidden transition.” As we have seen in Section 1.2.4,the mechanism by which energy exchange takes place between an atom and theelectromagnetic fields is the dipole radiation. As a consequence of quantum-mechanical considerations and the ensuing selection rules, transfer between cer-tain states cannot occur due to forbidden transitions. The term “forbidden” meansthat a transition among the states concerned does not take place as a result of theinteraction of the electric dipole moment of the atom with the radiation field. As
1.5. Laser Rate Equations 35
a result of the selection rules, an atom may get into an excited state from whichit will have difficulty returning to the ground state. A state from which all dipoletransitions to lower energy states are forbidden is metastable; an atom enteringsuch a state will generally remain in that state much longer than it would in anordinary excited state from which escape is comparatively easy.
In the absence of a metastable level, the ions which become excited by pumpradiation and are transferred to a higher energy level will return either directlyto the ground state by spontaneous radiation or by cascading down on interme-diate levels, or they may release energy by phonon interaction with the lattice.In order for the population to increase at the metastable laser level, several otherconditions have to be met. Let us consider the more general case of a four-levelsystem illustrated in Fig. 1.7. (Note that a three-level system can be thought ofas a special case of a four-level scheme where levels 1 and 0 coincide.) Pumpingtakes place between two levels and laser action takes place between two otherlevels. Energy from the pump band is transferred to the upper laser level by fastradiative transitions. Energy is removed from the lower laser level again by fastradiationless transitions.
For electrons in the pump band at level 3 to transfer to level 2 rather than re-turn directly to the ground state, it is required that τ30 � τ32. For population tobuild up, relaxation out of the lower level 1 has to be fast, τ21 � τ10. Thus, as afirst conclusion, we may say that if the right relaxation time ratio exists betweenany two levels (such as 3 and 2) in an energy level system, a population inversionshould be possible. If so, then obtaining a large enough inversion for successfullaser operation becomes primarily a matter of the right pumping method. The op-tical pumping method is generally feasible only in laser materials that combine anarrow laser emission line with a broad absorption transition, so that a broadbandintense light source can be used as the pump source. An exception is a solid-state laser that is pumped by another laser, such as a diode laser for example. Inthis case the requirement for a broad absorption range for the pump band can berelaxed.
Having achieved population inversion in a material by correct combination ofrelaxation times and the existence of broad pump bands, the linewidth of the lasertransition becomes very important. In Chapter 2 we will see that the optical gainfor a given population inversion is inversely proportional to linewidth. Therefore,the metastable level should have a sufficiently narrow linewidth.
1.5 Laser Rate Equations
The dynamic behavior of a laser can be described with reasonable precision bya set of coupled rate equations. In their simplest forms, a pair of simultaneousdifferential equations describe the population inversion and the radiation densitywithin a spatially uniform laser medium. We will describe the system in termsof the energy-level diagrams shown in Figs. 1.6 and 1.7. As we have seen in thepreceding discussions, two energy levels are of prime importance in laser action:

36 1. Energy Transfer Between Radiation and Atomic Transitions
the excited upper laser level E2 and the lower laser level E1. Thus, for manyanalyses of laser action, an approximation of the three- and four-level systems bya two-level representation is very useful.
The rate-equation approach used in this section involves a number of simpli-fying assumptions; in using a single set of rate equations we are ignoring lon-gitudinal and radial variations of the radiation within the laser medium. In spiteof these limitations, the simple rate-equation approach remains a useful tool and,properly used, provides a great deal of insight into the behavior of real solid-statelaser devices. We will derive from the rate equations the threshold condition forlaser actions, and obtain a first-order approximation of the relaxation oscillationsin a solid-state laser. Furthermore, in Chapter 4 we will use the rate equations tocalculate the gain in a laser amplifier.
In general, the rate equations are useful in predicting the gross features of thelaser output, such as average and peak power, Q-switched pulse-envelope shape,threshold condition, and so forth. On the other hand, many details of the nature ofthe laser emission are inaccessible from the point of view of a simple rate equa-tion. These include detailed descriptions of the spectral, temporal, and spatial dis-tributions of the laser emission. Fortunately, these details can often be accountedfor independently.
In applying the rate equations to the various aspects of laser operation, we willfind it more convenient to express the probability for stimulated emission �(ν)B21by the photon density φ and the stimulated emission cross section σ .
With (1.37) we can express the Einstein coefficient for stimulated emission B21in terms of the stimulated emission cross section σ(ν),
B21 = c
hνg(ν)σ (ν), (1.49)
where c = c0/n0 is the speed of light in the medium. The energy density per unitfrequency �(ν) is expressed in terms of the lineshape factor g(ν), the energy hν,and the photon density φ [photons/cm3] by
�(ν) = hνg(ν)φ. (1.50)
From (1.49) and (1.50) we obtain
B21�(ν) = cσ(ν)φ. (1.51)
1.5.1 Three-Level System
In order to approximate the three-level system with a two-level scheme, we as-sume that the transition from the pump band to the upper laser level is so fast thatN3 ≈ 0. Therefore pumping does not affect the other processes at all, except to al-low a mechanism of populating the upper level and thereby obtaining populationinversion (N2 > N1).

1.5. Laser Rate Equations 37
Looking at Fig. 1.6, this assumption requires that the relaxation time ratioτ32/τ21 be very small. In solid-state lasers τ32/τ21 ≈ 0 is a good approximation.Spontaneous losses from the pump band to the ground state can be expressed bythe quantum efficiency ηQ. This parameter, defined as
ηQ =(
1 + τ32
τ31
)−1
≤ 1, (1.52)
specifies what fraction of the total atoms excited to level 3 drop from there tolevel 2, thus becoming potentially useful for laser action. A small ηQ obviouslyrequires a correspondingly larger pump power.
The changes in the electron population densities in a three-level system, basedon the assumption that essentially all of the laser ions are in either levels 1 or 2,are
∂n1
∂t=(
n2 − g2
g1n1
)cφσ + n2
τ21− Wpn1 (1.53)
and
∂n2
∂t= −∂n1
∂t, (1.54)
since
ntot = n1 + n2, (1.55)
where Wp is the pumping rate [s−1].The terms of the right-hand side of (1.53) express the net stimulated emission,
the spontaneous emission, and the optical pumping.The time variation of the population in both levels due to absorption, sponta-
neous, and stimulated emission is obtained from (1.15). Note that the populationsN1 and N2 are now expressed in terms of population densities n1 and n2. To takeinto account the effect of pumping, we have added the term Wpn1, which can bethought of as the rate of supply of ions to the metastable level 2. More precisely,Wpn1 is the number of ions transferred from the ground level to the upper laserlevel per unit time per unit volume. The pump rate Wp is related to the pumpparameter W13 in Fig. 1.6 by
Wp = ηQW13. (1.56)
The negative sign in front of Wpn1 in (1.53) indicates that the pump mechanismremoves atoms from the ground level 1 and increases the population of level 2.
If we now define the inversion population density by
n = n2 − g2n1
g1, (1.57)

38 1. Energy Transfer Between Radiation and Atomic Transitions
we can combine (1.53), (1.54), and (1.57) to obtain
∂n
∂t= −γ nφσc − (n + ntot)(γ − 1)
τ f+ Wp(ntot − n), (1.58)
where
γ = 1 + g2
g1and τ f = τ21. (1.59)
In obtaining (1.58) we have used the relations
n1 = ntot − n
1 + g2/g1and n2 = n + (g2/g1)ntot
1 + g2/g1. (1.60)
Another equation, usually regarded together with (1.58), describes the rate ofchange of the photon density within the laser resonator,
∂φ
∂t= cφσn − φ
τc+ S, (1.61)
where τc is the decay time for photons in the optical resonator and S is the rate atwhich spontaneous emission is added to the laser emission.
If we consider for the moment only the first term on the right, which is theincrease of the photon density by stimulated emission, then (1.61) is identical to(1.33). However, for the time variation of the photon density in the laser resonatorwe must also take into account the decrease of radiation due to losses in the systemand the increase of radiation due to a small amount of spontaneous emission thatis added to the laser emission. Although very small, this term must be includedbecause it provides the source of radiation which initiates laser emission.
An important consideration for initiation of laser oscillation is the total numberp of resonant modes possible in the laser resonator volume V since in generalonly a few of these modes are initiated into oscillations. This number is given bythe familiar expression (1.3),
p = 8πν2�νV
c3, (1.62)
where ν is the laser optical frequency and �ν is the bandwidth of spontaneousemission. Let pL be the number of modes of the laser output. Then S can beexpressed as the rate at which spontaneous emission contributes to stimulatedemission, namely,
S = pLn2
pτ21. (1.63)
The reader is referred to Chapter 3 for a more detailed description of the factorτc which appears in (1.61). For now we only need to know that τc represents allthe losses in an optical resonator of a laser oscillator. Since τc has the dimension

1.5. Laser Rate Equations 39
of time, the losses are expressed in terms of a relaxation time. The decay of thephoton population in the cavity results from transmission and absorption at theend mirrors, “spillover” diffraction loss due to the finite apertures of the mirrors,scattering and absorptive losses in the laser material itself, etc. In the absence ofthe amplifying mechanism, (1.61) becomes
∂φ
∂t= − φ
τc, (1.64)
the solution of which is φ(τ) = φ0 exp(−t/τc).
The importance of (1.61) should be emphasized by noting that the right-handside of this equation describes the net gain per transit of an electromagnetic wavepassing through a laser material.
1.5.2 Four-Level System
We will assume again that the transition from the pump band into the upper laserlevel occurs very rapidly. Therefore the population of the pump band is negligible,that is, n3 ≈ 0. With this assumption the rate of change of the two laser levels ina four-level system is
dn2
dt= Wpng −
(n2 − g2
g1n1
)σφc −
(n2
τ21+ n2
τ20
), (1.65)
dn1
dt=(
n2 − g2
g1n1
)σφc + n2
τ21− n1
τ10, (1.66)
ntot = ng + n1 + n2 (1.67)
where ng is the population density of the ground level 0. From (1.65) it followsthat the upper laser level population in a four-level system increases because ofpumping and decreases because of stimulated emission and spontaneous emis-sions into levels 1 and 0. The lower level population increases because of stimu-lated and spontaneous emission and decreases by a radiationless relaxation pro-cess into the ground level. This process is characterized by the time constant τ10.In an ideal four-level system the terminal level empties infinitely fast to the groundlevel. If we let τ10 ≈ 0, then it follows from (1.66) that n1 = 0. In this case theentire population is divided between the ground level 0 and the upper level of thelaser transition. The system appears to be pumping from a large source that isindependent of the lower laser level. With τ10 = 0 and n1 = 0, we obtain thefollowing rate equation for the ideal four-level system
n = n2 (1.68)
and
ntot = ng + n2 ≈ ng since n2 � ng. (1.69)

40 1. Energy Transfer Between Radiation and Atomic Transitions
Therefore, instead of (1.58), we have
∂n2
∂t= −n2σφc − n2
τf+ Wp(ng − n2). (1.70)
The fluorescence decay time τf of the upper laser level is given by
1
τf= 1
τ21+ 1
τ20. (1.71)
In the equation for the rate of change of the upper laser level we have again takeninto account the fact that not all ions pumped to level 3 will end up at the upperlaser level. It is
Wp = ηQW03, (1.72)
where the quantum efficiency ηQ depends on the branching ratios that are therelative relaxation rates for the ions along the various possible downward paths,
ηQ =(
1 + τ32
τ31+ τ32
τ30
)−1
≤ 1. (1.73)
Strictly speaking the definition of ηQ given in (1.73) is the pump quantum effi-ciency that addresses the fact that some of the absorbed pump photons will decayto levels other than the upper laser level. The general definition of ηQ as given inChapters 3 and 7 also includes losses from the upper laser level as a result of non-radiative decay. These losses caused by quenching processes reduce the inversionavailable for laser action.
Summary
In thermal equilibrium lower energy states of ions or atoms are more heavilypopulated than higher energy states according to Boltzmann’s statistics. In orderfor stimulated emission rather than absorption to occur, the population betweentwo energy states has to be inverted, such that the higher energy level is moreheavily populated compared to the lower level. Energy to achieve this populationinversion is supplied by a pump source.
In a three-level laser the ground state of the electronic transition is also thelower laser level. At thermal equilibrium the majority of ions are in this level.Thus, at least half of the ions at the ground level must be transferred to the upperlaser level before laser action is possible.
In a four-level laser, the lower laser level lies at an energy level that is above theground state. Since the number of thermally excited ions in the lower laser level issmall, the population can be easily inverted by pumping a relatively small numberof ions into the upper laser level. Therefore it requires less energy to generate a
Exercises 41
population inversion in a four-level laser and the threshold will be lower comparedto a three-level system.
For both systems there must be a fast process that transfers excited ions fromthe pump level to the upper laser level. Futhermore in a four-level system, thelower laser level has to drain rapidly to the ground state to prevent laser action tocease.
The rate equation applicable to three- and four-level systems can be expressedby a single pair of equations, namely, (1.58) and (1.61), where γ = 1+g2/g1 for athree-level system and γ = 1 for a four-level system. The factor γ can be thoughtof as an “inversion reduction factor” since it corresponds to the net reductionin the population inversion after the emission of a single photon. In a four-levelsystem, see (1.70), we have γ = 1 since the population inversion density is onlyreduced by one for each photon emitted. For a three-level system (see (1.58)), wehave γ = 2 if we assume no degeneracy, that is, g2/g1 = 1. This reflects the factthat in this case the population inversion is reduced by two for each stimulatedemission of a photon because the emitting photon is not only lost to the upperlaser level, but also increases the lower laser level by one.
References[1] A. Yariv: Quantum Electronics, 4th ed. (Wiley, New York), 1991.
[2] A.E. Siegman: Lasers (University Science Books, Mill Valley, CA), 1986.
Exercises
1. A pretty good classical model of matter results when you think of an atom ashaving an electron attached to a massive nucleus by a spring so that it can un-dergo damped harmonic motion. Electrons, being charged particles, are drivento move under these constraints by applied electric fields. Since light is anelectromagnetic wave phenomenon having an electric field transverse to thedirection of propagation, we can try to understand light–matter interactions byasking how such a field causes the matter to react.
Solve for the motion of the driven, damped harmonic oscillator shown be-low, where the driving electric field propagating in the z-direction and polar-ized in the y-direction is E = E0 exp(i(ωt−kz))ay whereω is the frequency ofthe driving field, k is its wave vector, and ay is a unit vector in the y-direction.
(a) Find the resonant frequency for the electron by solving for the motion ofthe electron when it is not driven. When there is no damping, the resonantfrequency is called the natural frequency of the oscillator.
(b) What is the effect of damping on the motion (mathematically and inwords)?
(c) A material interacts with an electromagnetic wave by becoming polarizedand that polarization then radiates an electromagnetic wave. The polar-ization of a material is proportional to the sum of the dipole moments of
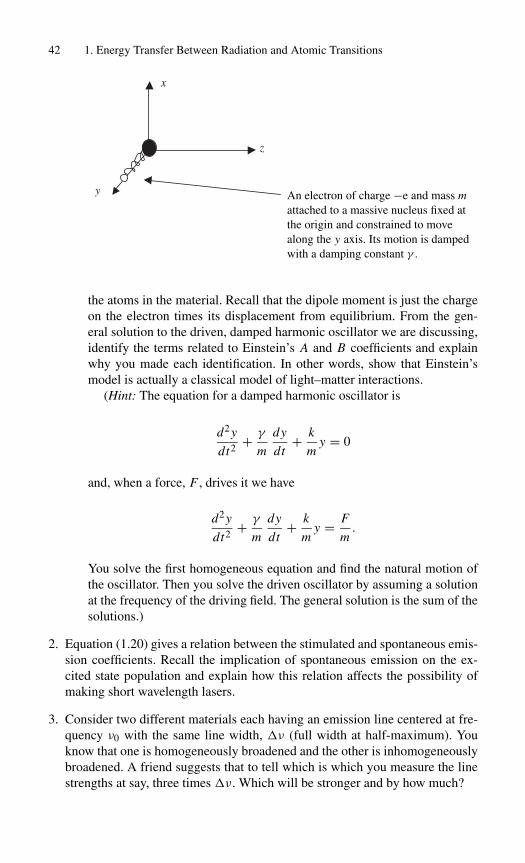
42 1. Energy Transfer Between Radiation and Atomic Transitions
y
x
z
An electron of charge −e and mass mattached to a massive nucleus fixed atthe origin and constrained to movealong the y axis. Its motion is dampedwith a damping constant γ .
the atoms in the material. Recall that the dipole moment is just the chargeon the electron times its displacement from equilibrium. From the gen-eral solution to the driven, damped harmonic oscillator we are discussing,identify the terms related to Einstein’s A and B coefficients and explainwhy you made each identification. In other words, show that Einstein’smodel is actually a classical model of light–matter interactions.
(Hint: The equation for a damped harmonic oscillator is
d2y
dt2+ γ
m
dy
dt+ k
my = 0
and, when a force, F , drives it we have
d2 y
dt2+ γ
m
dy
dt+ k
my = F
m.
You solve the first homogeneous equation and find the natural motion ofthe oscillator. Then you solve the driven oscillator by assuming a solutionat the frequency of the driving field. The general solution is the sum of thesolutions.)
2. Equation (1.20) gives a relation between the stimulated and spontaneous emis-sion coefficients. Recall the implication of spontaneous emission on the ex-cited state population and explain how this relation affects the possibility ofmaking short wavelength lasers.
3. Consider two different materials each having an emission line centered at fre-quency ν0 with the same line width, �ν (full width at half-maximum). Youknow that one is homogeneously broadened and the other is inhomogeneouslybroadened. A friend suggests that to tell which is which you measure the linestrengths at say, three times �ν. Which will be stronger and by how much?

Exercises 43
4. Is it possible to achieve an inverted population in a purely two-level system(assume equal degeneracy)? If so, then find the threshold for lasing in such asystem. If not, describe the interaction of a beam of light having a frequencycorresponding to the energy difference between the two levels when its photondensity gets very high? When this happens, what is the population of eachlevel?
5. Under what circumstances and at what temperature will the rate of transitiondue to thermal background radiation (proportional to the photon density timesthe Einstein B coefficient) be equal to the rate of spontaneous transition (pro-portional to the Einstein A coefficient) for a two-level system?

2
Properties of Solid-StateLaser Materials
2.1 Overview
2.2 Ruby
2.3 Nd : YAG
2.4 Nd : Glass
2.5 Nd : YLF
2.6 Nd : YVO4
2.7 Er : Glass
2.8 Yb : YAG
2.9 Alexandrite
2.10 Ti : Sapphire
References
Exercises
Materials for laser operation must possess sharp fluorescent lines, strong absorp-tion bands, and a reasonably high quantum efficiency for the fluorescent transitionof interest. These characteristics are generally shown by solids (crystals or glass)that incorporate in small amounts elements in which optical transitions can occurbetween states of inner, incomplete electron shells. Thus the transition metals, therare earth (lanthanide) series, and the actinide series are of interest in this con-nection. The sharp fluorescence lines in the spectra of crystals doped with theseelements result from the fact that the electrons involved in transitions in the op-tical regime are shielded by the outer shells from the surrounding crystal lattice.The corresponding transitions are similar to those of the free ions. In addition toa sharp fluorescence emission line, a laser material should possess pump bands
44

2.1. Overview 45
within the emission spectrum of readily available pump sources such as arc lampsand laser diode arrays.
The three principal elements leading to gain in a solid-state laser are:
• The host material with its macroscopic mechanical, thermal and optical prop-erties, and its unique microscopic lattice properties.
• The activator/sensitizer ions with their distinctive charge states and free-ionelectronic configurations.
• The optical pump source with its particular geometry, spectral irradiance, andtemporal characteristic.
These elements are interactive and must be selected self-consistently to achieve agiven system performance.
In this chapter we consider the properties of various host materials and activa-tor/sensitizer combinations.
2.1 Overview
The conditions for laser action at optical frequencies were first described bySchawlow and Townes [1] in 1958. The first demonstration of laser action byMaiman [2] was achieved in 1960 using ruby (Cr3+ : Al2O3), a crystalline solidsystem. The next step in the development of solid-state lasers was the operationof trivalent uranium in CaF2 and divalent samarium in CaF2.
Laser action in neodymium-doped glass and the first continuously operatingcrystal laser using Nd3+ : CaWO4 were reported in 1961. Since then laser actionhas been achieved from trivalent rare earths (Nd3+, Er3+, Ho3+, Ce3+, Tm3+,Pr3+, Gd3+, Eu3+, Yb3+), divalent rare earths (Sm2+, Dy2+, Tm2+), transitionmetals (Cr3+, Ni2+, Co2+, Ti3+, V2+), and the actinide ion U3+ embedded invarious host materials. Optically pumped laser action has been demonstrated inhundreds of ion-host crystal combinations covering a spectral range from the vis-ible to the mid-infrared.
The exceptionally favorable characteristics of the trivalent neodymium ion forlaser action were recognized at a relatively early stage in the search for solid-statelaser materials. Thus, Nd3+ was known to exhibit a satisfactorily long fluores-cence lifetime and narrow fluorescence linewidths in crystals with ordered struc-tures, and to possess a terminal state for the laser transition sufficiently high abovethe ground state so that cw operation at room temperature was readily feasible.Therefore, this ion was incorporated as a dopant in a variety of host materials, thatis, glass, CaWO4, CaMoO4, CaF2, LaF3, and so forth, in an effort to make useof its great potential. However, most of these early hosts displayed undesirableshortcomings, either from the standpoint of their intrinsic physical properties orbecause of the way in which they interacted with the Nd3+ ions. Finally, yttriumaluminum garnet (YAG) was explored by Geusic et al. [3] as a host for Nd3+, andits superiority to other host materials was quickly demonstrated.

46 2. Properties of Solid-State Laser Materials
2.1.1 Host Materials
Solid-state host materials may be broadly grouped into crystalline solids andglasses. The host must have good optical, mechanical, and thermal properties towithstand the severe operating conditions of practical lasers. Desirable proper-ties include hardness, chemical inertness, absence of internal strain and refractiveindex variations, resistance to radiation-induced color centers, and ease of fabri-cation.
Several interactions between the host crystal and the additive ion restrict thenumber of useful material combinations. These include size disparity, valence,and spectroscopic properties. Ideally, the size and valence of the additive ionshould match that of the host ion it replaces.
In selecting a crystal suitable for a laser ion host one must consider the follow-ing key criteria:
(a) The crystal must possess favorable optical properties. Variations in the indexof refraction lead to inhomogeneous propagation of light through the crystalwhich results in poor beam quality.
(b) The crystal must possess mechanical and thermal properties that will permithigh-average-power operation. The most important parameters are thermalconductivity, hardness, and fracture strength.
(c) The crystal must have lattice sites that can accept the dopant ions and thathave local crystal fields of symmetry and strength needed to induce the de-sired spectroscopic properties. In general, ions placed in a crystal host shouldhave long radiative lifetimes with emission cross sections near 10−20 cm2.
(d) It must be possible to scale the growth of the impurity-doped crystal, whilemaintaining high optical quality and high yield.
Glasses
Glasses form an important class of host materials for some of the rare earths,particularly Nd3+. The outstanding practical advantage compared to crystallinematerials is the tremendous size capability for high-energy applications. Rodsup to 1 m in length and over 10 cm in diameter, and disks up to 90 cm in diameterand several centimeters thick have been produced. The optical quality is excellent,and glass, of course, is easily fabricated and takes a good optical finish. Laser ionsplaced in glass generally show a larger fluorescent linewidth than in crystals as aresult of the lack of a unique and well-defined crystalline field surrounding theindividual active atoms. Therefore, the laser thresholds for glass lasers have beenfound to run higher than their crystalline counterparts. Also, glass has a muchlower thermal conductivity than most crystalline hosts. The latter factor leads toa large thermally induced birefringence and optical distortion in glass laser rodswhen they are operated at high average powers.
For bulk solid-state lasers, glass doped with Nd3+ or Er3+ is important and willbe discussed in Sections 2.4 and 2.7. In fiber oscillators and amplifiers, Er3+- andYb3+-doped glass provides the active medium.

2.1. Overview 47
Oxides
Sapphire. The first laser material to be discovered (ruby laser) employed sap-phire as a host. The Al2O3 (sapphire) host is hard, with high thermal conductivity,and transition metals can readily be incorporated substitutionally for the Al. TheAl site is too small for rare earths, and it is not possible to incorporate appreciableconcentrations of these impurities into sapphire. Besides ruby which is still usedtoday, Ti-doped sapphire has gained significance as a tunable-laser material. Theproperties of ruby and Ti-sapphire will be discussed in Sections 2.2 and 2.10.
Garnets. Some of the most useful laser hosts are the synthetic garnets: yttriumaluminum garnet, Y3Al5O12 (YAG); gadolinium gallium garnet, Gd3Ga5O12(GGG), and gadolinium scandium aluminum garnet Gd3Sc2Al3O12 (GSGG).These garnets have many properties that are desirable in a laser host material.They are stable, hard, optically isotropic, and have good thermal conductivities,which permits laser operation at high average power levels.
In particular, yttrium aluminum garnet doped with neodymium (Nd : YAG) hasachieved a position of dominance among solid-state laser materials. YAG is avery hard, isotropic crystal, which can be grown and fabricated in a manner thatyields rods of high optical quality. At the present time, it is the best commerciallyavailable crystalline laser host for Nd3+, offering low threshold and high gain. Theproperties of Nd : YAG are discussed in more detail in Section 2.3. Besides Nd3+,the host crystal YAG has been doped with Tm3+, Er3+, Ho3+, and Yb3+. TheYb : YAG laser material will be discussed in Section 2.8 and Er : YAG, Tm : YAG,and Ho : YAG crystals are briefly covered under the appropriate active ion.
In recent years, Nd : GSGG co-doped with Cr3+ has been employed in a num-ber of laser systems. Cr3+ considerably increases the absorption of flashlamp radi-ation and transfers the energy very efficiently to Nd. A comparison with Nd : YAGreveals a lower thermal conductivity and a lower heat capacity for GSGG but, ingeneral, the materials parameters are fairly close. The stimulated emission crosssection, and therefore the gain of Cr : Nd : GSGG is about half of that in YAG.This can be an advantage for Q-switch operation since more energy can be storedbefore amplified spontaneous emission (ASE) starts to deplete the metastablelevel.
Vanadates
Nd3+-doped yttrium orthovanadate (YVO4) has shown a relatively low thresholdat pulsed operation. However, early studies of this crystal were hampered by se-vere crystal growth problems, and as a result YVO4 was discarded as a host. Withthe emergence of diode pumping, Nd : YVO4 has become an important solid-statelaser material (Section 2.6), because it has very attractive features, such as a largestimulated emission cross section and a high absorption of the pump wavelength,and the growth problem has been overcome for the small crystals required withthis pump source.
48 2. Properties of Solid-State Laser Materials
Fluorides
Doping of fluorides with trivalent rare earth ions requires charge compensationwhich complicates the crystal growth process. The important representative ofthis crystal family is yttrium fluoride (YLiF4), a uniaxial crystal. YLiF4 is trans-parent to 150 nm. Therefore, high-current-density xenon flashlamps which emitstrongly in the blue and near-ultraviolet can be used as pump sources withoutdamage to the material. The most common dopant of YLF is Nd3+. Nd : YLF of-fers a reduction in thermal lensing and birefringence combined with improved en-ergy storage relative to Nd : YAG. The thermomechanical properties of Nd : YLF,however, are not as good as those of Nd : YAG. Details of Nd : YLF are discussedin Section 2.5.
2.1.2 Active Ions
Before proceeding to a discussion of the active laser ions, we will review brieflythe nomenclature of atomic energy levels.
Different energy states of electrons are expressed by different quantum num-bers. The electrons in an atom are characterized by a principal quantum number n,an orbital angular momentum l, the orientation of the angular momentum vectorm, and a spin quantum number s. A tradition from the early days of line-series al-location has established the following method of designating individual electronicorbits: a number followed by a letter symbolizes the principal quantum number nand the angular momentum number l, respectively. The letters s, p, d, f stand forl = 0, 1, 2, 3, respectively. For example, a 3d electron is in an orbit with n = 3and l = 2.
To designate an atomic energy term one uses by convention capital letters witha system of subscripts and superscripts. The symbol characterizing the term isof the form 2S+1L J , where the orbital quantum numbers L = 0, 1, 2, 3, 4, 5,are expressed by the capital letters S, P , D, F , G, H , I . A superscript to theleft of the letter indicates the value (2S + 1), that is, the multiplicity of the termdue to possible orientation of the resultant spin S. Thus a one-electron system(S = 1
2 ) has a multiplicity 2. L and S can combine to a total angular momentumJ , indicated by a subscript to the right of the letter. Thus the symbol 2P3/2 showsan energy level with an orbital quantum number L = 1, a spin of S = 1
2 , and atotal angular momentum of J = 3
2 . The complete term description must includethe configuration of the excited electron, which precedes the letter symbol. Thusthe ground state of lithium has the symbol 2s 2S1/2.
When an atom contains many electrons, the electrons that form a closed shellmay be disregarded and the energy differences associated with transitions in theatom may be calculated by considering only the electrons outside the closed shell.
In describing the state of a multielectron atom, the orbital angular momentaand the spin angular momenta are added separately. The sum of the orbital an-gular momenta are designated by the letter L , and the total spin is characterizedby S. The total angular momentum J of the atom may then be obtained by vector
2.1. Overview 49
addition of L and S. The collection of energy states with common values of J , L ,and S is called a term.
In the following section, a qualitative description is given of some of the promi-nent features of the most important rare earth, actinide, and transition metal ions.
Rare Earth Ions
The rare earth ions are natural candidates to serve as active ions in solid-state lasermaterials because they exhibit a wealth of sharp fluorescent transitions represent-ing almost every region of the visible and near-infrared portions of the electro-magnetic spectrum. It is a characteristic of these lines that they are very sharp,even in the presence of the strong local fields of crystals, as a result of the shield-ing effect of the outer electrons.
The ground state electronic configuration of the rare earth atom consists of acore that is identical to xenon, plus additional electrons in higher orbits. In xenon,the shells with quantum numbers n = 1, 2, 3 are completely filled. The shelln = 4 has its s, p, and d subshells filled, whereas the 4 f subshell capable ofaccommodating 14 electrons is completely empty. However, the n = 5 shell hasacquired its first eight electrons which fill the 5s and 5p orbits. The electronicconfiguration for xenon is
1s22s22p63s23p63d104s24p64d105s25p6 .
Elements beyond xenon, which has the atomic number 54, have this electronicstructure and, in addition, have electrons in the 4 f , 5d, 6s, etc. orbits. Cesium,barium, and lanthanum are the elements between xenon and the rare earths. Ce-sium has one, and barium has two 6s electrons, and lanthanum has in additionone electron in the 5d orbit. Rare earth elements begin with the filling of the innervacant 4 f orbits. For example, the first rare earth element cerium has only oneelectron in the f -orbit:
Ce: . . . 4 f 5s25p65d6s2
and the important rare earth neodymium has four electrons in the f orbit
Nd: . . . 4 f 45s25p66s2.
Since the first nine shells and subshells up to 4d10 are completely filled, only theouter electron configuration is indicated.
In crystals, rare earth ions are normally trivalent, but under appropriate condi-tions the valence state can also be divalent. When a trivalent ion is formed theatom gives up its outermost 6s electrons, the atom loses also its 5d electron if ithas one, otherwise one of the 4 f electrons is lost. For example, trivalent cesiumhas the electronic configuration
Ce3+: . . . 4 f 5s25p6

50 2. Properties of Solid-State Laser Materials
and trivalent neodymium has the configuration
Nd3+: . . . 4 f 35s25p6.
As one can see, the trivalent ions of rare earths have a simpler configuration thanthe corresponding atoms. Ions from the rare earths differ in electronic structureonly by the number of electrons in the 4 f shell as illustrated in Table 2.1. Whena divalent rare earth ion is formed, the atom gives up its outermost 6s electrons.
The fluorescence spectra of rare earth ions arise from electronic transitions be-tween levels of the partially filled 4 f shell. Electrons present in the 4 f shell canbe raised by light absorption into unoccupied 4 f levels. The 4 f states are well-shielded by the filled 5s and 5p outer shells. As a result, emission lines are rela-tively narrow and the energy level structure varies only slightly from one host toanother. The effect of the crystal field is normally treated as a perturbation on thefree-ion levels. The perturbation is small compared to spin-orbit and electrostaticinteractions among the 4 f electrons. The primary change in the energy levels is asplitting of each of the free-ion levels in many closely spaced levels caused by theStark effect of the crystal field. In crystals the free-ion levels are then referred toas manifolds. For example, Figure 2.2 provides a nice illustration of the splittingof the Nd3+ manifolds into sublevels as a result of the YAG crystal field.
Neodymium. Nd3+ was the first of the trivalent rare earth ions to be used in alaser, and it remains by far the most important element in this group. Stimulatedemission has been obtained with this ion incorporated in at least 100 different hostmaterials, and a higher power level has been obtained from neodymium lasersthan from any other four-level material. The principal host materials are YAG andglass. In these hosts stimulated emission is obtained at a number of frequencies
TABLE 2.1. Electronic configuration of trivalent rare earths.
Element Trivalent Number of Groundnumber rare earth 4 f electrons state
58 Cerium, Ce3+ 1 2 F5/259 Praseodymium, Pr3+ 2 3 H460 Neodymium, Nd3+ 3 4 I9/261 Promethium, Pm3+ 4 5 I462 Samarium, Sm3+ 5 6 H5/263 Europium, Eu3+ 6 7 F064 Gadolinium, Gd3+ 7 8S7/265 Terbium, Tb3+ 8 7 F666 Dysprosium, Dy3+ 9 6 H15/267 Holmium, Ho3+ 10 5 I868 Erbium, Er3+ 11 4 I15/269 Thulium, Tm3+ 12 3 H670 Ytterbium, Yb3+ 13 2 F7/271 Lutetium, Lu3+ 14 1S0
2.1. Overview 51
within three different groups of transitions centered at 0.9, 1.06, and 1.35µm.Radiation at these wavelengths results from 4F3/2 → 4I9/2, 4I11/2, and 4I13/2transitions, respectively.
The nomenclature of the energy levels may be illustrated by a discussion of theNd3+ ion. This ion has three electrons in the 4 f subshell. In the ground state theirorbits are so aligned that the orbital angular momentum adds up to 3 + 2 + 1 = 6atomic units. The total angular momentum L = 6 is expressed by the letter I .The spins of the three electrons are aligned parallel to each other, providing anadditional 3
2 units of angular momentum, which, when added antiparallel to theorbital angular momentum, gives a total angular momentum of 6 − 3
2 = 92 units.
According to the quantum rules for the addition of angular momenta, the vectorsum of an orbital angular momentum of 6 and a spin angular momentum of 3
2 mayresult in the following four values of the total angular momentum: 9
2 , 112 , 13
2 , and152 . The levels corresponding to these values are 4I9/2, 4I11/2, 4I13/2, and 4I15/2.
The first of these, which has the lowest energy, is the ground state; the others areamong the first few excited levels of Nd3+. These levels are distinguished by theorientation of the spins with respect to the resultant orbital angular momentum.Other excited levels are obtained when another combination of the orbital angu-lar momenta is chosen. The most important neodymium laser materials, namelyNd : YAG, Nd : glass, Nd : YLF, and Nd : YVO4 are described later in this chapter.
Erbium. Laser action in erbium has been demonstrated in a variety of garnets,fluorides, and glasses. Erbium-laser performance is not very impressive in termsof efficiency or energy output. However, erbium has attracted attention because oftwo particular wavelengths of interest. A crystal, such as YAG, highly doped witherbium produces an output around 2.9µm, and erbium-doped phosphate glassgenerates an output at 1.54µm. Both of these wavelengths are absorbed by water,which leads to interesting medical applications in the case of the 2.9µm lasers,and to eye safe military rangefinders in the case of the shorter wavelength.
The wavelength at 1.54 µm arises from a transition between the 4I13/2 stateand the 4I15/2 ground state of Er3+. At room temperature all levels of the terminal4I15/2 manifold are populated to some degree; thus this transition forms a three-level laser scheme with a correspondingly high threshold. Er : glass is discussedin Section 2.7. The wavelength at 2.9µm stems from a laser transition from the4I11/2 to the 4I13/2 state. The lower laser level of this transition is considerablyabove the ground state, similar to the 1.06µm transition in Nd3+. Therefore thistransition is four-level in nature. However, complicated energy transfer mech-anisms between the levels and a lower laser level which has a longer lifetimecompared to the upper laser level has prevented cw operation at this transition.But with highly concentrated pump beams at 963 nm from quasi-cw laser diodesaverage output powers of several watts have been obtained from 50% Er : YAG.
Holmium. Laser action in Ho3+ has been reported in many different host mate-rials. Because the terminal level is only about 250 cm−1 above ground level, thelower laser level has a relatively high thermal population at room temperature.

52 2. Properties of Solid-State Laser Materials
While Ho : YAG and Ho : YLF have proven to be efficient lasers, operation hasbeen limited in most cases to cryogenic temperatures, which will depopulate thelower laser level. Previous efforts in flashlamp-pumped 2µm lasers have concen-trated on Er : Tm : Ho-doped YAG and YLF.
It was discovered that chromium-sensitized Tm : Ho : YAG offers several ad-vantages over the erbium-sensitized materials. In a Cr : Tm : Ho : YAG laser, avery efficient energy transfer process between the co-dopants takes place. Cr3+acts to efficiently absorb flashlamp energy, which is then transferred to thuliumwith a transfer quantum efficiency approaching 2 (two photons in the infraredfor each pump photon). From thulium the energy is efficiently transferred toholmium. Lasing occurs at the 5I7–5I8 holmium transition at a wavelength of 2080nm. Laser diode pumping of a Tm : Ho : YAG laser via an absorption line in Tm3+at 780 nm is also possible. Chromium doping is not necessary in this case.
Thulium. Efficient flashlamp and laser diode-pumped laser operation has beenachieved in Tm3+ : YAG and Tm3+ : YLF co-doped either with Cr3+ or Ho3+.The output wavelength for the 3F4–3H6 transition is 2.01µm. The thulium ion hasan absorption at 785 nm which is useful for diode pumping. With diode pump-ing Tm : YAG lasers have been designed with output powers in excess of 100 W.Cr-doping provides for efficient absorption of the flashlamp radiation. Flashlamp-pumped Cr : Tm : YAG can achieve tunable output between 1.945 and 1.965µm.
Thulium and thulium-sensitized holmium lasers have outputs in the 2µm re-gion, a wavelength of interest for coherent radar systems, remote sensing, andmedical applications. The possibility of pumping thulium-doped crystals, withreadily available powerful GaAlAs laser diodes at 785 nm, has stimulated interestin these materials.
Praseodymium, Gadolinium, Europium, Ytterbium, and Cerium. Laser ac-tion in these triply ionized rare earths has been reported; however, only marginalperformance was obtained in hosts containing these ions with the exception of yt-terbium. Diode-pumped Yb : YAG has become an important laser and is describedin Section 2.8.
Samarium, Dysprosium, and Thulium. The divalent rare earths Sm2+, Dy2+,and Tm2+ have an additional electron in the 4 f shell, which lowers the energyof the 5d configuration. Consequently, the allowed 4 f –5d absorption bands fallin the visible region of the spectrum. These bands are particularly suitable forpumping the laser systems. Tm2+, Dy2+, and Sm2+ have been operated as lasers,all in a CaF2 host. For laser operation, these crystals must be refrigerated to atleast 77 K.
Actinide Ions
The actinides are similar to the rare earths in having the 5 f electrons partiallyshielded by 6s and 6p electrons. Most of the actinide elements are radioactive,and only uranium in CaF2 has been successfully used in a laser. The host wasdoped with 0.05% uranium. Laser action occurred at 2.6µm between a metastablelevel and a terminal level some 515 cm−1 above the ground state.
2.1. Overview 53
Transition Metals
Important members of the transition metal group include chromium and titanium.The chromium atom has 18 electrons in orbitals which make up the filled core.The outer configuration includes six electrons in the d and s orbitals:
Cr: . . . 3d54s.
The trivalent chromium ion has given up three electrons from these outer two setsof orbitals
Cr3+: . . . 3d3,
leaving three electrons in the 3d orbitals. These electrons determine the opticalproperties of the ion. Since they are unshielded by outer shells of electrons, in con-trast to rare earth ions, the optical properties of transition metal ions are stronglyinfluenced by the host crystal field.
The titanium atom has the same electronic configuration as chromium but onlyfour electrons in the d and s orbitals
Ti: . . . 3d24s2.
The trivalent titanium has only a single electron in the d orbital
Ti3+: . . . 3d.
Transition metal–host crystal combinations which have resulted in importantlasers include ruby (Cr3+ : Al2O3), alexandrite (Cr3+ : BeAl2O4), and Ti : sapphire(Ti3+ : Al2O3) lasers, which are discussed in separate sections.
In addition, two other lasers based on chromium-doped crystals, Cr : LiSAF(Cr3+ : LiSrAIF6) and Cr : forsterite (Cr4+ : Mg2SiO4) need to be mentioned.Cr : LiSAF has found applications as a flashlamp or diode-pumped laser sourcewith tunable output from 780 to 920 nm. The broadband emissions of Cr : LiSAFmakes this crystal attractive for the generation and amplification of femtosec-ond mode-locked pulses. Of particular interest is a diode-pumped, all solid-statetunable source for femtosecond pulse generation.
Systems have been developed which range from small diode-pumped Cr : LiSAFmode-locked oscillators to very large flashlamp-pumped amplifier stages. Bothpulsed and cw laser operation has been achieved in Cr4+ : Mg2SiO4 with Nd : YAGlasers at 1.06µm and 532 nm as pump sources. The tuning range covers the spec-tral region from 1167 to 1345 nm. A distinguishing feature of laser actions inCr : Mg2SiO4 is that the lasing ion is not trivalent chromium (Cr3+) as in the casewith other chromium-based lasers, but the active ion in this crystal is tetravalentchromium (Cr4+) which substitutes for silicon (Si4+) in a tetradedral site.
In the following section we will describe some of the features of the mostprominent laser materials. The ruby laser, still in use today, provides a good il-

54 2. Properties of Solid-State Laser Materials
lustration of a three-level system. Nd : YAG, because of its high gain and goodthermal and mechanical properties, is by far the most important solid-state laserfor scientific, medical, industrial, and military applications. Nd : glass is impor-tant for laser fusion drivers because it can be produced in large sizes. Nd : YLF isa good material for a number of applications; the crystal exhibits lower thermalbirefringence and has a higher energy storage capability (due to its lower gaincoefficient) compared to Nd : YAG. Nd : YVO4 has become a very attractive ma-terial for small diode-pumped lasers because of its large emission cross sectionand strong absorption at 809 nm. Er : glass is of special importance because thelaser output at 1.55µm is in the eye-safe region of the spectrum. The Yb : YAGlaser has been developed for high-power applications requiring output in the kWrange.
The last two lasers described in this chapter, alexandrite and Ti : sapphire, areboth broadly tunable lasers. Tunability of the emission in solid-state lasers isachieved when the stimulated emission of photons is intimately coupled to theemission of vibrational quanta (phonons) in a crystal lattice. In these “vibronic”lasers, the total energy of the lasing transition is fixed but can be partitioned be-tween photons and phonons in a continuous fashion. The result is broad wave-length tunability of the laser output. In other words, the existence of tunable solid-state lasers is due to the subtle interplay between the Coulomb field of the lasingion, the crystal field of the host lattice, and electron–phonon coupling permittingbroadband absorption and emission. Therefore, the gain in vibronic lasers dependson transitions between coupled vibrational and electronic states; that is, a phononis either emitted or absorbed with each electronic transition. In alexandrite andTi : sapphire tunability is achieved by the 3d electron of the transition metal ionsCr3+ and Ti3+.
Overviews of laser host materials and active ions, as well as compilations ofuseful laser and materials parameters, can be found in a number of handbooksand summary articles [4]–[10].
2.2 Ruby
The ruby laser, Cr3+ : Al2O3, is a three-level system, which makes it necessary topump the crystal at high intensity to achieve at least inversion. Consequently, theoverall system efficiency is very low, which is the main reason for its limited usetoday. Ruby chemically consists of sapphire (Al2O3) in which a small percentageof the Al3+ has been replaced by Cr3+. This is done by adding small amounts ofCr2O3 to the melt of highly purified Al2O3. Sapphire has the best thermomechan-ical properties of all solid-state laser materials. The crystal is very hard, has highthermal conductivity, and can be grown to very high quality by the Czochralskimethod. The Cr3+ ion has three d electrons in its unfilled shell; the ground stateof the free ion is described by the spectroscopic symbol 4A. The amount of dopingis nominally 0.05 wt.% Cr2O3.
A simplified energy level diagram of ruby is given in Fig. 2.1. In ruby lasers,population inversion with respect to the so-called 2 E level is obtained by opti-

2.2. Ruby 55
FIGURE 2.1. Important energy levels of Cr3+ in ruby (separation of 2E levels not to scale).
cally pumping Cr3+ ions from the 4A2 ground state to the broad pump bands 4F2and 4F1. The lifetime at the pump bands, which are each about 100 nm wide, lo-cated in the green (18,000 cm−1) and in the violet (25,000 cm−1), is extremelyshort, with the ions returning to a metastable state 2E that has a fluorescent life-time of 3 ms. This metastable level is split into two sublevels with a separation of�E = 29 cm−1. The upper sublevel is the 2A and the lower one the E sublevel.The two transitions (E → 4A2 and 2A → 4A2) are referred to as the R1 and R2lines, which are located at the end of the visible region at 694.3 and 692.9 nm,respectively. The width of these fluorescent lines is �ν = 11 cm−1 at room tem-perature and they are homogeneously broadened because of the interaction of theCr3+ ions with lattice vibrations. The two R lines are connected to each other bya very fast nonradiative decay, thermalization of the population occurs, and thisresults in the lower-lying E level being the more heavily populated.
At thermal equilibrium the difference in population between the E and 2A levelis determined by the Boltzmann factor κ = exp(�E/kT ). At room temperaturethe Boltzmann factor is κ = 0.87. The R1 line attains laser threshold beforethe R2 line because of the higher inversion. Once laser action commences in theR1 line, the E level becomes depleted and population transfer from the nearby2A level proceeds at such a fast rate that the threshold level is never reached

56 2. Properties of Solid-State Laser Materials
for the R2 line. Therefore the entire initial population of the two states decaysthrough R1 emission. If we compare the energy-level diagram of ruby with oursimplified scheme of a three-level system in Figure 1.6, the levels 4 F1 and 4 F2jointly constitute level 3, whereas 2E and 4A2 states represent levels 2 and 1,respectively. We can write
n2 = n2(R1)+ n2(R2) (2.1)
for the metastable level and n1 for the ground level. Threshold and gain in rubydepends only on the population of level n2(R1). However, in relating gain andthreshold to the population of the ground level n1 or to the total number of Cr3+ions ntot, one has to take the population of n2(R2) into account. In ruby all levelsare degenerate, that is,
g(n1) = 4, g(R1) = g(R2) = 2. (2.2)
Because of the higher degeneracy of the ground state, amplification occurswhen the R1 level is at least one-half as densely populated as the ground state.Since
n2(R1)+ n2(R2)+ n1 = ntot , (2.3)
we have the following population at threshold (300 K)
n2(R1) = ntot
3 + κ= 0.26ntot,
n2(R2) = ntot
3 + κ= 0.22ntot, (2.4)
n1 = 2ntot
3 + κ= 0.52ntot.
Thus we must have just under one-half of the atoms in the two upper levels inorder to reach threshold. With a Cr3+ concentration of ntot = 1.58 × 1019 cm3
and a photon energy of hν = 2.86 × 10⁻¹⁹ W s, we obtain for the energy den-sity at the metastable level required to achieve transparency in ruby according to(2.4),
Jth =(κ + 1
κ + 3
)ntothν = 2.18 J/cm3. (2.5)
The small-signal gain coefficient in ruby is
g0 = σ
[n2(R1)− g(R1)n1
g(n1)
], (2.6)
where σ is the stimulated emission cross section of the R1 line and n2(R1) is thepopulation density of the E level.

2.3. Nd : YAG 57
Since σ = σ12g(n1)/g(R1), the gain coefficient can be expressed as
g0 = α0
(2n2
ntot− 1
), (2.7)
where α0 = σ12ntot is the absorption coefficient of ruby. Ruby has an absorptioncross section of σ12 = 1.22 × 10⁻²⁰ cm2 and an absorption coefficient of α0 =0.2 cm−1. With all the chromium ions in the ground state (n2 = O) the gain ofthe unpumped ruby crystal is g0 = −α0. With all the ions in the upper levels(n2 = ntot) the maximum gain coefficent is g0 = α0.
The example of ruby illustrates very clearly the drawbacks of a three-level sys-tem.
(a) Compared to a four-level laser, three-level lasers such as ruby and Er : glass,and quasi-three-level lasers such as Yb : YAG require high-pump intensitiesbecause a certain amount of pump power is required just to achieve trans-parency in the material.
(b) Since three- and quasi-three-level lasers absorb at the laser wavelength unlesspumped to inversion, any portion of the laser crystal which is shielded fromthe pump light, for example, by the rod holder, will present a high absorptionloss.
Despite these obvious drawbacks, three-level lasers have other redeeming fea-tures, such as desirable wavelength or a particular efficient pump method, whichmakes these lasers attractive. For example, ruby lases in the visible region, it hasbroad absorption bands at a wavelength region particularly well-suited for flash-lamp pumping, and it has a long fluorescent lifetime and a reasonably large stim-ulated emission cross section.
2.3 Nd : YAG
The Nd : YAG laser is by far the most commonly used type of solid-state laser.Neodymium-doped yttrium aluminum garnet (Nd : YAG) possesses a combinationof properties uniquely favorable for laser operation. The YAG host is hard, ofgood optical quality, and has a high thermal conductivity. Furthermore, the cubicstructure of YAG favors a narrow fluorescent linewidth, which results in highgain and low threshold for laser operation. In Nd : YAG, trivalent neodymiumsubstitutes for trivalent yttrium, so charge compensation is not required.
Physical Properties
Pure Y3Al5O12 is a colorless, optically isotropic crystal that possesses a cubicstructure characteristic of garnets. In Nd : YAG about 1% of Y3+ is substituted byNd3+. The radii of the two rare earth ions differ by about 3%. Therefore, withthe addition of large amounts of neodymium, strained crystals are obtained—indicating that either the solubility limit of neodymium is exceeded or that the
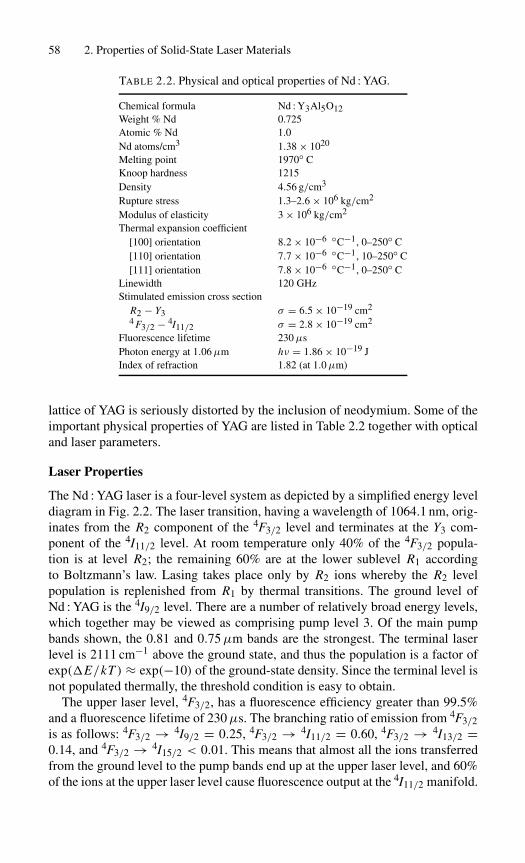
58 2. Properties of Solid-State Laser Materials
TABLE 2.2. Physical and optical properties of Nd : YAG.
Chemical formula Nd : Y3Al5O12Weight % Nd 0.725Atomic % Nd 1.0Nd atoms/cm3 1.38 × 10²⁰
Melting point 1970◦ CKnoop hardness 1215Density 4.56 g/cm3
Rupture stress 1.3–2.6 × 10⁶ kg/cm2
Modulus of elasticity 3 × 10⁶ kg/cm2
Thermal expansion coefficient[100] orientation 8.2 × 10⁻⁶ ◦C−1, 0–250◦ C[110] orientation 7.7 × 10⁻⁶ ◦C−1, 10–250◦ C[111] orientation 7.8 × 10⁻⁶ ◦C−1, 0–250◦ C
Linewidth 120 GHzStimulated emission cross section
R2 − Y3 σ = 6.5 × 10⁻¹⁹ cm2
4 F3/2 − 4I11/2 σ = 2.8 × 10⁻¹⁹ cm2
Fluorescence lifetime 230µsPhoton energy at 1.06µm hν = 1.86 × 10⁻¹⁹ JIndex of refraction 1.82 (at 1.0µm)
lattice of YAG is seriously distorted by the inclusion of neodymium. Some of theimportant physical properties of YAG are listed in Table 2.2 together with opticaland laser parameters.
Laser Properties
The Nd : YAG laser is a four-level system as depicted by a simplified energy leveldiagram in Fig. 2.2. The laser transition, having a wavelength of 1064.1 nm, orig-inates from the R2 component of the 4F3/2 level and terminates at the Y3 com-ponent of the 4I11/2 level. At room temperature only 40% of the 4F3/2 popula-tion is at level R2; the remaining 60% are at the lower sublevel R1 accordingto Boltzmann’s law. Lasing takes place only by R2 ions whereby the R2 levelpopulation is replenished from R1 by thermal transitions. The ground level ofNd : YAG is the 4I9/2 level. There are a number of relatively broad energy levels,which together may be viewed as comprising pump level 3. Of the main pumpbands shown, the 0.81 and 0.75µm bands are the strongest. The terminal laserlevel is 2111 cm−1 above the ground state, and thus the population is a factor ofexp(�E/kT ) ≈ exp(−10) of the ground-state density. Since the terminal level isnot populated thermally, the threshold condition is easy to obtain.
The upper laser level, 4F3/2, has a fluorescence efficiency greater than 99.5%and a fluorescence lifetime of 230µs. The branching ratio of emission from 4F3/2is as follows: 4F3/2 → 4I9/2 = 0.25, 4F3/2 → 4I11/2 = 0.60, 4F3/2 → 4I13/2 =0.14, and 4F3/2 → 4I15/2 < 0.01. This means that almost all the ions transferredfrom the ground level to the pump bands end up at the upper laser level, and 60%of the ions at the upper laser level cause fluorescence output at the 4I11/2 manifold.

2.3. Nd : YAG 59
FIGURE 2.2. Energy level diagram of Nd : YAG.
At room temperature the main 1.06µm line in Nd : YAG is homogeneouslybroadened by thermally activated lattice vibrations. The spectroscopic cross sec-tion for the individual transition between Stark sublevels has been measured tobe σ(R2 − Y3) = 6.5 × 10⁻¹⁹ cm2. At a temperature of 295 K, the Maxwell–Boltzmann fraction in the upper Stark sublevel is 0.427, implying an effectivecross section for Nd : YAG of σ ∗(4F3/2 − 4I11/2) = 2.8 × 10⁻¹⁹ cm2. The effec-tive stimulated-emission cross section is the spectroscopic cross section times theoccupancy of the upper laser level relative to the entire 4F3/2 manifold population.
Figure 2.3 shows the fluorescence spectrum of Nd3+ in YAG near the region ofthe laser output with the corresponding energy levels for the various transitions.The absorption of Nd : YAG in the range 0.3 to 0.9µm is given in Fig. 2.4(a). InFig. 2.4(b) the absorption spectrum is expanded around the wavelength of 808 nm,which is important for laser diode pumping. Thermal properties of Nd : YAGare summarized in Table 2.3. Under normal operating conditions the Nd : YAGlaser oscillates at room temperature on the strongest 4F3/2 → 4I11/2 transitionat 1.0641µm. It is possible, however, to obtain oscillation at other wavelengthsby inserting etalons or dispersive prisms in the resonator, by utilizing a specially

60 2. Properties of Solid-State Laser Materials
FIGURE 2.3. Fluorescence spectrum of Nd3+ in YAG at 300 K in the region of 1.06µm[10], [11].
designed resonant reflector as an output mirror, or by employing highly selec-tive dielectrically coated mirrors. These elements suppress laser oscillation atthe 1.06µm wavelength and provide optimum conditions at the wavelength de-sired. With this technique laser systems have been built which utilize the 946 and1330 nm transitions.
2.4 Nd : Glass
There are a number of characteristics that distinguish glass from other solid-statelaser host materials. Its properties are isotropic. It can be doped at very highconcentrations with excellent uniformity, and it can be made in large pieces ofdiffraction-limited optical quality. In addition, glass lasers have been made, in avariety of shapes and sizes, from fibers a few micrometers in diameter to rods 2 mlong and 7.5 cm in diameter and disks up to 90 cm in diameter and 5 cm thick.
The most common commercial optical glasses are oxide glasses, principally sil-icates and phosphates, that is, SiO2 and P2O5 based. Table 2.4 summarizes someimportant physical and optical properties of commercially available silicate andphosphate glasses. The gain cross sections at 1053 nm of available phosphatesrange from 3.0 × 10⁻²⁰ to 4.2 × 10⁻²⁰ cm2 and are generally larger than the1064 nm cross sections of silicate glasses. Silicate and phosphate glasses have flu-orescent decay times of around 300µs at doping levels of 2×10²⁰ Nd atoms/cm3.
2.4.1 Laser Properties
There are two important differences between glass and crystal lasers. First, thethermal conductivity of glass is considerably lower than that of most crystal hosts.

2.4. Nd : Glass 61
(a)
(b)
FIGURE 2.4. (a) Absorption spectrum of Nd : YAG from 0.3 to 0.9µm and (b) expandedscale around 808 nm.
TABLE 2.3. Thermal properties of Nd : YAG.
Property Units 300 K 200 K 100 K
Thermal conductivity W cm−1 K−1 0.14 0.21 0.58Specific heat W s g−1 K−1 0.59 0.43 0.13Thermal diffusivity cm2 s−1 0.046 0.10 0.92Thermal expansion K−1 × 10⁻⁶ 7.5 5.8 4.25∂n/∂T K−1 7.3 × 10⁻⁶ — —
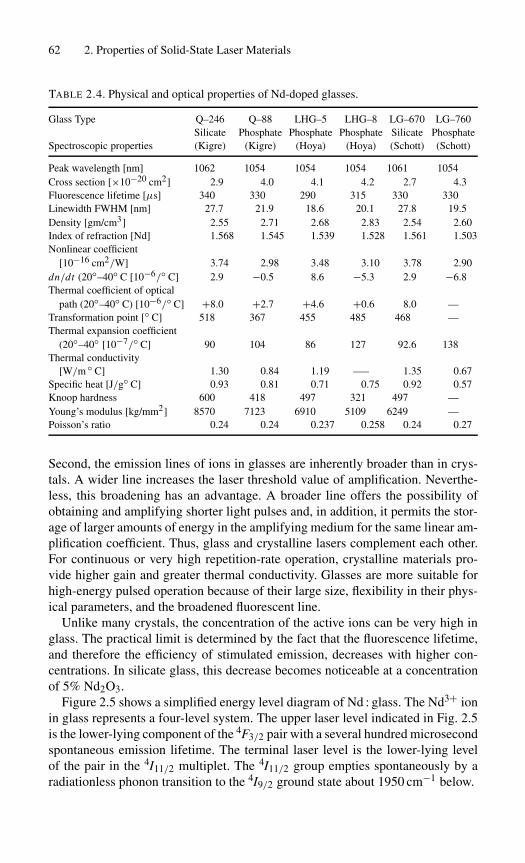
62 2. Properties of Solid-State Laser Materials
TABLE 2.4. Physical and optical properties of Nd-doped glasses.
Glass Type Q–246 Q–88 LHG–5 LHG–8 LG–670 LG–760Silicate Phosphate Phosphate Phosphate Silicate Phosphate
Spectroscopic properties (Kigre) (Kigre) (Hoya) (Hoya) (Schott) (Schott)
Peak wavelength [nm] 1062 1054 1054 1054 1061 1054Cross section [×10−20 cm2] 2.9 4.0 4.1 4.2 2.7 4.3Fluorescence lifetime [µs] 340 330 290 315 330 330Linewidth FWHM [nm] 27.7 21.9 18.6 20.1 27.8 19.5Density [gm/cm3] 2.55 2.71 2.68 2.83 2.54 2.60Index of refraction [Nd] 1.568 1.545 1.539 1.528 1.561 1.503Nonlinear coefficient
[10−16 cm2/W] 3.74 2.98 3.48 3.10 3.78 2.90dn/dt (20◦–40◦ C [10−6/◦ C] 2.9 −0.5 8.6 −5.3 2.9 −6.8Thermal coefficient of optical
path (20◦–40◦ C) [10−6/◦ C] +8.0 +2.7 +4.6 +0.6 8.0 —Transformation point [◦ C] 518 367 455 485 468 —Thermal expansion coefficient
(20◦–40◦ [10−7/◦ C] 90 104 86 127 92.6 138Thermal conductivity
[W/m ◦ C] 1.30 0.84 1.19 —– 1.35 0.67Specific heat [J/g◦ C] 0.93 0.81 0.71 0.75 0.92 0.57Knoop hardness 600 418 497 321 497 —Young’s modulus [kg/mm2] 8570 7123 6910 5109 6249 —Poisson’s ratio 0.24 0.24 0.237 0.258 0.24 0.27
Second, the emission lines of ions in glasses are inherently broader than in crys-tals. A wider line increases the laser threshold value of amplification. Neverthe-less, this broadening has an advantage. A broader line offers the possibility ofobtaining and amplifying shorter light pulses and, in addition, it permits the stor-age of larger amounts of energy in the amplifying medium for the same linear am-plification coefficient. Thus, glass and crystalline lasers complement each other.For continuous or very high repetition-rate operation, crystalline materials pro-vide higher gain and greater thermal conductivity. Glasses are more suitable forhigh-energy pulsed operation because of their large size, flexibility in their phys-ical parameters, and the broadened fluorescent line.
Unlike many crystals, the concentration of the active ions can be very high inglass. The practical limit is determined by the fact that the fluorescence lifetime,and therefore the efficiency of stimulated emission, decreases with higher con-centrations. In silicate glass, this decrease becomes noticeable at a concentrationof 5% Nd2O3.
Figure 2.5 shows a simplified energy level diagram of Nd : glass. The Nd3+ ionin glass represents a four-level system. The upper laser level indicated in Fig. 2.5is the lower-lying component of the 4F3/2 pair with a several hundred microsecondspontaneous emission lifetime. The terminal laser level is the lower-lying levelof the pair in the 4I11/2 multiplet. The 4I11/2 group empties spontaneously by aradiationless phonon transition to the 4I9/2 ground state about 1950 cm−1 below.
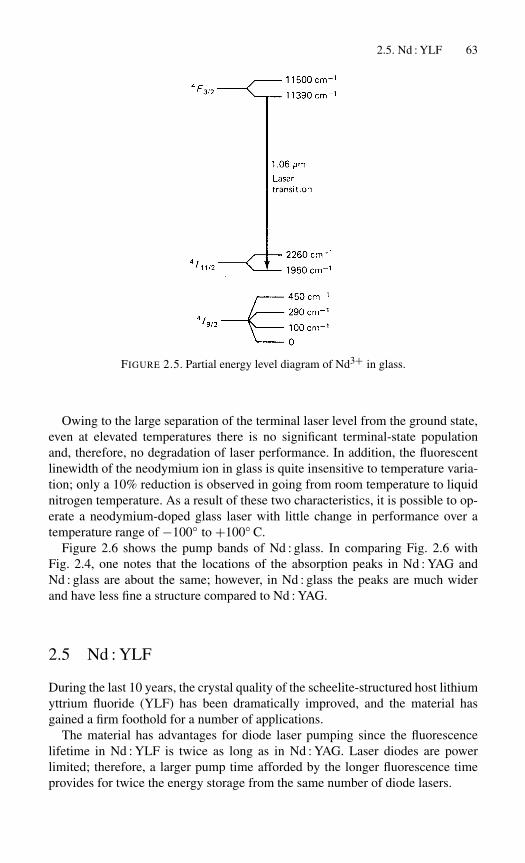
2.5. Nd : YLF 63
FIGURE 2.5. Partial energy level diagram of Nd3+ in glass.
Owing to the large separation of the terminal laser level from the ground state,even at elevated temperatures there is no significant terminal-state populationand, therefore, no degradation of laser performance. In addition, the fluorescentlinewidth of the neodymium ion in glass is quite insensitive to temperature varia-tion; only a 10% reduction is observed in going from room temperature to liquidnitrogen temperature. As a result of these two characteristics, it is possible to op-erate a neodymium-doped glass laser with little change in performance over atemperature range of −100◦ to +100◦ C.
Figure 2.6 shows the pump bands of Nd : glass. In comparing Fig. 2.6 withFig. 2.4, one notes that the locations of the absorption peaks in Nd : YAG andNd : glass are about the same; however, in Nd : glass the peaks are much widerand have less fine a structure compared to Nd : YAG.
2.5 Nd : YLF
During the last 10 years, the crystal quality of the scheelite-structured host lithiumyttrium fluoride (YLF) has been dramatically improved, and the material hasgained a firm foothold for a number of applications.
The material has advantages for diode laser pumping since the fluorescencelifetime in Nd : YLF is twice as long as in Nd : YAG. Laser diodes are powerlimited; therefore, a larger pump time afforded by the longer fluorescence timeprovides for twice the energy storage from the same number of diode lasers.
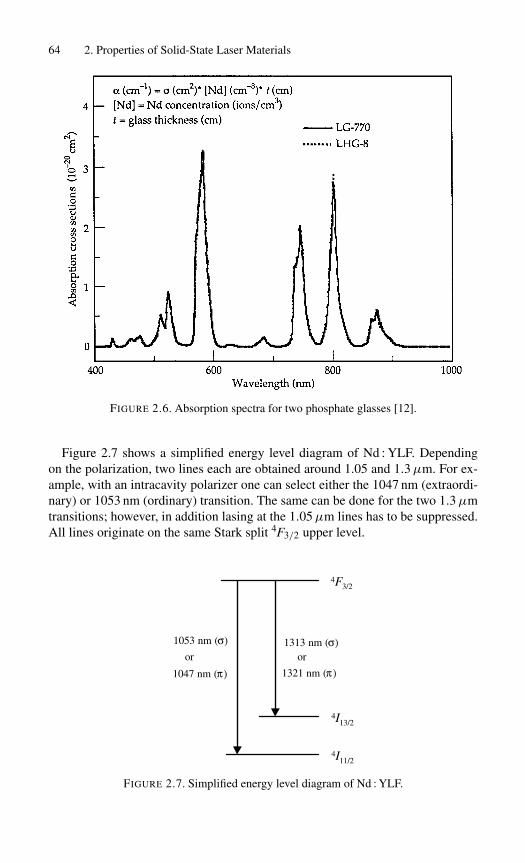
64 2. Properties of Solid-State Laser Materials
FIGURE 2.6. Absorption spectra for two phosphate glasses [12].
Figure 2.7 shows a simplified energy level diagram of Nd : YLF. Dependingon the polarization, two lines each are obtained around 1.05 and 1.3µm. For ex-ample, with an intracavity polarizer one can select either the 1047 nm (extraordi-nary) or 1053 nm (ordinary) transition. The same can be done for the two 1.3µmtransitions; however, in addition lasing at the 1.05µm lines has to be suppressed.All lines originate on the same Stark split 4F3/2 upper level.
1053 nm (σ)
1047 nm (π)
1313 nm (σ)
1321 nm (π)
4F3/2
4I13/2
4I11/2
or or
FIGURE 2.7. Simplified energy level diagram of Nd : YLF.

2.6. Nd : YVO4 65
TABLE 2.5. Properties of Nd-doped lithiumyttrium fluoride (YLF).
Lasing wavelength [nm] 1053 (σ )1047 (π)
Index of refraction n0 = 1.4481λ = 1.06µm ne = 1.4704
Fluorescent lifetime 480µsStimulated emission 1.8 × 10⁻¹⁹ (π)
Cross section [cm2] 1.2 × 10⁻¹⁹ (σ )
Density [g/cm3] 3.99 (undoped)Hardness [Mohs] 4–5Elastic modulus [N/m2] 7.5 × 10¹⁰
Strength [N/m2] 3.3 × 10⁷
Poisson’s ratio 0.33
Thermal conductivity 0.06[W/cm-K]
Thermal expansion a-axis: 13 × 10−6
coefficient [◦ C−1] c-axis: 8 × 10⁻⁶
Melting point [◦ C] 825
Material properties of Nd : YLF are listed in Table 2.5. The relatively largethermal conductivity allows efficient heat extraction, and its natural birefringenceoverwhelms thermally induced birefringence eliminating the thermal depolariza-tion problems of optically isotropic hosts like YAG. The cross section for YLFis about a factor of 2 lower than YAG. For certain lasers requiring moderateQ-switch energies, the lower gain offers advantages in system architecture com-pared to the higher gain material Nd : YAG.
The energy storage in Q-switched operation of neodymium oscillators andamplifiers is constrained by the onset of parasitic oscillations. To first order, theenergy storage limit of two materials is inversely proportional to the ratio of thestimulated emission cross section. Therefore, higher storage densities are obtainedin the lower cross section material Nd : YLF as compared to Nd : YAG.
2.6 Nd : YVO4
Neodymium-doped yttrium vanadate has several spectroscopic properties that areparticularly relevant to laser diode pumping. The two outstanding features are alarge stimulated emission cross section that is five times higher than Nd : YAG,and a strong broadband absorption at 809 nm.
The vanadate crystal is naturally birefringent and laser output is linearly polar-ized along the extraordinary π -direction. The polarized output has the advantagethat it avoids undesirable thermally induced birefringence.
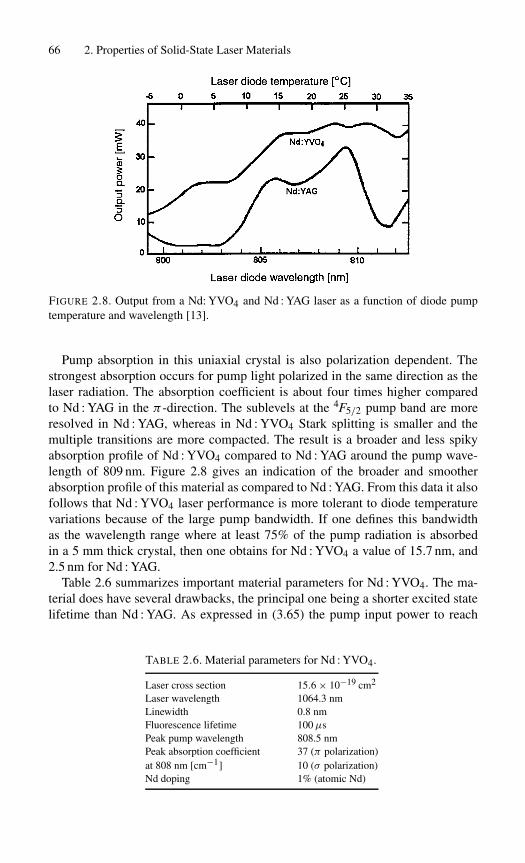
66 2. Properties of Solid-State Laser Materials
FIGURE 2.8. Output from a Nd: YVO4 and Nd : YAG laser as a function of diode pumptemperature and wavelength [13].
Pump absorption in this uniaxial crystal is also polarization dependent. Thestrongest absorption occurs for pump light polarized in the same direction as thelaser radiation. The absorption coefficient is about four times higher comparedto Nd : YAG in the π -direction. The sublevels at the 4F5/2 pump band are moreresolved in Nd : YAG, whereas in Nd : YVO4 Stark splitting is smaller and themultiple transitions are more compacted. The result is a broader and less spikyabsorption profile of Nd : YVO4 compared to Nd : YAG around the pump wave-length of 809 nm. Figure 2.8 gives an indication of the broader and smootherabsorption profile of this material as compared to Nd : YAG. From this data it alsofollows that Nd : YVO4 laser performance is more tolerant to diode temperaturevariations because of the large pump bandwidth. If one defines this bandwidthas the wavelength range where at least 75% of the pump radiation is absorbedin a 5 mm thick crystal, then one obtains for Nd : YVO4 a value of 15.7 nm, and2.5 nm for Nd : YAG.
Table 2.6 summarizes important material parameters for Nd : YVO4. The ma-terial does have several drawbacks, the principal one being a shorter excited statelifetime than Nd : YAG. As expressed in (3.65) the pump input power to reach
TABLE 2.6. Material parameters for Nd : YVO4.
Laser cross section 15.6 × 10⁻¹⁹ cm2
Laser wavelength 1064.3 nmLinewidth 0.8 nmFluorescence lifetime 100µsPeak pump wavelength 808.5 nmPeak absorption coefficient 37 (π polarization)at 808 nm [cm−1] 10 (σ polarization)Nd doping 1% (atomic Nd)

2.7. Er : Glass 67
threshold for cw operation depends on the product of στ f . Therefore, the largecross section σ of Nd : YVO4 is partially offset by its shorter fluorescence lifetimeτ f . Fluorescence lifetime is also a measure of the energy storage capability in Q-switched operation. Large energy storage requires a long fluorescence lifetime.As far as thermal conductivity is concerned, it is only half as high as Nd : YAGand somewhat lower than Nd : YLF.
The properties of Nd : YVO4 can best be exploited in an end-pumped config-uration, and a number of commercial laser systems are based on fiber-coupleddiode arrays pumping a small vanadate crystal. Actually, Nd : YVO4 is the mate-rial of choice for cw end-pumped lasers in the 5 W output region. These systemsare often also internally frequency doubled to provide output at 532 nm. In end-pumped systems the pump beam is usually highly focused, and it is difficult tomaintain a small beam waist over a distance of more than a few millimeters. Inthis case a material such as Nd : YVO4, which has a high absorption coefficientcombined with high gain, is very advantageous.
2.7 Er : Glass
Erbium has been made to lase at 1.54µm in both silicate and phosphate glasses.Owing to the three-level behavior of erbium, and the weak absorption of pumpradiation, codoping with other rare earth ions is necessary to obtain satisfactorysystem efficiency. In fact, erbium must be sensitized with ytterbium if the mate-rial is to lase at all at room temperature. Pump radiation is absorbed by ytterbium,which has an absorption band between 0.9 and 1µm, and transferred to the erbiumions. This transfer is illustrated in Fig. 2.9. In the co-doped erbium, Yb : glass ra-diation from a flashlamp or laser diode pumps the strong 2F7/2 − 2F5/2 transitionin Yb3+. Because of the good overlap between the upper states of Yb3+ and Er3+,the excited Yb3+ ions transfer energy to the 4I11/2 level of Er3+. The erbium ionsthen relax to the upper laser level 4I13/2 and lasing occurs down to the 4I15/2 man-
Yb3+ Er3+
Pump940 nm
Energy Transfer
2 F7/24I15/2
4I13/2
4I11/2
4I9/2
2 F5/2
Lasing1540 nm
FIGURE 2.9. Energy level diagram in codoped Er, Yb : glass.

68 2. Properties of Solid-State Laser Materials
ifold. For flashlamp pumping, the efficiency of Er : glass can be further improvedby adding Cr3+ in addition to Yb3+. The Cr3+ ions absorb flashlamp radiationin two broad bands centered at 450 and 640µm, and emit radiation in a broadband centered at 760 nm. This allows energy to be transferred from Cr3+ to Yb3+and Er3+. With the development of strained layer InGaAs laser diodes, whichhave emission between 0.9 and 1µm, it is now possible to pump the strong Yb3+transition 2F7/2 − 2F5/2. Diode pumping at 940 nm has dramatically improved theefficiency and average power achievable from Er : glass lasers.
2.8 Yb : YAG
Although Yb : YAG has been known for decades, interest was not very high in thismaterial since it lacks any pump bands in the visible spectrum. The crystal hasonly a single absorption feature around 942 nm. With conventional pump sourcessuch as flashlamps, the threshold is very high, which eliminated this material fromany serious consideration. With the emergence of powerful InGaAs laser diodesthat emit at 942 nm, the picture has changed completely and Yb : YAG has becomean important laser material [15]. The relevant energy level diagram of Yb : YAG isvery simple and consists of the 2F7/2 lower level and 2F5/2 excited state manifoldsseparated by about 10,000 cm−1. The laser wavelength is at 1.03µm, a represen-tative emission spectrum for a 5.5 at.% doped sample is shown in Fig. 2.10.
The laser transition 2F5/2 to 2F7/2 has a terminal level 612 cm−1 above theground state (see Fig. 2.11). The thermal energy at room temperature is 200 cm−1;therefore the terminal state is thermally populated making Yb : YAG a quasi-three-level system. By comparison, the terminal laser level in Nd : YAG is about2000 cm−1 above the ground state. Being a quasi-three-level laser, Yb : YAG ab-
FIGURE 2.10. Emission spectra of Yb : YAG with 5.5 at.% doping [14].

2.8. Yb : YAG 69
1032710624 cm–1
0
612
1030 nmlasing
941 nmpump
2F5/2
2F7/2
FIGURE 2.11. Relevant energy levels in Yb : YAG.
sorbs at 1.03µm unless it is pumped to inversion. At room temperature the ther-mal population of the lower laser level is about 5.5%. The absorbed pump powerper volume needed to achieve and maintain transparency at the laser wavelengthis I = fanthνp/τf, where fa is the fraction of the total ion density nt occupyingthe lower laser level, hνp is the energy per pump photon, and τf is the lifetimeof the upper level. With fa = 0.055, nt = 1.38 × 1020 cm−3 at 1% doping,hνp = 2.11 × 10⁻¹⁹ J, and τf = 0.95 ms, the absorbed pump power needed toreach inversion is 1.7 kW/cm3. Of course, a higher power density is required toovercome optical losses and reach laser threshold, and for an efficient operationthe laser has to be pumped about five to six times above threshold. Typically, inthis laser, small volumes of material are pumped on the order of 10 kW/cm3.
Yb : YAG performance is strongly dependent on temperature and can be im-proved by cooling the crystal, which reduces the thermal population and increasesthe stimulated emission cross section from 2.1 × 10⁻²⁰ cm2 at room temperatureto twice this value at 220 K.
In most of the large systems built to date the temperature of the crystal is main-tained between −10◦ C and 20◦ C depending on the particular design and modeof operation. To maintain the laser crystal at such a temperature under intensivepump radiation requires, as a minimum, some kind of refrigeration.
Despite these obvious drawbacks, Yb : YAG has a number of redeeming fea-tures that motivated the development of very powerful systems.
Pumping of Yb : YAG with an InGaAs pump source produces the smallestamount of crystal heating compared to any other major laser system. Actuallythe pump radiation in this material generates only about one-third of the heatcompared to Nd : YAG. The fractional thermal loading, that is, the ratio of heatgenerated to absorbed energy, is around 11% for Yb : YAG pumped at 943 nmand 32% for Nd : YAG pumped at 808 nm. This substantially reduced thermal dis-sipation is the result of a very small energy difference between the photons of thepump and laser radiation. This quantum defect or Stokes shift is 9% in Yb : YAGversus 24% in Nd : YAG. The thermal load generated in a laser medium is of
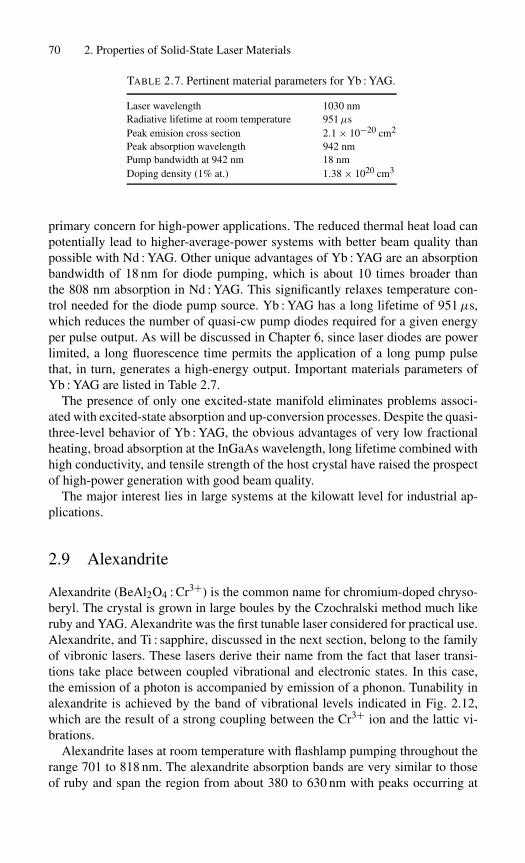
70 2. Properties of Solid-State Laser Materials
TABLE 2.7. Pertinent material parameters for Yb : YAG.
Laser wavelength 1030 nmRadiative lifetime at room temperature 951µsPeak emision cross section 2.1 × 10⁻²⁰ cm2
Peak absorption wavelength 942 nmPump bandwidth at 942 nm 18 nmDoping density (1% at.) 1.38 × 1020 cm3
primary concern for high-power applications. The reduced thermal heat load canpotentially lead to higher-average-power systems with better beam quality thanpossible with Nd : YAG. Other unique advantages of Yb : YAG are an absorptionbandwidth of 18 nm for diode pumping, which is about 10 times broader thanthe 808 nm absorption in Nd : YAG. This significantly relaxes temperature con-trol needed for the diode pump source. Yb : YAG has a long lifetime of 951µs,which reduces the number of quasi-cw pump diodes required for a given energyper pulse output. As will be discussed in Chapter 6, since laser diodes are powerlimited, a long fluorescence time permits the application of a long pump pulsethat, in turn, generates a high-energy output. Important materials parameters ofYb : YAG are listed in Table 2.7.
The presence of only one excited-state manifold eliminates problems associ-ated with excited-state absorption and up-conversion processes. Despite the quasi-three-level behavior of Yb : YAG, the obvious advantages of very low fractionalheating, broad absorption at the InGaAs wavelength, long lifetime combined withhigh conductivity, and tensile strength of the host crystal have raised the prospectof high-power generation with good beam quality.
The major interest lies in large systems at the kilowatt level for industrial ap-plications.
2.9 Alexandrite
Alexandrite (BeAl2O4 : Cr3+) is the common name for chromium-doped chryso-beryl. The crystal is grown in large boules by the Czochralski method much likeruby and YAG. Alexandrite was the first tunable laser considered for practical use.Alexandrite, and Ti : sapphire, discussed in the next section, belong to the familyof vibronic lasers. These lasers derive their name from the fact that laser transi-tions take place between coupled vibrational and electronic states. In this case,the emission of a photon is accompanied by emission of a phonon. Tunability inalexandrite is achieved by the band of vibrational levels indicated in Fig. 2.12,which are the result of a strong coupling between the Cr3+ ion and the lattic vi-brations.
Alexandrite lases at room temperature with flashlamp pumping throughout therange 701 to 818 nm. The alexandrite absorption bands are very similar to thoseof ruby and span the region from about 380 to 630 nm with peaks occurring at

2.9. Alexandrite 71
Ground level
Phononrelaxation
Lasing701-818 nm
Pump bands
Lasing 680 nm
Pump
4A2
2E
4T1
4T2
BLUE
YELLOW
FIGURE 2.12. Simplified energy level diagram for chromium ions in alexandrite.
410 and 590 nm. Figure 2.13 shows the absorption bands of alexandrite. The lasergain cross section increases from 7 × 10⁻²¹ cm2 at 300 K to 2 × 10⁻²⁰ cm2 at475 K, which results in improved laser performance at elevated temperature.
The basic physics of the four-level alexandrite laser can be discussed with ref-erence to the energy level diagram (Fig. 2.12). The 4A2 level is the ground state,and 4T2 is the absorption state continuum. Vibronic lasing is due to emission fromthe 4T2 state to excited vibronic states within 4A2. Subsequent phonon emissionreturns the system to equilibrium. The laser wavelength depends on which vi-brationally excited terminal level acts as the transition terminus; any energy notreleased by the laser photon will then be carried off by a vibrational phonon, leav-ing the chromium ion at its ground state.
FIGURE 2.13. Absorption spectrum of alexandrite [Allied Corp. Data Sheet].

72 2. Properties of Solid-State Laser Materials
Alexandrite can lase both as a four-level vibronic laser and as a three-level sys-tem analogous to ruby. In the latter mode of operation the laser transition is fromthe 2E state, which is coupled to 4T2, down to the ground state 4A2. As a three-level laser, alexandrite has a high threshold, fixed output wavelength (680.4 nm atroom temperature), and relatively low efficiency. Obviously, the primary interestof alexandrite lies in its vibronic nature.
2.10 Ti : Sapphire
Since laser action was first reported, the Ti : Al2O3 laser has been the subject ofextensive investigations and today it is the most widely used tunable solid-statelaser. The Ti : sapphire laser combines a broad tuning range of about 400 nm witha relatively large gain cross section that is half of Nd : YAG at the peak of its tuningrange. The energy level structure of the Ti3+ ion is unique among transition-metallaser ions in that there are no d state energy levels above the upper laser level.The simple energy-level structure (3d1 configuration) eliminates the possibilityof excited-state absorption of the laser radiation, an effect which has limited thetuning range and reduced the efficiency of other transition-metal-doped lasers.
In this material, a Ti3+ ion is substituted for an Al3+ ion in Al2O3. Laser crys-tals, grown by the Czochralski method, consist of sapphire doped with 0.1% Ti3+
FIGURE 2.14. Absorption and fluorescence spectra of the Ti3+ ion in Al2O3 (sapphire)[16].

2.10. Ti : Sapphire 73
TABLE 2.8. Laser parameters of Ti : Al2O3.
Index of refraction 1.76Fluorescent lifetime 3.2µsFluorescent linewidth (FWHM) 180 nmPeak emission wavelength 790 nmPeak stimulated emission cross section
parallel to c-axis σ‖ ∼ 4.1 × 10⁻¹⁹ cm2
perpendicular to c-axis σ⊥ ∼ 2.0 × 10⁻¹⁹ cm2
Stimulated emission cross sectionat 0.795µm (parallel to c-axis) σ‖ = 2.8 × 10⁻¹⁹ cm2
Quantum efficiency ofconverting a 0.53µm pump photoninto an inverted site ηQ ≈ 1
Saturation fluence at 0.795µm Es = 0.9 J/cm2
by weight. Crystals of Ti : Al2O3 exhibit a broad absorption band, located in theblue–green region of the visible spectrum with a peak around 490 nm. The greatinterest in this material arises from the broad vibronic fluorescence band that al-lows tunable laser output between 670–1070 nm, with the peak of the gain curvearound 800 nm.
The absorption and fluorescence spectra for Ti : Al2O3 are shown in Fig. 2.14.The broad, widely separated absorption and fluorescence bands are caused by thestrong coupling between the ion and host lattice and are the key to broadly tunablelaser operation. The laser parameters of Ti : Al2O3 are listed in Table 2.8.
Besides having favorable spectroscopic and lasing properties, one other advan-tage of Ti : Al2O3 is the material properties of the sapphire host itself, namely veryhigh thermal conductivity, exceptional chemical inertness, and mechanical rigid-ity. Ti : sapphire lasers have been pumped with a number of sources such as argonand copper vapor lasers, frequency doubled Nd : YAG and Nd : YLF lasers, aswell as flashlamps. Flashlamp pumping is very difficult to achieve in Ti : sapphirebecause a very high pump flux is required. The reason for that is the short fluores-cence lifetime of 3.2µm, which results in a small product of stimulated emissioncross section times fluorescence lifetime (στ f ). The population inversion in alaser required to achieve threshold is inversely proportional to στ f , as will beshown in Section 3.1.
Commercial Ti : sapphire lasers are pumped by argon lasers or frequency-doubled Nd : YAG or Nd : YLF lasers. Figure 2.15 displays the output of aTi : sapphire laser pumped at 1 kHz by a frequency-doubled Nd : YLF laserwhich had an average output of 1.7 W at 527 nm. A very important applica-tion of Ti : sapphire lasers is the generation and amplification of femtosecondmode-locked pulses. Kerr lens mode-locking and chirped pulse amplificationwith Ti : sapphire lasers is discussed in Chapter 9.

74 2. Properties of Solid-State Laser Materials
FIGURE 2.15. Tuning range of a Ti : sapphire laser pumped by a Nd : YLF laser at 1 kHz[17].
Summary
In this chapter an overview is given of the laser-related properties of rare earth,transition metal, and actinide ions embedded in solid hosts. The characteristics ofthe most important and highly developed laser materials are discussed in detail.The active element of a solid-state laser is a crystalline or glass host doped witha relatively small percentage of ions either from the rare earth, transition met-als, or actinide group of the periodic table. In terms of the density of active ions,solid-state laser materials are intermediate to gaseous and semiconductor lasers.Laser action has been produced in many hundreds of active ion-host combina-tions. However, only a small fraction of laser materials have been found to beuseful in actual laser systems.
Besides having pump bands that overlap the output spectra of flash lamps ordiode lasers, desirable features of laser ions are a large stimulated emission crosssection, long lifetime, and high quantum efficiency. A large stimulated emissioncross section leads to high gain and low threshold operation, a long lifetime deter-mines whether the laser can be operated cw or must be pulsed, and the quantumefficiency is a measure of the competition between radiative and nonradiative de-cay. The host material must possess favorable optical, thermal, and mechanicalproperties and lend itself to an economical growth process.
Important active ions include trivalent Nd, Er, and Yb from the rare earth groupand Cr and Ti from the transition metals. Since the 4F3/2 − 4I11/2 transition ofNd3+ has the largest cross section of all active ions, it has exhibited laser operationin the largest number of host crystals and glasses. Optical pumping of the 4F3/2level is efficient because of the large number of closely spaced levels at higherenergy levels that creates absorption in the visible and near infrared.
Summary 75
As a host, YAG has particular favorable optical, thermal, and mechanical prop-erties; this makes Nd:YAG the most widely used ion-host combination for solidstate lasers. The principal advantages offered by a glass over a crystalline hostare the flexibility in size and shape and the excellent optical quality. The majordisadvantage of glass is a low thermal conductivity.
Erbium-doped glass is attractive because the output wavelength of this mate-rial is of interest for fiberoptic amplifiers and oscillators and for military applica-tions of lasers. Compared to other materials, ytterbium-doped YAG crystals have amuch smaller energy difference between pump and laser wavelength.This resultsin reduced heating of the crystals and makes Yb : YAG attractive for high powerapplications. Ti : sapphire and alexandrite are important tunable lasers in the nearinfrared. Nd : YVO4 has a large stimulated emission cross section which makes ita low-threshold and high-gain laser. The longer lifetime of Nd : YLF as comparedto Nd : YAG is beneficial for diode pumping since diode lasers are power limitedand the longer pump pulse duration afforded by the larger upper state lifetimeincreases the energy storage capability of the material.
References[1] A.L. Schawlow and C.H. Townes: Phys. Rev. 112, 1940 (1958).
[2] T.H. Maiman: Nature 187, 493 (1960).
[3] J.E. Geusic, H.M. Marcos, and L.G. Van Uitert: Appl. Phys. Lett. 4, 182 (1964).
[4] S.E. Stokowski: Glass lasers, in Handbook of Laser Science and Technology (editedby M.J. Weber) (CRC Press, Boca Raton, FL), 1982, pp. 215–264.
[5] P.F. Moulton: Paramagnetic ion lasers, in Handbook of Laser Science and Technology(edited by M.J. Weber) (CRC Press, Boca Raton, FL), 1986, Vol. 1, pp. 21–295.
[6] L.G. DeShazer, S.C. Rund, and B.A. Wechsler: Laser crystals, in Handbook of LaserScience and Technology (edited by M.J. Weber) (CRC Press, Boca Raton, FL), 1987,Vol. 5, pp. 281–338.
[7] J.C. Walling: Tunable paramagnetic-ion solid-state lasers, in Tunable Lasers, 2ndedition (edited by L.F. Mollenauer, J.C. White, C.R. Pollock), Topics Appl. Phys.,Vol. 59 (Springer, Berlin), 1992, Chap. 9.
[8] R.C. Powell: Physics of Solid-State Laser Materials (Springer, New York), 1998.
[9] Special issue on solid-state lasers, IEEE J. Quantum Electron. QE-24 (1988).
[10] A.A. Kaminskii: Crystalline Lasers (CRC Press, Boca Raton, FL), 1996.
[11] H.G. Danielmeyer and M. Blatte: Appl. Phys. 1, 269 (1973).
[12] J.H. Campbell, T. Suratwala, C. Thorsness, P. Ehrmann, W. Steele, and M. McLean:ICF Quarterly Report, Jan–March 1999, vol. 9, p. 111. Lawrence Livermore Labora-tory.
[13] R.A. Fields, M. Birnbaum, and C.L. Fincher: Appl. Phys. Lett. 51, 1885 (1987).
[14] D.S. Sumida and T.Y. Fan: Proc. Advanced Solid State Lasers 20, 100 (Opt. Soc.Am., Washington, DC), 1994. Also Opt. Lett. 20, 2384 (1995).
[15] W.F. Krupke, IEEE J. Select. Topics Quantum Electron. QE-6, 1287 (2000).
[16] P.F. Moulton: J. Opt. Soc. Am. B 3, 125 (1986). Also Laser Focus 14, 83 (1983).

76 2. Properties of Solid-State Laser Materials
[17] R. Rao, G. Vaillancourt, H.S. Kwok, and C.P. Khattak: OSA Proc. on Tunable SolidState Lasers, Vol. 5, North Falmouth, MA, 1989, p. 39.
Exercises
1. Ruby is a three-level laser. This means that it can absorb its own laser emission.When designing a ruby laser you must be careful to minimize the unpumpedparts of the gain medium to minimize this type of loss. Using the data givenin the text, calculate the peak absorption coefficient of unpumped ruby at itsroom temperature lasing frequency. (See (1.36) and (1.37) and the data in Sec-tion 2.2.)
2. Why were some early ruby lasers cooled to liquid nitrogen temperature(∼77 K)?
3. The absorption spectrum of most Nd3+-doped materials is made up of narrowline features. To better utilize the light produced by flashlamp pump sourcessome materials are co-doped with Cr3+ that has broad and strong visible ab-sorption features. When the transfer of energy is efficient, as it is in gadoliniumscandium gallium garnet (Nd, Cr : GSGG) such co-doping can be very useful.The energy level diagrams of a system with two co-dopants such that energyabsorbed by Species A (the donor species) is transferred to Species B (the ac-ceptor species) so that Species B can lase as indicated is shown in the figure.Energy transfer depends on the populations in both the donor and the acceptorlevels involved. Write the rate equations for this process. Explain your termsand be sure you do not violate any laws of physics.
A B
Energy transfer from A to B excites B at a rate wAB
Pump light is absorbed by species A
Lasing takes place in species B
0A
3A
2A
0B 2B
3B 4B
4. The R1 laser transition of ruby has a good approximation to a Lorentzian shapewith full width at half-maximum (FWHM) of 330 GHz at room temperature.The measured peak transition cross section is σe = 2.5 × 10⁻²⁰ cm2. If therefractive index of ruby is 1.76, what is he radiative lifetime of this transition?Since the observed lifetime is 3 ms, what is the nonradiative lifetime? What isthe fluorescence quantum efficiency?

Exercises 77
5. The Nd : YAG laser transition at 1.064µm has a Lorentzian shape with FWHMof 195 GHz at room temperature. The upper state lifetime is 237µs, the flu-orescence quantum efficiency is 0.42, and the refractive index of Nd : YAG is1.83. What is the peak laser transition cross section?
6. Given that the five lowest levels of a laser system have relative energies of 0,134, 197, 311, and 848 cm−1, what percentage of the population lies in eachof these levels at room temperature (300 K)? (These levels actually define theStark splitting of the ground state of the Nd : YAG laser.)

3
Laser Oscillator
3.1 Operation at Threshold3.2 Gain Saturation3.3 Circulating Power3.4 Oscillator Performance Model3.5 Relaxation Oscillations3.6 Examples of Laser Oscillators
ReferencesExercises
In Chapter 1 we studied the processes which lead to optical amplification in lasermaterials. The regenerative laser oscillator is essentially a combination of twobasic components: an optical amplifier and an optical resonator. The optical res-onator, comprised of two opposing plane-parallel or curved mirrors at right anglesto the axis of the active material, performs the function of a highly selective feed-back element by coupling back in phase a portion of the signal emerging from theamplifying medium.
Figure 3.1 shows the basic elements of a laser oscillator. The pump lamp in-verts the electron population in the laser material, leading to energy storage inthe upper laser level. If this energy is released to the optical beam by stimulatedemission, amplification takes place. Having been triggered by some spontaneousradiation emitted along the axis of the laser, the system starts to oscillate if thefeedback is sufficiently large to compensate for the internal losses of the system.The amount of feedback is determined by the reflectivity of the mirrors. Loweringthe reflectivity of the mirrors is equivalent to decreasing the feedback factor. Themirror at the output end of the laser must be partially transparent for a fraction ofthe radiation to “leak out” or emerge from the oscillator.
An optical structure composed of two plane-parallel mirrors is called a Fabry–Perot resonator. In Chapter 5 we will discuss the temporal and spatial modestructures which can exist in such a resonator. For the purpose of this discus-sion it is sufficient to know that the role of the resonator is to maintain an elec-tromagnetic field configuration whose losses are replenished by the amplifying
78
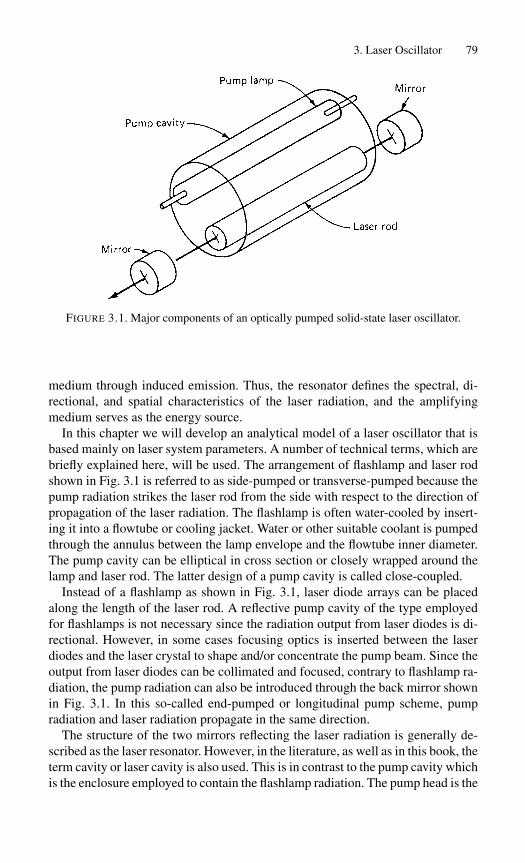
3. Laser Oscillator 79
FIGURE 3.1. Major components of an optically pumped solid-state laser oscillator.
medium through induced emission. Thus, the resonator defines the spectral, di-rectional, and spatial characteristics of the laser radiation, and the amplifyingmedium serves as the energy source.
In this chapter we will develop an analytical model of a laser oscillator that isbased mainly on laser system parameters. A number of technical terms, which arebriefly explained here, will be used. The arrangement of flashlamp and laser rodshown in Fig. 3.1 is referred to as side-pumped or transverse-pumped because thepump radiation strikes the laser rod from the side with respect to the direction ofpropagation of the laser radiation. The flashlamp is often water-cooled by insert-ing it into a flowtube or cooling jacket. Water or other suitable coolant is pumpedthrough the annulus between the lamp envelope and the flowtube inner diameter.The pump cavity can be elliptical in cross section or closely wrapped around thelamp and laser rod. The latter design of a pump cavity is called close-coupled.
Instead of a flashlamp as shown in Fig. 3.1, laser diode arrays can be placedalong the length of the laser rod. A reflective pump cavity of the type employedfor flashlamps is not necessary since the radiation output from laser diodes is di-rectional. However, in some cases focusing optics is inserted between the laserdiodes and the laser crystal to shape and/or concentrate the pump beam. Since theoutput from laser diodes can be collimated and focused, contrary to flashlamp ra-diation, the pump radiation can also be introduced through the back mirror shownin Fig. 3.1. In this so-called end-pumped or longitudinal pump scheme, pumpradiation and laser radiation propagate in the same direction.
The structure of the two mirrors reflecting the laser radiation is generally de-scribed as the laser resonator. However, in the literature, as well as in this book, theterm cavity or laser cavity is also used. This is in contrast to the pump cavity whichis the enclosure employed to contain the flashlamp radiation. The pump head is the

80 3. Laser Oscillator
structure and mechanical assembly that contains the laser crystal, pump source,cooling channels, and electrical connections.
3.1 Operation at Threshold
We will calculate the threshold condition of a laser oscillator composed of twomirrors having the reflectivities R1 and R2 and an active material of length l. Weassume a gain coefficient per unit length of g in the inverted laser material. Ineach passage through the material the intensity gains by a factor of exp(gl). Ateach reflection a fraction 1 − R1 or 1 − R2 of the energy is lost. Starting at onepoint, the radiation will suffer two reflections before it can pass the same point inthe original direction. The threshold condition is established by requiring that thephoton density—after the radiation has traversed the laser material, been reflectedby mirror with R1, and returned through the material to be reflected by mirrorwith R2—be equal to the initial photon density. Then on every complete two-waypassage of the radiation through the laser the loss will just equal the gain. We canexpress the threshold condition by
R1 R2 exp(2gl) = 1. (3.1)
The regenerative amplifier becomes unstable when the amplification per transitexceeds the losses. In this case oscillations will build up, starting from a smalldisturbance. Clearly, if the round-trip gain
G = R1 R2 exp(2gl) (3.2)
is larger than 1, radiation of the proper frequency will build up rapidly until itbecomes so large that the stimulated transitions will deplete the upper level andreduce the value of g. The condition of steady state is reached if the gain perpass exactly balances the internal and external losses. This process, called gainsaturation, will be discussed in Section 3.2. In an oscillator a number of lossmechanisms are responsible for attenuating the beam; the most important onesare reflection, scattering, and absorption losses caused by the various optical com-ponents. It is convenient to lump all losses which are proportional to the lengthof the gain medium, such as absorption and bulk scattering, into an absorptioncoefficient α. The condition for oscillation is then
R1 R2 exp(g − α)2l = 1. (3.3)
Rearranging (3.3) yields
2gl = − ln R1 R2 + 2αl. (3.4)
Losses such as scattering at interfaces and Fresnel reflections which are not de-pendent on the length of the gain medium can be thought of as leakage from the

3.1. Operation at Threshold 81
rear mirror. Hence the reduced reflectivity R2 of the rear mirror R2 = 1 − δMtakes into account the miscellaneous losses. In practice, δM does not exceed a fewpercent. With the approximation
ln(1 − δM) ≈ −δM, (3.5)
one can combine the optical losses in the resonator with the losses in the crystal
δ = 2αl + δM, (3.6)
where δ is the two-way loss in the resonator. With the aid of (3.5), (3.6) we canexpress the threshold condition (3.3) in the following form:
2gl = δ − ln R1 ≈ T + δ. (3.7)
where T = 1 − R1 is the transmission of the output mirror.In (1.61), (1.64) the decay time τc of the photon flux in the resonator was in-
troduced. This time constant, determined by photons either scattered, absorbed,or emitted, can be related to the loss term of (3.7) and the quality factor Q of theresonator. Since τc represents the average lifetime of the photons in the resonator,it can be expressed by the round trip time of a photon in the resonator tτ = 2L/cdivided by the fractional loss ε per round trip
τc = tτ /ε = 2L
c(T + δ), (3.8)
where ε = T + δ is the loss term in (3.7) and L is the length of the resonator.Resonators are characterized by the quality factor Q, which is defined as 2π timesthe ratio of stored energy Est to dissipated energy Ed per period T0. The resonatorQ defined in this way is Q = 2πEst/Ed where Ed = Est(1 − exp(−T0/τc)) fromwhich we obtain
Q = 2π
[1 − exp
(−T0
τc
)]−1
≈ 2πτc
T0= 2πν0τc, (3.9)
where ω0 = 2πν0 = 2π/T0. In a typical cw Nd : YAG laser, the transmission ofthe output mirror is around 10% and the combined losses about 5%. If we assumea resonator length of 50 cm, we obtain a photon lifetime of τc = 22 ns and aQ factor for the resonator of Q = 39 × 106. Compared to electronic resonancecircuits, optical resonators have very high values of Q.
As will be further discussed in Section 5.2.3 the finite lifetime of the photonsalso determine the minimum bandwidth of the passive resonator according to theFourier transform ω = 1/τc. With this relationship the quality factor in (3.9)can also be defined as Q = ν0/ ν. The laser parameters and conditions that leadto a low threshold will be examined next.
We turn to the rate equation (1.61), which gives the photon density in the am-plifying medium. It is clear from this equation that for onset of laser emission the

82 3. Laser Oscillator
rate of change of the photon density must be equal to or greater than zero. Thusat laser threshold for sustained oscillation the condition
∂φ
∂t≥ 0 (3.10)
must be fulfilled, which enables us to obtain from (1.61) the required inversiondensity at threshold,
n ≥ 1
cστc. (3.11)
In deriving this expression we have ignored the factor S, which denotes the smallcontribution from spontaneous emission to the induced emission.
According to (1.36) the gain coefficient g can be expressed by
g = nσ, (3.12)
where n is the population inversion and σ is the stimulated emission cross section.The expression for threshold (3.11) is identical to (3.7) if we introduce τc from(3.8) and g from (3.12) into (3.11) and assume that the resonator mirrors arecoated onto the ends of the laser rod, i.e., L = �. If we replace σ with (1.40) wemay write the threshold condition (3.11) in terms of fundamental laser parameters
n >τf8πν2
0
τcc3g(νs, ν0). (3.13)
The lineshape factor g(νs, ν0) and therefore the stimulated emission cross sec-tion σ are largest at the center of the atomic line. Thus from (3.13) we can seequalitatively how the linewidth of the laser output is related to the linewidth ofthe atomic system. Self-sustained oscillation that develops from noise will occurin the neighborhood of the resonant frequency because only at a narrow spectralrange at the peak will the amplification be large enough to offset losses. Conse-quently, the output of the laser will be sharply peaked, and its linewidth will bemuch narrower than the atomic linewidth.
It is also obvious from this equation that an increase of the inversion by strongerpumping will increase the laser linewidth because the threshold condition cannow be met for values of g(νs, ν0) farther away from the center. As we will seein Chapter 5 the linewidth of an actual laser system is related to the linewidthof the active material, the level of pump power, and the properties of the opticalresonator. The threshold condition at the center of the atomic line is obtained byintroducing the peak values of the amplification curve into (3.13). If g(νs, ν0) hasa Lorentzian shape with full width at half-maximum of ν centered about νs, theng(ν0) = 2/π ν and
n >τf4π2 νν2
0
τcc3. (3.14)
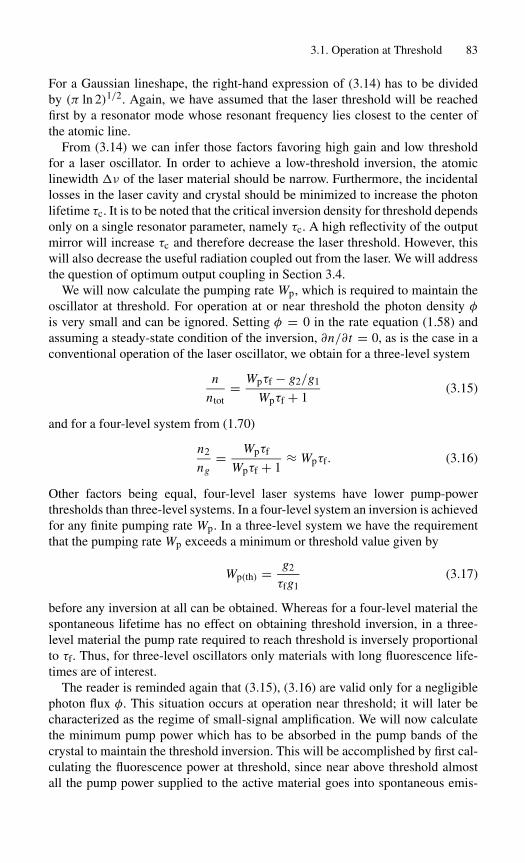
3.1. Operation at Threshold 83
For a Gaussian lineshape, the right-hand expression of (3.14) has to be dividedby (π ln 2)1/2. Again, we have assumed that the laser threshold will be reachedfirst by a resonator mode whose resonant frequency lies closest to the center ofthe atomic line.
From (3.14) we can infer those factors favoring high gain and low thresholdfor a laser oscillator. In order to achieve a low-threshold inversion, the atomiclinewidth ν of the laser material should be narrow. Furthermore, the incidentallosses in the laser cavity and crystal should be minimized to increase the photonlifetime τc. It is to be noted that the critical inversion density for threshold dependsonly on a single resonator parameter, namely τc. A high reflectivity of the outputmirror will increase τc and therefore decrease the laser threshold. However, thiswill also decrease the useful radiation coupled out from the laser. We will addressthe question of optimum output coupling in Section 3.4.
We will now calculate the pumping rate Wp, which is required to maintain theoscillator at threshold. For operation at or near threshold the photon density φis very small and can be ignored. Setting φ = 0 in the rate equation (1.58) andassuming a steady-state condition of the inversion, ∂n/∂t = 0, as is the case in aconventional operation of the laser oscillator, we obtain for a three-level system
n
ntot= Wpτf − g2/g1
Wpτf + 1(3.15)
and for a four-level system from (1.70)
n2
ng= Wpτf
Wpτf + 1≈ Wpτf. (3.16)
Other factors being equal, four-level laser systems have lower pump-powerthresholds than three-level systems. In a four-level system an inversion is achievedfor any finite pumping rate Wp. In a three-level system we have the requirementthat the pumping rate Wp exceeds a minimum or threshold value given by
Wp(th) = g2
τfg1(3.17)
before any inversion at all can be obtained. Whereas for a four-level material thespontaneous lifetime has no effect on obtaining threshold inversion, in a three-level material the pump rate required to reach threshold is inversely proportionalto τf. Thus, for three-level oscillators only materials with long fluorescence life-times are of interest.
The reader is reminded again that (3.15), (3.16) are valid only for a negligiblephoton flux φ. This situation occurs at operation near threshold; it will later becharacterized as the regime of small-signal amplification. We will now calculatethe minimum pump power which has to be absorbed in the pump bands of thecrystal to maintain the threshold inversion. This will be accomplished by first cal-culating the fluorescence power at threshold, since near above threshold almostall the pump power supplied to the active material goes into spontaneous emis-
84 3. Laser Oscillator
sion. The fluorescence power per unit volume of the laser transition in a four-levelsystem is
Pf
V= hνnth
τf, (3.18)
where n2 = nth is the inversion at threshold.In a three-level system at threshold, n2 ≈ n1 ≈ ntot/2 and
Pf
V≈ hνntot
2τf. (3.19)
In order that the critical inversion is maintained, the loss by fluorescence fromthe upper laser level must be supplied by the pump energy. As a result we obtain,for the absorbed pump power Pa needed to compensate for population loss of thelaser level by spontaneous emission for a four-level laser
Pa
V= hνpnth
ηQτf, (3.20)
where hνp is the photon energy at the pump wavelength and ηQ is the quantumefficiency as defined in (1.56). In a three-level system, one requires n2 ≈ n1 =ntot/2 to reach transparency, therefore
Pa
V= hνpntot
2ηQτf. (3.21)
3.2 Gain Saturation
In the previous section we considered the conditions for laser threshold. Thresholdwas characterized by a steady-state population inversion, that is, ∂n/∂t = 0 inthe rate equations. In doing this we neglected the effect of stimulated emissionby setting φ = 0. This is a good assumption at threshold, where the inducedtransitions are small compared with the number of spontaneous processes.
As the threshold is exceeded, however, stimulated emission and photon den-sity in the resonator build up. Far above threshold we have to consider a largephoton density in the resonator. From (1.58) we can see that ∂n/∂t decreases forincreasing photon density. Steady state is reached when the population inversionstabilizes at a point where the upward transitions supplied by the pump sourceequal the downward transitions caused by stimulated and spontaneous emission.With ∂n/∂t = 0 one obtains, for the steady-state inversion population in the pres-ence of a strong photon density φ,
n = ntot
(Wp − γ − 1
τf
)(γ cσφ + Wp + 1
τf
)−1
. (3.22)

3.2. Gain Saturation 85
The photon density φ is given by the sum of two beams traveling in oppositedirections through the laser material.
We will now express (3.22) in terms of operating parameters. From Section 1.3we recall that the gain coefficient g = −α is defined by the product of stimulatedemission, cross section, and inversion population. Furthermore, we will define again coefficient that the system would have at a certain pump level in the absenceof stimulated emission. Setting φ = 0 in (3.22) we obtain the small-signal gaincoefficient
g0 = σntot[Wpτf − (γ − 1)](Wpτf + 1)−1, (3.23)
which an active material has when pumped at a level above threshold and whenlasing action is inhibited by blocking the optical beam or by removing one orboth of the resonator mirrors. If feedback is restored, the photon density in theresonator will increase exponentially at the onset with g0. As soon as the photondensity becomes appreciable, the gain of the system is reduced according to
g = g0
(1 + γ cσφ
Wp + (1/τf)
)−1, (3.24)
where g is the saturated gain coefficient. Equation (3.24) was obtained by intro-ducing (3.23) into (3.22) and using g = σn.
We can express φ by the power density I in the system. With I = cφhν weobtain
g = g0
1 + I/Is, (3.25)
where
Is =(
Wp + 1
τf
)hν
γ σ. (3.26)
The parameter Is defines a flux in the active material at which the small-signalgain coefficient g0 is reduced by one-half.
In a four-level system Wp 1/τf and γ = 1, so (3.26) reduces to
Is = hν
στf. (3.27)
For a three-level system the saturation flux is
Is = hν[Wp + (1/τ21)]σ [1 + (g2/g1)] . (3.28)
As we can see from (3.23) the small-signal gain depends only on the materialparameters and the amount of pumping power delivered to the active material.

86 3. Laser Oscillator
The large-signal or saturated gain depends in addition on the power density in theresonator.
Gain saturation as a function of steady-state radiation intensity must be ana-lyzed for lasers with homogeneous and inhomogeneous line broadening. Equation(3.25) is valid only for the former case, in which the gain decreases proportion-ately over the entire transition line. As we have seen in Chapter 2, a ruby laserhas a homogeneously broadened bandwidth, whereas in Nd : glass the interactionof the active ion with the electrostatic field of the host leads to an inhomogeneousline. However, in solid-state materials such as Nd : glass, the cross-relaxation rateis very fast. The latter is associated with any process characteristic of the lasermedium that affects the transfer of excitation within the atomic spectral line so asto prevent or minimize the departure of this line from the equilibrium distribution.It has been shown that in the case of a very fast cross-relaxation within the inho-mogeneous line, the saturated gain is in agreement with that of a homogeneouslybroadened bandwidth.
3.3 Circulating Power
In a laser resonator the power density in the active medium increases up to thepoint where the saturated gain equals the total losses. This power density I isobtained from the threshold conditions (3.7) and the expression for saturated gain(3.25),
I = Is
[2g0l
δ − ln R1− 1
]. (3.29)
The first expression in brackets is a measure of by how much the laser is pumpedabove threshold. From (3.29) it follows as one would expect I = 0 at threshold. Ifthe gain medium is pumped above threshold, g0 and I will increase, whereas thesaturated gain coefficient g will stay constant according to (3.7). As I increases,so will the output power which is coupled out through mirror R1.
We will now relate the laser output to the power density in the resonator. Thepower density I in the laser resonator comprises the power densities of two oppo-sitely traveling waves. One can think of a circulating power density Icirc, which isreflected back and forth between the two resonator mirrors. Figure 3.2 illustratesa standing wave laser resonator, where IL(x) and IR(x) are the intracavity one-way intensities of the left and right traveling resonator beams as a function of theintracavity location x . The rear reflector and output coupler are located at x = 0and x = L , respectively. The rod faces are located at x = a and x = b. Hence,the length of the active medium is � = b − a.
The beam moving in the (+x) direction in Fig. 3.2 will experience an increaseaccording to
d IL(x)
dx= g(x)IL(x). (3.30)
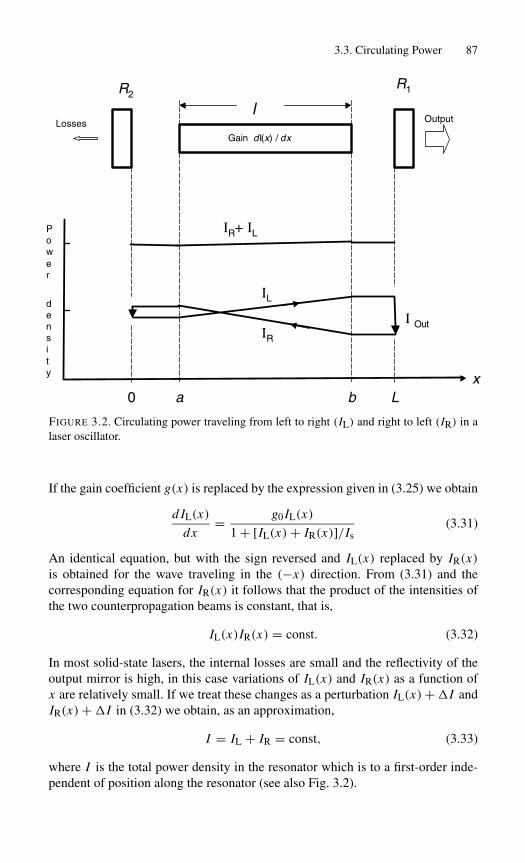
3.3. Circulating Power 87
0 a b Lx
IL
IR
IR+ IL
R2R1
lOutputLosses
I Out
Power
density
Gain dI(x) / dx
FIGURE 3.2. Circulating power traveling from left to right (IL) and right to left (IR) in alaser oscillator.
If the gain coefficient g(x) is replaced by the expression given in (3.25) we obtain
d IL(x)
dx= g0 IL(x)
1 + [IL(x)+ IR(x)]/Is(3.31)
An identical equation, but with the sign reversed and IL(x) replaced by IR(x)is obtained for the wave traveling in the (−x) direction. From (3.31) and thecorresponding equation for IR(x) it follows that the product of the intensities ofthe two counterpropagation beams is constant, that is,
IL(x)IR(x) = const. (3.32)
In most solid-state lasers, the internal losses are small and the reflectivity of theoutput mirror is high, in this case variations of IL(x) and IR(x) as a function ofx are relatively small. If we treat these changes as a perturbation IL(x)+ I andIR(x)+ I in (3.32) we obtain, as an approximation,
I = IL + IR = const, (3.33)
where I is the total power density in the resonator which is to a first-order inde-pendent of position along the resonator (see also Fig. 3.2).

88 3. Laser Oscillator
The circulating power Icirc is to a good approximation equal to the average ofthe power densities of the counterpropagating beams
Icirc = (IL + IR)/2. (3.34)
From Fig. 3.2 follows
Iout = (1 − R1)IL (3.35a)
and
IR = R1 IL. (3.35b)
Introducing (3.35) into (3.33) yields
Pout = AI
(1 − R
1 + R
), (3.36)
where R is now the reflectivity of the output mirror and A is the cross section ofthe gain medium. For values of R close to 1, (3.36) reduces to
Pout = AI T/2, (3.37)
where T is the transmission of the output mirror.
3.4 Oscillator Performance Model
In this section we will develop a model for the laser oscillator. First we will dis-cuss the various steps involved in the conversion process of electrical input to laseroutput. After that, we will relate these energy transfer mechanisms to parameterswhich are accessible to external measurements of the laser oscillator. The pur-pose of this section is to gain insight into the energy conversion mechanisms andtherefore provide an understanding of the dependency and interrelationship ofthe various design parameters which may help in the optimization of the overalllaser efficiency. In almost all applications of lasers, it is a major goal of the laserdesigner to achieve the desired output performance with the maximum systemefficiency.
3.4.1 Conversion of Input to Output Energy
The flow of energy from electrical input to laser output radiation is illustratedschematically in Fig. 3.3. Also listed are the principal factors and design issuesthat influence the energy conversion process. There are different ways of parti-tioning this chain of transfer processes. This approach was chosen from an en-gineering point of view which divides the conversion process into steps relatedto individual system components. As shown in Fig. 3.3, the energy transfer fromelectrical input to laser output can conveniently be expressed as a four-step pro-cess.

3.4. Oscillator Performance Model 89
FIGURE 3.3. Energy flow in a solid-state laser system.
Conversion of Electrical Input Delivered to the Pump Sourceto Useful Pump Radiation
We define as useful radiation the emission from the pump source that falls into theabsorption bands of the laser medium. The pump source efficiency ηP is thereforethe fraction of electrical input power that is emitted as optical radiation within theabsorption region of the gain medium. The output of a laser diode or a diode arrayrepresents all useful pump radiation, provided the spectral output is matched tothe absorption band of the gain medium. Typical values of ηp for commerciallyavailable cw and quasi-cw diode arrays are 0.3 to 0.5.
For flashlamp or cw arc lamp-pumped systems, the pump source efficiency maybe defined as
ηp = Pλ/Pin =∫ λ2
λ1
P ′λ dλ/Pin, (3.38)
where Pλ is the spectral output power of the lamp within the absorption bandsof the gain material, Pin is the electrical power input, and P ′
λ is the radiativepower per unit wavelength emitted by the lamp, and the integral is taken over thewavelength range λ1 to λ2, which is useful for pumping the upper laser level. Theoutput characteristics of arc lamps and their dependency on operating parameterswill be discussed in Section 6.1. The measurement of ηp for broadband sources issomewhat involved and requires either a calorimetric measurement of the powerabsorbed in a sample of the laser material or integration over the source emissionspectrum and the absorption spectrum of the gain material. Typical values areηp = 0.04–0.08. These numbers are typical for a 5 to 10 mm thick laser material.The magnitude of ηP is dependent on the thickness of the active material becauseas the thickness increases, radiation at the wings of the absorption band will startto contribute more to the pumping action.
Transfer of the Useful Pump Radiation Emitted by the Pump Sourceto the Gain Medium
The transfer of flashlamp pump radiation to the laser medium is accomplished bymeans of a completely enclosed reflective chamber or pump cavity. The radiation

90 3. Laser Oscillator
transfer efficiency ηt can be defined as
Pe = ηt Pλ, (3.39)
where Pλ is the useful pump radiation emitted by the source and Pe is the fractionof this radiation transferred into the laser material. The factor ηt is a combinationof the capture efficiency, defined by the fraction of rays leaving the source andintersecting the laser rod, and the transmission efficiency. The former is based onthe geometrical shape of the pump cavity, diameter and separation of the pumpsource, and laser rod. The latter is a function of the reflectivity of the walls ofthe pump cavity, reflection losses at the rod surface and coolant jacket, absorptionlosses in the coolant fluid, and radiation losses through the clearance holes atthe side walls of the pump cavity. For close-coupled cavities, typical values areηt = 0.3–0.6.
In diode-pumped lasers the radiation transfer is much simpler. In so-called end-pumped lasers, the transfer system usually consists of lenses for the collection andfocusing of diode radiation into the laser crystal. Furthermore, in side-pumpedsystems, the laser diodes are mounted in close proximity to the laser crystal with-out the use of any intervening optics. If we express reflection losses and spill-overlosses at the optics or active medium by the parameter R, we can write
ηt = (1 − R). (3.40)
Since the laser crystal and optical components are all antireflection coated, theradiation transfer losses are very small in these systems. Values for the radiationtransfer efficiency are typically ηt = 0.85–0.98.
Absorption of Pump Radiation by the Gain Medium and Transfer ofEnergy to the Upper Laser Level
This energy transfer can be divided into two processes. The first is the absorptionof pump radiation into the pump bands of the gain medium expressed by ηa, andthe second is the transfer of energy from the pump band to the upper laser levelexpressed by ηQηs.
The absorption efficiency is the ratio of power Pa absorbed to power Pe enteringthe laser medium
ηa = Pa/Pe. (3.41)
The quantity ηa is a function of the path length and the spectral absorption co-efficient of the laser medium integrated over the emission spectrum of the pumpsource. If the pump radiation is totally diffuse inside the laser rod, as is the casewhen the lateral surface is rough ground, a good approximation can be derived byexpressing (3.41) in a different form
ηa = (d Pa/dV )V
Iw F, (3.42a)

3.4. Oscillator Performance Model 91
where d Pa/dV is the power absorbed per volume, Iw is the power density at thecylindrical surface of the rod, and F , V are the cylindrical rod surface and volumeof the rod, respectively.
The power absorbed per volume can also be expressed by d Pa/dV = α0 Iav,where α0 is the absorption coefficient of the laser material averaged over the spec-tral emission range of the lamp and Iav is the average power density inside the rod.Radiation with an energy density Wav propagating at a velocity c has a power den-sity of Iav = cWav, where c = c0/n0 is the speed of light in the medium and n0 isthe refractive index. The energy density in the laser rod has a radial dependencedue to absorption. The average value Wav can be closely approximated by takingthe energy density Ws at the surface weighted by the factor exp(−α0 R), whereR is the rod radius and α0 is the absorption coefficient. From [3] it follows thatthis is a valid approximation over a large range of α0. From these considerationsfollows
d Pa/dV = α0cWs exp(−α0 R). (3.42b)
Owing to grinding the lateral surface of the rod, the pump radiation upon enter-ing the rod will be diffused. For an enclosure with diffusely reflecting walls, weobtain from blackbody radiation theory a relationship between energy Ws insidethe enclosure and the intensity Iw emitted by the walls
Iw = cWs/4. (3.42c)
Introducing (3.42b, c) into (3.42a) yields our final result
ηa = 2α0 R exp(−α0 R). (3.43)
For diode pumped lasers, the absorption efficiency can be approximated by
ηa = 1 − exp(−α0l), (3.44)
where α0 is the absorption coefficient of the laser crystal at the wavelength emittedby the laser diode and l is the path length in the crystal. Detailed data on ηa forboth flashlamp and laser diode radiation can be found in Chapter 6.
The upper state efficiency may be defined as the ratio of the power emitted at thelaser transition to the power absorbed into the pump bands. This efficiency is theproduct of two contributing factors, the quantum efficiency ηQ, which is definedas the number of photons contributing to laser emission divided by the numberof pump photons, and ηS, the quantum defect efficiency. The latter is sometimesreferred to as the Stokes factor, which represents the ratio of the photon energyemitted at the laser transition hνL to the energy of a pump photon hνp, that is,
ηS =(
hνL
hνp
)= λP
λL, (3.45)

92 3. Laser Oscillator
where λP and λL is the wavelength of the pump transition and the laser wave-length, respectively. For Nd : YAG emitting at 1064 nm that is pumped by a laserdiode array at 808 nm, we obtain ηS = 0.76, and ηQ = 0.90.
In a flashlamp-pumped system, the value of ηS is an average value derived fromconsidering the whole absorption spectrum of the laser.
Conversion of the Upper State Energy to Laser Output
The efficiency of this process can be divided into the fractional spatial overlap ofthe resonator modes with the pumped region of the laser medium and the fractionof the energy stored in the upper laser level which can be extracted as output.
The beam overlap efficiency ηB is defined as the resonator mode volume di-vided by the pumped volume of the active material. A value of ηB less than 1indicates that part of the inversion will decay by spontaneous, rather than stimu-lated, emission. In an oscillator ηB expresses the mode-matching efficiency, thatis, the spatial overlap between the resonator modes and the gain distribution. Inan amplifier ηB is a measure of the spatial overlap between the input beam andthe gain distribution in the laser material.
This subject usually does not receive a lot of attention in laser literature, but apoor overlap of the gain region of the laser with the laser-beam profile is oftenthe main reason that a particular laser performs below expectations. For example,the generally disappointing performance of slab lasers can often be traced to aninsufficient utilization of the rectangular gain cross-section by the laser beam.Likewise, the low overall efficiency of lasers with a TEM00 mode output is theresult of a mode volume that occupies only a small fraction of the gain region ofthe laser rod. On the other hand, so-called end-pumped lasers, where the outputfrom a laser diode pump is focused into the gain medium, achieve near perfectoverlap.
Instead of comparing the pump with the mode volume, it is often sufficient tocompare the cross-sections, if we assume that the radial distribution of the res-onator mode does not change appreciably along the length of the active medium.For example, in a 50 cm long resonator, with two curved mirrors of 5 m radius ateach end, the TEM00 mode changes only by 5% over the length of the resonator(Section 5.1.3).
The overlap between the resonator mode intensity distribution I (r) and the gaindistribution g(r) is given by an overlap integral
ηB =∫
g(r)I (r)2πr dr
/∫I 2(r)2πr dr. (3.46)
For two practical cases (3.46) can be easily evaluated. The first case is a uniformlypumped gain medium operated in a highly multimode resonator. If we assume atop hat distribtution for both the gain region and resonator beam (i.e., independentof r ), then ηB is simply the ratio of the overlapping cross sections, ηB = w2
m/w2p,
where πw2m and πw2
p is the cross section of the resonator mode and pump region,respectively. The efficiency ηB can at best equal unity.
3.4. Oscillator Performance Model 93
Another simple case is found in end-pumped lasers. In this case a Gaussianpump beam and a Gaussian (TEM00) resonator mode propagate coaxially insidethe active medium. Introducing in (3.46) a normalized Gaussian resonator mode
I (r) = (2/πw2m) exp[−2(r/wm)
2], (3.47)
and a similar expression for the pump beam yields
ηB = 2w2m
w2p + w2
mfor wp > wm, and ηB = 1 for wp ≤ wm, (3.48)
where wp and wm are the spot sizes for the pump beam and resonator mode pro-files. For wm = wp, the TEM00 mode and pump beam occupy the same volumeand ηB = 1.
Values for ηB can range from as low as 0.1, for example, for a laser rod of 5 mmdiameter operated inside a large radius mirror resonator containing a 1.5 mm aper-ture for fundamental mode control, to 0.95 for an end-pumped laser operatingat TEM00. Innovative resonator designs, employing unstable resonators, internallenses, variable reflectivity mirrors, and so forth, can achieve TEM00 mode opera-tion typically at ηB = 0.3–0.5. Multimode lasers typically achieve ηB = 0.8–0.9.If a laser oscillator is followed by an amplifier, a telescope is usually inserted be-tween these two stages in order to match the oscillator beam to the diameter ofthe amplifier and thereby optimize ηB.
The circulating power in an optical resonator is diminished by internal lossesdescribed by the round trip loss δ (Section 3.2) and by radiation coupled out ofthe resonator. For reasons that will become apparent in the next section, we willdefine an extraction efficiency ηE which describes the fraction of total availableupper state energy or power which appears at the output of the laser
ηE = Pout/Pavail. (3.49)
Expressions for ηE will be given in Section 3.4.2 and in Chapters 4 and 8 for thecw oscillator, laser amplifier, and Q-switch oscillator, respectively.
An indication of the reduction of available output power due to losses in res-onator can be obtained from the coupling efficiency
ηc = T/(T + δ). (3.50)
As will be explained in the next section, the slope of the output versus inputcurve of a laser is directly proportional to this factor, whereas the overall systemefficiency of a laser is directly proportional to ηE.
The conversion processes described so far are equally applicable to cw andpulsed lasers, provided that the power terms are replaced with energy and inte-gration over the pulse length is carried out where appropriate. The energy flowdepicted in Fig. 3.3 can also be extended to laser amplifiers and Q-switched sys-tems because the discussion of pump source efficiency, radiation transfer, and so
94 3. Laser Oscillator
forth, is equally applicable to these systems. Even the definition for the extrac-tion efficiency remains the same, however, the analytical expressions for ηE aredifferent as will be discussed in Chapter 4 for the laser amplifier.
If the laser oscillator is Q-switched, additional loss mechanisms come into playwhich are associated with energy storage at the upper laser level and with the tran-sient behavior of the system during the switching process. The Q-switch processwill be described in detail in Chapter 8. However, for completeness of the discus-sion on energy transfer mechanisms in a laser oscillator, we will briefly discussthe loss mechanisms associated with Q-switch operations.
In a Q-switched laser, a large upper state population is created in the lasermedium, and stimulated emission is prevented during the pump cycle by the in-troduction of a high loss in the resonator. At the end of the pump pulse, the loss isremoved (the resonator is switched to a high Q) and the stored energy in the gainmedium is converted to optical radiation in the resonator from which it is coupledout by the output mirror.
There are losses prior to opening of the Q-switch, such as fluorescence lossesand Amplified Spontaneous Emission (ASE) losses that will depopulate the up-per state stored energy. Also, not all of the stored energy available at the time ofQ-switching is converted to optical radiation. For a Q-switched laser, the extrac-tion efficiency ηE in Fig. 3.3 can be expressed as
ηE = ηStηASEηEQ, (3.51)
where ηSt and ηASE account for the fluorescence and ASE losses prior to the open-ing of the Q-switch and ηEQ is the extraction efficiency of the Q-switch process.
Assuming a square pump pulse of duration tp, the maximum upper state popu-lation reached at the end of the pump cycle is given by
n2(tp) = ngWpτf[1 − exp(−tp/τf)
]. (3.52)
Since the total number of ions raised to the upper level during the pump pulse isngWptp, the fraction available at the time of Q-switching (t = tp) is
ηSt = [1 − exp(−tp/τf)]tp/τf
. (3.53)
The storage efficiency ηSt is therefore the ratio of the energy stored in the upperlaser level at the time of Q-switching to the total energy deposited in the upperlaser level. From the expression for ηSt it follows that for a pump pulse equalto the fluorescence lifetime (tp = τf) the storage efficiency is 0.63. Clearly, ashort pump pulse increases the overall efficiency of a Q-switched laser. However,a shorter pump pulse puts an extra burden on the pump source because the pumphas to operate at a higher peak power to deliver the same energy to the lasermedium.
If the inversion reaches a critical value, the gain can be so high such that spon-taneous emission after amplification across the gain medium may be large enough

3.4. Oscillator Performance Model 95
to deplete the laser inversion. Furthermore, reflections from internal surfaces canincrease the path length or allow multiple passes inside the gain section whichwill make it easier for this unwanted radiation to build up. In high-gain oscilla-tors, multistage lasers, or in laser systems having large-gain regions, ASE coupledwith parasitic oscillations present the limiting factor for energy storage.
We can define ηASE as the fractional loss of the stored energy density to ASEand parasitic oscillations
ηASE = 1 − EASE/ESt. (3.54)
Minimizing reflections internal to the laser medium by AR coatings and providinga highly scattering, absorbing, or low-reflection (index matching) surface of thelaser rod, coupled with good isolation between amplifier stages, will minimizeASE and parasitic losses. The occurrence of ASE can often be recognized in alaser oscillator or amplifier as a saturation in the laser output as the lamp input isincreased (see also Section 4.4.1).
The fraction of the stored energy ESt available at the time of Q-switching to en-ergy EEX extracted by the Q-switch, can be expressed as the Q-switch extractionefficiency
ηEQ = EEX/ESt. (3.55)
The fraction of initial inversion remaining in the gain medium after emission ofa Q-switched pulse is a function of the initial threshold and final population in-version densities. These parameters are related via a transcendental equation, asshown in Chapter 8.
3.4.2 Laser Output
In this subsection, we will describe the basic relationships between externallymeasurable quantities, such as laser output, threshold, and slope efficiency, andinternal systems and materials parameters.
After the pump source in a laser oscillator is turned on, the radiation flux in theresonator that builds up from noise will increase rapidly. As a result of the increas-ing flux, the gain coefficient decreases according to (3.25) and finally stabilizes ata value determined by (3.7). A fraction of the intracavity power is coupled out ofthe resonator and appears as useful laser output according to (3.36). If we combine(3.29), (3.36), the laser output takes the form
Pout = A
(1 − R
1 + R
)IS
(2g0l
δ − ln R− 1
). (3.56)
In this equation, IS is a materials parameter, A and l are the cross-section andlength of the laser rod, respectively, and R is the reflectivity of the output coupler.These quantities are usually known, whereas the unsaturated gain coefficient g0and the resonator losses δ are not known. We will now relate g0 to system pa-

96 3. Laser Oscillator
rameters and describe methods for the measurement of g0 and the losses δ in anoscillator.
The Four-Level System
The population inversion in a four-level system as a function of pump rate is givenby (3.16). Making the assumption that WPτf 1 and multiplying both sides ofthis equation by the stimulated emission cross section yields
g0 = σn0WPτf. (3.57)
Now we recall from Chapter 1 that WPng gives the number of atoms transferredfrom the ground level to the upper laser level per unit time and volume, i.e., pumppower density divided by photon energy. This can be expressed as
WPng = ηQηSηB Pa/hνLV, (3.58)
where Pa is the total absorbed pump power and V is the volume of the gainmedium. Not all of the atoms transferred from the ground level to the upper laserlevel contribute to gain, this is accounted for by ηQ. The Stokes factor ηS entersin (3.58) because the photon energy is expressed in emitted laser photons ratherthan pump photons, and the overlap efficiency ηB defined in (3.46) accounts forthe fact that not all of the population inversion interacts with the photon densityof the resonator modes.
If we introduce (3.58) into (3.57), we can express the small signal gain coeffi-cient in terms of absorbed pump power
g0 = στfηQηSηB Pab/hνLV . (3.59)
The absorbed pump power in the laser material is related to the electrical input tothe pump source by
Pab = ηPηtηa Pin. (3.60)
With (3.59), (3.60) we can establish a simple relationship between the small sig-nal, single pass gain and lamp input power
g0 = στ f ηPin/hνLV, (3.61)
where, for convenience, we have combined all the efficiency factors into
η = ηpηtηaηQηSηB. (3.62)
If we replace the small signal coefficient g0 in (3.56) with the system and materialsparameters given in (3.61) we obtain our final result
Pout = σS(Pin − Pth), (3.63)

3.4. Oscillator Performance Model 97
FIGURE 3.4. Laser output versus pump input characterized by a threshold input power Pthand a slope efficiency σS.
where σS is the slope efficiency of the output versus input curve, as shown inFig. 3.4,
σS =( − ln R
δ − ln R
)η ≈ T
T + δη. (3.64)
The electrical input at threshold is
Pth =(δ − ln R
2
)AhνL
ηστf≈(
T + δ
2
)AhνL
ηστf. (3.65)
In deriving (3.64), (3.65) we have made use of the approximation 2(1 − R)/(1 +R) = − ln R. Also for reflectivities of the output coupler of R = 0.9 or higher,the term (− ln R) can be replaced in most cases by the mirror transmission Twith sufficient accuracy. In the laser literature, (3.65) is sometimes expressed interms of pump photon energy, in this case ηQηS have to be excluded from η sincehνL = ηQηShνp.
From (3.65) it follows that a laser material with a large product of the stimu-lated emission cross section and fluorescence lifetime (στf) will have a low laserthreshold. The slope efficiency σS is simply the product of all the efficiency fac-tors discussed in Section 3.4.1. The input power Pth required to achieve laserthreshold is inversely proportional to the same efficiency factors. Therefore, a de-crease of any of the η terms will decrease the slope efficiency and increase thethreshold, as shown in Fig. 3.4. In the expressions for σS and Pth we have left Tand δ in explicit form, because these parameters are subject to optimization in alaser resonator. As expected, higher optical losses δ, caused by reflection, scat-tering, or absorption, increase the threshold input power and decrease the slopeefficiency.
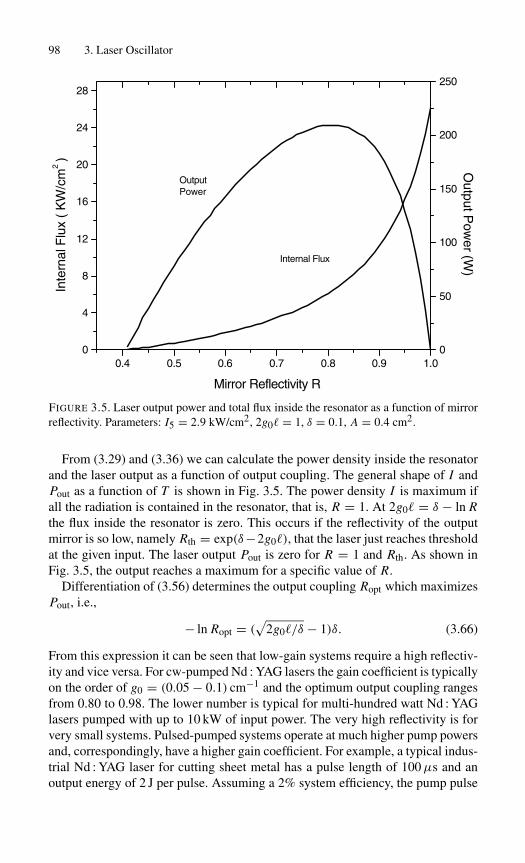
98 3. Laser Oscillator
0.4 0.5 0.6 0.7 0.8 0.9 1.00
4
8
12
16
20
24
28
Mirror Reflectivity R
Inte
rnal
Flu
x (
KW
/cm
2 )
0
50
100
150
200
250
Internal Flux
OutputPower
Output P
ower (W
)
FIGURE 3.5. Laser output power and total flux inside the resonator as a function of mirrorreflectivity. Parameters: I5 = 2.9 kW/cm2, 2g0� = 1, δ = 0.1, A = 0.4 cm2.
From (3.29) and (3.36) we can calculate the power density inside the resonatorand the laser output as a function of output coupling. The general shape of I andPout as a function of T is shown in Fig. 3.5. The power density I is maximum ifall the radiation is contained in the resonator, that is, R = 1. At 2g0� = δ − ln Rthe flux inside the resonator is zero. This occurs if the reflectivity of the outputmirror is so low, namely Rth = exp(δ−2g0�), that the laser just reaches thresholdat the given input. The laser output Pout is zero for R = 1 and Rth. As shown inFig. 3.5, the output reaches a maximum for a specific value of R.
Differentiation of (3.56) determines the output coupling Ropt which maximizesPout, i.e.,
− ln Ropt = (√
2g0�/δ − 1)δ. (3.66)
From this expression it can be seen that low-gain systems require a high reflectiv-ity and vice versa. For cw-pumped Nd : YAG lasers the gain coefficient is typicallyon the order of g0 = (0.05 − 0.1) cm−1 and the optimum output coupling rangesfrom 0.80 to 0.98. The lower number is typical for multi-hundred watt Nd : YAGlasers pumped with up to 10 kW of input power. The very high reflectivity is forvery small systems. Pulsed-pumped systems operate at much higher pump powersand, correspondingly, have a higher gain coefficient. For example, a typical indus-trial Nd : YAG laser for cutting sheet metal has a pulse length of 100µs and anoutput energy of 2 J per pulse. Assuming a 2% system efficiency, the pump pulse
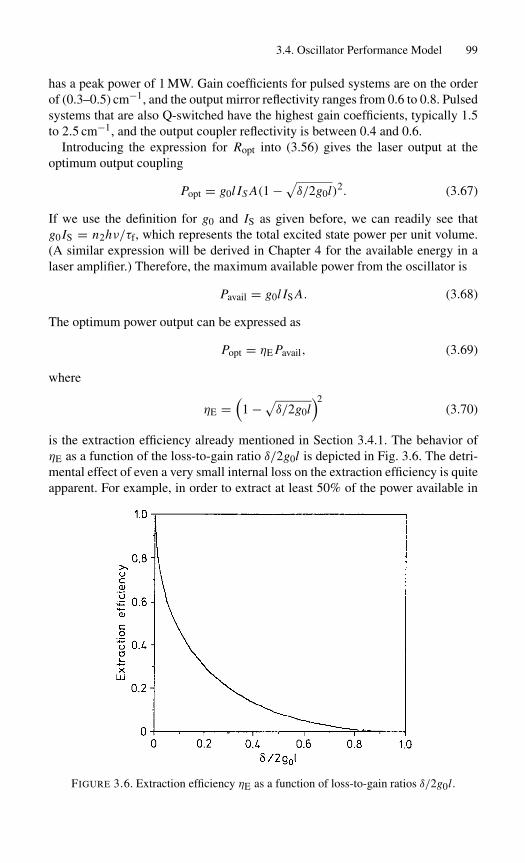
3.4. Oscillator Performance Model 99
has a peak power of 1 MW. Gain coefficients for pulsed systems are on the orderof (0.3–0.5) cm−1, and the output mirror reflectivity ranges from 0.6 to 0.8. Pulsedsystems that are also Q-switched have the highest gain coefficients, typically 1.5to 2.5 cm−1, and the output coupler reflectivity is between 0.4 and 0.6.
Introducing the expression for Ropt into (3.56) gives the laser output at theoptimum output coupling
Popt = g0l IS A(1 −√δ/2g0l)2. (3.67)
If we use the definition for g0 and IS as given before, we can readily see thatg0 IS = n2hν/τf, which represents the total excited state power per unit volume.(A similar expression will be derived in Chapter 4 for the available energy in alaser amplifier.) Therefore, the maximum available power from the oscillator is
Pavail = g0l IS A. (3.68)
The optimum power output can be expressed as
Popt = ηE Pavail, (3.69)
where
ηE =(
1 −√δ/2g0l
)2(3.70)
is the extraction efficiency already mentioned in Section 3.4.1. The behavior ofηE as a function of the loss-to-gain ratio δ/2g0l is depicted in Fig. 3.6. The detri-mental effect of even a very small internal loss on the extraction efficiency is quiteapparent. For example, in order to extract at least 50% of the power available in
FIGURE 3.6. Extraction efficiency ηE as a function of loss-to-gain ratios δ/2g0l.
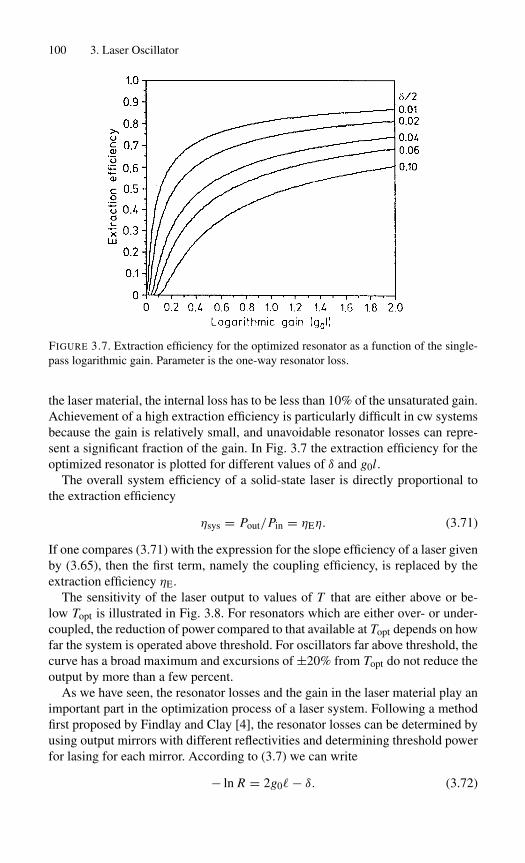
100 3. Laser Oscillator
FIGURE 3.7. Extraction efficiency for the optimized resonator as a function of the single-pass logarithmic gain. Parameter is the one-way resonator loss.
the laser material, the internal loss has to be less than 10% of the unsaturated gain.Achievement of a high extraction efficiency is particularly difficult in cw systemsbecause the gain is relatively small, and unavoidable resonator losses can repre-sent a significant fraction of the gain. In Fig. 3.7 the extraction efficiency for theoptimized resonator is plotted for different values of δ and g0l.
The overall system efficiency of a solid-state laser is directly proportional tothe extraction efficiency
ηsys = Pout/Pin = ηEη. (3.71)
If one compares (3.71) with the expression for the slope efficiency of a laser givenby (3.65), then the first term, namely the coupling efficiency, is replaced by theextraction efficiency ηE.
The sensitivity of the laser output to values of T that are either above or be-low Topt is illustrated in Fig. 3.8. For resonators which are either over- or under-coupled, the reduction of power compared to that available at Topt depends on howfar the system is operated above threshold. For oscillators far above threshold, thecurve has a broad maximum and excursions of ±20% from Topt do not reduce theoutput by more than a few percent.
As we have seen, the resonator losses and the gain in the laser material play animportant part in the optimization process of a laser system. Following a methodfirst proposed by Findlay and Clay [4], the resonator losses can be determined byusing output mirrors with different reflectivities and determining threshold powerfor lasing for each mirror. According to (3.7) we can write
− ln R = 2g0�− δ. (3.72)
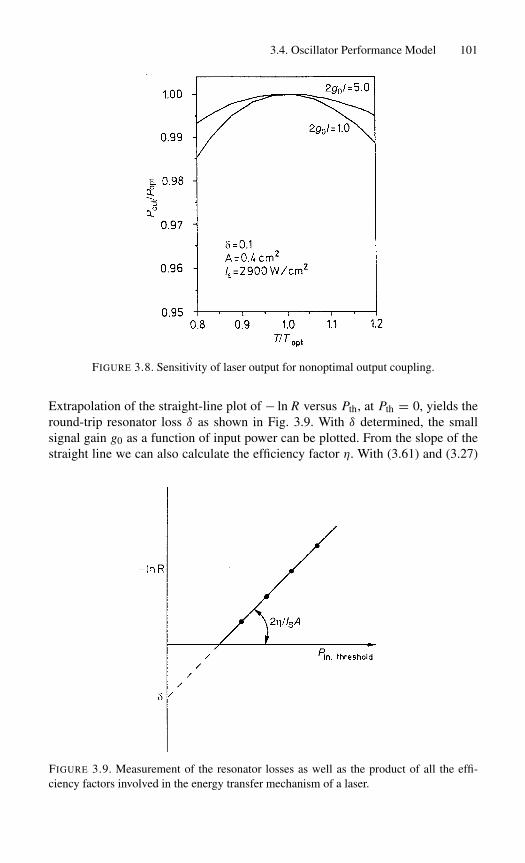
3.4. Oscillator Performance Model 101
FIGURE 3.8. Sensitivity of laser output for nonoptimal output coupling.
Extrapolation of the straight-line plot of − ln R versus Pth, at Pth = 0, yields theround-trip resonator loss δ as shown in Fig. 3.9. With δ determined, the smallsignal gain g0 as a function of input power can be plotted. From the slope of thestraight line we can also calculate the efficiency factor η. With (3.61) and (3.27)
FIGURE 3.9. Measurement of the resonator losses as well as the product of all the effi-ciency factors involved in the energy transfer mechanism of a laser.
102 3. Laser Oscillator
we obtain 2g0l = 2ηPin/IS A, and (3.72) can be written
− ln R = (2η/IS A)Pin − δ. (3.73)
The Three-Level System
The population inversion in a three-level system as a function of the pump rateis given by (3.15). If we multiply both sides of this equation by the stimulatedemission cross section σ21, we obtain
g0 = α0WPτ21 − 1
WPτ21 + 1, (3.74)
where α0 = σ21ntot is the absorption coefficient of the material when all atomsexist in the ground state. In the absence of pumping, (3.74) simply becomes g0 =−α0. In order to simplify our analysis, we assumed g2 = g1.
We assume now that the pump rate WP is a linear function of lamp input Pin,
WPτf = (η/AIS)Pin. (3.75)
Introducing (3.75) into (3.74) yields
g0 = α0(η/AIS)Pin − 1
(η/AIS)Pin + 1. (3.76)
In a four-level system, the small signal gain is directly proportional to the pumprate and therefore to the input power of the pump source. From (3.61) we obtain
g0 = (η/AIS)(Pin/�). (3.77)
Equation (3.76) and (3.77) are plotted in Fig. 3.10. Since both lasers are assumedto be pulsed, the input power Pin has been replaced by the flashlamp input energyEin = Pintp, where tp = 1 ms is the pump pulse width. The other parameters are(η/IS A) = 10−6 W−1, α0 = 0.2 cm−1, and � = 15 cm.
3.5 Relaxation Oscillations
So far in this chapter we have considered only the steady-state behavior of thelaser oscillator. Let us now consider some aspects of transient or dynamic behav-ior. Relaxation oscillations are by far the most predominant mechanisms causingfluctuations in the output of a solid-state laser. Instead of being a smooth pulse,the output of a pumped laser is comprised of characteristic spikes. In cw-pumpedsolid-state lasers the relaxation oscillations, rather than causing spiking of the out-put, manifest themselves as damped, sinusoidal oscillations with a well-defineddecay time.
In many solid-state lasers the output is a highly irregular function of time. Theoutput consists of individual bursts with random amplitude, duration, and sep-
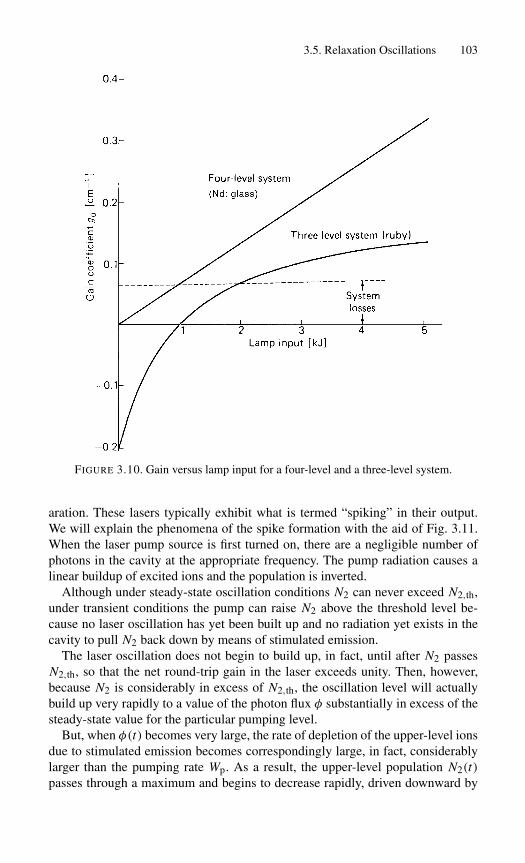
3.5. Relaxation Oscillations 103
FIGURE 3.10. Gain versus lamp input for a four-level and a three-level system.
aration. These lasers typically exhibit what is termed “spiking” in their output.We will explain the phenomena of the spike formation with the aid of Fig. 3.11.When the laser pump source is first turned on, there are a negligible number ofphotons in the cavity at the appropriate frequency. The pump radiation causes alinear buildup of excited ions and the population is inverted.
Although under steady-state oscillation conditions N2 can never exceed N2,th,under transient conditions the pump can raise N2 above the threshold level be-cause no laser oscillation has yet been built up and no radiation yet exists in thecavity to pull N2 back down by means of stimulated emission.
The laser oscillation does not begin to build up, in fact, until after N2 passesN2,th, so that the net round-trip gain in the laser exceeds unity. Then, however,because N2 is considerably in excess of N2,th, the oscillation level will actuallybuild up very rapidly to a value of the photon flux φ substantially in excess of thesteady-state value for the particular pumping level.
But, when φ(t) becomes very large, the rate of depletion of the upper-level ionsdue to stimulated emission becomes correspondingly large, in fact, considerablylarger than the pumping rate Wp. As a result, the upper-level population N2(t)passes through a maximum and begins to decrease rapidly, driven downward by
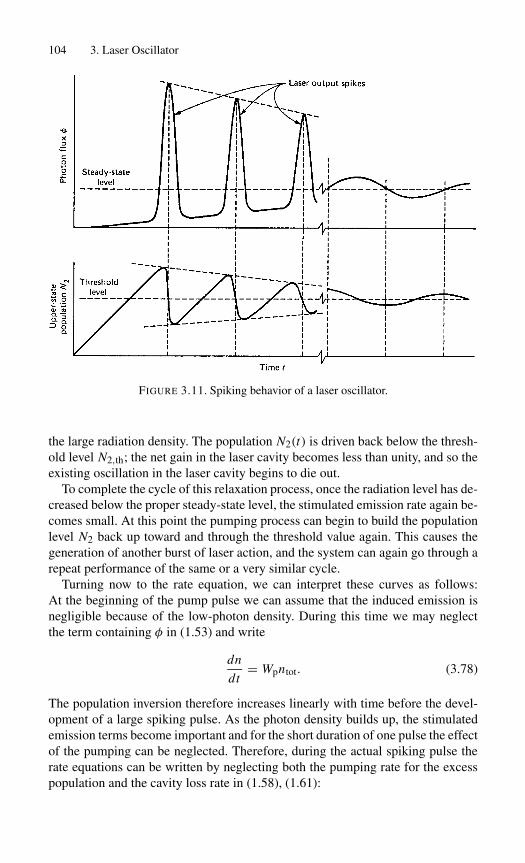
104 3. Laser Oscillator
FIGURE 3.11. Spiking behavior of a laser oscillator.
the large radiation density. The population N2(t) is driven back below the thresh-old level N2,th; the net gain in the laser cavity becomes less than unity, and so theexisting oscillation in the laser cavity begins to die out.
To complete the cycle of this relaxation process, once the radiation level has de-creased below the proper steady-state level, the stimulated emission rate again be-comes small. At this point the pumping process can begin to build the populationlevel N2 back up toward and through the threshold value again. This causes thegeneration of another burst of laser action, and the system can again go through arepeat performance of the same or a very similar cycle.
Turning now to the rate equation, we can interpret these curves as follows:At the beginning of the pump pulse we can assume that the induced emission isnegligible because of the low-photon density. During this time we may neglectthe term containing φ in (1.53) and write
dn
dt= Wpntot. (3.78)
The population inversion therefore increases linearly with time before the devel-opment of a large spiking pulse. As the photon density builds up, the stimulatedemission terms become important and for the short duration of one pulse the effectof the pumping can be neglected. Therefore, during the actual spiking pulse therate equations can be written by neglecting both the pumping rate for the excesspopulation and the cavity loss rate in (1.58), (1.61):

3.5. Relaxation Oscillations 105
dn
dt= −γ cσnφ,
dφ
dt= +cσnφ. (3.79)
The photon density thus grows with time and the population inversion de-creases with time. The photon density reaches a peak when the decreasing in-version reaches the threshold value nth. The inversion reaches a minimum atγ ncσφ ≈ Wpntot. The cycle repeats itself, forming another spike. The inver-sion fluctuates in a zigzag fashion around the threshold value nth. As time passes,the peaks become smaller and the curve becomes damped sinusoidal.
Solutions of the laser rate equations predict a train of regular and damped spikesat the output of the laser. Most lasers, however, show completely irregular, un-damped spikes. This discrepancy between theory and experiment is due to thefact that the spiking behavior dies out very slowly in most solid-state lasers andtherefore persists over the complete pump cycle. Furthermore, mechanical andthermal shocks and disturbances present in real lasers act to continually reexcitethe spiking behavior and keep it from damping out. Hence many lasers, especiallythe ruby laser, spike continuously without ever damping down to the steady state.Depending on the system parameters such as mode structure, resonator design,pump level, and so forth, the spiking may be highly irregular in appearance or itmay be regular.
In cw-pumped lasers, such as Nd : YAG, the relaxation oscillations are muchweaker and usually consist of damped sinusoidal oscillations around the steady-state value. These oscillations may be treated as perturbations of the steady-statepopulation inversion and photon density given in the rate equations (1.58), (1.61).Compared to the fluorescence time τf, the relaxation oscillations have a muchshorter period; therefore the term including τf in the rate equations can be ignored(i.e., τf → ∞).
We now introduce a small perturbation n into the steady-state value of thepopulation inversion n; similarly, a perturbation φ is introduced into the steadystate of the photon density φ. Thus we may write
n′ = n + n and φ′ = φ + φ. (3.80)
We now proceed to eliminate the population inversion n from (1.61). This isdone by first differentiating the equation and then substituting ∂n/∂t from (1.58).The differential equation is then linearized by introducing n and φ from (3.80).Neglecting products of ( n φ), we finally obtain
d2( φ)
dt2+ cσφ
d( φ)
dt+ (σc)2φn( φ) = 0. (3.81)
The solution of this equation gives the time variation of the photon density
φ ≈ exp
[(−σcφ
2
)]t sin[σc(φn)1/2t]. (3.82)

106 3. Laser Oscillator
The frequency ωs = σc(φn)1/2 and the decay time constant τR = 2/σcφ ofthis oscillation can be expressed in terms of laser parameters by noting that I =cφhν and n = 1/cστc. The latter expression follows from (1.61) for the steady-state condition, i.e., ∂φ/∂t = 0, and ignoring the initial noise level S. With theintroduction of the intracavity power density I and the photon decay time τc weobtain
ωs =√σ I
τchνand τR = 2hν
Iσ. (3.83)
These expressions can be further simplified for the case of a four-level system byintroducing the saturation power density Is, leading to
ωs =√
I
Isτfτcand τR = 2τf
(Is
I
). (3.84)
Note, that the greater the power density I and therefore the output power fromthe laser, the higher the oscillation frequency. The decay time τR will decrease forhigher output power.
From these equations it follows that the damping time is proportional to thespontaneous lifetime. This is the reason that relaxation oscillations are observedmainly in solid-state lasers where the upper-state lifetime is relatively long. Os-cilloscope traces of the relaxation oscillations of a cw-pumped Nd : YAG laser arepresented in Fig. 3.12.
Like most solid-state lasers, Nd : YAG exhibits relaxation oscillation. Fig-ure 3.12 exhibits oscilloscope traces of the relaxation oscillations of a smallcw-pumped Nd : YAG laser. The oscillation is a damped sine wave with only asmall content of harmonics. Figure 3.12(b) displays the spectrum of the relaxationoscillations, as obtained by a spectrum analyzer. From (3.84) it follows that theresonant frequency is proportional to (P1/2
out ) of the laser. Figure 3.12(b) illustratesthis dependence. With (3.84) we can calculate the center frequency νS and thetime constant τR of the relaxation oscillations. With the laser operated at 1 Woutput, a mirror transmission of T = 0.05, and beam diameter of 0.12 cm, oneobtains I = 4.0 × 10³ W/cm2; l = 35 cm is the length of the cavity and δ = 0.03are the combined cavity losses. With these values, and IS = 2900 W/cm2 andτ f = 230µs, it follows that τR = 333µs and νS = 72 kHz. The measured centerfrequency of the relaxation oscillation is, according to Fig. 3.12(b), about 68 kHz.
3.6 Examples of Laser Oscillators
The Nd : YAG laser is by far the most widely used and most versatile solid-statelaser. Pumping can be accomplished by means of flashlamps, cw arc lamps, orlaser diodes, and the laser can be operated cw or pulsed thereby achieving pulserepetition rates from single shot to several hundred megahertz. In this section

3.6. Examples of Laser Oscillators 107
FIGURE 3.12. Relaxation oscillation of a cw-pumped Nd : YAG laser. (a) Oscilloscopetrace showing the temporal behavior of a relaxation oscillation: time scale, 20µs/div.(b) Frequency spectrum of relaxation oscillations at different output power levels: (A)1.3 W, (B) 1.0 W, (C) 0.25 W.
we will relate the performance characteristics of several of these systems to theoscillator model described in this chapter.
3.6.1 Lamp-Pumped cw Nd : YAG Laser
A type of laser which is widely used for materials processing consists of anNd : YAG crystal 7.5 cm or 10 cm long and with a diameter of 6.2 mm pumpedby two krypton filled arc lamps. Electrical input to the lamps can be up to 12 kW.The optical resonator is typically comprised of two dielectrically coated mirrors
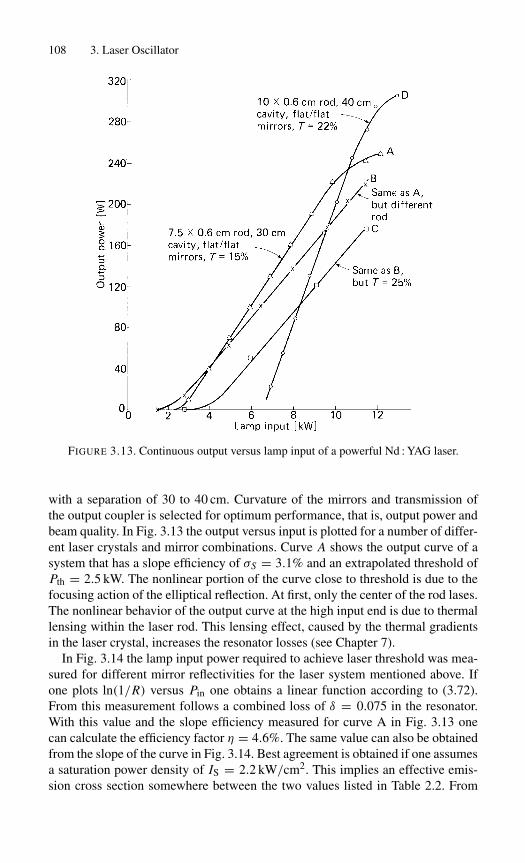
108 3. Laser Oscillator
FIGURE 3.13. Continuous output versus lamp input of a powerful Nd : YAG laser.
with a separation of 30 to 40 cm. Curvature of the mirrors and transmission ofthe output coupler is selected for optimum performance, that is, output power andbeam quality. In Fig. 3.13 the output versus input is plotted for a number of differ-ent laser crystals and mirror combinations. Curve A shows the output curve of asystem that has a slope efficiency of σS = 3.1% and an extrapolated threshold ofPth = 2.5 kW. The nonlinear portion of the curve close to threshold is due to thefocusing action of the elliptical reflection. At first, only the center of the rod lases.The nonlinear behavior of the output curve at the high input end is due to thermallensing within the laser rod. This lensing effect, caused by the thermal gradientsin the laser crystal, increases the resonator losses (see Chapter 7).
In Fig. 3.14 the lamp input power required to achieve laser threshold was mea-sured for different mirror reflectivities for the laser system mentioned above. Ifone plots ln(1/R) versus Pin one obtains a linear function according to (3.72).From this measurement follows a combined loss of δ = 0.075 in the resonator.With this value and the slope efficiency measured for curve A in Fig. 3.13 onecan calculate the efficiency factor η = 4.6%. The same value can also be obtainedfrom the slope of the curve in Fig. 3.14. Best agreement is obtained if one assumesa saturation power density of IS = 2.2 kW/cm2. This implies an effective emis-sion cross section somewhere between the two values listed in Table 2.2. From

3.6. Examples of Laser Oscillators 109
FIGURE 3.14. Threshold power input as a function of mirror reflectivity.
the data of Fig. 3.14 one can plot the small-signal, single-pass gain and the gaincoefficient as a function of lamp input power as shown in Fig. 3.15.
It is instructive to calculate the inversion density in the Nd : YAG crystal thathas to be sustained to achieve the maximum small-signal gain coefficient of g0 =0.11 cm−1. Assuming a neodymium concentration of 1.38 × 1020 cm−3 and astimulated emission cross section of 2.8 × 10⁻¹⁹ cm2, it follows from (3.12) thatat maximum pump input only 0.28% of the total neodymium atoms are inverted.The small percentage of atoms at the upper laser level is due to the four-levelnature of the transition and the large cross section of Nd : YAG.
For a mirror transmission of T = 0.15 the small-signal gain coefficient atthreshold is about g = 0.02 cm−1, which results in an upper-state populationdensity of nt = 1016 cm−3. From this value and using (3.18) we can calculatethe total fluorescence output of the laser at threshold. With V = 2.3 cm3, τ f =230µs, hν = 1.86 × 10⁻¹⁹ W s, one obtains Pf = 130 W.
If δ and η have been determined for a particular laser crystal and resonatorcombination, the laser output at different input levels and mirror reflectivities canbe calculated from (3.63)–(3.65). An example of such a calculation is shown inFig. 3.16. The mirror reflectivity which gives the highest output power for thedifferent input powers is located along the dashed curve. This curve has beenobtained from (3.66) with (3.61), (3.27). Figure 3.17 shows the intracavity powerdensity as a function of laser output power for a fixed lamp input power of 12 kW.The parameter is the reflectivity of the front mirror. This curve is obtained fromFig. 3.16 (uppermost curve) and using (3.36). As we can see from this figure, the

FIGURE 3.15. Small-signal, single-pass rod gain and gain coefficient as a function of lampinput.
0.6 0.7 0.8 0.9 1.00
50
100
150
200
250
Max. Output
12 KW
10 KW
8 KW
6 KW
4 KW
Out
put P
ower
(W
att)
Output Mirror Reflectivity
FIGURE 3.16. Output power versus mirror reflectivity. Parameter is the lamp input power.Parameters: η = 0.031, δ = 0.075, IS = 2.2 KW/cm2.
110

3.6. Examples of Laser Oscillators 111
0 5 10 15 20 25 30 350
50
100
150
200
R
0.7 o
0.98o
0.95o
0.9o
o1.0
o0.8
o 0.6
Input Power : 12 KW
Out
put
Pow
er (
W)
Intracavity Power Density ( KW/cm2 )
FIGURE 3.17. Intracavity power density as a function of laser output power. Parameter isthe reflectivity of the output coupler.
circulating power density in the resonator increased for the higher reflectivitiesdespite the reduction of output power.
Figure 3.18 shows a photograph of a typical, commercially available, cw-pumped Nd : YAG laser. The laser head contains a single arc lamp. The mechan-ical shutter is used to stop laser oscillations for short periods of time withouthaving to turn off the arc lamp. The purpose of the mode selector and Q-switchwill be discussed in Chapters 5 and 8. Bellows are employed between each opti-cal element in the laser head in order to seal out dust and dirt particles from theoptical surfaces. The laser head cover is sealed with a gasket in order to furtherreduce environmental contamination.
3.6.2 Diode Side-Pumped Nd : YAG Laser
The system illustrated here produces an energy per pulse of about 0.5 J at a rep-etition rate of 40 Hz. Critical design issues for this laser include heat removalfrom the diode arrays and laser rod and the overlapping of the pump and res-onator mode volumes. In side-pumped configurations, laser-diode arrays are notrequired to be coherent, and pump power can be easily scaled with multiple arraysaround the circumference of the rod or along its axis. Instead of one diode array
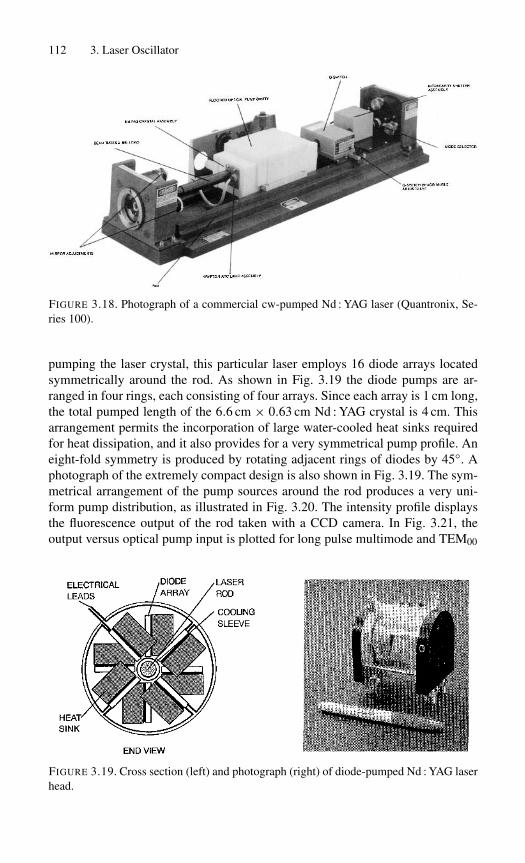
112 3. Laser Oscillator
FIGURE 3.18. Photograph of a commercial cw-pumped Nd : YAG laser (Quantronix, Se-ries 100).
pumping the laser crystal, this particular laser employs 16 diode arrays locatedsymmetrically around the rod. As shown in Fig. 3.19 the diode pumps are ar-ranged in four rings, each consisting of four arrays. Since each array is 1 cm long,the total pumped length of the 6.6 cm × 0.63 cm Nd : YAG crystal is 4 cm. Thisarrangement permits the incorporation of large water-cooled heat sinks requiredfor heat dissipation, and it also provides for a very symmetrical pump profile. Aneight-fold symmetry is produced by rotating adjacent rings of diodes by 45◦. Aphotograph of the extremely compact design is also shown in Fig. 3.19. The sym-metrical arrangement of the pump sources around the rod produces a very uni-form pump distribution, as illustrated in Fig. 3.20. The intensity profile displaysthe fluorescence output of the rod taken with a CCD camera. In Fig. 3.21, theoutput versus optical pump input is plotted for long pulse multimode and TEM00
FIGURE 3.19. Cross section (left) and photograph (right) of diode-pumped Nd : YAG laserhead.
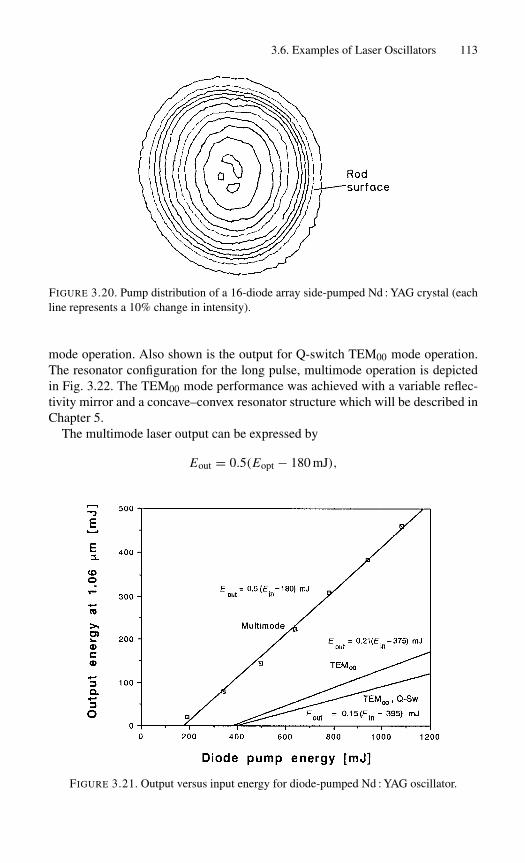
3.6. Examples of Laser Oscillators 113
FIGURE 3.20. Pump distribution of a 16-diode array side-pumped Nd : YAG crystal (eachline represents a 10% change in intensity).
mode operation. Also shown is the output for Q-switch TEM00 mode operation.The resonator configuration for the long pulse, multimode operation is depictedin Fig. 3.22. The TEM00 mode performance was achieved with a variable reflec-tivity mirror and a concave–convex resonator structure which will be described inChapter 5.
The multimode laser output can be expressed by
Eout = 0.5(Eopt − 180 mJ),
FIGURE 3.21. Output versus input energy for diode-pumped Nd : YAG oscillator.

114 3. Laser Oscillator
FIGURE 3.22. Resonator configuration for multimode operation.
where Eopt is the optical pump energy from the 16 diode arrays. The electricalinput energy Ein required to achieve Eopt is
Eopt = 0.5(Ein − 640 mJ).
Combining these two output–input curves relates the laser output with the electri-cal input energy
Eout = 0.25(Ein − 1000 mJ).
The slope efficiency of the laser is 25%, and the overall electrical efficiency atthe maximum output of 460 mJ per pulse is 16%. The optimum output couplingwas experimentally determined. Figure 3.23 shows a plot of the laser output fordifferent values of the reflectivity. The different efficiency factors of the system
FIGURE 3.23. Oscillator output vs. mirror reflectivity (calculated curve based on Topt =0.2, g0l = 1.4, δ = 0.03)

3.6. Examples of Laser Oscillators 115
TABLE 3.1. Energy transfer efficiencies of a largediode-pumped Nd : YAG oscillator.
Transfer process Multimode Single mode
Diode slope efficiency ηP 0.50 0.50Transfer efficiency ηt 0.95 0.95Absorption efficiency ηa 0.90 0.90Stokes shift ηS 0.76 0.76Quantum efficiency ηQ 0.95 0.95Coupling efficiency ηC 0.90 0.90Beam overlap efficiency ηB 0.90 0.38Electrical slope efficiency σS 0.25 0.10
are listed in Table 3.1. The slope efficiency of the diode array was measured witha power meter. The absorbed pump radiation in the 6.3 mm diameter crystal wascalculated from a computer code.
The coupling efficiency ηC follows from Topt = 0.20 and the measured round-trip loss of δ = 2.2%. The gain/mode overlap efficiency ηB was estimated bycomparing the beam profile with the pump distribution in the laser rod. The finalvalue was adjusted for the product of the η terms to agree with the measured slopeefficiency of 25%. For TEM00 mode operation, the major difference is a substan-tially reduced value for ηB as a result of a smaller beam. All other parametersremain unchanged.
3.6.3 End-Pumped Systems
In this so-called end-pumped configuration, the radiation from a single laser diodeor diode bar is focused to a small spot on the end of a laser rod. With a suitablechoice of focusing optics, the diode pump radiation can be adjusted to coincidewith the diameter of the TEM00 resonator mode. The end pumping configurationthus allows the maximum use of the energy from the laser diodes.
Using this longitudinal pumping scheme, the fraction of the active laser volumeexcited by the diode laser can be matched quite well to the TEM00 lasing volume.A solid-state laser pumped in this manner operates naturally in the fundamentalspatial mode without intracavity apertures.
Many excellent systems with extremely compact packaging and high effi-ciency that utilize the mode matching pump profile are commercially available.By way of illustrating the concept, we will consider the configuration illustratedin Fig. 3.24 which was originally proposed by Sipes [5]. The output from adiode array with 200 mW output at 808 nm is collimated and focused into a1 cm long × 0.5 cm diameter 1% Nd : YAG sample. The resonator configurationis plano-concave, with the pumped end of the Nd : YAG rod being coated forhigh reflection at 1.06µm, and with an output coupler having a 5 cm radius ofcurvature and a reflectivity at 1.06µm of 95%.

116 3. Laser Oscillator
FIGURE 3.24. End-pumped laser oscillator.
Figure 3.25 displays electrical input power versus 1.06µm output power forthe configuration illustrated in Fig. 3.24. We see that for approximately 1 W ofelectrical input power, 80 mW of Nd : YAG output is measured.
The electrical slope efficiency of the laser is 13%, and the overall efficiency at80 mW output is 8%. Also shown in Fig. 3.25 is the performance of the diode ar-ray that has a slope efficiency of 34% and an overall efficiency of 22% at 220 mWoutput. The energy transfer steps of the laser are listed in Table 3.2. The slope effi-ciency ηP of the diode laser output is a measured quantity. The transfer efficiencyηT includes the collection of diode radiation by the lens system and reflectionlosses at the surfaces. The pump radiation is completely absorbed in the 1-cmlong crystal, i.e., ηa = 1. The coupling efficiency ηC follows from the measured
FIGURE 3.25. Nd : YAG laser and diode output versus electrical input power.
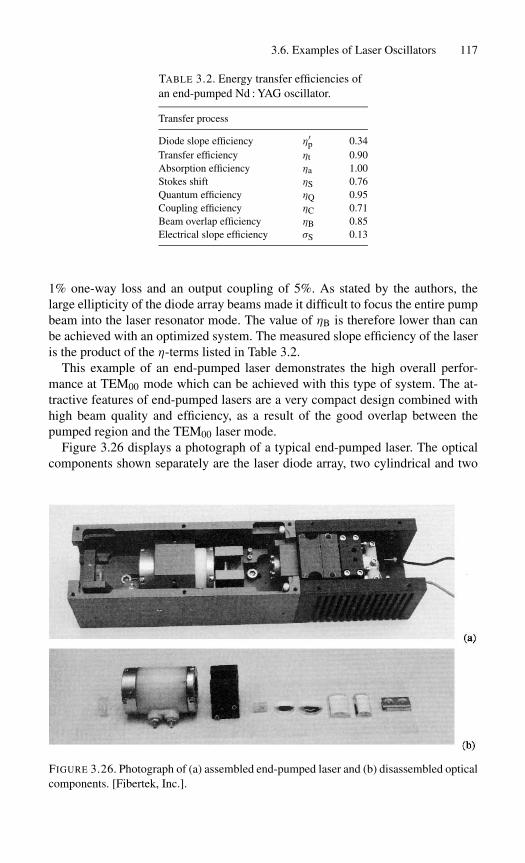
3.6. Examples of Laser Oscillators 117
TABLE 3.2. Energy transfer efficiencies ofan end-pumped Nd : YAG oscillator.
Transfer process
Diode slope efficiency η′p 0.34
Transfer efficiency ηt 0.90Absorption efficiency ηa 1.00Stokes shift ηS 0.76Quantum efficiency ηQ 0.95Coupling efficiency ηC 0.71Beam overlap efficiency ηB 0.85Electrical slope efficiency σS 0.13
1% one-way loss and an output coupling of 5%. As stated by the authors, thelarge ellipticity of the diode array beams made it difficult to focus the entire pumpbeam into the laser resonator mode. The value of ηB is therefore lower than canbe achieved with an optimized system. The measured slope efficiency of the laseris the product of the η-terms listed in Table 3.2.
This example of an end-pumped laser demonstrates the high overall perfor-mance at TEM00 mode which can be achieved with this type of system. The at-tractive features of end-pumped lasers are a very compact design combined withhigh beam quality and efficiency, as a result of the good overlap between thepumped region and the TEM00 laser mode.
Figure 3.26 displays a photograph of a typical end-pumped laser. The opticalcomponents shown separately are the laser diode array, two cylindrical and two
FIGURE 3.26. Photograph of (a) assembled end-pumped laser and (b) disassembled opticalcomponents. [Fibertek, Inc.].
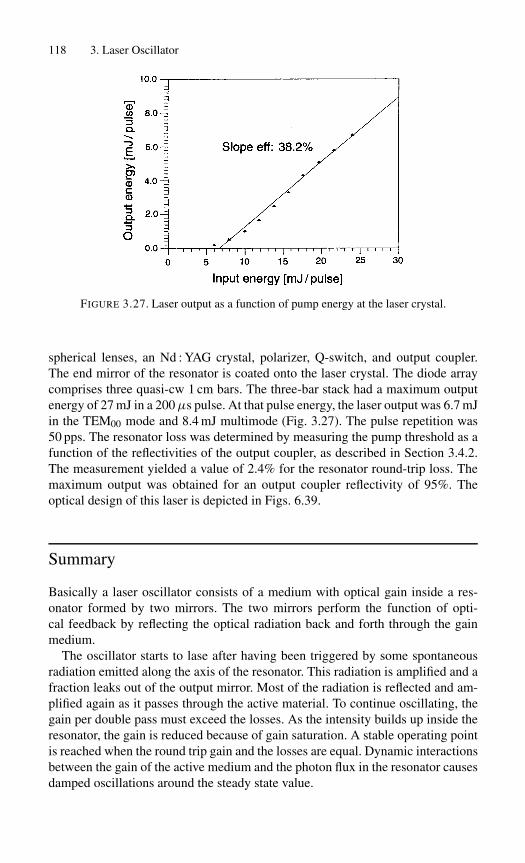
118 3. Laser Oscillator
FIGURE 3.27. Laser output as a function of pump energy at the laser crystal.
spherical lenses, an Nd : YAG crystal, polarizer, Q-switch, and output coupler.The end mirror of the resonator is coated onto the laser crystal. The diode arraycomprises three quasi-cw 1 cm bars. The three-bar stack had a maximum outputenergy of 27 mJ in a 200µs pulse. At that pulse energy, the laser output was 6.7 mJin the TEM00 mode and 8.4 mJ multimode (Fig. 3.27). The pulse repetition was50 pps. The resonator loss was determined by measuring the pump threshold as afunction of the reflectivities of the output coupler, as described in Section 3.4.2.The measurement yielded a value of 2.4% for the resonator round-trip loss. Themaximum output was obtained for an output coupler reflectivity of 95%. Theoptical design of this laser is depicted in Figs. 6.39.
Summary
Basically a laser oscillator consists of a medium with optical gain inside a res-onator formed by two mirrors. The two mirrors perform the function of opti-cal feedback by reflecting the optical radiation back and forth through the gainmedium.
The oscillator starts to lase after having been triggered by some spontaneousradiation emitted along the axis of the resonator. This radiation is amplified and afraction leaks out of the output mirror. Most of the radiation is reflected and am-plified again as it passes through the active material. To continue oscillating, thegain per double pass must exceed the losses. As the intensity builds up inside theresonator, the gain is reduced because of gain saturation. A stable operating pointis reached when the round trip gain and the losses are equal. Dynamic interactionsbetween the gain of the active medium and the photon flux in the resonator causesdamped oscillations around the steady state value.

Exercises 119
In order to achieve maximum output from an oscillator under given operatingconditions the reflectivity of the output mirror has to be optimized. Increasing theoutput coupling (T = 1 − R) is equivalent to decreasing the feedback factor andincreasing the loss in the resonator. The limiting condition is that feedback mustbe sufficiently large to compensate for the internal and output coupling losses inthe system. The transmission of the output mirror will have an optimum value thatmaximizes the output power from the oscillator. This value is between zero and atransmission at which the losses exceed the gain and the oscillator will cease tolase.
Threshold and laser output as a function of materials and systems parametersare discussed in this chapter. The conversion of electrical input energy to laseroutput proceeds through a number of steps that can be related to the pump source,pump radiation transfer system, laser medium, and optical resonator. The effi-ciency of the energy conversion or transfer process associated with each stepcontributes to the overall efficiency of the laser. The energy flow within a laseroscillator is analyzed in detail, and an illustration of the practical realization ofdifferent oscillators concludes the chapter.
References[1] W.W. Rigrod: J. Appl. Phys. 36, 2487 (1965); also IEEE J. Quantum Electron. QE-14,
377 (1978).
[2] A.E. Siegman: Lasers (University Science Books, Mill Valley, CA), 1986.
[3] W. Koechner, Solid-State Laser Engineering, 5th ed. (Springer-Verlag, Berlin), 1999,Fig. 6.82, p. 389.
[4] D. Findlay, R.A. Clay: Phys. Lett. 20, 277 (1966).
[5] D.L. Sipes: Appl. Phys. Lett. 47, 74–76 (1985).
Exercises
1. Prove that when the gain length is equal to the resonator length, the conditiongiving the required inversion density at lasing threshold, n = 1/cστc, is identi-cal to the threshold condition 2gl = δ− ln(R1) ≈ T +δ. Indicate any equationyou use from the text and define all the quantities that you use.
2. For the system described in Fig. 3.2 show that the quantity Irms = √IR IL is
constant throughout the resonator.
3. Derive equations (3.64) and (3.65). (Hint: Use the approximations given in thetext.)
4. The beam overlap efficiency is a very important parameter for evaluating manylasers. Derive equations (3.47) and (3.48). Do this again assuming the beamand gain distributions to be uniform.
5. Derive the expression for the output mirror reflectivity (the commensuratetransmission, e.g., T = 1 − R, is called the output coupling) that results in
120 3. Laser Oscillator
optimum output from a laser (e.g., equation (3.66)). Then insert your resultinto equation (3.56) and find the output obtained when using this reflectivity(e.g., equation (3.67)).
6. Derive the expressions in equation (3.84). Describe the relaxation oscillationsof a laser pumped just a tiny bit above oscillation threshold when it is perturbeda small amount for a brief instant and then returned to its original condition.Sketch the output as a function of time and explain your result.
7. Describe the relaxation oscillations of a laser pumped with a 100 ns durationpump pulse that achieves an intensity twice the saturation power density. Theresonator mirrors are 100% and 75% reflecting, and the cavity length is 30 cm.The length of the gain medium is 1 cm, and the nonproductive losses are equiv-alent to having distributed losses throughout the resonator with a loss coeffi-cient of 0.05 cm−1. The fluorescent lifetime of the gain medium is 8 ns. Sketchthe output as a function of time and explain your result.
8. Starting from the rate equation, for the photon density in a resonator havingan average photon lifetime of τc and the definition of cavity Q, derive equa-tion (3.9).
4
Laser Amplifier
4.1 Pulse Amplification
4.2 Nd : YAG Amplifiers
4.3 Nd : Glass Amplifiers
4.4 Depopulation Losses
4.5 Self-Focusing
References
Exercises
The use of lasers as pulse amplifiers is of great interest in the design of high-energy, high-brightness radiation sources. In the pulse amplifiers described in thischapter the input Q-switched or mode-locked pulse is considerably shorter thanthe fluorescent lifetime of the active medium. Hence the effect of spontaneousemission and pumping rate on the population inversion during the amplificationprocess can be neglected. Furthermore, energy is extracted from the amplifier,which was stored in the amplifying medium prior to the arrival of the pulse.
Because of the energy storage, pulse amplifiers have high-gain and high-energyextraction. In contrast, the small gain and energy storage of a cw amplifier requiresmany passes through the medium to achieve useful amplification. This can bestbe achieved in an oscillator. Therefore, in order to increase the output from a cwoscillator, several laser pump modules are operated in series between the resonantmirrors.
Although cw amplifiers are seldom employed in the traditional bulk solid-statelasers considered in this text, the situation is different for rare-earth-doped fiberlasers. In a fiber laser the pump and signal beam are confined by the fiber corealong the entire length of the fiber, which is typically several meters. The longgain path combined with the high pump beam density achievable in the fibercore make high-gain amplification possible. Fiber-optic cw amplifiers represent arapidly expanding branch of optics and the erbium-doped fiber amplifier (EDFA)is a critical component for telecommunication applications.
121
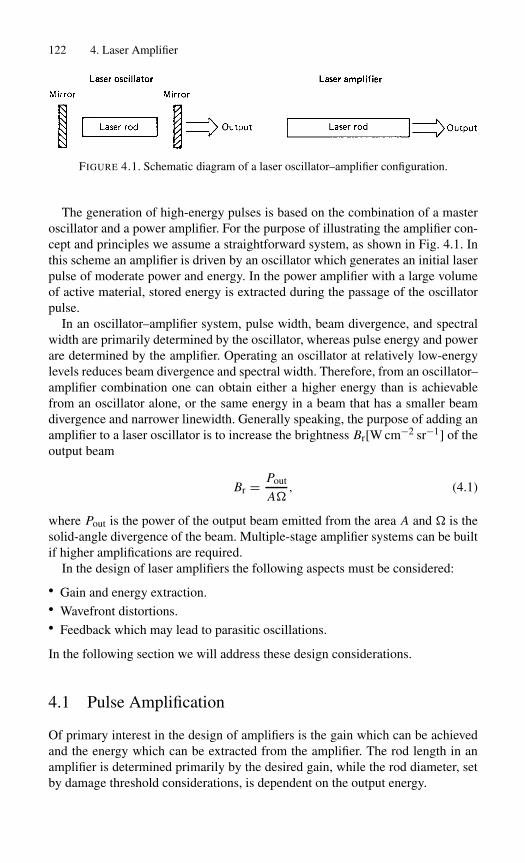
122 4. Laser Amplifier
FIGURE 4.1. Schematic diagram of a laser oscillator–amplifier configuration.
The generation of high-energy pulses is based on the combination of a masteroscillator and a power amplifier. For the purpose of illustrating the amplifier con-cept and principles we assume a straightforward system, as shown in Fig. 4.1. Inthis scheme an amplifier is driven by an oscillator which generates an initial laserpulse of moderate power and energy. In the power amplifier with a large volumeof active material, stored energy is extracted during the passage of the oscillatorpulse.
In an oscillator–amplifier system, pulse width, beam divergence, and spectralwidth are primarily determined by the oscillator, whereas pulse energy and powerare determined by the amplifier. Operating an oscillator at relatively low-energylevels reduces beam divergence and spectral width. Therefore, from an oscillator–amplifier combination one can obtain either a higher energy than is achievablefrom an oscillator alone, or the same energy in a beam that has a smaller beamdivergence and narrower linewidth. Generally speaking, the purpose of adding anamplifier to a laser oscillator is to increase the brightness Br[W cm−2 sr−1] of theoutput beam
Br = Pout
A�, (4.1)
where Pout is the power of the output beam emitted from the area A and � is thesolid-angle divergence of the beam. Multiple-stage amplifier systems can be builtif higher amplifications are required.
In the design of laser amplifiers the following aspects must be considered:
• Gain and energy extraction.• Wavefront distortions.• Feedback which may lead to parasitic oscillations.
In the following section we will address these design considerations.
4.1 Pulse Amplification
Of primary interest in the design of amplifiers is the gain which can be achievedand the energy which can be extracted from the amplifier. The rod length in anamplifier is determined primarily by the desired gain, while the rod diameter, setby damage threshold considerations, is dependent on the output energy.
4.1. Pulse Amplification 123
To a first approximation we can assume the growth of input energy to be ex-ponential, for the amount of stimulated emission is proportional to the excitingphoton flux. It will be seen, however, that exponential amplification will occuronly at low photon-flux levels. A deviation from the exponential gain regime inan amplifier occurs when an optical pulse traveling in the inverted medium be-comes strong enough to change the population of the laser levels appreciably. Theoptical amplifier will exhibit saturation effects as a result of depletion of the in-version density by the driving signal. Taking an extreme case, we can see that if ahigh-intensity light pulse is incident on an amplifier, the stimulated emission cancompletely deplete the stored energy as it progresses. Then the gain can be ex-pected to be linear with the length of the active medium rather than exponential.The events during the amplifier action are assumed to be fast compared with thepumping rate Wp and the spontaneous emission time τf. Therefore tp � τf,W−1
p ,tp being the width of the pulse which passes through the amplifying medium.
Thus the amplification process is based on the energy stored in the upper laserlevel prior to the arrival of the input signal. As the input pulse passes through theamplifier, the ions are stimulated to release the stored energy. The amplificationprocess can be described by the rate equations (1.58), (1.61). If we ignore theeffect of fluorescence and pumping during the pulse duration, we obtain for thepopulation inversion
∂n
∂t= −γ ncσφ. (4.2)
The growth of a pulse traversing a medium with an inverted population is de-scribed by the nonlinear, time-dependent photon-transport equation, which ac-counts for the effect of the radiation on the active medium and vice versa,
∂φ
∂t= cnσφ − ∂φ
∂xc. (4.3)
The rate at which the photon density changes in a small volume of material isequal to the net difference between the generation of photons by the stimulatedemission process and the flux of photons which flows out from that region. Thelatter process is described by the second term on the right of (4.3). This term thatcharacterizes a traveling-wave process is absent in (1.61).
Consider the one-dimensional case of a beam of monochromatic radiation in-cident on the front surface of an amplifier rod of length L . The point at which thebeam enters the gain medium is designated the reference point, x = 0. The twodifferential equations (4.2), (4.3) must be solved for the inverted electron pop-ulation n and the photon flux φ. Frantz and Nodvik [1] solved these nonlinearequations for various types of input pulse shapes.
If we take, for the input to the amplifier, a square pulse of duration tp and initialphoton density φ0, the solution for the photon density is
φ(x, t)
φ0={
1 − [1 − exp(−σnx)] exp[−γ σφ0c
(t − x
c
)]}−1, (4.4)

124 4. Laser Amplifier
where n is the inverted population density, assumed to be uniform throughout thelaser material at t = 0. The energy gain for a light beam passing through a laseramplifier of length x = l is given by
G = 1
φ0tp
∫ +∞
−∞φ(l, t) dt. (4.5)
After introducing (4.4) into (4.5) and integrating, we obtain
G = 1
cγ σφ0tpln{1 + [exp(γ σφ0tpc)− 1]enσ l}. (4.6)
We shall cast this equation in a different form such that it contains directly mea-surable laser parameters. The input energy per unit area can be expressed as
Ei = cφ0tphν. (4.7)
A saturation fluence Es can be defined by
Es = hν
γ σ= Jst
γ g0, (4.8)
where Jst = hνn is the stored energy per volume and g0 = nσ is the small-signalgain coefficient.
In a four-level system γ = 1 and the total stored energy per unit volume in theamplifier is
Jst = g0 Es . (4.9)
The extraction efficiency ηE is the energy extracted from the amplifier divided bythe stored energy in the upper-laser level at the time of pulse arrival. With thisdefinition, we can write
ηE = Eout − Ein
g0 Es. (4.10)
In this expression Eout, Ein is the amplifier signal output and input fluence, respec-tively. In a four-level system, all the stored energy can theoretically be extractedby a signal. In a three-level system γ = 1 + g2/g1, and only a fraction of thestored energy will be released because as the upper laser level is depleted, thelower-level density is building up.
Introducing (4.7), (4.8) into (4.6), one obtains
G = Es
Einln
{1 +
[exp
(Ein
Es
)− 1
]G0
}. (4.11)
This expression represents a unique relationship between the gain G, the in-put pulse energy density Ein, the saturation parameter Es, and the small-signal,single-pass gain G0 = exp(g0l).

4.1. Pulse Amplification 125
Equation (4.11), which is valid for rectangular input pulses, encompasses theregime from small-signal gain to complete saturation of the amplifier. The equa-tion can be simplified for these extreme cases. Consider a low-input signal Einsuch that Ein/Es � 1 and, furthermore, G0 Ein/Es � 1; then (4.11) can beapproximated to
G ≈ G0 ≡ exp(g0l). (4.12)
In this case, the “low-level gain” is exponential with amplifier length and no satu-ration effects occur. This, of course, holds only for rod lengths up to a value wherethe output energy density G0 Ein is small compared to Es.
For high-level energy densities such that Ein/Es 1, (4.11) becomes
G � 1 +(
Es
Ein
)g0l. (4.13)
Thus, the energy gain is linear with the length of the gain medium, implying thatevery excited state contributes its stimulated emission to the beam. Such a condi-tion obviously represents the most efficient conversion of stored energy to beamenergy, and for this reason amplifier designs that operate in saturation are usedwherever practical, with the major limitation being the laser damage threshold.
We will now recast (4.11) into a form that makes it convenient to model theenergy output and extraction efficiency for single- and multiple-amplifier stagesoperated either in a single- or double-pass configuration. With the notation in-dicated in Fig. 4.2, Ein is now the input to the amplifier and Eout is the outputfluence which are related by
Eout = ES ln
{1 +
[exp
(Ein
ES
)− 1
]exp(g0l)
}. (4.14)
The extraction efficiency is, according to (4.10),
ηE = (Eout − Ein)/g0l ES. (4.15)
In a laser system which has multiple stages, these equations can be applied suc-cessively, whereby the output of one stage becomes the input for the next stage.
FIGURE 4.2. Notation for the calculation of energy output fluence and extraction efficiencyfor one- and two-pass single or multiple amplifier stages.
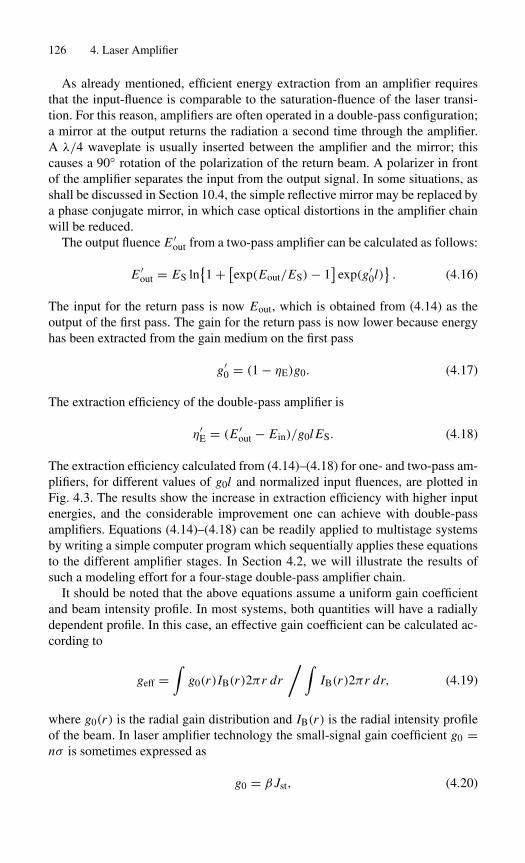
126 4. Laser Amplifier
As already mentioned, efficient energy extraction from an amplifier requiresthat the input-fluence is comparable to the saturation-fluence of the laser transi-tion. For this reason, amplifiers are often operated in a double-pass configuration;a mirror at the output returns the radiation a second time through the amplifier.A λ/4 waveplate is usually inserted between the amplifier and the mirror; thiscauses a 90◦ rotation of the polarization of the return beam. A polarizer in frontof the amplifier separates the input from the output signal. In some situations, asshall be discussed in Section 10.4, the simple reflective mirror may be replaced bya phase conjugate mirror, in which case optical distortions in the amplifier chainwill be reduced.
The output fluence E ′out from a two-pass amplifier can be calculated as follows:
E ′out = ES ln
{1 + [
exp(Eout/ES)− 1]
exp(g′0l)}. (4.16)
The input for the return pass is now Eout, which is obtained from (4.14) as theoutput of the first pass. The gain for the return pass is now lower because energyhas been extracted from the gain medium on the first pass
g′0 = (1 − ηE)g0. (4.17)
The extraction efficiency of the double-pass amplifier is
η′E = (E ′
out − Ein)/g0l ES. (4.18)
The extraction efficiency calculated from (4.14)–(4.18) for one- and two-pass am-plifiers, for different values of g0l and normalized input fluences, are plotted inFig. 4.3. The results show the increase in extraction efficiency with higher inputenergies, and the considerable improvement one can achieve with double-passamplifiers. Equations (4.14)–(4.18) can be readily applied to multistage systemsby writing a simple computer program which sequentially applies these equationsto the different amplifier stages. In Section 4.2, we will illustrate the results ofsuch a modeling effort for a four-stage double-pass amplifier chain.
It should be noted that the above equations assume a uniform gain coefficientand beam intensity profile. In most systems, both quantities will have a radiallydependent profile. In this case, an effective gain coefficient can be calculated ac-cording to
geff =∫
g0(r)IB(r)2πr dr
/∫IB(r)2πr dr, (4.19)
where g0(r) is the radial gain distribution and IB(r) is the radial intensity profileof the beam. In laser amplifier technology the small-signal gain coefficient g0 =nσ is sometimes expressed as
g0 = β Jst, (4.20)
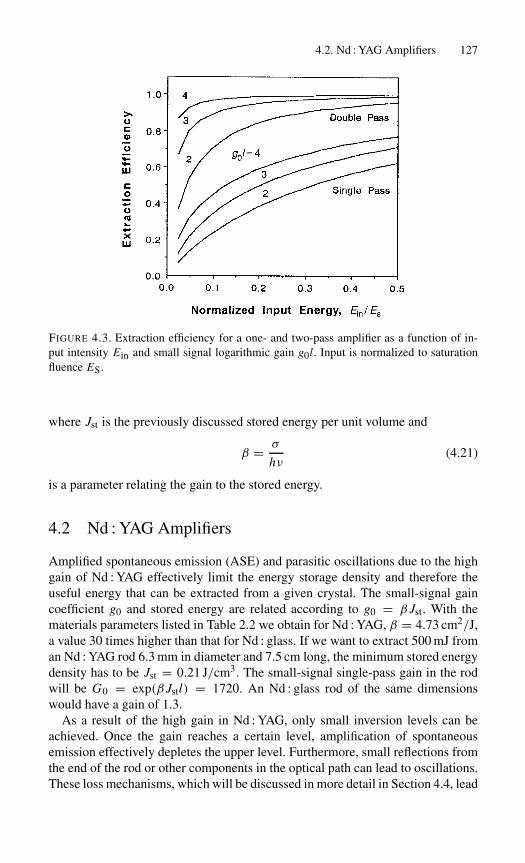
4.2. Nd : YAG Amplifiers 127
FIGURE 4.3. Extraction efficiency for a one- and two-pass amplifier as a function of in-put intensity Ein and small signal logarithmic gain g0l. Input is normalized to saturationfluence ES.
where Jst is the previously discussed stored energy per unit volume and
β = σ
hν(4.21)
is a parameter relating the gain to the stored energy.
4.2 Nd : YAG Amplifiers
Amplified spontaneous emission (ASE) and parasitic oscillations due to the highgain of Nd : YAG effectively limit the energy storage density and therefore theuseful energy that can be extracted from a given crystal. The small-signal gaincoefficient g0 and stored energy are related according to g0 = β Jst. With thematerials parameters listed in Table 2.2 we obtain for Nd : YAG, β = 4.73 cm2/J,a value 30 times higher than that for Nd : glass. If we want to extract 500 mJ froman Nd : YAG rod 6.3 mm in diameter and 7.5 cm long, the minimum stored energydensity has to be Jst = 0.21 J/cm3. The small-signal single-pass gain in the rodwill be G0 = exp(β Jstl) = 1720. An Nd : glass rod of the same dimensionswould have a gain of 1.3.
As a result of the high gain in Nd : YAG, only small inversion levels can beachieved. Once the gain reaches a certain level, amplification of spontaneousemission effectively depletes the upper level. Furthermore, small reflections fromthe end of the rod or other components in the optical path can lead to oscillations.These loss mechanisms, which will be discussed in more detail in Section 4.4, lead
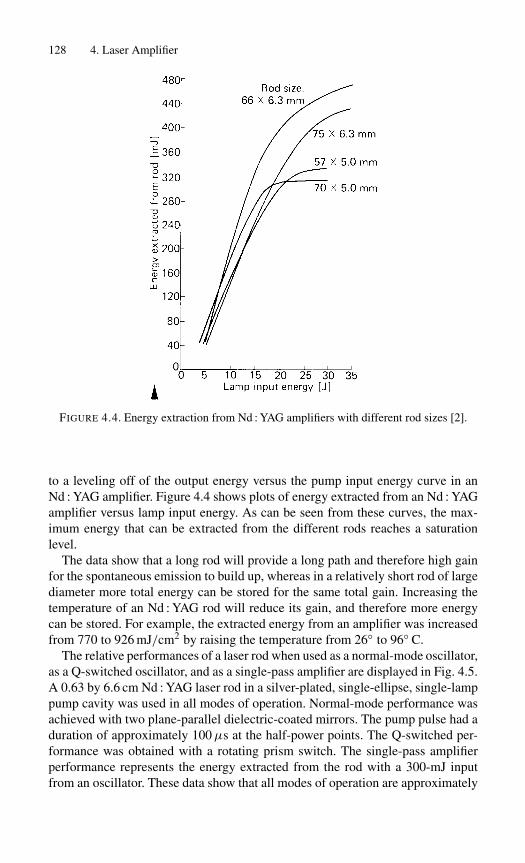
128 4. Laser Amplifier
FIGURE 4.4. Energy extraction from Nd : YAG amplifiers with different rod sizes [2].
to a leveling off of the output energy versus the pump input energy curve in anNd : YAG amplifier. Figure 4.4 shows plots of energy extracted from an Nd : YAGamplifier versus lamp input energy. As can be seen from these curves, the max-imum energy that can be extracted from the different rods reaches a saturationlevel.
The data show that a long rod will provide a long path and therefore high gainfor the spontaneous emission to build up, whereas in a relatively short rod of largediameter more total energy can be stored for the same total gain. Increasing thetemperature of an Nd : YAG rod will reduce its gain, and therefore more energycan be stored. For example, the extracted energy from an amplifier was increasedfrom 770 to 926 mJ/cm2 by raising the temperature from 26◦ to 96◦ C.
The relative performances of a laser rod when used as a normal-mode oscillator,as a Q-switched oscillator, and as a single-pass amplifier are displayed in Fig. 4.5.A 0.63 by 6.6 cm Nd : YAG laser rod in a silver-plated, single-ellipse, single-lamppump cavity was used in all modes of operation. Normal-mode performance wasachieved with two plane-parallel dielectric-coated mirrors. The pump pulse had aduration of approximately 100µs at the half-power points. The Q-switched per-formance was obtained with a rotating prism switch. The single-pass amplifierperformance represents the energy extracted from the rod with a 300-mJ inputfrom an oscillator. These data show that all modes of operation are approximately

4.2. Nd : YAG Amplifiers 129
FIGURE 4.5. Energy extraction from Nd : YAG operated as a normal mode and Q-switchedoscillator, and amplifier of Q-switched pulses [2].
equivalent until the 320 mJ output level is reached. Above this level depopulationlosses decrease the extractable energy.
If the Nd : YAG crystal is pumped with an input of 14 J, a total of 300 mJ canbe extracted from the amplifier (top curve in Fig. 4.4). Since the signal input is300 mJ, the amplifier has a saturated gain of G = 2 and a total output of 600 mJ.In order to extract 300 mJ from this rod, at least 0.15 J/cm3 must be stored inthe upper level. This corresponds to a small-signal gain of G0 = 108. Using(4.13) we can compare the measured saturated gain with the theoretical gain. Foran amplifier operated in the saturation regime Ein Es, the theoretical gain isG = 1 + (Es/Ein)g0l, where the saturation energy for Nd : YAG is Es = 1/β =0.2 J/cm2. With Ein = 1 J/cm2 based on a cross-section area of 0.3 cm2, g0 =0.71 cm−1, and l = 6.6 cm for this amplifier, we obtain G = 2, in agreement withthe measurement.
As was mentioned at the beginning of this chapter, the fraction of stored energythat can be extracted from a signal depends on the energy density of the incomingsignal. In this particular case the amplifier is completely saturated since Ein =5Es. According to our previous discussion, this should result in a high extractionefficiency. If we introduce E0 = 2 J/cm2, Ein = 1 J/cm2, and g0, , and ES fromabove into (4.10) we obtain an extraction efficiency of ηE ≈ 1. Figure 4.6 showsthe measured extraction efficiency of this amplifier as a function of signal input.
The transition region in which the amplifier output as a function of signal in-put changes from an exponential (small-signal) relationship to a linear (saturated)
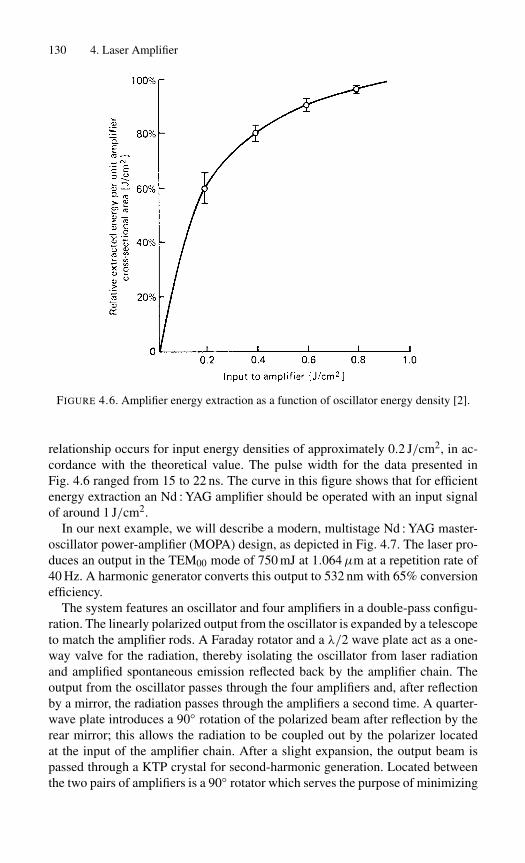
130 4. Laser Amplifier
FIGURE 4.6. Amplifier energy extraction as a function of oscillator energy density [2].
relationship occurs for input energy densities of approximately 0.2 J/cm2, in ac-cordance with the theoretical value. The pulse width for the data presented inFig. 4.6 ranged from 15 to 22 ns. The curve in this figure shows that for efficientenergy extraction an Nd : YAG amplifier should be operated with an input signalof around 1 J/cm2.
In our next example, we will describe a modern, multistage Nd : YAG master-oscillator power-amplifier (MOPA) design, as depicted in Fig. 4.7. The laser pro-duces an output in the TEM00 mode of 750 mJ at 1.064µm at a repetition rate of40 Hz. A harmonic generator converts this output to 532 nm with 65% conversionefficiency.
The system features an oscillator and four amplifiers in a double-pass configu-ration. The linearly polarized output from the oscillator is expanded by a telescopeto match the amplifier rods. A Faraday rotator and a λ/2 wave plate act as a one-way valve for the radiation, thereby isolating the oscillator from laser radiationand amplified spontaneous emission reflected back by the amplifier chain. Theoutput from the oscillator passes through the four amplifiers and, after reflectionby a mirror, the radiation passes through the amplifiers a second time. A quarter-wave plate introduces a 90◦ rotation of the polarized beam after reflection by therear mirror; this allows the radiation to be coupled out by the polarizer locatedat the input of the amplifier chain. After a slight expansion, the output beam ispassed through a KTP crystal for second-harmonic generation. Located betweenthe two pairs of amplifiers is a 90◦ rotator which serves the purpose of minimizing

4.2. Nd : YAG Amplifiers 131
FIGURE 4.7. Optical schematic of a high-power multistage Nd : YAG laser [3].
thermally induced birefringence losses, as will be explained in Section 7.1.1. Thechanges in the polarization of the beam as it travels back and forth through theamplifier chain is illustrated in Fig. 4.8.
Each amplifier contains 16 linear diode arrays for side pumping of the Nd : YAGcrystal. The optical pump energy for each amplifier is 900 mJ at 808 nm, or 4.5 kWat the pump pulse width of 200µs. In each amplifier, the arrays are arranged in aneightfold symmetrical pattern around the 7.6 mm diameter and 6.5 cm long laserrod in order to produce a uniform excitation. The active length of the rod pumpedby the arrays is 4 cm. The small-signal, single-pass gain of one amplifier as afunction of pump energy is plotted in Fig. 4.9.
For low input signals, the gain increases exponentially with g0l according to(4.12). The logarithmic gain g0l is proportional to the pump energy, as derived
FIGURE 4.8. Two-pass amplifier chain with polarization output coupling and birefringencecompensation.

132 4. Laser Amplifier
FIGURE 4.9. Small signal, single pass gain as a function of optical pump energy.
in (3.61),
g0l = η′Ep, (4.22)
where Ep is the optical pump energy from the diode arrays and the η terms for anamplifier operated in the energy storage mode are
η′ = ηtηaηSηQηBηStηASE/AES. (4.23)
For this particular amplifier design, the numerical values are ηt = 0.88 for thetransfer efficiency, ηa = 0.85 for the absorption of pump radiation in the 7.6 mmdiameter Nd : YAG crystal, ηS = 0.76 and ηQ = 0.90 for the Stokes shift andquantum efficiency, ηB = 0.62 for the overlap between the beam and gain regionof the rod, and ηASE = 0.90 and ηSt = 0.68 for the storage efficiency. The latter iscalculated from (3.53) for a pump pulse length of tp = 200µs and a fluorescencelifetime of τf = 230µs for Nd : YAG. With A = 0.25 cm2 and ES = 0.44 J/cm2,one obtains η′ = 1.85. The curve in Fig. 4.9 is based on this value of η′, i.e.,
Eout/Ein = exp[1.85Eopt(J )]. (4.24)
The energy output as a function of the signal input of one amplifier stage singlepass and two amplifiers in a double-pass configuration is plotted in Fig. 4.10. Theamplifiers are operated at a fixed pump energy of 900 mJ each. Also plotted in thisfigure is the gain for the two-amplifier double-pass configuration. The amplifiersare highly saturated as can be seen from the nonlinear shape of the Eout versusEin curve and the drop in gain at the higher input levels.
The increase in energy as the signal pulse travels forward and backward throughthe amplifier chain is plotted in Fig. 4.11. Shown are the measured data points anda curve representing the values calculated from (4.14)–(4.18) with Ein = 50 mJ,

4.2. Nd : YAG Amplifiers 133
FIGURE 4.10. Energy output as a function of signal input for a single-amplifier stage anda two-amplifier, double pass configuration. Also shown is the gain for the latter configura-tion.
FIGURE 4.11. Energy levels at successive stages in the amplifier chain. Points are mea-sured values and the curve is obtained from a computer model.

134 4. Laser Amplifier
FIGURE 4.12. Total energy extraction from each amplifier stage
A = 0.25 cm2, G0 = 4.8, and ES = 0.44 J/cm2. Energy extraction from eachstage for both passes is depicted in Fig. 4.12. The data indicate that the amplifiersare totally saturated and all the stored energy within the beam is extracted. As theinput beam travels the first time through the amplifiers, successively more energyis extracted from each stage since the ratio of Ein/ES increases. On the returnpass, very little energy is removed from the last two stages because stored energyhas already been depleted.
The logarithmic gain for the four stages having a 16 cm active length is g0l =6.0. The double-pass configuration increases the extraction efficiency from 0.8 to1.0. It should be noted that the small-signal gain obtained from Fig. 4.9 is mea-sured over the cross section of the beam. The gain and beam profile are bothcentrally peaked in this design. Both the beam profile and the gain profile havea Gaussian shape with spot sizes of 2.85 and 4.25 mm, respectively. In order toavoid diffraction effects, provide for adequate beam alignment tolerance, and ac-commodate a slightly expanding beam, the beam cross section at the 1/e2 inten-sity points is A = 0.25 cm2, whereas the rod cross section is 0.45 cm2.
Although the extraction is complete within the beam, stored energy is left at theouter regions of the rod. The beam fill factor takes into account this fact. Sinceboth gain and beam profiles are radially dependent, the beam fill factor cannotbe calculated from the ratio of the areas, as would be the case with a uniformgain and beam profile. The beam overlap efficiency can be calculated providedthe gain and beam profiles are known. These distributions were obtained fromimages taken with a CCD camera which recorded the profiles of the fluorescenceand laser beam output. With the radial spot sizes of the Gaussian approximations
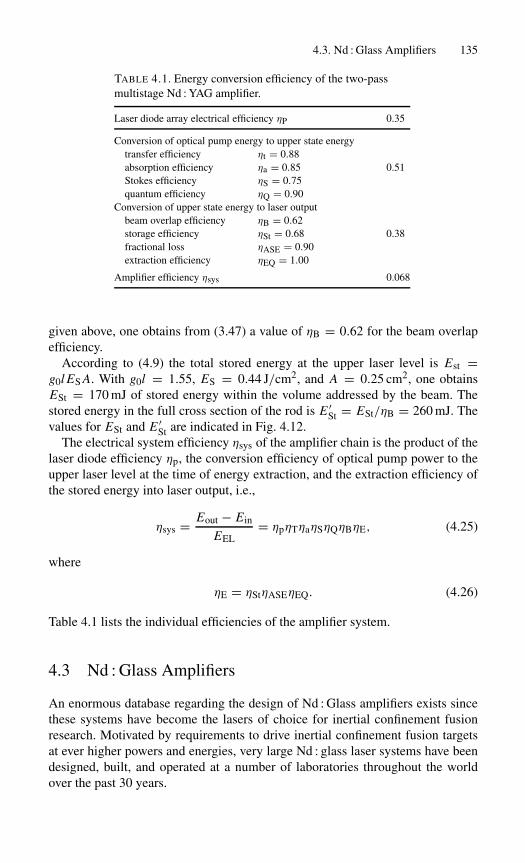
4.3. Nd : Glass Amplifiers 135
TABLE 4.1. Energy conversion efficiency of the two-passmultistage Nd : YAG amplifier.
Laser diode array electrical efficiency ηP 0.35
Conversion of optical pump energy to upper state energytransfer efficiency ηt = 0.88absorption efficiency ηa = 0.85 0.51Stokes efficiency ηS = 0.75quantum efficiency ηQ = 0.90
Conversion of upper state energy to laser outputbeam overlap efficiency ηB = 0.62storage efficiency ηSt = 0.68 0.38fractional loss ηASE = 0.90extraction efficiency ηEQ = 1.00
Amplifier efficiency ηsys 0.068
given above, one obtains from (3.47) a value of ηB = 0.62 for the beam overlapefficiency.
According to (4.9) the total stored energy at the upper laser level is Est =g0l ES A. With g0l = 1.55, ES = 0.44 J/cm2, and A = 0.25 cm2, one obtainsESt = 170 mJ of stored energy within the volume addressed by the beam. Thestored energy in the full cross section of the rod is E ′
St = ESt/ηB = 260 mJ. Thevalues for ESt and E ′
St are indicated in Fig. 4.12.The electrical system efficiency ηsys of the amplifier chain is the product of the
laser diode efficiency ηp, the conversion efficiency of optical pump power to theupper laser level at the time of energy extraction, and the extraction efficiency ofthe stored energy into laser output, i.e.,
ηsys = Eout − Ein
EEL= ηpηTηaηSηQηBηE, (4.25)
where
ηE = ηStηASEηEQ. (4.26)
Table 4.1 lists the individual efficiencies of the amplifier system.
4.3 Nd : Glass Amplifiers
An enormous database regarding the design of Nd : Glass amplifiers exists sincethese systems have become the lasers of choice for inertial confinement fusionresearch. Motivated by requirements to drive inertial confinement fusion targetsat ever higher powers and energies, very large Nd : glass laser systems have beendesigned, built, and operated at a number of laboratories throughout the worldover the past 30 years.
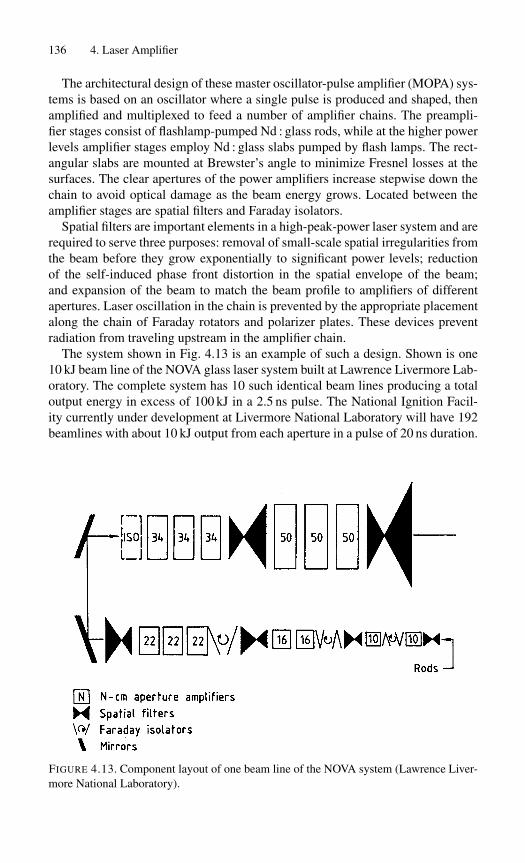
136 4. Laser Amplifier
The architectural design of these master oscillator-pulse amplifier (MOPA) sys-tems is based on an oscillator where a single pulse is produced and shaped, thenamplified and multiplexed to feed a number of amplifier chains. The preampli-fier stages consist of flashlamp-pumped Nd : glass rods, while at the higher powerlevels amplifier stages employ Nd : glass slabs pumped by flash lamps. The rect-angular slabs are mounted at Brewster’s angle to minimize Fresnel losses at thesurfaces. The clear apertures of the power amplifiers increase stepwise down thechain to avoid optical damage as the beam energy grows. Located between theamplifier stages are spatial filters and Faraday isolators.
Spatial filters are important elements in a high-peak-power laser system and arerequired to serve three purposes: removal of small-scale spatial irregularities fromthe beam before they grow exponentially to significant power levels; reductionof the self-induced phase front distortion in the spatial envelope of the beam;and expansion of the beam to match the beam profile to amplifiers of differentapertures. Laser oscillation in the chain is prevented by the appropriate placementalong the chain of Faraday rotators and polarizer plates. These devices preventradiation from traveling upstream in the amplifier chain.
The system shown in Fig. 4.13 is an example of such a design. Shown is one10 kJ beam line of the NOVA glass laser system built at Lawrence Livermore Lab-oratory. The complete system has 10 such identical beam lines producing a totaloutput energy in excess of 100 kJ in a 2.5 ns pulse. The National Ignition Facil-ity currently under development at Livermore National Laboratory will have 192beamlines with about 10 kJ output from each aperture in a pulse of 20 ns duration.
FIGURE 4.13. Component layout of one beam line of the NOVA system (Lawrence Liver-more National Laboratory).

4.3. Nd : Glass Amplifiers 137
The design of these systems is governed by the goal of simultaneously achiev-ing high stored energy and efficient extraction. Both are essential to minimize thenumber and cost of amplifiers.
High-energy storage implies high gain, which can lead to amplified sponta-neous emission owing to the large gain path across the slab dimension. Actually,the maximum energy storage that can be achieved in a large-aperture amplifieris determined by the onset of parasitic lasing, which is due to the formation of alaser resonator by Fresnel reflections at the interfaces of the gain medium. In gen-eral, many complex resonator configurations with multiple reflected beams canlase simultaneously. However, it has been shown that the lowest-loss path lies in aplane across the diameter of the disk. With D the diameter of the disk, parasiticswill start if
exp(g0 D) = 1/R, (4.27)
where g0 is the small signal gain coefficient and R is the reflectivity of the edgeof the disk.
In Nd : glass disks without special edge cladding the magnitude of the Fresnelreflections is on the order of 5%. The onset of parasitic lasing becomes a problemwhen the transfer gain approaches 20 or g0 D = 3. Cladding the edge of the diskswith index-matched absorbing glass results in a dramatic reduction of parasiticlosses. A design parameter and upper limit for state-of-the-art edge cladded large-slab amplifiers is a product of g0 D = 4.2. This value allows for a 1.5% reflectionfrom the disk edge.
Efficient energy extraction requires operation of the amplifier at very high inputfluence, as was discussed in Section 4.1. Extraction is particularly efficient at asignal fluence higher than the saturation fluence of Nd : glass. The upper limit issurface and bulk damage in the glass due to optical inhomogeneities, inclusions,and bubbles and laser-induced damage caused by the nonlinear refractive index.
Actually, the principal limit on the performance of a high-power glass laser,such as employed in fusion research, is the nonlinear refractive index. In the pres-ence of an intense light wave, with a power density of gigawatts per centimetersquared or more, the refractive index of a transparent dielectric is increased. Thisintensity-induced index change is small, on the order of 5 ppm at 1010 W/cm2,but it has profound effects. Changes in the refractive index can be described tofirst order by the equation
n0(E) = n0 +�n0 (4.28)
with
�n0 = n2〈E2〉 = γ I, (4.29)
where n0 and n2 is the linear and nonlinear refractive index, respectively; γ is thenonlinear refractive coefficient, E is the electric field strength, and I is the beam
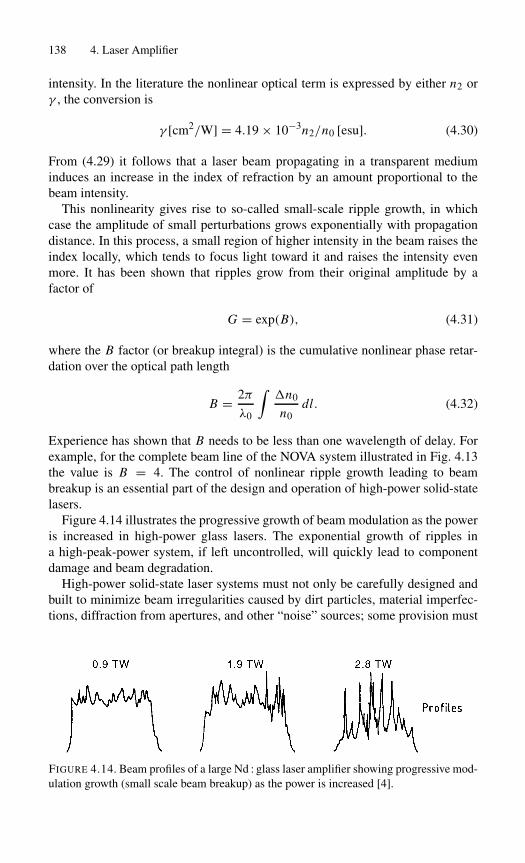
138 4. Laser Amplifier
intensity. In the literature the nonlinear optical term is expressed by either n2 orγ , the conversion is
γ [cm2/W] = 4.19 × 10⁻³n2/n0 [esu]. (4.30)
From (4.29) it follows that a laser beam propagating in a transparent mediuminduces an increase in the index of refraction by an amount proportional to thebeam intensity.
This nonlinearity gives rise to so-called small-scale ripple growth, in whichcase the amplitude of small perturbations grows exponentially with propagationdistance. In this process, a small region of higher intensity in the beam raises theindex locally, which tends to focus light toward it and raises the intensity evenmore. It has been shown that ripples grow from their original amplitude by afactor of
G = exp(B), (4.31)
where the B factor (or breakup integral) is the cumulative nonlinear phase retar-dation over the optical path length
B = 2π
λ0
∫�n0
n0dl. (4.32)
Experience has shown that B needs to be less than one wavelength of delay. Forexample, for the complete beam line of the NOVA system illustrated in Fig. 4.13the value is B = 4. The control of nonlinear ripple growth leading to beambreakup is an essential part of the design and operation of high-power solid-statelasers.
Figure 4.14 illustrates the progressive growth of beam modulation as the poweris increased in high-power glass lasers. The exponential growth of ripples ina high-peak-power system, if left uncontrolled, will quickly lead to componentdamage and beam degradation.
High-power solid-state laser systems must not only be carefully designed andbuilt to minimize beam irregularities caused by dirt particles, material imperfec-tions, diffraction from apertures, and other “noise” sources; some provision must
FIGURE 4.14. Beam profiles of a large Nd : glass laser amplifier showing progressive mod-ulation growth (small scale beam breakup) as the power is increased [4].

4.3. Nd : Glass Amplifiers 139
FIGURE 4.15. Relative intensity of one beam line of the SHIVA system at 1.5 TW, beforeand after installation of the output spatial filter [5].
also be made for removing the remaining small-scale structure, before it becomeslarge enough to cause severe degradation of the laser’s focusing properties.
As was already mentioned, spatial filters accomplish the task of removal of un-wanted ripples, imaging, and beam magnification. A spatial filter is a low-passfilter, where pin-hole diameter limits high spatial frequencies that can be passed.The spatial filter is designed to remove the most damaging ripples while pass-ing most of the energy. Therefore ripples, rather than growing exponentially, arereset at each spatial filter. Figure 4.15 shows the relative intensity of one Shivabeam line before and after installation of a spatial filter at the output. As one cansee from these densitometer scans, the intensity of the high-frequency spike wasreduced by a factor of 4 by the low-pass filter.
A few examples of typical rod and disk amplifiers will illustrate the character-istics of these devices. The front end of each beam line of a high-power Nd : glasslaser consists of rod amplifiers. The performance of such an amplifier is illus-trated in Fig. 4.16. The Nd : glass rod is pumped by flashlamps with an arc lengthof 30 cm. At the maximum pump-energy of 22.5 kJ a small signal gain of 59was measured with a probe beam. From this measurement we calculate a smallsignal gain of g0 = 0.136 cm−1 from (4.12). Since the saturation fluence fromthis Nd : glass ES = 4.8 J/cm2, we obtain from (4.9) a stored energy density ofJst = 0.66 J/cm3. The pump efficiency of this amplifier, defined as the ratio ofstored energy to pump energy, is ηamp = 0.5%.
We will illustrate the energy extraction and operating characteristics of diskamplifiers by comparing the measured data of two different amplifier stages ofthe NOVA beam line illustrated in Fig. 4.13 [7].
The three 22 cm slab amplifiers together have a small signal gain of G0 = 9.1,from which follows a small signal gain coefficient of g0 = 0.18 cm−1 for thecombined optical path length of 12 cm. With this gain coefficient, parasitic oscil-lations can be suppressed since the product g0 D is below 4. The average input

140 4. Laser Amplifier
4 8 12 16 200
10
20
30
40
50
60 o
o
o
oSm
all s
igna
l Gai
n
Lamp Input Energy (KJ)
FIGURE 4.16. Small signal gain of an Nd : glass amplifier. Clear aperture 2.5 cm, rod length38 cm, Hoya laser glass LHG-7 [6].
fluence to this stage is 0.27 J/cm2 and the output fluence is 1.96 J/cm2 across the233 cm2 of clear aperture area. This total extracted energy is 393 J from this stage,whereas the energy stored in the upper lower level is 5060 J. The energy extrac-tion efficiency from this amplifier stage is about 8%. This efficiency is the productof the beam fill factor and the actual extraction of stored energy within the beamarea. To avoid diffraction effects, the laser beam is smaller than the clear aper-ture of the amplifier. In this particular case the beam fill factor is 0.69. The inputfluence, to this amplifier stage, is considerably below the saturation fluence, there-fore the energy extraction efficiency across the beam area is relatively low, i.e.,12%. With an emission cross section of σ = 3.8 × 10⁻²⁰ cm2 for the phosphateglass employed in this laser we obtain a saturation fluence of ES = 5.0 J/cm2
from (4.8).High extraction efficiency requires a fluence level at or above the saturation
level. At the amplifier stage with a 50 cm aperture the fluence levels are consid-erably higher compared to the smaller amplifiers. For the combined three ampli-

4.4. Depopulation Losses 141
fiers, shown in Fig. 4.13, the input fluence is 2.6 J/cm2 and the output fluence is9.70 J/cm2 over a clear aperture area of 1330 cm2. Owing to these high fluencelevels, the energy extraction efficiency has risen to 0.54. The beam fill factor is0.8, which means that about 43% of the total stored energy is extracted from theamplifier. The fluence at the output of this amplifier stage is about twice the satu-ration fluence, and is about as high as one can safely operate these systems beforethe potential for optical damage becomes too high. The fluence level at the outputof this amplifier stage translates to a peak power of close to 4 GW/cm2 for a 2.5 nspulse. The total output at this pulse length is 12.9 kJ. The combined stored energyin all three amplifiers is 23 kJ, which results in a small signal gain of G0 = 7.5.Consistent with the larger aperture the small gain coefficient has been reduced tog0 = 0.1 cm−1 to avoid parasitics.
The measured output fluence levels listed above agree with the calculated val-ues from (4.11) to within a few percent if one introduces the small signal gain,input fluence, and saturation fluence for each amplifier into this equation.
4.4 Depopulation Losses
One of the main considerations in the design of an amplifier or amplifier chainis its stability under the expected operating conditions. In a laser operating as anamplifier or as a Q-switched oscillator the active material acts as an energy storagedevice, and to a large extent its utility is determined by the amount of populationinversion that can be achieved. As the inversion is increased in the active material,a number of different mechanisms begin to depopulate the upper level.
Depopulation can be caused by amplified stimulated emission (ASE). A pro-cess that will be enhanced by radiation from the pump source falling within thewavelength of the laser transition, or by an increase of the pathlength in the gainmedium either by internal or external reflections.
Also, if sufficient feedback exists in an amplifier because of reflections fromoptical surfaces, the amplifier will start to lase prior to the arrival of the signalpulse. If the reflections are caused by surfaces which are normal to the beamdirection, the amplifier will simply become an oscillator and prelasing will occurprior to Q-switching or the arrival of a signal pulse. Reflections that include thecylindrical surfaces of a rod will lead to parasitic modes, propagating at obliqueangles with respect to the optical axis of the laser.
4.4.1 Amplified Spontaneous Emission
The level of population inversion that can be achieved in an amplifier is usuallylimited by depopulation losses which are caused by amplified spontaneous emis-sion. The favorable condition for strong ASE is a high gain combined with a longpath length in the active material. In these situations, spontaneous decay occurringnear one end of a laser rod can be amplified to a significant level before leavingthe active material at the other end. A threshold for ASE does not exist; how-

142 4. Laser Amplifier
FIGURE 4.17. Directionality and maximum pathlength for ASE in a laser rod (a) withouta reflector and (b) with a reflector on one end.
ever, the power emitted as fluorescence increases rapidly with gain. Therefore, asthe pump power increases, ASE becomes the dominant decay mechanism for thelaser amplifier. At that point, an intense emission within a solid angle � aroundthe axis of the active material is observed from each end of the rod
� = A/ l2, (4.33)
where l and A are the rod length and cross-sectional area, respectively. As a resultof refraction at the end faces, the geometrical aperture angle of the rod is increasedby n2
0, as shown in Fig. 4.17. No mirrors are required for ASE to occur; however,reflections from a mirror or internal reflections from the cylindrical surfaces of therod will increase the pathlength for amplified spontaneous emission, which willlead to a further increase in intensity. This aspect will be treated in Section 4.4.2.
In high-gain, multistage amplifier systems ASE may become large enough todeplete the upper state inversion. ASE is particularly important in large Nd : glasssystems employed in fusion experiments. An analytical expression for the fluo-rescence flux IASE from a laser rod as a function of small signal gain, which hasbeen found very useful in estimating the severity of ASE, is given in (4.34) withthe approximation G0 > 1 [8]
IASE
IS= �
4
G0
(ln G0)1/2, (4.34)
where IS is the saturation flux and G0 is the small signal gain of the activemedium. We will apply this formula to a multistage Nd : YAG amplifier and com-pare the calculated with the measured values of ASE.
In Fig. 4.18, the measured ASE from a four-stage, double-pass Nd : YAG ampli-fier chain is plotted as a function of diode-pump input. At an input of about 500 mJinto each amplifier ASE starts to become noticeable, and quickly increases in in-tensity to reach 75 mJ at an input of 900 mJ per amplifier. The detrimental effectof ASE can be seen in Fig. 4.19, which shows the output from the amplifier chainas a function of pump input. As the amplified spontaneous emission increases, theslope of output versus input decreases and the difference can be accounted for bythe loss due to ASE.
From (4.34) in conjunction with Fig. 4.9 which shows the gain versus pumpinput for one amplifier head, we can calculate the ASE from the amplifier chain.

4.4. Depopulation Losses 143
FIGURE 4.18. ASE from a four-stage double pass Nd : YAG amplifier chain. Dots aremeasured values and the solid line represents calculated values from (4.34).
We have to recall that � = A/4l2 since the pathlength for ASE is doubled in adouble-pass system, and G0 = (G ′
0)8, where G ′
0 is the small signal gain in oneamplifier. With A = 0.45 cm2, l = 50 cm, IS = 2.9 × 10³ W/cm2, and tP =200µs, one obtains the curve in Fig. 4.18, which closely matches the observedASE output.
FIGURE 4.19. Signal output versus pump input from a multistage Nd : YAG amplifierchain. (Onset of ASE shown in Fig. 4.18 accounts for drop in output energy.)

144 4. Laser Amplifier
4.4.2 Prelasing and Parasitic Modes
Prelasing and parasitic modes are consequences of the interaction of a high-gainmaterial with reflecting surfaces.
Prelasing
Laser action, occurring during the pump phase in an amplifier, results from theresidual feedback of the various interfaces in the optical path. The condition forstable operation can be derived by considering the gain in an amplifier rod oflength pumped to an inversion level characterized by a gain coefficient g perunit length. Let the end faces of the rod exhibit residual reflectivities of R1 andR2. Then spontaneous emission emanating from any given location in the rod,traveling normal to the rod end faces, will exhibit a loop gain after one roundtrip in the rod of approximately R1 R2 exp(2g ). If this loop gain is greater thanunity, oscillations will build up until the usable stored energy is depleted. Therequirement for an amplifier is thus
R1 R2 exp(2g ) < 1, (4.35)
which sets an upper limit on rod length.
Parasitic Oscillations
Internal reflections at the boundaries of the active medium can drastically enhancethe onset of ASE, particularly if these reflections lead to a closed path, that is, aray that is reflected upon itself. In this case, we have a strong feedback mecha-nism and as soon as the gain in the laser medium exceeds the reflection lossesparasitic oscillations will set in. For example, in rods with polished walls therecan exist internal modes completely contained by total internal reflection. Theseare particularly troublesome.
One type of internal mode, the whisper mode, propagates circumferentiallyand has no longitudinal component. This mode can penetrate into the rod as faras r0/n0, where n0 is the index of refraction and r0 is the rod radius. Anothertype of internal mode, the light-pipe mode, propagates down the rod in a zigzagfashion. The gain limitations due to internal radial modes are considerably im-proved in immersed rods particularly in the case of an index matching fluid, orrods with rough surfaces, grooves, or antireflection coatings. Longitudinal modescan be suppressed if the faces of the rod are either wedged or antireflection coated.Parasitic modes in laser disks have already been described in Section 4.3.
4.5 Self-Focusing
Self-focusing is a consequence of the dependence of the refractive index in di-electric materials on the light intensity.

4.5. Self-Focusing 145
As we discussed in Section 4.3, an intense laser beam propagating in a trans-parent medium induces an increase in the index of refraction by an amountproportional to the beam intensity. For optical glass a typical value of the non-linear refractive coefficient is γ = 4 × 10⁻⁷ cm2/GW. Thus at a power densityof 2.5 GW/cm2 the fractional index change is 1 ppm. Although a change ofthis magnitude seems small, it can dramatically affect beam quality and laserperformance.
Since laser beams tend to be more intense at the center than at the edge, thebeam is slowed at the center with respect to the edge and consequently converges.If the path through the medium is sufficiently long, the beam will be focused to asmall filament, and the medium will usually break down via avalanche ionization.
A variety of physical mechanisms result in intensity-dependent contributions tothe refractive index, such as electronic polarization, electrostriction, and thermaleffects. The latter two mechanisms are responsible for stimulated Brillouin andRayleigh scattering which form the basis for optical phase conjugation treated inChapter 10. For short-pulse operation in solids, electronic polarization, also calledthe optical Kerr effect, which is caused by the nonlinear distortion of the electronorbits around the average position of the nuclei, usually dominates. The opticalKerr effect is utilized in Kerr lens mode-locking discussed in Chapter 9. Here wetreat the negative aspects of this physical process as far as the design of lasers isconcerned.
Self-focusing of laser radiation occurs when the focusing effect due to theintensity-dependent refractive index exceeds the spreading of the beam by diffrac-tion. For a given value of n2, two parameters characterize the tendency of amedium to exhibit self-focusing. The first, the so-called critical power of self-focusing, is the power level that will lead to self-focusing that just compensatesfor diffraction spreading. The second is the focusing length that represents thedistance at which an initially collimated beam will be brought to a catastrophicself-focus within the medium for power levels in excess of the critical power.
A first-order description of the phenomenon can be obtained by considering acircular beam of constant intensity entering a medium having an index nonlinear-ity �n proportional to power density. We define the critical power Pc to be thatfor which the angle for total internal reflection at the boundary equals the far-fielddiffraction angle. The critical angle for total internal reflection is
cos�c = 1
1 + (�n0/n0). (4.36)
If we expand the cosine for small angles and the right-hand side of (4.36) forsmall �n/n, we obtain
�2c = 2�n0/n0. (4.37)
The beam expands due to diffraction with a half-cone angle according to
�D ≈ 1.22λ0
n0 D, (4.38)
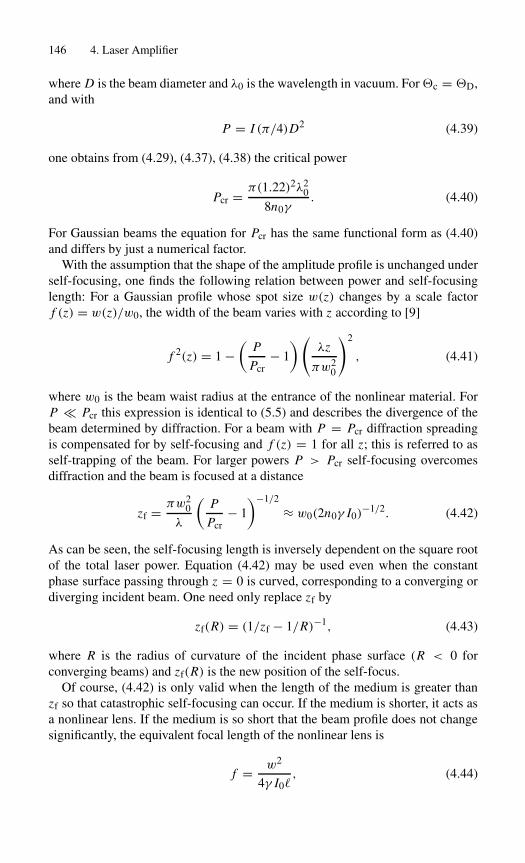
146 4. Laser Amplifier
where D is the beam diameter and λ0 is the wavelength in vacuum. For�c = �D,and with
P = I (π/4)D2 (4.39)
one obtains from (4.29), (4.37), (4.38) the critical power
Pcr = π(1.22)2λ20
8n0γ. (4.40)
For Gaussian beams the equation for Pcr has the same functional form as (4.40)and differs by just a numerical factor.
With the assumption that the shape of the amplitude profile is unchanged underself-focusing, one finds the following relation between power and self-focusinglength: For a Gaussian profile whose spot size w(z) changes by a scale factorf (z) = w(z)/w0, the width of the beam varies with z according to [9]
f 2(z) = 1 −(
P
Pcr− 1
)(λz
πw20
)2
, (4.41)
where w0 is the beam waist radius at the entrance of the nonlinear material. ForP � Pcr this expression is identical to (5.5) and describes the divergence of thebeam determined by diffraction. For a beam with P = Pcr diffraction spreadingis compensated for by self-focusing and f (z) = 1 for all z; this is referred to asself-trapping of the beam. For larger powers P > Pcr self-focusing overcomesdiffraction and the beam is focused at a distance
zf = πw20
λ
(P
Pcr− 1
)−1/2
≈ w0(2n0γ I0)−1/2. (4.42)
As can be seen, the self-focusing length is inversely dependent on the square rootof the total laser power. Equation (4.42) may be used even when the constantphase surface passing through z = 0 is curved, corresponding to a converging ordiverging incident beam. One need only replace zf by
zf(R) = (1/zf − 1/R)−1, (4.43)
where R is the radius of curvature of the incident phase surface (R < 0 forconverging beams) and zf(R) is the new position of the self-focus.
Of course, (4.42) is only valid when the length of the medium is greater thanzf so that catastrophic self-focusing can occur. If the medium is shorter, it acts asa nonlinear lens. If the medium is so short that the beam profile does not changesignificantly, the equivalent focal length of the nonlinear lens is
f = w2
4γ I0 , (4.44)
Summary 147
where I0 is the peak intensity and is the length of the medium. This equation isthe same as (9.12) which will be used in the section on Kerr lens mode-locking.
Summary
The generation of high-power laser pulses is based on the combination of a masteroscillator and power amplifier. The master oscillator generates an initial pulse ofmoderate power and energy with the desired pulse duration, beam divergence, andspectral width. In a single or multistage amplifier with a large volume of activematerial the pulse energy is increased to the desired level. In almost all casesamplifiers are employed to increase the energy of Q-switched or mode-lockedpulses. Therefore the pulse width is short compared to the lifetime of the upperlaser level, and the small signal gain is determined by the stored energy in theamplifier prior to the arrival of the pulse. For optimal operation the timing betweenthe oscillator and amplifier must be such that there is a maximum populationinversion in the amplifier when the pulse from the oscillator enters it.
The fraction of stored energy that can be extracted from the amplifier dependson the ratio of pulse energy to saturation energy at each point in the amplifier. Atinput energies well below the saturation energy, the pulse energy grows exponen-tially with length in the active material, at energy levels above the saturation den-sity the energy grows linearly. In the exponential regime, the signal gain is highbut the energy extraction is low; the reverse is true for operation of the amplifierin saturation. Typically the growth of energy of a pulse entering an amplifier oramplifier chain changes from an exponential increase at the input side to a linearenergy increase with length at the output end. Pulse amplification in the regimeof amplifier saturation is determined by eq. (4.11).
In the few cases where an amplifier is employed to amplify continuous radi-ation, such as in multikilowatt Nd : YAG lasers, or where the pulse duration islong compared to the upper state lifetime, the small signal gain is a function ofthe pump power, and the gain saturation depends on the ratio of power density tosaturation power density at each point as given by eq. (3.25).
The design of an amplifier chain is mainly governed by two considerations:elimination of any feedback path that may lead to oscillations and avoidance ofoptical damage. Self-oscillation is eliminated by dividing the amplifier chain intoa number of stages that are separated by optical isolators. Damage of the amplifiermedium due to high power radiation limits the energy and power for a givencross section. Therefore the cross section of the active medium is increased insuccessive stages of the amplifier chain.
References[1] L.M. Frantz and J.S. Nodvik: J. Appl. Phys. 34, 2346 (1963).
[2] T.G. Crow and T.J. Snyder: Techniques for achieving high-power Q-switched opera-tion in YAG : Nd. Final Tech. Report AFAL-TR-70-69, Air Force, WPAFB (1970); seealso Laser J. 18 (1970).
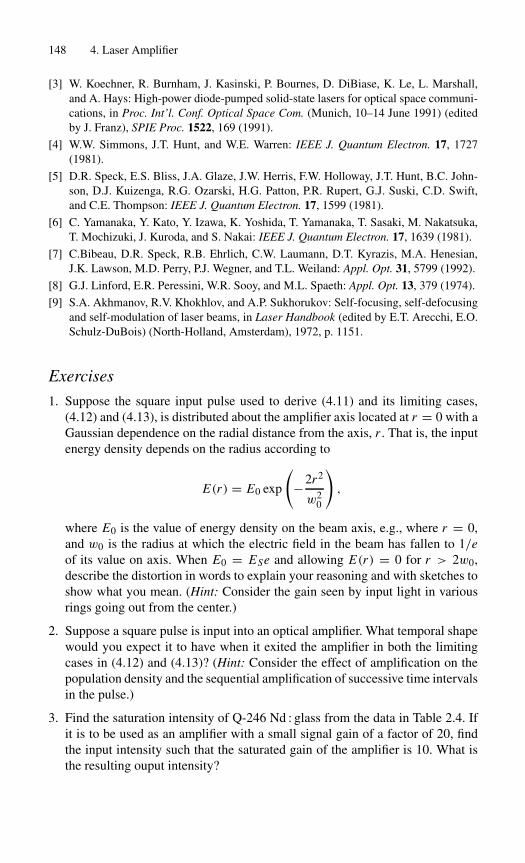
148 4. Laser Amplifier
[3] W. Koechner, R. Burnham, J. Kasinski, P. Bournes, D. DiBiase, K. Le, L. Marshall,and A. Hays: High-power diode-pumped solid-state lasers for optical space communi-cations, in Proc. Int’l. Conf. Optical Space Com. (Munich, 10–14 June 1991) (editedby J. Franz), SPIE Proc. 1522, 169 (1991).
[4] W.W. Simmons, J.T. Hunt, and W.E. Warren: IEEE J. Quantum Electron. 17, 1727(1981).
[5] D.R. Speck, E.S. Bliss, J.A. Glaze, J.W. Herris, F.W. Holloway, J.T. Hunt, B.C. John-son, D.J. Kuizenga, R.G. Ozarski, H.G. Patton, P.R. Rupert, G.J. Suski, C.D. Swift,and C.E. Thompson: IEEE J. Quantum Electron. 17, 1599 (1981).
[6] C. Yamanaka, Y. Kato, Y. Izawa, K. Yoshida, T. Yamanaka, T. Sasaki, M. Nakatsuka,T. Mochizuki, J. Kuroda, and S. Nakai: IEEE J. Quantum Electron. 17, 1639 (1981).
[7] C.Bibeau, D.R. Speck, R.B. Ehrlich, C.W. Laumann, D.T. Kyrazis, M.A. Henesian,J.K. Lawson, M.D. Perry, P.J. Wegner, and T.L. Weiland: Appl. Opt. 31, 5799 (1992).
[8] G.J. Linford, E.R. Peressini, W.R. Sooy, and M.L. Spaeth: Appl. Opt. 13, 379 (1974).
[9] S.A. Akhmanov, R.V. Khokhlov, and A.P. Sukhorukov: Self-focusing, self-defocusingand self-modulation of laser beams, in Laser Handbook (edited by E.T. Arecchi, E.O.Schulz-DuBois) (North-Holland, Amsterdam), 1972, p. 1151.
Exercises
1. Suppose the square input pulse used to derive (4.11) and its limiting cases,(4.12) and (4.13), is distributed about the amplifier axis located at r = 0 with aGaussian dependence on the radial distance from the axis, r . That is, the inputenergy density depends on the radius according to
E(r) = E0 exp
(−2r2
w20
),
where E0 is the value of energy density on the beam axis, e.g., where r = 0,and w0 is the radius at which the electric field in the beam has fallen to 1/eof its value on axis. When E0 = ESe and allowing E(r) = 0 for r > 2w0,describe the distortion in words to explain your reasoning and with sketches toshow what you mean. (Hint: Consider the gain seen by input light in variousrings going out from the center.)
2. Suppose a square pulse is input into an optical amplifier. What temporal shapewould you expect it to have when it exited the amplifier in both the limitingcases in (4.12) and (4.13)? (Hint: Consider the effect of amplification on thepopulation density and the sequential amplification of successive time intervalsin the pulse.)
3. Find the saturation intensity of Q-246 Nd : glass from the data in Table 2.4. Ifit is to be used as an amplifier with a small signal gain of a factor of 20, findthe input intensity such that the saturated gain of the amplifier is 10. What isthe resulting ouput intensity?

5
Optical Resonator
5.1 Transverse Modes5.2 Longitudinal Modes5.3 Unstable Resonators
ReferencesExercises
The radiation emitted by most lasers contains several discrete optical frequencies,separated from each other by frequency differences, which can be associated withdifferent modes of the optical resonator. Each mode is defined by the variation ofthe electromagnetic field perpendicular and along the axis of the resonator. Thesymbols TEMmnq or TEMplq are used to describe the transverse and longitudinalmode structure of a wave inside the resonator for cylindrical and rectangular co-ordinates, respectively. The capital letters stand for “transverse electromagneticwaves,” and the first two indices identify a particular transverse mode, whereasq describes a longitudinal mode. Although a resonator mode consists of a trans-verse and axial field distribution, it is useful to consider these two componentsseparately because they are responsible for different aspects of laser performance.
The spectral characteristics of a laser, such as linewidth and coherence length,are primarily determined by the longitudinal modes; whereas beam divergence,beam diameter, and energy distribution are governed by the transverse mode struc-ture. In general, lasers are multimode oscillators unless specific efforts are madeto limit the number of oscillating modes. The reason for this lies in the fact that avery large number of longitudinal resonator modes fall within the bandwidth ex-hibited by the laser transition, and a large number of transverse resonator modescan occupy the cross section of the active material.
5.1 Transverse Modes
The theory of modes in optical resonators has been treated in [1]–[3]; comprehen-sive reviews of the subject can also be found in [4], [5].
149
150 5. Optical Resonator
5.1.1 Intensity Distribution
In an optical resonator, electromagnetic fields can exist whose distribution of am-plitudes and phases reproduce themselves upon repeated reflections between themirrors. These particular field configurations comprise the transverse electromag-netic modes of a passive resonator.
Transverse modes are defined by the designation TEMmn for Cartesian coordi-nates. The integers m and n represent the number of nodes of zeros of intensitytransverse to the beam axis in the vertical and horizontal directions. In cylindricalcoordinates the modes are labeled TEMpl and are characterized by the number ofradial nodes p and angular nodes l. The higher the values of m, n, p, and l, thehigher the mode order. The lowest-order mode is the TEM00 mode, which has aGaussian intensity profile with its maximum on the beam axis. For modes withsubscripts of 1 or more, intensity maxima occur that are off-axis in a symmetri-cal pattern. To determine the location and amplitudes of the peaks and nodes ofthe oscillation modes, it is necessary to employ higher-order equations which in-volve either Hermite (H) or Laguerre (L) polynomials. The Hermite polynomialsare used when working with rectangular coordinates, while Laguerre polynomialsare more convenient when working with cylindrical coordinates.
In cylindrical coordinates, the radial intensity distribution of allowable circu-larly symmetric TEMpl modes is given by the expression
Ipl(r, φ, z) = I0�l [Ll
p�]2(cos2 lφ) exp(−�) (5.1)
with � = 2r2(z)/w2(z), where z is the propagation direction of the beam and r, φare the polar coordinates in a plane transverse to the beam direction. The radialintensity distributions are normalized to the spot size of a Gaussian profile; thatis, w(z) is the spot size of the Gaussian beam, defined as the radius at whichthe intensity of the TEM00 mode is 1/e2 of its peak value on the axis. L p is thegeneralized Laguerre polynomial of order p and index l.
The intensity distribution given in (5.1) is the product of a radial part and an an-gular part. For modes with l = 0 (i.e., TEMp0), the angular dependence drops outand the mode pattern contains p dark concentric rings, each ring correspondingto a zero of L0
p(�). The radial intensity distribution decays because of the factorexp(−�). The center of a pl mode will be bright if l = 0, but dark otherwise be-cause of the factor �l . These modes, besides having p zeros in the radial direction,also have 2l nodes in azimuth.
The only change in a (pl) mode distribution comes through the dependence ofthe spot sizew(z) on the axial position z. However, the modes preserve the generalshape of their electric field distributions for all values of z. As w increases with z,the transverse dimensions increase so that the sizes of the mode patterns stay inconstant ratio to each other.
From (5.1) it is possible to determine any beam mode profile. Figure 5.1(a)depicts various cylindrical transverse intensity patterns as they would appear inthe output beam of a laser. Note that the area occupied by a mode increases withthe mode number. A mode designation accompanied by an asterisk indicates a

5.1. Transverse Modes 151
FIGURE 5.1. Examples of (a) cylindrical and (b) rectangular transverse mode patterns. Forcylindrical modes, the first subscript indicates the number of dark rings, whereas the secondsubscript indicates the number of dark bars across the pattern. For rectangular patterns, thetwo subscripts give the number of dark bars in the x- and y-directions [6].
mode which is a linear superposition of two like modes, one rotated 90◦ about theaxis relative to the other. For example, the TEM mode designated 01∗ is made upof two TEM01 modes.
The intensity distribution of the modes shown in Fig. 5.1(a) can be calculatedif we introduce the appropriate Laguerre polynomials into (5.1), that is,
Ll0(�) = 1, L0
1(�) = 1 − �; L02(�) = 1 − 2� + 1
2�2.
A plot of the intensity distributions of the lowest-order mode and the next twohigher-order transverse modes, that is, TEM00, TEM01∗ , and TEM10, is illustratedin Fig. 5.2.

152 5. Optical Resonator
FIGURE 5.2. Radial intensity distribution for TEM00, TEM01∗ , and TEM10 modes. Theradii are normalized to the beam radius w00 of the fundamental mode [7].
In rectangular coordinates the intensity distributions of an (m, n)mode is givenby
Imn(x, y, z) = I0
[Hm
(x(2)1/2
w(z)
)exp
(−x2
w2(z)
)]2
×[
Hn
(y(2)1/2
w(z)
)exp
(−y2
w2(z)
)]2
. (5.2)
As before, w(z) is the spot size at which the transverse intensity decreasesto 1/e2 of the peak intensity of the lowest-order mode. The function Hm(s) isthe mth-order Hermite polynomial, for example, H0(s) = 1,H1(s) = 2s, andH2(s) = 4s2 − 2. At a given axial position z, the intensity distribution consistsof the product of a function of x alone and a function of y alone. The intensitypatterns of rectangular transverse modes are sketched in Fig. 5.1(b). The m, nvalues of a single spatial mode can be determined by counting the number of darkbars crossing the pattern in the x- and y-directions. Note that the fundamentalmode (m = n = 0) in this geometry is identical with the fundamental mode incylindrical geometry.
The transverse modes shown in Fig. 5.1 can exist as linearly polarized beams,as illustrated by Fig. 5.3. By combining two orthogonally polarized modes of thesame order, it is possible to synthesize other polarization configurations; this isshown in Fig. 5.4 for the TEM01 mode.
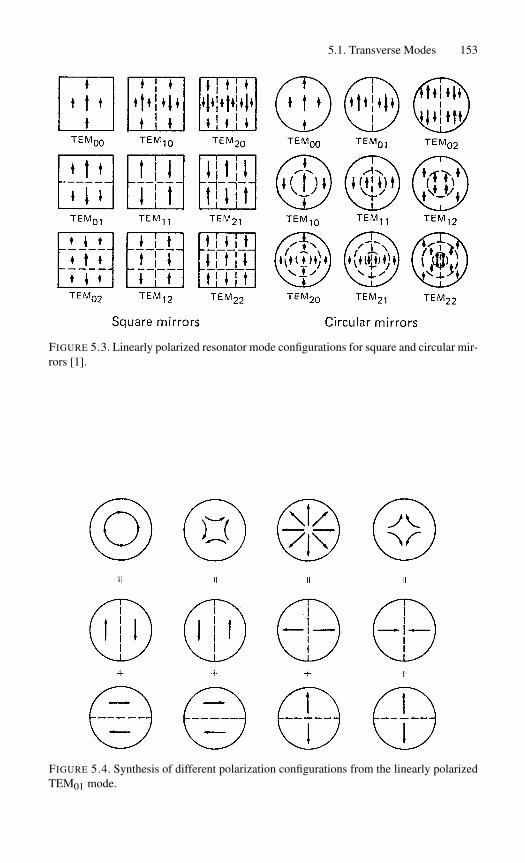
5.1. Transverse Modes 153
FIGURE 5.3. Linearly polarized resonator mode configurations for square and circular mir-rors [1].
FIGURE 5.4. Synthesis of different polarization configurations from the linearly polarizedTEM01 mode.
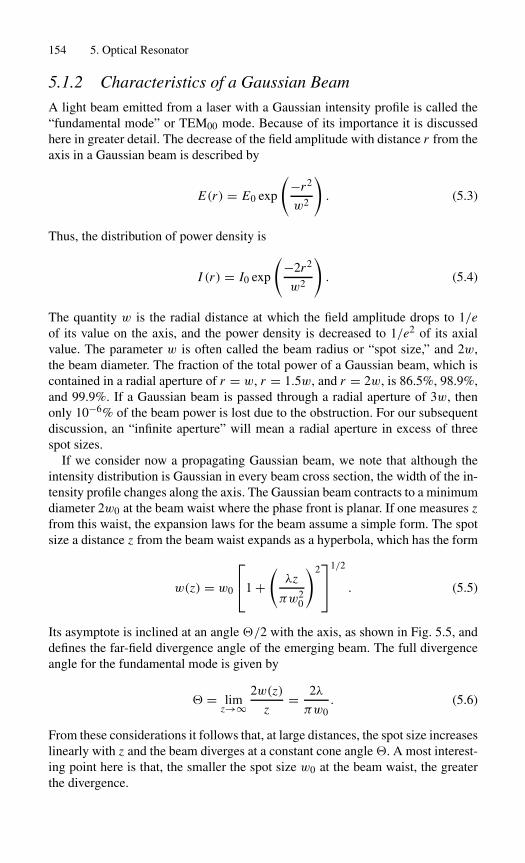
154 5. Optical Resonator
5.1.2 Characteristics of a Gaussian Beam
A light beam emitted from a laser with a Gaussian intensity profile is called the“fundamental mode” or TEM00 mode. Because of its importance it is discussedhere in greater detail. The decrease of the field amplitude with distance r from theaxis in a Gaussian beam is described by
E(r) = E0 exp
(−r2
w2
). (5.3)
Thus, the distribution of power density is
I (r) = I0 exp
(−2r2
w2
). (5.4)
The quantity w is the radial distance at which the field amplitude drops to 1/eof its value on the axis, and the power density is decreased to 1/e2 of its axialvalue. The parameter w is often called the beam radius or “spot size,” and 2w,the beam diameter. The fraction of the total power of a Gaussian beam, which iscontained in a radial aperture of r = w, r = 1.5w, and r = 2w, is 86.5%, 98.9%,and 99.9%. If a Gaussian beam is passed through a radial aperture of 3w, thenonly 10−6% of the beam power is lost due to the obstruction. For our subsequentdiscussion, an “infinite aperture” will mean a radial aperture in excess of threespot sizes.
If we consider now a propagating Gaussian beam, we note that although theintensity distribution is Gaussian in every beam cross section, the width of the in-tensity profile changes along the axis. The Gaussian beam contracts to a minimumdiameter 2w0 at the beam waist where the phase front is planar. If one measures zfrom this waist, the expansion laws for the beam assume a simple form. The spotsize a distance z from the beam waist expands as a hyperbola, which has the form
w(z) = w0
1 +
(λz
πw20
)2
1/2
. (5.5)
Its asymptote is inclined at an angle �/2 with the axis, as shown in Fig. 5.5, anddefines the far-field divergence angle of the emerging beam. The full divergenceangle for the fundamental mode is given by
� = limz→∞
2w(z)
z= 2λ
πw0. (5.6)
From these considerations it follows that, at large distances, the spot size increaseslinearly with z and the beam diverges at a constant cone angle�. A most interest-ing point here is that, the smaller the spot size w0 at the beam waist, the greaterthe divergence.

5.1. Transverse Modes 155
FIGURE 5.5. Contour of a Gaussian beam.
At sufficiently large distances from the beam waist, the wave has a sphericalwavefront appearing to emanate from a point on the beam axis at the waist. IfR(z) is the radius of curvature of the wavefront that intersects the axis at z, then
R(z) = z
1 +
(πw2
0
λz
)2 . (5.7)
It is important to note that in a Gaussian beam the wavefront has the same phaseacross its entire surface.
Sometimes the properties of a TEM00 mode beam are described by specifyinga confocal parameter
b = 2πw20
λ, (5.8)
where b is the distance between the points at each side of the beam waist forwhich w(z) = (2)1/2w0 (Fig. 5.5).
In dealing with Gaussian beams the relationship between peak power densityand total power is used in several places in this book. A Gaussian beam with apeak power density I0 at the center and a beam waist radius w0 is characterizedby
I (r) = I0 exp(−2r2/w20). (5.9)
The total power P in the beam is obtained by integrating over the cross section
P =∫
I (r)2rπ dr, (5.10)
which leads to
P = πw20 I0/2. (5.11)

156 5. Optical Resonator
For a Gaussian beam, the total power is half the peak intensity times the areadefined by the beam radius w0.
5.1.3 Resonator Configurations
The most commonly used laser resonators are composed of two spherical or flatmirrors facing each other. We will first consider the generation of the lowest-ordermode by such a resonant structure. Once the parameters of the TEM00 mode areknown, all higher-order modes simply scale from it in a known manner. Diffrac-tion effects due to the finite size of the mirrors will be neglected in this section.
The Gaussian beam indicated in Fig. 5.6 has a wavefront curvature of R1 ata distance t1 from the beam waist. If we put a mirror at L1, whose radius ofcurvature equals that of the wavefront, then the mode shape has not been altered.To proceed further, we can go along the z-axis to another point L2 where theTEM00 has a radius of curvature R2, and place there a mirror whose radius ofcurvature R2 equals that of the spherical wavefront at L2. Again the mode shaperemains unaltered.
Therefore, to make a resonator, we simply insert two reflectors that match twoof the spherical surfaces defined by (5.7). Alternatively, given two mirrors sepa-rated by a distance L , if the position of the plane z = 0 and the value of the param-eter w0 can be adjusted so that the mirror curvatures coincide with the wavefrontsurfaces, we will have found the resonator mode.
We will now list formulas, derived by Kogelnik and Li [4], which relate themode parameters w1, w2, w0, L1, and L2 to the resonator parameters R1, R2,and L . As illustrated in Fig. 5.6, w1 and w2 are the spot radii at mirrors M1 andM2, respectively; L1 and L2 are the distances of the beam waist described byw0 from mirrors M1 and M2, respectively; and R1 and R2 are the curvatures ofmirrors M1 and M2 that are separated by a distance L . Labeling conventions arethat concave curvatures are positive.
FIGURE 5.6. Mode parameters of interest for a resonator with mirrors of unequal curvature.

5.1. Transverse Modes 157
The beam radii at the mirrors are given by
w41 =
(λR1
π
)2 R2 − L
R1 − L
(L
R1 + R2 − L
),
w42 =
(λR2
π
)2 R1 − L
R2 − L
(L
R1 + R2 − L
). (5.12)
The radius of the beam waist, which is formed either inside or outside the res-onator, is given by
w40 =
(λ
π
)2 L(R1 − L)(R2 − L)(R1 + R2 − L)
(R1 + R2 − 2L)2. (5.13)
The distances L1 and L2 between the waist and the mirrors, measured positive(Fig. 5.6), are
L1 = L(R2 − L)
R1 + R2 − 2L, L2 = L(R1 − L)
R1 + R2 − 2L. (5.14)
These equations treat the most general case of a resonator. There are many opticalresonator configurations for which (5.12)–(5.14) are greatly simplified. Figure 5.7shows some of the most commonly used geometries.
Mirrors of Equal Curvature
With R1 = R2 = R we obtain, from (5.12),
w21,2 = λR
π
(L
2R − L
)1/2
. (5.15)
The beam waist that occurs at the center of the resonator L1 = L2 = R/2 is
w20 = λ
2π[L(2R − L)]1/2. (5.16)
If we further assume that the mirror radii are large compared to the resonatorlength R � L , the above formula simplifies to
w21,2 = w2
0 =(λ
π
)(RL
2
)1/2
. (5.17)
As follows from (5.17) in a resonator comprised of large-radius mirrors, the beamdiameter changes very little as a function of distance.
A resonator comprised of mirrors having a radius of curvature on the order of 2to 10 m, that is, several times longer than the length of the resonator, is one of themost commonly employed configurations. Such a large-radius mirror resonatorhas a reasonable alignment stability and a good utilization of the active medium.
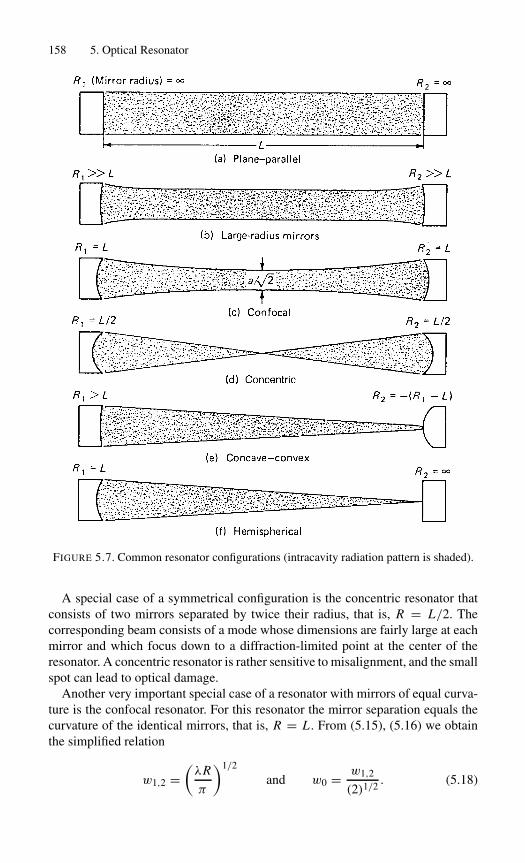
158 5. Optical Resonator
FIGURE 5.7. Common resonator configurations (intracavity radiation pattern is shaded).
A special case of a symmetrical configuration is the concentric resonator thatconsists of two mirrors separated by twice their radius, that is, R = L/2. Thecorresponding beam consists of a mode whose dimensions are fairly large at eachmirror and which focus down to a diffraction-limited point at the center of theresonator. A concentric resonator is rather sensitive to misalignment, and the smallspot can lead to optical damage.
Another very important special case of a resonator with mirrors of equal curva-ture is the confocal resonator. For this resonator the mirror separation equals thecurvature of the identical mirrors, that is, R = L . From (5.15), (5.16) we obtainthe simplified relation
w1,2 =(λR
π
)1/2
and w0 = w1,2
(2)1/2. (5.18)

5.1. Transverse Modes 159
The confocal configuration gives the smallest possible mode dimension for a res-onator of given length. For this reason, confocal resonators are not often employedsince they do not make efficient use of the active material.
Plano-Concave Resonator
For a resonator with one flat mirror (R1 = ∞) and one curved mirror we obtain
w21 = w2
0 =(λ
π
)[L(R2 − L)]1/2 and w2
2 =(λ
π
)R2
(L
R2 − L
)1/2
.
(5.19)
The beam waist w0 occurs at the flat mirror (i.e., L1 = 0 and L2 = L). A spe-cial case of this resonator configuration is the hemispherical resonator. The hemi-spherical resonator consists of one spherical mirror and one flat mirror placedapproximately at the center of curvature of the sphere. The resultant mode hasa relatively large diameter at the spherical mirror and focuses to a diffraction-limited point at the plane mirror. In practice, one makes the mirror separation Lslightly less than R2 so that a value of w1 is obtained that gives reasonably smalldiffraction losses.
In solid-state lasers, the small spot size can lead to optical damage at the mirror.A near hemispherical resonator has the best alignment stability of any configura-tion; therefore it is often employed in low-power lasers such as HeNe lasers.
Concave–Convex Resonator
The pertinent beam parameters for concave–convex resonators can be calculatedif we introduce a negative radius (−R2) for the convex mirror into (5.12)–(5.14).A small-radius convex mirror in conjunction with a large-radius concave or planemirror is a very common resonator in high-average-power solid-state lasers. Asfollows from the discussion in the next section, as a passive resonator such aconfiguration is unstable. However, in a resonator that contains a laser crystal, thisconfiguration can be stable since the diverging properties of the concave mirrorare counteracted by the focusing action of the laser rod. Since the concave mirrorpartially compensates for thermal lensing, a large mode volume can be achievedas will be shown in an example later in this chapter.
Plane–Parallel Resonator
The plane–parallel or flat–flat resonator, which can be considered a special caseof the large-radius mirror configuration (R1 = R2 = ∞), is extremely sensitive toperturbation. However, in an active resonator, that is, a resonator containing a lasercrystal, this configuration can be quite useful. Heat extraction leads to thermallensing in the active medium, this internal lens has the effect of transforming theplane–parallel resonator to a curved mirror configuration as explained later in thissection. Therefore the thermally induced lens in the laser material brings the flat–flat resonator into geometric stability.
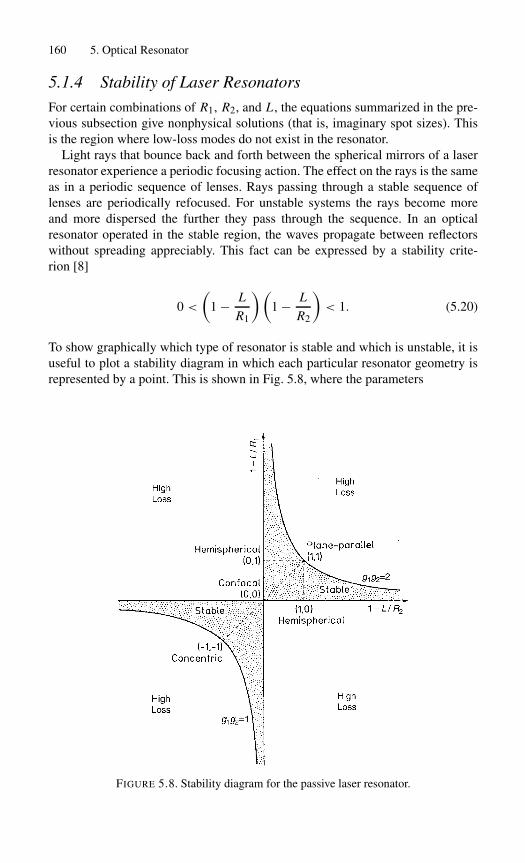
160 5. Optical Resonator
5.1.4 Stability of Laser Resonators
For certain combinations of R1, R2, and L , the equations summarized in the pre-vious subsection give nonphysical solutions (that is, imaginary spot sizes). Thisis the region where low-loss modes do not exist in the resonator.
Light rays that bounce back and forth between the spherical mirrors of a laserresonator experience a periodic focusing action. The effect on the rays is the sameas in a periodic sequence of lenses. Rays passing through a stable sequence oflenses are periodically refocused. For unstable systems the rays become moreand more dispersed the further they pass through the sequence. In an opticalresonator operated in the stable region, the waves propagate between reflectorswithout spreading appreciably. This fact can be expressed by a stability crite-rion [8]
0 <
(1 − L
R1
)(1 − L
R2
)< 1. (5.20)
To show graphically which type of resonator is stable and which is unstable, it isuseful to plot a stability diagram in which each particular resonator geometry isrepresented by a point. This is shown in Fig. 5.8, where the parameters
FIGURE 5.8. Stability diagram for the passive laser resonator.
5.1. Transverse Modes 161
g1 = 1 − L
R1, g2 = 1 − L
R2, (5.21)
are drawn as the coordinate axes.All cavity configurations are unstable unless they correspond to points located
in the area enclosed by a branch of the hyperbola g1g2 = 1 and the coordinateaxes. The origin of the diagram represents the confocal system.
The resonators located along the dashed line, oriented at 45◦ with respect to thecoordinate axis, are symmetric configurations, that is, they have mirrors with thesame radius of curvature.
The diagram is divided into positive and negative branches defining quadrantsfor which g1g2 is either positive or negative. The reason for this classificationbecomes clear when we discuss unstable resonators.
5.1.5 Higher Order Modes
The fundamental TEM00 mode has the smallest beam radius and divergence in theresonator. The beam radius of each mode increases with increasing mode number.Owing to the complicated beam patterns it is not possible to define the beam sizeby a 1/e drop in amplitude as is the case for the TEM00 mode. However, an ideaof the relationship of beam divergence and mode structure can be obtained ifone defines the spot size by a circle containing 90% of the energy for cylindricalmodes, and for rectangular modes by a rectangle having dimensions of twice thestandard deviation.
With these definitions we obtain, for cylindrical modes [9],
wpl = (2p + + 1)1/2w0 (5.22)
and, for rectangular modes [10],
wm = (2m + 1)1/2w0, wn = (2n + 1)1/2w0, (5.23)
where p, , m, n have been defined in Section 5.1.1 and w0 is the TEM00 moderadius. The beam divergence of each higher-order mode also increases accordingto the scaling law expressed by (5.22), (5.23). The increase of beam diameter anddivergence of a multimode beam can be expressed by
� = Mθ0 (5.24a)
and
D = M D0, (5.24b)
where the multimode beam divergence � and the beam diameter D are related tothe fundamental mode beam parameters θ0 and D0 by by a factor of M .
It is not sufficient to characterize a laser beam only by its divergence becausewith a telescope it can always be reduced. The beam property that cannot be
162 5. Optical Resonator
corrected by an optical system is the brightness, i.e., the beam intensity per unitsolid angle. The brightness theorem states that the product of beam diameter andfar-field angle is constant
θD = M2θ0 D0, (5.25a)
where M2 is a dimensionless beam-quality figure of merit and θD is typicallyexpressed as the beam-parameter product (mm-mrad). A laser operating in theTEM00 mode is characterized by M2 = 1 and from (5.6) we obtain
θ0 D0 = 4λ/π. (5.25b)
The value of M2 expresses the degree by which the actual beam is above thediffraction limit of an ideal Gaussian beam.
For an Nd : YAG laser emitting at 1.064µm this product is θ0 D0 = 1.35 mm-mr. An Nd : YAG laser with a low-order mode output such as, for example, TEM20shown in Fig. 5.1 has a beam quality factor of M2 = 5 or, in other words, the beamis five times diffraction limited. The beam-parameter product is about 6.8 mm-mrad.
Actually the output from a multimode laser rarely consists of a single higher-order mode, typically the output is comprised of the incoherent superposition ofseveral modes. Multimode beams comprised of the superposition of modes withbeam patterns, as shown in Fig. 5.1, have the property that the beam radius willretain a fixed ratio with respect to the Gaussian beam radius w(z) over all dis-tances. The multimode beam will therefore propagate with distance in the sameform as described by (5.5) for a Gaussian beam
w′(z) = w′0
√1 +
(zM2λ
πw′0
)2
, (5.26)
where w′(z) is the beam radius at z and w′0 is the radius at the waist of the multi-
mode beam.Because the envelope of a multimode and TEM00 beam change in the same
ratio over distance, calculations of the propagation of a multimode beam througha resonator can first be performed for a Gaussian beam and then multiplied by afactor w0′/w0 in order to obtain the multimode beam diameter at each point.
5.1.6 Diffraction Losses
In any real laser resonator some part of the laser beam will be lost either byspillover at the mirrors or by limiting apertures, such as the lateral boundariesof the active material. These losses will depend on the diameter of the laser beamin the plane of the aperture and the aperture radius. If we take a finite apertureof radius a within the resonator into account, the diffraction losses depend onfour parameters, R1, R2, L , and a, which describe the resonator; and on three pa-

5.1. Transverse Modes 163
rameters λ, m, and n, characterizing the particular mode present in the resonator.Fortunately, the losses depend only on certain combinations of these parameters.These combinations are the so-called Fresnel number,
N = a2
λL, (5.27)
and the quantities g1 and g2, which were defined in (5.21). The parameter N canbe thought of as the ratio of the acceptance angle (a/L) of one mirror as viewedfrom the center of the opposing mirror to the diffraction angle (λ/a) of the beam.Therefore, when N is small, especially if N < 1, the loss factor will be highbecause only a portion of the beam will be intercepted by the mirrors.
Conversely when N is large, diffraction losses will be low. The fractionalenergy loss per transit because of diffraction effects for the lowest-order mode(TEM00) is shown in Fig. 5.9 for resonators with equally curved mirrors andapertures located in front of the mirrors (g1 = g2 = g, a1 = a2 = a). Theplane-parallel and concentric resonator (|g| = 1) have the highest losses for a
FIGURE 5.9. Diffraction losses per transit for the TEM00 mode of various symmetricalresonators [8].
164 5. Optical Resonator
given aperture according to Fig. 5.9. This is not surprising because both resonatorconfigurations have mode sizes which approach infinity at the limit. On the otherhand, the confocal resonator (g = 0) has the smallest mode dimension for a givenresonator length as discussed before. Therefore a given aperture will also causethe lowest diffraction losses. It can also be seen from Fig. 5.9 that the diffractionlosses are very sensitive to changes in mirror curvature, and losses decrease veryrapidly for all resonator configurations as N increases.
Mode selection or discrimination of higher order modes, by choosing the ap-propriate Fresnel number, that is, intracavity aperture, is illustrated in Fig. 5.10. Inthis figure, the diffraction losses in a confocal resonator for a number of low-ordermodes are plotted versus the Fresnel number. For N = 1, only the TEM00 and theTEM01 modes have a power loss per transit of less than 1% per pass. All othermodes have losses above 10%. A laser with this resonator would emit on onlythese two modes if the gain per pass were less than 10%. Single-mode emissionwould require a slightly smaller aperture to reduce the value of N just under 1.Going in the other direction, if the aperture is increased by about a factor of 1.4in diameter to yield F = 2, then 10 modes from TEM00 to TEM05 have less than1% loss per transit. This resonator would clearly have a multimode output.
5.1.7 Active Resonator
So far we have discussed the modes in a passive resonator consisting of a pair ofmirrors. Introducing an active element into the resonator, such as a laser crystal,in addition to altering the optical length of the cavity, will perturb the mode con-figuration. In solid-state lasers the governing mechanisms that distort the modestructure in the resonator are the thermal effects of the laser rod. As will be dis-cussed in more detail in Chapter 7, optical pumping leads to a radial temperaturegradient in the laser rod. As a result, in cw and high average power systems, therod is acting like a distributed positive thick lens with an effective focal length f ,which is inversely proportional to the pump power.
The theory necessary to analyze resonators that contain optical elements otherthan the end mirrors has been developed by Kogelnik [12]. We will apply thistheory to the case of a resonator containing an internal thin lens. To a first approx-imation, this lens can be thought of as representing the thermal lensing introducedby the laser rod.
Beam properties of resonators containing internal optical elements are de-scribed in terms of an equivalent resonator composed of only two mirrors. Thepertinent parameters of a resonator equivalent to one with an internal thin lens are
g1 = 1 − L2
f− L0
R1; g2 = 1 − L1
f− L0
R2, (5.28)
where L0 = L1 + L2 − (L1L2/ f ) and f is the focal length of the internal lens;L1 and L2 are the spacings between mirrors M1, M2 and the lens, as shown inFig. 5.11(a).

5.1. Transverse Modes 165
FIGURE 5.10. Diffraction loss for various resonator modes as a function of the Fresnelnumber [11].
In any resonator, the TEM00 mode spot size at one mirror can be expressed asa function of the resonator parameters
w21 = λL
π
(g2
g1(1 − g1g2)
)1/2
. (5.29)

166 5. Optical Resonator
FIGURE 5.11. (a) Geometry and (b) stability diagram of a resonator containing a thinpositive lens.
The ratio of the spot sizes at the two mirrors is
w21
w22
= g2
g1. (5.30)
The stability condition (5.20) remains unchanged.As an example we will consider a resonator with flat mirrors (R1 = R2 = ∞)
and a thin lens in the center (L1 = L2 = L/2). From (5.28) and (5.29) we obtain
g = g1 = g2 = 1 − L
2 f, w2
1 = w22 =
(λL
π
)(1 − g2)−1/2. (5.31)
For f = ∞ the resonator configuration is plane-parallel; for f = L/2 we obtainthe equivalent of a confocal resonator; and for f = L/4 the resonator correspondsto a concentric configuration.
The mode size in the resonator will grow to infinity as the mirror separationapproaches four times the focal length of the laser rod. Figure 5.11(b) shows thelocation of a plane-parallel resonator with an internal lens of variable focal lengthin the stability diagram.
5.1.8 Mode-Selecting Techniques
If the transverse dimension of the gain region of a laser material is larger than theTEM00 mode dimension, an oscillator will lase at several modes.

5.1. Transverse Modes 167
Many applications of solid-state lasers require operation of the laser at theTEM00 mode since this mode produces the smallest beam divergence, the highestpower density, and, hence, the highest brightness.
For side-pumped lasers output at the fundamental mode usually requires the in-sertion of an aperture in the resonator to prevent oscillation of higher order modes.The pumped volume of the active material is therefore considerably larger thanthe TEM00 mode volume. The poor utilization of the stored energy in the activemedium leads to a poor overall efficiency. A large amount of research has beendevoted to the design of optical resonator configurations, which maximize energyextraction from solid-state lasers at the TEM00 mode. One finds that a resonatordesigned for TEM00 mode operation will represent a compromise between theconflicting goals of large mode radius, insensitivity to perturbation, good modediscrimination, and compact resonator length. One obvious solution to increasethe TEM00 mode volume is to make the resonator as long as physical constraintspermit, since for a given Fresnel number, the mode cross-sectional area increasesproportional with length. Another approach is to utilize resonators, such as theconcentric and hemispherical configuration shown in Fig. 5.7. These resonators,due to their focusing action, support large mode size differences along the axis.
For example, in a hemispherical cavity the spot size in the limit can theoreti-cally become zero at the flat mirror and grow to infinity for L = R. Location ofthe laser rod close to the curved mirror permits utilization of a large active volume.An example of this type of resonator is indicated in Fig. 5.12. Mode selection inthis resonator, which was employed in a cw Nd : YAG laser, is achieved by axiallymoving the laser rod until it becomes the limiting aperture for TEM00 operation.
Resonators with strong internal focusing suffer from several disadvantageswhich make them unattractive for most applications. In particular, since it isnecessary to operate quite close to the edge of the optically stable region, theconfigurations are extremely sensitive to mechanical and optical perturbations.
When designing a resonator for large mode size it is very important to con-sider sensitivity to optical and mechanical perturbations such as the pump-power-dependent thermal lensing in the laser medium and misalignment of the resonatormirrors. We note from (5.28)–(5.30) that for a resonator to have low sensitivityto axial perturbations, for example, caused by thermal lensing, it is necessary that
FIGURE 5.12. Focusing resonator geometry [13].

168 5. Optical Resonator
FIGURE 5.13. Convex–concave resonator containing (a) a laser rod and (b) an equivalentpassive resonator [14].
dw1/d f = 0. This condition is met for a resonator configuration, which satisfiesthe condition [14]
g1g2 = 0.5. (5.32)
Equation (5.32) represents a hyperbola located in the middle of the shaded areasof Fig. 5.8. Note from (5.29) that large spot sizes w1 are obtained for resonatorswith large g2 values. From (5.21) it follows that in order for g2 > 1, the radius ofcurvature of mirror R2 has to become negative, which indicates a convex mirroraccording to our labeling conventions. Optical resonators with one convex andone concave mirror in close proximity to the laser medium represent a good com-promise for achieving a large mode volume, low sensitivity to perturbation, and acompact design.
As an example we will calculate the parameters for a concave–convex resonatorthat has been used for a high-repetition-rate Nd : YAG laser (Fig. 5.13(a)). Thelaser rod, with a diameter of 5 mm, was measured to have a focal length of 6 mfor a particular input. The optical length of the cavity was restricted to 0.8 m. Theoptimum value of w1 has been found empirically to be equal to one-half the laserrod radius. With the rod as close as possible to the output mirror, the followingdesign parameters are obtained for the equivalent resonator (Fig. 5.13(b)):
w1 = 1.25 mm, f = 6 m, L1 = 0.1 m, L2 = 0.7 m.
Introducing the stability criterion g1g2 = 0.5 into (5.29) yields an expression forthe mode size as a function of g1,

5.2. Longitudinal Modes 169
w1 =(λL
πg1
)1/2
. (5.33)
Introducing the values for L andw1 into this equation, one obtains g1 = 0.16 and,from (5.32), g2 = 3.12. From (5.28) it follows that R1 = 1.1 m, R2 = −0.36 m;and from (5.30) we obtain w2 = 0.28 mm. The mirror M1 and the rod surface canbe combined by grinding a curvature R′
1 = n R1 onto the end of the rod.As we have seen in side-pumped lasers, expansion of the TEM00 mode in com-
bination with an intracavity aperture and operation of the resonator in a region thatis less sensitive to perturbation are usually the options available for fundamentalmode operation.
In the end-pumped lasers discussed in Sections 3.6.3, 6.2.3, and 7.3 a mostelegant solution to the problem of mode selection can be implemented, namelyspatial matching between the pump source beam and the resonator TEM00 mode.Because the beam characteristics of diode lasers allow for tight focusing of theiroutput radiation into the active material, a near perfect overlap between the pumpor gain region and the TEM00 mode volume can be achieved. Typically, the pumpbeam and resonator axis are oriented collinear within the active material. Thisway highly efficient TEM00 mode operation can be achieved.
The equations provided in this chapter for the design of laser resonators areusually sufficient to characterize the most common configurations. Complicatedresonator structures containing many optical elements can be evaluated with theaid of ABCD ray transfer matrices or by means of the Jones calculus if the stateof polarization is critical.
The ABCD law based on geometrical optics allows us to trace paraxial raysthrough a complicated sequence of lenslike elements. Each element is character-ized by its ABCD matrix, and the transfer function of the whole system is obtainedby multiplying all the matrices [4].
If a resonator contains a number of optical elements that change the polarizationof the beam, such as waveplates, porro prisms, corner cube reflectors, birefringentcrystals, and so forth, the Jones calculus provides a powerful method for the eval-uation of such a resonator [15]. The Jones calculus is a 2 × 2 matrix methodin which the state of polarization is represented by a two-component vector andeach optical element is represented by a 2×2 matrix. The polarization state of thetransmitted beam is computed by multiplying all the matrices. The overall matrixis then multiplied with the vector representing the input beam.
5.2 Longitudinal Modes
5.2.1 The Fabry–Perot Interferometer
The Fabry–Perot interferometer is based on multiple reflections between twoplane and parallel surfaces. A basic understanding of its characteristics is impor-tant because the laser resonator is closely related to the Fabry–Perot interferome-

170 5. Optical Resonator
FIGURE 5.14. Interference of a plane wave in a plane-parallel plate.
ter, and the device is also used for longitudinal mode control, and as an instrumentto measure line width. We will first consider a particularly simple version of theFabry–Perot interferometer, called an etalon, which consists of a solid plate withplane and parallel surfaces (see Fig. 5.14).
Multiple reflections which occur between the surfaces cause individual com-ponents of the wave to interfere at M1 and M2. Constructive interference occursat M2 if all components leaving M2 add in phase. For such preferred directions,the components reflected from M1 destructively interfere and all the incidentenergy is transmitted by the etalon. For each member of either the reflected orthe transmitted set of waves, the phase of the wave function differs from that ofthe preceding member by an amount which corresponds to a double traversalof the plate. This phase difference is
ϕ =(
2π
λ
)2n0d cos�, (5.34)
where n0d is the optical thickness between the two reflecting surfaces, � =�′/n0 is the beam angle in the material, and λ is the wavelength. The transmis-sion of the Fabry–Perot resonator is
T =[
1 + 4R′
(1 − R′)2sin2
(ϕ2
)]−1
, (5.35)
where R′ is the reflectivity of each of the two surfaces. The maximum value ofthe transmission, Tmax = 1, occurs when the path length differences between thetransmitted beams are multiple numbers of the wavelength
2n0d cos� = mλ, m = 1, 2, 3, . . . . (5.36)
The reflectivity of the resonator can be expressed by
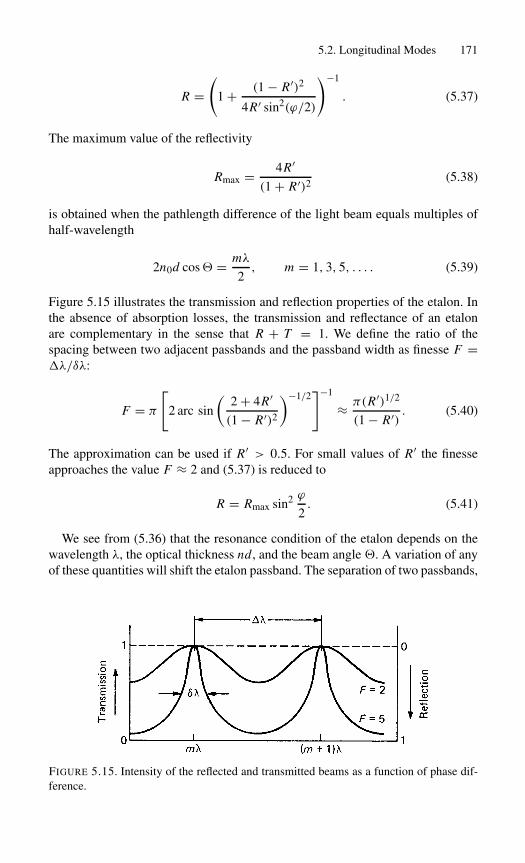
5.2. Longitudinal Modes 171
R =(
1 + (1 − R′)2
4R′ sin2(ϕ/2)
)−1
. (5.37)
The maximum value of the reflectivity
Rmax = 4R′
(1 + R′)2(5.38)
is obtained when the pathlength difference of the light beam equals multiples ofhalf-wavelength
2n0d cos� = mλ
2, m = 1, 3, 5, . . . . (5.39)
Figure 5.15 illustrates the transmission and reflection properties of the etalon. Inthe absence of absorption losses, the transmission and reflectance of an etalonare complementary in the sense that R + T = 1. We define the ratio of thespacing between two adjacent passbands and the passband width as finesse F =�λ/δλ:
F = π
[2 arc sin
(2 + 4R′
(1 − R′)2
)−1/2]−1
≈ π(R′)1/2
(1 − R′). (5.40)
The approximation can be used if R′ > 0.5. For small values of R′ the finesseapproaches the value F ≈ 2 and (5.37) is reduced to
R = Rmax sin2 ϕ
2. (5.41)
We see from (5.36) that the resonance condition of the etalon depends on thewavelength λ, the optical thickness nd, and the beam angle �. A variation of anyof these quantities will shift the etalon passband. The separation of two passbands,
FIGURE 5.15. Intensity of the reflected and transmitted beams as a function of phase dif-ference.

172 5. Optical Resonator
called the free spectral range, is given by
�λ = λ20
2n0d cos�or �ν = c
2n0d cos�. (5.42)
5.2.2 Laser Resonator
The spectral output from a laser is determined by the gain-bandwidth of the activematerial and the properties of the Fabry–Perot-type resonator. Typically, many re-flectivity peaks of the resonator are within the spectral width of the laser materialleading to many longitudinal modes. According to (5.42) the separation of thelongitudinal modes in a laser cavity is given by
�λ = λ20
2Lor �ν = c
2L, (5.43)
where L is the optical length of the resonator. For a resonator with L = 50 cm,adjacent longitudinal modes are separated by �ν = 300 MHz. For example,Nd : YAG lasers have a fluorescence linewidth of 120 GHz, and depending onthe threshold and pump strength the gain–bandwidth is on the order of 12 GHz.Therefore, about 40 longitudinal modes can oscillate within the resonator de-scribed above.
If the reflectivities of the two surfaces of a resonator are different, as in a lasercavity, the reflectivity R′ in (5.40) is the geometric mean reflectivity of the twomirrors: R′ = (R1 R2)
1/2. Typical values for a laser cavity are R1 = 0.8 andR2 = 1.0 and a resonator length of 50 cm. Introducing these numbers into (5.40),(5.43), one obtains F = 26.5 and δν = 11.3 MHz for the finesse and the spectralwidth of the empty resonator (Fig. 5.16).
In the presence of several transverse modes, additional resonant frequenciesoccur in the laser cavity. The frequency separation of different TEMplq modes ina laser resonator is given by [4]
q q+1 q+2
TEM00q
300 MHz
11.3 MHz
FIGURE 5.16. Longitudinal modes in an empty resonator composed of an 80% and a 100%reflective mirror separated by 50 cm.
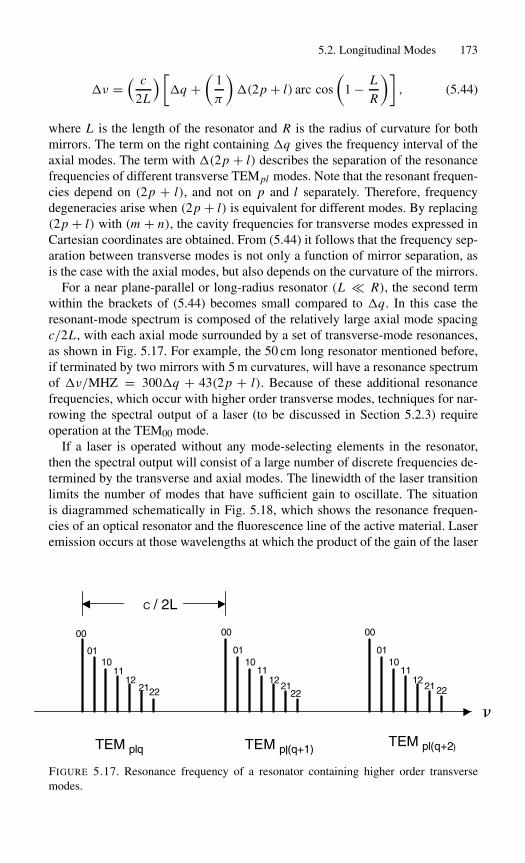
5.2. Longitudinal Modes 173
�ν =( c
2L
) [�q +
(1
π
)�(2p + l) arc cos
(1 − L
R
)], (5.44)
where L is the length of the resonator and R is the radius of curvature for bothmirrors. The term on the right containing �q gives the frequency interval of theaxial modes. The term with �(2p + l) describes the separation of the resonancefrequencies of different transverse TEMpl modes. Note that the resonant frequen-cies depend on (2p + l), and not on p and l separately. Therefore, frequencydegeneracies arise when (2p + l) is equivalent for different modes. By replacing(2p + l) with (m + n), the cavity frequencies for transverse modes expressed inCartesian coordinates are obtained. From (5.44) it follows that the frequency sep-aration between transverse modes is not only a function of mirror separation, asis the case with the axial modes, but also depends on the curvature of the mirrors.
For a near plane-parallel or long-radius resonator (L � R), the second termwithin the brackets of (5.44) becomes small compared to �q. In this case theresonant-mode spectrum is composed of the relatively large axial mode spacingc/2L , with each axial mode surrounded by a set of transverse-mode resonances,as shown in Fig. 5.17. For example, the 50 cm long resonator mentioned before,if terminated by two mirrors with 5 m curvatures, will have a resonance spectrumof �ν/MHZ = 300�q + 43(2p + l). Because of these additional resonancefrequencies, which occur with higher order transverse modes, techniques for nar-rowing the spectral output of a laser (to be discussed in Section 5.2.3) requireoperation at the TEM00 mode.
If a laser is operated without any mode-selecting elements in the resonator,then the spectral output will consist of a large number of discrete frequencies de-termined by the transverse and axial modes. The linewidth of the laser transitionlimits the number of modes that have sufficient gain to oscillate. The situationis diagrammed schematically in Fig. 5.18, which shows the resonance frequen-cies of an optical resonator and the fluorescence line of the active material. Laseremission occurs at those wavelengths at which the product of the gain of the laser
00
0110
1112
2122
�
TEM plq TEM pl(q+1)TEM pl(q+2)
C / 2L
00
0110
1112
2122
00
0110
1112
2122
FIGURE 5.17. Resonance frequency of a resonator containing higher order transversemodes.
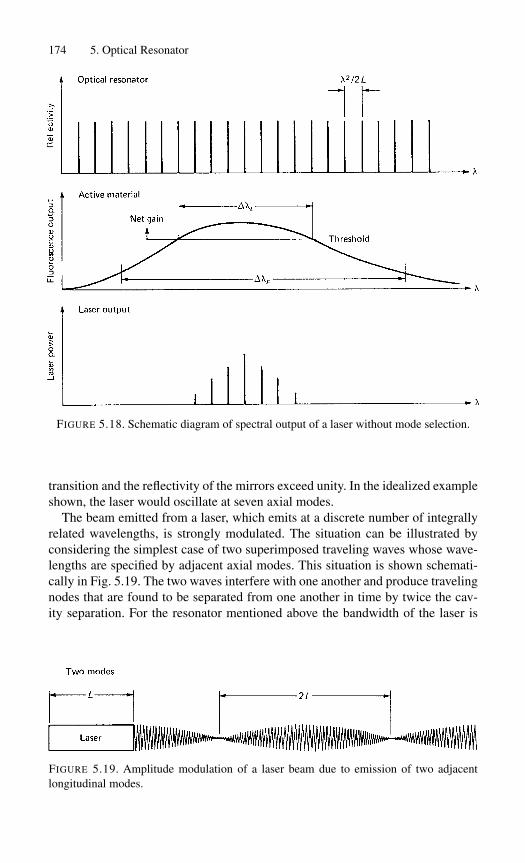
174 5. Optical Resonator
FIGURE 5.18. Schematic diagram of spectral output of a laser without mode selection.
transition and the reflectivity of the mirrors exceed unity. In the idealized exampleshown, the laser would oscillate at seven axial modes.
The beam emitted from a laser, which emits at a discrete number of integrallyrelated wavelengths, is strongly modulated. The situation can be illustrated byconsidering the simplest case of two superimposed traveling waves whose wave-lengths are specified by adjacent axial modes. This situation is shown schemati-cally in Fig. 5.19. The two waves interfere with one another and produce travelingnodes that are found to be separated from one another in time by twice the cav-ity separation. For the resonator mentioned above the bandwidth of the laser is
FIGURE 5.19. Amplitude modulation of a laser beam due to emission of two adjacentlongitudinal modes.
5.2. Longitudinal Modes 175
�ν = 300 MHz and the coherence length, if defined by
lc = c/2π�ν, (5.45)
has a value of lc = 16 cm.
5.2.3 Longitudinal Mode Control
In contrast to transverse mode control, which is important for most laser appli-cations, control of the longitudinal modes is generally only required for lasersemployed in interferometric applications, coherent lidar, or holographic systems.A reduction of longitudinal modes can be achieved by insertion of a tilted etaloninto the resonator. This will cause a strong amplitude modulation of the closelyspaced reflectivity peaks of the basic laser resonator, and thereby prevent mostmodes from reaching threshold.
The etalon is inserted at a small angle in the laser resonator. The tilt effectivelydecouples the internal transmission etalon from the resonator; that is, no otherresonances will be formed with other surfaces in the main resonator. If the etalonis sufficiently misaligned, it acts simply as a bandpass transmission filter. Thetilted etalon has no reflection loss for frequencies corresponding to its Fabry–Perot transmission maxima. At other frequencies the reflections from this modeselector are lost from the cavity, and thus constitute a frequency-dependent lossmechanism. The transmission maxima can be tuned into the central region of thegain curve by changing the tilt angle.
The transmission peaks of an etalon with index of refraction n = 1.5 and thick-ness d = 1 cm are separated by 10 GHz according to (5.42). If, for example, theetalon has a finesse of F = 10, the spectral width is 1 GHz, which is considerablynarrower than the 12 GHz gain-bandwidth of a typical Nd : YAG laser. The laseroutput will be composed of longitudinal modes, which fall inside the transmis-sion band of the etalon, hence a narrowing of the laser linewidth is observed. Inpulsed lasers longitudinal mode selection can be enhanced by a passive Q-switch.Longitudinal-mode selection in the laser takes place while the pulse is buildingup from noise. During this buildup time, modes that have a higher gain or a lowerloss will increase in amplitude more rapidly than the other modes. Besides differ-ences in gain or losses between the modes, there is one other important parameterwhich determines the spectral output of the laser. This parameter is the number ofround trips it takes for the pulse to build up from noise. The difference in ampli-tude between two modes becomes larger if the number of round trips is increased.Therefore, for a given loss difference between the modes it is important for goodmode selection to allow as many round trips as possible.
Since a passive Q-switch requires more round trips for the development of apulse, as compared to a Pockels cell Q-switch, the former has better mode selec-tion properties. While the above-mentioned techniques will narrow the line widthof a laser, reliable single longitude mode output can only be achieved from alaser which meets the following design criteria: a very short resonator such that

176 5. Optical Resonator
FIGURE 5.20. Design of a monolithic ring Nd :YAG laser [16].
the axial modes are spread so far apart that only one mode has sufficient gain;elimination of spatial hole burning caused by the standing wave pattern in theresonator; mechanical stability of the resonator elements; and a stable, low-noisepump source. These desirable features are combined, for example, in the diode-pumped, monolithic ring laser illustrated in Fig. 5.20.
The laser resonator is only a few millimeters long, therefore axial modes arespaced sufficiently far apart for axial mode control. The ring laser configurationavoids spatial hole burning, and end-pumping provides a small gain volume forefficient and stable TEM00 mode operation. Furthermore, the monolithic designassures good mechanical stability of the resonator. Spatial hole burning is a de-scriptive term for the fact that, along the axis of the resonator, “holes” in theinversion are burnt as a result of the standing wave nature of the mode. The fixednodal planes on the other hand represent regions of untapped inversion which willpreferentially contribute gain to other modes leading to mode-hopping. The ten-dency of a laser for mode-hopping can be eliminated by providing relative motion
5.2. Longitudinal Modes 177
between the atoms in the active material and the electric field of the resonator.This task can be accomplished with a traveling wave ring structure.
The oscillators that we have discussed so far are characterized by standingwaves in the resonator. In an oscillator consisting of a ring-like resonator utilizingthree or four mirrors and a nonreciprocal optical gate, a traveling wave can be gen-erated. The optical gate provides a high loss for one of the two countercirculatingtraveling waves. The wave with the high loss is suppressed, and unidirectionaloutput from the laser is obtained.
In a discrete element ring laser the unidirectional gate is formed by a Faradayrotator, a half-wave plate, and a polarizer. The Farady device rotates the planeof polarization by a small angle ±θ , the sign being dependent on the propagationdirection. The half-wave plate is oriented such that in one direction it compensatesfor the polarization rotation induced by the Faraday element. For this directionthe beam passes the polarizer without loss. In the opposite direction the beamexperiences a 2θ polarization rotation and suffers a loss at the polarizer.
The basic idea of a monolithic, diode-pumped unidirectional ring laser is toprovide the equivalent of a discrete element design. The polarizer, half-waveplate equivalent, and the Faraday rotator are all embodied in the nonplanar ringNd : YAG laser illustrated in Fig. 5.20. With a magnetic field H present in the di-rection shown, the YAG crystal itself acts as the Faraday rotator, the out-of-planetotal internal reflection bounced (labeled A and C) acts as the half-wave plate,and the output coupler (mirror D) acts as a partial polarizer. Polarization selec-tion results from nonnormal incidence at the dielectrically coated output mirror.
Such a device produces an extremely stable, narrow linewidth cw output of afew hundred milliwatts. For most applications the power must be increased byinjecting the output from this laser source into a large slave oscillator. Both theinjected single-mode radiation and spontaneous emission from the high-powerQ-switch slave laser will be regeneratively amplified in the slave cavity duringthe pulse buildup period. If the injected signal has enough power on a slave cav-ity resonance, the corresponding single axial mode will eventually saturate thehomogeneously broadened gain medium and prevent development of any otheraxial modes.
The linewidth of the output of a laser operated in a single axial mode is usuallymany orders of magnitude narrower than the linewidth of the empty or passive res-onator. The theoretical limit of the laser linewidth is determined by spontaneouslyemitted radiation which mixes with the wave already present in the resonator andproduces phase fluctuations. The photons in the resonator all correspond to in-phase waves except for the spontaneous emission, which occurs at the same fre-quency but with a random phase. It is this phase jitter that causes the finite laserlinewidth �νL which is given by the Schalow–Townes limit [17]
�νL = 2πhν(�νc)2
Pout, (5.46)
where �νc is the linewidth of the passive resonator, hν is the photon energy, andPout is the laser output.
178 5. Optical Resonator
The limit can also be expressed as
�νL = �νc
Nph(5.47)
which says that the theoretical minimum laser linewidth equals the linewidth ofthe empty resonator divided by the number of photons in the resonator. The aboveequation is derived if we note that the laser output power Pout equals the numberof photons Nph in the resonator times the energy per photon divided by the photonlifetime τc,
Pout = Nphhν
τc. (5.48)
Furthermore, from Chapter 3, we recall that in a resonator the loss mechanism,besides limiting the lifetime of the oscillation, causes a broadening of the reso-nance frequency. The width�ν of the resonance curve, at which the intensity hasfallen off to half the maximum value, is
�ν = (2πτc)−1. (5.49)
Introducing (5.48), (5.49) into (5.46) results in the expression (5.47).We will now calculate the fundamental linewidth limits for such a laser and
compare it with the values achieved in actual systems. The physical length of aminilaser is typically 5 mm and the refractive index is 1.82; therefore the opti-cal length of the resonator is 2L = 1.82 cm. The output coupling and internallosses for such a monolithic laser are δ + T = 0.01. These values result in alifetime of the photons in the resonator of τc = 6 ns or a linewidth of the emptyresonator of �νc = 26 MHz. The theoretical limit for the laser linewidth at atypical output power of 1 mW is, according to (5.46), �νL = 1 Hz. In practice,the laser linewidth is determined by temperature fluctuations and mechanical vi-brations and instabilities which produce rapid changes in frequency. For example,the temperature-tuning coefficient for a monolithic Nd : YAG laser operating at1064 nm is 3.1 GHz/◦ C. The major contribution is the temperature dependenceof the refractive index. The design of narrow linewidth laser oscillators requiresextremely good temperature control. A state-of-the-art diode-pumped monolithicNd : YAG laser has achieved a linewidth of 300 Hz during a 5 ms observation time,10 kHz in time intervals of 300 ms, and the laser exhibited a long-term drift of300 kHz/min [18].
5.3 Unstable Resonators
As was discussed in Section 5.1, in a stable resonator the radiation is confined be-tween the surfaces of the resonator mirrors and do not walk out past their edges.In order to produce a diffraction-limited output beam from a stable resonator, theFresnel number must be on the order of unity or smaller (Section 5.1.5), other-

5.3. Unstable Resonators 179
wise sufficient discrimination against higher-order modes cannot be achieved. Forpractical resonator lengths, this usually limits the diameter of the TEM00 mode toa few millimeters or less.
If the resonator parameters g1 and g2 lie outside the shaded regions defined inFig. 5.8, one obtains an unstable resonator. In these configurations, the beam isno longer confined between the mirrors. A beam in an “unconfining” or unstableresonator diverges away from the axis, as shown in Fig. 5.21, eventually radiationwill spill around the edges of one or both mirrors. This fact can, however, be usedto advantage if these walk-off losses are turned into useful output coupling.
The most useful property of an unstable resonator is the attainment of a largefundamental mode volume and good spatial mode selection at high Fresnel num-bers. In other words, unstable resonators can produce output beams of low di-vergence in a short resonator structure that has a large cross section. Whether anunstable resonator has an advantage over a stable resonator for a particular sys-tem depends on the gain of the laser, since gain, mode volume, and sensitivity tomisalignment are closely related in unstable resonators. Generally speaking, onlyin a high-gain laser can a large mode size be realized in an unstable resonator ata reasonable misalignment tolerance. Besides the issue of alignment stability, thecost and difficulty of fabrication of the output coupler is another consideration.
The unstable resonator first described by Siegman [19]–[21] has been studiedextensively for applications in high-energy chemical and gas dynamic lasers. Themost useful form of an unstable resonator is the confocal unstable resonator. Aprimary advantage of this configuration is that it automatically produces a colli-mated output beam.
Confocal configurations can be divided into positive-branch resonators that cor-respond to the case g1g2 > 1, and negative-branch resonators for which g1g2 < 0.Confocal unstable resonators of the positive or negative branches are shown inFig. 5.22. These configurations are defined by the following relationships:
2L = R1 + R2 (5.50)
or
L = f1 + f2,
FIGURE 5.21. Light ray in an unstable resonator.

180 5. Optical Resonator
FIGURE 5.22. Positive- and negative-branch confocal unstable resonators.
where L is the optical length of the resonator and R1, R2, f1, f2 are the radii andfocal lengths of the two mirrors, respectively. For concave mirrors, the sign for Rand f is positive and for convex mirrors it is negative.
The confocal positive-branch unstable resonator is the most widely used formof the unstable resonator for solid-state lasers because it does not have an intra-cavity focal point that could lead to air breakdown or could cause damage tooptical components.
Referring to Fig. 5.22 the annular output beam has an outer diameter of D0 andinner diameter D, where D is also the diameter of the output coupler.
The resonator magnification
m = D0/D (5.51)
is the amount that the feedback beam is magnified when it travels one round tripin the resonator and becomes the output beam.
The magnification in the transverse beam dimensions results in a decrease ofintensity by a factor 1/m2 in each round trip, and radiation spilling out around theedges of the output mirror. A beam that is just contained within the mirrors will,after one round trip, lose a fraction T of its energy.
The geometrical output coupling is related to the magnification by
T = 1 − 1
m2. (5.52)
If we insert a gain medium between the mirrors, the loss in energy has to be madeup by the gain of the laser. According to the laser threshold condition (3.7), weobtain
2gl = δ + ln m2. (5.53)
Ignoring internal resonator losses δ for a moment, the round-trip gain of the laserhas to be
G = exp(2gl) ≥ m2. (5.54)
For a confocal resonator, the mirror radii are given by

5.3. Unstable Resonators 181
R1 = −2L
m − 1, and R2 = 2mL
m − 1, (5.55)
where L is the length of the resonator and R1 and R2 are the output and back-cavity mirror curvatures. Note that the output mirror has a negative curvature andthus is convex, while the high-reflectivity mirror has positive curvature and isconcave.
Actually, the relationship between m and the output coupling T for confocalunstable resonators is such that T is less than the geometrically predicted value(1 − 1/m2). This is because the intensity distribution, according to wave optics,tends to be more concentrated toward the beam axis than that predicted by geo-metrical optics.
The equivalent Fresnel number of a resonator characterizes the destructive orconstructive interference of the mode at the center of the feedback mirror due tothe outcoupling aperture. For a positive-branch, confocal resonator, the equivalentFresnel number is
Neq = (m − 1)(D0/2)2
2Lλ, (5.56)
where D0 is the diameter of the output mirror and L is the resonator length. Plotsof the mode eigenvalue magnitudes versus Neq show local maxima near half-integer Neq’s.
Physically, the half-integer equivalent Fresnel numbers correspond to Fresneldiffraction peaks centered on the output coupler which leads to increased feed-back into the resonator. Resonators should be designed to operate at half-integerequivalent Fresnel numbers (Neq) to obtain best mode selectivity.
As a final step one has to take into account the effect of the focal length fof the active medium. One usually chooses an available mirror curvature R andcalculates the rod focal length at the desired lamp input power required to achievean effective mirror curvature Reff. If the mirror to rod distance is less than the rodfocal length, then
1
f+ 1
Reff= 1
R. (5.57)
Essentially the focusing effect of the laser rod is compensated for by increasingthe radius of curvature of the mirror.
The design of such a resonator is an iterative process. It starts with some knowl-edge of the optimum output coupling T or the saturated gain coefficient g obtainedfrom operating the laser with a stable resonator. From either of these two param-eters, we obtain from (5.52) or (5.53) the magnification m. Selecting a value of0.5, 1.5, 2.5, . . . for Neq from (5.56) provides a relationship between D0 and L .With (5.50), (5.51), (5.55) the pertinent resonator design parameters such as D,D0, L , R1, and R2 can be calculated. The effect of thermal lensing is then ac-counted for by adjusting the radius of curvature according to (5.57). There are

182 5. Optical Resonator
FIGURE 5.23. Small mirror out-coupling scheme in a confocal, positive branch unstableresonator.
basically two types of output couplers possible with solid-state lasers, the dotmirror and the radially variable reflectivity mirror.
The design depicted in Fig. 5.23 consists of a concave mirror M1 and a convexoutput mirror M2, both of which are totally reflecting. The dot mirror M2 is asmall circular dielectrically coated area of radius d centered on a glass substrate.The disadvantage of a dot mirror, namely the generation of an annular outputbeam containing diffraction rings and a hot spot in the center, can be eliminatedby employing a partially transparent output coupler with a radially variable re-flectivity profile. In such a mirror, reflectivity decreases radially from a peak inthe center down to zero over a distance comparable to the diameter of the laserrod. The output is a smooth Gaussian-shaped beam. Design procedures for suchmirrors are described in [22], [23].
Illustrated in Fig. 5.24 is a diode-pumped Nd : YAG slab laser with a positive-branch, confocal unstable resonator in a folded configuration. The output coupleris a dielectrically coated mirror with a variable reflectivity profile. The resonatorin Fig. 5.24 has a magnification M = 1.38 and a cavity length of 58 cm. The lasergenerated 100 mJ of Q-switched output at a repetition rate of 100 Hz with a neardiffraction limited beam.
FIGURE 5.24. Diode-pumped Nd : YAG slab laser with positive branch unstable resonatorand variable reflectivity output coupler [24].

Summary 183
Summary
In this chapter, the definition and characteristics of transverse and longitudinalmodes of optical resonators are reviewed, and mode-selecting techniques as wellas typical resonator configurations are discussed.
In resonators employed in microwave technology the cavity is totally enclosedand the dimensions are on the order of the wavelength. By virtue of the direc-tional properties of light, a structure formed by two mirrors facing one anothercan sustain high Q-resonances and therefore constitutes a resonator in spite of thefact that it is an open structure. In an optical resonator the mirror size and the sep-aration of the mirrors are very large compared to the wavelength. The modes ofan open passive resonator are eigenfunctions of an integral equation that dependon the shape and spacing of the mirrors and on the beam diameter. The gain pro-vided by the active material compensates for the resonator losses. The oscillatorwill lase at those modes that have the smallest losses.
Transverse modes determine beam divergence and power distribution withinthe cross section of the beam. The number of longitudinal modes that are oscillat-ing in a resonator are responsible for the spectral line width of the output beam.The smallest beam divergence is obtained if the resonator is operated in the lowesttransverse mode. Single transverse mode operation is obtained by restricting thelateral extent of the beam inside the resonator. This is usually associated with autilization of a smaller active volume of the laser material and therefore leads toa reduction in output power. Since virtually all laser applications benefit from alow beam divergence, many ingenious concepts and designs have been developedto achieve maximum output at the TEM00 mode.
In applications requiring a narrow line width from the laser the number of lon-gitudinal modes having sufficient gain to oscillate has to be restricted to just asingle mode. This can be achieved by shortening the resonator (and thereby alsothe active material) to a point where the modes are spaced so far apart that onlyone mode has sufficient gain to oscillate. From these considerations it becomesclear that single transverse and longitudinal mode lasers have a very small vol-ume.
Unstable resonators, also discussed in this chapter, are resonators where theg1g2 product falls outside the range 0 < g1g2 < 1. The modes are not confinedin the transverse direction, and the size is determined by some limiting aperturein the system.
References[1] A.G. Fox and T. Li: Bell Syst. Tech. J. 40, 453 (1961).
[2] G.D. Boyd and J.P. Gordon: Bell Syst. Tech. J. 40, 489 (1961).
[3] G.D. Boyd and H. Kogelnik: Bell Syst. Tech. J. 41, 1347 (1962).
[4] H. Kogelnik and T. Li: Appl. Opt. 5, 1550 (1966); see also Proc. IEEE 54, 1312(1966).

184 5. Optical Resonator
[5] H. Kogelnik: in Lasers I (edited by A.K. Levine), (Dekker, New York), 1966,pp. 295–347.
[6] J.S. Kruger: Electro-Opt. Syst. Designs 12 (September 1972).
[7] R.J. Freiberg and A.S. Halsted: Appl. Opt. 8, 335 (1969).
[8] T. Li: Bell Syst. Tech. J. 44, 917 (1965).
[9] R. Phillips and L. Andrews: Appl. Opt. 22, 643 (1983).
[10] W.H. Carter: Appl. Opt. 19, 1027 (1980).
[11] D.E. McCumber: Bell Syst. Tech. J. 44, 333 (1965).
[12] H. Kogelnik: Bell Syst. Tech. J. 44, 455 (1965).
[13] J.E. Geusic, H.J. Levingstein, S. Singh, R.C. Smith, and L.G. Van Uitert: Appl. Phys.Lett. 12, 306 (1968).
[14] H. Steffen, J.P. Lortscher, and G. Herziger: IEEE J. Quantum Electron. QE-8, 239(1972).
[15] A. Yariv: Optical Electronics, 4th ed. (Holt, Rinehart and Winston, Orlando, FL),1991.
[16] T.J. Kane and R.L. Byer: Opt. Lett. 10, 65 (1985).
[17] A. Yariv: Quantum Electronics, 3rd ed. (Wiley, New York), 1988, Sect. 21.1.
[18] B. Zhou, T.J. Kane, G.J. Dixon, and R.L. Byer: Opt. Lett. 10, 62 (1985).
[19] A.E. Siegman: Proc. IEEE 53, 227 (1965).
[20] A.E. Siegman and E. Arrathon: IEEE J. Quantum Electron. QE-3, 156 (1967).
[21] A.E. Siegman: Appl. Opt. 13, 353 (1974); see also Lasers (University Science Books,Mill Valley, CA), 1986.
[22] N. McCarthy and P. Lavigne: Appl. Opt. 22, 2704–2708 (1983).
[23] N. McCarthy and P. Lavigne: Appl. Opt. 23, 3845–3850 (1984).
[24] E. Armandillo, C. Norrie, A. Cosentino, P. Laporta, P. Wazen, and P. Maine: Opt.Lett. 22, 1168 (1997).
Exercises
1. When you work in modern optics you often have to find the values of theelectric field amplitude in a beam of laser light. In the laboratory your instru-ments do not measure this directly. When working with a pulsed laser (e.g., aQ-switched solid-state laser) your instruments allow you to measure the totalenergy in the pulse, the temporal waveform of the pulse, and the spatial dis-tribution of the beam. The first is done with what is essentially a calibratedabsorber that determines the change in temperature of the absorber and com-putes the energy that was absorbed. With knowledge of the absorbance of thesurface of the absorber the instrument can read out the number of joules of en-ergy that struck it. Pulse waveform is measured with a fast photodetector andan oscilloscope where both are selected to have enough bandwidth to assureaccurate waveform determination. The beam’s spatial properties are measuredwith an imaging camera (e.g., a CCD camera) and electronics and softwarethat display the intensity as a function of position normal to the beam axis ona computer screen.

Exercises 185
Now suppose you are in the laboratory using these instruments and youmeasure an energy, U , a pulse duration (the duration as defined by the pulsefull width at half-maximum, FWHM) of τp, and the beam spatial distribution.The latter is determined to be the lowest order Gaussian distribution with a fullwidth at 1/e of the maximum intensity of w. Use the definitions of terms inSection 5.1.2 and your knowledge of the definition of intensity to calculate thevalue of the electric field on axis in terms of your measured quantities. Useproper units so that you give your answer in volts/m. (Hint: You might want torefer to an electricity and magnetism text to refresh yourself on the definitionof the Poynting vector and to get the units straight.)
2. Is the resonator shown below stable or unstable for Gaussian mode propaga-tion?
L
R1 R2
Here L = 100 cm, R1 = 1000 cm, R2 = −1000 cm, and the laser wave-length λ = 1µm. If it is stable, locate the beam waist and find the beam radii ateach mirror. Where would you put the laser rod in this resonator to maximallyfill it, the gain medium, with the lowest order Gaussian mode?
3. Consider the laser shown below:
d 1 2
L
In this laser L is the length of the resonator; d = 10 cm is the length ofthe gain medium that has index of refraction of 1.8; the surfaces of the gainmedium are antireflection coated so they do not contribute to cavity losses;mirror 1 has reflectivity of 98% and is flat, and mirror 2 has reflectivity of 80%and radius of curvature, R2 = 100 cm. The laser wavelength is 1.06µm.(a) Find L such that this resonator is hemispherical and give the distances
between the ends of the centered rod and the mirrors.(b) What are g1 and g2 for the hemispherical resonator?(c) Find the mode size at each mirror and at each end of the laser rod in this
hemispherical resonator.(d) What is the frequency difference between two adjacent TEM00 modes?

186 5. Optical Resonator
(e) Find the frequency difference in megahertz between the TEM00q andTEM10q modes.
(f) What is the photon lifetime in this cavity?
(g) What is the minimum gain coefficient for this laser to oscillate?
(h) What gain coefficient would be needed if there were no antireflection coat-ings on the laser rod?
6
Optical Pump Systems
6.1 Pump Sources
6.2 Pump Radiation Transfer Methods
References
Exercises
An efficient pump system utilizes a radiation source having a spectral output thatclosely matches the absorption bands of the gain medium, transfers the radiationwith minimum losses from the source to the absorbing laser material, and createsan inversion which spatially matches the mode volume of the resonator mode. Inthis chapter we will review the most common pump sources and radiation trans-port systems employed in solid-state lasers.
6.1 Pump Sources
A number of different radiation sources have been employed over the years topump solid-state lasers; today only flashlamps, cw arc lamps, and laser diodesdepicted in Figs. 6.1 and 6.2 are of practical interest. Pump sources for solid-statelasers range in size and power from tiny laser diodes at the 1 W level, pumpinga microchip laser, to flashlamp-pumped lasers employed in inertial confinementfusion research, which occupy large buildings and provide tens of megajoules ofpump radiation.
6.1.1 Flashlamps
Lamp Design and Construction
Flashlamps used for laser pumping are essentially long arc devices designed sothat the plasma completely fills the tube. A flashlamp consists of a linear quartztube, two electrodes which are sealed into the envelope, and a gas fill. Standard
187

188 6. Optical Pump Systems
FIGURE 6.1. Outline drawing of (a) a flashlamp and (b) a cw krypton arc lamp and photo-graph of an arc lamp (c) with and (d) without cooling jacket.
FIGURE 6.2. Two-dimensional diode laser arrays. Stacked 1 cm bars (a) conduction-cooledand (b) internally water-cooled.
6.1. Pump Sources 189
linear lamps have wall thicknesses of 1 to 2 mm, bore diameters between 3 and19 mm, and lengths from 5 cm to 1 m.
Flashlamps are typically filled with gas at a fill pressure of 300 to 700 torrat room temperature. Xenon is generally chosen as the gas fill for flashlampsbecause it yields a higher radiation output for a given electrical input energy thanother gases. However, in a few special cases, such as small, low-energy lampsemployed to pump Nd : YAG lasers, the low-atomic-weight gas krypton providesa better spectral match to the absorption bands of Nd : YAG.
The anode in flashlamps consists of pure tungsten or often thoriated tungstenbecause the alloy is easier to machine. The cathode is comprised of a compressedpellet of porous tungsten impregnated with barium calcium aluminate. This pelletis attached onto a tungsten heat sink. The surface area of the tip must be largeenough to handle the peak current while the shape of the tip positions the arcduring the trigger pulse. During the lamp operation, barium is transported to thecathode surface where it forms a monolayer with a work function of about 2 eVversus 4.5 eV for pure tungsten. A lower work function improves electron emis-sion for a given temperature. For the same reason, a cathode material with a lowwork function makes it easier to trigger the lamp. Since in a standard lamp thecathode is more emissive than the anode, flashlamps are polarized and will passcurrent in only one direction without damage.
The envelope and the electrode-seal area of flashtubes are normally cooled byfree or forced air, water, or water-alcohol mixtures. Liquid cooling permits opera-tion of the lamps at a maximum inner-tube wall surface loading of 300 W/cm2 ofaverage power. Free-air convection cooling is limited to handling about 5 W/cm2
of dissipation; forcing air across the flashtube envelope increases this value up to40 W/cm2. Liquid-cooled linear flashlamps are available with outer quartz jackets,which permit cooling of the lamps with a highly turbulent flow.
Optical Characteristics. The radiation output of a gas discharge lamp is com-posed of several different components, each corresponding to a different light-emission mechanism. The relative importance of each of these mechanisms de-pends strongly on the current density in the lamp, and so the low- and high-poweroptical output spectra are markedly different. The total radiation is made up ofboth line and continuum components. The line radiation corresponds to discretetransitions between the bound energy states of the gas atoms and ions (bound–bound transitions). The continuum is made up primarily of recombination radia-tion from gas ions capturing electrons into bound states (free–bound transitions)and of bremsstrahlung radiation from electrons accelerated during collisions withions (free–free transitions). The spectral distribution of the emitted light dependsin complex ways on electron and ion densities and temperatures.
In the continuous-power, wall-stabilized noble gas arc, current densities aresuch that there is a high number of bound–bound transitions and therefore theradiation spectrum is characteristic of the fill gas and is broadened by increases inpressure.
In high current density, pulsed laser applications, the spectral output of the lampis dominated by continuum radiation, and the line structure is seen as a relatively
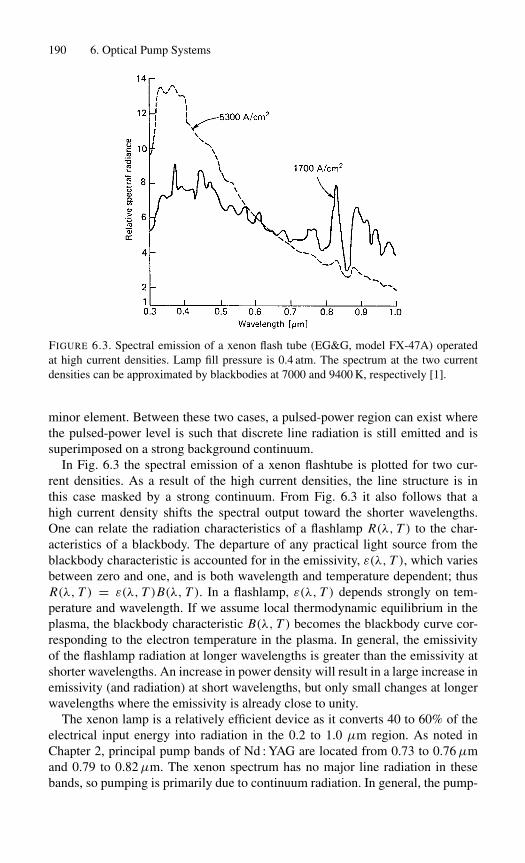
190 6. Optical Pump Systems
FIGURE 6.3. Spectral emission of a xenon flash tube (EG&G, model FX-47A) operatedat high current densities. Lamp fill pressure is 0.4 atm. The spectrum at the two currentdensities can be approximated by blackbodies at 7000 and 9400 K, respectively [1].
minor element. Between these two cases, a pulsed-power region can exist wherethe pulsed-power level is such that discrete line radiation is still emitted and issuperimposed on a strong background continuum.
In Fig. 6.3 the spectral emission of a xenon flashtube is plotted for two cur-rent densities. As a result of the high current densities, the line structure is inthis case masked by a strong continuum. From Fig. 6.3 it also follows that ahigh current density shifts the spectral output toward the shorter wavelengths.One can relate the radiation characteristics of a flashlamp R(λ, T ) to the char-acteristics of a blackbody. The departure of any practical light source from theblackbody characteristic is accounted for in the emissivity, ε(λ, T ), which variesbetween zero and one, and is both wavelength and temperature dependent; thusR(λ, T ) = ε(λ, T )B(λ, T ). In a flashlamp, ε(λ, T ) depends strongly on tem-perature and wavelength. If we assume local thermodynamic equilibrium in theplasma, the blackbody characteristic B(λ, T ) becomes the blackbody curve cor-responding to the electron temperature in the plasma. In general, the emissivityof the flashlamp radiation at longer wavelengths is greater than the emissivity atshorter wavelengths. An increase in power density will result in a large increase inemissivity (and radiation) at short wavelengths, but only small changes at longerwavelengths where the emissivity is already close to unity.
The xenon lamp is a relatively efficient device as it converts 40 to 60% of theelectrical input energy into radiation in the 0.2 to 1.0 µm region. As noted inChapter 2, principal pump bands of Nd : YAG are located from 0.73 to 0.76µmand 0.79 to 0.82µm. The xenon spectrum has no major line radiation in thesebands, so pumping is primarily due to continuum radiation. In general, the pump-
6.1. Pump Sources 191
ing efficiency of Nd : YAG increases as the pressure is increased. In the range 450to 3000 torr no maxima are found. The limitation to further increases appears to bethe fact that high-pressure lamps are difficult to trigger. The effect of an increasein gas fill pressure is to reduce the mean free path of the electrons and atoms inthe discharge, and thus to increase their collision frequency. This leads to the pro-duction of more excited species in the discharge and the emission of more usefulline radiation.
Electrical Characteristics. The impedance characteristics of a flashlamp deter-mine the efficiency with which energy is transferred from the capacitor bank tothe lamp. The impedance of the arc is a function of time and current density. Mosttriggering systems initiate the arc as a thin streamer which grows in diameter un-til it fills the whole tube. The expansion period is fast, of the order of 5 to 50µsfor tubes of bore diameter up to 1.3 cm. During the growth of the arc, lamp re-sistance is a decreasing function of time. The decreasing resistance arises in partfrom the increasing ionization of the gas and from the radial expansion of theplasma.
After the arc stabilizes in the high-current regime the voltage is proportional tothe square root of the current [1, 2]
V = K0i1/2, (6.1)
where the flashlamp impedance K0 depends on the arc length l and the bore di-ameter D of the flashlamp, and on the kind of gas and fill pressure p. For xenonthe following relation holds
K0 = 1.27( p
450
)0.2 l
D, (6.2)
where p is the flashlamp pressure in torr.
Tube Failure
The flashtube end-of-life can occur in either of two modes, and we can distinguishbetween catastrophic and nondestructive failures. The factors that contribute tocatastrophic failure are explosion of the walls due to the shock wave in the gaswhen the lamp is fired or overheating of the lamp envelope or seal and subsequentbreakage because of excessive thermal loading of the lamp. The first failure modeis a function of pulse energy and pulse duration, whereas the second catastrophic-failure mode is determined by the average power dissipated in the lamp. Whenthe flashtube is operated well below the rated maximum pulse energy and averagepower, the lamp usually does not fail abruptly. Rather, the tube will continue toflash with a gradual decrease in light output, which will eventually fall below alevel necessary for the particular application. In the latter mode of failure, thereduced light output is caused by the erosion of the flashtube electrodes and ofthe quartz walls and by the gradual buildup of light-absorbing deposits within theflashtube envelope.

192 6. Optical Pump Systems
Flashtube Explosion
When a high-voltage trigger pulse is applied between the electrodes of a flash-tube, the gas breaks down generally near the axis of the tube and a conductingfilament is established. As energy is released into the channel, heating of the am-bient gas causes the filament to expand radially, forming cylindrical shock waves.The shock front and its associated plasma travel radially from the tube axis toits wall. The radial velocity of the plasma discharge and the shock amplitude areproportional to the input energy. The cylindrical shock wave and the associatedplasma heat cause stress on the inside of the tube wall, which is axial in tensiontoward the electrodes. If the energy discharged exceeds the explosion limit for thelamp, the shock wave will be sufficiently intense to rupture the lamp walls andconsequently destroy the lamp.
The explosion energy is directly related to the inside-wall surface area of thelamp and to the square root of the pulse duration. If l and D are measured incentimeters and tp is in seconds, and if a critically damped single-mesh dischargecircuit is assumed, then it has been found empirically that for xenon-filled quartzflashtubes [1, 3] the explosion energy in Joules is
Eex = (1.2 × 10⁴)l D t1/2p . (6.3)
Having determined the ultimate limit for the tube, the question of the life thatthe tube will have in a given application has to be addressed. It has been shownthat lamplife can be related to the fraction of explosion energy at which the lampis operated. The life in flashes for a xenon-filled quartz-envelope flashlamp as afunction of the single-shot explosion energy is empirically given by [1, 4]
N ∼=(
Eex
Ein
)8.5
. (6.4)
The extremely strong dependence of flashlamp lifetime on the input energy Ein isa great incentive to underrate the lamp.
In Fig. 6.4 life expectancy as a function of lamp input is shown, assumingthat the interpulse interval is sufficiently long to permit the tube to cool betweenpulses. The lifetime expressed by (6.4) is defined as the number of shots at whichthe light output is reduced by 50% of its initial value. The life expectancy of aflashlamp begins to deteriorate rapidly when peak current exceeds 60% of ex-plosion current. Above 60%, the lamp’s life is usually limited to less than 100discharges, even if all other parameters are optimized. At the 80% level, explo-sion can occur on any discharge. Most flashlamps, with the exception of lampsinstalled in single-shot lasers, such as, for example, employed in inertial confine-ment fusion, are operated at only a small fraction of the explosion energy. In thiscase, cathode degradation is the primary failure mode. The two dotted lines inFig. 6.4 indicate where the cathode end of life begins to occur. As explained be-low, lamplife is considerably improved by operation in the simmer mode which

6.1. Pump Sources 193
FIGURE 6.4. Lamp life as a function of operating energy [4].
keeps the lamp continuously ionized at a low-current level. Because of the in-creased lamplife most lamps are operated in the simmer mode today.
Examples of Typical Operating Conditions
In selecting a particular lamp the following steps are usually followed:
1. A flashlamp arc length and bore diameter is chosen that matches the rod size.
2. The explosion energy for the lamp chosen is calculated.
3. An input energy is selected that is consistent with the desired lamp life. If thelamp input required to achieve a certain laser output is not consistent with adesired minimum lamplife, the application of a multiple-lamp pump cavity hasto be considered.
4. The average power loading of the lamp is calculated and compared with thelimit specified by the lamp manufacturer.
5. In designing the pulse-forming network, care must be taken to avoid fast cur-rent rise times and/or reverse currents. To obtain the expected life, manufac-turers recommend that the rise time of the flashlamp current be greater than120µs for lamps discharging more than a few hundred joules. Both electrodeerosion and wall vaporization are accelerated by fast-rising peak currents.
First we will consider a typical small linear flashlamp used in military equip-ment such as target designators or laser illuminators. These systems operate typ-ically at a flashlamp input of 10 J with pulse repetition rates of 20 pps. The laserstypically use 63 mm long Nd : YAG laser rods of 6.3 mm diameter and have aQ-switched output of 100 to 200 mJ. A 4 mm diameter and 60 mm long lamp
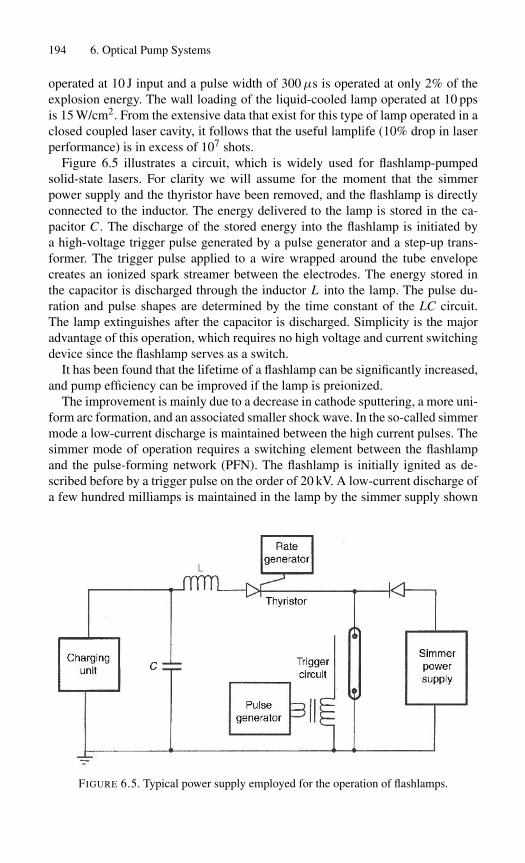
194 6. Optical Pump Systems
operated at 10 J input and a pulse width of 300µs is operated at only 2% of theexplosion energy. The wall loading of the liquid-cooled lamp operated at 10 ppsis 15 W/cm2. From the extensive data that exist for this type of lamp operated in aclosed coupled laser cavity, it follows that the useful lamplife (10% drop in laserperformance) is in excess of 107 shots.
Figure 6.5 illustrates a circuit, which is widely used for flashlamp-pumpedsolid-state lasers. For clarity we will assume for the moment that the simmerpower supply and the thyristor have been removed, and the flashlamp is directlyconnected to the inductor. The energy delivered to the lamp is stored in the ca-pacitor C . The discharge of the stored energy into the flashlamp is initiated bya high-voltage trigger pulse generated by a pulse generator and a step-up trans-former. The trigger pulse applied to a wire wrapped around the tube envelopecreates an ionized spark streamer between the electrodes. The energy stored inthe capacitor is discharged through the inductor L into the lamp. The pulse du-ration and pulse shapes are determined by the time constant of the LC circuit.The lamp extinguishes after the capacitor is discharged. Simplicity is the majoradvantage of this operation, which requires no high voltage and current switchingdevice since the flashlamp serves as a switch.
It has been found that the lifetime of a flashlamp can be significantly increased,and pump efficiency can be improved if the lamp is preionized.
The improvement is mainly due to a decrease in cathode sputtering, a more uni-form arc formation, and an associated smaller shock wave. In the so-called simmermode a low-current discharge is maintained between the high current pulses. Thesimmer mode of operation requires a switching element between the flashlampand the pulse-forming network (PFN). The flashlamp is initially ignited as de-scribed before by a trigger pulse on the order of 20 kV. A low-current discharge ofa few hundred milliamps is maintained in the lamp by the simmer supply shown
FIGURE 6.5. Typical power supply employed for the operation of flashlamps.

6.1. Pump Sources 195
in Fig. 6.5. The energy storage capacitor is discharged via a switch such as anSCR, thyristor, a gas, or mercury-filled tube. The pulse shape is determined bythe PFN, as before, and the switch, as well as the flashlamp, are turned off oncethe capacitor is discharged.
The dynamic behavior of the discharge circuit, which consists of the flashlampimpedance defined in (6.1), a capacitance C , and an inductance L , is described bya nonlinear differential equation. The impedance Z0 and the time constant tLC ofthe circuit is given by
Z0 = (L/C)1/2 and tLC = (LC)1/2. (6.5)
In addition, a damping factor α is defined, which determines the pulse shape ofthe current pulse. It is
α = K0(V0 Z0)−1/2, (6.6)
where V0 is the initial voltage of the capacitor. Solutions of the nonlinear differ-ential equation reveal that the current waveform is critically damped for a valueof α = 0.8 [5, 6]. The current waveform and energy, as a function of time for acritically damped pulse-forming network, is shown in Fig. 6.6.
The current pulse duration tp at the 10% points is approximately 3tLC; duringthis time about 97% of the energy has been delivered. If we substitute
α = 0.8 and tp = 3tLC = 3(LC)1/2 (6.7)
for a critically damped pulse into (6.5), (6.6), then we can determine for a givenlamp type the relationship between energy input, pulse duration, pulse shape, in-ductance, capacitance, and operating voltage.
FIGURE 6.6. Normalized current and energy of a critically damped flashlamp dischargecircuit. Pulse shape factor α = 0.8.
196 6. Optical Pump Systems
The energy initially stored in the capacitor is
Ein = 12 CV 2
0 . (6.8)
Equation (6.8) is used to eliminate V0 from (6.6), from which follows the value ofthe capacitor
C3 = 0.09Eint2
p
K 40
. (6.9)
The inductance can be calculated from (6.7)
L = t2p
9C. (6.10)
We now have a set of three equations (6.8)–(6.10) that, given the specifications ofthe flashlamp parameter K0, the desired input energy Ein, and pulse width tp, pro-vide explicit values of C, L , and V0. If the lamp parameter K0 is not specified bythe lamp manufacturer, it can be calculated from (6.2). From Fig. 6.6 also followsthe peak current for a critically damped current pulse
ip = 0.5V0
Z0. (6.11)
The rise time to reach this peak value is
tR = 1.25(LC)1/2 ∼= 0.4tp. (6.12)
6.1.2 Continuous Arc Lamps
Mechanical Design
Continuous arc lamps are similar in design to linear flashlamps, with the exceptionthat the cathode has a pointed tip for arc stability (see Fig. 6.1).
Electrical Characteristics
Continuous arc lamps are ignited just like flashlamps. For example, a series injec-tion trigger transformer supplying a 30 kV spike will lower the lamp impedanceto a level that is within the range of a 300 V dc supply. The operating parametersand impedance depend on current density, arc length, bore size, and fill pressure.Typical krypton arc lamps are operated between 80 and 150 V and 20 to 50 A.
Optical Characteristics
Arc lamps filled with inert gas are rich in line structure in the near-infrared. Xenonhas the highest overall conversion efficiency and is commonly used in arc lamps.

6.1. Pump Sources 197
FIGURE 6.7. Emission spectrum of a typical cw-pumped krypton arc lamp (6 mm bore,50 mm arc length, 4 atm fill pressure, 1.3 kW input power) (ILC Bulletin 3533).
However, the infrared line spectra of xenon misses all of the Nd : YAG pumpbands, which are located at 0.73 to 0.76, 0.79 to 0.82, 0.86 to 0.89, and 0.57 to0.60µm. The line spectrum from krypton is a better match to Nd : YAG than theline spectrum of xenon since two of its strongest emission lines (7600 and 8110 A)are strongly absorbed by the laser crystal (Fig. 6.7).
The laser output from a krypton-filled lamp is about twice that obtained from axenon arc lamp operated at the same input power. Krypton arc-pumped Nd : YAGlasers are currently the highest continuous power solid-state lasers. A summaryof the special data of a representative krypton arc lamp is given in Table 6.1. Notethe large fraction of radiation between 0.7 and 0.9µm.
TABLE 6.1. Spectral data for cw krypton arc lamps. Data are typicalfor lamps having a 6–13 mm bore, 7.5–25 cm arc length, 2–3 atm fillpressure, operated at 6–16 kW.
Quantity Definition Numerical data
Radiation efficiency Radiation output/ 0.45electrical input
Spectral output Fraction of radiation 0.40in spectral lines
Fraction of radiation 0.60in continuum
Spectral power Fraction of total radiation 0.10distribution below 0.7µm
Fraction of total radiation 0.60between 0.7 and 0.9µm
Fraction of total radiation 0.30between 0.9 and 1.4µm

198 6. Optical Pump Systems
FIGURE 6.8. Fractional utilization of krypton lamp output by Nd : YAG.
Combining the absorption spectra of Nd : YAG with the emission spectra of thekrypton lamp, the spectral utilization as a function of sample thickness has beencalculated. The result is shown in Fig. 6.8. The curve illustrates rather dramati-cally the kind of improvement one can achieve by increasing the diameter of anNd : YAG laser rod in a pumping cavity.
6.1.3 Laser Diodes
The high pump efficiency compared to flashlamps stems from the excellent spec-tral match between the laser diode emission and the Nd absorption bands at808 nm. Actually, flashlamps have a radiation efficiency (40–60%) comparableto laser diodes (35–50%); however, only a small fraction of the radiation matchby the laser material absorption bands. In contrast, the output wavelength of laserdiodes can be chosen to fall completely within an absorption band of a particu-lar solid-state laser. This has also the added benefit of reduced thermal loadingof the laser crystal, which leads to better beam quality. The directionality of thediode output and the small emitting area provides great flexibility of shaping andtransferring the pump radiation from the source to the laser medium that createdwhole new design architectures, such as end-pumped systems, microchip lasers,and fiber lasers. Diode laser pumps are also an enabling technology for new lasermaterials. The most prominent laser materials that are pumped with diode pumpsources can also be pumped with flashlamps. However, a number of very usefulmaterials such as Nd : YVO4, Yb : YAG, and Tm : YAG have only reached promi-nence as a result of diode laser pumps.
6.1. Pump Sources 199
Internal Structure of Laser Diodes
The most basic form of a diode laser consists of a semiconductor in which onepart is doped with electron donors to form n-type material and the other part isdoped with electron acceptors (holes) to produce p-type material. Application ofa negative voltage to the n-material and a positive voltage to the p-material driveselectrons and holes into the junction region between the n- and p-doped mate-rial. This is called forward biasing the pn-junction. In the junction electron–holerecombination takes place. In this process, electrons from a higher-energy state(conduction band) transfer to a lower-energy state (valence band) and this releasesenergy in the form of photons. In order to produce stimulated emission in the junc-tion area, population inversion and optical feedback are required. Passing a highcurrent through the junction area provides a population inversion. A Fabry–Perotresonator, formed by cleaving the chip along parallel crystal planes, provides op-tical feedback. Gain in laser diodes is very high; therefore only a small lengthof active material is needed. Typical edge emitting laser chips have active layersabout 500µm long. In order to increase efficiency and output power, actual laserdiodes contain a number of different layers with the active region sandwichedin between. Semiconductor-laser technology has produced an amazing variety ofnew device structures made possible by sophisticated growth techniques such asMetallOrganic Chemical–Vapor Deposition (MOCVD) and molecular beam epi-taxy (MBE) [7]. Most techniques differ in the way confinement is achieved re-garding the width and depth of the gain region and mode volume of the opticalradiation.
Figure 6.9 shows the dimensions of a typical 1 cm monolithic linear array (top)and a cross section of the device (bottom) that is made up of a stack of sev-eral semiconductor layers with varying thickness and doping levels. The thickestlayer on the bottom is the n-GaAs substrate onto which the other layers are de-posited. The top layer is p-GaAs. Sandwiched between several other layers isthe very thin active region of the pn-junction. The top and bottom surfaces of thewhole stack are coated with metallic contacts for electrical connection to the driveelectronics. The active region is divided into many parallel and narrow stripesby restricting the current in the lateral direction. The width of the active regionhas to be restricted to avoid the onset of amplified spontaneous emission whichwould propagate in off-axis directions and compete with the laser beam for theavailable population inversion. In the gain guided design illustrated in Fig. 6.9(a)particular emitter width is achieved by deposition of regions of high resistivitymaterial beneath the contact area. Therefore the current is channeled through nar-row low-resistance areas of the p-GaAs surface layer (white rectangular area inFig. 6.9(b)). Electrical current injected through the forward biased pn-junctioncreates the population inversion and gain in the active region. The distribution ofthe charge-carriers injected in the active region, and therefore the gain distribu-tion, is determined by the width of the current channel. The voltage across thejunction is on the order of 2 V for GaAs/AlGaAs materials, and the slope effi-ciency is about 1 W/A. Laser emission, which is between 790 and 860 nm for

200 6. Optical Pump Systems
10 mm
0.1 mm
0.5 mm(a)
(b)
FIGURE 6.9. Gain-guided, single quantum-well separate confinement heterostructurestripe laser [8]. (a) Typical dimensions of a 1 cm bar and (b) detail of internal structure.(Thickness of layers is greatly exaggerated).
GaA/AlGaAs laser diodes, is perpendicular to the planar front facet of the laserdiode bar shown in Fig. 6.9.
A 1 cm bar contains 10 to 50 independent laser emitters, all radiating in thesame direction perpendicular to the planar front of the structure. The width ofeach emitter (white rectangle in Fig. 6.9(b)) is between 50 to 200µm. The spac-ing between adjacent emitters ranges from 200µm to 1 mm. In so-called broadarea emitters each emitter consists of a single stripe. In other designs the totalwidth is subdivided in subarrays of 10 to 20 closely spaced narrow-stripe emit-ters for better lateral mode control. The width of, and spacing between, individualemitters is dictated by the average power, peak power, or duty cycle requirementsand the type of cooling applied to the bar.
Radiation in the vertical direction of the pn-junction is confined by a waveguide structure comprised of several layers of differently doped materials. Theactive layer shown in Fig. 6.9 is sandwiched between two pairs of layers hav-ing a different concentration of aluminum. The main purpose of the innermostpair of layers is to confine the carriers to the active region, whereas the pur-pose of the outer layers is to confine the optical beam. In a conventional double-
6.1. Pump Sources 201
heterostructure pn-junction the active region has a thickness around 0.1–0.3µm.The quantum-well active region illustrated in Fig. 6.9(b) is an order of magnitudethinner. Extremely high gains on the order of 3 to 5×104 cm−1 and low thresholdscan be achieved in such a thin layer.
A quantum well is a thin layer of semiconductor located between two layerswith a larger bandgap. Electrons in the quantum-well layer lack the energy toescape and cannot tunnel through the thicker surrounding layers. The quantum-well layer in Fig. 6.9(b) has a composition of gallium and aluminum indicatedby x , which defines the emission wavelength. A higher aluminum concentra-tion increases the bandgap and shifts the output toward shorter wavelength. Thequantum-well structure is sandwiched between two thick layers of a compositionwhich contains a higher concentration of aluminum (y > x). The higher alu-minum concentration increases the bandgap, thereby defining the quantum well,and the large thickness of the layer prevents tunneling of the carriers out of thequantum well. Instead of a single quantum-well active layer, several quantumwells can be sandwiched one above the other to generate multiple quantum-wellstacks.
The thin active region incorporating a quantum-well active layer structure pro-vides low threshold and high electrical-to-optical efficiency. However, such a verysmall emitting surface poses one problem since the power from a diode laser islimited by the peak flux at the output facet. One can increase the output fromthese devices by spreading the beam over an area that is larger than the activelayer or gain region. The standard approach is to deposit layers next to the activelayer, each of which has a slightly lower refractive index than the active layer,thus making a wave guide of the active layer. In the separate carrier and opticalconfinement heterostructure (SCH) design shown in Fig. 6.9(b), the refractive in-dex boundary is abrupt, at the layer boundary. Alternatively, the refractive indicesof the surrounding layers may be graded, forming a Graded-Index and Separatecarrier and optical Confinement Heterstructure (GRINSCH).
In the single quantum-well structure depicted in Fig. 6.9(b), the effective aper-ture of the laser output is 0.1 to 0.4µm vertical to the pn-junction, which is abouta factor 20 larger than the gain region. This substantially reduces the energy den-sity at the output facet and enhances reliability by minimizing catastrophic facetdamage.
The small white rectangle in Fig. 6.9(b) indicates the gain region, whereas thelarge rectangle surrounding it represents the optical aperture of one emitter. Thedrawing in Fig. 6.9 exaggerates the vertical dimension by several orders of mag-nitude. The emitting aperture is, in reality, a wide and very narrow horizontal linewith a width up to 200µm and a thickness of no more than 0.4µm.
As described above, the beam cross section of a single emitter is given by thewidth of the current channel in the plane of the pn-junction and by the waveguidestructure in the vertical direction. The front and rear facets, separated by about500µm, define the length of the Fabry–Perot resonator. The facets, which provideoptical feedback and output coupling, are created by cleaving the bars from theprocessed semiconductor wafer. Cleaving along directions dictated by the crystal

202 6. Optical Pump Systems
structure generates extremely planar and parallel surfaces. The facets are dielec-trically coated to provide a high reflectivity at the rear facet and an appropriateoutput transmission at the front facet.
Diode Pump Source Configuration
Depending on the output-power requirement of the laser and the particular pumpconfiguration chosen, one can select a diode pump source from a number of stan-dard commercial designs. In accordance with the average power capability we canclassify diode pumps into four groups:
(a) Laser diodes with emitting apertures between 100 and 500µm and outputpowers up to 5 W.
(b) Single 1 cm long bars yielding a cw output up to 40 W.(c) Stacked 1 cm bars, forming two-dimensional arrays that are conductively
cooled and mounted to a common heat sink.(d) Stacked bar two-dimensional arrays with individual, internal liquid cooling
for each bar.
Depending on the number of bars and the type of cooling employed, several kilo-watts of cw output and tens of kilowatts of peak power in quasi-cw mode can beobtained from two-dimensional arrays.
For small solid-state lasers a typical pump source is a laser diode as illustratedin Fig. 6.10. The diode has a total output of 2 W in the cw mode. The output isemitted from an area of 200 × 1.0µm with a beam divergence of 40◦ by 10◦. Thedevice can be coupled to an optical fiber or mounted on a thermoelectric cooler.In the latter configuration shown in Fig. 6.10 the array is mounted on a pyrami-
FIGURE 6.10. Diode laser mounted on a thermoelectric cooler (SDL, Inc.).
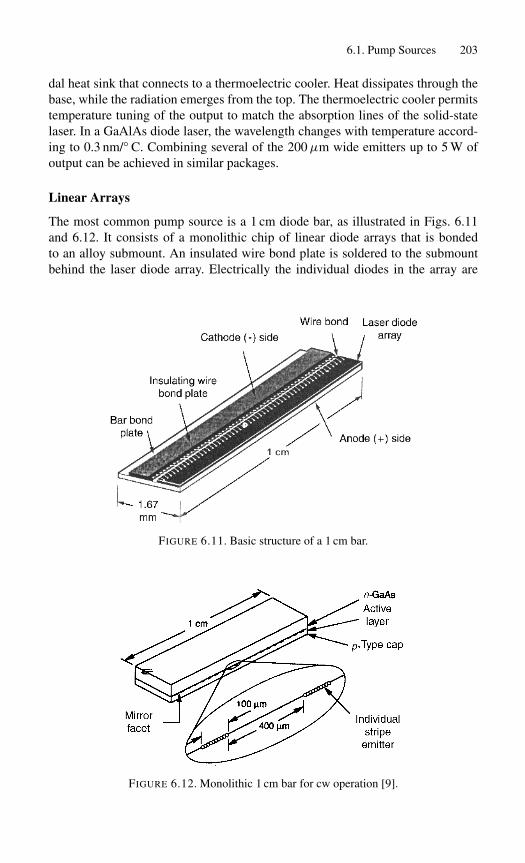
6.1. Pump Sources 203
dal heat sink that connects to a thermoelectric cooler. Heat dissipates through thebase, while the radiation emerges from the top. The thermoelectric cooler permitstemperature tuning of the output to match the absorption lines of the solid-statelaser. In a GaAlAs diode laser, the wavelength changes with temperature accord-ing to 0.3 nm/◦ C. Combining several of the 200µm wide emitters up to 5 W ofoutput can be achieved in similar packages.
Linear Arrays
The most common pump source is a 1 cm diode bar, as illustrated in Figs. 6.11and 6.12. It consists of a monolithic chip of linear diode arrays that is bondedto an alloy submount. An insulated wire bond plate is soldered to the submountbehind the laser diode array. Electrically the individual diodes in the array are
FIGURE 6.11. Basic structure of a 1 cm bar.
FIGURE 6.12. Monolithic 1 cm bar for cw operation [9].

204 6. Optical Pump Systems
all connected in parallel to a wire bond plate. The bonding of the bar to the heatsink is made through the thinner p-doped side to minimize the thermal resistancebetween the gain medium and the heat sink.
In the fabrication of laser bars 10 to 50 independent laser emitters are seriallyrepeated on a single substrate to form a monolithic bar structure. Practical pro-cessing considerations limit the length of such bars to 1 cm. In the example shownin Fig. 6.12, the device is composed of 20 emitters spaced on 500µm centers andproduces an output of 20 W in the cw mode. Recent devices are capable of up to40 W output power in a 1 cm bar. In the particular design shown in Fig. 6.12 eachemitter is further subdivided into a number of narrow stripes. The spacing of theemitters, which amounts to a fill factor of 20% for the device, is determined bythermal limitations.
The use of diode lasers for pumping pulsed neodymium lasers requires a pulselength on the order of several hundred microseconds. One limit of the output ofdiode lasers is the temperature of the junction and associated thermal runawaycondition that raises the local temperature of the facet to the melting temperature.Because of the small volume of material involved, this temperature rise occurs inless than 1µs. Therefore, the power limit of diodes in the long-pulse mode is thesame as for cw operation. Thus, long-pulse operation (� 1µs) is called quasi-cwoperation. The peak power obtained from a 1 cm bar can be increased over the cwvalue by increasing the number of stripe lasers; this is achieved by increasing thefill factor to close to 100%. Of course, the duty cycle has to be limited such thatthe average power from the bar is about the same as for a cw bar. Operated in thequasi-cw mode, a single bar typically generates 60 W peak power, or 12 mJ in a200µs long pulse, although devices up to 100 W are available at reduced lifetime.Depending on cooling conditions, duty cycles on the order of 30% are possible.Therefore, the maximum average output power for cw and quasi-cw devices is 20to 40 W for a 1 cm bar. Microlenses can be mounted in front of a bar to concentratepump radiation into a fiber. Typically a 20 W cw bar can be coupled to a 400µmfiber with 16 W available at the output end of the fiber. The ability to mount thepump source away from the laser onto a heat dissipating structure is very usefulin some applications.
Two-Dimensional Arrays
A number of 1 cm bars can be combined to form a two-dimensional array. The keyissues are the mounting technique and the efficient removal of waste heat fromthe laser emitter. In the so-called rack-and-stack assembly technique, laser diodebars are first mounted on individual submounts which are then stacked to producetwo-dimensional arrays. The spacing (pitch) between adjacent bars depends onthe average output power and on the cooling method.
For quasi-cw arrays one common design approach uses thin copper heatsink spacers between the bars. The assembly of sandwiched bars and spacersis mounted onto a common heat sink. Such a device is shown in Fig. 6.2(a). Thisinternal passively cooled diode stack is attached via the two mounting holes to

6.1. Pump Sources 205
a larger cold plate or water-cooled heat sink. Electrically the bars are connectedin series, the two large copper leads extending from the back of the device inFig. 6.2(a) are for connection to a power supply. The thickness of the copperheat spreader, and therefore the stacking density, depends on the duty cycle ofoperation. Higher average power operation requires thicker heat sinks. For low-duty-cycle operation around 3%, the bars can be densely packaged with only0.4 mm space in between; this allows a power density of 1.5 kW/cm2. At a 6%duty cycle, the spacing increases to 0.8 mm and 800 W/cm2 can be achieved.Operation of a 10 stack array, with 200µs pulses at 100 Hz, produces typically apeak power of 600 W at 40% efficiency.
Multibar arrays for cw or high-duty cycle-pulsed operation require active cool-ing close to the junction of the individual emitters. This can be achieved by us-ing microchannel cooling technology whereby each diode bar has its own liq-uid heat exchange submount. In one approach individual bars are separated bycooling plates apprxoimately 1 mm thick, through which cooling water is chan-neled. Using this approach, bars can be stacked with a 2 mm bar-to-bar pitch.Figures 6.2(b) and 6.13 depict internally liquid-cooled two-dimensional arrays.Arrays comprised of 20 cw bars have achieved 1 kW output in a 4 cm2 emittingarea. Pulsed arrays can be operated up to 30% duty cycle with internal active cool-ing. The most powerful multibar pump modules generate peak powers in excessof 30 kW and cw powers of several kilowatts.
Spatial Profile
The output beam emerging from the facet of a diode laser is in the form of alight cone that is oval in cross section, as illustrated in Fig. 6.14. In the verticaldirection with respect to the pn-junction the beam is diffraction limited and hasa divergence of about 40◦ FWHM. The Gaussian beam appears to emerge froma 1µm aperture. If one introduces in (5.6) a wavelength of λ = 0.8µm and aspot size for a Gaussian beam of 1µm the beam divergence at the 1/e2 points is2θ = 57◦.
FIGURE 6.13. High-duty cycle internally liquid-cooled stacked bars (SDL, Inc.); (a) with-out and (b) with microlens array.

206 6. Optical Pump Systems
FIGURE 6.14. Radiation pattern from a laser diode [10].
Collimation of such a highly divergent beam requires optics with a numericalaperture of NA = sin(2θ/2) = 0.5 or higher. Optical systems with such a highnumerical aperture are said to be fast. From this it follows that the direction of theoutput beam from a laser diode in the vertical direction of the emitting stripe istermed the fast axis.
In the plane parallel to the pn-junction, the beam divergence is much smallerand is about 10◦ FWHM. However considering the width of the emitter which isbetween 50 and 200µm, this is many times diffraction limited. For example, aGaussian beam emerging from an aperture of 150µm would have a divergenceof 0.4◦ at the 1/e2 points. The output consists of many high-order spatial modes,termed lateral modes in the literature. The number of lateral modes depends onthe design of the emitter (i.e., broad area or subdivided into narrow stripes), cavitylength, and various material parameters. Compared to the vertical direction, thesmaller divergence of the beam in the plane of the pn-junction allows the use ofoptics with a smaller numerical aperture. Therefore the beam in this direction isreferred to as the slow axis.
Reformatting the highly astigmatic pump beam emitted from a line source intoa circular beam, which is required for end-pumped lasers, is a challenging task.End-pumped lasers require focusing of the pump radiation to a small spot size formode matching or for coupling into an optical fiber. In Section 6.2.3 a number ofdifferent optical schemes that accomplish this task will be discussed.

6.1. Pump Sources 207
Diode Laser Lifetime
The long lifetime of laser diodes as compared to arc lamps is an important con-sideration for pumping solid-state lasers with these devices. We will distinguishbetween catastrophic failures and normal degradation during operation. Laserdiodes, like all semiconductors, are very susceptible to damage by electrostaticdischarges or high-voltage transients. Therefore handling of these components re-quires electric discharge control such as wearing wrist straps and grounded worksurfaces. Also great care has to go into power supply and driver design to protectthis very expensive pump source from transients, current surges, and high volt-age. Operation at excessive currents will lead to catastrophic mirror facet damage.Also, insufficient cooling combined with high currents can melt the solder jointsor vaporize the wire bonds within the diode structure.
Under proper operating conditions laser diodes degrade in a fairly predictablemanner which results in a decrease in output over time. The higher the operatingcurrent and/or the operating temperature, the faster the degradation. The decreasein output over time can be caused by structural defects, which spread throughthe laser diode forming light absorbing clusters. Dark lines or spots in the outputbeam are a manifestation of this damage. The degradation of AlGaAs laser diodes,the most common pump source, is usually attributed to oxidation and migrationof aluminum under high-power operation. Structural defects can also be causedby thermal stress due to different thermal expansion coefficients of semiconductorand heat sink material.
Facet damage due to the environment or high-radiation flux is another sourceof degradation, so is diffusion of solder into the semiconductor lattice over timecaused by the high-current density. After-screening of the laser diodes during aburn-in period performed by the manufacturer has eliminated early failures due toproduction problems, and very long operational lifetimes can be achieved. Life-times of cw devices are typically on the order of 104 hr. In most commercial sys-tems requiring long life, diode arrays are typically operated at 75% of their ratedoutput. Quasi-cw bars and stacked arrays achieve lifetimes of several billion shots.
Spectral Properties
The spectral properties of laser-diode arrays that are most critical for the pump-ing of solid-state lasers are the center wavelength and the spectral width of theemission and the wavelength shift with temperature.
The wavelength of a laser diode is inversely proportional to the energy differ-ence �E between the conduction and valence band
λ = hc/�E, (6.13)
where h is the Planck constant and c is the speed of light. The bandgap dependson the crystalline structure and chemical composition of the semiconductor. A bi-nary compound such as GaAs has a fixed wavelength. Adding a third element, bysubstituting a fraction of gallium with aluminum in GaAs, changes the bandgap.
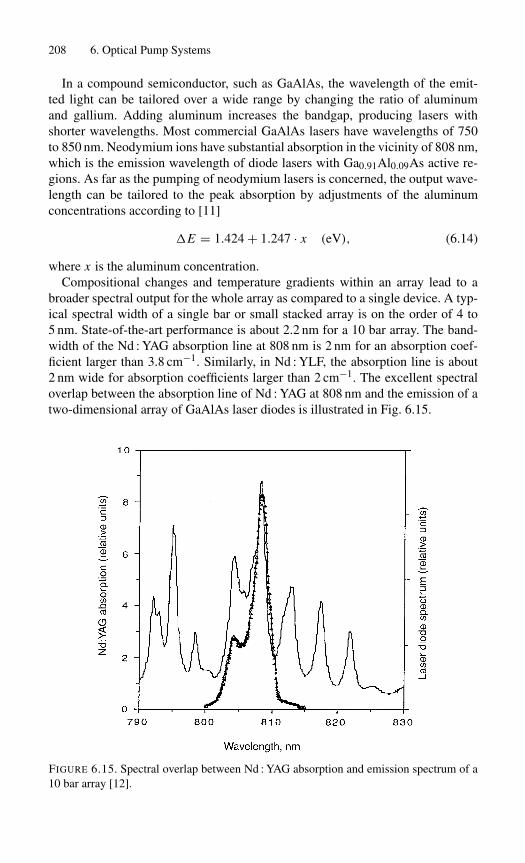
208 6. Optical Pump Systems
In a compound semiconductor, such as GaAlAs, the wavelength of the emit-ted light can be tailored over a wide range by changing the ratio of aluminumand gallium. Adding aluminum increases the bandgap, producing lasers withshorter wavelengths. Most commercial GaAlAs lasers have wavelengths of 750to 850 nm. Neodymium ions have substantial absorption in the vicinity of 808 nm,which is the emission wavelength of diode lasers with Ga0.91Al0.09As active re-gions. As far as the pumping of neodymium lasers is concerned, the output wave-length can be tailored to the peak absorption by adjustments of the aluminumconcentrations according to [11]
�E = 1.424 + 1.247 · x (eV), (6.14)
where x is the aluminum concentration.Compositional changes and temperature gradients within an array lead to a
broader spectral output for the whole array as compared to a single device. A typ-ical spectral width of a single bar or small stacked array is on the order of 4 to5 nm. State-of-the-art performance is about 2.2 nm for a 10 bar array. The band-width of the Nd : YAG absorption line at 808 nm is 2 nm for an absorption coef-ficient larger than 3.8 cm−1. Similarly, in Nd : YLF, the absorption line is about2 nm wide for absorption coefficients larger than 2 cm−1. The excellent spectraloverlap between the absorption line of Nd : YAG at 808 nm and the emission of atwo-dimensional array of GaAlAs laser diodes is illustrated in Fig. 6.15.
FIGURE 6.15. Spectral overlap between Nd : YAG absorption and emission spectrum of a10 bar array [12].

6.1. Pump Sources 209
FIGURE 6.16. Absorption efficiency of Nd : YAG as a function of absorption length for apump wavelength of 808 nm [13].
In diode-pumped lasers that have only a short absorption path, it is importantto have a narrow spectral emission from the diode array in order to absorb mostof the pump radiation. In optically thick materials, such as large diode-pumpedlasers with rod or slab dimensions on the order of 10–15 mm, spectral width be-comes less important because eventually all the pump radiation gets absorbed. InFig. 6.16 the absorption of diode-pumped radiation for Nd : YAG is plotted versusoptical thickness with spectral width as a parameter.
For laser materials with an absorption band between 750 and 850 nm, pumpingwith GaAlAs diodes is the obvious choice because of the availability and highstate of development of these devices. Lasers that can be pumped with GaAlAsdiodes include neodymium doped materials and Tm : YAG, as listed in Table 6.2.For pumping Yb : YAG or yttrbium-sensitized lasers such as the Er : Yb : glass, a
TABLE 6.2. Important lasers and diode pump sources.
Laser material Pump wavelength Semiconductor[nm] laser material
Nd : YAG 808 GaAlAsNd : YLF 798,792 GaAlAsNd : YVO4 809 GaAlAsTm : YAG 805 (wing) GaAlAs
785 (peak) GaAlAsYb : YAG 941 InGaAsEr : glass 980 InGaAsCr : LiSAF 670 (peak) AlGaInP
760 (wing) GaAlAs
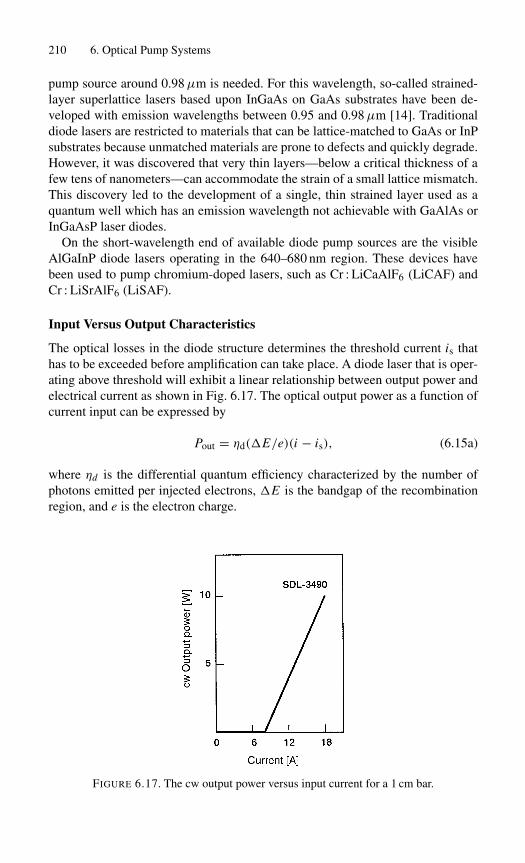
210 6. Optical Pump Systems
pump source around 0.98µm is needed. For this wavelength, so-called strained-layer superlattice lasers based upon InGaAs on GaAs substrates have been de-veloped with emission wavelengths between 0.95 and 0.98µm [14]. Traditionaldiode lasers are restricted to materials that can be lattice-matched to GaAs or InPsubstrates because unmatched materials are prone to defects and quickly degrade.However, it was discovered that very thin layers—below a critical thickness of afew tens of nanometers—can accommodate the strain of a small lattice mismatch.This discovery led to the development of a single, thin strained layer used as aquantum well which has an emission wavelength not achievable with GaAlAs orInGaAsP laser diodes.
On the short-wavelength end of available diode pump sources are the visibleAlGaInP diode lasers operating in the 640–680 nm region. These devices havebeen used to pump chromium-doped lasers, such as Cr : LiCaAlF6 (LiCAF) andCr : LiSrAlF6 (LiSAF).
Input Versus Output Characteristics
The optical losses in the diode structure determines the threshold current is thathas to be exceeded before amplification can take place. A diode laser that is oper-ating above threshold will exhibit a linear relationship between output power andelectrical current as shown in Fig. 6.17. The optical output power as a function ofcurrent input can be expressed by
Pout = ηd(�E/e)(i − is), (6.15a)
where ηd is the differential quantum efficiency characterized by the number ofphotons emitted per injected electrons, �E is the bandgap of the recombinationregion, and e is the electron charge.
FIGURE 6.17. The cw output power versus input current for a 1 cm bar.

6.1. Pump Sources 211
The slope efficiency σs, determined from the slope of the output power versusinput current, follows from (6.15a)
σs = ηd(�E/e). (6.15b)
Figure 6.17 depicts the output power versus current for a 10 W cw bar. The devicehas a slope efficiency of σs = 1 W/A and with�E = 1.5 eV follows from (6.15b)a differential quantum efficiency of ηd = 0.66. The applied forward voltage fordiode lasers is
V0 = (�E/e)+ i Rd, (6.15c)
where Rd is the series resistance of the diode due to the resistivity of the epilay-ers and the resistivity of the metal contacts. For typical devices the voltage dropacross the junction is 1.5 eV and one obtains V0 = 1.5V + i Rd.
The energy conversion efficiency of the diode laser, defined as the ratio of opti-cal output power to electrical input power, which we call the pump efficiency ηp,follows from the above equations
ηp = σs(i − is)
i[(�E/e)+ i Rd] . (6.15d)
The device characterized in Fig. 6.17 has an overall efficiency of ηp = 0.32 atthe maximum output based on a series resistance of Rd = 0.015� and �E/e =1.5 eV.
If quasi-cw bars are stacked into two-dimensional arrays, the bars are connectedelectrically in series to avoid high currents and the associated resistive losses.This is illustrated in Fig. 6.18. The drive current for this 10 bar stack is identicalto the current of a single bar. The nonlinear behavior of the overall efficiency
FIGURE 6.18. Performance of a quasi-cw 10 bar array (Spectra Diode Laboratories).

212 6. Optical Pump Systems
with increasing current occurs because the ohmic losses in the material increaseas the square of the current (see (6.15d)), whereas the output power is linear incurrent.
Thermal Management
Diode-array pumping offers dramatic improvements in efficiency of solid-statelaser systems. However, the need to maintain the operating temperature within arelatively narrow range requires a more elaborate thermal management system ascompared to flashlamp-pumped lasers.
In end-pumped systems, the diode wavelength is usually temperature tuned tothe peak absorption line of the laser and maintained at that wavelength by con-trolling the array temperature with a thermoelectric cooler. This approach workswell for small lasers, and systems including thermoelectric coolers can work overa large range of ambient temperatures.
In large systems, the power consumption of thermoelectric coolers is usuallyprohibitive. For these systems, a liquid cooling loop with a refrigeration stagecan be employed that maintains the temperature of the coolant independent of theenvironment. However, the coefficient of performance for refrigerators is typicallyno greater than one. Therefore, the electrical input power requirement is equal tothe heat load to be controlled.
Recently, the development of diode arrays which can operate at high junctiontemperatures has eliminated the need for refrigerated cooling loops for specialcases such as military systems. Diode arrays have been operated at junction tem-peratures as high as 75◦ C, which is higher than ambient in most situations. Asimple liquid-to-air cooling system provides the most efficient thermal controlsystem for the laser because only the power consumption of a pump and possiblya fan is added to the total electrical requirements.
The power dissipation of the various subsystems of a pulsed diode-pumpedlaser is listed in Table 6.3. The system has a repetition rate of 200 Hz and anoutput pulse energy of 0.8 J/pulse. By far the greatest heat dissipation occurs inthe diode pump arrays, and accounts for approximately 65% of the system inputpower. The solid-state laser medium itself dissipates heat at a rate approximatelyequal to the output power from the laser system. The electronics dissipate on theorder of 19% of the input power.
TABLE 6.3. Power dissipation from adiode-array-pumped solid-state laser.
System output 160 WDiode array 1300 WLaser crystal 160 WElectronics/other components 380 W
Total electrical input 2000 W

6.2. Pump Radiation Transfer Methods 213
Operation of Laser–Diode Arrays
Compared to arc lamps, the electrical operating conditions of laser diodes aremuch more benign. The operating voltages are low and a trigger circuit is notrequired. Essentially, only a low-voltage dc power supply of the appropriate volt-age and current range is required to operate the cw devices. Despite the verystraightforward electronics, there are several challenges for operating laser diodesefficiently and reliably. The series resistance of laser diodes is very low; therefore,the internal resistance of the power supply must be minimized for efficient energytransfer.
Second, compared to flashlamps, laser diodes are electrically much more vul-nerable. Therefore, overvoltage, reverse bias, and current protection are essentialfeatures in the design of power sources. The power supply of a diode-pumpedsolid-state laser is the subsystem where most of the weight and volume savingsoccur compared to a flashlamp-based laser. High efficiency of a diode-pumpedlaser, low-voltage operation of the diodes, and the use of electrolytic capacitorsfor energy storage, allow the design of very small and compact power supplies.In a pulsed diode-pumped solid-state laser system, the diode-array drivers replacethe pulse-forming network in a conventional flashlamp-pumped laser system. Thediode-array driver is a low-voltage switching network which supplies a constant-current pulse to the diode arrays. The low-voltage requirements for the diode ar-rays allow the use of power MOSFETs as switching elements. Electrical energystored in electrolytic capacitors is transferred to the diode arrays on each laserpulse.
6.2 Pump Radiation Transfer Methods
The efficiency in the transfer of radiation from the source to the laser elementdetermines, to a large extent, the overall efficiency of the laser system. The opticaldesign, besides providing good coupling between the source and the absorbingactive material, is also responsible for the pump power distribution in the laserelement which influences the uniformity, divergence, and optical distortions ofthe output beam.
In the development of solid-state lasers, many different optical designs havebeen employed to transfer the radiation from a light source to the active mate-rial. Depending on the shape of the active material and the type of pump sourceused, one can broadly divide pumping geometries into systems in which the ac-tive material is side-pumped, end-pumped, face-pumped, or edge-pumped. Side-or transverse-, and end- or longitudinal-pumping refers to the orientation of thepump beam relative to the direction of the laser beam in the gain medium. Face-and edge-pumped slabs and disks differ in the directions in which waste heat isremoved, and in the resulting directions and magnitudes of the thermal gradientsrelative to pump and output laser beam directions.

214 6. Optical Pump Systems
6.2.1 Side-Pumping with Lamps
The most widely used arrangement to collect and concentrate radiation emitted byan arc lamp into the laser medium is an enclosure comprising a highly reflectiveelliptical cylinder with the laser rod and pump lamp at each focus. The ellip-tic configuration is based on the geometrical theorem that rays originating fromone focus of an ellipse are reflected into the other focus. Therefore an ellipticalcylinder transfers energy from a linear source placed at one focal line to a lin-ear absorber placed along the second focal line. The elliptical cylinder is closedby two plane-parallel and highly reflecting end plates. This makes the cylinderoptically infinitely long.
An elliptical cylinder can have a cross section with a large or small eccentricity.In the former case, the laser rod and lamp are separated by a fairly large distance,in the second case they are close together. If the elliptical cylinder closely sur-rounds the lamp and rod, then one speaks of a close-coupled elliptical geometry(see Fig. 6.19(a)). This geometry usually results in the most efficient cavity andit has the further advantage that it minimizes the weight and size of the laserheads. Since the energy delivered to a discharge lamp is limited, schemes to focusthe energy from several lamps onto a single crystal are attractive. Figure 6.19(b)shows two partial elliptical cylinders having one common axis at which the crystalis placed. Multilamp close-coupled cavities provide a higher degree of pumpinguniformity in the laser rod than single-lamp designs.
Figure 6.20 exhibits examples of close-coupled nonfocusing pump cavities.The lamp and rod are placed as close together as possible, and a reflectorclosely surrounds them. The reflector can be circular (Fig. 6.20(a)) or oval
FIGURE 6.19. (a) Single and (b) double elliptical pump cavity.
FIGURE 6.20. Nonfocusing pump cavities; (a) circular cylinder, (b) single, and (c) double-lamp closed-coupled configuration.

6.2. Pump Radiation Transfer Methods 215
(Fig. 6.20(b),(c)). The latter type is often used in laboratory setups of low-repetition-rate pulsed lasers. The reflector consists simply of silver or aluminumfoil wrapped around the flash lamp and laser rod.
The fraction of pump energy that is transferred from the source to the laser rodcan be expressed by
ηt = ηtg × ηto, (6.16)
where ηtg is the geometrical cavity transfer coefficient. It is the calculated fractionof rays leaving the source which reach the laser material either directly or afterreflection from the walls. The parameter ηto expresses the optical efficiency of thecavity and essentially includes all the losses in the system. This parameter can beexpressed as
ηto = Rw(1 − Rr)(1 − δ)[1 − (An/Atot)], (6.17)
where Rw is the reflectivity of the cavity walls at the pump bands, Rr is the reflec-tion at the laser-rod surface or at the glass envelopes of the cooling jackets andFresnel losses of any filters inserted in the cavity, δ is the absorption loss in theoptical medium between the lamp and the laser rod such as coolant liquid, filters,etcetera, and (An/Atot) is the ratio of the nonreflecting area of the cavity An tothe total inside area Atot. This factor accounts for losses due to openings in thereflector which are required, for example, to insert the laser rod and pump lamp.Equations (6.16), (6.17) are rough approximations based on the assumption thatall the lamp radiation undergoes just one reflection. If one were to include directradiation and multiple reflections from the cavity walls, these equations wouldhave to be developed in series expressions.
The pump source is usually assumed to be a cylindrical radiator having a Lam-bertian radiation pattern. This implies that it appears as a source having constantbrightness across its diameter when viewed from any point. In Fig. 6.21 trajecto-
FIGURE 6.21. Trajectories of photons emitted from the pump source; (a) cross section and(b) top view of elliptical pump cavity.

216 6. Optical Pump Systems
ries of photons that originate from a volume element dv of the source are shown.In Fig. 6.21(a) the rays leave normal to the surface of the source and, therefore,remain in a cross-sectional plane. Figure 6.21(b) depicts trajectories of photonsthat leave the source at an angle with respect to a cross-sectional plane of the el-lipse. In this case the photons can be reflected off the end-plate reflectors as wellas undergo a reflection at the elliptical cylinder. In an elliptical pump cavity, allrays emanating from one point of the source are transformed into parallel linesat the laser rod. Each line corresponds to rays leaving the source inclined at thesame angle with respect to the major axis of the ellipse, but at different angleswith respect to the cross-sectional plane.
Image formation, in its usual sense, is meaningless for the elliptical cylindersince rays emanating in different directions from a point at the source convergeafter reflection from the cavity at altogether different points. In a pump cavity,all that is actually desired is the transfer of radiant energy from the source to thelaser rod. From the foregoing considerations, it is obvious that the condition ofan infinitely long elliptical pump cavity can be satisfied by enclosing the endsof the cylinder with highly reflective plane mirrors. Therefore, in the analysis ofthis arrangement the two-dimensional case can be treated by considering the lightdistribution in a plane perpendicular to the longitudinal axes of the cylinder.
In the theoretical expressions obtained for the efficiency of elliptical configu-rations, the pump system is usually characterized by the ratio of the rod and lampradii rR/rL, the ratio of the lamp radius to the semimajor axis of the ellipse rL/a,and the eccentricity e = c/a, where 2c is the focal separation. Consider any pointP on the surface of the cavity with a distance lR from the crystal and distancelL from the lamp as shown in Fig. 6.22. Suppose that the lamp has a radius rL,then, as a consequence of the preservation of angles, upon reflection the imagewill have the radius r ′
L = rLlR/ lL. This means that the portion of the ellipti-cal reflector nearer the lamp forms a magnified image at the laser rod, while that
FIGURE 6.22. Cross section of elliptical pump cavity. Eccentricity e = c/a; focal pointseparation c = (a2 − b2)1/2.

6.2. Pump Radiation Transfer Methods 217
portion nearer the crystal forms a reduced image of the lamp. A point P , with cor-responding angles αp and �p measured from the lamp and rod axis, respectively,may be defined dividing these two regions. At this point, the ellipse generates animage of the lamp which exactly fills the crystal diameter. We must allow for thiseffect of magnification and demagnification when determining how much energyis captured by the crystal. From the properties of an ellipse, and noting that at P ,lR/ lL = rR/rL, we obtain
cosαp = 1
e
[1 − 1 − e2
2
(1 + rR
rL
)], (6.18)
and
sin�p =(
rL
rR
)sin αp. (6.19)
The geometrical cavity transfer coefficient can be calculated by consideringwhat fraction of the energy radiated by the lamp into an angle �α is trapped bythe crystal. Integration over all angles leads to [15, 16]
ηtg = 1
π
[αp +
(rR
rL
)�p
]. (6.20)
This expression is plotted in Fig. 6.23. A certain portion of the reflecting surfacebehind the lamp is screened from the crystal by the lamp itself. In flashlamps,which resemble a blackbody source, the radiation reflected back into the lampwill be absorbed. On the other hand, the plasma in cw arc lamps is optically thin,and the reflected pump radiation is transmitted through the plasma. If we assumethe radiation reflected back to the pump source to be lost, we must reduce theangle �p in the above formula by �1, where
sin�1 = rL
4ae, (6.21)
FIGURE 6.23. Dependence of transfer efficiency of an elliptical reflector on the quantityrR/rL and eccentricity e [17].
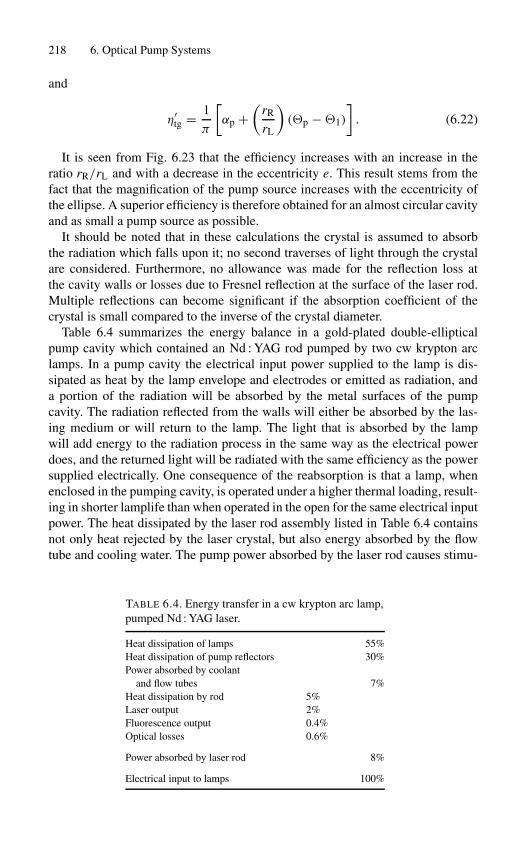
218 6. Optical Pump Systems
and
η′tg = 1
π
[αp +
(rR
rL
)(�p −�1)
]. (6.22)
It is seen from Fig. 6.23 that the efficiency increases with an increase in theratio rR/rL and with a decrease in the eccentricity e. This result stems from thefact that the magnification of the pump source increases with the eccentricity ofthe ellipse. A superior efficiency is therefore obtained for an almost circular cavityand as small a pump source as possible.
It should be noted that in these calculations the crystal is assumed to absorbthe radiation which falls upon it; no second traverses of light through the crystalare considered. Furthermore, no allowance was made for the reflection loss atthe cavity walls or losses due to Fresnel reflection at the surface of the laser rod.Multiple reflections can become significant if the absorption coefficient of thecrystal is small compared to the inverse of the crystal diameter.
Table 6.4 summarizes the energy balance in a gold-plated double-ellipticalpump cavity which contained an Nd : YAG rod pumped by two cw krypton arclamps. In a pump cavity the electrical input power supplied to the lamp is dis-sipated as heat by the lamp envelope and electrodes or emitted as radiation, anda portion of the radiation will be absorbed by the metal surfaces of the pumpcavity. The radiation reflected from the walls will either be absorbed by the las-ing medium or will return to the lamp. The light that is absorbed by the lampwill add energy to the radiation process in the same way as the electrical powerdoes, and the returned light will be radiated with the same efficiency as the powersupplied electrically. One consequence of the reabsorption is that a lamp, whenenclosed in the pumping cavity, is operated under a higher thermal loading, result-ing in shorter lamplife than when operated in the open for the same electrical inputpower. The heat dissipated by the laser rod assembly listed in Table 6.4 containsnot only heat rejected by the laser crystal, but also energy absorbed by the flowtube and cooling water. The pump power absorbed by the laser rod causes stimu-
TABLE 6.4. Energy transfer in a cw krypton arc lamp,pumped Nd : YAG laser.
Heat dissipation of lamps 55%Heat dissipation of pump reflectors 30%Power absorbed by coolant
and flow tubes 7%Heat dissipation by rod 5%Laser output 2%Fluorescence output 0.4%Optical losses 0.6%
Power absorbed by laser rod 8%
Electrical input to lamps 100%

6.2. Pump Radiation Transfer Methods 219
lated emission and fluorescence at the laser wavelength and other main emissionbands. The remainder is dissipated as heat by the laser material.
In elliptical-pump cavities, the laser rod and lamp are often liquid cooled bycirculating the coolant in flow tubes that surround these elements. The inside ofthe pumping chamber itself is dry. However, in most cases the body of the reflectorcontains cooling chambers through which the coolant fluid passes.
In the so-called flooded cavity approach, the whole inside of the pump cavityis immersed in cooling fluid. The absence of flow tubes and separate coolingchambers for the reflector makes this type of cavity very compact and simplein design. For example, only one inlet and outlet are required for the coolingloop, whereas in an elliptical cavity with flow tubes, one pair of coolant portswith the associated fittings, tubing, and so on, is required for each reflector half,lamp, and laser rod. Also, in the flooded cavity design, lamp and laser rod can bebrought very close together, and no reflection losses from additional glass surfacesare encountered. Figure 3.18 presents a photograph of a commercial cw-pumpedNd : YAG laser featuring a single elliptical reflector in a flooded cavity.
Most liquid-cooled military-type Nd : YAG lasers and most commercial cw-pumped Nd : YAG lasers feature this design because of its compactness and sim-plicity. Figure 6.24 shows a photograph of a liquid-immersed pump cavity usedfor a high-repetition-rate military Nd : YAG laser. The cavity is sealed by onelarge O-ring in the top cover. The reflector inserts are machined from aluminumwhich is nickel-plated, polished, and silver-plated. The laser head is machinedfrom aluminum that is hard-anodized to prevent corrosion.
FIGURE 6.24. Laser head of a military Nd : YAG laser.

220 6. Optical Pump Systems
FIGURE 6.25. Exploded view of a single- and double-elliptical pump cavity of a cw-pumped Nd : YAG laser.
Figure 6.25 illustrates an exploded view of a double-elliptical pump cylin-der using immersion cooling. The laser head is machined from a solid block ofacrylic. This material alleviates the problem of arcing and eliminates the need toelectrically insulate the electrodes from the laser head. The reflector inserts aremachined from copper and are gold-plated.
The planar pump and cooling geometry achieved with a slab provides the possi-bility for one-dimensional heat flow. The design of flashlamp-pumped slab lasershas been extensively studied, and the potential advantages and deficiencies of suchsystems will be discussed in Chapter 7.
In Fig. 6.26 a single lamp is placed along the axis of the slab on each side.Appropriate reflectors are employed to distribute the pump light evenly over theslab surface area. Uniform pumping and cooling of the optical surfaces is abso-lutely crucial for good performance of this type of laser as will be discussed inChapter 7.
6.2.2 Side-Pumping with Diodes
In contrast to flashlamps, the emission from laser diodes is highly directional;therefore many arrangements are possible for transferring the pump radiation tothe solid-state laser material. Since the output beams of laser diodes can be shaped

6.2. Pump Radiation Transfer Methods 221
FIGURE 6.26. Flashlamp-pumped slab laser [18].
and focused, a major consideration is the design of a pump geometry which maxi-mizes the overlap of the pumped volume with the volume occupied by a low-orderresonator mode. The optimization of the overlap is referred to as mode-matching.
In side-pumping the diode arrays are placed along the length of the gain ma-terial and pumping is transverse to the direction of the laser beam. Scalability tohigher power is the advantage of this design approach. As more power is required,more diode arrays can be added along and around the laser rod. There are threeapproaches to couple the radiation emitted by the diode lasers to the rod:
(a) Direct coupling. From a design standpoint this is by far the most desirableapproach. However, this arrangement does not allow for much flexibility inshaping the pump radiation inside the laser rod.
(b) Intervening optics between source and absorber: In this case, the pump dis-tribution can be peaked at the center of the rod allowing for a better matchwith the resonator modes. Optical coupling can be achieved by using imag-ing optics such as lenses or elliptical and parabolic mirrors or by nonimagingoptics such as reflective or refractive flux concentrators.
(c) Fiber optic coupling. Due to the coupling losses combined with the increasedmanufacturing cost of fiber-coupled diode arrays, this technique is not veryattractive for side-pumping.
Whether or not to use intervening optics between the arrays and the laser roddepends mainly on the desired beam diameter and optical density of the activemedium. Generally speaking, oscillator pump heads usually employ optical ele-ments in order to concentrate the pump radiation in the center for efficient extrac-tions at the TEM00 mode, whereas large amplifier rods are direct-pumped.

222 6. Optical Pump Systems
FIGURE 6.27. Side-pumping of a cylindrical laser rod employing a hemispherical pumpgeometry.
An example of a side-pumped Nd : YAG rode is shown in Fig. 6.27, the laserrod is conductively cooled by a copper heat sink. The pumping cavity consistsof a number of linear arrays symmetrically located around the rod. The arraysare mounted on long heat-sink structures and contain cylindrical optics. The op-tics allow the arrays to stand-off from the laser crystal and the arrays. The outputapertures of the diode bars are imaged near the center of the rod by using a sym-metrical doublet of plano-convex cylindrical lenses. The rod surface in contactwith the heat sink has a reflective coating that returns the pump light for a secondpass through the rod.
For optimization of the pump distribution within the gain medium, a ray traceprogram is very useful. Figure 6.28 presents the result of such a calculation for the
FIGURE 6.28. Contour plot of pump intensity distribution.

6.2. Pump Radiation Transfer Methods 223
FIGURE 6.29. Arrangement of stacked diode array bars around a laser rod.
pump arrangement of Fig. 6.27. The code calculates the spatial pump distributionin the laser material as a function of spectral absorption, and the spectral and spa-tial properties of the radiation source as modified by the optical surfaces betweenthe source and absorber. The strong concentration of pump radiation at the centerof the rod was responsible for the good TEM00 performance of the laser.
A pump configuration of a high-power amplifier head which does not use cou-pling optics is illustrated in Fig. 6.29. The laser rod is surrounded by eight stackedarrays, each containing six bars. Since the bars are 1 cm long, and each bar pro-duces 12 mJ in a 200µs pump pulse, the rod can be pumped at 576 mJ per cen-timeter rod length.
Figure 6.30 displays a photograph of a pump head containing four rings ofstacked diode arrays. In this design, 4 cm of the 2 in long rod are pumped by thediode arrays. Large diode-pumped lasers employ liquid-cooled laser rods or slabssimilar to flashlamp-pumped systems. The laser-diode arrays are directly mountedon liquid-cooled heat sinks. Extremely compact and lightweight structures haveemerged which take full advantage of the high packaging density which can beachieved in the diode arrays.
Figure 6.31 presents a photograph of an assembled pump head for a side-pumped Nd : YAG rod pumped by 16 diode arrays. Each array is 1 cm long, andthe devices are arranged in four pairs symmetrically around the rod. The adja-cent four pairs are off-set 45◦ in order to achieve an eight-fold symmetry aroundthe laser crystal. The active pump area is 4 cm long and the complete assembly,including the end plates, has a length of 7 cm.
Each diode array contains five bars, that is, the laser crystal is pumped by 80bars at a pulse energy of 800 mJ in a 200µs-long pulse. Electrical input is 2 J perpulse that at a repetition rate of 100 Hz amounts to about 180 W of heat, whichhas to be carried away by the laser head. To carry off heat from the diodes andlaser rod, liquid flows into the pump head through a fitting that screws into the
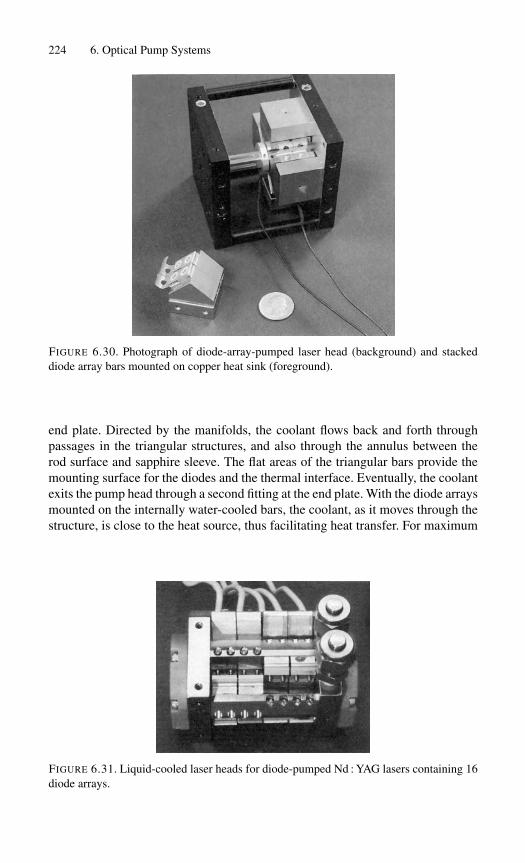
224 6. Optical Pump Systems
FIGURE 6.30. Photograph of diode-array-pumped laser head (background) and stackeddiode array bars mounted on copper heat sink (foreground).
end plate. Directed by the manifolds, the coolant flows back and forth throughpassages in the triangular structures, and also through the annulus between therod surface and sapphire sleeve. The flat areas of the triangular bars provide themounting surface for the diodes and the thermal interface. Eventually, the coolantexits the pump head through a second fitting at the end plate. With the diode arraysmounted on the internally water-cooled bars, the coolant, as it moves through thestructure, is close to the heat source, thus facilitating heat transfer. For maximum
FIGURE 6.31. Liquid-cooled laser heads for diode-pumped Nd : YAG lasers containing 16diode arrays.
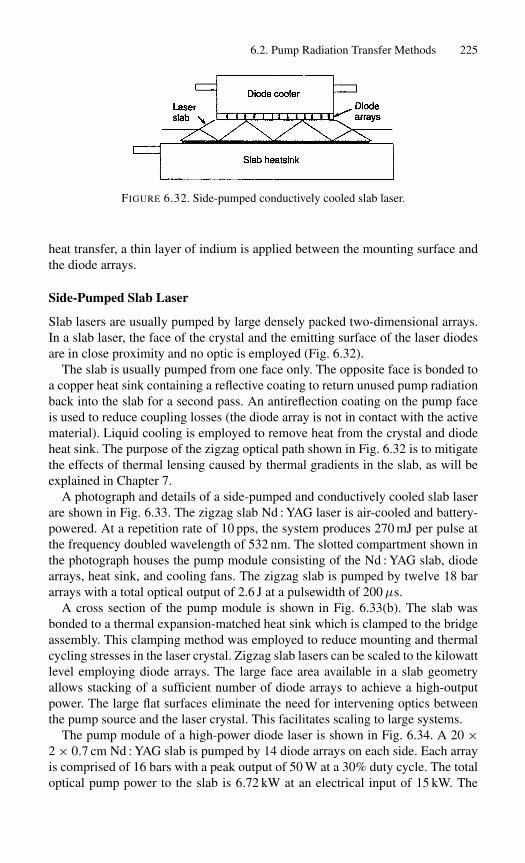
6.2. Pump Radiation Transfer Methods 225
FIGURE 6.32. Side-pumped conductively cooled slab laser.
heat transfer, a thin layer of indium is applied between the mounting surface andthe diode arrays.
Side-Pumped Slab Laser
Slab lasers are usually pumped by large densely packed two-dimensional arrays.In a slab laser, the face of the crystal and the emitting surface of the laser diodesare in close proximity and no optic is employed (Fig. 6.32).
The slab is usually pumped from one face only. The opposite face is bonded toa copper heat sink containing a reflective coating to return unused pump radiationback into the slab for a second pass. An antireflection coating on the pump faceis used to reduce coupling losses (the diode array is not in contact with the activematerial). Liquid cooling is employed to remove heat from the crystal and diodeheat sink. The purpose of the zigzag optical path shown in Fig. 6.32 is to mitigatethe effects of thermal lensing caused by thermal gradients in the slab, as will beexplained in Chapter 7.
A photograph and details of a side-pumped and conductively cooled slab laserare shown in Fig. 6.33. The zigzag slab Nd : YAG laser is air-cooled and battery-powered. At a repetition rate of 10 pps, the system produces 270 mJ per pulse atthe frequency doubled wavelength of 532 nm. The slotted compartment shown inthe photograph houses the pump module consisting of the Nd : YAG slab, diodearrays, heat sink, and cooling fans. The zigzag slab is pumped by twelve 18 bararrays with a total optical output of 2.6 J at a pulsewidth of 200µs.
A cross section of the pump module is shown in Fig. 6.33(b). The slab wasbonded to a thermal expansion-matched heat sink which is clamped to the bridgeassembly. This clamping method was employed to reduce mounting and thermalcycling stresses in the laser crystal. Zigzag slab lasers can be scaled to the kilowattlevel employing diode arrays. The large face area available in a slab geometryallows stacking of a sufficient number of diode arrays to achieve a high-outputpower. The large flat surfaces eliminate the need for intervening optics betweenthe pump source and the laser crystal. This facilitates scaling to large systems.
The pump module of a high-power diode laser is shown in Fig. 6.34. A 20 ×2 × 0.7 cm Nd : YAG slab is pumped by 14 diode arrays on each side. Each arrayis comprised of 16 bars with a peak output of 50 W at a 30% duty cycle. The totaloptical pump power to the slab is 6.72 kW at an electrical input of 15 kW. The

226 6. Optical Pump Systems
(a)
(b)
FIGURE 6.33. (a) Photograph of an air-cooled and battery-operated zigzag slab Nd : YAGlaser and (b) cross section of pump module [19].
system was designed for a pulse repetition rate of 2 kHz and a pump pulse lengthof 150 µs. With a 2 m long resonator, the pump head generated 740 W of averageQ-switched power in a 7 × diffraction limited beam. Peak power was 1 MW.
Depending on the way heat is extracted from the slab we can distinguish thethree design configurations illustrated in Fig. 6.35. If the slab is water-cooled,pumping and heat extraction can occur through the broad faces of the rectangularslab as shown in Fig. 6.35(a). Space and military applications require conductivelycooled slabs. One approach, shown in Fig. 6.35(b), is to conductively cool oneface of the slab and pump through the opposite side. More powerful lasers can be

6.2. Pump Radiation Transfer Methods 227
FIGURE 6.34. High-power diode-pumped Nd : YAG slab laser; shown is (a) the arrange-ment of the diode arrays and (b) a cross section of the pump head [20].
built by conduction cooling of both large surface areas of the slab. Pump radiationis introduced through the two narrow sides of the slab as shown in Fig. 6.35(c).Therefore this pumping geometry is termed edge-pumping [21]. The concentra-tion of pump radiation, which is possible with diode sources, makes this approachfeasible. In all three cases depicted in Fig. 6.35 pump radiation enters into the slabtransverse to the resonator axis and the laser output is extracted from the ends ofthe slab. Also the plane of the zigzag beam is collinear with the direction of thethermal gradients in the slab.
Pump Configurations Based on Internal Reflections of the Laser Beam
Besides the classical side-pumped configurations discussed in this section, thereis an almost unlimited number of pump-configuration variations possible. Mostof the more unusual design configurations utilize internal reflections of the laserbeam. In Fig. 6.36 designs are illustrated which contain one, or many internalreflections of the laser beam. An extension of this concept is the monolithic ringlaser which was discussed in Section 5.2.3.
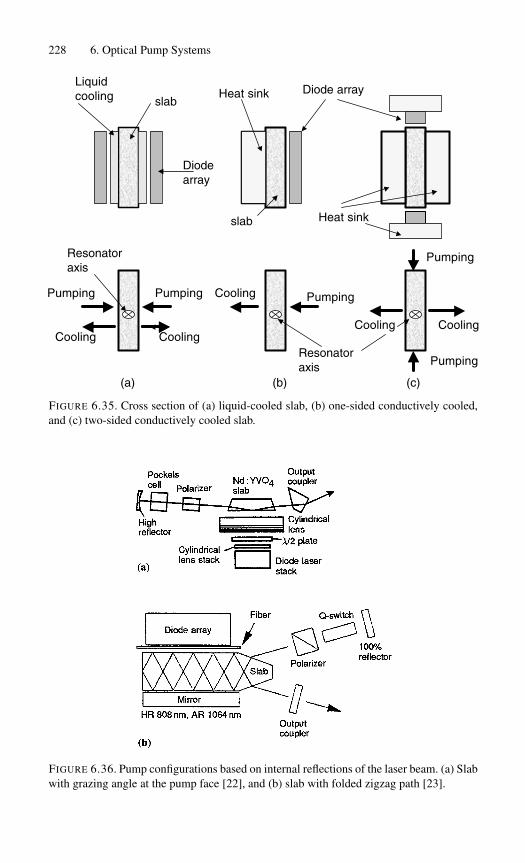
228 6. Optical Pump Systems
slab
Diode array
Liquid cooling
Resonator axis
Pumping
Cooling
PumpingCooling
CoolingCooling
Pumping
Pumping
Diode arrayHeat sink
Heat sinkslab
Resonator axis
Cooling
Pumping
(a) (b) (c)
FIGURE 6.35. Cross section of (a) liquid-cooled slab, (b) one-sided conductively cooled,and (c) two-sided conductively cooled slab.
FIGURE 6.36. Pump configurations based on internal reflections of the laser beam. (a) Slabwith grazing angle at the pump face [22], and (b) slab with folded zigzag path [23].

6.2. Pump Radiation Transfer Methods 229
FIGURE 6.37. Energy flow in a typical diode-pumped Nd : YAG laser. (Efficiencies aredefined in Section 3.4.1.)
In the design shown in Fig. 6.36(a) side-pumping through a polished face ofthe gain medium is used to obtain high gain. The resonator mode makes a singlegrazing-incidence total internal reflection at the pump face, thus remaining in theregion of the highest gain throughout its passage through the slab. This designhas been used for small Nd : YVO4 and Er : YAG lasers. Figure 6.36(b) exhibits aminiature slab laser with a folded zigzag path of the laser beam. The entrance andexit faces are cut at Brewster’s angle. The beam path in this particular Nd : YAGslab consisted of five bounces. The pump radiation is collimated in the plane ofthe zigzag path by a fiber lens to maximize the overlap between pump beam andresonator mode.
The excellent spectral match of the diode output and the absorption of the solid-state material, in conjunction with a high spatial overlap between pump radiationand resonator mode volume, are responsible for the high overall efficiencies thatcan be achieved in diode-pumped lasers. Figure 6.37 illustrates the energy flow ina typical Nd : YAG laser, pumped with a 20 W diode bar at 808 nm. Laser diodes
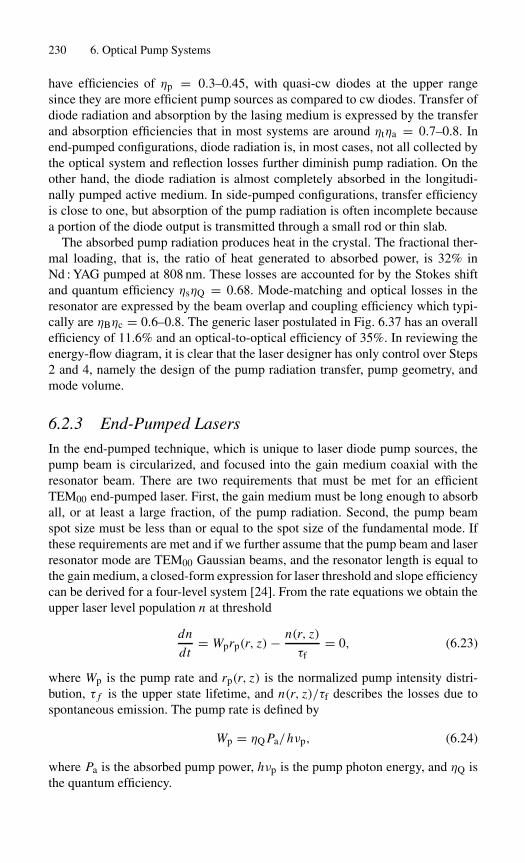
230 6. Optical Pump Systems
have efficiencies of ηp = 0.3–0.45, with quasi-cw diodes at the upper rangesince they are more efficient pump sources as compared to cw diodes. Transfer ofdiode radiation and absorption by the lasing medium is expressed by the transferand absorption efficiencies that in most systems are around ηtηa = 0.7–0.8. Inend-pumped configurations, diode radiation is, in most cases, not all collected bythe optical system and reflection losses further diminish pump radiation. On theother hand, the diode radiation is almost completely absorbed in the longitudi-nally pumped active medium. In side-pumped configurations, transfer efficiencyis close to one, but absorption of the pump radiation is often incomplete becausea portion of the diode output is transmitted through a small rod or thin slab.
The absorbed pump radiation produces heat in the crystal. The fractional ther-mal loading, that is, the ratio of heat generated to absorbed power, is 32% inNd : YAG pumped at 808 nm. These losses are accounted for by the Stokes shiftand quantum efficiency ηsηQ = 0.68. Mode-matching and optical losses in theresonator are expressed by the beam overlap and coupling efficiency which typi-cally are ηBηc = 0.6–0.8. The generic laser postulated in Fig. 6.37 has an overallefficiency of 11.6% and an optical-to-optical efficiency of 35%. In reviewing theenergy-flow diagram, it is clear that the laser designer has only control over Steps2 and 4, namely the design of the pump radiation transfer, pump geometry, andmode volume.
6.2.3 End-Pumped Lasers
In the end-pumped technique, which is unique to laser diode pump sources, thepump beam is circularized, and focused into the gain medium coaxial with theresonator beam. There are two requirements that must be met for an efficientTEM00 end-pumped laser. First, the gain medium must be long enough to absorball, or at least a large fraction, of the pump radiation. Second, the pump beamspot size must be less than or equal to the spot size of the fundamental mode. Ifthese requirements are met and if we further assume that the pump beam and laserresonator mode are TEM00 Gaussian beams, and the resonator length is equal tothe gain medium, a closed-form expression for laser threshold and slope efficiencycan be derived for a four-level system [24]. From the rate equations we obtain theupper laser level population n at threshold
dn
dt= Wprp(r, z)− n(r, z)
τf= 0, (6.23)
where Wp is the pump rate and rp(r, z) is the normalized pump intensity distri-bution, τ f is the upper state lifetime, and n(r, z)/τf describes the losses due tospontaneous emission. The pump rate is defined by
Wp = ηQ Pa/hνp, (6.24)
where Pa is the absorbed pump power, hνp is the pump photon energy, and ηQ isthe quantum efficiency.

6.2. Pump Radiation Transfer Methods 231
From the threshold condition (3.7) and with (3.12) we obtain
2nσ ls0(r, z) = T + δ, (6.25)
the term s0(r, z) has been added to describe the normalized resonator mode inten-sity distribution. From (6.23)–(6.25) follows
Pa = hνp(T + δ)
τfηQ2σ lrp(r, z)s0(r, z). (6.26)
The spatial distribution of the pump volume rp(r, z) and resonator mode s0(r, z) istaken into account by calculating an overlap integral that averages the upper laserlevel population over the laser resonator mode. With the assumption of TEM00Gaussian beams, the normalized expressions for the pump and resonator modesare given by
rp(r, z) = 2α0 exp(−α0z) exp(−2r2/w2p)
πw2p[1 − exp(−α0l)] (6.27a)
and
s0(r, z) = 2 exp(−2r2/w20)
πw20l
, (6.27b)
where ∫ ∫ ∫rp(r, z) dV =
∫ ∫ ∫s0(r, z) dV = 1, (6.27c)
α0 is the absorption coefficient at the pump wavelength, wp, w0 is the Gaussianbeam radius of the pump beam and resonator modes, respectively, and L is thelength of the gain medium and resonator. With (6.27) the overlap integral can becalculated ∫ ∫ ∫
s0(r, z)rp(r, z) dV = 2/�(w20 + w2
p)π. (6.28)
With (6.28) following from (6.26) for the absorbed pump power at threshold
Pa = πhνL
4σηQηsτf(w2
0 + w2p)(T + δ), (6.29)
where hνp has been replaced by the laser photon energy hνL, and ηs is the quan-tum defect efficiency.
From (6.29) it follows that a low-laser threshold requires small spot sizes andlow losses. The smallest mode dimensions are determined by diffraction and bythe length l of the resonator. As explained in Chapter 5, the cross-sectional area ofa mode is proportional to resonator length. Efficient absorption of pump radiationrequires that l should be on the order of or greater than 1/α0, where α0 is the
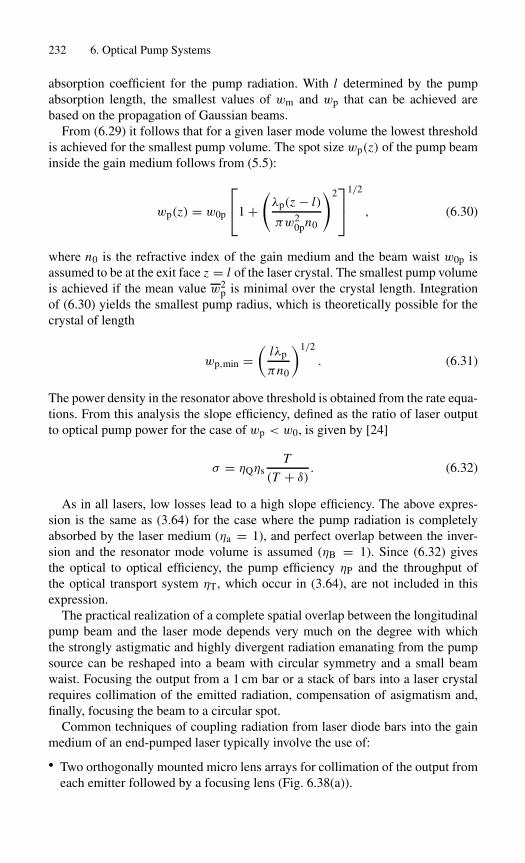
232 6. Optical Pump Systems
absorption coefficient for the pump radiation. With l determined by the pumpabsorption length, the smallest values of wm and wp that can be achieved arebased on the propagation of Gaussian beams.
From (6.29) it follows that for a given laser mode volume the lowest thresholdis achieved for the smallest pump volume. The spot size wp(z) of the pump beaminside the gain medium follows from (5.5):
wp(z) = w0p
1 +
(λp(z − l)
πw20pn0
)2
1/2
, (6.30)
where n0 is the refractive index of the gain medium and the beam waist w0p isassumed to be at the exit face z = l of the laser crystal. The smallest pump volumeis achieved if the mean value w2
p is minimal over the crystal length. Integrationof (6.30) yields the smallest pump radius, which is theoretically possible for thecrystal of length
wp,min =(
lλp
πn0
)1/2
. (6.31)
The power density in the resonator above threshold is obtained from the rate equa-tions. From this analysis the slope efficiency, defined as the ratio of laser outputto optical pump power for the case of wp < w0, is given by [24]
σ = ηQηsT
(T + δ). (6.32)
As in all lasers, low losses lead to a high slope efficiency. The above expres-sion is the same as (3.64) for the case where the pump radiation is completelyabsorbed by the laser medium (ηa = 1), and perfect overlap between the inver-sion and the resonator mode volume is assumed (ηB = 1). Since (6.32) givesthe optical to optical efficiency, the pump efficiency ηP and the throughput ofthe optical transport system ηT, which occur in (3.64), are not included in thisexpression.
The practical realization of a complete spatial overlap between the longitudinalpump beam and the laser mode depends very much on the degree with whichthe strongly astigmatic and highly divergent radiation emanating from the pumpsource can be reshaped into a beam with circular symmetry and a small beamwaist. Focusing the output from a 1 cm bar or a stack of bars into a laser crystalrequires collimation of the emitted radiation, compensation of asigmatism and,finally, focusing the beam to a circular spot.
Common techniques of coupling radiation from laser diode bars into the gainmedium of an end-pumped laser typically involve the use of:
• Two orthogonally mounted micro lens arrays for collimation of the output fromeach emitter followed by a focusing lens (Fig. 6.38(a)).

6.2. Pump Radiation Transfer Methods 233
Heat sink
Fast axiscollimation
Focusing lens
Laserbar Slow axis
Collimation
Outputmirror
Nd:YAG
(a)
Focusinglens
Diodearray
Fiber lens
Nd:YAG
Outputmirror
OutputHR 1064nmAR 808 nm
AR1064 nm1064 nm
Fiberopticbundle
Collimation andfocusing optics
Nd:YVO4
Outputmirror
(b)
(c)
Output1064nm
FIGURE 6.38. Focusing of pump radiation into an end-pumped laser: (a) with two cylindri-cal micro lens arrays and a focusing lens, (b) a single micro lens array and a focusing lens,(c) a micro lens array followed by a fiber bundle and focusing optics, and (d) a nonimaginglight concentrator [25].
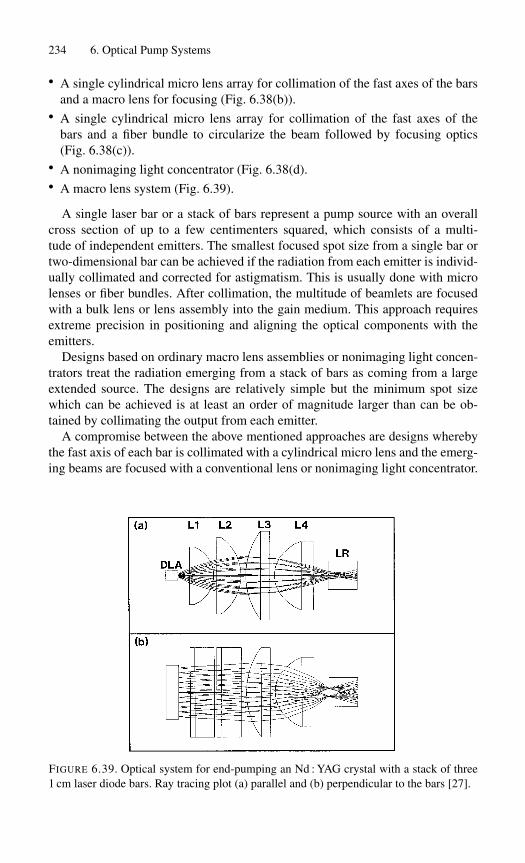
234 6. Optical Pump Systems
• A single cylindrical micro lens array for collimation of the fast axes of the barsand a macro lens for focusing (Fig. 6.38(b)).
• A single cylindrical micro lens array for collimation of the fast axes of thebars and a fiber bundle to circularize the beam followed by focusing optics(Fig. 6.38(c)).
• A nonimaging light concentrator (Fig. 6.38(d).• A macro lens system (Fig. 6.39).
A single laser bar or a stack of bars represent a pump source with an overallcross section of up to a few centimenters squared, which consists of a multi-tude of independent emitters. The smallest focused spot size from a single bar ortwo-dimensional bar can be achieved if the radiation from each emitter is individ-ually collimated and corrected for astigmatism. This is usually done with microlenses or fiber bundles. After collimation, the multitude of beamlets are focusedwith a bulk lens or lens assembly into the gain medium. This approach requiresextreme precision in positioning and aligning the optical components with theemitters.
Designs based on ordinary macro lens assemblies or nonimaging light concen-trators treat the radiation emerging from a stack of bars as coming from a largeextended source. The designs are relatively simple but the minimum spot sizewhich can be achieved is at least an order of magnitude larger than can be ob-tained by collimating the output from each emitter.
A compromise between the above mentioned approaches are designs wherebythe fast axis of each bar is collimated with a cylindrical micro lens and the emerg-ing beams are focused with a conventional lens or nonimaging light concentrator.
FIGURE 6.39. Optical system for end-pumping an Nd : YAG crystal with a stack of three1 cm laser diode bars. Ray tracing plot (a) parallel and (b) perpendicular to the bars [27].

6.2. Pump Radiation Transfer Methods 235
Lens Transfer SystemA very effective method of collimating the output from two-dimensional barsis by means of two orthogonally oriented arrays of micro lenses. The first setof lenses are typically cylindrical micro lenses similar to short pieces of opticalfibers. Each lens is oriented along the length of a bar close to the facets of theemitters. These fiber lenses, mounted in a rigid holder assembly, collimate the fastaxis of each bar within the stacked array. The number of micro lenses required isthus given by the number of bars in the array. These fiber lenses are 1 cm long andhave a maximum diameter determined by the pitch of the array (typically 0.4 to1 mm). The distance from the facets is determined by the back focal length whichis, for a micro lens with a circular cross section and uniform refractive index,D(2 − n0)/4(n0 − 1). For a fiber lens with a diameter D = 800µm, made fromfused silica with n = 1.51, the distance between the micro lens and the facet istherefore 200µm.
Instead of simple step-index fibers with a circular cross section, lenses withnoncircular cross section (aspherics) or graded index (GRIN) lenses can be usedto reduce spherical aberration. Aspheric lenses can be fabricated in large volumefrom drawing of a shaped-glass preform. It is also common practice to make mi-cro lens arrays monolithic rather than from discrete segments of optical fibers.Monolithic arrays consist of a glass plate in which parallel curved surfaces thatoptically act the same way as individual fiber lenses are shaped (see Fig. 6.13(b)).
Mounted orthogonally in front of the first array of micro lenses is another setof micro lenses for collimation of the slow axis or each emitter. The number ofmicro lenses is given in this case by the number of emitters in each bar. Thediameter of the micro lenses cannot exceed the spacing between adjacent emitters(0.2 to 1 mm). Because of the stand-off distance from the facets, which is largelydetermined by the intervening horizontal lens array, the back focal length of thesecond lens array must be significantly larger than the lens diameter. This rulesout micro lenses with a circular cross section since these optical elements havea very short back focal length. Either aspheric or plano-convex cylindrical microlenses are normally used for the collimation of the slow axis of the emitters.
As an example, we consider a typical 1 cm cw bar which contains 20 emitterseach 100µm wide and spaced 400µm apart as shown in Fig. 6.12. If we assume a5-bar internally cooled stack with a pitch of 1 mm, a collimator could be designedthat consists of a matrix of five horizontal cylindrical micro lenses with a circulardiameter of 800µm and a back focal length of 200µm and 20 vertical plano-convex lenses with a diameter of 500µm and a back focal length of 2.5 mm. Withthe approach discussed so far, the output from a stacked bar can be focused to aspot with a diameter of a few hundred micrometers.
If larger spot sizes can be tolerated, a compromise between complexity andperformance can be reached if only one array of micro lenses is employed fol-lowed by an ordinary lens system. In a typical design, a set of fiber lenses reducesthe beam divergence of the fast axis of each bar to match the divergence of theslow axis and a bulk lens focuses the beam into the active medium. Figure 6.38(b)illustrates such an approach.
236 6. Optical Pump Systems
In the absence of micro lenses or fiber-optic bundles one can attempt to focusthe radiation from a single bar or stacked bar array with conventional optics. Asalready mentioned, the power density at the focal point will be far below thatwhich can be achieved with micro-optics. To illustrate this point and to provide acomparison the following example is given.
Figure 6.39 depicts an imaging optical system for focusing pump radiation froma stack of three 1 cm bars into an Nd : YAG crystal. The optic consists of twocylindrical lenses, L1 and L2, with 12.7 and 19 mm focal length, respectively,followed by a 30 mm focal length plano-convex lens L3 and a 12 mm focal lengthaspheric L4. The rays traced in the plane perpendicular to the bars span a totalangular field of 60◦ at the source and those traced in the plane parallel to the barscover a total field of 10◦. The corresponding width at the pump end of the laserrod is ≈ 2 mm.
In order to at least approximately match such a large pump profile with theresonator mode, a near hemispherical resonator was chosen. The resonator lengthwas adjusted until the TEM00 mode at the curved mirror and the front surfaceof the Nd : YAG was expanded to 1.8 mm. At the flat output coupler the 1/e2
beam diameter was 120µm. The expansion of the mode at the pump end of theresonator is achieved at the expense of alignment stability. A photograph of thesystem is shown in Fig. 3.27.
Fiber Coupling
Using fiber optics to deliver the diode output to the laser crystal has a number ofadvantages: the beam at the fiber output has a circular distribution and the abilityto remove heat from the diode remote from the optical components of the laseris an attractive feature. Also the pump source can be replaced relatively easilywithout disturbing the alignment of the laser. Typically one of the following threetechniques is implemented in coupling the output from a diode bar or stacked barinto an optical fiber.
The first approach is identical to the technique already described for end-pumping a laser. Two sets of micro lenses and a condensor lens are used forfocusing the radiation into a multimode fiber with a diameter of 200 to 400µm.In another design, the output from a diode bar is first collimated using a fiberlens and subsequently imaged with a combination of lenses into a two-mirrorbeam-shaping device. With this focusing scheme the output from a 1 cm bar hasbeen focused into a circular spot of less than 200µm [26].
In the third approach a fiber bundle is employed to transform a line source,which a single 1 cm bar represents, into a circular beam. A micro lens reduces thedivergence of the fast axis of the emitters before the radiation is collected by aflat bundle of fibers (see Fig. 6.38(c)). The line-to-bundle converting fiber-opticcoupler consists of a large number of small fibers spread out in a linear arraywhich faces the emitting diodes of the laser bar. At the other end, the fibers arearranged into a round fiber bundle.
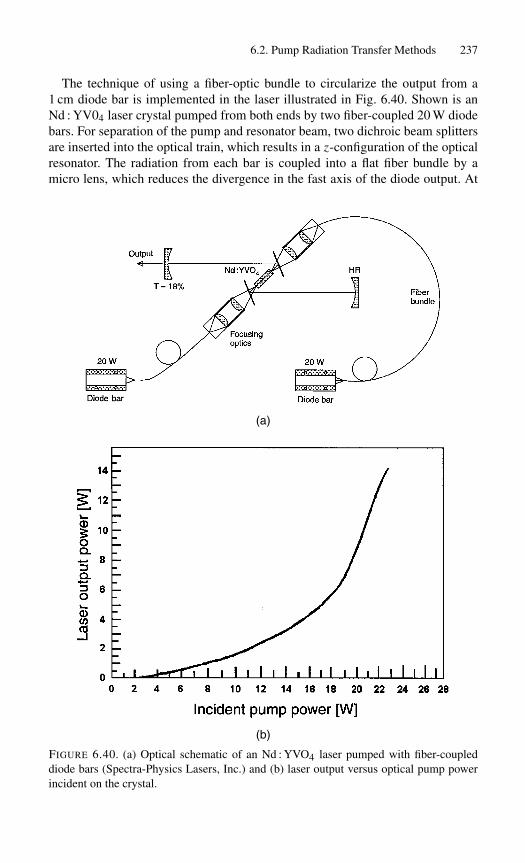
6.2. Pump Radiation Transfer Methods 237
The technique of using a fiber-optic bundle to circularize the output from a1 cm diode bar is implemented in the laser illustrated in Fig. 6.40. Shown is anNd : YV04 laser crystal pumped from both ends by two fiber-coupled 20 W diodebars. For separation of the pump and resonator beam, two dichroic beam splittersare inserted into the optical train, which results in a z-configuration of the opticalresonator. The radiation from each bar is coupled into a flat fiber bundle by amicro lens, which reduces the divergence in the fast axis of the diode output. At
(a)
(b)
FIGURE 6.40. (a) Optical schematic of an Nd : YVO4 laser pumped with fiber-coupleddiode bars (Spectra-Physics Lasers, Inc.) and (b) laser output versus optical pump powerincident on the crystal.

238 6. Optical Pump Systems
FIGURE 6.41. End-pumping with a nonimaging light concentrator [28].
the pump end, the fibers form a round bundle, and a collimating and focusinglens transfer the pump radiation into the crystal through a dichroic fold mirror.The high efficiency that can be achieved with diode end-pumped solid-state lasersis illustrated in Fig. 6.40(b). With a fiber coupling efficiency of 85% and somereduction in the rated power level of the diode to preserve lifetime, each sideof the Nd : YVO4 crystal is pumped with 13 W. Pump radiation at the crystal isconverted with over 50% conversion efficiency into a polarized TEM00 mode.
Maximum output of the system is 13 W. An Nd : YAG laser used in the sameconfiguration produced 11 W of polarized cw output.
Nonimaging Light Concentrators
Figure 6.41 illustrates an end-pumping technique based on a nonimaging devices.In this approach the output from a stack of bars is first collimated in the fast axisby cylindrical micro lenses mounted in front of each bar. The collimated radiationis directed into a lens duct that combines focusing at its curved input face and totalinternal reflection at the planar faces to channel the diode pump radiation to thelaser rod. Powerful Nd : YAG, Tm : YAG, and Yb : YAG lasers have been pumpedwith this technique and outputs in excess of 100 W have been reached in theselasers. A slightly different version of a light concentrator that has parallel wallsin the vertical direction is shown in Fig. 6.38(c). Concentrators are an attractivesolution for large stacks because they are relatively easy to fabricate. The degreeof concentration is governed by the radiance theorem stating that the radiance ofthe light distribution produced by an imaging system cannot be greater than theoriginal source radiance.
6.2.4 Face-Pumped Disks
In a disk laser amplifier the surfaces are set at Brewster’s angle, as shown inFig. 6.42. The slab faces have a high-quality optical finish to minimize scatter-ing loss. The beam is linearly polarized in the p-plane to avoid reflection loss.Flashlamps are used for pumping, with lamp radiation incident on the disk facesand transverse to the beam direction. Thus, the disks are said to be face-pumped.Nd : glass amplifiers containing glass disks have mainly been developed at labo-
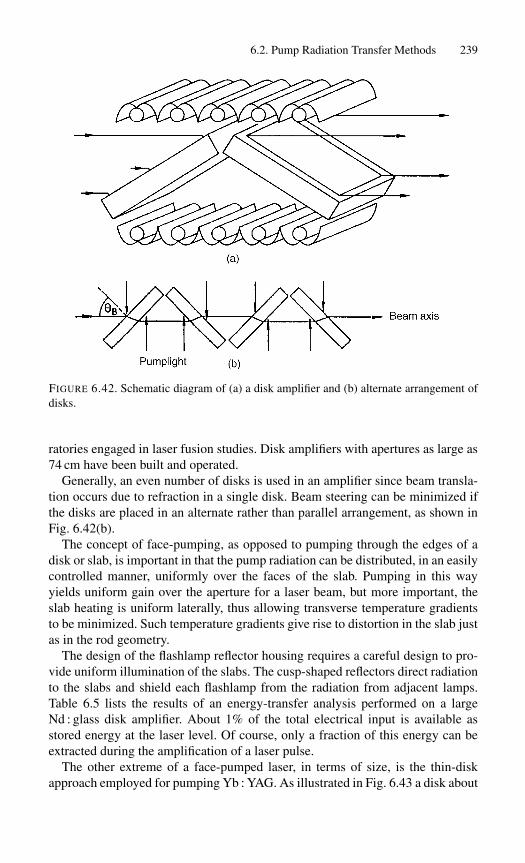
6.2. Pump Radiation Transfer Methods 239
FIGURE 6.42. Schematic diagram of (a) a disk amplifier and (b) alternate arrangement ofdisks.
ratories engaged in laser fusion studies. Disk amplifiers with apertures as large as74 cm have been built and operated.
Generally, an even number of disks is used in an amplifier since beam transla-tion occurs due to refraction in a single disk. Beam steering can be minimized ifthe disks are placed in an alternate rather than parallel arrangement, as shown inFig. 6.42(b).
The concept of face-pumping, as opposed to pumping through the edges of adisk or slab, is important in that the pump radiation can be distributed, in an easilycontrolled manner, uniformly over the faces of the slab. Pumping in this wayyields uniform gain over the aperture for a laser beam, but more important, theslab heating is uniform laterally, thus allowing transverse temperature gradientsto be minimized. Such temperature gradients give rise to distortion in the slab justas in the rod geometry.
The design of the flashlamp reflector housing requires a careful design to pro-vide uniform illumination of the slabs. The cusp-shaped reflectors direct radiationto the slabs and shield each flashlamp from the radiation from adjacent lamps.Table 6.5 lists the results of an energy-transfer analysis performed on a largeNd : glass disk amplifier. About 1% of the total electrical input is available asstored energy at the laser level. Of course, only a fraction of this energy can beextracted during the amplification of a laser pulse.
The other extreme of a face-pumped laser, in terms of size, is the thin-diskapproach employed for pumping Yb : YAG. As illustrated in Fig. 6.43 a disk about

240 6. Optical Pump Systems
TABLE 6.5. Energy transfer in anNd : glass disk amplifier [29].
Circuit losses 8%Lamp heat 50%Heating of pump cavity walls 30%Ultraviolet absorption 7%Heating of glass disks 2%Fluorescence decay 2%Useful laser energy 1%
Electrical input to lamps 100%
300µm thick is pumped in a small spot of a few millimeters in diameter at a smallangle about the normal of the disk face. The 941 nm pumps radiation reflectedback from the disk is refocused by a mirror for a second path through the crystal.The backside of the disk, which is in contact with a heat sink, is coated to form oneof the resonator mirrors. The other resonator mirror is the curved output couplershown in Fig. 6.43.
In the thin-disk laser, waste heat generated in the disk is extracted through theback high-reflectivity mirror and to an actively cooled submount that holds thelaser disk. The key feature of the thin-disk design approach is that this coolinggeometry constrains resulting thermal gradients to lie essentially parallel to thelaser resonator axis. Consequently, thermal focusing by the gain disk is greatlyreduced, facilitating the achievement of high beam quality.
Outcouplingmirror
Optical fiber
Pumping lens
Crystal disc
Indium foil
Heat sink
Pumping mirror
FIGURE 6.43. Thin-disk-pumping geometry of a Yb : YAG laser [30].

Summary 241
Summary
This chapter deals with the design and characteristics of the pump sources em-ployed in solid state lasers and with the techniques and methods that have been de-veloped for transferring the radiation from the pump source to the laser medium.The designs of an optical pump system for a solid state laser is governed bythe following considerations: the spectral and spatial emission characteristicsof the pump source, transfer of pump radiation to the gain medium, absorp-tion of the pump radiation, and spatial overlap with the mode volume in theresonator.
The pump sources for solid-state lasers are flash lamps, continuous arc lamps,and laser diode arrays. In flash lamps that are typically operated at high currentdensities, the spectral line structure of the particular fill gas is masked by a strongcontinuum. The output spectrum resembles a blackbody radiator. In continuousarc lamps, the continuum emission spectrum contains sharp emission lines thatare characteristic of the particular fill gas. The output from flash lamps and arclamps is broadband, and only a small fraction of the total output spectrum fallswithin the absorption bands of the active medium. Diode lasers, on the other hand,are narrowband emitters and by adjusting the composition of the semiconductormaterial, the output wavelength can be shifted to match an absorption band of aparticular solid-state laser material.
The transfer of radiation from the pump source to the laser medium shouldbe highly efficient, and ideally the pump radiation should create an inversionthat spatially overlaps the volume of the resonator mode. The total absorptionof pump radiation depends on the absorption coefficient and thickness of the lasermedium. However, mode structure and thereby beam uniformity and divergenceare strongly affected by the pump power distribution inside the active material.In flash lamps and arc-lamp pumped lasers, the active medium and the radiationsource are contained in highly reflective enclosures. Typical pump cavities con-sist of reflective elliptical cylinders with the lamp and active medium at each focalaxis, or so-called closed coupled cavities where the lamp and laser rod are in closeproximity surrounded by reflective metal or white ceramic walls.
Since radiation from diode lasers is directional, reflective enclosures are notneeded. In the so-called side-pumped configuration, the laser diode arrays areplaced along the length of cylindrical laser rods or rectangular slabs and the pumpradiation propagates perpendicular to the axis of the resonator. In this config-uration laser diode arrays are essentially used as replacements for flashlamps.Other designs exploit more fully the spatial properties of laser diodes by employ-ing intervening optics to shape the pump beam to achieve good overlap with theresonator fundamental mode. The most efficient pump method is end-pumping,whereby pump and laser radiation propagate collinear inside the active material.End pumping has the advantage that total absorption of the pump radiation is ob-tained, and an excellent overlap between the pump volume and the laser mode canbe achieved.

242 6. Optical Pump Systems
References[1] J.H. Goncz: Instr. Soc. Am. Trans. 5, 1 (1966).
[2] J.H. Goncz: J. Appl. Phys. 36, 742 (1965).
[3] H.E. Edgerton, J.H. Goncz, and J. Jameson: Xenon flashlamps, limits of operation.Proc. 6th Int’l Congr. on High Speed Photography, Haarlem, Netherlands, 1963,p. 143.
[4] F. Schuda: in Flashlamp-Pumped Laser Technology (edited by F. Schuda). SPIE Proc.609, 177 (1986).
[5] J.P. Markiewicz and J.L. Emmett: IEEE J. Quantum Electron. QE-2, 707 (1966).
[6] J.F. Holzrichter and J.L. Emmett: Appl. Opt. 8, 1459 (1969).
[7] J. Hecht: The Laser Guidebook, 2nd ed. (McGraw-Hill, New York), 1991.
[8] W. Streifer, D.R. Scifres, G.L. Harnagel, D.F. Welch, J. Berger, and M. Sakamoto:IEEE J. Quantum Electron. QE-24, 883 (1988).
[9] R.S. Geels, D.F. Welch, D.R. Scifres, D.P. Bour, D.W. Treat, and R.D. Bringans:CLEO 93, Tech. Digest, Paper CThQ3 (1993), 478.
[10] M. Ettenberg: Laser Focus 22, 86 (May 1985).
[11] E. Kapon: Semiconductor Diode Lasers: Theory and Techniques, in Handbook ofSolid-State Lasers, (edited by P.K. Cheo), (Marcel Dekker, New York), 1989.
[12] R. Burnham, Fibertek, Inc. Private communication.
[13] N.P. Barnes, M.E. Storm, P.L. Cross, and M.W. Skolaut: IEEE J. Quantum Electron.QE-26, 558 (1990).
[14] G.C. Osbourn, P.L. Gourley, I.J. Fritz, R.M. Biefield, L.R. Dawson, and T.E. Zip-perian: Principles and applications of strained-layer superlattices, in Semiconductorsand Semimetals, Vol. 24, Applications of Multiple Quantum Wells, Doping, and Su-perlattices (edited by R. Dingle) (Academic Press, San Diego, CA), 1987, p. 459.
[15] S.B. Schuldt and R.L. Aagard: Appl. Opt. 2, 509 (1963).
[16] C. Bowness: Appl. Opt. 4, 103 (1965).
[17] Yu.A. Kalinin and A.A. Mak: Opt. Tech. 37, 129 (1970).
[18] Lawrence Livermore National Lab., Medium Average Power Solid State Laser Tech-nical Information Seminar, CA (October 1985).
[19] A.D. Hays, G. Witt, N. Martin, D. DiBiase, and R. Burnham: UV and Visible Lasersand Laser Crystal Growth (edited by R. Scheps, M.R. Kokta). SPIE Proc. 2380, 88(1995).
[20] R. Burnham, G. Moule, J. Unternahrer, M. McLaughlin, M. Kukla, M. Rhoades, D.DiBiase, and W. Koechner: Laser ’95 (Munich), Paper K9.
[21] T.S. Rutherford, W.M. Tulloch, E.K. Gustafson, and R.L. Byer: IEEE J. QuantumElectron. QE-36, 205 (2000).
[22] J.E. Bernard and A.J. Alcock: Opt. Lett. 19, 1861 (1994); also 18, 968 (1993).
[23] J. Richards and A. Mclnnes: Opt. Lett. 20, 371 (1995).
[24] T.Y. Fan and R.L. Byer: IEEE J. Quantum Electron. QE-24, 895 (1988).
[25] A. Brignon, G. Feugnet, J.P. Huignard, and J.P. Pocholle: IEEE J. Quantum Electron.QE-34, 577 (1998)
[26] W.A. Clarkson and D.C. Hanna: Opt. Lett 21, 869 (1996).
[27] H.R. Verdun and T. Chuang: Opt. Lett. 17, 1000 (1992).

Exercises 243
[28] E.C. Holnea, C.A. Ebbers, R.J. Beach, J.A. Speth, J.A. Skidmore, M.A. Emanuel,and S.A. Payne: Opt. Lett. 23, 1203 (1998).
[29] J. Trenholme: Optimizing the design of a kilojoule laser amplifier chain. Laser FusionProgram, Semiannual Report, Lawrence Livermore Laboratory, 1973, p. 60.
[30] Datasheet, Jenoptik Laser, Jena, Germany.
Exercises
1. In the text an example of a small, xenon-filled, linear flashlamp used in mil-itary equipment is given. It indicates that such a lamp is operated at 10 J perpulse and at 20 pulses per second. The lamp’s inner diameter is 4 mm and itsdischarge length is 60 mm long. If the pulse width is 300µs long calculate theexplosion limit and the expected useful lifetime (number of pulses) for 10 Jpulses using (6.3) and (6.4). Does your result agree with that in the exampleand why? (There may be more than the obvious reason.)
2. It seems clear that you would prefer to deliver all the pump energy you couldto the gain medium before fluorescence losses start to significantly deplete theinversion that you are trying to build. This comment is particularly importantwhen you are building Q-switched lasers since you are trying to hold off las-ing until the inversion gets large and then to let it lase. You would prefer notto waste any pump energy by pumping too slowly. Therefore, for a 6.0 mmdiameter and 100.0 mm long Nd : YAG laser rod, use the equations derived inthis chapter to select a reasonable xenon-filled flashlamp capable of deliveringup to 20 J per pulse at a repetition rate of 10 Hz. “Reasonable” means one thatdelivers a pulse shorter than the fluorescent lifetime (you can look the lifetimeup in the text) and which demands reasonable size capacitors and inductors,reasonable voltage, and operates with a critically damped pulse. The choiceof pressure and lamp dimensions will tell you something of the lamp’s elec-trical properties. From this you can find the circuit parameters needed for itsoperation. Be careful to make the pulse duration short, but not so short that thelamp’s useful lifetime is less than 107 shots.
3. Calculate the heat flux in watts per square centimeter of a diode laser at 808 nmthat emits 2 W of laser power and is 0.1 mm wide by 1.0 mm long. Assumeit is 40% efficient and that what does not appear as light appears as heat inthe diode. Compare this to the heat flux into the heat removal plates that thispump light would produce if it were completely absorbed in a solid-state lasermedium in a cylinder of diameter 200µm and length 1 mm. This microlasergain medium is a small chip 1 mm thick by 1 mm in diameter held between twocopper heat removal plates with 500µm diameter holes in them as sketchedbelow.
4. Derive equation (6.28).
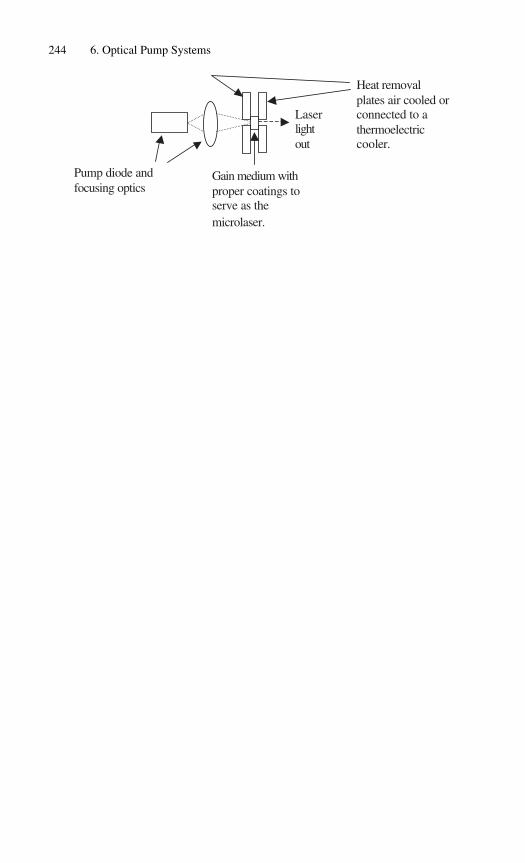
244 6. Optical Pump Systems
Pump diode and focusing optics
Gain medium with proper coatings to serve as the microlaser.
Heat removal plates air cooled or connected to a thermoelectric cooler.
Laser light out
7
Thermo-Optic Effects
7.1 Cylindrical Geometry
7.2 Slab and Disk Geometries
7.3 End-Pumped Configurations
References
Exercises
The optical pumping process in a solid-state laser material is associated with thegeneration of heat for a number of reasons:
(a) the energy difference of the photons between the pump band and the upperlaser level is lost as heat to the host lattice; similarly, the energy differencebetween the lower laser level and the ground state is thermalized. The dif-ference between the pump and laser photon energies, termed quantum defectheating, is the major source of heating in solid-state lasers.
(b) In addition, nonradiative relaxation from the upper laser level to the groundstate, due to concentration quenching, and nonradiative relaxation from thepump band to the ground state will generate heat in the active medium.
(c) In flashlamp-pumped systems, the broad spectral distribution of the pumpsource causes a certain amount of background absorption by the laser hostmaterial, particularly in the ultraviolet and infrared regions of the lamp spec-trum. Absorption of lamp radiation by impurity atoms and color centers canfurther increase heating.
The temperature gradients set-up in the gain material as a result of heatingcan lead to stress fracture, which represents the ultimate limit in average powerobtainable from a laser material. Below the stress fracture limit thermal lensingand birefringence adversely affect the output beam quality. Also, due to thermallensing, the operating point of the resonator within the stability diagram becomesa function of input power. Therefore the output beam quality and mode structure
245

246 7. Thermo-Optic Effects
are power dependent because the thermal lens can only be compensated for oneinput power level.
Efficient heat removal, and the reduction of the thermal effects that are causedby the temperature gradients across the active area of the laser medium usuallydominate design considerations for high-average-power systems.
The ability to predict the amount of heat generated in a laser material is im-portant to obtain an indication of the thermo-optic effects that can be expected ina particular rod or slab laser. In the laser literature several parameters have beenintroduced to quantify the amount of heat dissipated by the active material. Thefractional thermal loading ηh is defined as the ratio of heat produced to absorbedpump power or energy. A different way to quantify heat generation is expressedby the parameter χ , defined as the ratio of heat deposited to energy stored in theupper laser level.
The theoretical lower limit of ηh for ND : YAG lasing at 1.06µm and pumpedwith a laser diode pump source at 808 nm is ηh = 1 − λp/λL = 0.24, whereηS = λp/λL is the Stokes factor discussed in Section 3.4.1 and λp and λL are thewavelengths of the pump and laser beam, respectively.
A Yb : YAG crystal lases at 1.03µm and can be diode-pumped at 943 nm. Ow-ing to the smaller difference between pump and laser photon energy the theoreticalthermal loading is only ηh = 0.09.
In flashlamps and cw krypton arc lamps optical excitation is less efficient com-pared to laser diode pumping because of the comparatively high content of shortwavelength radiation in the spectrum. Therefore the difference between pump andlaser photon energies is larger and results in sizeable quantum defect heating.
In actual lasers there are also a number of nonradiative decay processes thatgenerate heat but do not contribute to laser output. Concentration quenching, sonamed because it increases strongly with neodymium-doping levels, causes a non-radiative decay of excited ions from the upper laser level to the ground state. Con-centration quenching reduces the radiative quantum efficiency to less than unity.So-called “dark neodymium ions” or “dead sites” are ions that absorb pump pho-tons but do not contribute to inversion. This leads to a pump quantum efficiencyof less than unity.
The fraction of absorbed pump radiation converted into heat was measured tobe around 30 to 32% for different Nd : YAG lasers pumped at 808 nm [1]. Esti-mated values of ηh derived from thermal measurements without lasing also sug-gest a value of ηh = 0.32 for Nd : YAG, and ηh = 0.11 for Yb : YAG pumped at943 nm [2].
In Section 3.4.2 we have combined the losses due to nonradiative processes inthe quantum efficiency ηQ. For Nd : YAG we use ηQ = 0.9 (see Fig. 6.37), whichgives a heat load of ηh = 1−ηQηs = 0.32 for diode pumping, consistent with themeasured value.
The parameter χ is usually determined by measuring the small signal gain witha probe beam at the end of the pump pulse. The stored energy is then calculatedfrom the gain, and the heat deposited is deduced from the observed temperaturerise of the material. In the energy storage mode the value of χ depends on the

7. Thermo-Optic Effects 247
pump pulse length because of the fluorescence losses (see (3.53). Operated in theenergy storage mode, a value of χ = 1.1 was measured for a 200µs long pumppulse [3].
In flashlamp-pumped lasers, the quantum defect heating is larger as alreadymentioned, and in addition to the nonradiative processes described above there isadditional heating because of the background absorption of the pump radiation bythe host, and additional absorption because of impurity atoms and color centers.Measured values for χ range from 2.9 to 3.3 for Nd : YAG and from 1.6 to 3.0 forNd : phosphate glass doped at 3 to 6% neodymium [4, 5].
Comparing the value of χ measured for flashlamp and diode pumping of anNd : YAG laser suggests that diode pumping produces only one-third of the heatin the crystal compared to flashlamp-pumped systems.
From the magnitude of ηh and χ one can obtain an estimate of the amountof heat generated in the laser material relative to the output of the laser system.Absorbed power in the laser element is channeled into heat, stimulated emission,and fluorescence. In the presence of a strongly saturating stimulated emissionthe fluorescence becomes insignificant. Only the excited ions that are outside thevolume occupied by the resonator modes will relax as fluorescence to the groundstate.
For example, from the definition of ηh it follows that the ratio of heat to in-version power density available for extraction is ηh/(1 − ηh). If we account forthe resonator losses expressed by the coupling efficiency ηc and for the less thanunity overlap of the gain region with the resonator modes expressed by ηB (seeSection 3.4.1) we obtain, for the ratio of heat load to output power,
Ph
Pout= ηh
ηcηB(1 − ηh). (7.1)
This expression is a lower limit because it does not include the portion of theresonator losses which appear as heat in the active medium due to absorption ofintracavity laser radiation by the laser material.
Typical examples of heating generated in the laser process are provided in Sec-tion 6.2. In the laser diode-pumped systems analyzed in Fig. 6.37 an output of7 W is associated with 5 W of heating due to the quantum defect and nonradiativeprocesses. This is expressed by ηh = 0.32. With the coupling efficiency and beamoverlap efficiency of ηBηc = 0.65 given in Fig. 6.37, a ratio of Ph/Pout = 0.72is obtained. In addition, a fraction of the absorption losses also contributed to theheating of the laser crystal. Let us assume that the 7 W output is produced by a5 cm long Nd : YAG rod with an absorption coefficient of 10−3 cm−1. If the res-onator has an output coupler with a reflectivity of 90%, then the intracavity poweris 133 W which produces about 0.7 W of absorption losses in the Nd : YAG rod.Therefore, in the example given in Fig. 6.37, the total heat load for the crystal isaround 5.7 W.
In general one can assume a ratio of
Ph/Pout = 0.8 − 1.1 (7.2)
248 7. Thermo-Optic Effects
for a diode-pumped Nd : YAG laser, depending on the crystal quality and the over-lap of the resonator and pump region. In flashlamp- or krypton arc lamp-pumpedNd : YAG lasers the thermal load of the crystal is about three times higher
Ph/Pout = 2.5 − 3.3. (7.3)
In the example of the energy flow in an arc lamp system summarized in Table 6.4,the measured ratio of heat load to laser output was about 2.5 for a highly multi-mode beam. Any measures to improve the beam quality will invariably result ina reduced overlap between resonator mode and pump region and, therefore, theratio of heat load to laser output will increase.
7.1 Cylindrical Geometry
The combination of volumetric heating of the laser material by the absorbed pumpradiation and surface cooling required for heat extraction leads to a nonuniformtemperature distribution in the rod. This results in a distortion of the laser beamdue to a temperature- and stress-dependent variation of the index of refraction.The thermal effects which occur in the laser material are thermal lensing andthermal stress-induced birefringence.
An additional issue associated with thermal loading is stress fracture of thelaser material. Stress fracture occurs when the stress induced by temperature gra-dients in the laser material exceeds the tensile strength of the material. The stress-fracture limit is given in terms of the maximum power per unit length dissipatedas heat in the laser medium.
The particular temperature profile which exists in the laser material depends,to a large degree, on the mode of operation, that is, cw- pumped, single-shot, orrepetitively pulse-pumped. In the case of cw operation, a long cylindrical laser rodwith uniform internal heat generation and constant surface temperature assumesa quadratic radial temperature dependence. This leads to a similar dependence inboth the index of refraction and the thermal-strain distributions.
In a pulse-pumped system, laser action occurs only during the pump pulse orshortly thereafter in the case of Q-switching. Theoretical and experimental inves-tigations have shown that heat transport during the pump pulse, which usually hasa duration between 0.2 and 5 ms, can be neglected. Therefore, in single-shot oper-ation, optical distortions are the result of thermal gradients generated by nonuni-form pump-light absorption.
In repetitively pulse-pumped systems, distortions will occur from the cumula-tive effects of nonuniform pump processes and thermal gradients due to cooling.Which effects dominate depend on the ratio of the pulse interval time to the ther-mal relaxation time constant of the rod. At repetition intervals, which are shortcompared to the thermal relaxation time of the laser rod, a quasi-thermal steadystate will be reached where the distortions from pumping become secondary tothe distortions produced by the removal of heat from the laser material.

7.1. Cylindrical Geometry 249
7.1.1 Temperature Distribution
We consider the case where the heat generated within the laser rod by pump-light absorption is removed by a coolant flowing along the cylindrical-rod surface.With the assumption of uniform internal heat generation and cooling along thecylindrical surface of an infinitely long rod, the heat flow is strictly radial, andend effects and the small variation of coolant temperature in the axial directioncan be neglected. The radial temperature distribution in a cylindrical rod with thethermal conductivity K , in which heat is uniformly generated at a rate Q per unitvolume, is obtained from the one-dimensional heat conduction equation [6]
d2T
dr2+(
1
r
)(dT
dr
)+ Q
K= 0. (7.4)
The solution of this differential equation gives the steady-state temperature at anypoint along a radius of length r . With the boundary condition T (r0) for r = r0,where T (r0) is the temperature at the rod surface and r0 is the radius of the rod, itfollows that
T (r) = T (r0)+(
Q
4K
)(r2
0 − r2). (7.5)
The temperature profile is parabolic, with the highest temperature at the centerof the rod. The temperature gradients inside the rod are not a function of thesurface temperature T (r0) of the rod. The heat generated per unit volume can beexpressed as
Q = Ph
πr20 l, (7.6)
where Ph is the total heat dissipated by the rod and l is the length of the rod. Thetemperature difference between the rod surface and the center is
T (0)− T (r0) = Ph
4πKl. (7.7)
The transfer of heat between the rod and the flowing liquid creates a temperaturedifference between the rod surface and the coolant. A steady state will be reachedwhen the internal dissipation Ph is equal to the heat removed from the surface bythe coolant
Ph = 2πr0lh[T (r0)− TF ], (7.8)
where h is the surface heat transfer coefficient and TF is the coolant temperature.With A = 2πr0l being the surface area of the rod, it follows that
T (r0)− TF = Ph
Ah. (7.9)

250 7. Thermo-Optic Effects
Combining (7.7) and (7.9) one obtains, for the temperature at the center of therod,
T (0) = TF + Ph
(1
4πKl+ 1
Ah
). (7.10)
Thus, from the geometry, and the appropriate system and material parameters, thethermal profile of the crystal can be determined, except that h must be evaluated.This coefficient is obtained from a rather complex expression involving the ther-mal properties of the coolant, the mass flow rate of the coolant, the Reynolds,Prandtl, and Grashof numbers, and the geometry of the cooling channel [7].
The boundary conditions for the heat transfer coefficient are a thermally insu-lated laser rod (h = 0), or unrestricted heat flow from the rod surface to a heat sink(h = ∞). For cases of practical interest the heat transfer coefficient is typicallyaround h = 0.5–2 W cm−2 C−1.
Figure 7.1 shows as an example the radial temperature profile in an Nd : YAGrod calculated from (7.10). The laser, which delivered between 200 to 250 W ofoutput, was pumped at 12 kW of input power. The following parameters have beenused in the numerical calculations of the temperature profile in the crystal: rodlength l = 7.5 cm; rod radius r0 = 0.32 cm; flow-tube inside radius rF = 0.7 cm;power dissipated by the Nd : YAG rod Ph = 600 W; mass flow rate of the coolantm∗ = 142 g/s; and fluid temperature entering the cavity TF = 20◦ C. As canbe seen from this figure, the maximum temperature of the crystal occurring atthe center is 114◦ C. The large temperature gradient of 57◦ C between the centerof the crystal and the surface is responsible for the high stresses present in thematerial.
FIGURE 7.1. Radial temperature distribution within an Nd : YAG crystal as a function ofradius. TF is the temperature of coolant entering the flow-tube assembly, �TF is the axialtemperature gradient, and T (r0) is the rod surface temperature [7].

7.1. Cylindrical Geometry 251
7.1.2 Thermal Stresses
The temperature gradients generate mechanical stresses in the laser rod since thehotter inside area is constrained from expansion by the cooler outer zone. Thestresses in a cylindrical rod, caused by a temperature distribution T (r), can becalculated from the equations given in [8]. Equations (7.11)–(7.13) describe theradial σr , tangential σφ , and axial σz stress in an isotropic rod with free ends anda temperature distribution according to (7.5),
σr (r) = QS(r2 − r20 ), (7.11)
σφ(r) = QS(3r2 − r20 ), (7.12)
σz(z) = 2QS(2r2 − r20 ), (7.13)
where the factor S = αE[16K (1 − ν)]−1 contains the material parameters, Eis Young’s modulus, ν is Poisson’s ratio, and α is the thermal coefficient of ex-pansion. The stress components, σr , σφ , σz represent compression of the materialwhen they are negative and tension when they are positive. We notice that thestress distributions also have a parabolic dependence on r . The center of the rodis under compression. The radial component of the stress goes to zero at the rodsurface, but the tangential and axial components are in tension on the rod sur-face by virtue of the larger bulk expansion in the rod’s center compared to thecircumference.
Figure 7.2 gives the stresses as a function of radius inside the Nd : YAG rodwhose temperature profile was shown in Fig. 7.1. From these curves it followsthat the highest stresses occur at the center and at the surface. Since the tensile
FIGURE 7.2. Radial (σr ), tangential (σφ ), and axial (σz ) stress components within anNd : YAG crystal as a function of radius [7].
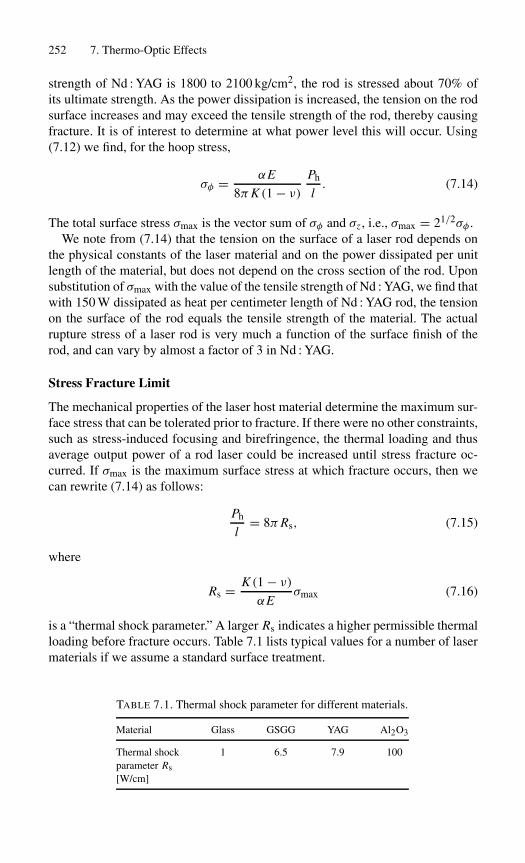
252 7. Thermo-Optic Effects
strength of Nd : YAG is 1800 to 2100 kg/cm2, the rod is stressed about 70% ofits ultimate strength. As the power dissipation is increased, the tension on the rodsurface increases and may exceed the tensile strength of the rod, thereby causingfracture. It is of interest to determine at what power level this will occur. Using(7.12) we find, for the hoop stress,
σφ = αE
8πK (1 − ν)
Ph
l. (7.14)
The total surface stress σmax is the vector sum of σφ and σz , i.e., σmax = 21/2σφ .We note from (7.14) that the tension on the surface of a laser rod depends on
the physical constants of the laser material and on the power dissipated per unitlength of the material, but does not depend on the cross section of the rod. Uponsubstitution of σmax with the value of the tensile strength of Nd : YAG, we find thatwith 150 W dissipated as heat per centimeter length of Nd : YAG rod, the tensionon the surface of the rod equals the tensile strength of the material. The actualrupture stress of a laser rod is very much a function of the surface finish of therod, and can vary by almost a factor of 3 in Nd : YAG.
Stress Fracture Limit
The mechanical properties of the laser host material determine the maximum sur-face stress that can be tolerated prior to fracture. If there were no other constraints,such as stress-induced focusing and birefringence, the thermal loading and thusaverage output power of a rod laser could be increased until stress fracture oc-curred. If σmax is the maximum surface stress at which fracture occurs, then wecan rewrite (7.14) as follows:
Ph
l= 8πRs, (7.15)
where
Rs = K (1 − ν)
αEσmax (7.16)
is a “thermal shock parameter.” A larger Rs indicates a higher permissible thermalloading before fracture occurs. Table 7.1 lists typical values for a number of lasermaterials if we assume a standard surface treatment.
TABLE 7.1. Thermal shock parameter for different materials.
Material Glass GSGG YAG Al2O3
Thermal shock 1 6.5 7.9 100parameter Rs[W/cm]

7.1. Cylindrical Geometry 253
7.1.3 Photoelastic Effects
The stresses calculated in the previous subsection generate thermal strains in therod that, in turn, produce refractive index variations via the photoelastic effect.The refractive index of a medium is specified by the indicatrix that, in its mostgeneral case, is an ellipsoid. A change of refractive index due to strain is given bya small change in shape, size, and orientation of the indicatrix [9]. The change isspecified by small changes in the coefficients Bi j ,
Bi j = Pi jklεkl (i, j, k, l = 1, 2, 3), (7.17)
where Pi jkl is a fourth-rank tensor giving the photoelastic effect. The elements ofthis tensor are the elasto-optical coefficients. εkl is a second-rank strain tensor.
We will confine our calculation to the case of an Nd : YAG laser rod. Themethod, however, is applicable to any material if the proper photoelastic matrixis used. Since Nd : YAG is a cubic crystal, the indicatrix is a sphere. Under stressthe indicatrix becomes an ellipsoid. Nd : YAG rods are grown with the cylindricalaxes along the [111]-direction. The light propagates in this direction, and thus thechange of the refractive index along the [111] is of interest.
Since the transverse stresses are in the radial and tangential directions—relativeto the coordinate system shown in Fig. 7.3—the local indicatrix also orientsits axis in these directions. In a cylindrical coordinate system the photoelasticchanges in the refractive index for the r and φ polarizations are given by [10]
�nr = − 12 n3
0�Br (7.18)
and�nφ = − 1
2 n30�Bφ. (7.19)
FIGURE 7.3. (a) Crystal orientation for an Nd : YAG rod and (b) orientation of the indica-trix of the thermally stressed Nd : YAG rod in a plane perpendicular to the rod axis.
254 7. Thermo-Optic Effects
A considerable amount of tensor calculation is required to determine the co-efficients �Br and �Bφ in a plane perpendicular to the [111]-direction of theNd : YAG crystal. The technique used in these calculations consists of introduc-ing the elasto-optic coefficients for Nd : YAG into the matrix form Pmn of thephotoelastic tensor. The published values of these coefficients are given in a [100]-oriented Cartesian coordinate frame: P11 = −0.029; P12 = +0.0091; and P44 =−0.0615. The strain tensor is obtained from the stresses calculated in (7.11)–(7.13). After a coordinate transformation to bring Pmn and εkl into the same coor-dinate system, the tensor operation according to (7.17) can be performed. Intro-ducing the expression for �Br and �Bφ into (7.18), (7.19), the refractive-indexchanges are given by [11], [12]
�nr = − 12 n3
0αQ
KCrr2, (7.20)
�nφ = − 12 n3
0αQ
KCφr2, (7.21)
where Cr and Cφ are functions of the elasto-optical coefficients of Nd : YAG,
Cr = (17ν − 7)P11 + (31ν − 17)P12 + 8(ν + 1)P44
48(ν − 1),
Cφ = (10ν − 6)P11 + 2(11ν − 5)P12
32(ν − 1).
The induced birefringence is determined from (7.20), (7.21)
�nr −�nφ = n30αQ
KCBr2, (7.22)
where
CB = 1 + ν
48(1 − ν)(P11 − P12 + 4P44).
Inserting the values of the photoelastic coefficients and the material parametersof Nd : YAG, α = 7.5×10⁻⁶/◦ C, K = 0.14 W/cm ◦ C, ν = 0.25, n0 = 1.82 into(7.20)–(7.22), one obtains Cr = 0.017, Cφ = −0.0025, CB = −0.0099, and
�nr = (−2.8 × 10⁻⁶)Qr2,
�nφ = (+0.4 × 10⁻⁶)Qr2,
�nr −�nφ = (−3.2 × 10⁻⁶)Qr2,
where Q has the dimension of watts per cubic centimeter and r is measured incentimeters.

7.1. Cylindrical Geometry 255
7.1.4 Thermal Lensing
Having explored the stresses in the laser rod, we now turn to the optical distor-tions which are a result of both temperature gradients and stresses. The change ofthe refractive index can be separated into a temperature- and a stress-dependentvariation. Hence
n(r) = n0 +�n(r)T +�n(r)ε, (7.23)
where n(r) is the radial variation of the refractive index, n0 is the refractive indexat the center of the rod, and �n(r)T, �n(r)ε are the temperature- and stress-dependent changes of the refractive index, respectively.
The temperature-dependent change of the refractive index can be expressed as
�n(r)T = [T (r)− T (0)](
dn
dT
). (7.24)
With the aid of (7.5), (7.7) we obtain
�n(r)T = − Q
4K
dn
dTr2. (7.25)
As can be seen from (7.20), (7.21), and (7.25) the refractive index in a laser rodshows a quadratic variation with radius r . An optical beam propagating along therod axis suffers a quadratic spatial phase variation. This perturbation is equivalentto the effect of a spherical lens. The focal length of a lens-like medium, where therefractive index is assumed to vary according to
n(r) = n0
(1 − 2r2
q2
)(7.26)
is given by
f ∼= q2
4n0l. (7.27)
This expression is an approximation where it was assumed that the focal length isvery long in comparison to the rod length. The distance f is measured from theend of the rod to the focal point.
The total variation of the refractive index is obtained by introducing (7.20),(7.21), and (7.25) into (7.23):
n(r) = n0
[1 − Q
2K
(1
2n0
dn
dT+ n2
0αCr,φ
)r2]. (7.28)
As was discussed in the previous subsection, the change of refractive index dueto thermal strain is dependent on the polarization of light; therefore the photo-elastic coefficient Cr,φ has two values, one for the radial and one for the tangential

256 7. Thermo-Optic Effects
component of the polarized light. Comparing (7.28) with (7.26) yields
f ′ = K
Ql
(1
2
dn
dT+ αCr,φn3
0
)−1
. (7.29)
In our final expression for the focal length of an Nd : YAG rod, we will includethe contributions caused by end effects. Perturbations of the principal thermaldistortion pattern occur in laser rods near the ends, where the free surface altersthe stress character. The so-called end effects account for the physical distortionof the flatness of the rod ends. Self-equilibrating stresses causing a distortion offlatness were found to occur within a region of approximately one diameter fromthe ends of Nd : glass and one radius from the end for Nd : YAG. The deviationfrom flatness of the rod ends is obtained from
l(r) = αl0[T (r)− T (0)], (7.30)
where l0 is the length of the end section of the rod over which expansion occurs.With l0 = r0 and (7.5) we obtain
l(r) = −αr0Qr2
4K. (7.31)
The focal length of the rod caused by an end-face curvature is obtained from thethick-lens formula of geometric optics
f ′′ = R
2(n0 − 1), (7.32)
where the radius of the end-face curvature is R = −(d2l/dr2)−1. From theseexpressions follows the focal length of the rod caused by a physical distortion ofthe flat ends
f ′′ = K [αQr0(n0 − 1)]−1. (7.33)
The combined effects of the temperature- and stress-dependent variation of therefractive index and the distortion of the end-face curvature of the rod lead to thefollowing expression for the focal length
f = K A
Ph
(1
2
dn
dT+ αCr,φn3
0 + αr0(n0 − 1)
l
)−1
, (7.34)
where A is the rod cross-sectional area and Ph is the total heat dissipated inthe rod. If one introduces the appropriate materials parameters for Nd : YAGinto (7.34) then one finds that the temperature-dependent variation of the re-fractive index constitutes the major contribution of the thermal lensing. Thestress-dependent variation of the refractive index modifies the focal length about

7.1. Cylindrical Geometry 257
20%. The effect of end-face curvature caused by an elongation of the rod is lessthan 6%.
Ignoring the end effects, we notice that the focal length is proportional to amaterial constant and the cross section A of the rod and is inversely proportionalto the power Ph dissipated as heat in the rod. At first, it may be surprising thatthe length of the rod does not enter the equations. However, in a longer rod, forexample, the reduction in power dissipation per unit length is offset by a longerpath length.
We see from (7.34) that we have little flexibility in influencing the focal length.The material constants are determined when we choose the laser material: the dis-sipated power Ph is determined by the application (even though we may be able toreduce the heat load by avoiding unusable pump radiation); thus the only remain-ing design parameter is the rod cross section. The focal length can be increased byincreasing A, but this is usually not a practical way of solving the problem, sincea larger crystal reduces pump power density and therefore leads to lower gain.
According to (7.34), the focal length of a cylindrical laser rod, where heat isgenerated uniformly within the bulk material, can be written as
f = Mr,φP−1in , (7.35)
where M contains all the material parameters of the laser rod and an efficiencyfactor η which relates the electrical input power to the power dissipated as heat inthe rod (Ph = ηPin).
We can introduce a laser-rod sensitivity defined as
d(1/ f )
d Pin= M−1
r,φ . (7.36)
The sensitivity factor describes how much the optical power 1/ f of a laser rodchanges with input power. For an Nd : YAG rod 0.63 cm in diameter, and assumingthat 5% of the electrical input power to the lamp is dissipated as heat, we obtain achange of focusing power of 0.5×10⁻³ diopters per watt of lamp input variation.
Returning now to (7.34), we can see that the rod acts as a bifocal lens withdifferent focal lengths for radiation with radial and tangential polarization. Sincea linear polarized wave or a nonpolarized wave incident on the crystal will alwayshave components in radial and tangential directions, two focal points are obtained.For Nd : YAG one finds a theoretical value of fφ/ fr = 1.2. A difference in focallength for different polarizations means that a resonator designed to compensatefor the lensing of the radial polarization cannot also compensate for the lensingof tangentially polarized light.
In Fig. 7.4 theoretical and measured thermally induced back focal lengths ofvarious laser rods are plotted as a function of lamp input. Experimentally, the focallength was determined by projecting an HeNe laser beam through the rod andmeasuring the position of the beam diameter minimum. The measured curves havebeen observed for the same rod size in different pump cavities. The focal lengthchanges faster than predicted, probably as a result of nonuniform pumping. The

258 7. Thermo-Optic Effects
1 2 2.5 5 7.5 1010
20
40
60
80
100
200
C
D
B
A
Foc
al L
engt
h (c
m)
Input Power (KW)
FIGURE 7.4. Thermally induced back focal length as a function of lamp input power forNd : YAG rods. Shown are calculated curves for (A) the radially and (B) tangentially po-larized beam components, and (C, D) measurements of average focal length for differentrods and pump cavities [14].
calculations for the theoretical back focal length assumed that 5% of the electricalinput power will be dissipated as heat in a 7.5 × 0.63 cm diameter crystal. Thevalue of M for the radially polarized beam (A) is Mr = 18 × 104 Wcm, andMφ = 22 × 104 Wcm for the tangentially polarized beam (B).
7.1.5 Stress Birefringence
We will now investigate the influence of thermally induced birefringence on theperformance of a solid-state laser. Taking Nd : YAG as an example, it was shownin (7.20), (7.21) that the principal axes of the induced birefringence are radiallyand tangentially directed at each point in the rod cross section and that the magni-tude of the birefringence increases quadratically with radius r . As a consequence,a linearly polarized beam passing through the laser rod will experience a substan-tial depolarization. We refer to Fig. 7.3, where we have chosen a point P(r, φ)
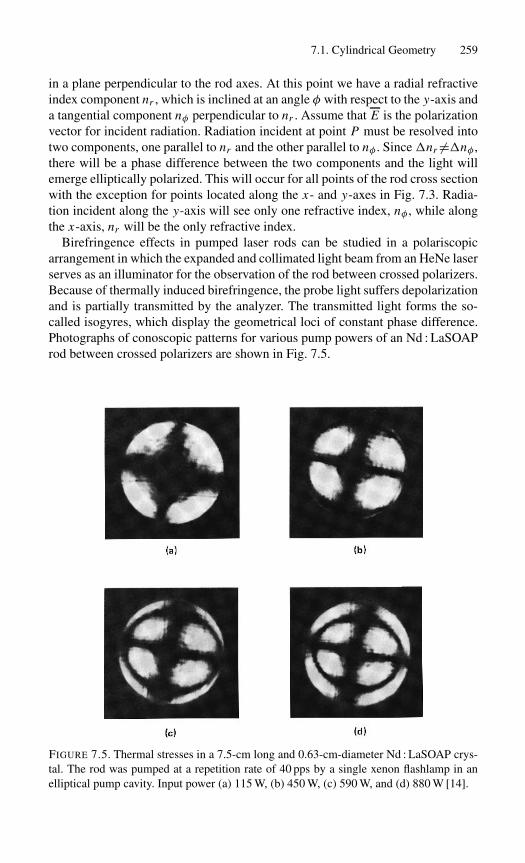
7.1. Cylindrical Geometry 259
in a plane perpendicular to the rod axes. At this point we have a radial refractiveindex component nr , which is inclined at an angle φ with respect to the y-axis anda tangential component nφ perpendicular to nr . Assume that E is the polarizationvector for incident radiation. Radiation incident at point P must be resolved intotwo components, one parallel to nr and the other parallel to nφ . Since�nr �=�nφ ,there will be a phase difference between the two components and the light willemerge elliptically polarized. This will occur for all points of the rod cross sectionwith the exception for points located along the x- and y-axes in Fig. 7.3. Radia-tion incident along the y-axis will see only one refractive index, nφ , while alongthe x-axis, nr will be the only refractive index.
Birefringence effects in pumped laser rods can be studied in a polariscopicarrangement in which the expanded and collimated light beam from an HeNe laserserves as an illuminator for the observation of the rod between crossed polarizers.Because of thermally induced birefringence, the probe light suffers depolarizationand is partially transmitted by the analyzer. The transmitted light forms the so-called isogyres, which display the geometrical loci of constant phase difference.Photographs of conoscopic patterns for various pump powers of an Nd : LaSOAProd between crossed polarizers are shown in Fig. 7.5.
FIGURE 7.5. Thermal stresses in a 7.5-cm long and 0.63-cm-diameter Nd : LaSOAP crys-tal. The rod was pumped at a repetition rate of 40 pps by a single xenon flashlamp in anelliptical pump cavity. Input power (a) 115 W, (b) 450 W, (c) 590 W, and (d) 880 W [14].

260 7. Thermo-Optic Effects
The isogyre pattern exhibits a cross and ring structure, where the arms of thecross are parallel and orthogonal to the incident polarization. As mentioned be-fore, the crosses correspond to those regions of the crystal where an induced (ra-dial or tangential) axis is along a polarizer axis, so that the induced birefringenceresults only in a phase delay and not in a polarization rotation. The dark ringscorrespond to an integral number of full waves of retardation.
A number of operations of solid-state lasers, such as, for example, electro-optical Q-switching, frequency doubling, and external modulation of the beam, re-quire a linearly polarized beam. An optically isotropic material, such as Nd : YAG,must be forced to emit a linearly polarized beam by the introduction of a polar-izer in the resonant cavity. In the absence of birefringence, no loss in output powerwould be expected. However, the thermally induced birefringence causes a signif-icant decrease in output power and a marked change in beam shape.
For a system with an intracavity polarizer, the effect of depolarization involvestwo phenomena: coupling of power into the orthogonal state of polarization fol-lowed by subsequent removal of that component by the polarizer and modificationof the main beam by the depolarization process leading to a distortion of beamshape. When a birefringent crystal is placed between a polarizer and analyzer thatare parallel, the transmitted intensity is given by [9]
Iout
Iin= 1 − sin2(2φ) sin2
(ϕ2
), (7.37)
where φ is the angle between the polarizer and one of the principal birefringenceaxes and ϕ is the polarization phase shift of the light emerging from the crystal.The index difference, �nφ −�nr , leads to a phase difference
ϕ = 2π
λl(�nφ −�nr ). (7.38)
To illustrate the magnitude of stress birefringence in an Nd : YAG rod, the differ-ence in optical path length normalized to the wavelength
�l
λ= l(�nφ −�nr )
λ(7.39)
is plotted in Fig. 7.6 as a function of pump power. The following constants wereused: Ph = 0.05Pin, l = 7.5 cm, r0 = 0.31 cm, and λ = 1.06 × 10⁻⁴ cm. As canbe seen from this figure, at maximum lamp input power of 12 kW, the path-lengthdifference is approximately six wavelengths.
Assuming a plane wave, we can calculate the total transmitted intensity from(7.37), (7.38) by integrating over the cross-sectional area of the rod. The followingintegral must be evaluated
(Iout
Iin
)T
=(
1
πr20
)∫ 2π
φ=0
∫ r0
r=0
[1 − sin2(2φ) sin2 ϕ
2
]r dr dφ. (7.40)
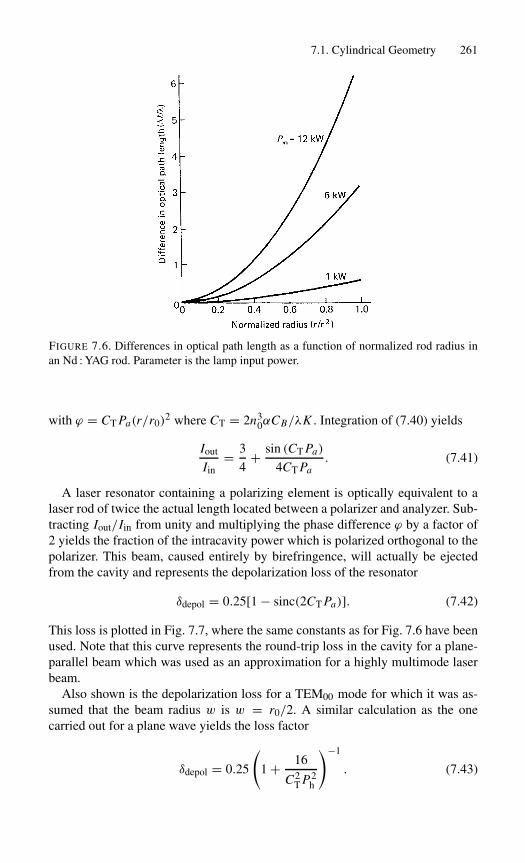
7.1. Cylindrical Geometry 261
FIGURE 7.6. Differences in optical path length as a function of normalized rod radius inan Nd : YAG rod. Parameter is the lamp input power.
with ϕ = CT Pa(r/r0)2 where CT = 2n3
0αCB/λK . Integration of (7.40) yields
Iout
Iin= 3
4+ sin (CT Pa)
4CT Pa. (7.41)
A laser resonator containing a polarizing element is optically equivalent to alaser rod of twice the actual length located between a polarizer and analyzer. Sub-tracting Iout/Iin from unity and multiplying the phase difference ϕ by a factor of2 yields the fraction of the intracavity power which is polarized orthogonal to thepolarizer. This beam, caused entirely by birefringence, will actually be ejectedfrom the cavity and represents the depolarization loss of the resonator
δdepol = 0.25[1 − sinc(2CT Pa)]. (7.42)
This loss is plotted in Fig. 7.7, where the same constants as for Fig. 7.6 have beenused. Note that this curve represents the round-trip loss in the cavity for a plane-parallel beam which was used as an approximation for a highly multimode laserbeam.
Also shown is the depolarization loss for a TEM00 mode for which it was as-sumed that the beam radius w is w = r0/2. A similar calculation as the onecarried out for a plane wave yields the loss factor
δdepol = 0.25
(1 + 16
C2T P2
h
)−1
. (7.43)

262 7. Thermo-Optic Effects
FIGURE 7.7. Calculated resonator loss caused by the combination of thermally inducedbirefringence in an Nd : YAG rod and an intracavity polarizer.
For the same lamp input power the losses for the TEM00 mode are less than fora highly multimode beam. This is expected since the energy in the TEM00 modeis concentrated nearer the center of the rod, where the induced birefringence issmaller.
The interaction of a linearly polarized beam with a birefringent laser rod and apolarizer not only leads to a substantial loss in power, but also a severe distortionof the beam shape. Figure 7.8 shows the output beam shape obtained from a cw-pumped Nd : YAG laser with and without an intracavity polarizer. The output isobtained in the form of a cross with a bright center. As discussed before, the
FIGURE 7.8. Output beam pattern for a high-power cw Nd : YAG laser (a) without and(b) with a Brewster plate in the cavity.
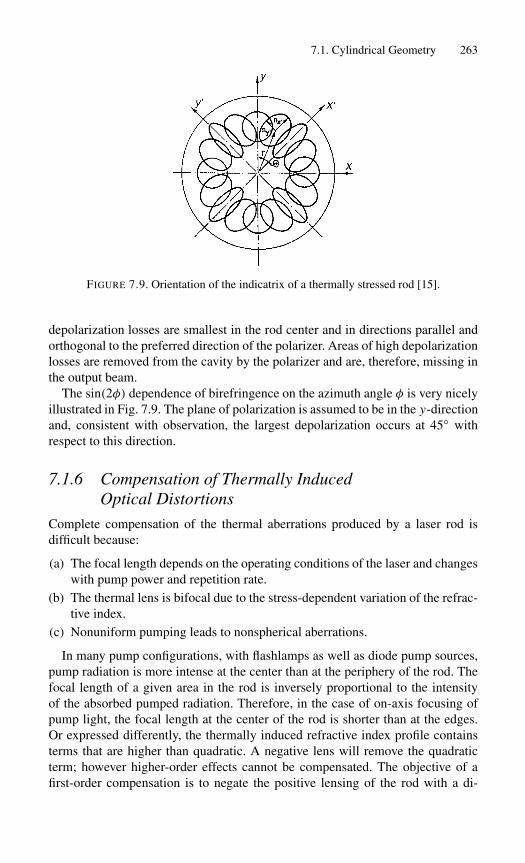
7.1. Cylindrical Geometry 263
FIGURE 7.9. Orientation of the indicatrix of a thermally stressed rod [15].
depolarization losses are smallest in the rod center and in directions parallel andorthogonal to the preferred direction of the polarizer. Areas of high depolarizationlosses are removed from the cavity by the polarizer and are, therefore, missing inthe output beam.
The sin(2φ) dependence of birefringence on the azimuth angle φ is very nicelyillustrated in Fig. 7.9. The plane of polarization is assumed to be in the y-directionand, consistent with observation, the largest depolarization occurs at 45◦ withrespect to this direction.
7.1.6 Compensation of Thermally InducedOptical Distortions
Complete compensation of the thermal aberrations produced by a laser rod isdifficult because:
(a) The focal length depends on the operating conditions of the laser and changeswith pump power and repetition rate.
(b) The thermal lens is bifocal due to the stress-dependent variation of the refrac-tive index.
(c) Nonuniform pumping leads to nonspherical aberrations.
In many pump configurations, with flashlamps as well as diode pump sources,pump radiation is more intense at the center than at the periphery of the rod. Thefocal length of a given area in the rod is inversely proportional to the intensityof the absorbed pumped radiation. Therefore, in the case of on-axis focusing ofpump light, the focal length at the center of the rod is shorter than at the edges.Or expressed differently, the thermally induced refractive index profile containsterms that are higher than quadratic. A negative lens will remove the quadraticterm; however higher-order effects cannot be compensated. The objective of afirst-order compensation is to negate the positive lensing of the rod with a di-

264 7. Thermo-Optic Effects
verging optical component. The most common approaches are the insertion of anegative lens in the resonator, or a resonator featuring an internal telescope, or adesign where one of the mirrors has a convex surface. The latter approach wasdiscussed in Section 5.1.8.
A greater reduction of thermally induced optical distortions can be achievedif thermal lensing compensation is combined with birefringence compensation.In this case bifocusing is eliminated and depolarization losses are minimized inresonators containing polarized beams. The objective of birefringence compensa-tion is to achieve equal phase retardation at each point of the rod’s cross sectionfor radially and tangentially polarized radiation. This can be accomplished by ro-tating the polarizations, either between two identical laser rods or in the samerod on successive passes, such that the radial and tangential components of thepolarizations are exchanged.
On passing once through a rod with a radial temperature distribution, a phasedifference [�Pr (r) − �Pθ (r)] is introduced between the radially polarized rayand the tangentially polarized ray at the same radius r . Now, if the two rays passthrough a 90◦ polarization rotator, the radially polarized ray will be converted totangential polarization, and vice versa. If the two rays are passed again throughthe same rod, or through an identical rod, the phase difference between the tworays will be removed.
For example, birefringence compensation in an oscillator containing two iden-tical laser heads can be achieved by inserting a 90◦ quartz rotator between thelaser rods. This rotator can be of crystalline quartz, for example, cut perpendicu-lar to the optic axis. The rotator produces a 90◦ rotation of every component of theelectric field of the laser beam. The part of a mode that is radially polarized in thefirst rod, is tangentially polarized in the second rod. Since each part of the beampasses through nearly identical regions of the two rods, the retardation induced byone rod is reversed by the other.
Figure 7.10 shows an example of a thermally compensated resonator designedto achieve high TEM00 mode output in a linearly polarized beam. The 90◦ quartzrotator eliminates bifocusing and the convex rear mirror of the resonator com-pensates for the positive thermal lensing of the Nd : YAG crystal. Instead of us-ing a convex resonator mirror, a negative lens is sometimes inserted between the
FIGURE 7.10. Schematic diagram of a birefringence-compensated laser [16].

7.2. Slab and Disk Geometries 265
two rods together with the quartz rotator. The resonator depicted in Fig. 7.10also contains a Brewster plate to linearly polarize the laser output. Without thequartz rotator, the insertion of the polarizer generates a large depolarization lossfor the TEM00 mode. With this technique, linearly polarized outputs with negli-gible power loss and TEM00 output of 50 to 70% of the multimode power havebeen achieved.
Other measures for achieving high TEM00 mode output are more fundamentaland address the origin of thermal distortions. Changing from an arc lamp-pumpedsystem to diode pumping drastically reduces the thermal distortions in the lasercrystal. For the same output power, a diode pump source generates only aboutone-third the amount of heat in an Nd : YAG crystal compared to an arc lamp.Also, instead of using a cylindrical rod, a rectangular slab with an internal zigzagpath minimizes wavefront distortions in the resonator. As explained in Section 7.2such a structure provides a high degree of self-compensation of optical beam dis-tortions. If the TEM00 output beam has to be linearly polarized, a naturally bire-fringent crystal such as Nd : YLF can be advantageous in particular situations.The natural birefringence in Nd : YLF is much larger than the thermally inducedbirefringence.
In an amplifier, wavefront distortions can be eliminated with an optical phaseconjugated mirror as discussed in Section 10.4. This approach requires an injec-tion seeded, narrow bandwidth oscillator with a diffraction limited output, and adouble pass amplifier. The oscillator typically has a low power output becauseonly aberrations in the amplifier are corrected. Compared to spherical diverginglenses, optical phase conjugation does provide complete correction of wavefrontdistortions over a large dynamic range.
7.2 Slab and Disk Geometries
Practical limitations arise in the operation of any solid-rod laser owing to the ther-mal gradients required to dissipate heat from the rod. As was discussed in Sec-tion 7.1, the thermally loaded cylindrical laser medium exhibits optical distortionsthat include thermal focusing, stress-induced biaxial focusing, and stress-inducedbirefringence. These thermally induced effects severely degrade the optical qual-ity of the laser beam and eventually limit the laser output power, either because ofan unacceptably poor beam pattern or because of thermal stress-induced breakageof the rod.
The limitations imposed by the rod geometry have long been recognized and anumber of designs have emerged, such as slab and disk geometries, in an attemptto reduce the effect of thermal gradients on beam quality.
7.2.1 Rectangular-Slab Laser
The rectangular-slab laser provides a larger cooling surface and essentially a one-dimensional temperature gradient across the thickness of the slab. Figure 7.11

266 7. Thermo-Optic Effects
FIGURE 7.11. Geometry of a rectangular-slab laser.
shows the geometry of a rectangular slab laser. The z-axis coincides with theoptical axis of the slab.
The slab has thickness d and width w. The upper and lower surfaces are main-tained at a constant temperature by water-cooling, and the sides are uncooled.Provided the slab is uniformally pumped through the top and bottom surfaces, thethermal gradients are negligible in the x- and z-directions and the thermal anal-ysis is reduced to a one-dimensional case, that is, temperature and stress are afunction of y only. This, of course, is only true for an infinitely large plate in xand y, and uniform pumping and cooling. Under these conditions we find that thetemperature assumes a parabolic profile (Fig. 7.12(a)).
The maximum temperature that occurs between the surface and the center ofthe slab (y = d/2) is given by
�T = d2
8KQ, (7.44)
where Q is the heat deposition, d is the thickness, and K is the thermal conduc-tivity of the slab. For example, a heat deposition of 2 W/cm3, in a 1 cm thick glass
FIGURE 7.12. (a) Temperature profile and (b) stress in a rectangular slab.

7.2. Slab and Disk Geometries 267
slab (K = 0.01 W/cm3) will create a temperature difference between the cooledsurfaces and the center of 25◦ C.
The temperature rise causes stress in the slab according to
σmax = 2αE
3(1 − ν)�T = αEd2
12(1 − ν)KQ, (7.45)
where σmax is the surface stress for the slab. The surfaces are in tension and thecenter is under compression as shown in Fig. 7.12(b).
If we introduce the “thermal-shock parameter” from Section 7.1 we can cal-culate the maximum temperature difference allowed between the surface and thecenter before thermal fracture occurs; this is
�Tmax = 3Rs
2K. (7.46)
With Rs = 1 W/cm for Nd : glass, one obtains
�Tmax = 150◦ C.
Stress fracture at the surface limits the total thermal power absorbed by the slabper unit of face area. For slabs of finite width w, the power per unit length at thestress fracture limit is given by
Ph
l= 12σmax
(1 − ν)K
αE
(wd
), (7.47)
where w/d is the aspect ratio of a finite slab. It is interesting to compare thesurface stress of a rod and slab for the same thermal power absorbed per unitlength. From (7.14), (7.47) it follows that
(Ph/ l)rod
(Ph/ l)slab= 2π
3
(d
w
). (7.48)
Thus, for a superior power handling capability relative to a rod, the aspect ratio ofthe slab must be greater than 2.
The temperature and stress profile leads to a birefringent cylindrical lens. Thefocal lengths of the birefringent lens are [17]
fx = 1
2l(S0 − S1), fy = 1
2l(S0 − S2), (7.49)
for x and y polarized light, respectively. The parameter S0 is the contribution fromthermal focusing, that is,
S0 = dn
dT
(Q
2K
), (7.50)
268 7. Thermo-Optic Effects
and the parameters S1 and S2 are related to stress-induced focusing
S1 = QαE
2(1 − ν)K(B⊥ + B‖), S2 = QαE
(1 − ν)KB⊥, (7.51)
where B‖ and B⊥ are the stress optic coefficients for stress applied parallel andperpendicular to the polarization axis. Comparing the focal length of a rod (7.29)with the focal length of a slab (7.49) and considering only thermal focusing, thenthe slab has twice the focal power of a rod. In [17] it has been shown that ifthe stress-induced focusing is included, the slab still shows about twice the focalpower compared to a rod.
In a slab, however, for incident radiation polarized along either the x- or y-directions the stress-induced depolarization is zero. In a rectangular rod, the mainaxes of the resulting index ellipse are oriented parallel to the x-and y-axes of therod, and a beam polarized along either one of these axes can propagate in a direc-tion parallel to the z-axis without being depolarized. This is, as mentioned earlier,in contrast to the situation in a cylindrical rod, where a plane-polarized beam doessuffer depolarization because the direction of the main axes of the index ellipsoidvary from point to point within the cross section of the rod. The advantage of therectangular geometry is obtained at some cost: The focal lengths are shorter thanfor the cylindrical rod, and cylindrical rather than spherical compensating opticsare needed. The idea of the zigzag path in a slab, which will be discussed next, isto eliminate to a first-order focusing in a slab.
7.2.2 Slab Laser with Zigzag Optical Path
In the previous section we considered propagation straight through an infinite slab.Due to the rectilinear pumping and cooling geometry of the lasing medium, ther-mal gradients and thermally induced stresses are present only in the y-direction.Therefore, for light polarized in either the x- or y-directions, stress-induced bi-axial focusing and depolarization losses are eliminated. However, the slab stillbehaves as a thin cylindrical lens with a focal length shorter by a factor of 2 rela-tive to that of a rod.
The cylindrical focusing in the slab can be eliminated by choosing propaga-tion along a zigzag optical path. In the zigzag geometry, the optical beam doesnot travel parallel to the z-axis, as was the case for the straight-through opticalpath. Instead the beam traverses the slab at an angle with respect to the x–z-planeusing total internal reflection from the slab y faces. This geometry is depicted inFig. 7.13.
The laser beam is introduced into the slab with suitable entrance/exit optics,usually through surfaces at Brewster’s angle, as shown in Fig. 7.13(b). In orderto maintain total internal reflection for the desired path length the two opposingfaces have to be highly polished and have to be fabricated with a high degreeof parallelism. The same two optical faces are also employed for pumping andcooling of the slab.
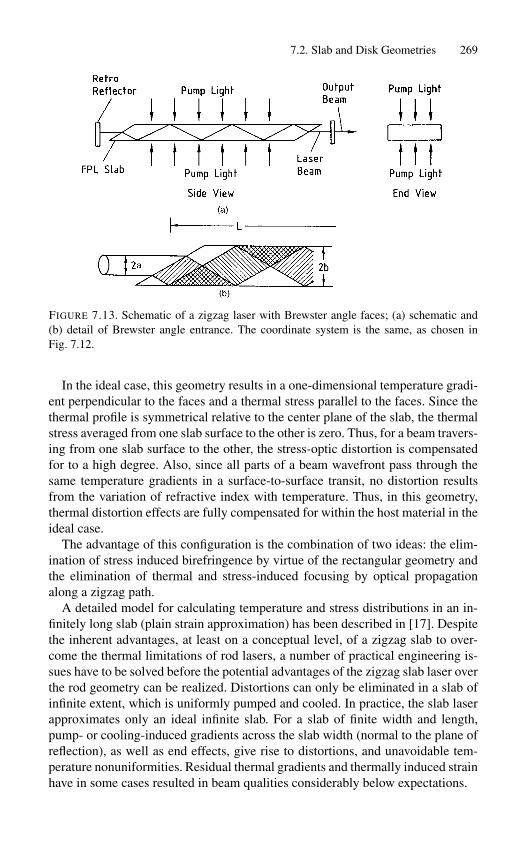
7.2. Slab and Disk Geometries 269
FIGURE 7.13. Schematic of a zigzag laser with Brewster angle faces; (a) schematic and(b) detail of Brewster angle entrance. The coordinate system is the same, as chosen inFig. 7.12.
In the ideal case, this geometry results in a one-dimensional temperature gradi-ent perpendicular to the faces and a thermal stress parallel to the faces. Since thethermal profile is symmetrical relative to the center plane of the slab, the thermalstress averaged from one slab surface to the other is zero. Thus, for a beam travers-ing from one slab surface to the other, the stress-optic distortion is compensatedfor to a high degree. Also, since all parts of a beam wavefront pass through thesame temperature gradients in a surface-to-surface transit, no distortion resultsfrom the variation of refractive index with temperature. Thus, in this geometry,thermal distortion effects are fully compensated for within the host material in theideal case.
The advantage of this configuration is the combination of two ideas: the elim-ination of stress induced birefringence by virtue of the rectangular geometry andthe elimination of thermal and stress-induced focusing by optical propagationalong a zigzag path.
A detailed model for calculating temperature and stress distributions in an in-finitely long slab (plain strain approximation) has been described in [17]. Despitethe inherent advantages, at least on a conceptual level, of a zigzag slab to over-come the thermal limitations of rod lasers, a number of practical engineering is-sues have to be solved before the potential advantages of the zigzag slab laser overthe rod geometry can be realized. Distortions can only be eliminated in a slab ofinfinite extent, which is uniformly pumped and cooled. In practice, the slab laserapproximates only an ideal infinite slab. For a slab of finite width and length,pump- or cooling-induced gradients across the slab width (normal to the plane ofreflection), as well as end effects, give rise to distortions, and unavoidable tem-perature nonuniformities. Residual thermal gradients and thermally induced strainhave in some cases resulted in beam qualities considerably below expectations.

270 7. Thermo-Optic Effects
Earlier work on slab lasers concentrated on Nd : glass slabs pumped with flash-lamps. A typical example of a flashlamp pumped zigzag Nd : glass slab laser isshown in Fig. 6.26.
In recent years, design efforts have concentrated mainly on systems utilizingNd : YAG slabs. Flashlamp systems have been built in the multi-kilowatt regime,and diode-pumped slab lasers range from small conductively cooled systems tolasers with kilowatt output. Improvements in the growth technology of Nd : YAGboules has made it possible to fabricate Nd : YAG slabs up to 20 cm in lengthand 2.5 cm wide. The superior thermal properties of this crystal, compared toglass, has led to dramatic performance improvements and also opened the doorfor conductively cooled slabs in combination with diode pumping.
A large diode-pumped, liquid-cooled zigzag Nd : YAG slab laser is illustratedin Fig. 6.34. A photograph and a drawing of a conductively cooled Nd : YAGzigzag slab laser is shown in Fig. 6.33. The slab is designed for 13 bounces andnear normal incidence AR-coated input faces. This type of slab geometry allowsboth S and P polarizations to be transmitted without loss. The slab dimensions are138 mm × 9.5 mm × 8 mm. The side of the slab, mounted to the heat sink, wascoated with a high reflection coating at 808 nm to allow two passes of the pumplight through the slab.
7.2.3 Disk Amplifiers
Solid-state glass-disk amplifiers were considered very early in the developmentof high-brightness pulsed laser systems in order to solve problems of cooling,aperture size, gain uniformity, and pumping efficiency. In a disk laser amplifier(see Fig. 6.42) pump radiation is distributed uniformly over the faces of the slab.Pump-induced slab heating is uniform laterally, thus allowing transverse tempera-ture gradients to be minimized. Such temperature gradients give rise to distortionin the slab just as in the rod geometry. In contrast to the rod geometry, however,the transverse gradients in the slab geometry arise only from spurious effects inpumping and cooling, whereas in the rod geometry, transverse temperature gradi-ents arise from the principal cooling mechanism.
The Brewster angle disk lasers have been primarily developed for very highpeak-power and relatively low average-power operation, with the slabs andcoolant all approaching thermal equilibrium in the interval between pulses. Tooperate the Brewster angle slab laser at high average power requires adequatecooling as, for example, with forced convection over the faces. In addition, sincethe laser beam must pass through the coolant, the problem of thermal distortionin the coolant must be dealt with. This operating mode requires that the slabs besufficiently thin so that the cooling time is several times less than the laser repeti-tion period. Figure 7.14 shows a configuration of a gas-cooled disk module whichcould potentially be developed for high average power operation, particularly ifthe Nd : glass slabs are replaced with crystalline laser host materials.

7.3. End-Pumped Configurations 271
FIGURE 7.14. Concept of a gas-cooled disk amplifier module designed for high averagepower operation [18].
7.3 End-Pumped Configurations
So far, we have discussed cylindrical rods and rectangular slab configurationswhich are pumped from the side. As we have seen, analytical solutions generallyassume uniform heating in an infinitely long rod or slab structure. End effects aretreated separately as a distortion of the two-dimensional temperature distribution.
In contrast to transversally pumped systems, heat deposition in end-pumpedlasers is very inhomogeneous. The very localized heat deposition leads to highlynonuniform and complex temperature and stress profiles. Besides the tempera-ture and stress-dependent variations of the refractive index, the contribution ofend bulging to the formation of a thermal lens can be substantial in end-pumpedlasers. Inhomogeneous local heating and nonuniform temperature distribution inthe laser crystal lead to a degradation of the beam quality due to the highly aber-rated nature of the thermal lens.
With the availability of high-power diode lasers, end-pumping, or longitudinal-pumping, of laser crystals has become a very important technology. End-pumpedlasers are described in Chapters 3, 6, and 9. Here, we are concerned with thethermal aspects of end-pumping.
The most common end-pumped configuration is a cylindrical rod mounted in atemperature-controlled heat sink with its cylindrical surface maintained at a con-stant temperature. The attraction of this arrangement is the relative simplicity ofits implementation, but owing to the predominantly radial heat flow, it has thedisadvantage of strong thermal lensing. Figure 7.15 shows the calculated temper-ature distribution in a conductively cooled end-pumped laser rod. An end-pumped
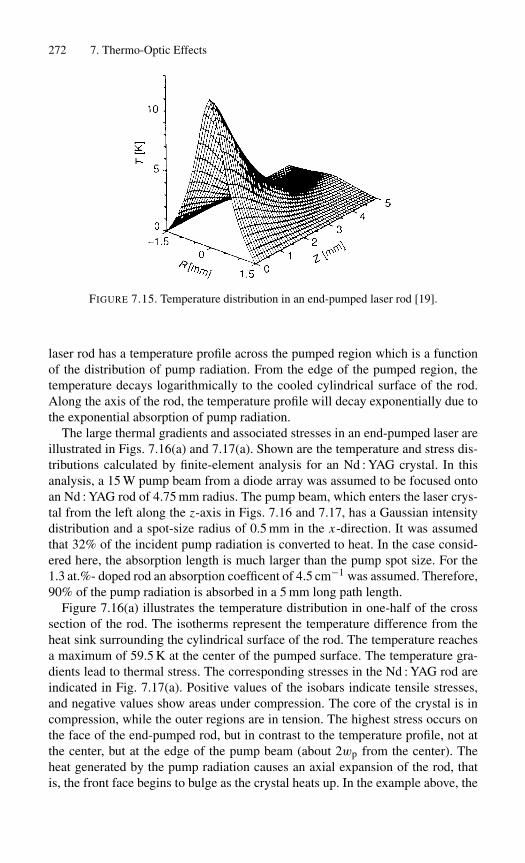
272 7. Thermo-Optic Effects
FIGURE 7.15. Temperature distribution in an end-pumped laser rod [19].
laser rod has a temperature profile across the pumped region which is a functionof the distribution of pump radiation. From the edge of the pumped region, thetemperature decays logarithmically to the cooled cylindrical surface of the rod.Along the axis of the rod, the temperature profile will decay exponentially due tothe exponential absorption of pump radiation.
The large thermal gradients and associated stresses in an end-pumped laser areillustrated in Figs. 7.16(a) and 7.17(a). Shown are the temperature and stress dis-tributions calculated by finite-element analysis for an Nd : YAG crystal. In thisanalysis, a 15 W pump beam from a diode array was assumed to be focused ontoan Nd : YAG rod of 4.75 mm radius. The pump beam, which enters the laser crys-tal from the left along the z-axis in Figs. 7.16 and 7.17, has a Gaussian intensitydistribution and a spot-size radius of 0.5 mm in the x-direction. It was assumedthat 32% of the incident pump radiation is converted to heat. In the case consid-ered here, the absorption length is much larger than the pump spot size. For the1.3 at.%- doped rod an absorption coefficent of 4.5 cm−1 was assumed. Therefore,90% of the pump radiation is absorbed in a 5 mm long path length.
Figure 7.16(a) illustrates the temperature distribution in one-half of the crosssection of the rod. The isotherms represent the temperature difference from theheat sink surrounding the cylindrical surface of the rod. The temperature reachesa maximum of 59.5 K at the center of the pumped surface. The temperature gra-dients lead to thermal stress. The corresponding stresses in the Nd : YAG rod areindicated in Fig. 7.17(a). Positive values of the isobars indicate tensile stresses,and negative values show areas under compression. The core of the crystal is incompression, while the outer regions are in tension. The highest stress occurs onthe face of the end-pumped rod, but in contrast to the temperature profile, not atthe center, but at the edge of the pump beam (about 2wp from the center). Theheat generated by the pump radiation causes an axial expansion of the rod, thatis, the front face begins to bulge as the crystal heats up. In the example above, the

7.3. End-Pumped Configurations 273
FIGURE 7.16. Modeled temperature profiles of an end-pumped Nd : YAG rod: (a) withuniform doping and (b) with a 5 mm long undoped end cap. The maximum values andtheir locations are indicated by arrows. The temperature difference beween two isothermsis 4 K [20].
bending of the pumped surface resulted in a dioptic power of 1.4 m−1. The axialexpansion of the rod leads to the high tensile stress at the pump face, as indicatedin Fig. 7.17(a).
The above-mentioned example illustrates a number of characteristic featuresof end-pumped systems. In order to maximize gain, and to match the TEM00resonator mode, the pump beam is tightly focused, which leads to high-pump-power irradiance incident on the end of the laser rod. As a result, the input faceis under a high thermal load. The thermal stress, which leads to strong thermallensing, is often high enough to cause fracture of the end face of the laser rod.
The thermal management of end-pumped lasers can be greatly improved bythe use of composite rods. Laser crystals, such as Nd : YAG, Nd : YVO4, andYb : YAG, have become available with sections of undoped host material on oneor both ends. These end caps are diffusion bonded to the doped laser crystal. Com-posite rods are proven to provide a very effective way to reduce temperature andstresses at the face of end-pumped lasers. This is illustrated in Figs. 7.16(b) and7.17(b) that show the result of an analysis carried out for an Nd : YAG rod with a

274 7. Thermo-Optic Effects
FIGURE 7.17. Distribution of the stresses (megapascals) generated by the temperaturegradients illustrated in Fig. 7.16 (a) for the uniformly doped crystal and (b) the rod with anundoped end cap [20].
5 mm long undoped YAG section at the pumped front end. The other parametersare the same as for the uniformly doped crystal. Because the undoped region istransparent to the impinging pump radiation, there is no thermal load generated atthe rod pump face.
The diffusion bond provides uninhibited heat flow from the doped to the un-doped region. A large temperature reduction of about 35% is achieved for thecomposite rod, where a significant part of heat flow occurs into the undoped endcap. The undoped end cap prevents the doped pump face from expanding along itsaxis; therefore no surface deformation takes place at this interface. This leads tostrong compressive stresses (as shown in Fig. 7.17(b)) instead of tensile stresses,as was the case for the unrestrained surface (Fig. 7.17(a)). Since the Nd : YAGcrystal, like most materials, is much stronger under compression than under ten-sion, the undoped end cap increases the stress fracture limit and thereby the max-imum thermal loading that can be tolerated by the end-pumped laser.
An important parameter for the design of the optical resonator is the amountof thermal lensing caused by the temperature distribution in an end-pumped lasercrystal. In a first approximation, the thermally induced lens can be described byconsidering only the temperature-dependent part of the refractive index. Also as-

7.3. End-Pumped Configurations 275
suming only radial heat flow in a rod that is in contact with a thermal heat sinkof fixed temperature, an analytical solution for the focal length of the thermallens was derived in [21]. A Gaussian pump beam incident on the crystal has beenassumed
I (r, z) = I0 exp(−2r2/w2p) exp(−α0z), (7.52)
where α0 is the absorption coefficient and wp is the (1/e2) Gaussian radius of thepump beam. With Ph the fraction of the pump power that results in heating, theeffective focal length for the entire rod can be expressed by
f = πKw2p
Ph(dn/dT )
(1
1 − exp(−α0l)
), (7.53)
where K is the thermal conductivity of the laser material and dn/dT is the changeof refractive index with temperature. From (7.53) it follows that the effective focallength depends on the square of the pump-beam radius wp. Therefore, it is desir-able to use the largest pump-beam radius consistent with resonator-mode match.
The dependence of thermal lensing on pump power is illustrated in Fig. 7.18.An end-pumped Nd : YAG rod with a length of 20 mm and a radius of 4.8 mm waspumped with a fiber-coupled laser-diode array. The output from the fiber bundlewas imaged onto the crystal surface into a pump spot with radius wp = 340µm.Figure 7.18 displays the measured thermal lens and the calculated values accord-ing to (7.53). In using this equation, we assume that 32% of the pump powerresults in heating. The material parameters required for Nd : YAG are dn/dT =7.3 × 10⁻⁶K−1, α0 = 4.1 cm−1, K = 0.13 W/cm K.
Equation (7.53) is an approximation for low and medium pump intensities. Athigh pump levels, the contribution of end bulging to thermal lensing is substan-tial and in Nd : YVO4 can be as high as the thermal index variations [23]. As
FIGURE 7.18. Thermal lensing in an end-pumped Nd : YAG laser. Measured values arefrom [22].
276 7. Thermo-Optic Effects
discussed above, end bulging due to thermal deformation can be prevented bydiffusion bonding of an undoped end cap at the pump side of the laser. Anotherapproach to reduce bulging is the application of mechanical stress to the crystalto compensate for thermally induced deformation. In this approach a thin crys-tal is compressed between a sapphire window and a copper heat sink. Pump andresonator beam enter through the sapphire window. At an applied pressure on theorder of 700 MPa a marked reduction of thermal lensing was observed [24].
Summary
In solid-state lasers only a small fraction of electrical input power is convertedto laser radiation; the remainder of the input power is converted to heat. Solidstate lasers require cooling of the pump source, active medium, and in case offlash lamp pumping, cooling of the pump enclosure. In this chapter we are con-cerned with the thermally induced effects caused by internal heating and removalof waste heat from the active medium. Heating of the laser medium is caused bynonradiative transitions within the active ions and by absorption of pump radiationby the host material. The amount of heat generated in a Nd : YAG crystal is aboutequal to the laser output power for laser diode pumping; in flash lamp pumpedsystems the heat generated is about three times as high as the laser output.
The combination of volumetric heating of the laser medium by the absorbedpump radiation and surface cooling required for heat extraction leads to a nonuni-form temperature distribution. The thermal gradients cause optical distortions thatcan severely degrade the optical quality of the laser beam and eventually limitthe laser output power, either because of an unacceptable poor beam pattern orbecause of thermal stress-induced breakage of the laser material. The optical dis-tortions are due to temperature and stress-dependent variations of the refractiveindex.
In long cylindrical laser rods that are transversely pumped by arc lamps ordiode lasers, the rods develop a quadratic radial temperature, refractive index andthermal strain profile. This leads to thermal focusing of the laser rod, and in caseof Nd : YAG, where the strain is different in radial and tangential directions, givesrise through the photoelastic effect, to thermally induced birefringence and stress-induced biaxial focusing.
The two-dimensional radial stress profile inherent in cylindrical geometrics isreduced to a one-dimensional plane stress distribution in a thin rectangular slabcooled only at the two opposing large faces. For incident radiation polarized alongthe major axis of the slab the stress-induced birefringence is zero. Cylindrical fo-cusing in a slab can be eliminated by choosing a propagation direction along azigzag path, which averages the distortions caused by the one-dimensional ther-mal gradient.
In end-pumped lasers a short cylindrical or rectangular laser crystal is mountedin a heat sink. Heat deposition in end-pumped lasers is very inhomogeneous. Thevery localized heat deposition leads to highly nonuniform and complex temper-

Summary 277
ature and stress profiles, depending on whether cooling is through the lateral orfront surface of the crystal. Also in end-pumped configurations the pumped frontsurface tends to bend owing to the locally varying expansion of the material.
In disk-type geometries the pump and laser radiation propagate in the samedirection just as in end-pumped systems. However, heat extraction is also in thelongitudinal direction. The idea behind the design of disk-shaped lasers is a re-duction or elimination of thermally induced index of refraction gradients acrossthe beam. Thermal gradients are predominantly in the direction of beam propaga-tion. In very thin disks, such as utilized in Yb : YAG lasers, heat is extracted fromthe back side, whereas the pump and laser beam enter the disk through the frontface. Very large disks employed in Nd : glass lasers are air or gas cooled on bothsides.
References[1] B. Comaskey, B.D. Moran, G.F. Albrecht, and R.J. Beach: IEEE J. Quantum Elec-
tron. QE-31, 1261 (1995).
[2] T.Y. Fan: IEEE J. Quantum Electron. QE-29, 1457 (1993).
[3] T.S. Chen, V.L. Anderson, and O. Kahan: IEEE J. Quantum Electron. QE-26, 6(1990).
[4] M.S. Mangir and D.A. Rockwell: IEEE J. Quantum Electron. QE-22, 574 (1986).
[5] D.S. Sumida, D.A. Rockwell, and M.S. Mangir: IEEE J. Quantum Electron. QE-24,985 (1988).
[6] H.S. Carslaw and J.C. Jaeger: Conduction of Heat in Solids (Oxford University Press,London), 1948, p. 191.
[7] W. Koechner: Appl. Opt. 9, 1429 (1970).
[8] S. Timoshenko and J.N. Goodier: Theory of Elasticity, 3rd ed. (McGraw-Hill, Singa-pore), 1982.
[9] M. Born and E. Wolf: Principles of Optics (Pergamon, London), 1965.
[10] J.F. Nye: Physical Properties of Crystals (Clarendon, Oxford, UK), 1985, reprinted1993.
[11] J.D. Foster and L.M. Osterink: J. Appl. Phys. 41, 3656 (1970).
[12] W. Koechner and D.K. Rice: IEEE J. Quantum Electron. QE-6, 557 (1970).
[13] W. Koechner: Appl. Opt. 9, 2548 (1970).
[14] G.D. Baldwin: Q-switched evaluation of Nd: CaLaSOAP. Final Report AFAL-TR-72-334, Air Force Avionics Laboratory, Wright-Patterson AFB, Ohio (September1972).
[15] S.Z. Kurtev, O.E. Denchev, and S.D. Savov: Appl. Opt. 32, 278 (1993).
[16] W.C. Scott and M. de Wit: Appl. Phys. Lett. 18, 3 (1971).
[17] J.M. Eggleston, T.J. Kane, K. Kuhn, J. Unternahrer, and R.L. Byer: IEEE J. QuantumElectron. QE-20, 289 (1984).
[18] M.A. Summers, J.B. Trenholme, W.L. Gagnon, R.J. Gelinas, S.E. Stokowski, J.E.Marion, H.L. Julien, J.A. Blink, D.A. Bender, M.O. Riley, and R.F. Steinkraus: HighPower and Solid State Lasers (edited by W. Simmons), SPIE Proc. 622, 2 (1986).
278 7. Thermo-Optic Effects
[19] J. Frauchiger, P. Albers, and H.P. Weber: IEEE J. Quantum Electron. QE-28, 1046(1992).
[20] R. Weber, B. Neuenschwander, M. MacDonald, M.B. Roos, and H.P. Weber: IEEE J.Quantum Electron. QE-34, 1046 (1998).
[21] M.E. Innocenzi, H.T. Yura, C.L. Fincher, and R.A. Fields: Appl. Phys. Lett. 56, 1831(1990).
[22] B. Neuenschwander, R. Weber, and H.P. Weber: IEEE J. Quantum Electron. QE-31,1082 (1995).
[23] X. Peng, A. Asundi, Y. Chen, and Z. Xiong: Appl. Opt. 40, 1396 (2001).
[24] Y. Liao, R.J.D. Miller, and M.R. Armstrong: Opt. Lett. 24, 1343 (1999).
Exercises
1. Evaluate (7.34) for Nd : YAG and, ignoring end effects, find the material con-stant that determines the thermal lensing-induced focal length of a laser rodmade of this material that is uniformly pumped.
2. Is the assumption of uniform pumping in the previous problem strictly valid?If you think it is, explain in words and sketches why this is so. If you think itis not, explain in words and sketches why it is not so.
3. If an Nd : YAG laser rod with flat and parallel faces is placed centered betweentwo flat resonator mirrors spaced by 1 m, is the resonator stable or unstable?When the pump lamp (assume an ideal elliptical pump cavity and an idealcw discharge lamp) power reaches the threshold value for oscillation that youwould calculate using the formalism of Chapter 3, you find that lasing doesnot begin. Instead, you have to pump harder. At what pump power would youexptect it to start lasing and why?
4. When the laser in Problem 3 is lasing you try to get more output by pumpingstill harder. You do up to a point and then the lasing stops. At what pump powerwould you expect the lasing to stop and why?

8
Q-Switching
8.1 Q-Switch Theory8.2 Mechanical Devices8.3 Electro-Optical Q-Switches8.4 Acousto-Optic Q-Switches8.5 Passive Q-Switch
ReferencesExercises
A mode of laser operation extensively employed for the generation of high pulsepower is known as Q-switching. It has been so designated because the optical Qof the resonant cavity is altered when this technique is used. As was discussed inChapter 3, the quality factor Q is defined as the ratio of the energy stored in thecavity to the energy loss per cycle. Consequently, the higher the quality factor, thelower the losses.
In the technique of Q-switching, energy is stored in the amplifying mediumby optical pumping while the cavity Q is lowered to prevent the onset of laseremission. Although the energy stored and the gain in the active medium are high,the cavity losses are also high, lasing action is prohibited, and the population in-version reaches a level far above the threshold for normal lasing action. The timefor which the energy may be stored is on the order of τf, the lifetime of the upperlevel of the laser transition. When a high cavity Q is restored, the stored energy issuddenly released in the form of a very short pulse of light. Because of the highgain created by the stored energy in the active material, the excess excitation isdischarged in an extremely short time. The peak power of the resulting pulse ex-ceeds that obtainable from an ordinary long pulse by several orders of magnitude.
Figure 8.1 shows a typical time sequence of the generation of a Q-switchedpulse. Lasing action is disabled in the cavity by a low Q of the cavity. Towardthe end of the flashlamp pulse, when the inversion has reached its peak value, theQ of the resonator is switched to some high value. At this point a photon fluxstarts to build up in the cavity, and a Q-switch pulse is emitted. As illustrated in
279
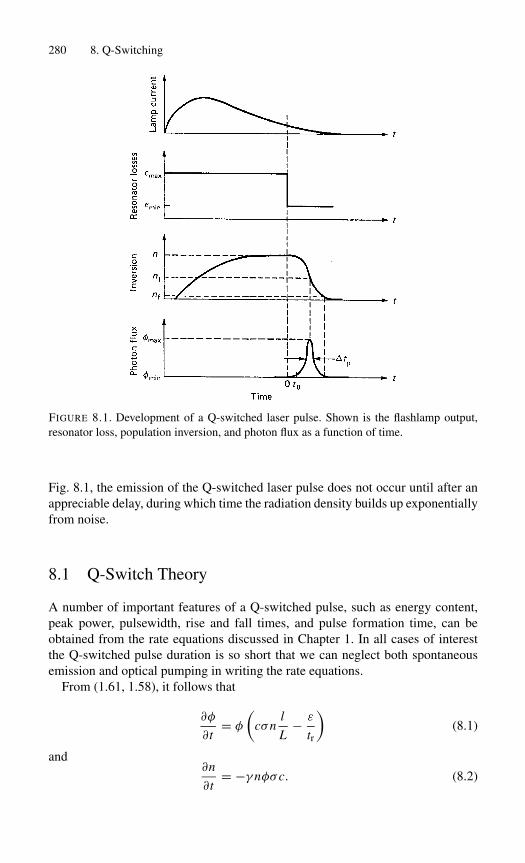
280 8. Q-Switching
FIGURE 8.1. Development of a Q-switched laser pulse. Shown is the flashlamp output,resonator loss, population inversion, and photon flux as a function of time.
Fig. 8.1, the emission of the Q-switched laser pulse does not occur until after anappreciable delay, during which time the radiation density builds up exponentiallyfrom noise.
8.1 Q-Switch Theory
A number of important features of a Q-switched pulse, such as energy content,peak power, pulsewidth, rise and fall times, and pulse formation time, can beobtained from the rate equations discussed in Chapter 1. In all cases of interestthe Q-switched pulse duration is so short that we can neglect both spontaneousemission and optical pumping in writing the rate equations.
From (1.61, 1.58), it follows that
∂φ
∂t= φ
(cσn
l
L− ε
tr
)(8.1)
and∂n
∂t= −γ nφσc. (8.2)

8.1. Q-Switch Theory 281
In (8.1) we expressed the photon lifetime τc by the round-trip time tr and thefractional loss ε per round trip according to (3.8). Also, a distinction is madebetween the length of the active material l and the length of the resonator L .Q-switching is accomplished by making ε an explicit function of time (e.g., ro-tating mirror or Pockels cell Q-switch) or a function of the photon density (e.g.,saturable absorber Q-switch). The losses in a cavity can be represented by
ε = −lnR + δ + ζ(t), (8.3)
where the first term represents the output coupling losses determined by the mirrorreflectivity R, the second term contains all the incidental losses such as scattering,diffraction, and absorption, and ζ(t) represents the cavity loss introduced by theQ-switch. For a particular explicit form of ζ(t, φ), the coupled rate equations canbe solved numerically with the boundary condition ζ(t < 0) = ζmax; ζ(t ≥0) = 0. In many instances Q-switches are so fast that no significant change ofpopulation inversion takes place during the switching process; in these cases ζcan be approximated by a step function.
In the ideal case, where the transition from low Q to high Q is made instan-taneously, the solution to the rate equations is particularly simple. In this casewe assume that at t = 0 the laser has an initial population inversion ni, and theradiation in the cavity has some small but finite photon density φi. Initially, thephoton density is low while the laser is being pumped and the cavity losses areεmax = − ln R + δ + ζmax as illustrated in Fig. 8.1. The losses are suddenly re-duced to εmin = − ln R + L . The photon density rises from φi, reaches a peakφmax many orders of magnitude higher than φi, and then declines to zero. Thepopulation inversion is a monotone decreasing function of time starting at the ini-tial inversion ni and ending at the final inversion nf. We note that the value for nfis below the threshold inversion nt for normal lasing operation. At nt the photonflux is maximum and the rate of change of the inversion dn/dt is still large andnegative, so that n falls below the threshold value nt and finally reaches the valuenf. If ni is not too far above nt, that is, initial gain is close to threshold, then thefinal inversion nf is about the same amount below threshold as ni is above andthe output pulse is symmetric. On the other hand, if the active material is pumpedconsiderably above threshold, the gain drops quickly in a few cavity transit timestr to where it equalizes the losses. After the maximum peak power is reached atnt, there are enough photons left inside the laser cavity to erase the remainingpopulation excess and drive it quickly to zero. In this case the major portion ofthe decay proceeds with a characteristic time constant τc, which is the cavity timeconstant.
The equations describing the operation of rapidly Q-switched lasers involvesthe simultaneous solution of two coupled differential equations for the time rateof change of the internal photon density in the resonator, (8.1), and the populationinversion density in the active medium, (8.2). We can express the output energyof the Q-switched laser as follows [1]:
282 8. Q-Switching
Eout = hνA
2σγln
(1
R
)ln
(ni
nf
), (8.4)
where hν is the laser photon energy and A is the effective beam cross sectionalarea. The initial and final population inversion densities, ni and nf, are related bythe transcendental equation
ni − nf = nt ln
(ni
nf
), (8.5)
where nt is the population inversion density at threshold, that is,
nt = 1
2σ�
(ln
1
R+ δ
). (8.6)
The pulse width of the Q-switch pulse can also be expressed as a function of theinversion levels, ni, nf, nt,
�tp = τcni − nf
ni − nt[1 + ln(ni/nt)] . (8.7)
The equations for pulse energy, pulse width, and therefore peak power, are ex-pressed in terms of the initial and final population inversion densities which de-pend not only on the particular choice of output coupler, but which are also relatedvia a transcendental equation.
An analytical solution has been reported in [2], which reveals that key parame-ters such as optimum reflectivity, output energy, extraction efficiency, pulse width,peak power, etcetera, can all be expressed as a function of a single dimensionlessvariable z = 2g0�/δ, where 2g0� is the logarithmic small-signal gain and δ is theround-trip loss.
It is interesting to note that in Chapter 3 we derived expressions for Topt, Popt,and ηE for normal mode operation of the oscillator which were also functionsof the parameter z. We will summarize the results of [2] because the equationspresented in this work are particularly useful to the laser designer. The followingexpression for the optimum reflectivity was derived
Ropt = exp
[−δ
(z − 1 − ln z
ln z
)]. (8.8)
For values of Ropt close to one, this expression simplifies to
Topt = δ
(z − 1
lnz − 1
). (8.9)
This equation has a similar functional form as (3.70), which was derived for thelong pulse operation. In both cases the optimum transmission increases for largervalues of z and δ.
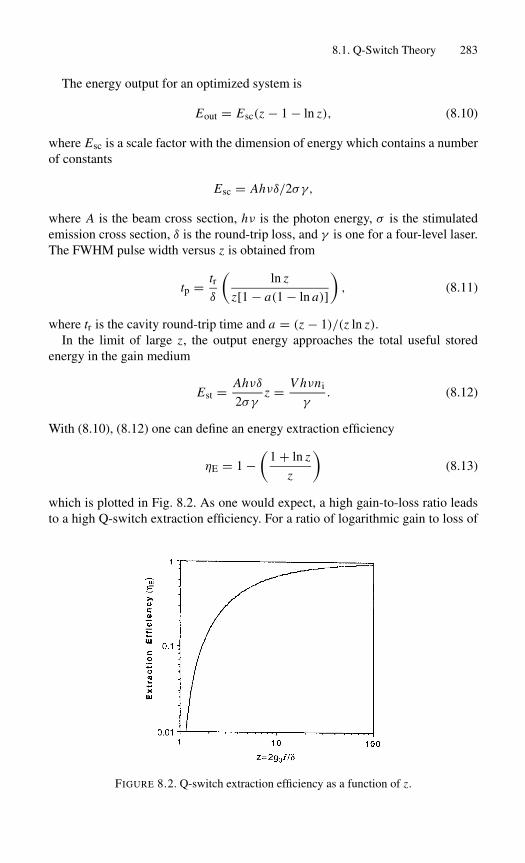
8.1. Q-Switch Theory 283
The energy output for an optimized system is
Eout = Esc(z − 1 − ln z), (8.10)
where Esc is a scale factor with the dimension of energy which contains a numberof constants
Esc = Ahνδ/2σγ,
where A is the beam cross section, hν is the photon energy, σ is the stimulatedemission cross section, δ is the round-trip loss, and γ is one for a four-level laser.The FWHM pulse width versus z is obtained from
tp = trδ
(ln z
z[1 − a(1 − ln a)]), (8.11)
where tr is the cavity round-trip time and a = (z − 1)/(z ln z).In the limit of large z, the output energy approaches the total useful stored
energy in the gain medium
Est = Ahνδ
2σγz = V hνni
γ. (8.12)
With (8.10), (8.12) one can define an energy extraction efficiency
ηE = 1 −(
1 + ln z
z
)(8.13)
which is plotted in Fig. 8.2. As one would expect, a high gain-to-loss ratio leadsto a high Q-switch extraction efficiency. For a ratio of logarithmic gain to loss of
FIGURE 8.2. Q-switch extraction efficiency as a function of z.

284 8. Q-Switching
about 10, an extraction efficiency of 70% is achieved. For higher factors of z, theextraction efficiency increases only very slowly.
The reader is reminded that the shape of the curve for ηE is similar to the resultsobtained for the free-running laser discussed in Chapter 3, see Fig. 3.7, whichalso depends only on the ratio of 2g0�/δ. It is also important to remember thatbesides the Q-switch extraction efficiency expressed by (8.13), the total energyextraction from a Q-switched laser also depends on the fluorescence losses andASE depopulation losses prior to opening of the Q-switch. The overall efficiencyof the Q-switch process was defined in Section 3.4.1 as the product of the Q-switch extraction efficiency, storage efficiency, and depopulation efficiency.
Laser-design trade-offs and performance projections and system optimizationcan be accomplished quickly with the help of (8.8)–(8.13). For example, weconsider the design parameters for a Q-switched Nd : YAG laser with a desiredmultimode output of 100 mJ. The laser crystal has a diameter of 5 mm and thelaser resonator is 30 cm long. Assuming a 5% round-trip cavity loss (δ = 0.05),and with hν = 1.86 × 10⁻¹⁹ J and σ = 2.8 × 10⁻¹⁹, cm2 we calculate Esc =3.2 × 10⁻³ J. This requires a ratio of Eout/Esc = 31 in order to achieve the de-sired output energy. From (8.10), one therefore obtains a value 2g0�/δ = 35, or asingle-pass power gain of the rod of G = exp(g0�) = 2.4. Extraction efficiencyfollows from (8.12) to be around 87% for z = 35 and the optimum output couplerhas a reflectivity of R = 0.65 according to (8.9). Since the cavity transit round-triptime for the given resonator length is about 2 ns, the expected pulse width fromthe laser is tp = 11 ns according to (8.11). The peak power of the Q-switch pulsefollows from the parameters already calculated and is Pp = Eout/tp = 9 MW.
8.1.1 Continuously Pumped, RepetitivelyQ-Switched Systems
A very important class of laser systems, employed extensively in micromachiningapplications, is the cw-pumped, repetitively Q-switched Nd : YAG laser. In theselaser systems the population inversion undergoes a cyclic variation, as shown inFig. 8.3. Between Q-switches the population inversion rises from a value nf to avalue ni. The buildup of the inversion under the influence of a continuous pumpingrate and spontaneous decay is described as a function of time by
n(t) = n∞ − (n∞ − nf) exp
(− t
τf
), (8.14)
where n∞ is the asymptotic value of the population inversion which is approachedas t becomes large compared to the spontaneous decay time τf. The value n∞,which depends on the pump input power, is reached only at repetition rates smallcompared to 1/τf. For repetition rates larger than 1/τf, the curves representingthe buildup of the population are shorter segments of the same exponential curvefollowed for the lower repetition rates.

8.1. Q-Switch Theory 285
FIGURE 8.3. Population inversion versus time in a continuously pumped Q-switched laser.Shown is the inversion for two different repetition rates. At repetition rates less than 1/τf,the inversion approaches the asymptotic value n∞.
During the emission of a Q-switch pulse, the inversion changes from ni to nf.Figure 8.4 shows the development of the Q-switched pulse on an expanded timescale. At t = 0 the cavity Q factor starts to increase until it reaches its maximumvalue Qmax at t = t1. Pulse formation ensues until the full pulse output is achievedat t = t2. Stimulated emission ceases at t = t3; at this time continued pumpingcauses the inversion to start to increase. At the point where the inversion beginsto increase, t = t3, the cavity Q begins to decrease, reaching its minimum valueat t = t4. During the time period t3–t5, the inversion is allowed to build up to itsinitial value ni.
The theory of Q-switch operation [1], summarized at the beginning of this chap-ter for the case of single Q-switched pulses, can also be applied to the case ofrepetitive Q-switches, with some modifications that take into account the effectsof continuous pumping. Equations (8.1), (8.2) are applicable, however we will setγ = 1 and n = n2 because all repetitively Q-switched lasers of practical use are
FIGURE 8.4. Development of a Q-switched pulse in a cw-pumped system [3].
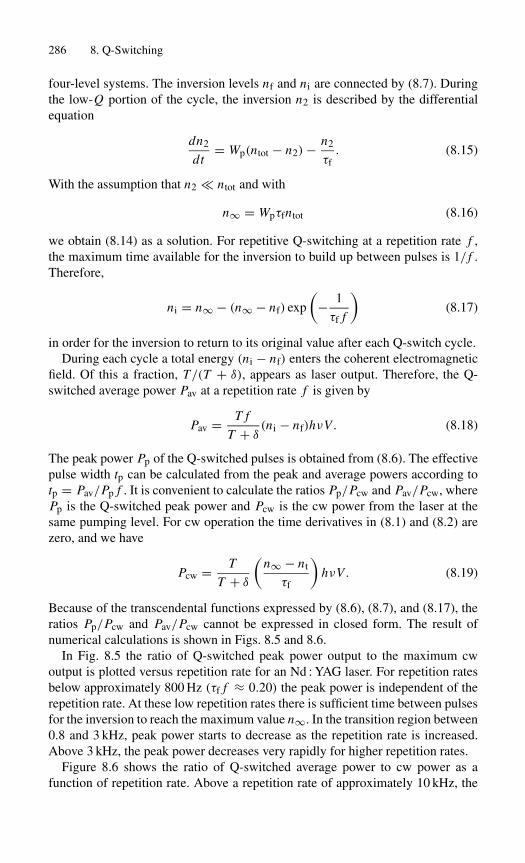
286 8. Q-Switching
four-level systems. The inversion levels nf and ni are connected by (8.7). Duringthe low-Q portion of the cycle, the inversion n2 is described by the differentialequation
dn2
dt= Wp(ntot − n2)− n2
τf. (8.15)
With the assumption that n2 ntot and with
n∞ = Wpτfntot (8.16)
we obtain (8.14) as a solution. For repetitive Q-switching at a repetition rate f ,the maximum time available for the inversion to build up between pulses is 1/ f .Therefore,
ni = n∞ − (n∞ − nf) exp
(− 1
τf f
)(8.17)
in order for the inversion to return to its original value after each Q-switch cycle.During each cycle a total energy (ni − nf) enters the coherent electromagnetic
field. Of this a fraction, T/(T + δ), appears as laser output. Therefore, the Q-switched average power Pav at a repetition rate f is given by
Pav = T f
T + δ(ni − nf)hνV . (8.18)
The peak power Pp of the Q-switched pulses is obtained from (8.6). The effectivepulse width tp can be calculated from the peak and average powers according totp = Pav/Pp f . It is convenient to calculate the ratios Pp/Pcw and Pav/Pcw, wherePp is the Q-switched peak power and Pcw is the cw power from the laser at thesame pumping level. For cw operation the time derivatives in (8.1) and (8.2) arezero, and we have
Pcw = T
T + δ
(n∞ − nt
τf
)hνV . (8.19)
Because of the transcendental functions expressed by (8.6), (8.7), and (8.17), theratios Pp/Pcw and Pav/Pcw cannot be expressed in closed form. The result ofnumerical calculations is shown in Figs. 8.5 and 8.6.
In Fig. 8.5 the ratio of Q-switched peak power output to the maximum cwoutput is plotted versus repetition rate for an Nd : YAG laser. For repetition ratesbelow approximately 800 Hz (τf f ≈ 0.20) the peak power is independent of therepetition rate. At these low repetition rates there is sufficient time between pulsesfor the inversion to reach the maximum value n∞. In the transition region between0.8 and 3 kHz, peak power starts to decrease as the repetition rate is increased.Above 3 kHz, the peak power decreases very rapidly for higher repetition rates.
Figure 8.6 shows the ratio of Q-switched average power to cw power as afunction of repetition rate. Above a repetition rate of approximately 10 kHz, the

8.1. Q-Switch Theory 287
FIGURE 8.5. Ratio of peak power to cw power as a function of the repetition rate for a typ-ical cw-pumped Nd : YAG laser. The parameter n∞/nt expresses the fractional inversionabove threshold [4].
FIGURE 8.6. Ratio of Q-switched average power to maximum cw power as a function ofnormalized repetition rate f [4].

288 8. Q-Switching
FIGURE 8.7. Performance of a cw-pumped Nd : YAG laser system. Plotted is the peakpower, average power, pulse buildup time, and pulse width as a function of repetition rate.
Q-switch average power approaches the cw power. At low repetition rates theaverage power is proportional to the repetition rate. In Fig. 8.7 the experimen-tally determined peak power, average power pulse width, and pulse buildup timeis plotted as a function of repetition rate for an Nd : YAG laser. In accordancewith theory, for higher repetition rates the pulse width and the pulse buildup timeincrease as a result of the reduction of gain.
In the following sections we will describe and compare different Q-switch tech-niques.
8.2 Mechanical Devices
Q-switches have been designed based upon rotational, oscillatory, or translationalmotion of optical components. These techniques have in common that they inhibitlaser action during the pump cycle by either blocking the light path, causing amirror misalignment, or reducing the reflectivity of one of the resonator mirrors.Near the end of the flashlamp pulse, when maximum energy has been stored inthe laser rod, a high Q-condition is established and a Q-switch pulse is emittedfrom the laser.
Mechanical Q-switches are relatively slow and tend to emit multiple pulses;also, the mechanical wear requires frequent maintenance. Owing to these disad-vantages mechanical Q-switches have been replaced by electro-optic or acousto-optic devices.

8.3. Electro-Optical Q-Switches 289
8.3 Electro-Optical Q-Switches
Very fast electronically controlled optical shutters can be designed by exploitingthe electro-optic effect in crystals or liquids. The key element in such a shutteris an electro-optic element that becomes birefringent under the influence of anexternal field. Birefringence in a medium is characterized by two orthogonal di-rections, called the “fast” and “slow” axes, which have different indices of refrac-tion. An optical beam, initially plane-polarized at 45◦ to these axes and directednormal to their plane, will split into two orthogonal components, traveling alongthe same path but at different velocities. Hence, the electro-optic effect causes aphase difference between the two beams. After traversing the medium, the combi-nation of the two components results, depending on the voltage applied, in eitheran elliptical, circular, or linearly polarized beam. For Q-switch operation onlytwo particular voltages leading to a quarter-wave and half-wave retardation are ofinterest. In the first case, the incident linearly polarized light is circular polarizedafter passing the cell, and in the second case the output beam is linearly polarized;however, the plane of polarization has been rotated 90◦.
The two most common arrangements for Q-switching are shown in Fig. 8.8. InFig. 8.8(a) the electro-optic cell is located between a polarizer and the rear mirror.
FIGURE 8.8. Electro-optic Q-switch operated at (a) quarter-wave and (b) half-wave retar-dation voltage.

290 8. Q-Switching
The inclusion of the polarizer is not essential if the laser radiation is polarized,such as, for example, in Nd : YLF. The sequence of operation is as follows: Duringthe flashlamp pulse, a voltage V1/4 is applied to the electro-optic cell such that thelinearly polarized light passed through the polarizer is circularly polarized. Afterbeing reflected at the mirror, the radiation again passes through the electro-opticcell and undergoes another λ/4 retardation, becoming linearly polarized but at90◦ to its original direction. This radiation is ejected from the laser cavity by thepolarizer, thus preventing optical feedback. Toward the end of the flashlamp pulsethe voltage on the cell is switched off, permitting the polarizer–cell combinationto pass a linearly polarized beam without loss. Oscillation within the cavity willbuild up, and after a short delay a Q-switch pulse will be emitted from the cavity.
In the arrangement of Fig. 8.8(b) an electric voltage must first be applied tothe cell to transmit the beam. In this so-called pulse-on Q-switch, the cell is lo-cated between two crossed polarizers. As before, polarizer P1, located betweenthe laser rod and the cell, is not required if the active medium emits a polarizedbeam. During the flashlamp pulse, with no voltage applied to the cell, the cavityQ is at a minimum due to the crossed polarizers. At the end of the pump pulsea voltage V1/2 is applied to the cell, which causes a 90◦ rotation of the incomingbeam. The light is therefore transmitted by the second polarizer P2. Upon reflec-tion at the mirror the light passes again through polarizer P2 and the cell, whereit experiences another 90◦ rotation. Light traveling toward the polarizer P1 hasexperienced a 180◦ rotation and is therefore transmitted through P1.
Two types of electro-optic effects have been utilized in laser Q-switches: thePockels effect, which occurs in crystals that lack a center of point symmetry, andthe Kerr effect, which occurs in certain liquids. Pockels cells, which require afactor of 5 to 10 lower voltage than Kerr cells, are the most widely used activedevices for Q-switching pulsed lasers.
Pockels Cell Q-Switch
The Pockels cell contains an electro-optic crystal in which a refractive indexchange is produced by an externally applied electric field. Crystals are classifiedinto 32-point groups according to their structure. Only 20-point groups, namelythose that lack a center on symmetry, exhibit a nonvanishing electro-optic effect.The index change produced by an externally applied field is described in eachcase by a 6 × 3 matrix of electro-optic coefficients. The number of coefficients isgreatly reduced by the structural characteristics of crystals. The most commonlyused electro-optic materials have only a few distinct coefficients. The location ofa coefficient in the matrix array interrelates the crystal orientation, the appliedfield direction, and the polarization and direction of the optical beam. The magni-tude of each coefficient determines the strength of the electro-optic effect for eachgeometry.
The basic requirements for a crystal to be useful as an electro-optic Q-switchare: a good optical quality combined with a high laser damage threshold and alarge electro-optic coefficient for light propagating parallel to the optic axis. The
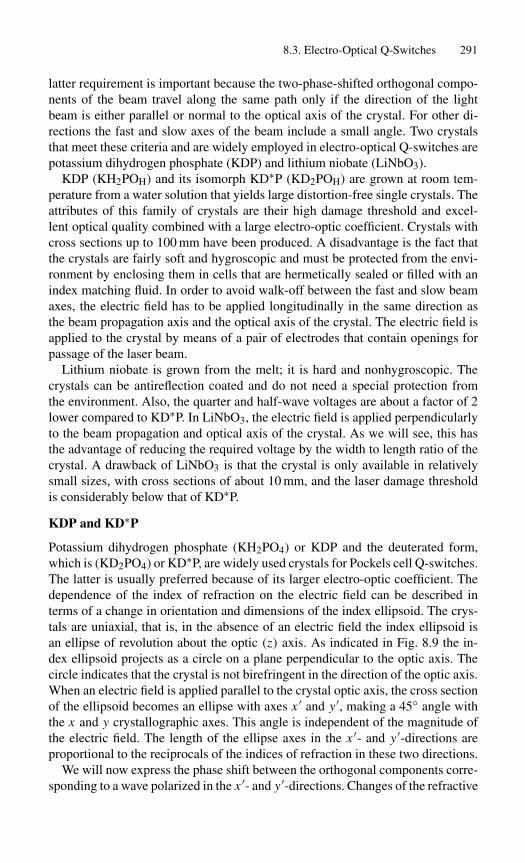
8.3. Electro-Optical Q-Switches 291
latter requirement is important because the two-phase-shifted orthogonal compo-nents of the beam travel along the same path only if the direction of the lightbeam is either parallel or normal to the optical axis of the crystal. For other di-rections the fast and slow axes of the beam include a small angle. Two crystalsthat meet these criteria and are widely employed in electro-optical Q-switches arepotassium dihydrogen phosphate (KDP) and lithium niobate (LiNbO3).
KDP (KH2POH) and its isomorph KD∗P (KD2POH) are grown at room tem-perature from a water solution that yields large distortion-free single crystals. Theattributes of this family of crystals are their high damage threshold and excel-lent optical quality combined with a large electro-optic coefficient. Crystals withcross sections up to 100 mm have been produced. A disadvantage is the fact thatthe crystals are fairly soft and hygroscopic and must be protected from the envi-ronment by enclosing them in cells that are hermetically sealed or filled with anindex matching fluid. In order to avoid walk-off between the fast and slow beamaxes, the electric field has to be applied longitudinally in the same direction asthe beam propagation axis and the optical axis of the crystal. The electric field isapplied to the crystal by means of a pair of electrodes that contain openings forpassage of the laser beam.
Lithium niobate is grown from the melt; it is hard and nonhygroscopic. Thecrystals can be antireflection coated and do not need a special protection fromthe environment. Also, the quarter and half-wave voltages are about a factor of 2lower compared to KD∗P. In LiNbO3, the electric field is applied perpendicularlyto the beam propagation and optical axis of the crystal. As we will see, this hasthe advantage of reducing the required voltage by the width to length ratio of thecrystal. A drawback of LiNbO3 is that the crystal is only available in relativelysmall sizes, with cross sections of about 10 mm, and the laser damage thresholdis considerably below that of KD∗P.
KDP and KD∗P
Potassium dihydrogen phosphate (KH2PO4) or KDP and the deuterated form,which is (KD2PO4) or KD∗P, are widely used crystals for Pockels cell Q-switches.The latter is usually preferred because of its larger electro-optic coefficient. Thedependence of the index of refraction on the electric field can be described interms of a change in orientation and dimensions of the index ellipsoid. The crys-tals are uniaxial, that is, in the absence of an electric field the index ellipsoid isan ellipse of revolution about the optic (z) axis. As indicated in Fig. 8.9 the in-dex ellipsoid projects as a circle on a plane perpendicular to the optic axis. Thecircle indicates that the crystal is not birefringent in the direction of the optic axis.When an electric field is applied parallel to the crystal optic axis, the cross sectionof the ellipsoid becomes an ellipse with axes x ′ and y ′, making a 45◦ angle withthe x and y crystallographic axes. This angle is independent of the magnitude ofthe electric field. The length of the ellipse axes in the x ′- and y ′-directions areproportional to the reciprocals of the indices of refraction in these two directions.
We will now express the phase shift between the orthogonal components corre-sponding to a wave polarized in the x ′- and y ′-directions. Changes of the refractive

292 8. Q-Switching
FIGURE 8.9. Change of the index ellipsoid in a KDP crystal when an electric field isapplied parallel to the z-axis, I0 is an incident wave polarized in the x-direction, x and yare the crystallographic axes, and x ′ and y′ are the electrically induced axes.
index �n are related by the electro-optic tensor ri j of rank 3 to the applied field
�
(1
n2i
)=
3∑j=1
ri j E j , (8.20)
where i = 1, . . . , 6 and j = 1, . . . , 3.Generally there exist 18 linear electro-optic coefficients ri j . However, in crys-
tals of high symmetry, many of these vanish. For phosphates of the KDP family,r63 is the only independent electro-optic coefficient that describes the changes inthe ellipsoid when a longitudinal field is applied to the crystal. The change ofrefractive index in the x ′- and y ′-directions is
nx ′ = n0 + 12 n3
0r63 Ez, ny′ = n0 − 12 n3
0r63 Ez, (8.21)
where n0 is the ordinary index of refraction and Ez is the electric field in thez-direction. The difference in the index of refraction for the two orthogonal com-ponents is then
�n0 = n30r63 Ez . (8.22)
For a crystal of length l, this leads to a path-length difference �n0l and a phasedifference of �ϕ = (2π/λ)�n0l.
The phase difference δ in a crystal of length l is related to the voltage Vz = Ezlapplied across the faces by
�ϕ = 2π
λn3
0r63Vz . (8.23)
It should be noted that δ is a linear function of voltage and is independent of thecrystal dimensions. If linearly polarized light is propagated through the crystal

8.3. Electro-Optical Q-Switches 293
with the direction of polarization parallel to the x- or y-axis, as shown in Fig. 8.9,the components of this vector parallel to the electrically induced axes x ′ and y ′will suffer a relative phase shift δ. In general, orthogonal components undergoinga relative phase shift produce elliptically polarized waves. Thus, the application ofvoltage in this configuration changes linearly polarized light to elliptically polar-ized light. If the light then passes through a polarizer, the resulting light intensitywill be a function of the ellipticity and therefore the voltage applied to the crystal.A simple derivation shows that, with the analyzer axis oriented at right angles tothe input polarization direction, the voltage and the transmitted light intensity Iare related by [5]
I = I0 sin2 �ϕ
2, (8.24)
where I0 is the input light intensity.For Q-switch operation, two particular values of phase shift are of interest:
these are the λ/4 and λ/2 wave retardations that correspond to a phase shiftof π/2 and π . With linearly polarized light being applied, for example, in thex-direction, as shown in Fig. 8.9, the output from the crystal is circularly polar-ized if �ϕ = π/2. For �ϕ = π the output beam is linearly polarized, but theplane of polarization has been rotated 90◦.
From (8.23) it follows that the voltage required to produce a retardation of π is
V1/2 = λ
2n30r63
. (8.25)
KD∗P has an index of refraction of n = 1.51 and an electro-optic constant r63 =26.4 × 10⁻⁶ µm/V. With these values we calculate a voltage of Vλ/2 = 5.8 kV at1.06µm in order to produce a half-wave retardation.
LiNbO3
The crystal lithium niobate is employed in transverse field electro-optic Q-switches. In an arrangement as shown in Fig. 8.10 light propagates along thec-axis of the crystal. If the light is polarized parallel to the a-axis and an electricfield is applied parallel to the a axis, the half-wave retardation is
V1/2 = λd
2r22n30l, (8.26)
where l is the length of the crystal in the c-direction, d is the distance between theelectrodes along the a-axis, and r22 is the electro-optic coefficient.
The half-wave voltage is directly proportional to the distance between the elec-trodes and inversely proportional to the path length. At a wavelength of λ = 1.064µm, the linear electro-optic coefficient is r22 = 5.61×10⁻⁶ µm/V and the refrac-tive index of the ordinary ray is n0 = 2.237 in LiNbO3. The theoretical half-wavevoltage obtained from (8.26) for a typical crystal size of 9 mm × 9 mm × 25 mm

294 8. Q-Switching
FIGURE 8.10. Electro-optic Q-switch employing an LiNbO3 crystal.
is 3.0 kV. The high refractive index of LiNbO3 and the geometrical factor d/� areresponsible for the lower voltage requirements of LiNbO3 as compared to KD∗P.
Examples of Pockels Cell Q-Switched Lasers
Output energies between 100 and 250 mJ are obtained from Nd : YAG oscillators.The energy extraction is limited by the high gain of this material, which leads toprelasing and subsequently to a depopulation of the inversion. The width of theQ-switched pulses is usually between 10 and 25 ns, and the pulse buildup time isbetween 50 and 100 ns in typical systems.
For typical KD∗P Pockels cell Q-switches the maximum power density isaround 250 MW/cm2 and for LiNbO3 Q-switches about 50 MW/cm2. Switchinga Pockels cell to obtain a quarter-wave retardation has the advantage that it re-quires only half the voltage of a half-wave retardation device. But the voltagehas to be applied to the crystal for the duration of the pump pulse (i.e., about240µs for Nd : YAG). In the case of a half-wave retardation, the voltage is onlyapplied to the crystal during the pulse build-up time at the end of the pump cycle(typically about 100 ns). As far as the electronics is concerned, for λ/4, switchinga fast turn-off of the high voltage is critical and, for λ/2, switching a fast rise-timeof the high voltage pulse is important to minimize resonator losses.
Operation of an electro-optically Q-switched laser requires fast switching ofvoltages in the multi-kilovolt regime. The driver for the Pockels cell must be ahigh-speed, high-voltage switch that also must deliver a sizeable current. The cellhas a few tens of picofarads capacitance which is charged (or discharged) to sev-eral kilovolts in a few nanoseconds. The resulting current is of the order of 10 to20 A. Common switching techniques include the use of MOSFET’s, SCR’s, andavalanche transistors.
A typical circuit is based on a Marx bank, in which a number of capacitorsare charged in parallel and then connected in series by means of semiconduc-tor switches. The advantage of the Marx bank circuit is the fact that the voltage

8.4. Acousto-Optic Q-Switches 295
FIGURE 8.11. Circuit diagram of Pockels cell drive electronics employing avalanche tran-sistors.
requirement of the power supply is only a fraction of the voltage generated atthe crystal. Figure 8.11 illustrates such a design. The capacitors C1 to Cn are allcharged through resistors R1 and Rn to about 1 kV. A string of transistors is con-nected in parallel to each capacitor and associated diode D. The transistors areoperated close to their avalanche breakdown voltage. As soon as one transistoris triggered, all the transistors are switched on, which connects all capacitors inseries and a large negative voltage appears on the Pockels cell. Typically fourto six strings of avalanche transistors are employed to generate voltages in the(2.5–6) kV range starting with 0.8 to 1 kV at the power supply.
8.4 Acousto-Optic Q-Switches
In acousto-optic Q-switches, an ultrasonic wave is launched into a block of trans-parent optical material, usually fused silica. By switching on the acoustic field,a fraction of the energy of the main beam is diffracted out of the resonator, thusintroducing a loss mechanism that prevents laser action. When the acoustic field

296 8. Q-Switching
is switched off, full transmission through the Q-switch cell is restored and a laserpulse is created.
The acousto-optic Q-switch is the device of choice for repetitively Q-switchingcw lasers. The low gain characteristics of cw-pumped solid-state lasers do notrequire very high extinction ratios but do demand an exceptionally low insertionloss. Since high optical-quality fused silica with antireflection coatings can beused as the active medium in the acousto-optical Q-switch, the overall insertionloss of the inactive Q-switch can be reduced to less than 0.5% per pass. The low-insertion loss of the acousto-optic Q-switch offers the convenience of convertingfrom Q-switched to cw operation simply by removing the rf drive power.
An acousto-optic Q-switch is activated by the application of rf power to a trans-ducer that is attached to the transparent medium. The resulting acoustic wavegives rise to a sinusoidal modulation of the density of the medium. The indexto refraction is coupled to these periodic variations of the density and strain viathe photoelastic effect. Considering only the one-dimensional case for an acousticwave traveling in the y-direction, we can write
n(y, t) = n0 +�n0 sin(wst − ks y), (8.27)
where n0 is the average refractive index of the medium, �n0 is the amplitude ofthe index change, and ws = 2πνs and ks = 2π/λs are the angular frequency andthe wave vector of the sound wave which travels with the sound velocity vs = νsλsthrough the medium.
The refractive index change described by (8.27) forms a traveling-wave phasegrating across the width of the optical beam. The grating has a period equal tothe acoustic wave length and an amplitude proportional to the sound amplitude.A portion of the optical beam which passes through the region occupied by theacoustic wave is diffracted by this phase grating. Acousto-optic Q-switches areoperated at ultrasonic frequencies in the tens of megahertz, and the beam interac-tion length is on the order of several centimeters. In this so-called Bragg regime,the grating acts as thick phase grating. The diffracted beam is primarily confinedto a single direction and has a maximum at the Bragg angle. The condition forBragg scattering to occur is lλ � λ2
s , where l is the interaction length and λ andλs are the optical and acoustical wavelengths in the medium, respectively.
In the case of a short interaction length or long acoustical wavelength theacousto-optic cell becomes a thin phase grating and the light beam is diffractedinto many orders. This is the regime of Raman–Nath scattering. Because ofthe higher rf power requirements acousto-optic Q-switches are not used in thisregime.
Figure 8.12 displays the geometry for Bragg reflection. The incident beam ap-pears to be reflected from the acoustic wavefronts as if they were mirrors. Thisphenomenon is called acoustic Bragg reflection in analogy to the selective reflec-tion of X-rays by the lattice of crystals first observed by Bragg. Conservation ofenergy and momentum of the photon–phonon interaction leads to the condition
sin� = λ/2λs, (8.28)

8.4. Acousto-Optic Q-Switches 297
Diffracted beam
Incident beam
Sound Wave
Transducer
noλs
Undeflected beam
λo
θ
FIGURE 8.12. Geometry for Bragg reflection.
where � is the angle of incidence between the optical beam and the acousticwave, and λ = λ0/n0 is the optical wavelength in the diffracting medium. We canderive the Bragg condition (8.28) with the aid of Fig. 8.13 if we assume for themoment that there is no motion of the sound wave. Rays A and B are reflected bytwo successive acoustic wavefronts. The rays differ in pathlength by the distance2s. In order for the rays to be in phase and reinforce we require 2s = λ. FromFig. 8.13 we also obtain the relationship sin� = s/λs. Elimination of s in thesetwo equations yields the Bragg condition. The beam observed at the Bragg anglearrives from reflections at successive acoustic wavefronts. The rays from eachwavefront add in phase and the total intensity is, therefore, N times the intensityof a single reflection.
The difference in direction of the diffracted and incident beam inside themedium is twice the Bragg angle, that is, 2 sin θ or 2θ , since the angle is verysmall. Reflection at the external boundary of the device will increase the angle byn, accordingly we obtain
2�′ = λ0/λs. (8.29)
The external angular separation of the two beams is equal in radians to the ratioof the optical to acoustic wavelengths.
A
B
Sound Wave
ssθ
θ λλs
FIGURE 8.13. Reflection of rays A and B by two successive acoustic wavefronts.
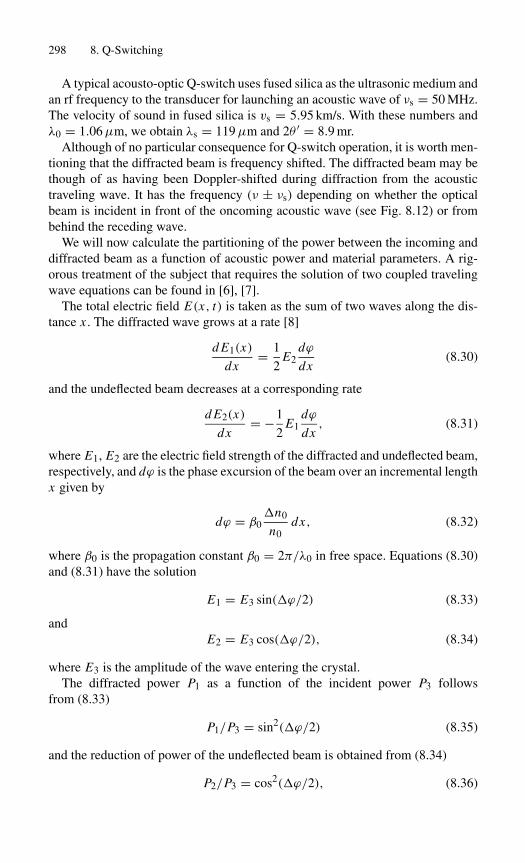
298 8. Q-Switching
A typical acousto-optic Q-switch uses fused silica as the ultrasonic medium andan rf frequency to the transducer for launching an acoustic wave of νs = 50 MHz.The velocity of sound in fused silica is vs = 5.95 km/s. With these numbers andλ0 = 1.06µm, we obtain λs = 119µm and 2θ ′ = 8.9 mr.
Although of no particular consequence for Q-switch operation, it is worth men-tioning that the diffracted beam is frequency shifted. The diffracted beam may bethough of as having been Doppler-shifted during diffraction from the acoustictraveling wave. It has the frequency (ν ± νs) depending on whether the opticalbeam is incident in front of the oncoming acoustic wave (see Fig. 8.12) or frombehind the receding wave.
We will now calculate the partitioning of the power between the incoming anddiffracted beam as a function of acoustic power and material parameters. A rig-orous treatment of the subject that requires the solution of two coupled travelingwave equations can be found in [6], [7].
The total electric field E(x, t) is taken as the sum of two waves along the dis-tance x . The diffracted wave grows at a rate [8]
d E1(x)
dx= 1
2E2
dϕ
dx(8.30)
and the undeflected beam decreases at a corresponding rate
d E2(x)
dx= −1
2E1
dϕ
dx, (8.31)
where E1, E2 are the electric field strength of the diffracted and undeflected beam,respectively, and dϕ is the phase excursion of the beam over an incremental lengthx given by
dϕ = β0�n0
n0dx, (8.32)
where β0 is the propagation constant β0 = 2π/λ0 in free space. Equations (8.30)and (8.31) have the solution
E1 = E3 sin(�ϕ/2) (8.33)
andE2 = E3 cos(�ϕ/2), (8.34)
where E3 is the amplitude of the wave entering the crystal.The diffracted power P1 as a function of the incident power P3 follows
from (8.33)
P1/P3 = sin2(�ϕ/2) (8.35)
and the reduction of power of the undeflected beam is obtained from (8.34)
P2/P3 = cos2(�ϕ/2), (8.36)

8.4. Acousto-Optic Q-Switches 299
where �ϕ is the total phase shift the beam experienced over the interactionlength �,
�ϕ = �β0�n0. (8.37)
The sum of the powers of the undeflected and diffracted beams remains constantP1 + P2 = P3. Now we have to connect a change of�n0 with the acoustic powerPac in the medium.
The change of refractive index as a function of strain s is given by [5]
�n0 = n30 pi j
2s, (8.38)
where pi j is the elasto-optic coefficient in the medium, and the strain s is relatedto the acoustic power Pac by [6]
s =[
2Pac
ρ0v3s �w
]1/2
. (8.39)
In the above equation vs is the velocity of sound in the medium, ρ0 is the massdensity, and � and w are the length and width of the transducer that launches theacoustic wave into the medium. Introducing (8.37)–(8.39) into (8.35) yields
P1
P3= sin2
[π
λ
(�Pac Mac
2w
)1/2]. (8.40)
The quantity Mac is a material constant that determines the inherent efficiency ofdiffraction and is called the figure of merit
Mac = n60 p2
i j/ρ0v3s . (8.41)
It is apparent from (8.40) that the amount of diffracted power depends on thematerial parameters expressed by Mac, the ratio of length to width of the interac-tion path and the acoustical power Pac. In a given material such as, for example,fused silica, the value of the photoelastic coefficient pi j in (8.41) depends on theplane of polarization of the light beam with respect to the ultrasonic propagationdirection and on the type of ultrasonic wave, that is, longitudinal or shear wave.With shear wave generation the particle motion is transverse to the direction ofthe acoustic wave propagation direction. In this case the dynamic optical loss isindependent of polarization in isotropic materials such as fused quartz.
Table 8.1 lists the pertinent material parameters for an acousto-optic Q-switchfabricated from fused silica. The p coefficients and velocity of sound in fusedsilica are from [10]. The figure of merit Mac follows from (8.41) with n0 = 1.45 at1.06µm and ρ0 = 2.2 g/cm3. The acoustic power requirement for 1% diffractionhas been calculated from (8.40) for l/w = 10 and λ = 1.06µm. The dimensionof Pac in (8.40) is erg/s (1 erg/s = 10−7 W.)

300 8. Q-Switching
TABLE 8.1. Material parameters of acousto-optic Q-switches employing fused silica.
Polarization ofoptical beam Velocity Figure of Acoustical powerwith respect of sound merit Mac Pac [W] forto acoustic ×105 ×10−18 1% diffraction
Acoustic wave p coefficient wave vector [cm/s] [s3/g] (l/w = 10)
Shear wave p44 = 0.075 Independent 3.76 0.45 0.51Longitudinal p11 = 0.121 Parallel 5.95 0.30 0.77Longitudinal p12 = 0.270 Perpendicular 5.95 1.46 0.16
8.4.1 Device Characteristics
Figure 8.14 shows an optical schematic of a cw-pumped laser that contains anacousto-optic Q-switch: The Q-switch consists of a fused silica block to which acrystalline quartz or an LiNbO3 transducer is bonded. Both the transducer and thefused silica interface contain vacuum-deposited electrodes to allow for electricalconnections. An inductive impedance-matching network couples the signal of therf generator to the quartz transducer. The ultrasonic wave is launched into the Q-switch block by the piezoelectric transducer that converts electrical energy intoultrasonic energy. The laser is returned to the high Q-state by switching off thedriving voltage to the transducer. With no ultrasonic wave propagating throughit, the fused silica block returns to its usual state of high optical transmissionand a Q-switch pulse is emitted. The width of the transducer is typically 3 mm,which is about twice the beam diameter for most TEM00-mode Nd : YAG lasers.The length of the Bragg cell and the transducer is around 50 mm. From (8.40) itfollows that a large length-to-width ratio reduces the acoustic power requirementfor a given diffraction ratio P1/P3.
FIGURE 8.14. Acousto-optic Q-switch employed in a cw-pumped Nd : YAG laser.

8.4. Acousto-Optic Q-Switches 301
Virtually all acousto-optic Q-switches are single-pass devices; i.e., the acousticwave generated by the transducer is absorbed after traveling across the interactionregion. The absorber, consisting of a piece of lead attached to the tapered endof the quartz block, prevents reflected acoustical waves from interfering with theincident light beam.
Although the figure of merit Mac of fused quartz is quite low, its optical high-quality, low optical absorption, and high damage threshold make it superior toother, more efficient acousto-optic materials, such as lithium niobate (LiNbO3),lead molybdate (PbMoO4), tellurium dioxide (TeO2), and dense flint glass. Thesematerials are usually employed in low-power light modulators and optical scan-ners.
By properly choosing the parameters of the acousto-optic device, a largeenough fraction of the laser beam can be deflected out of the resonator to providean energy loss that inhibits laser action. The frequency of the rf generator de-termines the diffraction angle according to (8.29), whereas the magnitude of thediffracted power is controlled by the rf power according to (8.40). The frequencyof the rf signal driving the transducer is typically in the 40 to 50 MHz range. Forthese frequencies we obtain, with the values from Table 8.1 for both shear waveand longitudinal wave Q-switches, scattering angles in fused quartz between 14.1and 7.1 mr. These angles are large enough to deflect the diffracted beam out ofthe resonator.
The amount of acoustical power required to achieve a certain diffraction effi-ciency can be calculated from (8.40). Unpolarized lasers are usually Q-switchedwith shear-wave devices, whereas for polarized laser radiation longitudinal mod-ulators are employed. A longitudinal Q-switch in which the large p12 coefficientis utilized requires substantially lower rf powers compared to a shear wave de-vice.
For the practical case of a shear wave Bragg cell having a length of � = 50 mmand a width of w = 3 mm, we find from (8.40) that in order to deflect 35%of the laser beam out of the resonator an acoustic power of 11.7 W is required.Since the Q-switch diffracts radiation in both directions the total insertion lossper round trip is δ = (P1/P3)(2 − P1/P3), where (P1/P3) is the fraction ofradiation diffracted out of the resonator in one pass. For the example above oneobtains a round trip insertion loss of 58%, which is large enough to prevent laseraction in most cw lasers. The conversion efficiency of rf power delivered to thetransducer to acoustic power is on the order of 25 to 30%; therefore, at least 40 Wof rf power have to be delivered to the transducer. If the laser output is polarizeda Bragg cell with a longitudinal wave can be utilized, in this case only 12 W of rfpower is required to achieve the same insertion loss.
The Q-switch must be able to switch from the high-loss to the low-loss statein less than the time required for the laser pulse to build up if maximum outputenergy is to be achieved. The turn-off time of an acousto-optical Q-switch is deter-mined by the transit time of the sound wave across the beam diameter. Dependingon the type of interaction, the transit time of the acoustic wave across a 1-mmdiameter beam is between 266 and 168 ns. The relatively slow transit-time is not
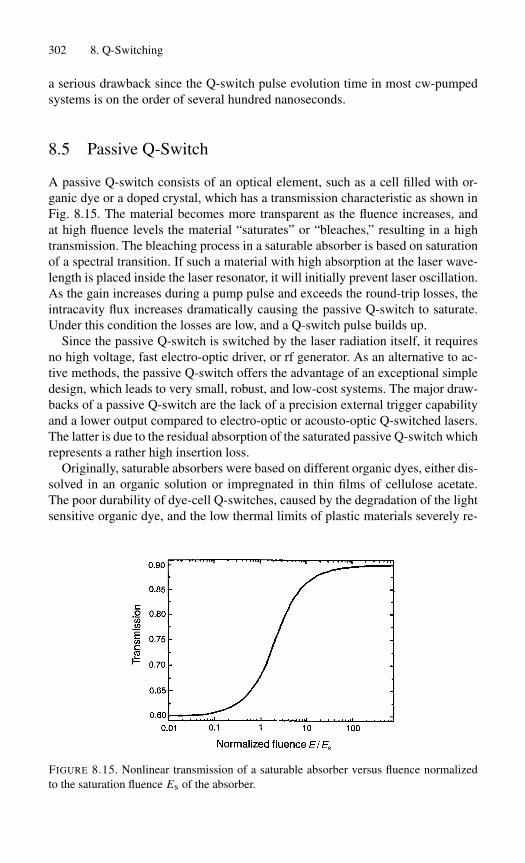
302 8. Q-Switching
a serious drawback since the Q-switch pulse evolution time in most cw-pumpedsystems is on the order of several hundred nanoseconds.
8.5 Passive Q-Switch
A passive Q-switch consists of an optical element, such as a cell filled with or-ganic dye or a doped crystal, which has a transmission characteristic as shown inFig. 8.15. The material becomes more transparent as the fluence increases, andat high fluence levels the material “saturates” or “bleaches,” resulting in a hightransmission. The bleaching process in a saturable absorber is based on saturationof a spectral transition. If such a material with high absorption at the laser wave-length is placed inside the laser resonator, it will initially prevent laser oscillation.As the gain increases during a pump pulse and exceeds the round-trip losses, theintracavity flux increases dramatically causing the passive Q-switch to saturate.Under this condition the losses are low, and a Q-switch pulse builds up.
Since the passive Q-switch is switched by the laser radiation itself, it requiresno high voltage, fast electro-optic driver, or rf generator. As an alternative to ac-tive methods, the passive Q-switch offers the advantage of an exceptional simpledesign, which leads to very small, robust, and low-cost systems. The major draw-backs of a passive Q-switch are the lack of a precision external trigger capabilityand a lower output compared to electro-optic or acousto-optic Q-switched lasers.The latter is due to the residual absorption of the saturated passive Q-switch whichrepresents a rather high insertion loss.
Originally, saturable absorbers were based on different organic dyes, either dis-solved in an organic solution or impregnated in thin films of cellulose acetate.The poor durability of dye-cell Q-switches, caused by the degradation of the lightsensitive organic dye, and the low thermal limits of plastic materials severely re-
FIGURE 8.15. Nonlinear transmission of a saturable absorber versus fluence normalizedto the saturation fluence Es of the absorber.
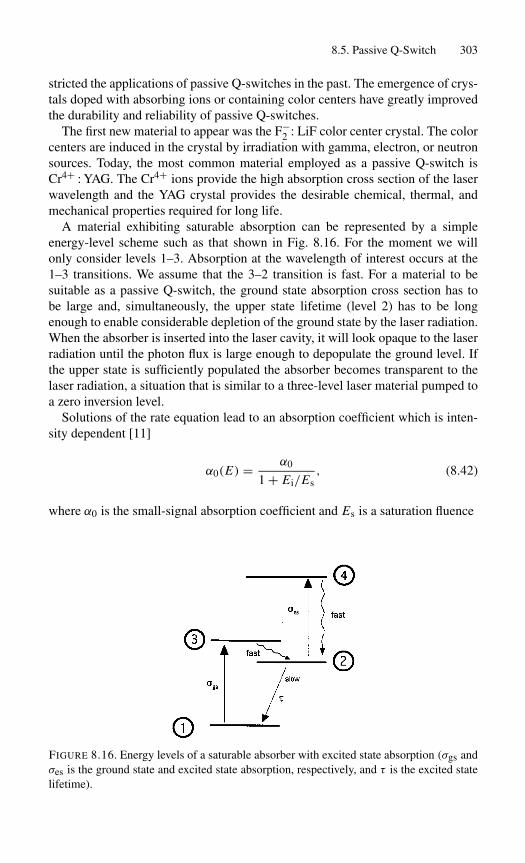
8.5. Passive Q-Switch 303
stricted the applications of passive Q-switches in the past. The emergence of crys-tals doped with absorbing ions or containing color centers have greatly improvedthe durability and reliability of passive Q-switches.
The first new material to appear was the F−2 : LiF color center crystal. The color
centers are induced in the crystal by irradiation with gamma, electron, or neutronsources. Today, the most common material employed as a passive Q-switch isCr4+ : YAG. The Cr4+ ions provide the high absorption cross section of the laserwavelength and the YAG crystal provides the desirable chemical, thermal, andmechanical properties required for long life.
A material exhibiting saturable absorption can be represented by a simpleenergy-level scheme such as that shown in Fig. 8.16. For the moment we willonly consider levels 1–3. Absorption at the wavelength of interest occurs at the1–3 transitions. We assume that the 3–2 transition is fast. For a material to besuitable as a passive Q-switch, the ground state absorption cross section has tobe large and, simultaneously, the upper state lifetime (level 2) has to be longenough to enable considerable depletion of the ground state by the laser radiation.When the absorber is inserted into the laser cavity, it will look opaque to the laserradiation until the photon flux is large enough to depopulate the ground level. Ifthe upper state is sufficiently populated the absorber becomes transparent to thelaser radiation, a situation that is similar to a three-level laser material pumped toa zero inversion level.
Solutions of the rate equation lead to an absorption coefficient which is inten-sity dependent [11]
α0(E) = α0
1 + Ei/Es, (8.42)
where α0 is the small-signal absorption coefficient and Es is a saturation fluence
FIGURE 8.16. Energy levels of a saturable absorber with excited state absorption (σgs andσes is the ground state and excited state absorption, respectively, and τ is the excited statelifetime).

304 8. Q-Switching
Es = hν/σgs, (8.43)
where σgs is the absorption cross section for the 1–3 transition.Important characteristics of a saturable absorber are the initial transmission T0,
the fluence Es at which saturation becomes appreciable, and the residual absorp-tion which results in a Tmax of the fully bleached absorber.
The small signal transmission of the absorber is
T0 = exp(−α0�s) = exp(−ngσgs�s), (8.44)
where �s is the thickness of the bleachable crystal and ng is the ground statedensity. In order to calculate the transmission as a function of fluence, the photonflux and population density must be considered as a function of position withinthe absorbing medium.
Identical to the situation which occurs in pulse amplifiers (Section 4.1), differ-ential equations for the population density and photon flux have to be solved. Thesolution is the Frantz–Nodvik equation, which is identical to (4.11) except thatgain G,G0 is replaced by transmission Ti, T0. Therefore the energy transmissionTi of an ideal saturable absorber as a function of input fluence Ei is given by
Ti = Es
Eiln[1 + (eEi/Es − 1)T0] (8.45)
Equation (8.45) reduces to Ti = T0 for Ei < Es and Ti = 1 for Ei > Es.In practical saturable absorbers, the transmission never reaches 100%. The
reason for that is photon absorption by the excited atoms. A passive Q-switchrequires a material which exhibits saturation of the ground state absorption. How-ever, most materials also exhibit absorption from an excited state. This is illus-trated in Fig. 8.16 by the transition from the excited state (level 2) to some higherlevel 4 which has an energy level corresponding to the laser transition. As theground state is depleted, absorption takes place increasingly between levels 2and 4. Excited State Absorption (ESA) results in a residual loss in the resonatorwhen the ground state absorption has been saturated. The 2–4 transition does notsaturate because of the fast relaxation of level 4. A saturable absorber is useful forQ-switching only as long as σgs > σes, where σes is the cross section for excitedstate absorption.
A saturable absorber with ESA can be described by a four-level model [11],[12]. In this case, maximum transmission Tmax is given by
Tmax = exp(−ngσes�s). (8.46)
In [12] an approximation in closed form that gives the shape of the transmissionversus fluence curve in the presence of ESA, has been derived. For a nonidealabsorber the transmission Tn can be approximated by
Tn = T0 + Ti − T0
1 − T0(Tmax − T0), (8.47)
Summary 305
where Ti is the transmission of an ideal absorber given by (8.45) and T0 and Tmaxare the lower and upper limits of the transmission.
In Fig. 8.15, Tn is plotted for the case of T0 = 60% and Tmax = 90%. Fora given saturable absorber one needs to know the cross sections σgs and σes, theground state concentration n0, and the thickness ls of the material. With thesequantities known one can calculate T0, Tmax, and Es and plot a transmission versusenergy density curve as determined by (8.47).
Because of the importance of Cr4+ : YAG as a passive Q-switch material, wewill briefly review the properties of this material. In order to produce Cr4+ : YAG,a small fraction of chromium ions in YAG are induced to change valence fromthe normal Cr3+ to Cr4+ with the addition of charge compensating impuritiessuch as Mg2+ or Ca2+. The crystal Cr4+ : YAG has broad absorption bands cen-tered at 410, 480, 640, and 1050 nm. Published values for the cross section ofthe ground state vary greatly [12], [13]. The most recent measurements indi-cate σgs = 7 × 10⁻¹⁸ cm2 and σes = 2 × 10⁻¹⁸ cm2 for the excited-state ab-sorption at the Nd : YAG wavelength [12]. The excited state lifetime (level 2 inFig. 8.16) is 4.1µs and the lifetime of the higher excited state (level 4) is 0.5 ns.With hν = 1.87 × 10⁻¹⁹ J at 1.06µm and the above value for σgs one obtains asaturation fluence of Es = 27 mJ/cm2 for Cr4+ : YAG.
Commercially available Cr4+ : YAG passive Q-switches are specified by thelow power transmission at the laser wavelength. Typical transmission values rangefrom 30 to 50%, and the crystal thickness is usually between 1–5 mm. Values ofthe small signal absorption coefficient α0 vary from 3–6 cm−1. For example, forα0 = 4 cm−1 and �s = 2 mm the low power transmission is T0 = 45%.
For a given pump power, that is, gain in the laser medium, there is an optimalchoice of output coupler reflectivity and unsaturated absorber transmission. De-sign procedures which permit optimization of passively Q-switched lasers havebeen reported in [14], [15].
Summary
When the lifetime of the upper laser level is much longer than the desired pulselength of the laser output pulse, the laser medium can act as an energy storagemedium. In this situation the upper laser level is able to integrate the power sup-plied by the pump source. The stored energy can be released in a short outputpulse using the method of Q-switching. This chapter describes the theory andtechniques of Q-switching solid-state lasers. Q-switching is a method to generatepulses in the nanosecond regime from a solid-state laser.
In analogy to electrical terminology the losses in an optical resonator can becharacterized by a Q-factor that is defined as the ratio of energy stored in theresonator to the energy loss per cycle. The higher the quality factor Q, the lowerthe losses. In the Q-switch mode the loss of the optical resonator is made so largethat a photon flux cannot build up and stimulated emission cannot occur. Duringthis time the Q of the resonator is kept low, although the energy stored in the laser
306 8. Q-Switching
material is high. After there is considerable energy stored in the laser material,the loss in the resonator is suddenly removed, that is, the Q-factor is increased.This results in a sudden increase of photon flux and the energy stored in the gainmedium is converted to optical radiation and a short powerful pulse is emitted.
A number of different methods have been devised to introduce a controllabledynamic loss into the resonator. A simple technique of Q-switching consists ofthe rotation of one of the resonator mirrors by a high-speed motor. In an acoustic-optic Q-switch a fraction of the optical beam is diffracted out of the resonator asa result of the modulation of the refractive index by an acoustic wave launchedinto a transparent solid. In a passive Q-switch the absorption of laser radiationis dependent on the intensity. The active element, either a liquid or a crystal, be-comes more transparent as the fluence increases, and at very high fluence levelsthe material saturates and becomes transparent. In an electro-optic Q-switch, ahigh voltage applied to a suitable crystal rotates the plane of polarization. In con-junction with a polarizer in the resonator the device represents an electro-opticalshutter.
References[1] W.G. Wagner and B.A. Lengyel: J. Appl. Phys. 34, 2040 (1963).[2] J.J. Degnan: IEEE J. Quantum Electron. QE-25, 214 (1989).[3] G.D. Baldwin: IEEE J. Quantum Electron. QE-7, 220 (1971).[4] R.B. Chesler, M.A. Karr, and J.E. Geusic: Proc. IEEE 58, 1899 (1970).[5] M. Born and E. Wolf: Principles of Optics, 2nd ed. (Macmillan, New York), 1964.[6] C.F. Quate, C.D. Wilkinson, and D.K. Winslow: Proc. IEEE 53, 1604 (1965).[7] N. Uchida and N. Niizeki: Proc. IEEE 61, 1073 (1973).
[8] R. Adler: IEEE Spectrum 4, 42 (1967).[9] R.W. Dixon: IEEE J. Quantum Electron. QE-3, 85 (1967).
[10] R.W. Dixon: J. Appl. Phys. 38, 5149 (1967).[11] M. Hercher: Appl. Opt 6, 947 (1967).[12] Z. Burshtein, P. Blau, Y. Kalisky, Y. Shimony, and M.R. Kokta: IEEE J. Quantum
Electron. QE-34, 292 (1998).[13] Y. Shimony, Z. Burshtein, and Y. Kalisky: IEEE J. Quantum Electron. QE-31, 1738
(1995).[14] G. Xiao and M. Bass: IEEE J. Quantum Electron. QE-33, 41 (1997) and QE-34,
1142 (1998).[15] J.J. Degnan: IEEE J. Quantum Electron. QE-31, 1890 (1995).
Exercises
1. Explain why it is unwise to place the Q-switch in a Q-switched laser betweenthe gain medium and the output mirror of the resonator.
2. An early mechanical Q-switch was a flat mirror rotated by a high-speed motorspinning with its axis perpendicular to the resonator axis. This is still used

Exercises 307
today for infrared lasers where there are no acceptable electro-optic materialsor polarizers to allow one to use electro-optic Q-switching. If the motor speedwas 24,000 rpm and the necessary misalignment for hold-off were 1 mrad,how long would the rotating mirror require to switch from hold-off to lasingalignment? What would be the effects of using a 45–90–45◦ prism rotatingso that its roof top or 90◦ ridge were parallel to the axis of the motor rotation?Would it be better to orient the roof top ridge to be perpendicular to the rotationaxis of the prism? Explain your answers. Draw sketches to help both yourselfand the reader of your solution to understand your reasoning.
3. Consider an ideal (that means lossless and very fast) Q-switch in a laser res-onator where all the components have been designed or selected to have prop-erties that are independent of temperature. On the other hand, there is nothingyou can do about the temperature dependence of the stimulated emission crosssection of the lasing medium, σ . Assume that you always pump this laser tothe exact same initial inversion and find the temperature dependence of the out-put energy of the laser. If σ decreases with increasing temperature, as it doesin Nd : YAG, what would you expect the output energy to do as temperatureincreases? What problems might this cause?

9
Mode-Locking
9.1 Pulse Formation9.2 Passive Mode-Locking9.3 Active Mode-Locking9.4 Picosecond Lasers9.5 Femtosecond Lasers
ReferencesExercises
As we have seen in the previous chapter, the minimum pulse width obtainablefrom a Q-switched laser is on the order of 10 ns because of the required pulsebuildup time. With the cavity dumping technique, the pulse width can be reducedto a minimum of 1 to 2 ns. The limitation here is the length of the cavity, whichdetermines the pulse length. Ultrashort pulses with pulse widths in the picosecondor femtosecond regime are obtained from solid-state lasers by mode-locking.Employing this technique, which phase-locks the longitudinal modes of the laser,the pulse width is inversely related to the bandwidth of the laser emission.
The output from laser oscillators is subject to strong fluctuations that originatefrom the interference of longitudinal resonator modes with random phase rela-tions. These random fluctuations can be transformed into a powerful well-definedsingle pulse circulating in the laser resonator by the introduction of a suitable non-linearity, or by an externally driven optical modulator. In the first case, the laser isreferred to as passively mode-locked because the radiation itself, in combinationwith the passive nonlinear element, generates a periodic modulation that leads toa fixed phase relationship of the axial modes. In the second case, we speak ofactive mode-locking because an rf signal applied to a modulator provides a phaseor frequency modulation, which leads to mode-locking.
9.1 Pulse Formation
In a free-running laser, both longitudinal and transverse modes oscillate simul-taneously without fixed mode-to-mode amplitude and phase relationships. Theresulting laser output is a time-averaged statistical mean value. Restricting oscil-
308
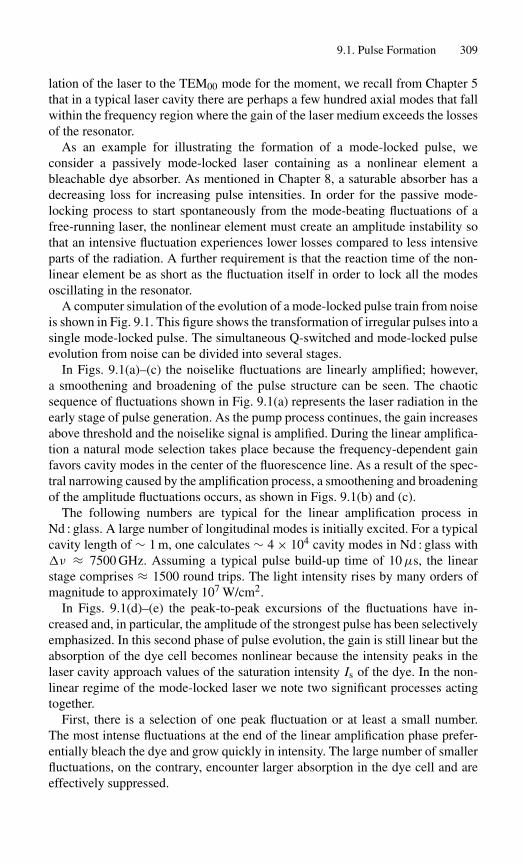
9.1. Pulse Formation 309
lation of the laser to the TEM00 mode for the moment, we recall from Chapter 5that in a typical laser cavity there are perhaps a few hundred axial modes that fallwithin the frequency region where the gain of the laser medium exceeds the lossesof the resonator.
As an example for illustrating the formation of a mode-locked pulse, weconsider a passively mode-locked laser containing as a nonlinear element ableachable dye absorber. As mentioned in Chapter 8, a saturable absorber has adecreasing loss for increasing pulse intensities. In order for the passive mode-locking process to start spontaneously from the mode-beating fluctuations of afree-running laser, the nonlinear element must create an amplitude instability sothat an intensive fluctuation experiences lower losses compared to less intensiveparts of the radiation. A further requirement is that the reaction time of the non-linear element be as short as the fluctuation itself in order to lock all the modesoscillating in the resonator.
A computer simulation of the evolution of a mode-locked pulse train from noiseis shown in Fig. 9.1. This figure shows the transformation of irregular pulses into asingle mode-locked pulse. The simultaneous Q-switched and mode-locked pulseevolution from noise can be divided into several stages.
In Figs. 9.1(a)–(c) the noiselike fluctuations are linearly amplified; however,a smoothening and broadening of the pulse structure can be seen. The chaoticsequence of fluctuations shown in Fig. 9.1(a) represents the laser radiation in theearly stage of pulse generation. As the pump process continues, the gain increasesabove threshold and the noiselike signal is amplified. During the linear amplifica-tion a natural mode selection takes place because the frequency-dependent gainfavors cavity modes in the center of the fluorescence line. As a result of the spec-tral narrowing caused by the amplification process, a smoothening and broadeningof the amplitude fluctuations occurs, as shown in Figs. 9.1(b) and (c).
The following numbers are typical for the linear amplification process inNd : glass. A large number of longitudinal modes is initially excited. For a typicalcavity length of ∼ 1 m, one calculates ∼ 4 × 10⁴ cavity modes in Nd : glass with�ν ≈ 7500 GHz. Assuming a typical pulse build-up time of 10µs, the linearstage comprises ≈ 1500 round trips. The light intensity rises by many orders ofmagnitude to approximately 107 W/cm2.
In Figs. 9.1(d)–(e) the peak-to-peak excursions of the fluctuations have in-creased and, in particular, the amplitude of the strongest pulse has been selectivelyemphasized. In this second phase of pulse evolution, the gain is still linear but theabsorption of the dye cell becomes nonlinear because the intensity peaks in thelaser cavity approach values of the saturation intensity Is of the dye. In the non-linear regime of the mode-locked laser we note two significant processes actingtogether.
First, there is a selection of one peak fluctuation or at least a small number.The most intense fluctuations at the end of the linear amplification phase prefer-entially bleach the dye and grow quickly in intensity. The large number of smallerfluctuations, on the contrary, encounter larger absorption in the dye cell and areeffectively suppressed.
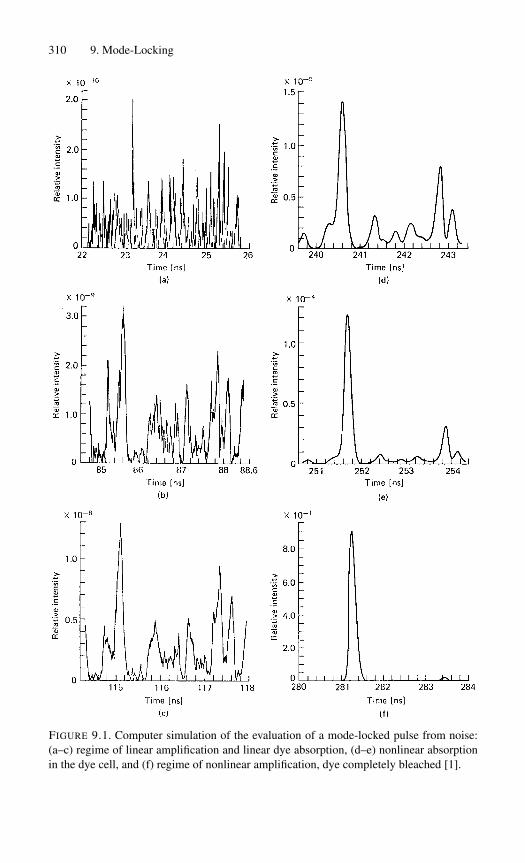
310 9. Mode-Locking
FIGURE 9.1. Computer simulation of the evaluation of a mode-locked pulse from noise:(a–c) regime of linear amplification and linear dye absorption, (d–e) nonlinear absorptionin the dye cell, and (f) regime of nonlinear amplification, dye completely bleached [1].

9.1. Pulse Formation 311
The second effect is a narrowing of the existing pulses in time, which broadensthe frequency spectrum. The shapes of the pulses are affected by the nonlinearityof the dye because the wings of the pulse are more strongly absorbed than thepeak. The second phase ends when the absorbing transition in the dye cell iscompletely saturated. Under favorable conditions the final transmission is closeto one; that is, the dye is transparent.
In Fig. 9.1(f) the background pulses have been completely suppressed. The fi-nal phase of the pulse evolution occurs when the intensity is sufficiently high forcomplete saturation of the absorber transition to take place and for the amplifica-tion to be nonlinear. This is the regime of high-peak power. During the nonlinearstage the pulse intensity quickly rises within ≈ 50 cavity round trips to a value ofseveral gigawatts per square centimeter. Successive passages of the high-intensityradiation pulse through the resonator result in a pulse train appearing at the laseroutput. Finally, the population inversion is depleted and the pulse decays.
In Fig. 9.2 the spectral and temporal structure of the radiation inside a lasercavity are shown for a non-mode-locked laser. In the frequency domain, the radi-ation consists of a large number of discrete spectral lines spaced by the axial mode
FIGURE 9.2. Signal of a non-mode-locked laser. (a) In the frequency domain the intensitiesi(ν) of the modes have a Rayleigh distribution about the Gaussian mean and the phases arerandomly distributed. (b) In the time domain the intensity has the characteristic of thermalnoise.
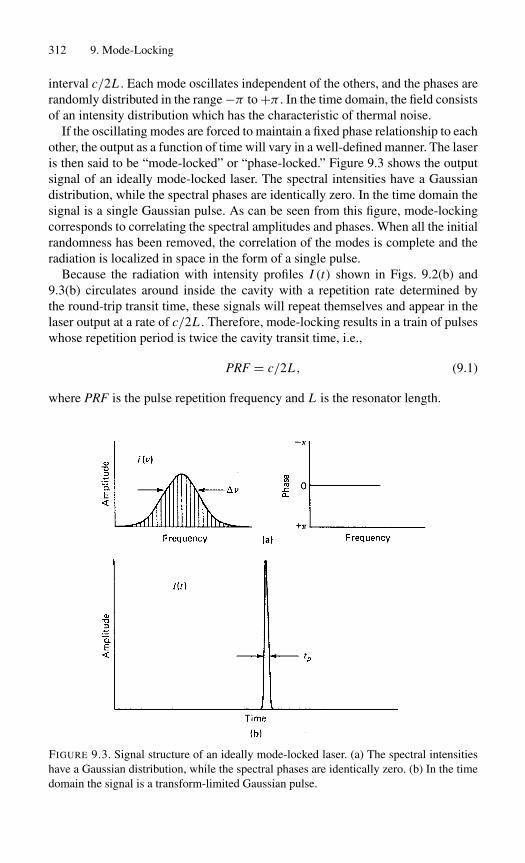
312 9. Mode-Locking
interval c/2L . Each mode oscillates independent of the others, and the phases arerandomly distributed in the range −π to +π . In the time domain, the field consistsof an intensity distribution which has the characteristic of thermal noise.
If the oscillating modes are forced to maintain a fixed phase relationship to eachother, the output as a function of time will vary in a well-defined manner. The laseris then said to be “mode-locked” or “phase-locked.” Figure 9.3 shows the outputsignal of an ideally mode-locked laser. The spectral intensities have a Gaussiandistribution, while the spectral phases are identically zero. In the time domain thesignal is a single Gaussian pulse. As can be seen from this figure, mode-lockingcorresponds to correlating the spectral amplitudes and phases. When all the initialrandomness has been removed, the correlation of the modes is complete and theradiation is localized in space in the form of a single pulse.
Because the radiation with intensity profiles I (t) shown in Figs. 9.2(b) and9.3(b) circulates around inside the cavity with a repetition rate determined bythe round-trip transit time, these signals will repeat themselves and appear in thelaser output at a rate of c/2L . Therefore, mode-locking results in a train of pulseswhose repetition period is twice the cavity transit time, i.e.,
PRF = c/2L , (9.1)
where PRF is the pulse repetition frequency and L is the resonator length.
FIGURE 9.3. Signal structure of an ideally mode-locked laser. (a) The spectral intensitieshave a Gaussian distribution, while the spectral phases are identically zero. (b) In the timedomain the signal is a transform-limited Gaussian pulse.
9.1. Pulse Formation 313
If we make some simplifying assumptions, we can obtain a general idea aboutthe pulse width and peak power of the mode-locked output pulses. The structureof an optical pulse is completely defined by a phase and an intensity. Whetherthese refer to time or to frequency is immaterial since, if the description in onedomain is complete, the profiles in the other are obtained from the Fourier trans-form. However, there is no one-to-one correspondence between the two intensityprofiles I (t) and i(ν) since each depends not only on the other but also on theassociated phase function. The only general relationship between the two is
�νtp ≥ ψ, (9.2)
where tp and �ν are the full width half-maximum of I (t) and i(ν), respectively,andψ is a constant of the order of unity. In particular, the shortest pulse obtainablefor a given spectral bandwidth is said to be transform-limited; its duration is
tp = ψ
�ν. (9.3)
For mode-locking purposes �ν corresponds to the gain bandwidth �νL of thelaser. The number of axial modes that are contained within the oscillating band-width is N = �νLtr, where tr = 2L/c is the round-trip time in the optical res-onator. The width of the individual mode-locked pulses is therefore
tp ≈ 1
�νL≈ tr
N. (9.4)
Equation (9.4) expresses the well-known result from Fourier’s theorem that thenarrower the pulse width tp, the larger the bandwidth required to generate thepulse. From (9.4) also follows the interesting fact that the pulse width of the mode-locked pulses roughly equals the cavity round-trip time divided by the number ofphase-locked modes.
For simplicity, the spectral intensity in Fig. 9.3(a) was chosen to be a Gaussianfunction and hence the temporal profile has also a Gaussian distribution. The mostgeneral Gaussian optical pulse is given by
E(t) =(
E0
2
)exp(−αt2) exp[ j (ωpt + βt2)]. (9.5)
The term α determines the Gaussian envelope of the pulse, and the term jβt is alinear frequency shift during the pulse (chirp). From (9.5) follows, for the pulsewidth at the half-intensity points,
tp =(
2 ln 2
α
)1/2
, (9.6)
and a bandwidth again taken at the half-power points of the pulse spectrum [2]

314 9. Mode-Locking
�νp = 1
π
[2 ln 2
(α2 + β2
α
)]1/2
. (9.7)
Note how the frequency chirp contributes to the total bandwidth. The pulsewidth–bandwidth product is a parameter often used to characterize pulses. For Gaussianpulses, the pulsewidth-bandwidth product is given by
tp�νp =(
2 ln 2
π
)[1 +
(β
α
)2]1/2
. (9.8)
For the important special case β = 0 (i.e., no frequency chirp), one obtains ψ =tp�νp ≈ 0.441.
Before leaving this subject, we have to mention one other important pulseshape, namely the hyperbolic secant function. The steady-state solution of the dif-ferential equation describing the pulse envelope I (t) of a cw mode-locked pulseis a function of the form [3]:
I (t) = IO sech2(t/tp). (9.9)
The FWHM pulsewidth of a sech2 pulse is t ′p where t ′p = 1.76tp, and a transform-
limited sech2 pulse has a pulsewidth-bandwidth product of
t ′p�ν = 0.315. (9.10)
Mode-locked lasers can have high peak powers because the power contained inthe entire output of the uncoupled laser is now contained within the more intenseultrafast pulses. From (9.4) follows, for the ratio of pulse-on-to-pulse-off time,that is, the duty cycle, a value of tp/tR = 1/N , so that the peak power of thepulse is N times the average power resulting from incoherent phasing of the axialmodes
Pp = N Pav. (9.11)
Typical output-pulse formats from pulsed and cw mode-locked lasers are il-lustrated in Fig. 9.4. The output of a flashlamp-pumped, mode-locked, solid-statelaser consists of a burst of pulses with amplitudes that fit underneath the enve-lope of a Q-switched pulse. A cw mode-locked laser produces a train of pulseswith equal amplitude. In both cases are consecutive pulses separated by the cavityround-trip time.
A modern diode end-pumped Nd : YAG laser, cw mode-locked with an acousto-optic modulator, produces pulses of about 20 ps in duration and has an averageoutput power of about 200 mW. If we assume a resonator length of L = 1.2 m weobtain, from (9.1), a PRF of 125 MHz or a pulse separation of 8 ns. The pulsewidthof 20 ps in combination with (9.4) indicates that about 400 longitudinal modes arephase-locked together (N = 400). From (9.11) follows a peak power of 80 W.

9.2. Passive Mode-Locking 315
FIGURE 9.4. Output pulses from (a) a cw mode-locked and (b) a pulsed mode-locked laser.
The homogeneously broadened line in Nd : YAG is�ν = 120 GHz. Therefore,the ultimate limit in short-pulse generation in Nd : YAG is, according to (9.10),about two picoseconds. Passively cw mode-locked Nd : YAG have approachedthis limit. The modulation index one can achieve in active mode-locking is notlarge enough to support phase-locking over a very large bandwidth. Therefore,actively mode-locked lasers emit longer pulses compared to cw passively mode-locked systems.
The generation of mode-locked pulses from a laser requires that the longitudi-nal modes be coupled together. This is achieved experimentally by placing insidethe laser cavity either an externally driven loss or phase modulator, or a passivedevice which exhibits saturable absorption. Details of the generation of mode-locked pulses with active and passive devices will be discussed in the followingsections. Tutorial discussions of the work on mode-locked lasers with extensivereferences can be found in [4], [5].
9.2 Passive Mode-Locking
Originally the nonlinear absorption of saturable absorbers was employed for si-multaneously Q-switching and mode-locking solid-state lasers. The saturable ab-sorbers consisted of organic dyes that absorb at the laser wavelength. At sufficient
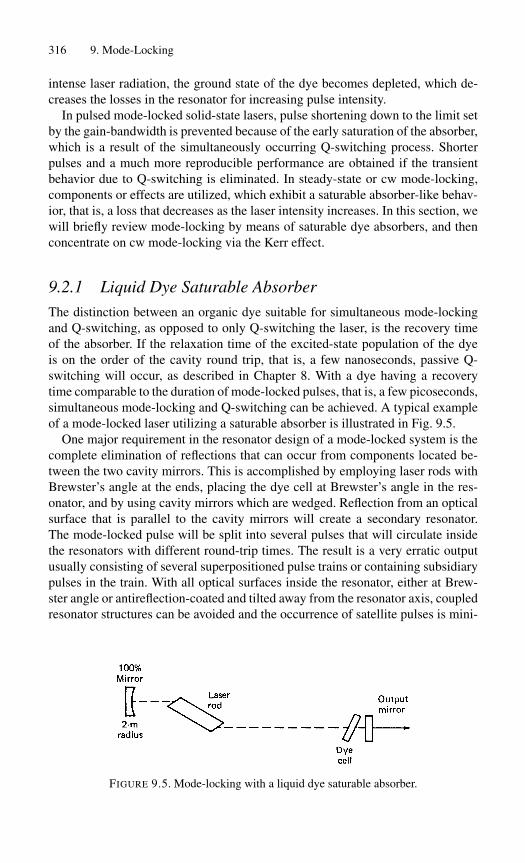
316 9. Mode-Locking
intense laser radiation, the ground state of the dye becomes depleted, which de-creases the losses in the resonator for increasing pulse intensity.
In pulsed mode-locked solid-state lasers, pulse shortening down to the limit setby the gain-bandwidth is prevented because of the early saturation of the absorber,which is a result of the simultaneously occurring Q-switching process. Shorterpulses and a much more reproducible performance are obtained if the transientbehavior due to Q-switching is eliminated. In steady-state or cw mode-locking,components or effects are utilized, which exhibit a saturable absorber-like behav-ior, that is, a loss that decreases as the laser intensity increases. In this section, wewill briefly review mode-locking by means of saturable dye absorbers, and thenconcentrate on cw mode-locking via the Kerr effect.
9.2.1 Liquid Dye Saturable Absorber
The distinction between an organic dye suitable for simultaneous mode-lockingand Q-switching, as opposed to only Q-switching the laser, is the recovery timeof the absorber. If the relaxation time of the excited-state population of the dyeis on the order of the cavity round trip, that is, a few nanoseconds, passive Q-switching will occur, as described in Chapter 8. With a dye having a recoverytime comparable to the duration of mode-locked pulses, that is, a few picoseconds,simultaneous mode-locking and Q-switching can be achieved. A typical exampleof a mode-locked laser utilizing a saturable absorber is illustrated in Fig. 9.5.
One major requirement in the resonator design of a mode-locked system is thecomplete elimination of reflections that can occur from components located be-tween the two cavity mirrors. This is accomplished by employing laser rods withBrewster’s angle at the ends, placing the dye cell at Brewster’s angle in the res-onator, and by using cavity mirrors which are wedged. Reflection from an opticalsurface that is parallel to the cavity mirrors will create a secondary resonator.The mode-locked pulse will be split into several pulses that will circulate insidethe resonators with different round-trip times. The result is a very erratic outputusually consisting of several superpositioned pulse trains or containing subsidiarypulses in the train. With all optical surfaces inside the resonator, either at Brew-ster angle or antireflection-coated and tilted away from the resonator axis, coupledresonator structures can be avoided and the occurrence of satellite pulses is mini-
FIGURE 9.5. Mode-locking with a liquid dye saturable absorber.
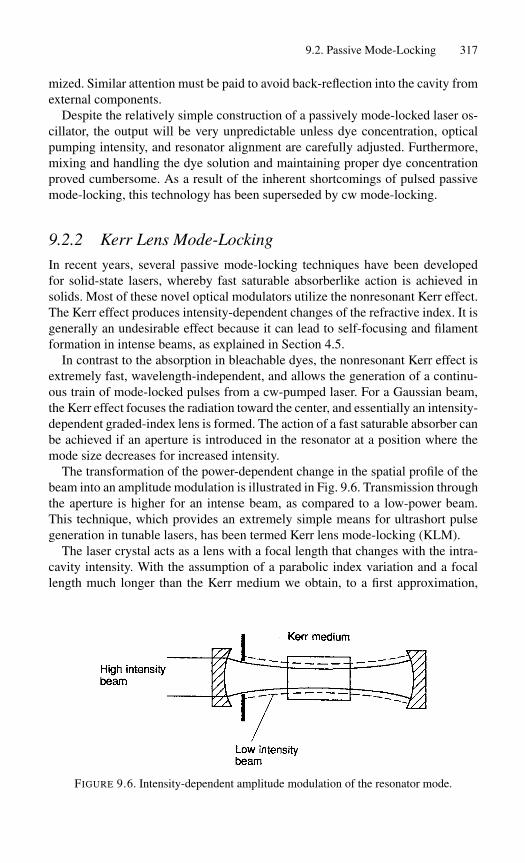
9.2. Passive Mode-Locking 317
mized. Similar attention must be paid to avoid back-reflection into the cavity fromexternal components.
Despite the relatively simple construction of a passively mode-locked laser os-cillator, the output will be very unpredictable unless dye concentration, opticalpumping intensity, and resonator alignment are carefully adjusted. Furthermore,mixing and handling the dye solution and maintaining proper dye concentrationproved cumbersome. As a result of the inherent shortcomings of pulsed passivemode-locking, this technology has been superseded by cw mode-locking.
9.2.2 Kerr Lens Mode-Locking
In recent years, several passive mode-locking techniques have been developedfor solid-state lasers, whereby fast saturable absorberlike action is achieved insolids. Most of these novel optical modulators utilize the nonresonant Kerr effect.The Kerr effect produces intensity-dependent changes of the refractive index. It isgenerally an undesirable effect because it can lead to self-focusing and filamentformation in intense beams, as explained in Section 4.5.
In contrast to the absorption in bleachable dyes, the nonresonant Kerr effect isextremely fast, wavelength-independent, and allows the generation of a continu-ous train of mode-locked pulses from a cw-pumped laser. For a Gaussian beam,the Kerr effect focuses the radiation toward the center, and essentially an intensity-dependent graded-index lens is formed. The action of a fast saturable absorber canbe achieved if an aperture is introduced in the resonator at a position where themode size decreases for increased intensity.
The transformation of the power-dependent change in the spatial profile of thebeam into an amplitude modulation is illustrated in Fig. 9.6. Transmission throughthe aperture is higher for an intense beam, as compared to a low-power beam.This technique, which provides an extremely simple means for ultrashort pulsegeneration in tunable lasers, has been termed Kerr lens mode-locking (KLM).
The laser crystal acts as a lens with a focal length that changes with the intra-cavity intensity. With the assumption of a parabolic index variation and a focallength much longer than the Kerr medium we obtain, to a first approximation,
FIGURE 9.6. Intensity-dependent amplitude modulation of the resonator mode.
318 9. Mode-Locking
(see also Section 4.5)
f = w2
4γ I0l(9.12)
where w is the beam waist, γ is the nonlinear refractive coefficient, I0 is the peakintensity, and l is the length of the Kerr medium.
Assuming a waist radius w of 50µm in a 4 mm long Ti : Al2O3 crystal, and apeak power of 150 kW we obtain, with γ = 3.45 × 10⁻¹⁶ cm2/W, a focal lengthof f = 24 cm.
As was discussed in Section 4.5 beam focusing due to the Kerr effect can lead tocatastrophic beam collapse with the beam breaking up into filaments. The criticalpower level at which beam collapse will set in is usually defined by
Pcr = aλ20
8πn0γ, (9.13)
where the factor a can take on values between 3.77 and 6.4 depending on theseverity of nonlinear phase distortion. For the materials and wavelengths of inter-est, one finds Pcr = 2–3 MW. For example, Pcr = 2.6 MW for Al2O3 and BK7glass at 0.8µm. In KLM lasers, the peak power has to be large enough to pro-duce a strong nonlinearity, but needs to be well below the critical power for beamcollapse.
Returning to Fig. 9.6, for a hard aperture of radius r0, the rate of change intransmission T with respect to the beam waist w for a Gaussian beam is given by
dT/dw = (−4r20/w
3) exp(−2r20/w
2). (9.14)
If one assumes that the aperture size is close to the mode size r0 ≈ w, one obtainsδT ≈ −(1/2w) δw. The limiting aperture introduces a loss discrimination for lowpower (cw) and high peak power (mode-locked) operation which is proportionalto mode size changes.
Since the mode size, w is power dependent due to the Kerr effect, the resonatorlosses are expressed as
δ = δ0 − u P, (9.15)
where δ0 are the fixed losses, P is the intracavity power, and u is the nonlinear losscoefficient. For the design of KLM systems, it is more convenient to use, insteadof u, the small-signal relative spot size variation s, where s ∼ −u. The parameters, also called the Kerr lens sensitivity is an important factor for analyzing anddesigning KLM resonators. It is defined as
s =(
1
w
dw
d(P/Pcr)
), (9.16)
where w is the spot size at a given place inside the resonator. The second term isthe slope of the spot size versus normalized power, taken at P = 0.

9.2. Passive Mode-Locking 319
FIGURE 9.7. Beam-waist radius as a function of peak power [6].
In Fig. 9.7 the beam waist at the center of a Ti : Al2O3 crystal is plotted. The cal-culations were performed for a 100 fs pulsewidth, 3 W intracavity average power,and a 80 MHz pulse repetition rate. The beam radius decreases with a slope ofapproximately −1.5 × 10⁻⁵ µm/W. Introducing this value into (9.16), and nor-malizing to the spot size w and critical power Pcr, gives s = −1.36.
A typical resonator, used for KLM of a Ti : Al2O3 crystal pumped by an argonlaser, consists of two plane mirrors and two focusing mirrors. The crystal is at thebeam waist as shown in Fig. 9.8. An aperture is usually located close to one ofthe flat mirrors. As will be explained later, the spot size variation s, at the apertureas a function of the circulating power, critically depends on the position x of theKerr medium around the focus of the beam, and on the separation z of the twofocusing mirrors.
We will first consider the properties of the empty resonator illustrated inFig. 9.8. The equivalent resonator consists of two flat mirrors with two internallenses essentially forming a telescope with a magnification of one, as shown inFig. 9.9. For a slightly misadjusted telescope, the lens spacing is z = 2 f − �zwhere �z measures the misadjustment. The focal length of the lens assemblyis then fef = f 2/�z, where f is the focal length of the individual lenses. Thedistances from the resonator mirrors and the principal planes of the lenses are L1and L2. The g-parameters for a resonator comprised of two flat mirrors and an
FIGURE 9.8. Typical resonator used for Kerr lens mode-locking (KLM).
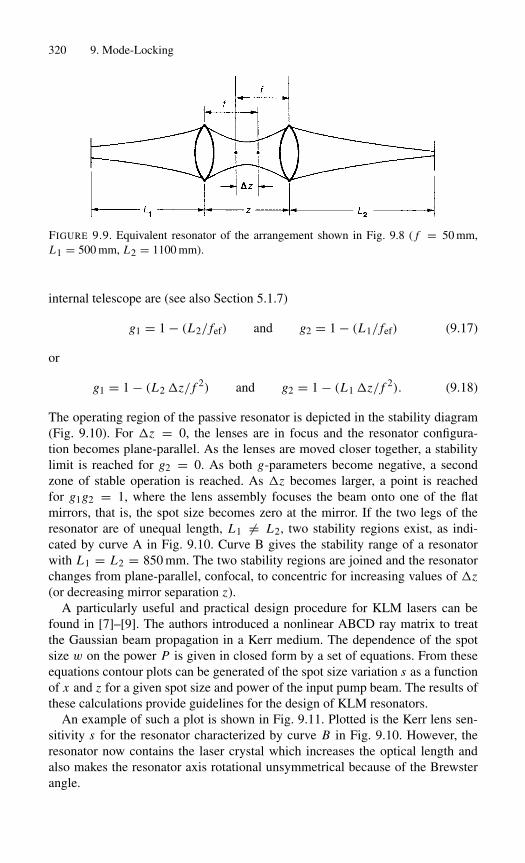
320 9. Mode-Locking
FIGURE 9.9. Equivalent resonator of the arrangement shown in Fig. 9.8 ( f = 50 mm,L1 = 500 mm, L2 = 1100 mm).
internal telescope are (see also Section 5.1.7)
g1 = 1 − (L2/ fef) and g2 = 1 − (L1/ fef) (9.17)
or
g1 = 1 − (L2�z/ f 2) and g2 = 1 − (L1�z/ f 2). (9.18)
The operating region of the passive resonator is depicted in the stability diagram(Fig. 9.10). For �z = 0, the lenses are in focus and the resonator configura-tion becomes plane-parallel. As the lenses are moved closer together, a stabilitylimit is reached for g2 = 0. As both g-parameters become negative, a secondzone of stable operation is reached. As �z becomes larger, a point is reachedfor g1g2 = 1, where the lens assembly focuses the beam onto one of the flatmirrors, that is, the spot size becomes zero at the mirror. If the two legs of theresonator are of unequal length, L1 �= L2, two stability regions exist, as indi-cated by curve A in Fig. 9.10. Curve B gives the stability range of a resonatorwith L1 = L2 = 850 mm. The two stability regions are joined and the resonatorchanges from plane-parallel, confocal, to concentric for increasing values of �z(or decreasing mirror separation z).
A particularly useful and practical design procedure for KLM lasers can befound in [7]–[9]. The authors introduced a nonlinear ABCD ray matrix to treatthe Gaussian beam propagation in a Kerr medium. The dependence of the spotsize w on the power P is given in closed form by a set of equations. From theseequations contour plots can be generated of the spot size variation s as a functionof x and z for a given spot size and power of the input pump beam. The results ofthese calculations provide guidelines for the design of KLM resonators.
An example of such a plot is shown in Fig. 9.11. Plotted is the Kerr lens sen-sitivity s for the resonator characterized by curve B in Fig. 9.10. However, theresonator now contains the laser crystal which increases the optical length andalso makes the resonator axis rotational unsymmetrical because of the Brewsterangle.
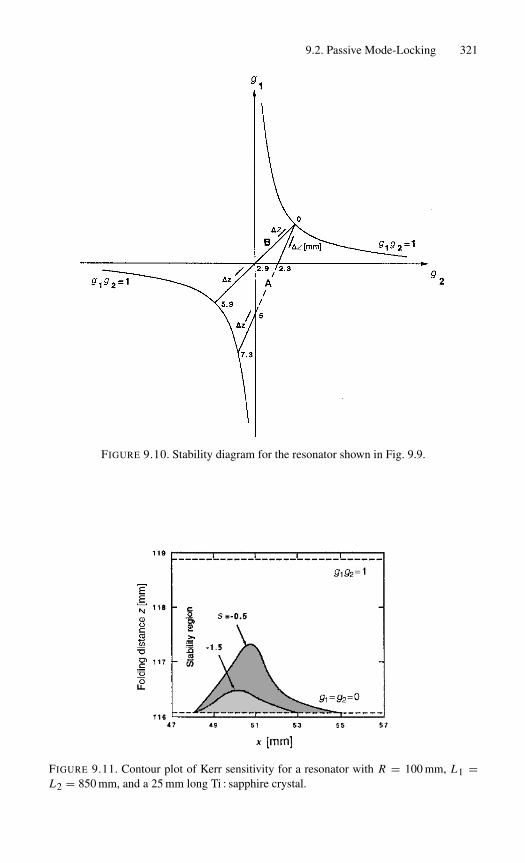
9.2. Passive Mode-Locking 321
FIGURE 9.10. Stability diagram for the resonator shown in Fig. 9.9.
FIGURE 9.11. Contour plot of Kerr sensitivity for a resonator with R = 100 mm, L1 =L2 = 850 mm, and a 25 mm long Ti : sapphire crystal.

322 9. Mode-Locking
The plots are for the tangential plane of the resonator because δ is larger in thisplane as compared to the saggital plane. The curves for δ are bound by the stabilitylimits of the resonator in the first quadrant of the stability diagram, i.e., g1 ·g2 = 1and g1 = g2 = 0. Similar curves are obtained for the third quadrant. Experimentsperformed on an actual system revealed that, for reliable mode-locking, a valueof |δ| ≥ 0.5 was necessary. This defines the operating regime of the laser systemindicated by the shaded areas.
It was found that the best compromise between a large δ and a reasonably stableperformance is achieved for a symmetric resonator L1 = L2 and operation closeto g1g2 = 0. For this configuration, which is equivalent to a confocal resonator,the tolerance for stable operation is about ±0.6 mm in the z-direction, with theresonator operated about 0.5–1 mm from the stability limit. From the results illus-trated in Fig. 9.11 it is clear that the alignment of a KLM resonator is very criticaland the tolerance in length adjustments are fractions of a millimeter.
Specific resonator designs can be analyzed by following the formulas devel-oped in the referenced papers. The design usually starts with the assumption of apump beam that has a certain spot size and power in the Kerr medium (definedby n2 and Pcr). From this a nonlinear matrix is developed which, combined withthe linear matrix of the passive elements of the resonator, describes the behaviorof the system. Kerr lens mode-locking is the preferred method for the generationof femtosecond lasers. Pulses on the order of a few tens of femtoseconds havebeen obtained from solid-state tunable lasers. The ultimate limit of pulse durationfor Ti : sapphire is somewhere in the range of ∼ 3 fs, or about 1 cycle of light at800 nm.
9.3 Active Mode-Locking
By placing inside a laser cavity either a phase modulator (FM) or an amplitudemodulator (AM), driven at exactly the frequency separation of the axial modes,one can cause the laser to generate a train of mode-locked pulses with a pulserepetition rate of νm = c/2L . Active mode-locking, performed on cw-pumpedlasers such as the Nd : YAG system, is achieved by inserting into the resonator anelectro-optic or acousto-optic modulator.
A cw actively mode-locked laser generates a train of equal pulses at a repeti-tion rate typically in the range of 80–250 MHz with pulse energies in the nano-joule range. Figure 9.12 presents an example of an end-pumped Nd : YAG laserin a folded resonator containing an LiNbO3 phase modulator for active mode-locking of the laser. Although the system architecture looks identical, we have todistinguish between AM and FM modulation.
9.3.1 AM Modulation
From a frequency-domain viewpoint, introducing a time-varying transmissionT (t) through an amplitude modulator inside the laser resonator creates sidebands

9.3. Active Mode-Locking 323
FIGURE 9.12. Schematic of an FM mode-locked Nd : YAG laser [10].
on each oscillating axial mode that overlap with adjoining axial modes. The oper-ation can be described by assuming that the mode with the frequency ν0, nearestthe peak of the laser gain profile, will begin to oscillate first. If a loss modulatoroperating at a frequency νm is inserted into the resonator, the carrier frequencyν0 will develop sidebands at ±νm. If the modulating frequency is chosen to becommensurate with the axial mode frequency separation νm = c/2L , the coinci-dence of the upper (ν0 + νm) and the lower (ν0 − νm) sidebands with the adjacentaxial mode resonances will couple the ν0 −νm, ν0, and ν0 +νm modes with a well-defined amplitude and phase. As the ν0 +νm and ν0 −νm oscillations pass throughthe modulator, they will also become modulated and their sidebands will couplethe ν0 ± 2νm modes to the previous three modes. This process will continue untilall axial modes falling within the laser linewidth are coupled.
Viewed in the time domain, the same intracavity modulating element, with itsmodulation period equal to the round-trip transit time 2L/c, can reshape the inter-nal circulating field distribution repeatedly on each successive round trip insidethe cavity. For example, light incident at the modulator during a certain part ofthe modulation cycle will be again incident at the same point of the next cycleafter one round trip in the laser resonator. Light suffering a loss at one time willagain suffer a loss on the next round trip. Thus, all the light in the resonator willexperience loss except that light which passes through the modulator when themodulator loss is zero (Fig. 9.13(a)). Light will tend to build up in narrow pulses

324 9. Mode-Locking
FIGURE 9.13. Mode-coupling behavior in the case of (a) AM mode-locking and (b) FMmode-locking.
in these low-loss time positions. In a general way, we can see that these pulses willhave a width given by the reciprocal of the gain bandwidth since wider pulses willexperience more loss in the modulator, and narrower pulses will experience lessgain because their frequency spectrum will be wider than the gain bandwidth.
By following a single mode-locked pulse through one round trip around thelaser cavity a comprehensive analysis of active mode-locking has been developed[11]–[13]. For steady-state mode-locking the pulse shape should be unchangedafter a complete round-trip. The self-consistent solution carried out for a Gaussianpulse leads to a simple expression that shows the dependence of the mode-lockedpulsewidth on the spectral linewidth, modulation frequency, depth of modulation,and saturated gain.
For an acousto-optic AM operating in the Bragg regime, as well as for electro-optic AMs, the round trip amplitude transmission is
T (t) ≈ cos2(δAM sinωmt), (9.19)
where δAM is the modulation depth and ωm = 2πνm is the angular frequencyof the modulation. In the ideal mode-locking case, the pulse passes through themodulator at the instant of maximum transmission. This occurs twice in everyperiod of the modulation signal ωm and, hence, one drives these modulators at amodulation frequency equal to half the axial mode-spacing of the laser. Expanding(9.19) at the transmission maximum gives, for the round-trip modulation function,
T (t) = exp(−δAMω2mt2), (9.20)
which results in a pulse width for the AM mode-locked laser of
tp(AM) = µ(gl)1/4
(δAMνm�ν)1/2. (9.21)
where µ = 0.53 for Bragg deflection and µ = 0.45 for Raman–Nath modulation,g is the saturated gain coefficient at the line center, �ν is the gain bandwidth ofthe laser, and l is the length of the active medium. The AM mode-locked pulseshave no frequency “chirp”; that is, β = 0 in (9.5).
The pulsewidth-bandwidth product for AM is
tp (AM)×�ν (AM) = 0.440. (9.22)
9.3. Active Mode-Locking 325
From (9.21) it follows that the pulse duration of cw AM mode-locked lasersis inversely related to the product of the modulation depth and modulation fre-quency, tp(AM) ∼ (δAMνm)
−1/2. It follows that pulse duration can be shortenedby increasing the modulation depth or the frequency of the mode locker. Thepulsewidth is also inversely proportional to the gain bandwidth �ν. ThereforeNd : glass and Nd : YLF produce shorter pulses as compared to Nd : YAG.
As is the case with passive mode-locked systems, etalon effects due to intra-cavity elements will reduce the bandwidth of the system and broaden the mode-locked pulses. In a cw-pumped Nd : YAG laser, even a weak etalon effect due tothe modulator or rod surfaces can decrease the effective value of �ν by a largeamount. Therefore, one of the most important considerations in a practical mode-locking system is the elimination of residual reflections and optical interferenceeffects in the laser cavity.
On the other hand, it is possible to use a tilted etalon inside a mode-lockedlaser to deliberately lengthen the pulse width. With uncoated quartz etalonsof thickness between 1 and 10 mm, good control of the pulse width can beachieved.
9.3.2 FM Modulation
Light passing through an electro-optic phase modulator will be up- or down-shifted in frequency unless it passes through at the time when the intracavity phasemodulator δ(t) is stationary at either of its extrema. The recirculating energy pass-ing through the phase modulator at any other time receives a Doppler shift pro-portional to dδ/dt , and the repeated Doppler shifts on successive passes throughthe modulator eventually push this energy outside the frequency band over whichgain is available from the laser medium. The interaction of the spectrally widenedcirculating power with the narrow laser linewidth leads to a reduction in gain formost frequency components. Thus, the effect of the phase modulator is similar tothe loss modulator, and the previous discussion of loss modulation also applieshere. As shown in Fig. 9.13(b), the existence of two phase extrema per periodcreates a phase uncertainty in the mode-locked pulse position since the pulse canoccur at either of two equally probable phases relative to the modulating signal.The quadratic variation of δ(t) about the pulse arrival time also produces a fre-quency “chirp” within the short mode-locked pulses.
In the FM case, the internal FM introduces a sinusoidally varying phase per-turbation such that the round-trip transmission through the modulator is givenapproximately by
T (t) ≈ exp(± jδFMω2mt2), (9.23)
where δFM is the peak phase retardation through the modulator. The ± sign corre-sponds to the two possible phase positions at which the pulse can pass through themodulator, as mentioned earlier. With these parameters the pulse width of phasemode-locked pulses is given by
326 9. Mode-Locking
tp (FM) = 0.54
(gl
δFM
)1/4 1
(νm�ν)1/2. (9.24)
The time-bandwidth product is given by
tp (FM)×�ν (FM) = 0.626. (9.25)
In an electro-optic phase modulator the phase retardation is proportional to themodulating voltage, hence δFM ∝ P1/2
in , where Pin is the drive power into themodulator. Therefore, we obtain from (9.24) the following expression for thepulse width: tp(FM) ∝ P−1/8
in , which indicates that the pulses shorten very slowlywith increased modulator drive. More effective in shortening the pulses is an in-crease of the modulation frequency. Since νm = c/2L , the pulse width will beproportional to the square root of the cavity length.
In order to calculate the pulse width from (9.24), we can calculate the saturatedgain coefficient g by equating the loop gain with the loss in the resonator
2gl ≈ ln
(1
R
), (9.26)
where R is the effective reflectivity of the output mirror and includes all losses.For a typical Nd : YAG laser with 10% round-trip loss, that is, R = 0.9, a res-onator length of 60 cm, and a linewidth of 120 GHz, the pulse length is given bytp(FM) = 39(1/δFM)
1/4. For δFM = 1 rad, which is easily obtainable, pulses of39 ps can be generated.
9.4 Picosecond Lasers
Today, diode-pumped cw Nd : YAG or Nd : YLF lasers, mode-locked with anacousto-optic modulator, are the standard sources for the production of pico-second pulses. A typically end-pumped and actively mode-locked neodymiumlaser is shown in Fig. 9.14. The output from a GaAlAs diode array is focused ontothe end of the laser crystal. Spot sizes of the pump beam range from 50µm to afew hundred micrometers. A common resonator configuration for diode-pumpedactively mode-locked lasers is a three-mirror arrangement. A folded cavity geom-etry provides a beam waist at both the laser crystal and the modulator, as wellas astigmatic compensation. In commercial mode-locked lasers, the resonator isusually folded a few times to decrease the overall length of the system. The lengthof the cavity is usually a compromise between the need for short pulses, whichrequires a short resonator and a high-modulation frequency, and the ability to sliceout a single pulse with a Pockels cell.
Typical of end-pumped lasers is the highly reflective coating applied to theback face of the crystal (Fig. 9.14) to form one of the resonator mirrors. Smallthermal or vibrational changes in the pump radiation readily induce relaxation

9.4. Picosecond Lasers 327
FIGURE 9.14. Typical end-pumped and actively mode-locked neodymium laser [14].
oscillations in mode-locked systems. These relaxation oscillations cause fluctua-tions in amplitude, accompanied by damped oscillations at frequencies in the 30to 150 kHz range. Therefore, careful alignment and isolation is required for cleanmode-locking. The modulator is usually placed close to the front mirror at thebeam waist created by the folding mirror. The resonator length is typically on theorder of 1 m or longer to provide a sufficiently large separation between pulsesfor pulse selection by an external switching device. Actively mode-locked lasersare very sensitive to cavity length detuning. In practice, cavity length changes onthe order of 1µm can cause serious degradation in pulse quality. Therefore, ac-tive length stabilization of the resonator by a feedback loop is needed to maintainlong-term stability of mode-locking.
Active mode-locking of a laser can be achieved by using a tunable rf oscil-lator and adjusting the modulator frequency to agree with the cavity length; or,alternatively, selecting a fixed frequency and adjusting the mirror spacing.
9.4.1 AM Mode-Locking
Amplitude modulation for mode-locking cw lasers is usually performed with anacousto-optic modulator. These devices are different from the modulators em-ployed for Q-switching lasers because they are operated at resonance. The mod-ulator material, such as a quartz block, has parallel faces and the sound wave isreflected back and forth in the material. The length of the quartz cell is cut suchthat the length is equal to an integer number of half-wavelength of the soundwave. In such a standing-wave pattern, the diffraction loss of the optical beamwill be modulated at twice the frequency of the sound wave since the diffractionloss reaches a maximum wherever the standing-wave pattern has a maximum. The

328 9. Mode-Locking
TABLE 9.1. Modulation depth and rf power requirements for typicalmode lockers.
Frequency Modulation Corresponding[MHz] depth (δAM) Drive power [W] resonator length
38 0.8 5 197.4 cm120 0.63 1 62.5 cm
transducer of the acousto-optic modulator is therefore driven at an rf frequency ofνrf = c/4L . Operation of the modulator at resonance requires considerably lessrf power compared to a traveling-wave device. For Q-switching of lasers, this ap-proach is not feasible because the high Q of the acoustic resonance prevents fastswitching.
Acousto-optic mode-locking requires a precise match of the drive rf with oneof the acoustic resonances of the modulator and also with the frequency spac-ing of the cavity modes. Since an acousto-optic mode locker operates at a fixedfrequency, exact synchronism between the modulation frequency and the cavitylength is achieved by mounting one of the resonator mirrors on a piezoelectrictranslator for cavity-length adjustment. A second feedback loop is usually re-quired to maintain synchronism between the rf drive frequency and the resonancefrequency of the high-Q modulator. This is achieved by sampling the rf reflectedback from the modulator by means of a directional coupler. This reflected rf powerprovides an error signal for slight frequency adjustments caused by a shift of themodulator’s resonance due to thermal effects.
Usually, fused quartz is used as the Bragg deflector in mode lockers becauseof its excellent optical quality, which ensures a low-insertion loss. A transducer,such as LiNbO3, is bonded to the quartz block and launches an acoustic wave intothe substrate. Such mode lockers are driven by an rf generator anywhere from40 to 120 MHz and at power ranges from 1 to 5 W. For example, two commer-cially available units at the low and high ends of the frequency range have theperformance characteristics, as listed in Table 9.1.
Optimum mode-locking is achieved by adjusting the cavity length such that itsresonant frequency matches the frequency of the mode locker. This is usually ac-complished by fixing the frequency of the mode locker and tuning the resonatorlength to match the mode locker’s frequency. The cavity length is tuned by trans-lating one mirror mounted on a piezoelectric translator.
Figure 9.15 shows feedback control of a laser mode-locked with an acousto-optic Bragg cell. The mode locker is driven by an rf generator whose output fre-quency is divided by 2. Manually, the cavity length is adjusted until a region ofstable mode-locking is achieved. This is accomplished by adjusting the referencevoltage of a differential operational amplifier, which then provides a dc voltage tothe piezoelectric transducer. At that point, the feedback loop is closed. The train ofmode-locked pulses is detected by a photodiode. Appropriate filtering of the pho-todiode output provides a sine wave that corresponds to the resonator round-trip

9.4. Picosecond Lasers 329
FIGURE 9.15. Feedback control of an acousto-optic mode-locked laser.
repetition frequency. The phase of this waveform is compared with the waveformof the rf generator in a phase detector. A deviation or drift between these twofrequencies produces an error signal directed to the differential amplifier that, inturn, provides a dc voltage to the piezoelectric translation stage.
9.4.2 FM Mode-Locking
To achieve FM mode-locking, an intracavity electro-optic phase modulator isdriven at the cavity resonance frequency. Electrically, the modulator consists of apair of electrodes between which the crystal is placed. An inductive loop and atuning capacitor are shunted across these electrodes and are used to achieve thedesired resonant frequency.
Lithium niobate is usually the crystal employed in electro-optic modulators.With the electric field applied transversely to the optical beam, the r33 electro-optic coefficient can be utilized, and one obtains
�nz = −1
2r33(n
e)3 Ez, (9.27)
where ne is the extraordinary index of refraction. The light propagates in thex-direction, and the beam is polarized in the z-direction in the same directionas the applied electric field.
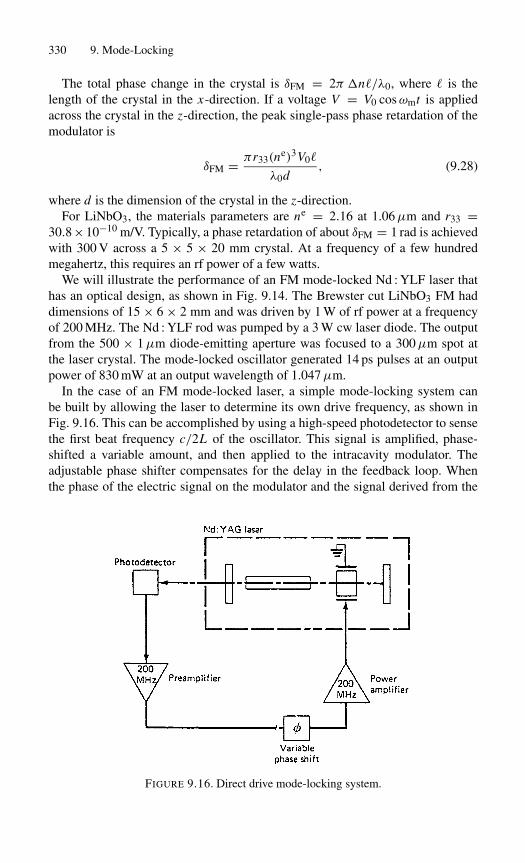
330 9. Mode-Locking
The total phase change in the crystal is δFM = 2π �n�/λ0, where � is thelength of the crystal in the x-direction. If a voltage V = V0 cosωmt is appliedacross the crystal in the z-direction, the peak single-pass phase retardation of themodulator is
δFM = πr33(ne)3V0�
λ0d, (9.28)
where d is the dimension of the crystal in the z-direction.For LiNbO3, the materials parameters are ne = 2.16 at 1.06µm and r33 =
30.8×10⁻¹⁰ m/V. Typically, a phase retardation of about δFM = 1 rad is achievedwith 300 V across a 5 × 5 × 20 mm crystal. At a frequency of a few hundredmegahertz, this requires an rf power of a few watts.
We will illustrate the performance of an FM mode-locked Nd : YLF laser thathas an optical design, as shown in Fig. 9.14. The Brewster cut LiNbO3 FM haddimensions of 15 × 6 × 2 mm and was driven by 1 W of rf power at a frequencyof 200 MHz. The Nd : YLF rod was pumped by a 3 W cw laser diode. The outputfrom the 500 × 1µm diode-emitting aperture was focused to a 300µm spot atthe laser crystal. The mode-locked oscillator generated 14 ps pulses at an outputpower of 830 mW at an output wavelength of 1.047µm.
In the case of an FM mode-locked laser, a simple mode-locking system canbe built by allowing the laser to determine its own drive frequency, as shown inFig. 9.16. This can be accomplished by using a high-speed photodetector to sensethe first beat frequency c/2L of the oscillator. This signal is amplified, phase-shifted a variable amount, and then applied to the intracavity modulator. Theadjustable phase shifter compensates for the delay in the feedback loop. Whenthe phase of the electric signal on the modulator and the signal derived from the
FIGURE 9.16. Direct drive mode-locking system.
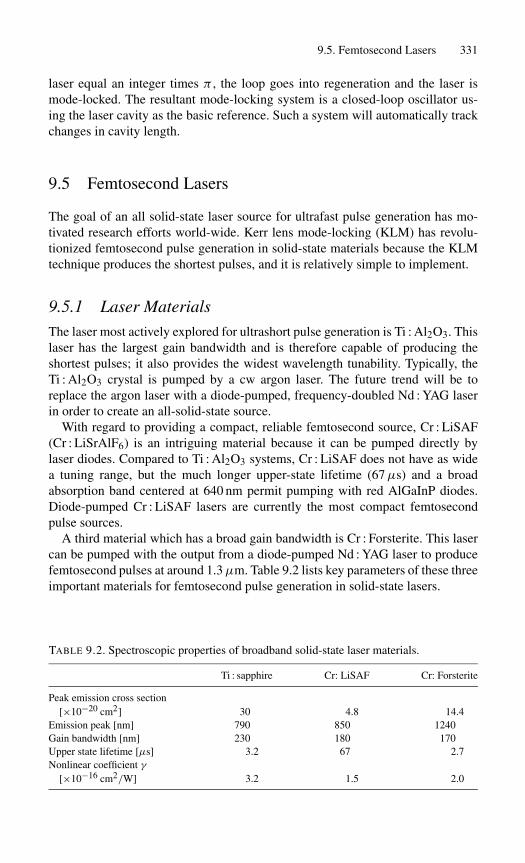
9.5. Femtosecond Lasers 331
laser equal an integer times π , the loop goes into regeneration and the laser ismode-locked. The resultant mode-locking system is a closed-loop oscillator us-ing the laser cavity as the basic reference. Such a system will automatically trackchanges in cavity length.
9.5 Femtosecond Lasers
The goal of an all solid-state laser source for ultrafast pulse generation has mo-tivated research efforts world-wide. Kerr lens mode-locking (KLM) has revolu-tionized femtosecond pulse generation in solid-state materials because the KLMtechnique produces the shortest pulses, and it is relatively simple to implement.
9.5.1 Laser Materials
The laser most actively explored for ultrashort pulse generation is Ti : Al2O3. Thislaser has the largest gain bandwidth and is therefore capable of producing theshortest pulses; it also provides the widest wavelength tunability. Typically, theTi : Al2O3 crystal is pumped by a cw argon laser. The future trend will be toreplace the argon laser with a diode-pumped, frequency-doubled Nd : YAG laserin order to create an all-solid-state source.
With regard to providing a compact, reliable femtosecond source, Cr : LiSAF(Cr : LiSrAlF6) is an intriguing material because it can be pumped directly bylaser diodes. Compared to Ti : Al2O3 systems, Cr : LiSAF does not have as widea tuning range, but the much longer upper-state lifetime (67µs) and a broadabsorption band centered at 640 nm permit pumping with red AlGaInP diodes.Diode-pumped Cr : LiSAF lasers are currently the most compact femtosecondpulse sources.
A third material which has a broad gain bandwidth is Cr : Forsterite. This lasercan be pumped with the output from a diode-pumped Nd : YAG laser to producefemtosecond pulses at around 1.3µm. Table 9.2 lists key parameters of these threeimportant materials for femtosecond pulse generation in solid-state lasers.
TABLE 9.2. Spectroscopic properties of broadband solid-state laser materials.
Ti : sapphire Cr: LiSAF Cr: Forsterite
Peak emission cross section[×10−20 cm2] 30 4.8 14.4
Emission peak [nm] 790 850 1240Gain bandwidth [nm] 230 180 170Upper state lifetime [µs] 3.2 67 2.7Nonlinear coefficient γ
[×10−16 cm2/W] 3.2 1.5 2.0

332 9. Mode-Locking
FIGURE 9.17. (a) Resonator for Kerr lens mode locking and (b) equivalent resonator.
9.5.2 Resonator Design
A resonator commonly employed for KLM is an astigmatically compensated ar-rangement consisting of two focusing mirrors and two flat mirrors. In order toobtain a high nonlinearity, the Kerr medium is inserted into the tightly focusedsection of the resonator, as shown in Fig. 9.17(a). Taking into account the astig-matism of the Brewster cut crystal and the tilted mirrors, the resonator shown inFig. 9.17(a) has to be evaluated in the tangential and sagittal plane. The curvedmirrors correspond to lenses with focal lengths f , which are different for thetwo planes, the same is true for the equivalent lengths l of the laser crystal. Fig-ure 9.17(b) depicts the equivalent resonator. The function of the two prisms is toprovide dispersion compensation in the resonator, as will be explained in the nextsubsection.
As was explained in Section 9.2.2, the operation of a KLM laser is a trade-off between output power, stability, and tolerance to the exact position of thecomponents. An analytical treatment of nonlinear resonators has shown that for agiven pump power and pump spot size, the most critical parameters are:
(a) the distance z of the two focusing mirrors;
(b) the location x of the Kerr medium with respect to the mirrors, and
(c) the spot size variation s at the aperture.
As we have seen in Section 9.2.2, the Kerr lens sensitivity s is highest near thelimit of the stability range of the resonator, therefore loss-modulation efficiencyhas to be traded off against stable laser performance.
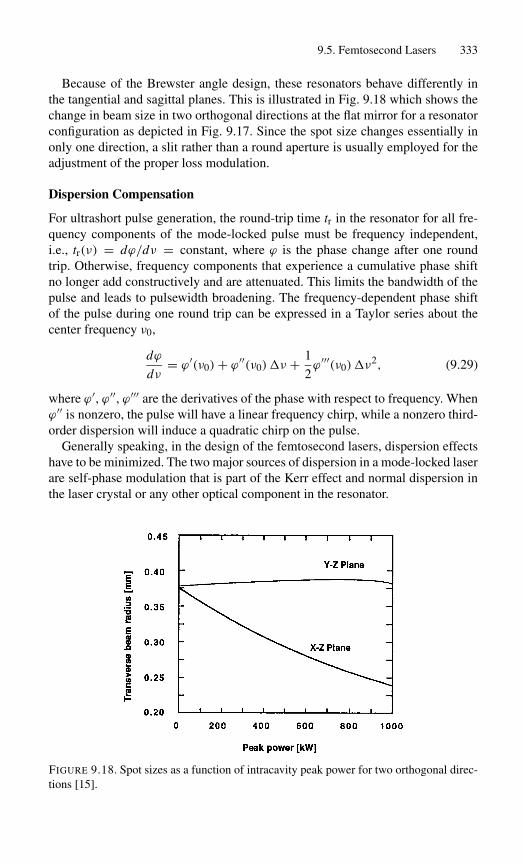
9.5. Femtosecond Lasers 333
Because of the Brewster angle design, these resonators behave differently inthe tangential and sagittal planes. This is illustrated in Fig. 9.18 which shows thechange in beam size in two orthogonal directions at the flat mirror for a resonatorconfiguration as depicted in Fig. 9.17. Since the spot size changes essentially inonly one direction, a slit rather than a round aperture is usually employed for theadjustment of the proper loss modulation.
Dispersion Compensation
For ultrashort pulse generation, the round-trip time tr in the resonator for all fre-quency components of the mode-locked pulse must be frequency independent,i.e., tr(ν) = dϕ/dν = constant, where ϕ is the phase change after one roundtrip. Otherwise, frequency components that experience a cumulative phase shiftno longer add constructively and are attenuated. This limits the bandwidth of thepulse and leads to pulsewidth broadening. The frequency-dependent phase shiftof the pulse during one round trip can be expressed in a Taylor series about thecenter frequency ν0,
dϕ
dν= ϕ′(ν0)+ ϕ′′(ν0)�ν + 1
2ϕ′′′(ν0)�ν
2, (9.29)
where ϕ′, ϕ′′, ϕ′′′ are the derivatives of the phase with respect to frequency. Whenϕ′′ is nonzero, the pulse will have a linear frequency chirp, while a nonzero third-order dispersion will induce a quadratic chirp on the pulse.
Generally speaking, in the design of the femtosecond lasers, dispersion effectshave to be minimized. The two major sources of dispersion in a mode-locked laserare self-phase modulation that is part of the Kerr effect and normal dispersion inthe laser crystal or any other optical component in the resonator.
FIGURE 9.18. Spot sizes as a function of intracavity peak power for two orthogonal direc-tions [15].
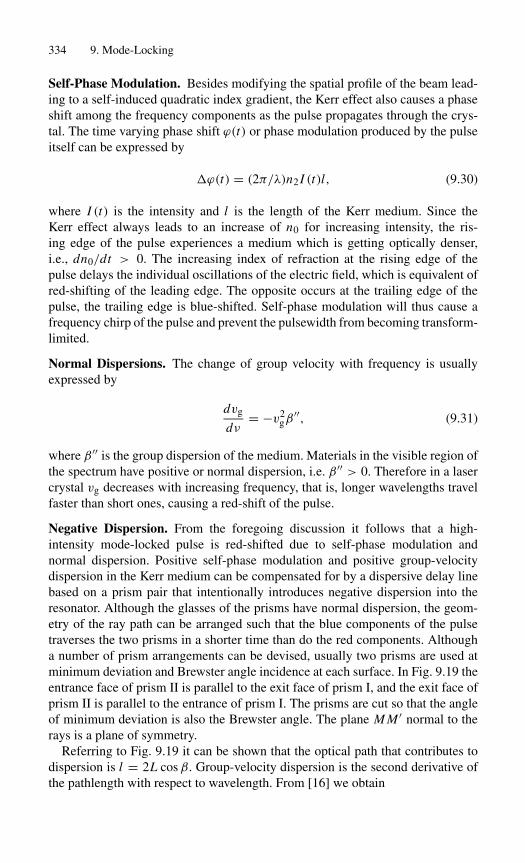
334 9. Mode-Locking
Self-Phase Modulation. Besides modifying the spatial profile of the beam lead-ing to a self-induced quadratic index gradient, the Kerr effect also causes a phaseshift among the frequency components as the pulse propagates through the crys-tal. The time varying phase shift ϕ(t) or phase modulation produced by the pulseitself can be expressed by
�ϕ(t) = (2π/λ)n2 I (t)l, (9.30)
where I (t) is the intensity and l is the length of the Kerr medium. Since theKerr effect always leads to an increase of n0 for increasing intensity, the ris-ing edge of the pulse experiences a medium which is getting optically denser,i.e., dn0/dt > 0. The increasing index of refraction at the rising edge of thepulse delays the individual oscillations of the electric field, which is equivalent ofred-shifting of the leading edge. The opposite occurs at the trailing edge of thepulse, the trailing edge is blue-shifted. Self-phase modulation will thus cause afrequency chirp of the pulse and prevent the pulsewidth from becoming transform-limited.
Normal Dispersions. The change of group velocity with frequency is usuallyexpressed by
dvg
dν= −v2
gβ′′, (9.31)
where β ′′ is the group dispersion of the medium. Materials in the visible region ofthe spectrum have positive or normal dispersion, i.e. β ′′ > 0. Therefore in a lasercrystal vg decreases with increasing frequency, that is, longer wavelengths travelfaster than short ones, causing a red-shift of the pulse.
Negative Dispersion. From the foregoing discussion it follows that a high-intensity mode-locked pulse is red-shifted due to self-phase modulation andnormal dispersion. Positive self-phase modulation and positive group-velocitydispersion in the Kerr medium can be compensated for by a dispersive delay linebased on a prism pair that intentionally introduces negative dispersion into theresonator. Although the glasses of the prisms have normal dispersion, the geom-etry of the ray path can be arranged such that the blue components of the pulsetraverses the two prisms in a shorter time than do the red components. Althougha number of prism arrangements can be devised, usually two prisms are used atminimum deviation and Brewster angle incidence at each surface. In Fig. 9.19 theentrance face of prism II is parallel to the exit face of prism I, and the exit face ofprism II is parallel to the entrance of prism I. The prisms are cut so that the angleof minimum deviation is also the Brewster angle. The plane M M ′ normal to therays is a plane of symmetry.
Referring to Fig. 9.19 it can be shown that the optical path that contributes todispersion is l = 2L cosβ. Group-velocity dispersion is the second derivative ofthe pathlength with respect to wavelength. From [16] we obtain
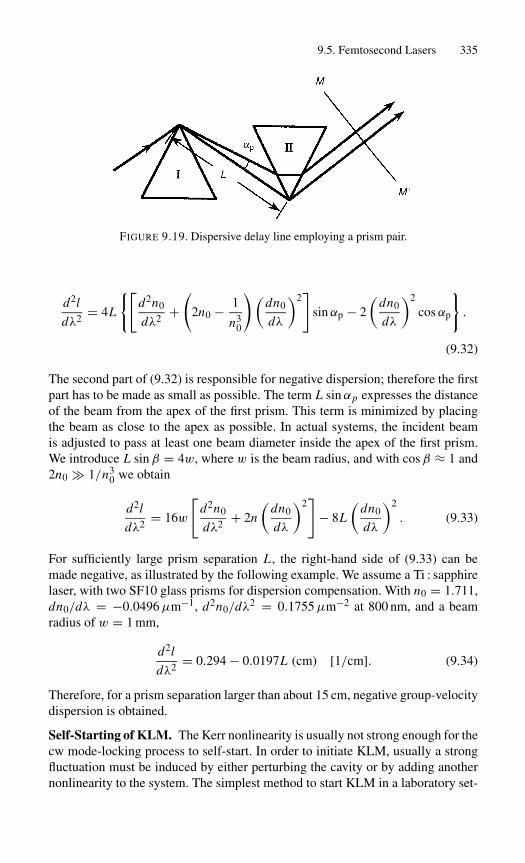
9.5. Femtosecond Lasers 335
FIGURE 9.19. Dispersive delay line employing a prism pair.
d2l
dλ2= 4L
{[d2n0
dλ2+(
2n0 − 1
n30
)(dn0
dλ
)2]
sinαp − 2
(dn0
dλ
)2
cosαp
}.
(9.32)
The second part of (9.32) is responsible for negative dispersion; therefore the firstpart has to be made as small as possible. The term L sin αp expresses the distanceof the beam from the apex of the first prism. This term is minimized by placingthe beam as close to the apex as possible. In actual systems, the incident beamis adjusted to pass at least one beam diameter inside the apex of the first prism.We introduce L sin β = 4w, where w is the beam radius, and with cosβ ≈ 1 and2n0 � 1/n3
0 we obtain
d2l
dλ2= 16w
[d2n0
dλ2+ 2n
(dn0
dλ
)2]
− 8L
(dn0
dλ
)2
. (9.33)
For sufficiently large prism separation L , the right-hand side of (9.33) can bemade negative, as illustrated by the following example. We assume a Ti : sapphirelaser, with two SF10 glass prisms for dispersion compensation. With n0 = 1.711,dn0/dλ = −0.0496µm−1, d2n0/dλ2 = 0.1755µm−2 at 800 nm, and a beamradius of w = 1 mm,
d2l
dλ2= 0.294 − 0.0197L (cm) [1/cm]. (9.34)
Therefore, for a prism separation larger than about 15 cm, negative group-velocitydispersion is obtained.
Self-Starting of KLM. The Kerr nonlinearity is usually not strong enough for thecw mode-locking process to self-start. In order to initiate KLM, usually a strongfluctuation must be induced by either perturbing the cavity or by adding anothernonlinearity to the system. The simplest method to start KLM in a laboratory set-
336 9. Mode-Locking
up is to slightly tap one of the resonator mirrors. Disturbing the cavity mirrors willsweep the frequencies of competing longitudinal modes, and strong amplitudemodulation due to mode-beating will occur. The most intense mode-beating pulsewill be strong enough to initiate mode-locking.
Several methods for the self-starting of KLM that are practical enough to beimplemented on commercial lasers have recently been developed. A simple ap-proach for starting KLM is to mount one of the resonator mirrors on a PZT andintroduce a vibration on the order of a few micrometers at a frequency of tensof hertz.
In synchronous pumping, the Kerr material is pumped from a source thatproduces already mode-locked pulses. For example, a Ti : Al2O3 crystal can bepumped with a frequency-doubled Nd : YAG laser which is actively mode-locked.
Summary
This chapter deals with the formation of ultrashort pulses by longitudinal mode-locking and the techniques employed for the generation of pulses with durationsless than 100 picoseconds and as short as a few femtoseconds.
In typical lasers the phases of different longitudinal modes vary randomly withtime. This causes the intensity of the laser output to fluctuate producing an irreg-ular, spiking emission. When the longitudinal modes are forced to oscillate withtheir phases locked, the modes interfere and produce short pulses in the pico- orfemto-second regime. The longitudinal modes of a laser oscillator can be lockedin phase by means of a suitable nonlinear process or by the action of an activeelement that modulates the loss in the resonator.
In passive mode-locking the intensity of the radiation in combination with apassive nonlinear element generates a periodic modulation that leads to a fixedphase relationship of the longitudinal modes. In active mode-locking, a rf signalis applied to a phase or frequency modulator at exactly the frequency interval ofthe longitudinal modes.
The output of a mode-locked laser consists of a train of pulses with a separationequal to the round-trip time of the resonator. The laser radiation can thereforealso be understood in terms of a pulse that propagates back and forth between themirrors of the resonator. The pulse width is equal to the round-trip time divided bythe number of modes locked together. Therefore the shortest pulses are obtainedfrom solid-state lasers, such as Ti : sapphire, that have a large gain bandwidth andcan support many longitudinal modes.
The generation of femtosecond pulses requires a nonlinear process in the res-onator that has an extremely fast response time. Most femtosecond lasers utilizethe Kerr effect in a solid that produces an intensity-dependent change of the re-fractive index. The Kerr medium acts as a lens with an intensity-dependent focallength. Dispersion of various elements in the resonator causes a phase shift of in-dividual modes, thus reducing the number of modes that can be mode-locked. Inthe design of femtosecond lasers, dispersion effects have to be minimized.

Exercises 337
References[1] J.A. Fleck: Phys. Rev. B 1, 84 (1970).
[2] R. Bracewell: The Fourier Transform and its Applications (McGraw-Hill, New York),1965.
[3] H.A. Haus, J.G. Fujimoto and E.P. Ippen: IEEE J. Quantum Electron. QE-28, 2086(1992).
[4] S.L. Shapiro (ed.): Ultrashort Light Pulses. Topics Appl. Phys., Vol. 18 (Springer,Berlin), 1977.
[5] W. Kaiser (ed.) Ultrashort Laser Pulses, 2nd ed., Topics Appl. Phys., Vol. 60(Springer, Berlin), 1993.
[6] F. Salin, J. Squier, G. Mourou, M. Piche, and N. McCarthy: OSA Proc. Ad. Solid-StateLasers 10, 125 (1991).
[7] V. Magni, G. Cerullo, and S. DeSilvestri: Opt. Commun. 101, 365 (1993).
[8] V. Magni, G. Cerullo, and S. DeSilvestri: Opt. Commun. 96, 348 (1993).
[9] G. Cerullo, S. DeSilvestri, V. Magni, and L. Pallaro: Opt. Lett. 19, 807 (1994).
[10] C.J. Flood, D.R. Walker, and H.M. van Driel: Opt. Lett. 20, 58 (1995).
[11] D.J. Kuizenga and A.E. Siegman: IEEE J. Quantum Electron. QE-6, 694, 709 (1970).
[12] A.E. Siegman and D.J. Kuizenga: Appl. Phys. Lett. 14, 181 (1969).
[13] A.E. Siegman and D.J. Kuizenga: Opto-Electr. 6, 43 (1974).
[14] J.L. Dallas: Appl. Opt. 33, 6373 (1994).
[15] D.K. Negus, L. Spinelli, N. Goldblatt, and G. Feuget: OSA Proc. Adv. Solid-StateLasers 10, 120 (1991).
[16] R.L. Fork, O.E. Martinez, and J.P. Gordon: Opt. Lett. 9, 150 (1984).
Exercises
1. Consider a continuously operating laser that is restricted to a single transversemode of oscillation but which is oscillating in N + 1 longitudinal modes thatare exactly equally spaced from each other in frequency by the amount �Hz.Assume that they all have equal electric field amplitude E0. Since these modesmust all satisfy the same boundary conditions on a cavity mirror, they can beassumed to have equal phase intervals from one mode to the next. Let us setthat to zero. Each mode can be written as an oscillating electromagnetic fieldthat satisfies Maxwell’s equations. The electric field of each mode is givenas
Ep = E0 exp(i(kpz + ωpt)),
where p is an integer from zero to N . The total output electric field of thislaser is the sum of these fields. Find an expression for the electric field as afunction of time at some arbitrary plane, say where z = 0. Then show that theoutput intensity is given by

338 9. Mode-Locking
I = E20
sin2
(12 (N�t)
)sin2
(12 (�t)
) .
If there are peaks of intensity in the output what is the intensity of thelaser at a peak? How does this compare to the intensity you would haveif the modes were spaced by random frequency differences? What is � interms of cavity parameters and what is the interval in time between thepeaks? (Hint: This is the derivation of (9.9). See the discussion of mode-locking in Laser Fundamentals by William T. Silfvast, Cambridge Univer-sity Press, Cambridge, UK, 1996, ISBN 0-521-55424-1, if you can’t do thisproblem yourself. To do it yourself you will need to look up the summa-tion of a geometric series with a finite limit. It is not hard once you dothat.)
2. In Problem 1 you found an expression for the intensity as a function of time fora mode-locked laser. Use that expression and find the full width of the peaksat half-maximum (FWHM). If the cavity of the laser has an optical length of15 cm, and the number of modes that are locked together (e.g., have constantintermode frequency spacing) in N + 1 = 100, what is the duration at FWHMof the intensity maxima?
10
Nonlinear Devices
10.1 Nonlinear Optics
10.2 Harmonic Generation
10.3 Parametric Oscillators
10.4 Raman Laser
10.5 Optical Phase Conjugation
References
Exercises
Nonlinear optical devices, such as harmonic generators and parametric oscillators,provide a means of extending the frequency range of available laser sources. In1961, Franken and coworkers detected ultraviolet light at twice the frequency ofa ruby laser beam when this beam was propagated through a quartz crystal [1].This experiment marked the beginning of an intense investigation into the realmof the nonlinear optical properties of matter.
Frequency conversion is a useful technique for extending the utility of high-power lasers. It utilizes the nonlinear optical response of an optical mediumin intense radiation fields to generate new frequencies. It includes both elastic(optical-energy-conserving) processes, such as harmonic generation, and inelas-tic processes (which deposit some energy in the medium), such as stimulatedRaman or Brillouin scattering.
There are several commonly used elastic processes. Frequency doubling gener-ates a single harmonic from a given fundamental high-power source. The closelyrelated processes of sum- and difference-frequency generation also produce asingle new wavelength but require two high-power sources. These processes havebeen used to generate high-power radiation in all spectral regions, from the ul-traviolet to the far-infrared. Optical parametric oscillators and amplifiers generatetwo waves of lower frequency from a pump source. They are capable of generatinga range of wavelengths from a single frequency source, in some cases spanningthe entire visible and near-infrared regions.
339

340 10. Nonlinear Devices
As far as inelastic processes are concerned, the Raman process can be utilizedin solid-state lasers for the generation of additional spectral output lines. Thestrongest interaction is for the output shifted toward a longer wavelength (firstStokes shift), but at sufficiently high-pump intensities additional lines at longer,as well as shorter, wavelengths with respect to the pump wavelength will appear(Stokes and anti-Stokes lines).
Although it produces a small wavelength shift, stimulated Brillouin scatteringis mainly of interest for the realization of phase-conjugating mirrors. The appli-cation of phase conjugation, or wavefront reversal, via stimulated Brillouin scat-tering, offers the possibility of minimizing thermally induced optical distortions[2] which occur in solid-state laser amplifiers.
10.1 Nonlinear Optics
Nonlinear optical effects are analyzed by considering the response of the dielec-tric material at the atomic level to the electric fields of an intense light beam.The propagation of a wave through a material produces changes in the spatial andtemporal distribution of electrical charges as the electrons and atoms react to theelectromagnetic fields of the wave. The main effect of the forces exerted by thefields on the charged particles is a displacement of the valence electrons fromtheir normal orbits. This perturbation creates electric dipoles whose macroscopicmanifestation is the polarization. For small field strengths this polarization is pro-portional to the electric field. In the nonlinear case, the reradiation comes fromdipoles whose amplitudes do not faithfully reproduce the sinusoidal electric fieldthat generates them. As a result, the distorted reradiated wave contains differentfrequencies from that of the original wave.
On a microscopic scale, the nonlinear optical effect is rather small even at rela-tively high-intensity levels, as the following example illustrates. We will comparethe applied electric field strength of a high-intensity beam to the atomic electricfield which binds the electrons to the nucleus. The magnitude of the atomic fieldstrength is approximately equal to Eat = e/4πε0r2 where e is the charge of anelectron, ε0 is the permitivity of free space, and r is the radius of the electron or-bit. With r = 10−8 cm one obtains Eat = 109 V/cm. A laser beam with a powerdensity of I = 100 MW/cm2 generates an electric field strength in the materialof about E = 105 V/cm according to I = n0 E2(µ0/ε0)
−1/2, where n0 is therefractive index and (µ0/ε0)
1/2 is the impedance of free space. To observe sucha small effect, which is on the order of 10−4, it is important that the waves addcoherently on a macroscopic scale. This requires that the phase velocities of thegenerated wave and the incident wave are matched.
In a given material, the magnitude of the induced polarization per unit volumeP will depend on the magnitude of the applied electric field E. We can thereforeexpand P in a series of powers of E and write
P = ε0�(1)E + ε0�(2)EE + ε0�(3)EEE + · · · , (10.1)

10.1. Nonlinear Optics 341
where ε0 is the permitivity of free space and �(1) is the linear susceptibility rep-resenting the linear response of the material. The two lowest-order nonlinear re-sponses are accounted for by the second- and third-order nonlinear susceptibilities�(2) and �(3). The expression of the polarization in anisotropy materials is rathercomplicated, for the induced polarization depends not only on the magnitude ofthe electric vector but on the magnitude and direction of all vectors that charac-terize the electromagnetic field. Normally �(1) � �(2) � �(3) and therefore thenonlinear effects will be negligible unless the electric field strength is very high.
The linear term in (10.1) represents three separate equations, one for each valueof the i th Cartesian coordinate of P, that is,
Pi = �i j E j (i, j = 1, 2, 3). (10.2)
The linear polarization tensor, which is rank 2, has an array of nine coefficients.The linear susceptibility, related to the refractive index through � = n2
0 −1 and tothe dielectric constant ε = ε0(1 + �), is responsible for the linear optical proper-ties of the medium such as refraction, dispersion, absorption, and birefringence.In the linear regime optical properties are independent of light intensity and thewavelength of radiation does not change.
The nonlinear optical susceptibilities of second and third order which describethree- and four-wave mixing processes, respectively, give rise to a large variety ofoptical phenomena since each electric field can have a different frequency, prop-agation vector, polarization, and relative phase. Therefore P can contain manydifferent product terms of the various interacting fields. In the following overviewonly interactions that are utilized in the nonlinear devices described in the remain-der of this chapter are described.
10.1.1 Second-Order Nonlinearities
The second-order susceptibility �(2) is responsible for second harmonic genera-tion, sum and difference frequency generation, and optical parametric amplifica-tion. Sections 10.2 and 10.3 describe devices based on these nonlinear phenom-ena. The above-mentioned second-order nonlinear effects are produced by twowaves, which interact to produce a third wave. Conservation of momentum andconservation of photon energy is always required in these processes. The opti-cal fields of the three waves are coupled to one another through the second-ordersusceptibility. The coupling provides the mechanism for the exchange of energyamong the interacting fields. The second-order nonlinear susceptibility in a Carte-sian coordinate system can be written as
P j = ε0�(2)i jkE j Ek , i, j, k = 1, 2, 3. (10.3)
The tensor �(2)i jk in general has 27 independent coefficients. By taking into ac-count symmetry conditions, the second-order susceptibility can be expressed by atwo-dimensional 3×6 tensor, commonly known as the d-tensor. The nonlinear co-efficients ranging from d11 to d36 will be frequently used throughout this chapter.

342 10. Nonlinear Devices
Most nonlinear crystals are described by only a few d-coefficients. For example,the nonlinear crystal KDP has only three nonvanishing terms (d14, d25, d36). Fur-thermore, for those crystals of main interest there is usually one predominant co-efficient associated with a beam propagation direction which yields maximumharmonic power. In centrosymmetric crystals the �(2) tensor is actually zero;therefore second-order nonlinear processes are only possible in crystals that lackinversion symmetry. Using the d-coefficients, the nonlinear polarization is givenby
P = ε0dEE, (10.4)
where d has the dimension of meter per volt.
Sum- and Difference-Frequency Generation
Two waves of comparable intensity and frequency ω1 and ω2 are initially present,and a wave at the third frequency ω3 is created through the nonlinear interaction
P(ω3) = ε0�(2)E(ω1)E(ω2), (10.5)
where ω3 = ω1 +ω2. Similarly, a wave at the difference frequency ω3 −ω2 = ω1may be generated (ω3 > ω2 > ω1). Sum frequency generation is described insection 10.2.5. A very common technique to produce the third harmonic of aneodymium laser is, first, the generation of the second harmonic and then sumfrequency generation by mixing the second harmonic (ω2) with the unconvertedportion of the fundamental beam (ω1).
Second Harmonic Generation
This is a special case of frequency mixing with the initial waves having a com-mon frequency, i.e., ω = ω1 = ω2 and ω3 = 2ω in (10.5). The generationof a second harmonic can be readily shown if we describe the applied field byE = E0 sin(ωt). The induced polarization, according to (10.1) takes the form
P = ε0[�(1)E sin(ωt)+ �(2)E2 sin2(ωt)+ · · · , (10.6a)
which can be written as
P = ε0[�(1)E sin(ωt)+ 1/2�(2)E2(1 − cos 2ωt)+ · · · . (10.6b)
In the last expression, the presence of the second term shows that a wave havingtwice the frequency of the fundamental can be formed in a nonlinear medium.Second harmonic generation is described in Section 10.2.
Parametric Amplification
Parametric amplification refers to the coupled growth of two waves in the presenceof a strong wave, which will be referred to as the pump. Energy and momentum
10.1. Nonlinear Optics 343
are conserved if ω3 = ω2 + ω1, where ω3 is the frequency of the input pumpbeam and ω2 and ω1 are the frequencies of the resulting signal and idler beams.Parametric oscillators are described in Section 10.3.
10.1.2 Third-Order Nonlinearities
Third-order optical nonlinearities involve the nonlinear susceptibility tensor �(3)
in (10.1). This term governs third harmonic generation, optical Kerr effect, Ra-man effect, and Brillouin scattering. In general, �(3) will couple together fourfrequency components, that is, three fields interact to produce a fourth field,
P(ω4) = ε0�(3)E(ω3)E(ω2)E(ω1), (10.7)
where ω4 = ω3 + ω2 + ω1. �(3) is a four-rank tensor with 81 elements, becausean array of 3 × 27 coefficients couple a single component of the polarization P tothree independent components of three electric field vectors.
The third-order optical nonlinearity is thus a four-photon process. There canbe up to three different input laser frequencies, but several of the frequencies canalso be the same. In a lossless medium the susceptibility coefficients of �(3) arereal. In this case, the primary nonlinear optical effects are the generation of newfrequency components and the intensity-dependent change in the refractive index(Kerr effect). In third-order interactions involving absorption, the imaginary partof �(3) describes Raman and Brillouin scattering.
Third Harmonic Generation
The third harmonic generated by an intense beam at frequency ω can be describedby (10.7) with ω = ω1 = ω2 = ω3 and ω4 = 3ω. The expression of a si-nusoidal electric field raised to the third power will include a term sin3(ωt) =3/4 sin(ωt) − 1/4 sin(3ωt) which illustrates the creation of a third harmonic.The possibility of third-harmonic generation exists in principle, although it suf-fers from practical drawbacks. Typical values of �(3) are orders of magnitudesmaller than �(2) coefficients found in nonlinear crystals. Therefore the preferredmethod of third-harmonic generation is the utilization of two second-order effects.(Second-harmonic generation, followed by sum-frequency mixing, is explained inSection 10.2.5.)
Optical Kerr Effect
The third-order nonlinearity can lead to an intensity-dependent refractive indexknown as the optical Kerr effect. With ω2 = −ω1, (10.7) transforms to
P(ω) = [�(3)E2av]E(ω), (10.8)
where Eav is the average electric field strength. The tensor �(3) describes theeffect of an intense light beam upon the propagation path of the beam. The self-induced effect manifests itself as an intensity-dependent contribution to the index

344 10. Nonlinear Devices
of refraction
n2 = n0 + (12π/n0)�(3)E2
av. (10.9)
The effect of an intensity-dependent refractive index is exploited in Kerr lensmode-locking (KLM), which is described in Section 9.2.2. In high-intensitybeams the nonlinear refractive index can be the source of optical damage becauseit can lead to self-focusing and small-scale ripple growth. Both phenomena arediscussed in Sections 4.3 and 4.5.
Stimulated Raman Scattering
This nonlinear process involves the interaction of a laser beam with the molecularvibrations in gases or liquids. In the presence of a strong external electric field,the charge distribution of a diatomic molecule is polarized. The molecule acquiresa dipole that can interact with the driving field. The external field exerts a forceon the molecule proportional to E2. This implies that there must be two inputphotons driving the interaction. Therefore two electric fields in (10.7) have thesame frequency and represent the pump beam ωp which drives the interaction toprovide amplification at ωp − ω0, where ω0 is the frequency of the molecularvibration wave. In accordance with (10.7) three waves produce a fourth wave viathe third-order polarization, and energy at the pump frequency can be transferredto the signal frequency ωp − ω0. In addition, nonlinear mixing processes createadditional frequency components atωp− jω0 andωp+ jω0 where j = 1, 2, 3, . . . .Raman lasers employed to shift the wavelength of solid-state lasers are describedin Section 10.4.
Stimulated Brillouin Scattering
In this process an optical beam interacts with an acoustic wave in the medium.The acoustic wave is associated with the propagation of pressure in the medium,leading to periodic density fluctuations. Electrostriction provides the couplingmechanism between the acoustic wave and electromagnetic wave, that is, a lo-cal compression of the medium in response to the strength of the electromagneticfield. An incident laser beam can scatter with the periodic index variations as-sociated with a propagating acoustic wave. The interaction is stimulated becausethe acoustic and scattered waves can grow as the pump beam is depleted. Theacousto-optic interaction with the laser pump beam depends on the intensity ofthe pump, just as in stimulated Raman scattering; therefore the polarizability isa function of E2. The four-wave mixing process is characterized by two electro-magnetic fields with the same frequency ωp interacting with an acoustic wave offrequency ωa to produce a fourth wave at ωp − ωa. The frequency of the acousticwave is determined by the conservation of energy and momentum. The stimulatedwave is usually radiated backward toward the incoming pump beam. The acous-tical frequency for a backward wave is ωa = 2ωp(n0va/c), where va is the speedof sound in the medium. Since va is very small compared to the speed of light inthe medium c/n0, the frequency shift is very small.

10.2. Harmonic Generation 345
Acoustic waves occur at frequencies orders of magnitude smaller than molecu-lar vibrations. Brillouin scattering is therefore frequency shifted from the incidentradiation by a much smaller amount as compared to Raman scattering. From anengineering point of view, interest in Brillouin scattering is not related to the fre-quency shift which occurs in the interaction, but in the phase-conjugate reflectionof the pump beam. Brillouin scattering is the mechanism for phase conjugationdiscussed in Section 10.5.
10.2 Harmonic Generation
In this section, we will review the basic theory and discuss system parameters andmaterial properties which affect harmonic generation. The subject of nonlinearoptics has been treated in several books [2]–[6] and tutorial review articles [7],[8]. For a general introduction to crystal optics the reader is referred to standardtexts [9], [10].
10.2.1 Basic Equations of Second-Harmonic Generation
The process of harmonic generation by an incident wave of frequency ω1 must beviewed as a two-step process. First, a polarization wave at the second harmonic2ω1 is produced and has a phase velocity and wavelength in the medium whichare determined by n1ω, the index of refraction for the fundamental wave, that is,λp = c/2ν1n1ω. The second step is the transfer of energy from the polarizationwave to an electromagnetic wave at frequency 2ν1. The phase velocity and thewavelength of this electromagnetic wave are determined by n2ω, the index of re-fraction for the doubled frequency, that is, λ2 = c/2ν1n2ω. For efficient energytransfer it is necessary that the two waves remain in phase, which implies thatn1ω = n2ω. Since almost all materials have normal dispersion in the optical re-gion, the radiation will generally lag behind the polarization wave. The phase mis-match between the polarization wave and the electromagnetic wave for collinearbeams are usually expressed as the difference in wave number, �k = 2kω − k2ω,or
�k = 4π
λ1(n1ω − n2ω). (10.10)
If Maxwell’s equations are solved for a coupled fundamental and second-harmonic wave propagating in a nonlinear medium, then the ratio of the powergenerated at the second-harmonic frequency, to that incident at the fundamental,is given by [2]
P2ω
Pω= tanh2
[l K 1/2
(PωA
)1/2 sin �kl/2
�kl/2
], (10.11)

346 10. Nonlinear Devices
where
K = 2Z3ω21d2
eff, (10.12)
l is the length of the nonlinear crystal, A is the area of the fundamental beam,Z is the plane-wave impedance Z = √
µ0/ε0ε = 120π/n0[V/A], ω1 is thefrequency of the fundamental beam, and deff is the effective nonlinear coeffi-cient of the nonlinear polarizability tensor �(2) in (10.1). The dimension of deffin (10.12) is given in the MKS system and includes ε0, the permittivity of freespace, thus deff [As/V2]. Some authors exclude ε0 from the d coefficient, in thiscase d [As/V2] = 8.855 × 10⁻¹²d [m/V]. The conversion from the cgs system toMKS units becomes d [As/V2] = 3.68 × 10⁻¹⁵d [esu].
For low conversion efficiencies, (10.11) may be approximated by
P2ω
Pω= l2K
PωA
sin2 (�kl/2)
(�kl/2)2. (10.13)
For a given wavelength and a given nonlinear material, K is a constant. The con-version efficiency, therefore, depends on the length of the crystal, the power den-sity, and the phase mismatch. For a crystal of fixed length, the second-harmonicpower generation is strongly dependent on the phase mismatch expressed by thesinc2 function, as is illustrated in Fig. 10.1. In this case, a variation of�k was ob-tained by changing the crystal temperature. The harmonic power is at maximum
FIGURE 10.1. Second-harmonic generation as a function of temperature in aBa2NaNb5O15 crystal employed to frequency-double an Nd : YAG laser.

10.2. Harmonic Generation 347
when �k = 0, that is, at the exact phase-matching temperature. For a fixed �k,the second-harmonic power as a function of distance l along the crystal growsand decays with a period of �kl/2 = π. Half of this distance has been termedthe coherence length lc. It is the distance from the entrance face of the crystal tothe point at which the second-harmonic power will be at its maximum value. Thisparameter is not to be confused with the coherence length lc of the laser beam,which was defined in Chapter 5.
For normal incidence the coherence length is given by
lc = π/�k. (10.14)
Expressing the phase mismatch �k in terms of coherence length in (10.13) oneobtains
P2ω
Pω= l2
c K4
π2
PωA
sin2(πl
2lc
). (10.15)
The oscillatory behavior of (10.15) is shown in Fig. 10.2 for several values of lc.For the ideal case lc = ∞, the second-harmonic conversion efficiency is propor-tional to the square of the crystal length, at least in the small-signal approximation
P2ω
Pω= l2K
PωA. (10.16)
Clearly, if the crystal is not perfectly phase-matched (lc = ∞), the highestsecond-harmonic power we can expect to generate will be the signal obtainedafter the beam propagates one coherence length, no matter how long the crystal
FIGURE 10.2. Second-harmonic power conversion efficiency as a function of distance lfrom the entrance surface of a CDA crystal. Parameter is the coherence length lc (K =1.3 × 10⁻⁹ W−1; λ = 1.06µm; I = 100 MW/cm2).

348 10. Nonlinear Devices
is. The decrease in harmonic power, for example, between lc and 2lc, is explainedby a reversal of the power flow. Instead of power being coupled from the polariza-tion wave into the electromagnetic wave, it is coupled from the electromagneticwave into the polarization wave: that is, the power is coupled back into the inputbeam. Thus we find that the power oscillates back and forth between the harmonicand the fundamental wave.
In almost all practical cases the coherence length is limited by the beam diver-gence and the bandwidth of the laser beam and by angular and thermal deviationsof the crystal from the phase-matching angle and temperature.
10.2.2 Index Matching
With typical dispersion values in the visible region, the coherence length inmost crystals is limited to about 10µm. For this reason the intensity of second-harmonic power is small. Only if n1 can be made substantially equal to n2 willrelatively high efficiencies of frequency-doubled power be obtained.
An effective method of providing equal-phase velocities for the fundamentaland second-harmonic waves in the nonlinear medium utilizes the fact that disper-sion can be offset by using the natural birefringence of uniaxial or biaxial crystals.These crystals have two refractive indices for a given direction of propagation,corresponding to two allowed orthogonally polarized beams; by an appropriatechoice of polarization and direction of propagation it is often possible to obtain�k = 0. This is termed phase matching or index matching.
We shall restrict our discussion to that of uniaxial crystals. These crystals, towhich the very important nonlinear crystals KDP, and its isomorphs, and LiNbO3belong, have an indicatrix that is an ellipsoid of revolution with the optic axisbeing the axis of rotation, as shown in Fig. 10.3. The two directions of polar-ization and the indices for these directions are found as follows: We draw a line
FIGURE 10.3. Indicatrix ellipsoid of a uniaxial crystal. Also shown is a cross section per-pendicular to the light propagation direction P .
10.2. Harmonic Generation 349
through the center of the ellipsoid in the direction of beam propagation (line OPin Fig. 10.3). Then we draw a plane perpendicular to the direction of propagation.The intersection of this plane with the ellipsoid is an ellipse. The two axes of thisellipse are parallel to the two directions of polarization, and the length of eachsemiaxis is equal to the refractive index in that direction.
We now examine how the indices of refraction vary when the direction of prop-agation is changed. We notice that for the direction of polarization perpendicularto the optic axis, known as the ordinary direction, the refractive index is inde-pendent of the direction of propagation. For the other direction of polarization,known as the extraordinary direction, the index changes between the value of theordinary index n0 when OP is parallel to z, and the extraordinary index ne whenOP is perpendicular to z. When the wave propagation is in a direction � to theoptic axis, the refractive index for the extraordinary wave is given by [9]
ne(�) = none
[(no)2 sin2�+ (ne)2 cos2�]1/2, (10.17)
where the superscripts “o” and “e” refer to the ordinary and extraordinary rays.Changing the point of view, we look now at the shape of the wavefronts for
these two rays instead of their direction and polarization. Assuming that the inputis a monochromatic point source at O, the expanding wavefront for the o-rayis spherical, whereas the spreading wavefront for the e-ray is an ellipsoid. Thisproperty of crystals is described by the index surface, which has the property thatthe distance of the surface from the origin along the direction of the wave vectoris the refractive index. For a uniaxial crystal this surface has two sheets—a spherefor ordinary waves polarized perpendicular to the optic axis with index no, and anellipsoid for extraordinary waves with index ne(�). By definition the optic axis isthat direction at which the o- and e-rays propagate with the same velocity. If thevalue of ne −no is larger than zero, the birefringence is said to be positive, and forne −no smaller than zero the birefringence is negative; the corresponding crystalsare called positive or negative uniaxial. Figure 10.4 shows a cross section of theindex surface of a negative uniaxial crystal (for the moment we consider only thesolid lines no
1 and ne1). The complete surfaces are generated by rotating the given
sections about the z-axis. The wavefront velocity v and the refractive index no arerelated by v = c/no, where c is the velocity of light.
Both refractive indices no and ne are a function of wavelength. Figures 10.4and 10.5 illustrate how the dependence of the refractive index on beam direction,wavelength, and polarization can be utilized to achieve angle-tuned phase match-ing. The dashed lines in these figures show the cross section of the index surfacesn2 at the harmonic frequency. As can be seen, the negative uniaxial crystal hassufficient birefringence to offset dispersion, and the matching condition can besatisfied for a beam deviating from the z-axis by the angle �m.
The directions for phase-matched second-harmonic generation are obtained byconsidering the intersection of the index surfaces at the fundamental and harmonicfrequencies. As was mentioned earlier, frequency doubling may be considered

350 10. Nonlinear Devices
FIGURE 10.4. Cross section of the index surface of a negative uniaxial crystal for twodifferent wavelengths.
FIGURE 10.5. Direction for phase-matched second-harmonic generation (type-I) in a uni-axial crystal, where�m is the phase-matching angle measured from z and φ is the azimuthangle measured from x .

10.2. Harmonic Generation 351
as a special case, where two incident waves with electric fields Em and En areidentical waveforms. There are two types of processes in harmonic generation,depending on the two possible orientations for the linear polarization vectors ofthe incident beams. In the type-I process both polarization vectors are parallel: inthe type-II process the polarization vectors are orthogonal.
In a negative uniaxial crystal there are two loci where the index surfaces inter-sect and �k = 0 [11]
ne2(�m) = no
1 type-I, (10.18a)
ne2(�m) = 1
2 [ne1(�m)+ no
1] type-II, (10.18b)
first, in a symmetrical cone at �m (type-I) about the optic axis where two o-raysat ω are matched to an e-ray at 2ω; second, in a cone at �m (type-II) where ano-ray and an e-ray at ω are matched to an e-ray at 2ω.
The harmonic power is not independent of the azimuthal angle of the phase-matched direction (Fig. 10.5). In general, deff is a combination of one or severalcoefficients of �(2), and the angles � and φ that define the direction of the wavepropagation vector. For example, for KDP and its isomorphs and type-I indexmatching, one obtains
deff = d14 sin 2φ sin�m. (10.19)
The phase-matching angle �m is obtained by combining (10.17) and (10.18a)
sin2�m = (no1)
−2 − (no2)
−2
(ne2)
−2 − (no2)
−2. (10.20)
For frequency doubling of 1.05µm radiation, the beam propagation vector isat �m = 41◦ with respect to the optical axis of the KDP crystal and the azimuthangle is at 45◦ in type-I phase-matching. The fundamental beams, E j = Ek in(10.3), are polarized perpendicular to the optical axis (ordinary direction) and thefrequency doubled beam is polarized parallel to the optical axis of the crystal(extraordinary direction). The orientation of the beam propagation vector, polar-ization, and crystal axes is illustrated in Fig. 10.6(a) for the case of KDP.
For type-II phase-matching in KDP one obtains
deff = d14 cos 2φ sin 2�m. (10.21)
In this case the angle between the beam direction and the crystal axis is�m = 59◦and φ = 90◦ with respect to the x-axis. A single linearly polarized fundamentalbeam incident on the crystal may be equally divided into o- and e-rays by ori-enting the polarization vector at 45◦ with respect to the x-axis. The polarizationvector of the harmonic beam is rotated 45◦ from the fundamental beam with thepolarization parallel to the optical axis (see Fig. 10.6(b)).

352 10. Nonlinear Devices
FIGURE 10.6. Crystal and electric vector orientation for harmonic generation in KDP andits isomorphs for (a) Type-I and (b) Type-II phase-matching [12].
Comparing type-I and type-II phase-matching, we find that type-I is more fa-vorable when �m is near 90◦, whereas type-II leads to a higher deff when�m liesnear 45◦.
Critical Phase-Matching
The reason for not achieving the optimum second harmonic output from a par-ticular set-up is in many cases the divergence of the pump beam. For second-harmonic generation in a negative crystal we find from (10.10) that �k = 0 ifno
1 = ne2(�m), which is exactly true only at � = �m. In Section 10.1.2 it will
be shown that there is a linear relationship between small deviations δθ from the
10.2. Harmonic Generation 353
phase-matching angle and�k. The change of �k as a function of δθ can be largeenough to limit the conversion efficiency in real devices. Consider as an examplesecond-harmonic generation in KDP at 1.064 µm. The linear change in �k with� is sufficiently great to restrict the deviation from the phase-matched direction toapproximately 1.2 mrad if the coherence length is to be greater than 1 cm. Phase-matching under these unfavorable conditions is termed “critical phase-matching.”
Also if phase-matching is accomplished at an angle �m other than 90◦ withrespect to the optic axis of a uniaxial crystal, there will be double refraction.Therefore, the direction of power flow (Poynting vector) of the fundamental andsecond harmonics will not be completely collinear but occur at a small angle.
For a negative uniaxial crystal and type-I phase-matching, this angle is givenby [13]
tan � = (no1)
2
2
(1
(ne2)
2− 1
(no2)
2
)sin 2�. (10.22)
The angle � has the effect of limiting the effective crystal length over which har-monic generation can take place. The beams completely separate at a distance oforder
la = D/� (10.23)
called the aperture length where D is the beam diameter. Of course, at only afraction of this distance the reduction of conversion efficiency because walk-offbecomes noticeable and has to be taken into account.
For weakly focused Gaussian beams, the aperture length can be expressed as
la = w0√π/�, (10.24)
where w0 is the fundamental beam radius.
Noncritical Phase-Matching
If the refractive indices can be adjusted so that �m = 90◦, by variation of aparameter such as the temperature or chemical composition of the crystal, thedependence of �k on beam divergence or angular misalignment δθ is due to amuch smaller quadratic term, instead of a linear relationship as is the case incritical phase-matching.
For example, second-harmonic generation in LiNbO3 occurs at 90◦ for 1.064µm radiation provided the crystal is at a temperature of ≈ 107◦ C (for a crystaldoped with 5% MgO). The allowable departure from the phase-matched directionis greater than 26 mrad if the coherence length is to be 1 cm. For these reasons,90◦ phase-matching is often called noncritical phase-matching. Provided that no
1and ne
2 are nearly equal and d(no1 − ne
2)/dT = 0, noncritical phase-matching canbe achieved by temperature tuning the crystal.
In addition, at�m = 90◦ there are no walk-off effects due to double refraction.
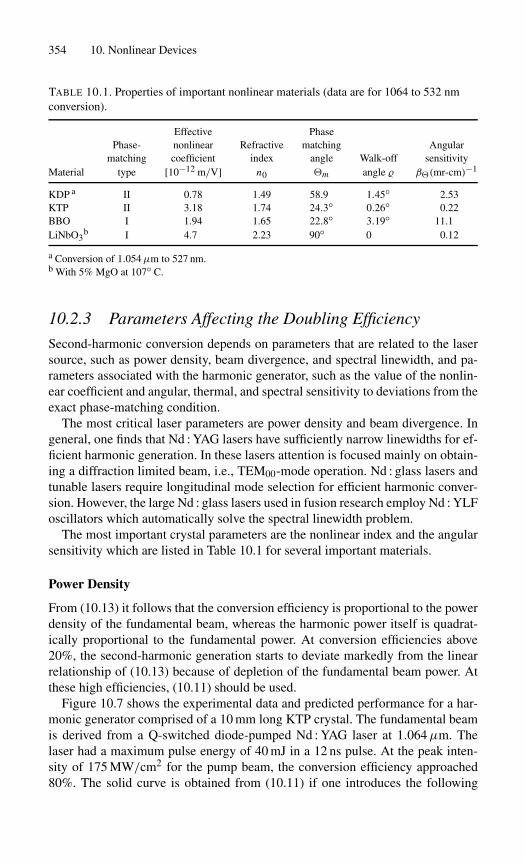
354 10. Nonlinear Devices
TABLE 10.1. Properties of important nonlinear materials (data are for 1064 to 532 nmconversion).
Effective PhasePhase- nonlinear Refractive matching Angular
matching coefficient index angle Walk-off sensitivityMaterial type [10−12 m/V] n0 �m angle � β�(mr-cm)−1
KDP a II 0.78 1.49 58.9 1.45◦ 2.53KTP II 3.18 1.74 24.3◦ 0.26◦ 0.22BBO I 1.94 1.65 22.8◦ 3.19◦ 11.1LiNbO3
b I 4.7 2.23 90◦ 0 0.12
a Conversion of 1.054µm to 527 nm.b With 5% MgO at 107◦ C.
10.2.3 Parameters Affecting the Doubling Efficiency
Second-harmonic conversion depends on parameters that are related to the lasersource, such as power density, beam divergence, and spectral linewidth, and pa-rameters associated with the harmonic generator, such as the value of the nonlin-ear coefficient and angular, thermal, and spectral sensitivity to deviations from theexact phase-matching condition.
The most critical laser parameters are power density and beam divergence. Ingeneral, one finds that Nd : YAG lasers have sufficiently narrow linewidths for ef-ficient harmonic generation. In these lasers attention is focused mainly on obtain-ing a diffraction limited beam, i.e., TEM00-mode operation. Nd : glass lasers andtunable lasers require longitudinal mode selection for efficient harmonic conver-sion. However, the large Nd : glass lasers used in fusion research employ Nd : YLFoscillators which automatically solve the spectral linewidth problem.
The most important crystal parameters are the nonlinear index and the angularsensitivity which are listed in Table 10.1 for several important materials.
Power Density
From (10.13) it follows that the conversion efficiency is proportional to the powerdensity of the fundamental beam, whereas the harmonic power itself is quadrat-ically proportional to the fundamental power. At conversion efficiencies above20%, the second-harmonic generation starts to deviate markedly from the linearrelationship of (10.13) because of depletion of the fundamental beam power. Atthese high efficiencies, (10.11) should be used.
Figure 10.7 shows the experimental data and predicted performance for a har-monic generator comprised of a 10 mm long KTP crystal. The fundamental beamis derived from a Q-switched diode-pumped Nd : YAG laser at 1.064µm. Thelaser had a maximum pulse energy of 40 mJ in a 12 ns pulse. At the peak inten-sity of 175 MW/cm2 for the pump beam, the conversion efficiency approached80%. The solid curve is obtained from (10.11) if one introduces the following

10.2. Harmonic Generation 355
FIGURE 10.7. Second-harmonic conversion efficiency versus power density for a KTPcrystal pumped by a Q-switched Nd : YAG laser at 1.06µm.
system parameters: crystal length l = 10 mm, effective nonlinear coefficientdeff = 3.2 pm/V, and fundamental wavelength λ1 = 1.064µm. The fundamentalbeam was a weakly focused Gaussian beam with a spot radius of w0 = 0.75 mm.The beam area is therefore A = πw2
0 = 1.8 × 10⁻² cm2.As will be demonstrated in the next section, phase-mismatch can be ex-
pressed as �k = β�(��/2), where β� is the angular sensitivity and ��is the beam divergence of the fundamental beam. From Table 10.1 followsβ� = 0.2 (mrad cm)−1 for KTP at 1.06µm and type-II phase-matching. Thebeam divergence of the weakly focused beam was about 22 mrad from whichfollows �k = 2.4 cm−1. The value of K listed in Fig. 10.7 is obtained byintroducing the parameters for KTP from Table 10.1 into (10.12).
Walk-off reduces the region of overlap between the beams, thus reducing theeffective gain length of the crystal. From (10.19) we obtain for the aperture lengthla = 290 mm if we use the beam walk-off angle from Table 10.1. Since the aper-ture length is large compared to the crystal length, double refraction has only anegligible effect on the conversion efficiency.
The theoretical doubling efficiency calculated using (10.11) gives quite ac-ceptable agreement with the experimental data. As expected, the theory predictshigher efficiency than can be achieved in practice due to the imperfect nature ofthe pump beam and crystal quality.
Beam Divergence
When collinear phase-matched second-harmonic generation is used, the lightwaves will have a small but finite divergence. It is necessary to consider the mis-

356 10. Nonlinear Devices
match �k of the wave vector for small deviations δ� from the phase-matcheddirection. An expansion for no
1 − ne2(�) taken for a direction close to the perfect
phase-matching direction �m yields
no1 − ne
2(�) = ∂[no1 − ne
2(�)]∂�
(�−�m). (10.25)
The expression given in (10.17) for the dependence of ne2 on the angular direction
in the crystal can be very well approximated by [14]
ne2(�) = no
2 − (no2 − ne
2) sin2�. (10.26)
Introducing (10.26) into (10.25) gives
no1 − ne
2(�) = δ�(no2 − ne
2) sin 2�m, (10.27)
where we note that ∂no1/∂� = 0 and ∂no
2/∂� = 0.Introducing (10.27) into (10.10) yields
�k = β� δ�′ = β�(��/2) (10.28)
where
β� = 4π
λ1n01
(no2 − ne
2) sin 2�m (10.29)
is a material constant and expresses the angular sensitivity of the crystal, and��is the full angle of the pump beam. The expression for β� has been divided by n0
1,because δ�′ is the angular misalignment measured external to the crystal.
Under noncritical phase-matching conditions (�m = 90◦), we can make theapproximation sin 2(90◦ + δ�) ≈ 2δ� and, instead of (10.29), we obtain
β� = 4π
λ1(no1)
2(no
2 − ne2)��. (10.30)
Properties of Nonlinear Crystals
Table 10.1 lists parameters for several important nonlinear materials for 1064 to532 nm conversion. Frequency doubling of neodymium lasers is one of the majorapplications of harmonic generation.
Since KDP is rather easily grown from a water solution, crystals with crosssections of 30 cm square have been produced. Because of the availability of largeaperture harmonic crystal assemblies, KDP is the material of choice for the largeNd : glass lasers employed in fusion research. Despite the lower nonlinear coeffi-cient of KDP compared to other nonlinear crystals, conversion efficiencies as highas 80% have been obtained. A high-conversion efficiency is actually the result ofmaterial properties as well as pump source characteristics, the high-peak power,narrow spectral bandwidth, small beam divergence, and clean spatial and tem-
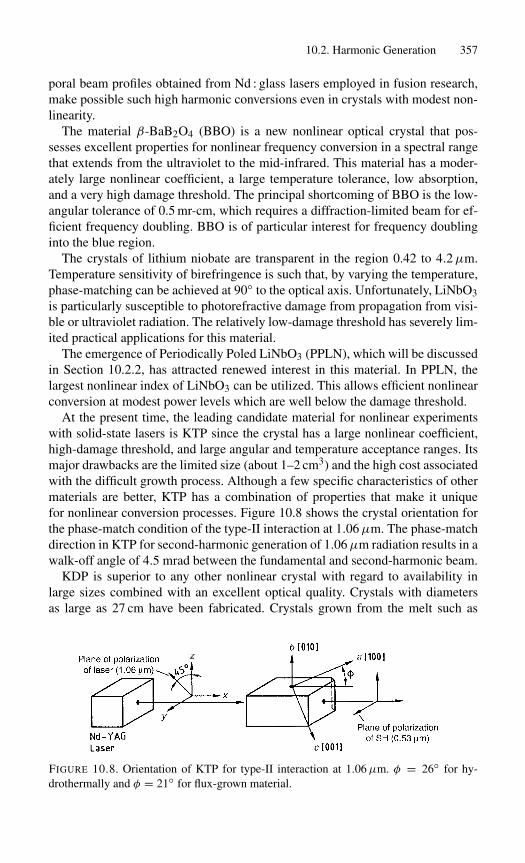
10.2. Harmonic Generation 357
poral beam profiles obtained from Nd : glass lasers employed in fusion research,make possible such high harmonic conversions even in crystals with modest non-linearity.
The material β-BaB2O4 (BBO) is a new nonlinear optical crystal that pos-sesses excellent properties for nonlinear frequency conversion in a spectral rangethat extends from the ultraviolet to the mid-infrared. This material has a moder-ately large nonlinear coefficient, a large temperature tolerance, low absorption,and a very high damage threshold. The principal shortcoming of BBO is the low-angular tolerance of 0.5 mr-cm, which requires a diffraction-limited beam for ef-ficient frequency doubling. BBO is of particular interest for frequency doublinginto the blue region.
The crystals of lithium niobate are transparent in the region 0.42 to 4.2µm.Temperature sensitivity of birefringence is such that, by varying the temperature,phase-matching can be achieved at 90◦ to the optical axis. Unfortunately, LiNbO3is particularly susceptible to photorefractive damage from propagation from visi-ble or ultraviolet radiation. The relatively low-damage threshold has severely lim-ited practical applications for this material.
The emergence of Periodically Poled LiNbO3 (PPLN), which will be discussedin Section 10.2.2, has attracted renewed interest in this material. In PPLN, thelargest nonlinear index of LiNbO3 can be utilized. This allows efficient nonlinearconversion at modest power levels which are well below the damage threshold.
At the present time, the leading candidate material for nonlinear experimentswith solid-state lasers is KTP since the crystal has a large nonlinear coefficient,high-damage threshold, and large angular and temperature acceptance ranges. Itsmajor drawbacks are the limited size (about 1–2 cm3) and the high cost associatedwith the difficult growth process. Although a few specific characteristics of othermaterials are better, KTP has a combination of properties that make it uniquefor nonlinear conversion processes. Figure 10.8 shows the crystal orientation forthe phase-match condition of the type-II interaction at 1.06µm. The phase-matchdirection in KTP for second-harmonic generation of 1.06µm radiation results in awalk-off angle of 4.5 mrad between the fundamental and second-harmonic beam.
KDP is superior to any other nonlinear crystal with regard to availability inlarge sizes combined with an excellent optical quality. Crystals with diametersas large as 27 cm have been fabricated. Crystals grown from the melt such as
FIGURE 10.8. Orientation of KTP for type-II interaction at 1.06µm. φ = 26◦ for hy-drothermally and φ = 21◦ for flux-grown material.
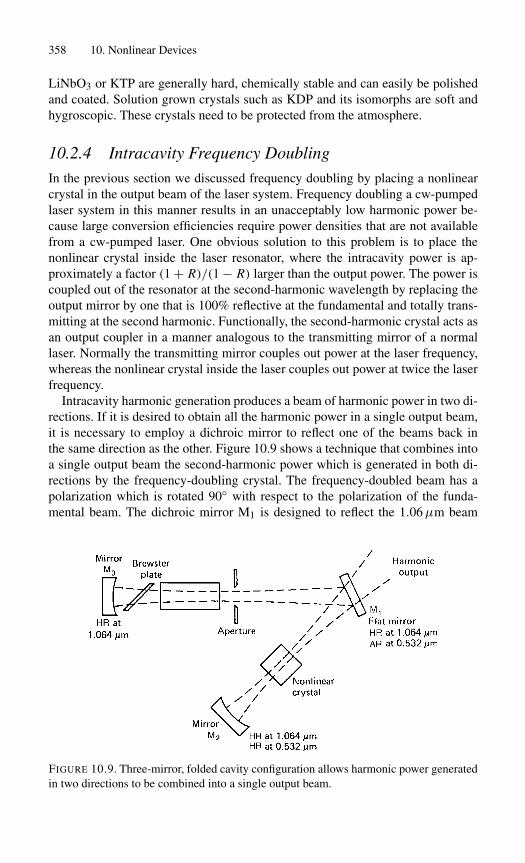
358 10. Nonlinear Devices
LiNbO3 or KTP are generally hard, chemically stable and can easily be polishedand coated. Solution grown crystals such as KDP and its isomorphs are soft andhygroscopic. These crystals need to be protected from the atmosphere.
10.2.4 Intracavity Frequency Doubling
In the previous section we discussed frequency doubling by placing a nonlinearcrystal in the output beam of the laser system. Frequency doubling a cw-pumpedlaser system in this manner results in an unacceptably low harmonic power be-cause large conversion efficiencies require power densities that are not availablefrom a cw-pumped laser. One obvious solution to this problem is to place thenonlinear crystal inside the laser resonator, where the intracavity power is ap-proximately a factor (1 + R)/(1 − R) larger than the output power. The power iscoupled out of the resonator at the second-harmonic wavelength by replacing theoutput mirror by one that is 100% reflective at the fundamental and totally trans-mitting at the second harmonic. Functionally, the second-harmonic crystal acts asan output coupler in a manner analogous to the transmitting mirror of a normallaser. Normally the transmitting mirror couples out power at the laser frequency,whereas the nonlinear crystal inside the laser couples out power at twice the laserfrequency.
Intracavity harmonic generation produces a beam of harmonic power in two di-rections. If it is desired to obtain all the harmonic power in a single output beam,it is necessary to employ a dichroic mirror to reflect one of the beams back inthe same direction as the other. Figure 10.9 shows a technique that combines intoa single output beam the second-harmonic power which is generated in both di-rections by the frequency-doubling crystal. The frequency-doubled beam has apolarization which is rotated 90◦ with respect to the polarization of the funda-mental beam. The dichroic mirror M1 is designed to reflect the 1.06µm beam
FIGURE 10.9. Three-mirror, folded cavity configuration allows harmonic power generatedin two directions to be combined into a single output beam.

10.2. Harmonic Generation 359
completely and transmit virtually all the orthogonally polarized 0.53µm beam.Mirror M2 is a 100% reflector for both 1.06 and 0.53µm mirrors. In this way theforward and reverse green beams are combined into one.
The steady-state condition for intracavity doubling can be determined if weequate the round-trip saturated gain of the laser to the sum of the linear and non-linear losses [15]
2g0l∗
1 + I/Is= δ + K ′ I, (10.31)
where g0 is the unsaturated gain coefficient, l∗ is the length of the laser medium,I is the power density in the laser rod, and Is is the saturation power density ofthe active material. All linear losses occurring at the fundamental frequency arelumped together into the parameter δ, the quantity K ′ I is the nonlinear loss. Thenonlinear coupling factor K ′, defined by
I (2ω) = K ′ I 2(ω), (10.32)
is related to K in (10.12); it is K ′ = (Icrys/Irod)l2K , where (Icrys/Irod) accountsfor different power densities in the laser rod and nonlinear crystal in the case offocused beams, and l is the crystal length.
From the theoretical treatment of intracavity doubling, it follows that a maxi-mum value of second-harmonic power is found when
K ′max = δ
Is. (10.33)
The magnitude of the nonlinearity required for optimum second-harmonic pro-duction is proportional to the loss, inversely proportional to the saturation density,and independent of the gain. Thus, for a given loss, optimum coupling is achievedfor all values of gain and, hence, all power levels. As we recall from Chapter 3, ina laser operating at the fundamental wavelength the optimum output coupling ofthe front mirror is gain-dependent. The usefulness of (10.33) stems from the factthat by introducing the material parameters for a particular crystal into (10.12)and combining with (10.33) the optimum length of the nonlinear crystal is ob-tained. For example, from (10.12) we obtain K = 5.1 × 10⁻⁸ W−1 for KTP andλ = 1.064µm. With a saturation flux of 2.9 kW/cm2 for Nd : YAG and assuminga 2% linear cavity loss, we obtain from (10.33) a nonlinear coupling factor ofK ′
max = 0.69 × 10⁻⁵ cm2/W. Focusing the intracavity beam to achieve a fluxenhancement of (Icrys/Irod) = 24, a crystal 2.4 cm long would be required tooptimally couple the second harmonic from the laser.
As an example, the performance of a typical intracavity doubled Nd : YAG laseris illustrated in Fig. 10.10. The output at the harmonic wavelength is compared tothe TEM00 output available at 1.064µm from the same laser. The Nd : YAG laseremployed in these experiments was cw-pumped by diode arrays and intracavitydoubled with KTP. After measuring the output at 1.064µm, a KTP crystal wasinserted in the folded resonator (similar to the arrangement shown in Fig. 10.9)

360 10. Nonlinear Devices
FIGURE 10.10. Comparison of fundamental and second harmonic output from a cw-pumped intracavity frequency-doubled Nd : YAG laser for different KTP crystal lengths.
and the output coupler was replaced with a mirror of high reflectivity at 1.064 and0.53µm. For the short crystals, the nonlinear coupling factor K ′ is too small andfar from optimum. A higher output at 532 nm would require an increase of inten-sity by tighter focusing of the beam. However, this makes alignment very criticaland sacrifices mechanical and thermal stability of the laser. A longer nonlinearcrystal is therefore a better solution. However, a 15 mm long crystal is about thelongest crystal available for KTP.
From the theory presented in [15] it follows that if the loss due to the insertedsecond-harmonic crystal is small compared to the total internal loss, the value ofK ′ is the same for fundamental and second-harmonic output coupling. Also, themaximum second-harmonic power equals the fundamental power obtainable fromthe same laser.
In most systems, the second-harmonic power is considerably below the outputpower that can be achieved at the fundamental wavelength. Insertion losses ofthe nonlinear crystal, or any other additional intracavity element, are often thereason for the poor performance, or in the case of Nd : YAG, thermally induceddepolarization losses can have a major effect.
10.2.5 Third-Harmonic Generation
Efficient conversion of the output of a laser to the third harmonic is possible byinvoking a two-step process, namely second harmonic generation followed byfrequency mixing. In the first crystal (“doubler”) some fraction of the fundamen-tal radiation is converted to the second harmonic, followed by a second crystal

10.2. Harmonic Generation 361
(“tripler”), in which unconverted fundamental radiation is mixed with the secondharmonic to produce the third harmonic.
The optimum situation is achieved if, for three photons at the fundamental fre-quency ω entering the first crystal, two photons are converted to create a photonat 2ω, and the third photon at ω is combined in the second crystal with the 2ωphoton to produce one 3ω photon. The 1 = 1 mix of an ω and a 2ω photon atthe exit of the doubling crystal represents a 67% conversion efficiency. Given thisratio, in a lossless and perfectly matched crystal, a complete conversion of thefundamental beam to the third harmonic is theoretically possible.
Third-harmonic generation is very important for frequency up-conversion ofhigh-energy Nd : glass lasers employed in fusion research. In these lasers the fre-quency converters are constructed from two type-II potassium dihydrogen phos-phate (KDP) crystals arranged in tandem. As illustrated in Fig. 10.6(b), in con-ventional type-II doubling in KDP the polarization vector of the incoming beam isoriented at 45◦ with respect to the x-axis. In this case an equal number of photonsare incident along the ordinary and extraordinary directions that may combine onefor one to create a second harmonic photon in the extraordinary direction.
In order to optimize the production of the third harmonic, the doubling crystal isoriented at an angle of tan−1(1/
√2) = 35◦ with respect to the x-axis of the KDP
crystal. This ensures that two photons in the ordinary direction are incident forevery photon in the extraordinary direction. Each e-photon will combine with oneo-photon to produce an e-photon at 2ω, leaving one o-photon at ω unconverted.The doubler output of one o-photon atω and one e-photon at 2ω provides the inputto the frequency mixing second crystal. This situation is depicted in Fig. 10.11(a).
Third-harmonic generation has been analyzed starting with the general equa-tion governing frequency mixing [16]
d E1/dz = − j K1 E3 E∗2 exp(− j �k · z)− 1
2γ1 E1,
d E2/dz = − j K2 E3 E∗1 exp(− j �k · z)− 1
2γ2 E2, (10.34a)
d E3/dz = − j K3 E1 E2 exp( j �k · z)− 12γ3 E3.
Here the E j ’s are the complex electric vectors of waves propagating in thez-direction with frequencies ω j , where ω3 = ω1+ ω2. The electric field of wave jis the real part of E j exp(iω j t−ik j z), and the phase mismatch�k = k3−(k1+k2)
is proportional to the deviation �θ of the beam path from the phase-matchingdirection. The γ j ’s are absorption coefficients. For tripling, ω2 = 2ω1, ω3 = 3ω1,K2 � 2K1, and K3 � 3K1 where
K1 = ω1d36
2cε0(n2ωn3ω)
−1/2 sin rθm, (10.34b)
r = 1 or 2 for type-I or type-II interactions and θm is the corresponding phase-matching angle. The solution of such an analysis for the phase-matched case(�k = 0) of a type-II KDP crystal is shown in Fig. 10.11(b). The curves have

362 10. Nonlinear Devices
ω
ωω ωω
ω2
3
Type-II tripler
Type-IIdoubler
e
o
o
e
(a)
(b)
FIGURE 10.11. Frequency tripling. (a) Orientation of polarization vectors for optimumthird-harmonic generation. (b) Tripling efficiency of a 9 mm thick phase-matched KDPtype-II crystal as a function of total input intensity, for various percentages M of the sec-ond harmonic in the input. A small absorption of 0.04 cm−1 is included for the fundamen-tal [16].
been calculated assuming a value of K1 = 1.4 × 10⁻⁶V−1, an absorption coeffi-cient of γ = 0.09 cm−1 at 1.054µm, and a crystal thickness of 9 mm.
The parameter M is the ratio of second-harmonic power to total power in thetripler
M = P2ω/(Pω + P2ω). (10.35)
If one ignores the small absorption in the doubling crystal, then M is essentiallythe conversion efficiency of the doubler. If the input photons at ω and 2ω are

10.3. Parametric Oscillators 363
matched 1 : 1, then P2ω = 2Pω and M = 0.67. In principle, complete conversionof the input beams to the third harmonic can be achieved.
A deviation from the optimum photon ratio results in a reduction of the peakconversion efficiency, which is approximately proportional to the ratio of the ac-tual M value and M = 0.67. Also, as can be seen from Fig. 10.11(b) the crystalthickness and beam intensity have to be carefully matched to avoid back con-version of energy. For values other than M = 0.67, after a ray has propagatedan optimum distance zopt into the crystal, the number of photons in one of thecomponents depletes to zero, and as z increases beyond zopt the mixing processreverses and the third-harmonic radiation reconverts.
10.3 Parametric Oscillators
As was mentioned at the beginning of this chapter, two beams with different fre-quencies incident on a nonlinear crystal will generate a traveling polarizationwave at the difference frequency. Provided the polarization wave travels at thesame velocity as a freely propagating electromagnetic wave, cumulative growthwill result. For reasons that will soon become clear, the two incident beams aretermed “pump” and “signal” waves having a frequency of νp and νs, and the re-sulting third wave is termed an “idler” wave with frequency νi. Under properconditions, the idler wave can mix with the pump beam to produce a travelingpolarization wave at the signal frequency, phased such that growth of the signalwave results. The process continues with the signal and idler waves both growing,and the pump wave decaying as a function of distance in the crystal.
Since each pump photon with energy hνp is generating a photon at the signal(hνs) and idler frequency (hν i), energy conservation requires that
1
λp= 1
λs+ 1
λi. (10.36)
In order to achieve significant parametric amplification, it is required that at eachof the three frequencies the generated polarization waves travel at the same ve-locity as a freely propagating electromagnetic wave. This will be the case if therefractive indices of the material are such that the k vectors satisfy the momentum-matching condition kp = ks + ki. For collinearly propagating waves this may bewritten as
np
λp− ns
λs− ni
λi= 0, (10.37)
where ns, ni, and np are the refractive indices at the signal, idler, and pump fre-quency, respectively.
Since the three indices of refraction depend on the wavelength, the directionof propagation in the crystal, and on the polarization of the waves, it is generallypossible, by using birefringence and dispersion, to find conditions under which(10.37) is satisfied.
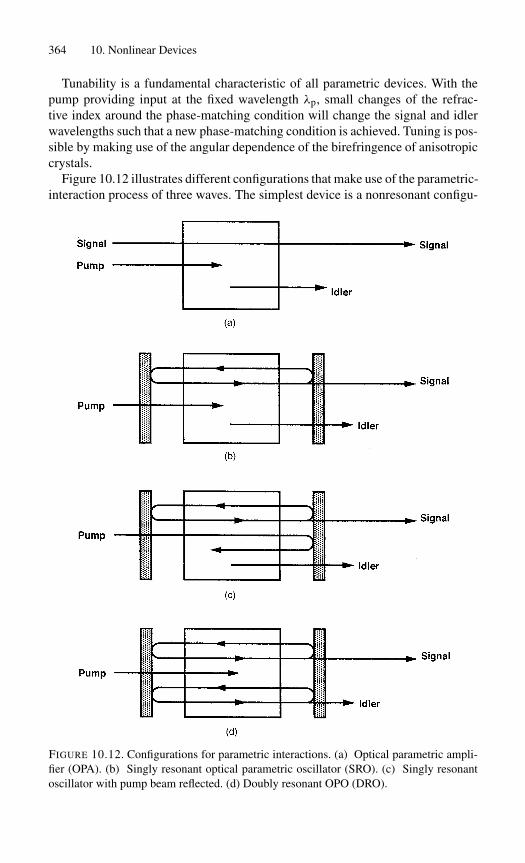
364 10. Nonlinear Devices
Tunability is a fundamental characteristic of all parametric devices. With thepump providing input at the fixed wavelength λp, small changes of the refrac-tive index around the phase-matching condition will change the signal and idlerwavelengths such that a new phase-matching condition is achieved. Tuning is pos-sible by making use of the angular dependence of the birefringence of anisotropiccrystals.
Figure 10.12 illustrates different configurations that make use of the parametric-interaction process of three waves. The simplest device is a nonresonant configu-
FIGURE 10.12. Configurations for parametric interactions. (a) Optical parametric ampli-fier (OPA). (b) Singly resonant optical parametric oscillator (SRO). (c) Singly resonantoscillator with pump beam reflected. (d) Doubly resonant OPO (DRO).

10.3. Parametric Oscillators 365
ration, namely an optical parametric amplifier (OPA) exhibited in Fig. 10.12(a).In this case, a pump beam and a signal beam are present at the input. If the outputof a Q-switched laser is focused into the crystal and if the intensity of the pump issufficiently high, and phase-matching conditions are met, gain is obtained for thesignal wave and at the same time an idler wave is generated. Typically, an OPAis used if the signal obtained from an optical parametric oscillator (OPO) is tooweak and further amplification is desired.
The most common optical parametric device is the singly resonant oscillatordepicted in Figs. 10.12(b) and (c). In this device, the crystal is located inside aresonator that provides feedback at either the signal or idler frequency. In theexample illustrated, the pump beam enters through a mirror that is highly trans-mitting at the pump wavelength and highly reflective for the signal wavelength. InFig. 10.12(b) the opposite mirror, which is the output coupler, has typically 80–95% reflectivity for the signal wavelength, and high transmission for the idler andpump beam. Only the signal wavelength is resonant in the cavity, and a small frac-tion is coupled out through the front mirror. In the configuration in Fig. 10.12(c)the pump beam is reflected at the output mirror and makes one return pass throughthe crystal. Since the input mirror through which the pump enters is highly trans-missive for this wavelength, no resonance condition is set up for the pump wave-length. However, threshold is lowered, because on the return path the pump beamprovides gain for the resonant signal wave.
Figure 10.12(d) depicts a doubly resonant oscillator (DRO), which providesfeedback at both the signal and idler wavelengths. The double-resonance condi-tion, in which both the signal and the idler waves are simultaneously resonantwithin the optical cavity, lowers the threshold significantly. However, this advan-tage of a DRO is off-set by a reduction in stability and tunability. Maintainingthe doubly resonant condition in a common resonator requires that the pump besingle frequency and stable, and that the OPO cavity length be actively controlledto maintain the resonance condition. The considerably lower threshold of a DROmakes it possible to obtain parametric gain at the low-power densities achievableunder cw conditions.
10.3.1 Performance Modeling
Of greatest interest for the design of parametric devices are simple models thatdescribe gain, threshold, phase-matching, and conversion efficiency as a functionof device and input parameters.
For the amplifier depicted in Fig. 10.12(a) a parametric gain coefficient for theamplification of the signal wave can be defined [17]
g = √κ Ip, (10.38)
where Ip is the pump flux and κ is a coupling constant,
κ = 8π2d 2eff
λsλinsninpε0c. (10.39)

366 10. Nonlinear Devices
The effective nonlinear coefficient deff connects the pump, signal, and idler fields.The parameters np, ns, ni and λs and λi are the refractive indices of the threewaves, and the wavelengths of the signal and idler waves, respectively.
The single-pass power gain of the parametric amplifier in the high-gain limitcan be approximated by
G = 14 exp(2gl), (10.40)
where l is the length of the crystal.A phase-mismatch between the waves can be expressed by
�k = kp − ks − ki, (10.41)
where k j = 2πn j/λ j , with j = p, s, i, are the propagation constants of the threewaves.
In the presence of phase-mismatch, the gain coefficient is reduced according to
geff =[
g2 −(
12 �k
)2]1/2
. (10.42)
The reduction of gain resulting from momentum or phase-mismatch is clearlyevident. Maximum gain is achieved for �kl = 0. Typical values for the couplingconstant are on the order of κ = 10−8/W, as will be discussed later. Therefore,a power density of at least 100 MW/cm2 is required to obtain a gain coefficientof g = 1 cm−1 and a modest power gain of G = 1.8 in a 1 cm long crystal. At a1µm wavelength, the propagation constant is k ≈ 105/cm in a material with ann = 1.7 refractive index. In order to minimize the effect of phase-mismatch, werequire from (10.42) that �k/2 < g. This means that the propagation constantshave to be phase-matched to better than 10−5/cm.
From these very basic considerations, one can already draw several conclu-sions that govern the design of parametric devices. The optimum configuration ofa parametric converter depends critically on the pump intensity in the nonlinearcrystal. There is a strong incentive to operate at the highest attainable levels fora given pump source. However, the practical and acceptable pump intensity de-pends strongly on the optical damage threshold of the crystal and its coatings. Theimportance of a high nonlinear coefficient deff is also clearly evident from theseequations, as is the detrimental effect of phase-mismatch.
Figure 10.13 shows an optical schematic of an OPO designed to generate out-put at the eye-safe wavelength of 1.6µm. The OPO contains a 15 mm long KTPcrystal as the nonlinear material which is pumped by a Q-switched Nd : YAG laserat 1.064µm. The maximum output energy of the pump laser was 10 mJ, producedin a 50 ns pulse. The crystal was positioned to achieve type-II noncritical phase-matching for a pump wavelength of 1.06µm (Nd : YAG) and a signal wavelengthnear 1.6µm; the idler wavelength was therefore near 3.2µm. Noncritical phase-matching maximizes the effective nonlinear coefficient and essentially eliminateswalk-off. The crystal was positioned inside an optical cavity formed by a pair

10.3. Parametric Oscillators 367
FIGURE 10.13. Plane-parallel resonator for optical parametric oscillator, showing mode-matching of focussed pump to OPO cavity mode.
of plane-parallel mirrors. The input mirror, through which the pump enters, wasantireflection coated at the pump wavelength (1.06µm) and highly reflecting atthe signal wavelength (1.6µm); while the output mirror was highly reflecting atthe pump wavelength and 10% transmitting at the signal wavelength. The laseroutput was focused by a 100 cm focal length lens, carefully positioned so as tomode-match the waist of the pump to the cavity mode of the OPO resonator.
In this noncritically phase-matched configuration the wavelengths are λs =1.61µm, λi = 3.2µm, λp = 1.06µm, and the respective indices of refraction arens = 1.7348, ni = 1.7793, and np = 1.7474. The effective nonlinear coefficientof KTP for parametric conversion (as well as type-II harmonic generation) can beapproximated as follows [18]
deff ≈ (d24 − d15) sin 2φ sin 2θ − (d15 sin2 φ + d24 cos2 φ) sin θ, (10.43)
which reduces to |deff| = 0.15d15 + 0.84d24 for θ = 90◦ and φ = 23◦. With thevalues of d24 = 3.64 pm/V and d15 = 1.91 pm/V, one obtains deff ≈ 3.3 pm/V.Using these parameters we calculate from (10.39) κ = 1.2 × 10⁻⁸ W−1.
Saturation and Pump Beam Depletion
When the Q-switched pump pulse is incident on the nonlinear crystal, the signaland ideal waves are amplified from the initial noise level. The number of roundtrips in the optical cavity necessary to amplify the signal and idler waves, multi-plied by the cavity round-trip time, determines the delay in achieving threshold.This build-up time, required to achieve parametric oscillation, causes a temporalcompression of the OPO output with respect to the pump pulse. Above threshold,after a short transition period during which a steady-state condition is established,the pump power is limited at the threshold value. Any pump input power abovethreshold is divided into power at the signal and idler beams. Since ν3 = ν1 + ν2,it follows that for each input pump photon above threshold, one photon at thesignal and idler wavelengths is generated.
The oscilloscope trace in Fig. 10.14, taken from the OPO described on theprevious pages, shows the dynamics of signal generation very nicely. The dashedcurve is the input pump pulse. The two solid curves display the signal pulse andthe depleted pump pulse at the output of the OPO. During the early part of the
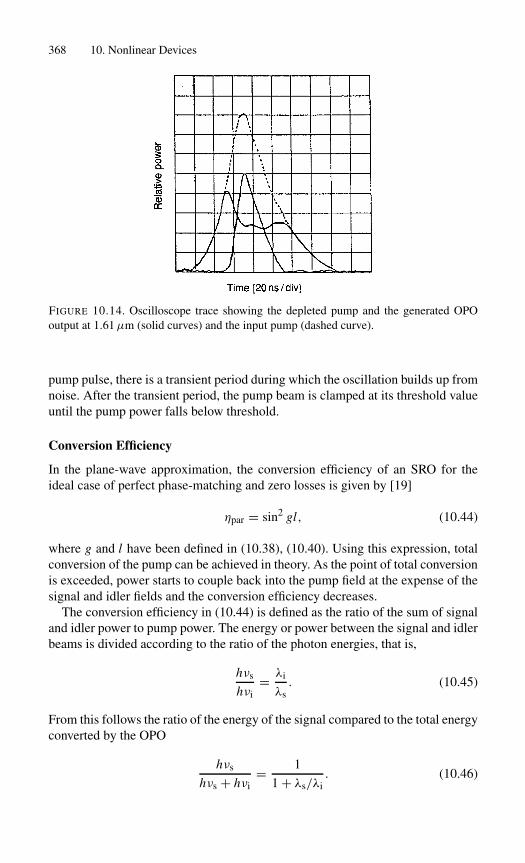
368 10. Nonlinear Devices
FIGURE 10.14. Oscilloscope trace showing the depleted pump and the generated OPOoutput at 1.61µm (solid curves) and the input pump (dashed curve).
pump pulse, there is a transient period during which the oscillation builds up fromnoise. After the transient period, the pump beam is clamped at its threshold valueuntil the pump power falls below threshold.
Conversion Efficiency
In the plane-wave approximation, the conversion efficiency of an SRO for theideal case of perfect phase-matching and zero losses is given by [19]
ηpar = sin2 gl, (10.44)
where g and l have been defined in (10.38), (10.40). Using this expression, totalconversion of the pump can be achieved in theory. As the point of total conversionis exceeded, power starts to couple back into the pump field at the expense of thesignal and idler fields and the conversion efficiency decreases.
The conversion efficiency in (10.44) is defined as the ratio of the sum of signaland idler power to pump power. The energy or power between the signal and idlerbeams is divided according to the ratio of the photon energies, that is,
hνs
hνi= λi
λs. (10.45)
From this follows the ratio of the energy of the signal compared to the total energyconverted by the OPO
hνs
hνs + hνi= 1
1 + λs/λi. (10.46)

10.3. Parametric Oscillators 369
In the so-called degenerate mode, for which λs = λi = 2λp, each pump photongenerates two photons at twice the pump wavelength. In this case, two orthogo-nally polarized beams at the same wavelength are emitted from the OPO.
Phase-Matching
In order to achieve significant gain in the parametric device, the pump, signal, andidler waves have to be phase-matched according to (10.37). In a medium withoutdispersion, all waves propagate with the same velocity, hence �k = 0. In real-ity, �k is not zero for different wavelengths, and just as in harmonic generation,dispersion is compensated for by birefringence. The index of refraction at a givenwavelength is a function of the direction of propagation in the crystal as well asorientation of polarization.
When the signal and idler waves are both ordinary rays, one has type-I phase-matching. When either one is an ordinary ray, it is referred to as type-II phase-matching.
In a uniaxial crystal, if the signal and idler are ordinary rays (type I) with indicesof refraction ns and ni, then the index of refraction for the pump wave necessaryto achieve phase-matching is
np = (λp/λs)ns = (λp/λi)ni. (10.47)
In uniaxial crystals, the index of refraction no for an extraordinary wave propa-gating at an angle θ to the optic axis is given by
1
n(θ)2= cos2 θ
(no)2+ sin2 θ
(ne)2, (10.48)
where no and ne are the ordinary and extraordinary indices of refraction, respec-tively. The index n0 is thus limited by no and ne. If np falls between no and ne,then an angle θm exists for which n0 = np. Propagation with �k = 0 results, andall three waves travel at the phase-matching angle �m with respect to the opticalaxis.
Phase-matching with a propagation direction normal to the optic axis (90◦phase-matching) is preferred if possible. In that direction, the double refractionangle is zero and the nonlinear interaction is not limited by the effective gainlength but by the crystal’s physical length. Non-90◦ phase-matching does, how-ever, allow angle tuning.
Tuning curves for parametric oscillators can be determined by solving thephase-matching equations (10.36), (10.37) for signal and idler frequencies at agiven pump frequency as a function of the tuning variable. The most commontuning method is varying the direction of propagation with respect to the crystalaxes. To carry out the calculations, the indices of refraction must be known overthe entire tuning range. For most nonlinear crystals of interest, the indices can beobtained from the Sellmeier equation.

370 10. Nonlinear Devices
FIGURE 10.15. Tuning range of an OPO pumped by a 1.06µm neodymium laser andemploying a type-II KTP crystal.
Figure 10.15 exhibits the calculated phase-matching angles for a KTP opti-cal parametric converter pumped at 1.064µm. The two curves correspond to thesignal and idler wavelengths for type-II phase-matching with φ = 0. The polar-ization of the pump wave is along the y-axis (o-wave) of the crystal as is thatof the signal wave. The idler wave is polarized in the x–z-plane (e-wave). Thedegenerate point at 2.12µm corresponds to a phase-matching angle of θ = 54◦.
Figure 10.16 illustrates a configuration of an intracavity doubled OPO designedto produce output in the ultraviolet/blue wavelength region. The device generatesradiation between 760 and 1040 nm, which is internally doubled to produce tun-
FIGURE 10.16. Layout of intracavity OPO, showing the different pump wavelengths in-volved: the 532 nm pump, the 760–1040 nm signal, and the 380–520 nm intracavitydoubled signal [20].

10.3. Parametric Oscillators 371
able output from 380 to 520 nm. The OPO employs a 15 mm long KTP crystal, an-tireflection coated at 911 nm, cut for normal incidence at φ = 0◦ and θ = 69◦. Theangles correspond to type-II phase-matching for a signal wavelength of 911 nm.The pump source is a diode-pumped Nd : YAG laser that is frequency doubled bya 1 cm long KTP crystal. The waist of the pump beam is positioned at the centerof the 5 cm long OPO cavity.
The 532-nm pulse enters the OPO cavity through a flat dichroic turning mirror(M1; highly reflecting at 800–950 nm and highly transmitting at 440–540 nm).The 532-nm pulse passes through the OPO crystal and is reflected off the flat rearcavity mirror (M2; highly reflecting at 532 and 880–950 nm), to leave the cavitythrough mirror M1 after making a second pass through the OPO crystal.
All mirrors have minimal reflectivity at the idler wavelength, making the OPOsingly resonant. The intracavity 911-nm flux is reflected by the turning mirror(M1) to pass through a 3 mm long BBO type-I doubling crystal. The final cavitymirror (M3) is highly reflective at both 880–950 and 410–480 nm, which allowsthe doubled output to be extracted through the turning mirror (M1) after makinganother pass through the doubling crystal. The use of two-pass nonlinear gen-eration in both the doubler and the OPO significantly improves the conversionefficiency of these processes. The advantage of this configuration is that the KTPcrystal is not exposed to the blue-ultraviolet flux, which could cause damage prob-lems.
The output energies obtained at the various wavelengths are shown in Fig. 10.17plotted as a function of electrical input energy to the diode arrays of the Nd : YAGpump laser.
FIGURE 10.17. Output at various wavelengths of the OPO depicted in Fig. 10.16 as afunction of electrical input to the Nd : YAG pump laser.

372 10. Nonlinear Devices
10.3.2 Quasi-Phase-Matching
In this subsection we will briefly review the concept of quasi-phase-matching(QPM), and summarize the properties of Periodically Poled LiNbO3 (PPLN). Al-though QPM is applicable to any nonlinear process, the subject is covered herebecause of the importance of PPLN and its application in OPOs for the generationof mid-infrared radiation.
PPLN is the first commercially available crystal in which efficient nonlinearconversion processes, such as harmonic generation or parametric interactions,are not based on birefringence phase-matching but on a periodic structure engi-neered into the crystal. We will briefly explain this technique, termed quasi-phase-matching, by referring to Section 10.1.1. An in-depth treatment of this subject canbe found in [21], [22].
As illustrated in Fig. 10.2 and expressed in (10.13) in a phase-matched con-dition �k = 0 the harmonic power increases with the square of the interactionlength l. In the situation of a fixed phase mismatch �k, energy flows back andforth sinusoidally between the fundamental and harmonic beams with a period of�k�/2 = π as the waves propagate through the crystal. Half of this period is thecoherence length lc given by (10.14) which is the maximum distance over whichthe second harmonic can grow. In a non-phase-matched condition, this distanceis on the order of 2–20µm for conversion processes of interest. The objectiveof birefringence phase-matching is to make this distance as long as possible bytaking advantage of the wavelength and the polarization dependence of the re-fractive indices in a crystal. By arranging proper balance between dispersion andbirefringence the technique of phase-matching increases lc by a factor of 103.
Even before the concept of birefringence phase-matching was invented, it wasproposed that a periodic structure in the crystal, which corrects the phase of thepropagating beams each time it reaches π , would enable continued energy flowfrom the fundamental to the harmonic beam. An implementation of this concept isa crystal where the sign of the nonlinear coefficient is reversed after each distancelc. In this case the relative phase between the waves is inverted after the conver-sion has reached its maximum. Therefore, on average, the proper phase relation-ship between the beams is maintained, and the second-harmonic power increaseswith the square of crystal length similar to the birefringence phase-matched case.The nonlinear coefficient dQ for quasi-phase-matching is, however, reduced ascompared to the phase-matched interaction according to [21],
dQ = 2
πdeff. (10.49)
A phase reversal is the equivalent of slicing a crystal in thin wafers and stackingthe wafers by rotating alternate wafers by 180◦. The periodicity� of this structureis twice that of lc, that is,
� = 2lc. (10.50)

10.3. Parametric Oscillators 373
Because of the micrometer size thickness of alternating layers, the practical re-alization of quasi-phase-matching had to wait until it was possible to engineer aperiodic phase reversal into a monolithic crystal. Only recently has the techniqueof periodically reversed polarization domains in ferroelectric crystals, combinedwith advances in lithography, made it possible to realize this concept. A rever-sal of the ferroelectric domains corresponds to a sign reversal of the nonlinearcoefficient. In this process, standard lithography produces a patterned electrodewith a period between 5 and 30µm on the surface of a ferroelectric crystal suchas LiNbO3. A high-voltage pulse is applied to the crystal which is sandwichedbetween the patterned electrode and a uniform electrode. The high-electric-fieldstrength of the voltage pulse permanently reverses the sign of the nonlinear coef-ficient in a pattern determined by the electrode structure.
This electric-field poling technique is employed to reproducibly manufactureperiodically poled lithium niobate (PPLN) suitable for applications in infraredparametric oscillators and second-harmonic generation.
We will now derive an expression for the quasi-phase-matching condition inOPOs for periodically poled crystals. Parametric conversion requires energy con-servation and momentum-matching conditions, as given by (10.36) and (10.37). Amomentum mismatch expressed as a phase mismatch between the pump, signal,and idler waves has been defined in (10.41). In the frequency domain, a periodicstructure can be represented by a grating wave vector
kg = 2π/�, (10.51)
where � is the period of the grating. In the presence of a grating structure in thecrystal, the equation for phase mismatch (10.41) includes, as an additional term,the grating wave vector kg [22]
�k = kp − ks − ki − kg, (10.52)
the first three terms being the conventional phase-matching condition. It is as-sumed that all wave vectors are collinear with the grating vector.
The objective of high parametric conversion is to eliminate the phase-mismatchcaused by dispersion by selecting the appropriate crystal orientation, temperature,and polarization such that k = 0 is achieved. The grating vector in (10.52) pro-vides an additional adjustable parameter that is independent of inherent materialproperties.
Differences in the three wave vectors kp, ks, ki can be compensated for by anappropriate choice of the grating vector kg such that �k = 0 can be achieved.Introducing (10.51) into (10.52) and with �k = 0 the grating period under quasi-phase-matching conditions is given by
�g = 2π
kp − ks − ki. (10.53)
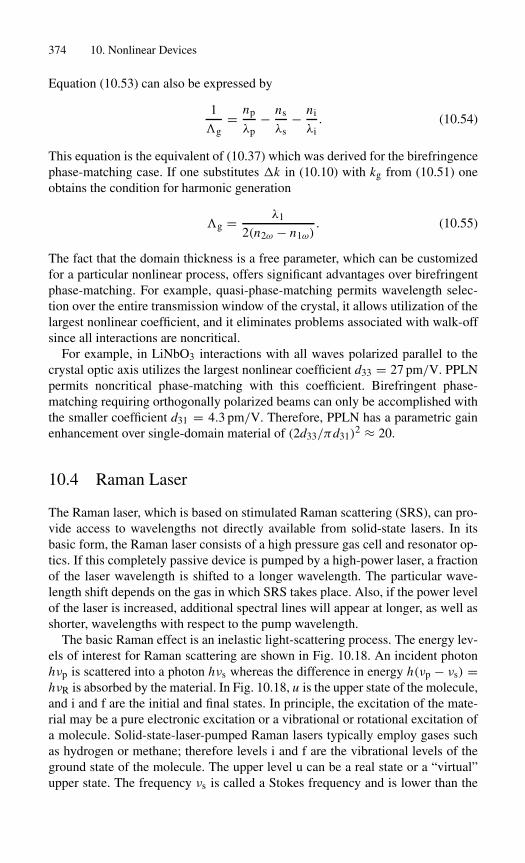
374 10. Nonlinear Devices
Equation (10.53) can also be expressed by
1
�g= np
λp− ns
λs− ni
λi. (10.54)
This equation is the equivalent of (10.37) which was derived for the birefringencephase-matching case. If one substitutes �k in (10.10) with kg from (10.51) oneobtains the condition for harmonic generation
�g = λ1
2(n2ω − n1ω). (10.55)
The fact that the domain thickness is a free parameter, which can be customizedfor a particular nonlinear process, offers significant advantages over birefringentphase-matching. For example, quasi-phase-matching permits wavelength selec-tion over the entire transmission window of the crystal, it allows utilization of thelargest nonlinear coefficient, and it eliminates problems associated with walk-offsince all interactions are noncritical.
For example, in LiNbO3 interactions with all waves polarized parallel to thecrystal optic axis utilizes the largest nonlinear coefficient d33 = 27 pm/V. PPLNpermits noncritical phase-matching with this coefficient. Birefringent phase-matching requiring orthogonally polarized beams can only be accomplished withthe smaller coefficient d31 = 4.3 pm/V. Therefore, PPLN has a parametric gainenhancement over single-domain material of (2d33/πd31)
2 ≈ 20.
10.4 Raman Laser
The Raman laser, which is based on stimulated Raman scattering (SRS), can pro-vide access to wavelengths not directly available from solid-state lasers. In itsbasic form, the Raman laser consists of a high pressure gas cell and resonator op-tics. If this completely passive device is pumped by a high-power laser, a fractionof the laser wavelength is shifted to a longer wavelength. The particular wave-length shift depends on the gas in which SRS takes place. Also, if the power levelof the laser is increased, additional spectral lines will appear at longer, as well asshorter, wavelengths with respect to the pump wavelength.
The basic Raman effect is an inelastic light-scattering process. The energy lev-els of interest for Raman scattering are shown in Fig. 10.18. An incident photonhνp is scattered into a photon hνs whereas the difference in energy h(νp − νs) =hνR is absorbed by the material. In Fig. 10.18, u is the upper state of the molecule,and i and f are the initial and final states. In principle, the excitation of the mate-rial may be a pure electronic excitation or a vibrational or rotational excitation ofa molecule. Solid-state-laser-pumped Raman lasers typically employ gases suchas hydrogen or methane; therefore levels i and f are the vibrational levels of theground state of the molecule. The upper level u can be a real state or a “virtual”upper state. The frequency νs is called a Stokes frequency and is lower than the
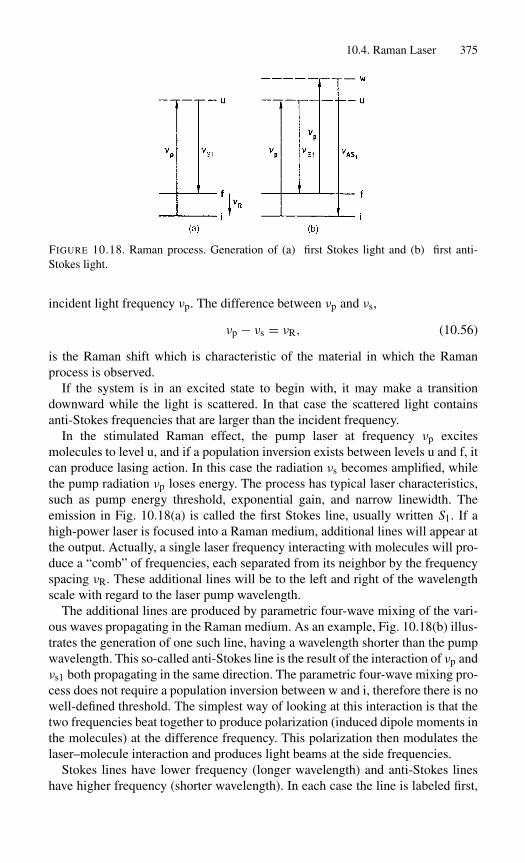
10.4. Raman Laser 375
FIGURE 10.18. Raman process. Generation of (a) first Stokes light and (b) first anti-Stokes light.
incident light frequency νp. The difference between νp and νs,
νp − νs = νR, (10.56)
is the Raman shift which is characteristic of the material in which the Ramanprocess is observed.
If the system is in an excited state to begin with, it may make a transitiondownward while the light is scattered. In that case the scattered light containsanti-Stokes frequencies that are larger than the incident frequency.
In the stimulated Raman effect, the pump laser at frequency νp excitesmolecules to level u, and if a population inversion exists between levels u and f, itcan produce lasing action. In this case the radiation νs becomes amplified, whilethe pump radiation νp loses energy. The process has typical laser characteristics,such as pump energy threshold, exponential gain, and narrow linewidth. Theemission in Fig. 10.18(a) is called the first Stokes line, usually written S1. If ahigh-power laser is focused into a Raman medium, additional lines will appear atthe output. Actually, a single laser frequency interacting with molecules will pro-duce a “comb” of frequencies, each separated from its neighbor by the frequencyspacing νR. These additional lines will be to the left and right of the wavelengthscale with regard to the laser pump wavelength.
The additional lines are produced by parametric four-wave mixing of the vari-ous waves propagating in the Raman medium. As an example, Fig. 10.18(b) illus-trates the generation of one such line, having a wavelength shorter than the pumpwavelength. This so-called anti-Stokes line is the result of the interaction of νp andνs1 both propagating in the same direction. The parametric four-wave mixing pro-cess does not require a population inversion between w and i, therefore there is nowell-defined threshold. The simplest way of looking at this interaction is that thetwo frequencies beat together to produce polarization (induced dipole moments inthe molecules) at the difference frequency. This polarization then modulates thelaser–molecule interaction and produces light beams at the side frequencies.
Stokes lines have lower frequency (longer wavelength) and anti-Stokes lineshave higher frequency (shorter wavelength). In each case the line is labeled first,

376 10. Nonlinear Devices
second, and so on, by counting the number of frequency shifts from the pumplaser.
SRS can be described as a nonlinear interaction involving the third-order non-linear susceptibility χ3. At a medium’s Raman resonance, the third-order sus-ceptibility reduces to the peak Raman susceptibility χ ′′
R, where the double primeindicates the imaginary part of the total susceptibility.
The growth of the electric field E2 at the Stokes wavelength and depletion ofthe pump field E1 is governed by the equations
∂E1
∂z= − ωp
2cnpχ ′′
R|E2|2 E1, (10.57)
∂E2
∂z= ωs
2cnsχ ′′
R|E1|2 E2, (10.58)
where ωp − ωs = ωR are the frequencies, ns and np are the indices of refraction,and c is the velocity of light. For a constant pump field, the Stokes field growsexponentially with a power gain given by
Ps(l) = Ps(0) exp(gsl), (10.59)
where gs is the gain coefficient and l is the interaction length in the Ramanmedium
gs = ωsχ′′R|Ep|2nsc
= 4πχ ′′R Ip
λSnsnpε0c. (10.60)
If one expresses the third-order Raman susceptibility, χ ′′R, in terms of sponta-
neous Raman scattering cross section, dσ/d , one obtains
gs = λpλ2S N (dσ/d )Ip
n2s hcπ �νR
, (10.61)
where λS is the Stokes wavelength, Ip is the pump intensity, N is the numberdensity of molecules, h is Planck’s constant, and �νR is the full-width, half-maximum Raman linewidth.
From these equations it follows that the gain for a single-pass Raman mediumis proportional to the incident intensity, the active media cross section (whichincludes pressure and linewidth dependencies), and the length of the Raman cell.
The threshold of a Raman laser is usually defined as the gain required to achievean output power at the Stokes wavelength that is of the same order as the pumpradiation. For example, to achieve a 1 MW Stokes shifted power output, one re-quires a gain length product of gsl = 36 in the Raman medium in order forthe radiation to build up from the initial spontaneous noise level which is Ps =hνs�νs ≈ 10−19 W in the visible. Table 10.2 summarizes the data for the mostimportant Raman media.
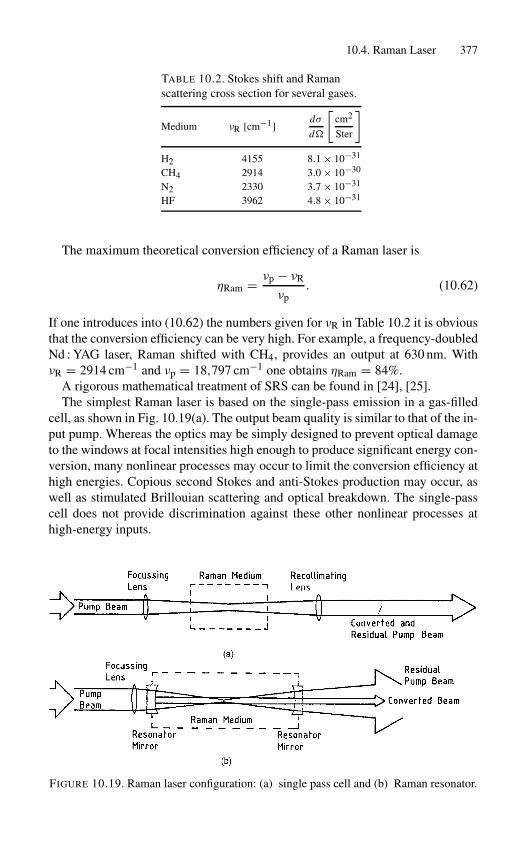
10.4. Raman Laser 377
TABLE 10.2. Stokes shift and Ramanscattering cross section for several gases.
Medium νR [cm−1] dσ
d
[cm2
Ster
]
H2 4155 8.1 × 10⁻³¹
CH4 2914 3.0 × 10⁻³⁰
N2 2330 3.7 × 10⁻³¹
HF 3962 4.8 × 10⁻³¹
The maximum theoretical conversion efficiency of a Raman laser is
ηRam = νp − νR
νp. (10.62)
If one introduces into (10.62) the numbers given for νR in Table 10.2 it is obviousthat the conversion efficiency can be very high. For example, a frequency-doubledNd : YAG laser, Raman shifted with CH4, provides an output at 630 nm. WithνR = 2914 cm−1 and νp = 18,797 cm−1 one obtains ηRam = 84%.
A rigorous mathematical treatment of SRS can be found in [24], [25].The simplest Raman laser is based on the single-pass emission in a gas-filled
cell, as shown in Fig. 10.19(a). The output beam quality is similar to that of the in-put pump. Whereas the optics may be simply designed to prevent optical damageto the windows at focal intensities high enough to produce significant energy con-version, many nonlinear processes may occur to limit the conversion efficiency athigh energies. Copious second Stokes and anti-Stokes production may occur, aswell as stimulated Brillouian scattering and optical breakdown. The single-passcell does not provide discrimination against these other nonlinear processes athigh-energy inputs.
FIGURE 10.19. Raman laser configuration: (a) single pass cell and (b) Raman resonator.
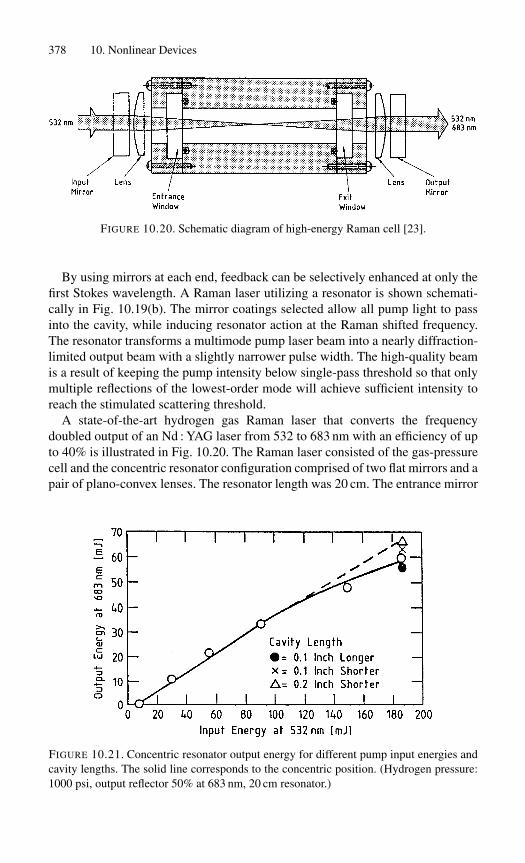
378 10. Nonlinear Devices
FIGURE 10.20. Schematic diagram of high-energy Raman cell [23].
By using mirrors at each end, feedback can be selectively enhanced at only thefirst Stokes wavelength. A Raman laser utilizing a resonator is shown schemati-cally in Fig. 10.19(b). The mirror coatings selected allow all pump light to passinto the cavity, while inducing resonator action at the Raman shifted frequency.The resonator transforms a multimode pump laser beam into a nearly diffraction-limited output beam with a slightly narrower pulse width. The high-quality beamis a result of keeping the pump intensity below single-pass threshold so that onlymultiple reflections of the lowest-order mode will achieve sufficient intensity toreach the stimulated scattering threshold.
A state-of-the-art hydrogen gas Raman laser that converts the frequencydoubled output of an Nd : YAG laser from 532 to 683 nm with an efficiency of upto 40% is illustrated in Fig. 10.20. The Raman laser consisted of the gas-pressurecell and the concentric resonator configuration comprised of two flat mirrors and apair of plano-convex lenses. The resonator length was 20 cm. The entrance mirror
FIGURE 10.21. Concentric resonator output energy for different pump input energies andcavity lengths. The solid line corresponds to the concentric position. (Hydrogen pressure:1000 psi, output reflector 50% at 683 nm, 20 cm resonator.)

10.5. Optical Phase Conjugation 379
has high transmission at 532 nm and high reflection at 683 nm. The exit mirrorhas high transmission for the pump wavelength at 532 nm and 50% reflectance atthe first Stokes wavelength. The reflectance for the second Stokes (954 nm) andfirst anti-Stokes (436 nm) wavelengths was only a few percent at both mirrors.
Figure 10.21 exhibits the output versus input for the resonator at the exactlength for the concentric geometry (solid line) and for slight variations in length[23].
10.5 Optical Phase Conjugation
Optical phase conjugation, also referred to as wave-front reversal, has beendemonstrated in solids, liquids, and gaseous media using a number of nonlinearoptical interactions, such as three- and four-wave mixing, stimulated Brillouinscattering (SBS), stimulated Raman scattering (SRS), and photon echoes.
From the standpoint of solid-state laser engineering, phase conjugation via SBSis particularly important because it provides a means to correct optical aberrationsproduced by a laser amplifier stage. Comprehensive descriptions of the principleof phase conjugation can be found in [26], [27].
Basic Considerations. From a mathematical point of view, phase-conjugationcan be explained by considering an optical wave of frequency ω moving in the(+z)-direction,
E1(x, y, z, t) = A(x, y) exp{ j[kz + φ(x, y)] − jωt}, (10.63)
where E1 is the electric field of the wave with wavelength λ = 2π/k. The trans-verse beam profile is given by the function A(x, y) and the phase factor φ(x, y),indicating how the wave deviates from a uniform, ideal plane wave. In particular,the phase factor carries all the information about how the wave is aberrated.
If the beam given by (10.63) is incident upon an ordinary mirror, it is reflectedupon itself and the sign of z changes to (−z), all other terms of the equation re-main unchanged. However, if the beam is incident upon a phase-conjugate mirrorit will be reflected as a conjugated wave E2 given by
E2(x, y, z, t) = A(x, y) exp{ j[−kz − ϕ(x, y)] − jωt}. (10.64)
In addition to the sign change of z, the phase term has changed sign, too. Theconjugate beam corresponds to a wave moving in the (−z)-direction, with thephase ϕ(x, y) reversed relative to the incident wave. We can think of the processas a reflection combined with phase- or wave-front reversal. The phase-reversalexpressed by (10.64), for example, means that a diverging beam emitted from apoint source, after reflection at a phase-conjugate mirror, will be converging andbe focused back to the point of origin.
A practical application of phase-reversal in a laser system is depicted inFig. 10.22. Shown is an oscillator which produces an output with a uniform flatwavefront that is distorted in the amplifier medium. An ordinary mirror merely

380 10. Nonlinear Devices
FIGURE 10.22. Compensation for optical phase distortions caused by an amplifyingmedium using nonlinear optical phase-conjugation. (a) Original wave, (b) ordinary reflec-tion, and (c) phase conjugated reflection.
inverts the distortion as it reflects the beam, thereby keeping the distortion fixedwith respect to the propagation direction. With a second pass through the ampli-fier, the distortion is essentially doubled. A phase-conjugate mirror, on the otherhand, reverses the wavefronts relative to the wave-propagation direction; hence,the same region of the amplifier that originally created the distortion compensatesfor it during the second pass through the amplifier.
However, it should be noted that although the wavefront is conjugated, the po-larization state of the backward-going field is not conjugated. As far as the polar-ization vector is concerned, the SBS mirror behaves like an ordinary mirror.
As already mentioned, SBS of laser radiation in liquids or gases is the pre-ferred approach for designing phase-conjugate mirrors. SBS involves the scatter-ing of light by sound waves, i.e., acoustic phonons or pressure/density waves. Theincoming laser radiation generates an ultrasound wave by electrostriction corre-sponding to a spatial density modulation in the material. This modulation changesthe refractive index and, therefore, a refractive index grating is created in the ma-terial.
The resultant Stokes scattered light is down-shifted in frequency by a relativelysmall amount (≈ 109 to 1010 Hz). The gain of the Stokes-shifted wave is gener-ally the highest in a direction opposite to that of the incident beam. The efficiencyof the SBS process (defined as the ratio of the Stokes-shifted, backward-goingenergy or power, to the incident optical energy or power) can be as high as 90%.SBS has been studied extensively in liquids, solids, and gases. The steady-state

10.5. Optical Phase Conjugation 381
gain factor of SBS is generally large, making SBS the dominant simulated scat-tering process in many substances.
Phase-conjugate mirrors can be employed to compensate thermal lensing indouble-pass amplifiers if the beam intensity is high enough to provide sufficientreflectivity from the SBS process. An SBS mirror in its most common form con-sists of a lens that focuses the incident beam into the bulk nonlinear material. Fig-ure 10.22 illustrates the most common configuration of compensating thermallyinduced lensing in amplifiers with an SBS mirror. The output from the oscilla-tor passes through the amplifiers, is reflected by the SBS mirror, and propagatesa second time through the amplifier chain. Output coupling is realized by a po-larizer and a 90◦ polarization rotation carried out by a λ/4 wave plate which ispassed twice. Conjugate reflectivities in this type of configuration are typically50% to 80%, so that the efficiency of the amplifier stage is reduced by a fractionthat depends on the ratio of energy extraction between the first and second pass inthe amplifiers.
Material Properties. Pressurized gases such as CH4 and SF6, or liquids suchas CCl4, acetone, and CS2 are usually employed to provide efficient SBS for a1.06µm pump. SBS materials can be characterized by a gain coefficient and anacoustic-decay time. The gain coefficient g determines the threshold and slope ofthe reflectivity curve. Materials with a lower gain show a higher threshold and aslower increase of the reflectivity with increased pumping.
The acoustic-decay time τ establishes criteria for the coherence or linewidthof the pump beam. For efficient interaction with the sound-wave grating, a co-herent interaction on the order of the acoustic decay time is required. An inversebandwidth of the pump pulse, which is larger than the acoustic-phonon dampingtime, describes the steady-state condition, that is, (�ν)−1 > τB. Maximum gainis achieved if this condition is satisfied. Most calculations, as well as the simplerelationships for gain and threshold given below, are for this case.
Table 10.3 lists steady-state SBS gain coefficient g and acoustic decay time τBof representative gases and fluids.
Quite noticeable is the longer phonon lifetime in gases compared to liquids.Single longitudinal mode Q-switched lasers have a pulse length of 10 to 20 ns;
TABLE 10.3. Steady-state SBS gaincoefficients and acoustic decay time ofrepresentative gases and fluids.
Medium g [cm/GW] τB[ns]CH4 (30 atm) 8 6CH4 (100 atm) 65 17SF6 (20 bar) 14 17SF6 (22 atm) 35 24CCL4 6 0.6Acetone 20 2.1CS2 130 5.2
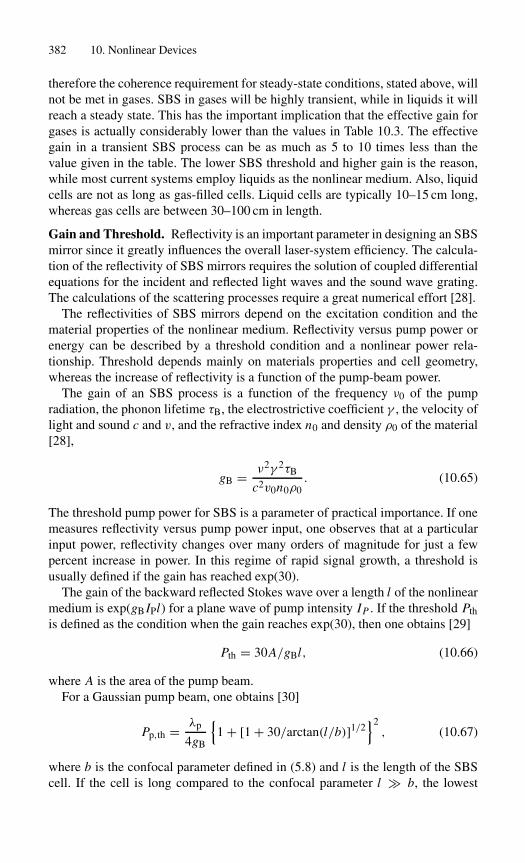
382 10. Nonlinear Devices
therefore the coherence requirement for steady-state conditions, stated above, willnot be met in gases. SBS in gases will be highly transient, while in liquids it willreach a steady state. This has the important implication that the effective gain forgases is actually considerably lower than the values in Table 10.3. The effectivegain in a transient SBS process can be as much as 5 to 10 times less than thevalue given in the table. The lower SBS threshold and higher gain is the reason,while most current systems employ liquids as the nonlinear medium. Also, liquidcells are not as long as gas-filled cells. Liquid cells are typically 10–15 cm long,whereas gas cells are between 30–100 cm in length.
Gain and Threshold. Reflectivity is an important parameter in designing an SBSmirror since it greatly influences the overall laser-system efficiency. The calcula-tion of the reflectivity of SBS mirrors requires the solution of coupled differentialequations for the incident and reflected light waves and the sound wave grating.The calculations of the scattering processes require a great numerical effort [28].
The reflectivities of SBS mirrors depend on the excitation condition and thematerial properties of the nonlinear medium. Reflectivity versus pump power orenergy can be described by a threshold condition and a nonlinear power rela-tionship. Threshold depends mainly on materials properties and cell geometry,whereas the increase of reflectivity is a function of the pump-beam power.
The gain of an SBS process is a function of the frequency ν0 of the pumpradiation, the phonon lifetime τB, the electrostrictive coefficient γ , the velocity oflight and sound c and v, and the refractive index n0 and density ρ0 of the material[28],
gB = ν2γ 2τB
c2v0n0ρ0. (10.65)
The threshold pump power for SBS is a parameter of practical importance. If onemeasures reflectivity versus pump power input, one observes that at a particularinput power, reflectivity changes over many orders of magnitude for just a fewpercent increase in power. In this regime of rapid signal growth, a threshold isusually defined if the gain has reached exp(30).
The gain of the backward reflected Stokes wave over a length l of the nonlinearmedium is exp(gB IPl) for a plane wave of pump intensity IP . If the threshold Pthis defined as the condition when the gain reaches exp(30), then one obtains [29]
Pth = 30A/gBl, (10.66)
where A is the area of the pump beam.For a Gaussian pump beam, one obtains [30]
Pp,th = λp
4gB
{1 + [1 + 30/arctan(l/b)]1/2
}2, (10.67)
where b is the confocal parameter defined in (5.8) and l is the length of the SBScell. If the cell is long compared to the confocal parameter l � b, the lowest

10.5. Optical Phase Conjugation 383
threshold is obtained, since arctan(l/b) = π/2 and (10.67) reduces to
Pth = 7.5λp
gB. (10.68)
The pump power has to be well above the threshold of the nonlinear reflectivitycurve. Otherwise, the fidelity of the reflected signal becomes small because theparts of the beam away from the central peak, with energies below this thresholdvalue, are not reflected. The useful power range of the incident radiation is limitedby the SBS threshold at the lower limit and by optical breakdown at the upper end.
A typical curve for SBS reflectivity versus input energy is shown in Fig. 10.23.These experimental data were obtained by focusing a Q-switched Nd : YAG laserinto a CCl4 cell with an 80 mm long focal length lens. Both threshold and theslope of reflectivity depend on the coherence properties of the beam. There is aminimum requirement on the coherence or linewidth of the incident beam suchthat a coherent spatial and temporal interaction with the sound-wave grating ispossible.
First, the coherence length of the beam should exceed the longitudinal sound-wave extension. If the pump beam has a Gaussian spatial profile, the sound wavehas a longitudinal extent given approximately by the confocal parameter. Second,the coherence time (i.e., the inverse of the linewidth, 1/�ν), of the pump beamshould exceed the response time τB of the acoustic phonons. Typically, τB is onthe order of nanoseconds for liquids, and tens of nanoseconds for pressurizedgases. Therefore, high-efficiency SBS requires linewidth narrowing or preferablysingle-longitudinal-mode operation.
FIGURE 10.23. SBS energy reflectivity of CCL4 as a function of pump energy for a Q-switched Nd : YAG laser [31].

384 10. Nonlinear Devices
SummaryOne usually assumes a linear relationship between the induced electric polariza-tion and the electric field strength. The term nonlinear optics refers to those phe-nomena in which the polarization per unit volume is no longer proportional tothe electric field strength. Nonlinear effects can be described by a power-seriesexpansion of the induced polarization and electric field. The nonlinear responseof the medium can give rise to an exchange of energy between electromagneticwaves of different frequencies (second harmonic generation, frequency mixing,optical parametric intractions), or lead to an exchange of energy between electro-magnetic waves and phonons in transparent media (stimulated Raman or Brillouinscattering). In the first group of interactions that take place between electromag-netic waves, crystals with large nonlinear coefficients are utilized as the nonlinearmedium, whereas high-pressure gas or a liquid is used as the nonlinear mediumfor Raman or Brillouin scattering.
Second-harmonic generation takes place when two photons combine and a pho-ton at twice the energy is created; in this case a wave at frequency ν1 is convertedto a wave at frequency 2ν1. In frequency mixing two waves at frequencies ν1 andν2 produce a wave at frequency ν3, such that ν1 + ν2 = ν3. In an optical para-metric oscillator the reverse process takes place, namely, a strong pump beamat frequency ν3 produces radiation at two lower frequencies ν3 = ν1 + ν2. In allthese processes the interaction of the various beams and the flow of energy amongthem is critically dependent on a velocity match of the interacting waves in thenonlinear crystal. Dispersion causes waves at different frequencies to propagateat different velocities. Taking advantage of the birefringence of nonlinear crystalsis the most common approach to compensate for the effects of dispersion. In abirefringent crystal the index of refraction and therefore the propagation velocityof a wave at a given frequency depends on the propagation direction within thecrystal and its sense of polarization.
Besides the aforementioned nonlinear processes, stimulated Raman scatteringin a high-pressure gas cell is exploited in solid-state laser technology to expandthe frequency range. Stimulated Raman scattering is an inelastic scattering pro-cess and involves interaction of light with the vibrational levels of the groundstate of the gas molecule. An incident pump photon is scattered, while the differ-ence energy is absorbed in the gas raising the vibrational level of the moleculeto a higher level. The frequency shift is relatively large and is determined by thedifferent vibrational frequencies of the gas. At very-high pump levels additionalspectral lines will appear at longer as well as shorter wavelengths with respect tothe pump wavelength. Stimulated Brillouin scattering involves scattering of laserradiation by sound waves. The incoming laser radiation generates an ultrasoundwave by electrostriction corresponding to a density modulation in the material.This modulation changes the refractive index, and a refractive index grating iscreated in the material. Stimulated Brillouin scattering is the nonlinear effect ex-ploited in phase conjugation, which provides a means to correct for optical aber-rations produced in a laser amplifier stage.

Summary 385
References[1] P.A. Franken, A.E. Hill, C.W. Peters, and G. Weinreich: Phys. Rev. Lett. 7, 118
(1961).
[2] N. Bloembergen: Nonlinear Optics (Benjamin, New York), 1965.
[3] F. Zernike and J.E. Midwinter: Applied Nonlinear Optics (Wiley, New York), 1973.
[4] R.L. Sutherland: Handbook of Nonlinear Optics (Dekker, New York), 1996.
[5] R.W. Boyd: Nonlinear Optics (Academic, San Diego, CA), 1992.
[6] D.L. Mills: Nonlinear Optics, 2nd ed. (Springer, Berlin), 1998.
[7] D.A. Kleinman: in Laser Handbook (edited by. F.T. Arecchi, E.O. Schulz-DuBois)(North-Holland, Amsterdam), 1972, Vol. 2, pp. 1229–1258.
[8] D. Hon: in Laser Handbook (edited by M. Stitch) (North-Holland, Amsterdam),1979, Vol. 3, pp. 421–456.
[9] M. Born and E. Wolf: Principles of Optics (Macmillan, New York), 1964.
[10] N.F. Nye: Physical Properties of Crystals (Clarendon, Oxford), 1960.
[11] M.V. Hobden: J. Appl. Phys. 38, 4365 (1967).
[12] Lasermetrics, Electro-Optics Div., Englewood, NJ, Data Sheet 8701, Optical Har-monic Generating Crystals (February 1987).
[13] G.D. Boyd, A. Ashkin, J.M. Dziedzic, and D.A. Kleinman: Phys. Rev. 137, 1305(1965).
[14] W.F. Hagen, P.C. Magnante: J. Appl. Phys. 40, 219 (1969).
[15] R.G. Smith: IEEE J. Quantum Electron. QE-6, 215 (1970).
[16] R.S. Craxton: IEEE J. Quantum Electron QE-17, 1771 (1981); Opt. Commun. 34,474 (1980).
[17] R.L. Byer: in Quantum Electronics: A Treatise (edited by H. Rabin and C.L. Tang)(Academic Press, New York), 1973, Vol. I, Pt. B, pp. 587–702.
[18] R.C. Eckardt, H. Masuda, Y.L. Fan, and R.X. Byer: IEEE J. Quantum Electron. QE-26, 922 (1990).
[19] J.E. Bjorkholm: IEEE J. Quantum Electron. QE-7, 109 (1971).
[20] L.R. Marshall, A. Kaz, and O. Aytur: Opt. Lett. 18, 817 (1993).
[21] M.M. Fejer, G.A. Magel, D.H. Jundt, and R.L. Byer: IEEE J. Quantum Electron.QE-28, 2631 (1992).
[22] L.E. Myers, R.C. Eckardt, M.M. Fejer, and R.L. Byer: J. Opt. Soc. Am. B 12, 2102(1995).
[23] D.G. Bruns and D.A. Rockwell: High-Energy Raman Resonator (Hughes AircraftComp., Culver City, CA). Final Report, Report FR-81-72-1035, (1981).
[24] G.L. Eesley: Coherent Raman Spectroscopy (Pergamon, New York) 1981; A.Owyoung: CW stimulated Raman spectroscopy, in Chemical Applications of Non-linear Raman Spectroscopy (edited by B. Harvey) (Academic, New York), 1981,pp. 281–320.
[25] W. Kaiser and M. Maier: Stimulated Rayleigh, Brillouin and Raman spectroscopy,in Laser Handbook, Vol. II (edited by F.T. Arecchi and E.O. Schulz-DuBois), (NorthHolland, Amsterdam), 1972.
[26] B.Ya. Zel’dovich, N.F. Pilipetsky, and V.V. Shkunov: Principles of Phase Conjuga-tion, Springer Ser. Opt. Sci., Vol. 42 (Springer, Berlin), 1985.

386 10. Nonlinear Devices
[27] D.M. Pepper: Nonlinear optical phase conjugation, in Laser Handbook, Vol. 4,pp. 333–485, (edited by M.L. Stitch and M. Bass) (North-Holland, Amsterdam),1985.
[28] R. Menzel and H.J. Eichler: Phys. Rev. A 46, 7139 (1992).
[29] I.D. Carr, D.C. Hanna: Appl. Phys. B 36, 83 (1985).
[30] D. Cotter, D.C. Hanna, and R. Wyatt: Appl. Phys. 8, 333 (1975).
[31] R. Menzel and D. Schulze: Proc. Int’l Summer School on Applications of NonlinearOptics, Prague (1993).
Exercises
1. Use (10.17) and derive an expression for the type-I phase-matching angle forsecond harmonic generation in a positive uniaxial crystal.
2. Consider the third harmonic generation system shown below:
Eoω
L1
SHG
Type-I
Eoω
Ee2ω
L2
SFG
Type-II
E3ω
where SHG stands for second harmonic generator and SFG stands for sumfrequency generator. If the input beam is of the form
Iω(r, t) = Ioω exp
(−(
2r2
w2+ t2
T 2
)).
(a) What is the beam radius and pulse width of the third harmonic output?
(b) Why might one prefer to use a second harmonic generator and a sumfrequency generator to produce a third harmonic generator rather than asingle third harmonic generator?
Appendix A
Conversion Factors and Constants
In this Appendix we have listed some of the most frequently used conversionfactors and constants.
Physical Constants
h = 6.626 × 10⁻³⁴ J s Planck constante = 1.602 × 10⁻¹⁹ A s Charge of an electronk = 1.381 × 10⁻²³ J K−1 Boltzmann constantc = 2.998 × 10⁸ m s−1 Speed of light in vacuumε0 = 8.854 × 10⁻¹² A s V−1 m−1 Permittivity of free spaceµ0 = 1.257 × 10⁻⁶ V s A−1 m−1 Permeability of free spaceZ0 = √
µ0/ε0 = 376.7� Impedance of free spaceg = 9.81 m s−2 Acceleration due to gravity
Force Conversions
1 dyne = 1 g cm s−2
1 N = 1 kg m s−2 = 105 dyne
1 kp = 9.81 kg m s−2
Energy Conversions
1 J = 1 W s1 cal = 4.19 J
1 eV = 1.60 × 10⁻¹⁹ J
1 erg = 10−7 J
Pressure Conversions
1 Pa = 1 N m−2
1 MPa = 145.1 psi = 9.87 atm
1 atm = 1.013 bar = 1.033 kp cm−2
1 bar = 106 dyne cm−2 = 105 N m−2
1 torr = 133.3 N m−2
387
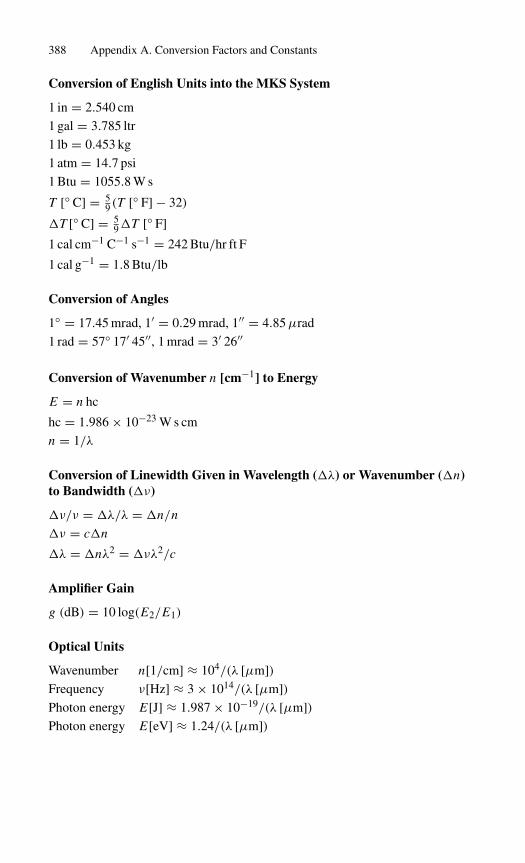
388 Appendix A. Conversion Factors and Constants
Conversion of English Units into the MKS System
1 in = 2.540 cm
1 gal = 3.785 ltr
1 lb = 0.453 kg
1 atm = 14.7 psi
1 Btu = 1055.8 W s
T [◦ C] = 59 (T [◦ F] − 32)
�T [◦ C] = 59�T [◦ F]
1 cal cm−1 C−1 s−1 = 242 Btu/hr ft F
1 cal g−1 = 1.8 Btu/lb
Conversion of Angles
1◦ = 17.45 mrad, 1′ = 0.29 mrad, 1′′ = 4.85µrad
1 rad = 57◦ 17′ 45′′, 1 mrad = 3′ 26′′
Conversion of Wavenumber n [cm−1] to Energy
E = n hc
hc = 1.986 × 10⁻²³ W s cm
n = 1/λ
Conversion of Linewidth Given in Wavelength (�λ) or Wavenumber (�n)to Bandwidth (�ν)
�ν/ν = �λ/λ = �n/n
�ν = c�n
�λ = �nλ2 = �νλ2/c
Amplifier Gain
g (dB) = 10 log(E2/E1)
Optical Units
Wavenumber n[1/cm] ≈ 104/(λ [µm])Frequency ν[Hz] ≈ 3 × 10¹⁴/(λ [µm])Photon energy E[J] ≈ 1.987 × 10⁻¹⁹/(λ [µm])Photon energy E[eV] ≈ 1.24/(λ [µm])

Appendix A. Conversion Factors and Constants 389
Conversion of Transmission, T , to Optical Density, D
D = log(1/T ); T = 10−D .
Conversion of the Nonlinear Refractive Index n2 (esu) to NonlinearRefractive Coefficient γ (cm2/W)
γ (cm2/W) = 4.19 × 10⁻³
n0n2 (esu).

This page intentionally left blank

Appendix B
Definition of Symbols
A21 Einstein coefficient (Chapter 1)A∗ areaa aperture radiusb confocal parameterB21, B12 Einstein coefficients (Chapter 1)B beam breakup integral (Chapter 4)Br brightness (Chapter 4)c, c0 speed of lightC capacitance (Chapter 6)CT, Cr, Cφ , CB combination of material constants (Chapter 7)d thickness (Chapters 5, 9)d, d14, deff coefficient of nonlinear polarizationD, D0 beam diametere electron chargeE Young’s modulus (Chapter 7)E1, E2, E3, E0 energy levels (Chapter 1)Est stored energy�E energy differenceEEL electrical input energyESC scale factor energy (Chapter 8)Ein, Eout, Eopt input-, output-, optical energy (Chapters 3, 4)Eex flashlamp explosion energyEi, E0, Es input-, output-, saturation fluenceE1, E2, E3, E electric field strength (Chapter 10)E j , Ez electric field strength (Chapter 8)f , f ′, f ′′, fx , fy , fef focal lengthF finesse of interferometer (Chapter 5)f pulse repetition rate (Chapter 8)g1, g2, g(n1), g(R1), g(R2) degeneracy of energy levels (Chapters 1, 2, 3)
∗Symbols whose definitions are not followed by chapter numbers are used throughout thebook.
391

392 Appendix B. Definition of Symbols
g(ν, ν0), g(ν0), g(ν), g(νs, ν0) atomic lineshape function (Chapters 1, 3)
g0, g gain coefficientG, G0 gain
g, g1, g2 parameters of resonator stability(Chapters 5, 9)
hν photon energy
h surface heat transfer coefficient (Chapter 7)h Planck constant (Chapter 6)
I , IL, IR, Icirc, Iout, IIN, IP, I0 power density of laser beam
Iav, Iw power density of pump radiation (Chapter 3)IASE fluorescence flux (Chapter 4)
Imn, Ipl intensity distribution of radial modesIac acoustic power density
IS saturation power densityi , iP, iS current
JST, Jth energy density (Chapters 2, 4)K0 flashlamp parameter (Chapter 6)
K thermal conductivitykT thermal energy
K , K ′ nonlinear coupling factor (Chapter 10)
K1, K2, K3 combination of parameters (Chapter 10)kp, ks, ki, kW, k2W, �k wave number
l, l(r), l0 length of active medium�l pathlength difference (Chapter 7)
L , LO, L1, L2 distances within resonatorlC, la coherence-, aperture length
L inductance (Chapter 6)l, m, n, p higher order modes (Chapter 5)
M beam quality figure of merit (Chapter 5)
M power ratio (Chapter 10)m magnification of unstable resonator
(Chapter 5)
Mac acoustic figure of merit (Chapter 8)Mr, Mφ thermal lensing sensitivity (Chapter 7)
n0, nS, ni, np, nx, ny refractive index�n0, �n(r), �nφ , �nr refractive index difference
n1ω, n2ω, n3ω index at harmonic frequenciesn0, ne ordinary-, extraordinary refractive index
n(r), nr, nφ index in radial-, tangential direction

Appendix B. Definition of Symbols 393
dn/dT temperature dependence of index
dn/dλ wavelength dependence of index
n(I ) intensity dependence of index
n2 nonlinear refractive index (Chapters 4, 9)
ng, n1 ground state-, lower laser level populationdensity
n2, n upper laser level population density
ntot total population density
ni, nt, nf, noo initial-, threshold-, final-, steady-statepopulation density
�n perturbation of population density (Chapter 3)
N1, N2, N0, Ntot, N (ν), �N population of energy levels
N , Neq Fresnel number (Chapter 5)
N number of axial modes (Chapter 9)
N number of flashlamp firings (Chapter 6)
Nph number of photons (Chapter 5)
N number density of molecules (Chapter 10)
Pin, Pout, Pth, P , Popt input-, output-, threshold-, intracavity-,optimum power
Pav, Pp, Pcw average-, peak-, cw power
Pω, P2ω fundamental-, harmonic power
Pac acoustic power (Chapter 8)
Pa, Ph absorbed-, dissipated power
Pcr, Pf, Pλ critical-, fluorescence-, spectral power
Pavail, Pe available-, incident power
Piklm, pij photoelastic tensor, coefficients
P induced polarization (Chapter 10)
p gas pressure (Chapter 6)
p, pn, pL resonator modes (Chapters 1, 5)
Q resonator quality factor (Chapter 3)
Q heat per volume (Chapter 7)
q parameter (Chapter 7)
R1, R2, R, Ropt, Rth, R′ reflectivity
r , r0, rL, rR radius
R(z), R1, R2, R, Reff radius of curvature of resonator mirrors(Chapter 5)
Rd electrical resistance (Chapter 6)
ri j electro-optic coefficients
RS thermal shock parameter (Chapter 7)

394 Appendix B. Definition of Symbols
rP pump intensity distributionR(λ, T ) flashlamp radiations strain (Chapter 8)s Kerr lens sensitivity (Chapter 9)S, S1, S2, S0 combination of material constants (Chapter 7)T , Topt, Tn, To, Ti, Tmax transmissiontp, tR pulsewidth, rise timeT , T (r), T (r0), T (o), TF temperaturet timetr round trip time of photonstLC time constantu nonlinear loss coefficientV volume (Chapters 3, 8)V , V0, Vz, V1/2 voltage (Chapters 6, 8)v, vs, vg velocityW blackbody radiation (Chapter 1)w widthWp pump rateW13, W03 pump parameter (Chapter 1)Wav, Ws energy density (Chapter 3)w0, w, w1, w2, wP, wpl, wm, wn beam radiusx , y, z distanceZ0, Z impedancez parameterα0, α0(νs), α0(E) absorption coefficientα damping factor of current pulse (Chapter 6)α pulse shape factor (Chapter 9)α thermal expansion coefficient (Chapter 7)αP angle (Chapters 6, 9)β0 propagation constant (Chapter 8)β combination of parameters (Chapter 4)βθ angular sensitivity of doubling crystal
(Chapter 10)β frequency chirp (Chapter 9)β ′′ group dispersion in solids (Chapter 9)χ susceptibility (Chapter 10)χ heat deposition (Chapter 7)δ, δm, δ0, δdepol resonator lossesδAM, δFM modulation depth
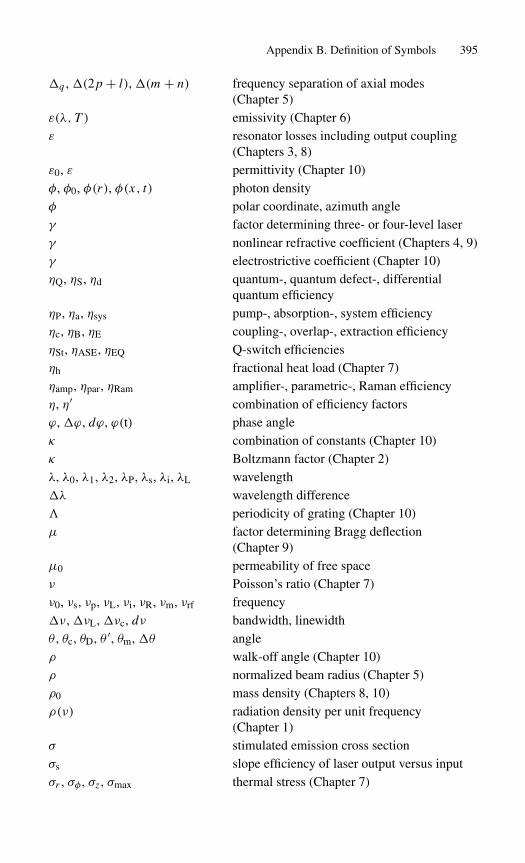
Appendix B. Definition of Symbols 395
�q , �(2p + l), �(m + n) frequency separation of axial modes(Chapter 5)
ε(λ, T ) emissivity (Chapter 6)ε resonator losses including output coupling
(Chapters 3, 8)ε0, ε permittivity (Chapter 10)φ, φ0, φ(r), φ(x, t) photon densityφ polar coordinate, azimuth angleγ factor determining three- or four-level laserγ nonlinear refractive coefficient (Chapters 4, 9)γ electrostrictive coefficient (Chapter 10)ηQ, ηS, ηd quantum-, quantum defect-, differential
quantum efficiencyηP, ηa, ηsys pump-, absorption-, system efficiencyηc, ηB, ηE coupling-, overlap-, extraction efficiencyηSt, ηASE, ηEQ Q-switch efficienciesηh fractional heat load (Chapter 7)ηamp, ηpar, ηRam amplifier-, parametric-, Raman efficiencyη, η′ combination of efficiency factorsϕ, �ϕ, dϕ, ϕ(t) phase angleκ combination of constants (Chapter 10)κ Boltzmann factor (Chapter 2)λ, λ0, λ1, λ2, λP, λs, λi, λL wavelength�λ wavelength difference� periodicity of grating (Chapter 10)µ factor determining Bragg deflection
(Chapter 9)µ0 permeability of free spaceν Poisson’s ratio (Chapter 7)ν0, νs, νp, νL, νi, νR, νm, νrf frequency�ν, �νL, �νc, dν bandwidth, linewidthθ , θc, θD, θ ′, θm, �θ angleρ walk-off angle (Chapter 10)ρ normalized beam radius (Chapter 5)ρ0 mass density (Chapters 8, 10)ρ(ν) radiation density per unit frequency
(Chapter 1)σ stimulated emission cross sectionσs slope efficiency of laser output versus inputσr , σφ , σz , σmax thermal stress (Chapter 7)

396 Appendix B. Definition of Symbols
σ12, σgs, σes absorption cross section
σ Stefan–Boltzmann constant (Chapter 1)
τf, τ21 spontaneous emission lifetime of upper laserlevel
τc decay time of photon density in resonator
τB phonon lifetime (Chapter 10)
τR decay time of relaxation oscillations(Chapter 3)
τi j spontaneous emission lifetime between statesEi and E j
ω, ω0, ωp, ω1, ω2, ω3, ω4, ωs frequency
�ω bandwidth
� solid angle beam divergence (Chapter 4)
� pulsewidth–bandwidth product (Chapter 9)
ζ , ζmax, ζ(t, φ) cavity losses (Chapter 8)

Appendix C
Partial Solutions to the Exercises
Chapter 1
5. (page 43) For simplicity we treat the case of equal degeneracies. We want tofind the temperature when
N2 A21 = B21ρN21,
where the photon density is given by the Planck law, Eq. 1.2. Thus, the equationabove becomes
A21 = (B21)8πν2
c3
hν
exp
(hν
kT
)− 1
.
We know that A21/B21 = 8πν2hν/c3 from Eq. 1.20, so we can write
1 = 1
exp
(hν
kT
)− 1
or
exp
(hν
kT
)= 2.
Thus, hν/kT = ln 2 and so T = hν/k ln 2.
Chapter 2
4. (page 76) For a Lorentzian lineshape,
σ21 = A21λ20
4π2n2�ν.
397

398 Appendix C. Partial Solutions to the Exercises
The radiative lifetime for R1 line is then
τ21 = 1
A21= λ2
0
4π2n2�vσ21= 69432 × 10−20
4π2 × 1.762 × 330 × 109 × 2.5 × 10−20 × 10−4
= 4.778 ms,
and so the nonradiative lifetime is obtained from the fact that both radiative andnonradiative processes go on in parallel. Since the fluorescent lifetime is 3.0 ms,we use
1
τ f= 1
τr= 1
τnr⇒ τnr = τ f τr
τr − τ f= 4.778 × 3.0
4.778 − 3.0= 8.062 ms.
The fluorescence quantum efficiency is the ratio of the excited ions that emit ra-diatively to the total number of ions that decay in any given period. In other wordsit is the ratio of 1
τrto the total lifetime 1
τr+ 1
τnr. In other words
ηQ = τ f
τr= 3
4.778= 0.63.
Chapter 3
5. (pages 119–120) Let T = 1 − R, and use the approximations that for highlyreflecting mirrors 1 + R ≈ 2 and ln(1 − T ) = −T . Then from Eq. 3.56, we have
Pout = AIST
2
(2g0l
δ + T− 1
).
Now differentiating this with respect to T :
d Pout
dT= AIS
[g0l
(1
δ + T− T
(δ + T )2
)− 1/2
].
By letting d PoutdT = 0 we find the value of T that maximizes Pout. We find
g0l
(1
δ + T− T
(δ + T )2
)− 1/2 = 0
⇒ g0l(δ + T )
(δ + T )2− g0lT
(δ + T )2− 1/2 = 0
⇒ g0lδ
(δ + T )2− 1/2 = 0
⇒ δ + T = √2g0lδ
⇒ T =(√
2g0l/δ − 1)δ.
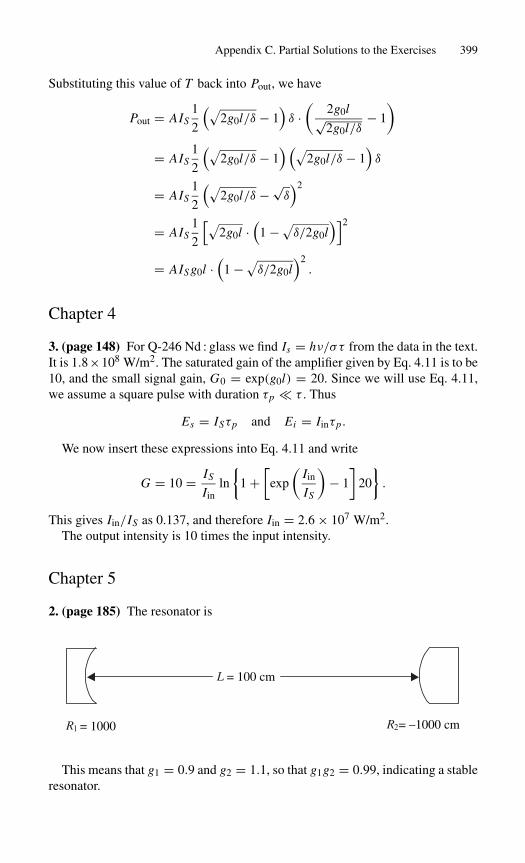
Appendix C. Partial Solutions to the Exercises 399
Substituting this value of T back into Pout, we have
Pout = AIS1
2
(√2g0l/δ − 1
)δ ·(
2g0l√2g0l/δ
− 1
)
= AIS1
2
(√2g0l/δ − 1
) (√2g0l/δ − 1
)δ
= AIS1
2
(√2g0l/δ − √
δ)2
= AIS1
2
[√2g0l ·
(1 −√
δ/2g0l)]2
= AISg0l ·(
1 −√δ/2g0l
)2.
Chapter 4
3. (page 148) For Q-246 Nd : glass we find Is = hν/στ from the data in the text.It is 1.8×10⁸ W/m2. The saturated gain of the amplifier given by Eq. 4.11 is to be10, and the small signal gain, G0 = exp(g0l) = 20. Since we will use Eq. 4.11,we assume a square pulse with duration τp τ . Thus
Es = ISτp and Ei = Iinτp.
We now insert these expressions into Eq. 4.11 and write
G = 10 = IS
Iinln
{1 +
[exp
(Iin
IS
)− 1
]20
}.
This gives Iin/IS as 0.137, and therefore Iin = 2.6 × 10⁷ W/m2.The output intensity is 10 times the input intensity.
Chapter 5
2. (page 185) The resonator is
L = 100 cm
R2= –1000 cmR1 = 1000
This means that g1 = 0.9 and g2 = 1.1, so that g1g2 = 0.99, indicating a stableresonator.

400 Appendix C. Partial Solutions to the Exercises
Now use Eqs. 5.29 and 5.30 to find the mode sizes on each mirror.w1 = 1.876 mm and w2 = 1.697 mm. Eq. 5.13 gives the beam waist radiusas w0 = 1.258 mm, and Eq. 5.1 gives L1 as 5.5 m so that the waist is located4.5 m to the right of mirror 2.
Since the beam is largest near mirror 1, that is where to put the laser rod formaximum TEM00 mode size in the gain medium.
Chapter 6
1. (page 243) For an input energy of E0 = 10 J we use Eq. 6.3 to find theexplosion limit as
Eex = (1.2 × 10⁴)l dt1/2p ,
where L = 6 cm and d = 0.4 cm, tp = 300 µs. The explosion energy is thenEex = 498.8 J. The expected lifetime (number of pulses) for 10 J pulses can becalculated using Eq. 6.4,
N ∼=(
Eex
E0
)8.5
as 2.76 × 10¹⁴ pulses.This result does not agree with that in the example. The calculated expected
lifetime is larger than that in the example by 7 orders of magnitude. In this casethe input energy is only 2% of the explosion energy. There is another examplein Solid-State Laser Engineering, a large linear lamp employed to pump rubyand Nd : glass laser rod; the lamp is 16.5 cm long and has a bore diameter of13 mm. The lamp has explosion energy of 8450 J for a 1-ms-long pulse. If thelamp is operated at an input energy of 2000 J, a flashlamp life of 150 (103 shotscan be expected using Eq. 6.4. In this case there is good agreement between thecalculated result and that in the example. So the formula seems to work.
Consider that there are other mechanisms for lamp failure besides explosion.The lamp jacket can be eroded by the plasma in the discharge after many shots.This weakens the jacket and lowers the explosion limit as use continues. The ero-sion also clouds the lamp jacket, making the jacket absorptive to the pump light.The lamp becomes progressively less efficient as a pump source. Thus, while notat its originally calculated explosion limited life, the lamp must be replaced afteronly 10 million shots because it is no longer as good a pump source as it was, andits current explosion limit after 10 million shots is less than when it was new.
Chapter 7
1. (page 278) The material constant of the Nd : YAG laser crystal required forthis calculation are

Appendix C. Partial Solutions to the Exercises 401
thermal expansion coefficient α = 7.5 × 10⁻⁶/◦C,
thermal conductivity K = 0.14 W/cm◦C,
Poisson’s ratio, ν = 0.25,
the refractive index n0 = 1.82, and
dn/dT = 7.3 × 10⁻⁶/◦C
Now substitute these parameters into Eqs. 7.20 and 7.21:
�nr = −1
2n3
0αQ
KCrr2,
�nφ = −1
2n3
0αQ
KCφr2,
where Cr and Cφ are functions of the elasto-optic coefficients of Nd : YAG,
Cr = (17υ − 7)P11 + (31υ − 17)P12 + 8(υ + 1)P44
48(υ − 1)
Cφ = (10υ − 6)P11 + 2(11υ − 5)P12
32(υ − 1).
Here P11, P12, and P44 are −0.029, 0.0091, and −0.0615, respectively. Evalu-ating Cr , Cφ , �nr , �nφ yields
Cr = 0.017,Cφ = −0.0025,
�nr = (−2.8 × 10⁻⁶) Qr2,
�nφ = (0.4 × 10⁻⁶) Qr2.
Eq. 7.34 is used to calculate the induced focal length considering the combinedeffects of the temperature- and stress-dependent variation of the refractive indexand the distortion of the end-face curvature of the rod. It is
f = K A
Pa
(1
2
dn
dT+ αCr,φn3
0 + αr0(n0 − 1)
l
)−1
.
Ignoring the end effects, assuming the dimension of Nd : YAG laser rod used is 6mm in diameter and 100 mm in length, and assuming the Nd : YAG laser rod isuniformly pumped so the rod cross-section area is 0.2826 cm2, the focal lengthcan be expressed as
f = K A
Pa
(1
2
dn
dT+ αCr,φn3
0
)−1
.
If the total heat dissipated in the rod is 1000 W, the focal length of this laser rodcan be calculated as fr = 8.95 cm and fφ = 11.18 cm. These are very short focallengths, and clearly the rod is astigmatic.

402 Appendix C. Partial Solutions to the Exercises
Chapter 8
2. (pages 306–307)
(a) If the motor speed is 24,000 rpm and the misalignment tolerance is 1mrad, then the time for switching is the time it takes the mirror to movethrough an angle of 1 mrad or
t = 10−3/(2π × 24000/60) sec = 3 × 10⁻⁷ sec.
(b & c) If instead of a mirror one used a 40-90-45 prism as the rotating cavityreflector, the effect of the prism is to make the light require two roundtrips to reflect back on itself. This is because the roof prism is a retro-reflector in the plane perpendicular to its roof ridge. As indicated in thefigure below, the roof prism makes the cavity seem twice as long andtherefore makes it seem to have 0.5 mrad of alignment tolerance. In thisfigure the paths have been displaced from each other slightly to show thetwo round trips more clearly. However, the roof prism rotating about anaxis parallel to the ridge can align with the output coupler, perhaps coatedon the far end of the rod, over a wide range of angles (see sketch below).It is therefore preferable to rotate the prism about an axis perpendicularto the roof top ridge. In this manner one gains the faster Q-switching timemade possible by the rooftop reflector while gaining some insensitivityto misalignments in the plane perpendicular to both the ridge and therotation axis.
<A>
<B>
<C>
<D> Z
X
Y

Appendix C. Partial Solutions to the Exercises 403
<A>
<B>
<C> Z
X
Y
Chapter 9
2. (page 338) The intensity as a function of time is from the preceding problem
I (t) = Imaxsin2 ( N�
2 tHWHM)
sin2 (�2 tHWHM
) .To find the pulse width we first find the width at the base of each pulse, or in otherwords, when the pulse amplitude first becomes zero after the peak. This occurswhen the numerator in the preceding equation is first zero. That is when
N�
2
tbase
2= π.
So tbase = 4π/N� = 2π/N (2πc/2L) = 4L/Nc = 2tround trip/N and is exactlycorrect. Thus, the pulse duration at the base for the described laser is 4×10⁻¹¹ sec.
The time at which the half maximum is reached is the time that causes
Imaxsin2 ( N�
2 tHWHM)
sin2 (�2 tHWHM
) = Imax
2.
This is a transcendental equation in tHWHM and must be solved numerically forprecise results. When it is solved numerically, the result for tFWHM is the result inEq. 9.4 but divided by 1.128. Thus Eq. 9.4 is off by about ∼13% in this problem.
Another approximation is to consider that since the half width at half maximumtime should be much less than the interpulse period we can approximate it byfinding the time when
sin
(N�
2tHWHM
)= 1√
2.
Here the approximation is that the numerator in the expression for I changes muchmore quickly than the denominator. This is so, but the denominator does changefrom 0 to some finite value necessitating the numerical solution for a precise an-swer. However, the approximation may be useful. We have in this approximation
tHWHM = 2
N�sin−1
(1√2
)= 2
N�
π
4= π
2N 2πc2L
= 1
4Ntroundtrip.

404 Appendix C. Partial Solutions to the Exercises
The full width at half maximum is twice this number or tround trip/2N and forthe cavity described we have 0.5 × 10⁻¹¹ sec. In this approximation instead of1.13 we have 2.00 in the denominator. While it is not precisely correct, it gives auseful estimate of the pulse duration at tFWHM.
Chapter 10
2. (page 386)
(a) The intensity going in is
Iω(r, t) = I0ω exp
(−(
2r2
w2+ t2
T 2
)).
This squared is proportional to the intensity going out of the SHG as
I2ω(r, t) ∝ (I0ω)2 exp
(−2
(2r2
w2+ t2
T 2
)).
When this light and the fundamental light interact in the SFG to produce thethird harmonic, we have I3ω proportional to Iω I2ω so
I3ω(r, t) ∝ (I0ω)3 exp
(−2
(2r2
w2+ t2
T 2
))exp
(−(
2r2
w2+ t2
T 2
))
or
I3ω(r, t) ∝ (I0ω)3 exp
(−3
(2r2
w2+ t2
T 2
)),
Therefore the radius at which the intensity is 1/e2 of the peak on axis intensityof the third harmonic is w3ω = wω/
√3, and the pulse duration corresponding
to the 1/e height of the intensity in time of the third harmonic is T3ω =Tω/
√3.
(b) Using a SHG first and then an SFG allows one to have large intensities at bothw and 2w in the SFG so that it works efficiently. That is, it is better to sum twohigh-intensity beams than to triple one high-intensity beam. In each nonlineardevice we deal only with a second-order nonlinearity not the much smallerthird-order nonlinearity. It is also easier to find phase-matching conditions fora second-order process than it is for a third-order process.
Index
Absorption, 18, 21, 25, 61, 64, 71, 72coefficient, 27, 57cross section, 27, 57efficiency, 89, 91, 197, 199, 209
Acousto-optic modulator, 322–326Acousto-optic Q-switch, 295–302Actinide, 52Alexandrite laser, 70–72Amplified spontaneous emission, 94,
142–144Amplifier
Nd: glass, 136–142Nd: YAG, 128–136
Amplitude fluctuation; see Outputfluctuation
Angular divergence; see Beamdivergence
Aperture length, 353Arc lamp; see FlashlampsAtomic energy level; see Energy levelAtomic lineshapes, 21–25Axial modes; see Longitudinal modes
Bandwidth; see LinewidthBeam divergence definition, 155, 156,
162, 163Beam overlap efficiency, 92, 93Beta-barium borate, 354, 357, 370Biaxial crystal, 348Birefringence
electrically induced, 289–294thermally induced, 248, 258–264,
267, 268Blackbody radiation, 15, 16, 191Bleachable dye; see Saturable absorberBohr’s frequency relation, 12
Boltzmann distribution, 16, 17Bragg scattering, 296–299, 328Brewster angle, 269, 270, 271Brightness, definition, 123Brillouin scattering, 343–345, 379–383Broadening of atomic transitions; see
Line broadening effects
Cerium, 52Circulating power, 86–88Close-coupled pump cavity, 214, 215Coherence length
frequency doubling, 347, 348laser radiation, 176, 383
Collision broadening, 22Concave-convex, resonator, 159, 160,
169Concentric resonator, 159, 378Confocal parameter, 156Confocal resonator, 159, 160Confocal unstable resonator, 180–182Continuous arc lamp, 189, 197, 198Conversion efficiency, 345–347, 362,
368, 377Cooling, 219–228, 239–241, 249, 271Cr: Forsterite laser, 53, 331Cr: GSGG laser, 47Cr: LiSAF laser, 53, 331Critical phase matching, 352Cross section, stimulated emission, 28,
56, 58, 62, 65, 66, 70, 73
Decay time, resonator, 38, 81, 82Degeneracy, energy levels, 16, 17, 20,
28Degenerate mode, 370
405

406 Index
Depolarization loss, 261, 262Depopulation losses, 142–144Diffraction losses, resonator, 163–165Diode arrays; see Laser diodesDipolar broadening, 23Disk amplifier, 137–140, 221, 225–229,
265–271; see also Slab laserDispersion compensation, 233–235Doppler broadening, 24Dye Q-Switch; see Saturable absorberDysprosium, 52
Efficiency factors, 89–95, 115, 117,126, 127, 136, 198, 211,217–219, 230, 240
Einstein coefficients, 17, 20Electronic feedback loop, 329, 330Electro-optic effect, 289–294Electrostriction, 146, 344Elliptical cylinder, pump cavity,
214–219Emissivity, 190End-pumped lasers, 116–118, 230–239,
271–276, 319, 323, 327, 329,332, 367, 377
Energy extraction, efficiency, 93, 99,125–127, 283
Energy leveldiagram, 29–31, 33, 55, 59, 63, 64,
67, 69, 71nomenclature, 48–51
Energy storage, 125–128Energy-transfer mechanisms, 88–95Erbium, 50, 51Er: glass laser, 67, 68Er: YAG laser, 51Etalon, 171, 176Europium, 52Excited state absorption, 72, 304, 305Explosion energy, flashlamp, 192, 193
Fabry–Perot interferometer, 170–173Fabry–Perot resonator; see Resonator,
opticalFaraday effect, 178Faraday isolator, 131, 132Femtosecond lasers, 331–336Fiber coupling, 236–238Finesse, 172, 173, 176
Flashlamps, 188–197Fluorescence, 18, 27, 32, 33, 40Fluorides, laser host, 48Forbidden transition, 34Fourier transform, 313, 314Four-level laser, definition, 33, 34Frequency chirp, 313, 333–335Frequency doubling; see
Second-harmonic generationFrequency stability, 179Fresnel number, 164–166, 180, 182Fundamental mode, 151–162; see also
Gaussian beam
g parameters, resonator, 162–167, 169,170
GaAlAs laser diodes, 111–118, 188,189, 197–213
Gadolinium, 50, 52Gain coefficient, 56, 57, 80–82, 85–96,
98–102, 125–128, 133, 282,365, 366, 376, 382
Gain saturation, 84–86, 125–127Garnet, laser host, 47; see also Nd:
YAG, YB: YAG lasersGaussian beam, 155–157Gaussian lineshape, 25Gaussian temporal profile, 313, 314Giant pulse; see Q-switchGlass, laser host, 46, 60–63, 67, 68Ground level, 31–34GSGG, laser host, 47
Harmonic generation; seeSecond-harmonic generation
Heat removal; see CoolingHeat-transfer coefficient, 249, 250Hemispherical resonator, 159–161Hermite polynomial, 151, 153Hole burning; see Spatial hole bumingHolmium, 50–52Homogeneous broadening, 22, 23Host materials, 46–48
Idler wave, 363–366, 368, 373, 374Indicatrix, 291, 292, 348–352Inhomogeneous broadening, 23–25Interferometer; see Fabry–Perot
interferometer

Index 407
Intracavity frequency doubling,358–360
Inversion reduction factor, 41Isolator, 136, 147
KDP, 291–293, 348, 350–354, 357,361, 362
Kerr effect, 146, 147, 290, 317–322,331, 343, 344
Kerr lens mode locking, 317–322,331–336
Kerr lens sensitivity, 318Krypton arc lamp, 188, 189, 197, 198KTP, 354, 355, 357, 359, 360, 366, 367,
370, 371
Laguerre polynomial, 151, 152Large-radius mirror resonator, 158, 160Laser amplifier; see AmplifierLaser diode pumped systems, 111–118,
131–136, 221–241Laser diodes, 197–213; see also
GaAlAs laser diodesLaser threshold; see Oscillator,
threshold conditionLifetime broadening, 22Light-pipe mode, 145LiNbO3, 291–294, 353, 354, 357,
372–374Line broadening effects, 22–25Linewidth, 21–26, 58, 62, 66, 73, 81,
173–176, 178, 179, 381Longitudinal mode selection, 176–179Longitudinal modes, 150, 173–176Lorentzian lineshape, 23, 25Loss modulation, 322–325
Metastable level, 34, 35Mode locking, 308–336Mode locking, active, 322–326Mode locking, passive, 315–317Mode matching, 92, 93, 116Mode patterns, 152, 154Mode radius, resonator modes, 153,
155, 156, 162, 163, 166, 167,169, 170, 232
Mode selectionlongitudinal, 176–179transverse, 167–170
Monolithic laser, 177MOPA design, 123, 137
Nd: Cr: GSGG laser, 47Nd: glass laser, 60–63
amplifier, 136–142Nd: YAG laser, 57–60, 106–118, 177,
287, 288amplifier, 128–136thermal effects, 250–263
Nd: YLF laser, 48Nd: YVO4 laser, 65–67Neodymium; see Nd: glass, Nd: YAG,
Nd: YLF, Nd: YVO4, Nd: Cr:GSGG lasers
Noncritical phase matching, 353Nonlinear coefficient, 346, 351, 354,
366, 367Nonlinear crystals, 354Nonlinear optical effects, 340–345Nonlinear refractive index, 138, 139,
147, 318, 331Nonspherical aberration, 363
Optical parametric oscillator, 363–374Optical phase conjugation, 379–384Optical resonator; see Resonator,
opticalOrganic dye; see Saturable absorberOscillator, threshold condition, 80–84,
97Oscillator loop, electronic feedback,Output coupling, 95, 98, 99, 108, 109,
110, 111Output fluctuation, 102–107Output vs input calculation, 95–102
Parasitic modes, 145Passive mode locking; see Mode
locking, passivePassive Q-switch, 302–305; see also
Dye Q-switchPeriodically poled crystals, 372–374PFN; see Pulse-forming networkPhase coherence, stimulated emission,
19Phase matching, 345–356, 363, 366,
369, 370, 372–374Phase modulation, 329–331

408 Index
Picosecond lasers, 326–331Planck’s constant, 12Planck’s law, 15Plane-parallel resonator, 159, 160Plane wave impedance, 346Plano-concave resonator, 160Plastic Q-switch, 302Pockels cell Q-switch, 290–295Polarization, induced, 340–343Population inversion, 13, 28–35, 82,
124Potassium titanyl phosphate; see KTPPower supplies, 194–197, 213PPLN, 372–374Praseodymium, 50, 52Prelasing, 145–147Pulse-forming network, 194–197Pump band, 31, 33Pump cavity, 214–221Pump source efficiency, 89Pumping rate, 37, 83–86, 94, 102,
104
Quasi phasematching, 372–374Q-switch devices
acousto-optic, 295–302electro-optical, 289–295mechanical, 288passive, 302–305
Q-switch theory, 280–288Quality factor Q, 81, 279Quantum efficiency, 37, 40Quantum noise, 178Quantum well, 201, 202
Radiation transfer efficiency, 89,90
Raman laser, 374–379Raman–Nath scattering, 296Rare earth ions, 49–52Rate equations, 35–40Rectangular slab laser, 265, 268Relaxation oscillation, 102–106Resonant reflector, 171–173Resonator, optical, 150–183
configuration, 157–160modes, 150–154unstable, 179–183
Ring laser, 177, 178
Ruby laser, 54–57
Samarium, 52Saturable absorber, 302–305Saturation fluence, flux, 85, 86,
125–127Second-harmonic generation, 345–360
intracavity, 358–360theory, 345–353
Self-focusing, 145–148Self mode locking; see Kerr lens mode
lockingSemiconductor, pump source, 197–213Sensitivity factor, thermal lensing, 257,
258Sensitizer, 52, 67, 68Servo loop; see Electronic feedback
loopSide-pumped active material, 107–116,
214–230Simmer triggering, 195Slab laser, 185, 221, 225–229, 265–271Slope efficiency, 96, 97Spatial filter, 137Spatial hole burning, 177Spectral characteristic, laser output,
173–176Spiking; see Relaxation oscillationSpontaneous emission, 18Spot size, definition, 155, 156, 162,
163Stability diagram for resonator, 161,
162, 167, 321Stefan–Boltzmann equation, 16, 17Stimulated emission, 19, 25
cross section, 28Stimulated Raman scattering, 344,
374–379Stokes factor, 91, 92Stokes shift, 375, 377Storage efficiency, 94System efficiency, 88, 115, 117, 136
TEMmnq , TEMplq modes, definition,150–154
Thermal beam distortion, 245,255–263, 267, 268, 275
Thermal broadening, 23Thermal effect, laser rod

Index 409
birefringence, 258–263fracture, 245, 252lensing, 255–258
Third-harmonic generation, 360–363Three-level laser, 31, 32, 36–39Threshold condition; see Oscillator,
threshold conditionThreshold input, 97Thulium, 52Ti: sapphire laser, 72–74, 319–322,
331Tm: YAG, 52Transition metals, 53, 54Transverse mode selection; see Mode
selection, transverseTransverse modes, 150–156Travelling wave oscillator; see Ring
laserTrigger circuit, flashlamp, 191Tunable lasers, 70–74Tungstate, laser host, 45Type I, II phase matching, 351, 352,
354
Uniaxial crystal, 348Unstable resonator, 179–183Upper state efficiency, 89, 92
Vanadate, laser host, 47Variable reflectivity mirror, 183, 184Vibronic lasers, 70–74
Waist, Gaussian beam, 155, 156Wavefront distortion, 139, 380Whisper modes, 145Wien’s displacement law, 16
Xenon arc, spectral data, 190, 191
YAG, laser host, 47, 57–60, 68–70; seealso Nd: YAG, Er: YAG, Yb:YAG lasers
Yb: YAG, 68–70YLF, laser host, 48, 63–65Ytterbium, 52
Zig-zag slab laser, 185, 268–270