solid-state ¹³c nmr determination of the … ·...
TRANSCRIPT
NBS
PUBLICATIONS
NBSIF
A111D2 4T173fa
NATL INST OF STANDARDS & TECH R.I.C.
All 102491 736Manders, William F/Solld-state carbon 1
QC100 .1156 NO.86-3380 1986 V19 C.1 NBS-P
Solid-State 13C NMR Determination of
the Syringyl/Guaiacyl Ratio in
Hardwood
William F. Manders
U.S. DEPARTMENT OF COMMERCENational Bureau of Standards
National Engineering Laboratory
Center for Fire Research
Gaithersburg, MD 20899
May 1986
4**' °' %J? W V
#</*r*u o*s
U.S. DEPARTMENT OF COMMERCE‘“'•ONAL BUREAU OF STANDARDS
QC
100
. U 5 6
86-3380
1986
C. 2


NBS
RESEARCH
INFORMATION
CENTER
NBSIR 86-3380
SOLID-STATE 13C NMR DETERMINATION OFTHE SYRINGYL/GUAIACYL RATIO IN
HARDWOOD
William F. Manders
U.S. DEPARTMENT OF COMMERCENational Bureau of Standards
National Engineering Laboratory
Center for Fire Research
Gaithersburg, MD 20899
May 1986
U.S. DEPARTMENT OF COMMERCE, Malcolm Baldrige, Secretary
NATIONAL BUREAU OF STANDARDS. Ernest Ambler, Director


Solid-State NMR Determination of the
Syringyl/Guaiacyl Ratio in Hardwood
by William F. Manders
Center for Fire ResearchNational Bureau of Standards
Gaithersburg, MD 20899
Keywords
1 ^C NMR, Solid-State NMR, Lignin, Softwood, Hardwood, Syringyl/Guaiacyl Ratio
Summary
13The unprotonated aromatic regions of the solid-state C NMR spectra of
several hardwoods and softwoods are examined. Spectra are acquired with cross
polarization, magic-angle spinning, and delayed proton decoupling. The hard-
wood spectra are decomposed into syringyl and guaiacyl components with the aid
of a softwood spectrum, which is assumed to be the same as the guaiacyl
component of the hardwood spectrum. The molar ratio of syringylpropanoid
units to guaiacylpropanoid units (S/G) in hardwood is determined from the
intensities of their respective component spectra. Ratios for elm (0.45),
basswood (0.70), oak (0.70), maple (0.85), cherry (1.00), birch (1.00), and
poplar (1.20) are reported. These results were comparable to literature
values that were obtained by a combination of methoxyl and elemental analyses.
Nitrobenzene oxidation gave syringaldehyde/vanillin ratios that were approxi-
mately three times greater than the corresponding NMR S/G ratios.
-1-
Introduction
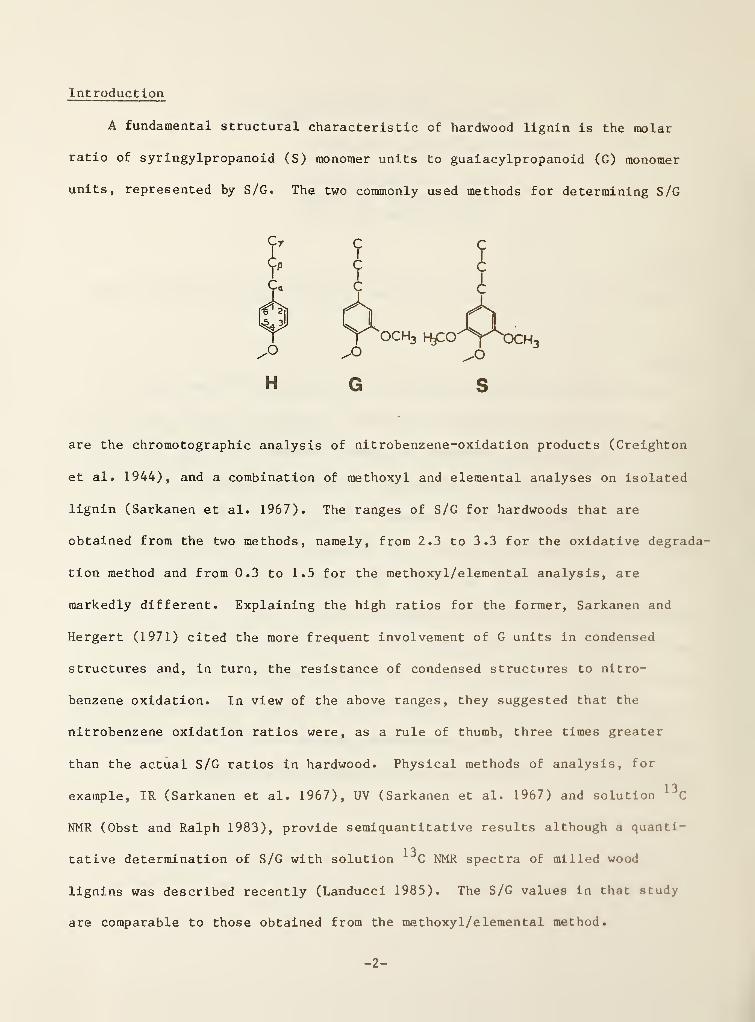
A fundamental structural characteristic of hardwood lignin is the molar
ratio of syringylpropanoid (S) monomer units to guaiacylpropanoid (G) monomer
units, represented by S/G. The two commonly used methods for determining S/G
are the chroraotographic analysis of nitrobenzene-oxidation products (Creighton
et al. 1944), and a combination of methoxyl and elemental analyses on isolated
lignin (Sarkanen et al. 1967). The ranges of S/G for hardwoods that are
obtained from the two methods, namely, from 2.3 to 3.3 for the oxidative degrada-
tion method and from 0.3 to 1.5 for the methoxyl/elemental analysis, are
markedly different. Explaining the high ratios for the former, Sarkanen and
Hergert (1971) cited the more frequent involvement of G units in condensed
structures and, in turn, the resistance of condensed structures to nitro-
benzene oxidation. In view of the above ranges, they suggested that the
nitrobenzene oxidation ratios were, as a rule of thumb, three times greater
than the actual S/G ratios in hardwood. Physical methods of analysis, for
1 3example, IR (Sarkanen et al. 1967), UV (Sarkanen et al. 1967) and solution C
NMR (Obst and Ralph 1983), provide semiquantitative results although a quanti-
1
3
tative determination of S/G with solution C NMR spectra of milled wood
lignins was described recently (Landucci 1985). The S/G values in that study
are comparable to those obtained from the methoxyl/elemental method.
-2-

Described here is a quantitative method for determining S/G in whole
hardwood with solid-state C NMR techniques including cross polarization (CP)
and magic-angle spinning (MAS) (Schaefer and Stejskal 1976; Yannoni 1982).
The potential of the solid-state NMR experiment is indicated by (1) the
broad range of chemical shifts for lignin (Liidemann and Nimz 1973),
(2) the quantitativeness of the CP/MAS wood spectra (Haw et al. 1984a), and
(3) the convenience and simplicity of whole-wood sampling. Seven genera of
hardwood are represented in order to test the universality of the method and
permit multiple comparisons with S/G values obtained by other techniques.
Experimental
Samples of the following woods were obtained from commercial lumber
stock: spruce ( Picea spp. ) , western red cedar ( Thuja plicata) , southern pine
( Pinus spp.), maple (Acer spp.), yellow poplar (Liriodendron tulipifera ), red
oak ( Quercus spp.), basswood ( Tilia spp.), and cherry ( Prunus spp.). The
white birch ( Betula papyrifera ) and american elm (Ulmus americana ) samples
were taken directly from trunk wood. Samples were ground in a Wiley mill and
the wood meal (40 mesh) was extracted with benzene/ethanol (2:1) in a Soxhlet
apparatus for 8 hr and air dried. The extracted ground wood (320 mg) was
mixed with adamantane (10 mg), a secondary chemical shift reference
(6 = 29.50 ppm and 38.56 ppm), and pressed into pellets. Because of weak C-H
dipolar couplings, the adamantane signal survives the delay-decoupled
experiment.
1
3
The C NMR spectra were obtained at 15.08 MHz on a homebuilt spectro-
meter. Delay-decoupled spectra were acquired with 2 ms of cross polarization
1 13with the H and C fields matched at 57 kHz, high-power proton decoupling
that was begun 45 us after the conclusion of cross polarization, and raagic-
-3-
angle spinning at 2300 Hz. 90,000 scans were averaged with a repetition rate
of 1.5 s. The signal-to-noise ratio was improved by exponential apodization,
which introduced 12-Hz line broadening. Baseline corrections and phasing were
carefully maintained in order to ensure reproducible intensity measurements of
the unprotonated aromatic region, which is measured from 115 to 163 ppm.
Phasing parameters were obtained from the delay-decoupled spectrum of
hexamethylbenzene
.
Results and Discussion
Analysis of Wood NMR Spectra
The chemical shift assignments in the CP/MAS 1JC NMR spectra of softwoods
(Fig. la) and hardwoods (Fig. lc) have been discussed previously (Kolodziejski
et al. 1982; Taylor et al. 1983; Haw et al. 1984; Haw et al. 1984a); the
distinguishable features of the wood spectrum are assigned as follows: from
60 to 110 ppm, cellulose and herai celluloses ;from 110 to 160 ppm and 56 ppm,
aromatic and methoxyl carbons, respectively, in lignin; and 20 ppm and
172 ppm, methyl and carboxylate carbons, respectively, in acetyl groups of
hemicelluloses . Delayed decoupling (Opella and Frey 1979) is employed in
order to select certain lignin resonances in the CP/MAS spectrum. With this
technique, the intensities due to carbons with one or two directly bonded
protons, which include the principal carbohydrate carbons, are reduced to an
insignificant fraction of their original intensity. Accordingly, resonances
due to methoxyl (56 ppm) and unprotonated aromatic (115-163 ppm; C-l,C-3 ,
and
C-4 in G; C-l, C-3, C-4, and C-5 in S) carbons appear in the delay-decoupled
softwood (Fig. lb) and hardwood (Fig. Id) spectra. The relative intensities
of the unprotonated aromatics are unaltered (Schmitt and Sheppard 1984), but
the usefulness of the methoxyl resonance is reduced by its nonquant 1 tat l ve
-4 -

intensity (Schmitt and Sheppard 1984) and overlap with residual carbohydrate
signal. The unprotonated aromatic regions of the delay-decoupled spectra of
softwood (spruce, cedar, and pine) and hardwood (poplar, birch, cherry, maple,
oak, basswood, and elm) are shown in Figures 2 and 3, respectively.
lO ##
Lignin high-resolution C NMR data (Ludemann and Nimz 1973, 1974), with
which most of the following assignments are made, include multiple chemical
shifts for many of the unprotonated aromatic carbons, owing to inter-unit
structural variations. This fine structure is generally not resolved in the
solid-state spectra. Unless specified, an assignment to a particular carbon
in either an S or G unit pertains to all structures of the unit.
Peaks in the softwood spectrum (Fig. 2) are assigned to unprotonated
aromatic carbons in G units; only trace amounts of p-hydroxyphenylpropanoid
(H) units (Westermark 1985) and S units (Obst and Landucci 1986) are reported
for softwoods. The absence of significant intensity from 160 to 162 ppm, a
region assigned to C-4 in H units (Ludemann and Nimz 1973, 1974; Nimz et al.
1981) is consistent with this assignment. The broad, structured peak centered
at 148 ppm is composed of resonances due to C-3 and C-4 (Liideraann and Nimz
1973); the peak at 134 ppm is assigned to C-l (Ludemann and Nimz 1973).
Slight differences in the structure of the downfield resonance distinguish the
three softwood spectra.
The hardwood spectrum (Fig. 3) comprises resonances due to unprotonated
aromatic carbons in either S or G units; the absence of significant intensity
from 160 to 162 ppm is consistent with reports (Sarkanen and Hergert 1971;
Nimz et al. 1981) of there being only trace amounts of H units in hardwoods.
The broad resonance at 136 ppm is assigned to C-l in G units and to C-l and
C-4 in S units (Ludemann and Nimz 1973). The sharp peak at 153.5 ppm is
assigned to C-3 and C-5 in S units which are O-alkylated at C-4 (Haw et al.
-5-

1984). The upfield wing of the 153.5 ppm peak is assigned to C-3 and C-4 in G
units (Ludemann and Nimz 1973). C-3 and C-5 in S units that are not
O-alkylated at C-4 appear at 148 ppm (Haw et al. 1984) and also contribute
intensity to the wing, but the total number of S and G phenols in hardwood
lignin is small, about 15% (Nimz 1974). In addition, it is expected that S
phenols are the minority in view of the limited ability of the dimethoxy-
substituted S unit to form condensed structures. In the cherry spectrum (Fig.
3c), the peak at 145 ppm and the intensity from 155-160 ppm are due to
condensed tannins (Newman et al. 1985). The possibility of removing these
impurities by means of additional extractive methods (Newman et al. 1985) was
not investigated.
Determination of S/G
Large differences in the magnitude of S/G are apparent in the delay-
decoupled CP /MAS ^C NMR spectra of the hardwoods (Fig. 3). As S/G increases,
the peak at 153.5 ppm (C-3 and C-5 in S units) will increase in intensity
relative to its upfield wing (C-3 and C-4 in G units). Poplar (Fig. 3a)
clearly exhibits the greatest S/G, and elm (Fig. 3g) the smallest; the others
are placed intermediately but are not readily distinguishable.
In order to obtain S/G, the unprotonated aromatic region of the hardwood
spectrum is decomposed into individual spectra of the S and G components. The
decomposition is based upon two assumptions. The first is that the softwood
spectrum closely resembles the G component of the hardwood spectrum.
Consistent chemical shifts are evidenced by the nonexistence of a hardwood/
softwood distinction for the high-resolution G-unit chemical shifts (Luden&nn
and Nimz 1973). With respect to resonance intensities, structural studies
suggest that the abundances of G structural units are mostly unaffected by the
-6-

incorporation of S units. This conclusion is based upon the abundances of
structural units that involve C-5 and therefore must contain a G unit. On a
per-G-unit basis, the respective numbers of 5-0-4 (diphenylether) and 8-5
(phenylcoumaran) structures found in hardwood (Niraz 1974) are comparable to
those in softwood (Adler 1977). Some minor intensity differences between the
softwood spectrum and the G component of the hardwood spectrum are expected
owing to the lower abundance of the exceptional 5-5 (biphenyl) structure in
hardwood (Nimz 1974; Adler 1977). The second assumption is the existence of a
G-resonance window from about 146 to 148 ppm in the hardwood spectrum. The
proximity of the chemical shift of C-3 and C-5 in unalkylated S units
(148 ppm) is presumed to be inconsequential in view of the low abundance for
this structure ( vide supra ).
The relative total intensities of the S and G components of the hardwood
spectrum are determined in the following manner. A hardwood spectrum is
paired with a softwood spectrum and the latter is linearly scaled by a factor
that renders it less intense than the G component of the hardwood spectrum.
This is indicated by positive intensity in the G-resonance window in the
difference spectrum (hardwood minus softwood). The softwood spectrum is then
scaled upward, and difference spectra generated, until some point in the
difference spectrum, presumably in the G-resonance window, has just begun to
go negative (illustrated in Fig. 4). When this occurs, the total intensity
and the spectrum of the S component are given by the difference spectrum
(exclusive of tannin resonances); the G-component total intensity is equal to
the total intensity of the softwood spectrum. Before S/G is calculated, the S
and G intensities are normalized to an equal number of unprotonated aromatic
carbons in their respective structures.
- 7-

Decompositions of the hardwood spectra in Figure 3 with the cedar
softwood spectrum (Fig. 2b) gave the S-component (difference) spectra shown in
Figure 5. Each spectrum consists of two peaks, except the cherry (Fig. 5c),
which also contains the previously identified tannin resonances. The chemical
shift of the upfield resonance in the S spectrum, which is assigned to C-l and
C-4, is 137 ppm; the position of the downfield peak (C-3 and C-5) was
unaffected by the decomposition. The intensities of the two resonances
provide evidence for the validity of the decomposition. Since each resonance
is assigned to two carbons in the S unit structure, equal intensities are
indicated. In the S spectra, the intensity of the peak at 137 ppm ranges from
0.85 to 0.96 times the intensity of the peak at 153.5 ppm.
With regard to the abundance of unalkylated S units in hardwood, it is
noted that only the elm S spectrum (Fig. 5g) exhibits significant intensity at
148 ppm. A simulation of the unalkylated component of the S spectrum (Fig.
6a) (cf. Haw and Schultz 1985) was constructed from the poplar S spectrum by
isolating a segment of the spectrum containing only the peak at 153.5 ppm,
shifting the segment 5 ppm upfield, and adding it to the remaining upfield
resonance. After scaling the total intensity of the unalkylated spectrum to a
certain percentage of the elm S spectrum intensity, it was subtracted from the
original elm spectrum and the decomposition was repeated. The resulting S
spectra are compared in Figure 6b. The intensity at 148 ppm is completely
removed when the subtracted unalkylated intensity is equal to about 6% of the
total S-unit intensity. More significant, the intensity of the G component
was not changed from the value obtained in the original decomposition.
Accordingly, S/G was also unaffected.
-8-
The values of S/G for the hardwood/softwood pairs are given in Table 1.
In each case the use of the cedar spectrum as the softwood spectrum resulted
in the greatest S/G; spruce and pine gave comparable values. Most were within
0.05 ratio units of their respective averages, and this interval was adopted
as the uncertainty in the average value of S/G. Averages ranged from 0.45,
for elm, to 1.20 for poplar. Published methoxyl/elemental results (Sarkanen
and Hergert 1971) for five of the hardwoods and nitrobenzene oxidation results
for the samples used in this study are included in Table 1. The solid-state
NMR S/G values are in close agreement with the methoxyl/elemental results;
the orders of S/G values, excluding the basswood entries, that were obtained
1 ^by the two methods are the same. Hence the solid-state C NMR method
provides confirmation of the methoxyl/elemental method for determining S/G.
Nitrobenzene oxidation yielded syringaldehyde/vanillin (S/V) ratios that were
approximately three times greater than the corresponding NMR S/G values.
Interestingly, Sarkanen and Hergert (1971) suggested that the S/V ratios were,
as a rule of thumb, three times greater than the ratios of the corresponding
units in hardwoods (see Introduction).
Acknowledgments
The author is grateful to J.R. Obst for discussion of lignin structure
and composition, to D.L. VanderHart for discussion of the NMR experiment, to
D.M. Crawford for the nitrobenzene oxidation analyses, and to R.H. White for
providing several of the wood samples.
-9-

References
Adler, E. 1977. Lignin Chemistry - Past, Present and Future. Wood Sci.
Technol. _U, 169-218.
Creighton, R.H.J., R.D. Gibbs and H. Hibbert. 1944. Studies on Lignin and
Related Compounds. LXXV. Alkaline Nitrobenzene Oxidation of Plant
Materials and Application to Taxonomic Classification. J. Am. Chera. Soc.
J56 ,32-37.
Haw, J.F., G.E. Maciel, and C .J . Biermann. 1984. Carbon-13 Nuclear Magnetic
Resonance Study of the Rapid Steam Hydrolysis of Red Oak. Holzf orschung
38, 327-331.
Haw, J.F., G.E. Maciel, and H.A. Schroeder. 1984a. Carbon-13 Nuclear
Magnetic Resonance Spectrometric Study of Wood and Wood Pulping with Cross
Polarization and Magic-Angle Spinning. Anal. Chera. 56^ 1323-1329.
Haw, J.F. and T.P. Schultz. 1985. Carbon-13 CP/MAS NMR and FT-IR Study of
Low-Temperature Lignin Pyrolysis. Submitted for publication.
Kolodziejski, W., J.S. Frye, and G.E. Maciel. 1982. Carbon-13 Nuclear
Magnetic Resonance Spectrometry with Cross Polarization and Magic-Angle
Spinning for Analysis of Lodgepole Pine Wood. Anal. Chera. 54,
1419 - 1424 .
Landucci, L.L. 1985. Quantitative ^C NMR Characterization of Lignin. 1. A
Methodology for High Precision. Holzf orschung 39, 355-359.
-10-
Ludemann, H.-D. and H. Nimz . 1973. Carbon-13 Nuclear Magnetic Resonance
Spectra of Lignins. Biochem. Biophys. Res. Commun. 52_,
1162-1169.
Ludemann, H.-D. and H. Nimz. 1974. ^C-Kernresonanzspektren von Ligninen,
Z. Buchen- und Fichten-Bjorkman-Lignin. Makromol. Chem. 175,2409-2422.
Newman, R.H., K.R. Morgan, and G.J. Leary. 1985. Characterization of Lignin
Structures in Whole Wood by Carbon-13 CP /MAS Nuclear Magnetic Resonance.
Int. Sym. Wood Pulp. Chem., Vancover, British Columbia, pp. 53-54.
Nimz, H. 1974. Beech Lignin - Proposal of a Constitutional Scheme. Angew.
Chem. internat. Edit. 13,313-321.
Nimz, H.H., D. Robert, 0. Faix and M. Nemr. 1981. Carbon-13 NMR Spectra of
Lignins, 8. Structural Differences Between Lignins of Hardwoods,
Softwoods, Grasses and Compression Wood. Holzforschung 3_5, 16-26.
Obst, J.R. and J. Ralph. 1983. Characterization of Hardwood Lignin:
Investigation of Syringyl/Guaiacyl Composition by ^C Nuclear Magnetic
Resonance. Holzforschung 37,297-302.
Obst, J.R. and L.L. Landucci. 1986. The Syringyl Content of Softwood Lignin.
J. Wood Chem. Tech., in press.
Opella, S .J . and M.H. Frey. 1979. Selection of Nonprotonated Carbon
Resonances in Solid-State Nuclear Magnetic Resonance. J. Am. Chem. Soc.
101 ,5854-5856.
-11-

Sarkanen, K.V., H.M. Chang and G.G. Allan. 1967. Species Variation in
Lignins III. Hardwood Lignins. Tappi 50 ,587-590.
Sarkanen, K.V. and H.L. Hergert. 1971. Classification and Distribution. In
"Lignins: Occurrence, Formation, Structure, and Reactions." Ed. by
K.V. Sarkanen and C.H. Ludwig, Wiley-Interscience , New York. Chapter 3,
pp. 63-79.
Schaefer, J. and E.O. Stejskal. 1976. Carbon-13 Nuclear Magnetic Resonance
of Polymers Spinning at the Magic Angle. J. Am. Chem. Soc. 98_, 1031-1032.
Schmitt, K.D. and E.W. Sheppard. 1984. Determination of Carbon Center Types
in Solid Fuel Materials by CP /MAS N.M.R. Fuel 63_, 1241-1244.
Taylor, M.G., Y. Deslandes, T. Bluhm, R.H. Marchessault ,M. Vincendon, and J.
Saint-Germain. 1983. Solid State ^C NMR Characterization of Wood. Tappi
66^, 92-94.
Westermark, U. 1985. The Occurrence of p-Hydroxyphenylpropane Units in the
Middle-Lamella Lignin of Spruce ( Picea abies ). Wood Sci. Technol. 19,
223-232.
Yannoni, C.S. 1982. High-Resolution NMR in Solids: The CPMAS Experiment.
Acc. Chem. Res. 15 ,201-208.
-12-

Table 1
Hardwood Values of S/G Obtained by Solid-State 13C NMR and Other Methods
Hardwood Spruce-Softwood-
Cedar PineArithmetic
MeanaMethoxyl/Elemental^
NitrobenzeneOxidation0
Elm 0.42 0.49 0.44 0.45 0.32 1.3
Basswood 0.67 0.77 0.63 0.70 0.92 2.0, 2.1
Oak 0.65 0.76 0.68 0.70 0.72 2.2, 2.4
Maple 0.79 0.88 0.81 0.85 0.79 3.0
Cherry^ 0.98 1.05 0.99 1.00 — 3.9, 4.2
Birch 0.98 1.05 0.99 1.00 0.92 2.9, 3.2
Poplar 1.16 1.23 1.16 1.20 — 3.6
aRounded to nearest pentad, uncertainty is ± 0.05.^Sarkanen and Hergert (1971). For lignin thioglycolic acids.cSyringaldehyde-vanillin molar ratio. Method in Obst and Landucci (1985).
Duplicate analyses were performed on some samples.^Tannin resonances in this spectrum increase the uncertainty of S/G.
-13-
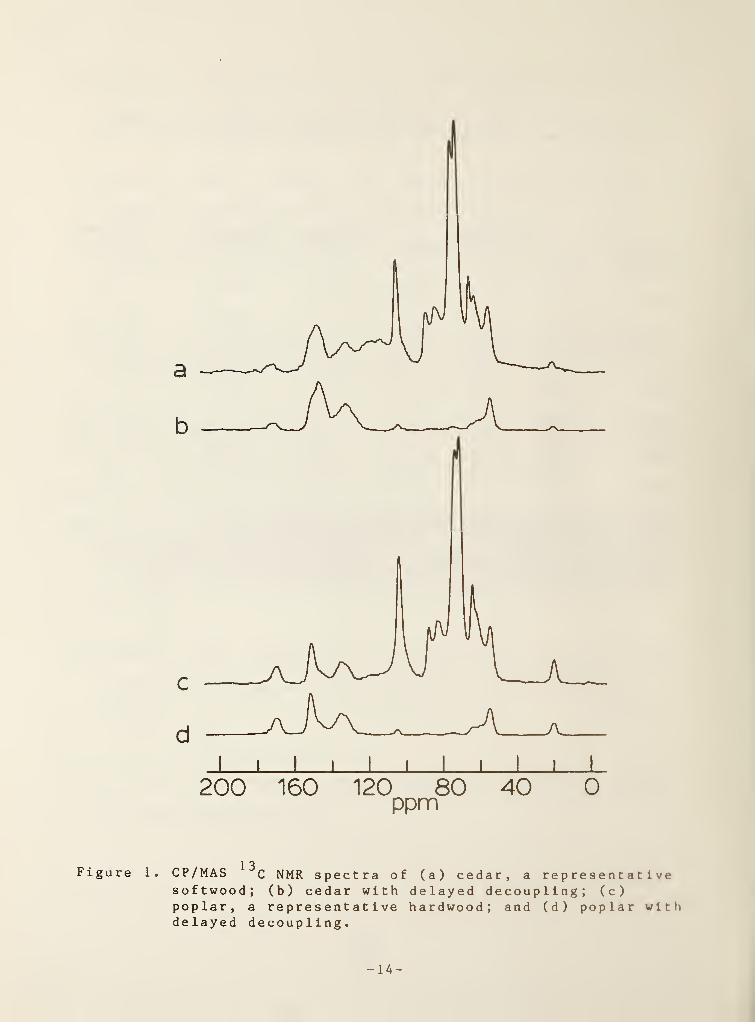
1 3Figure 1. CP/MAS C NMR spectra of (a) cedar, a representativesoftwood; (b) cedar with delayed decoupling; (c)poplar, a representative hardwood; and (d) poplar withdelayed decoupling.
- 14 -

_l 1 I I II I 1 I L
160 150 140 130 120ppm
Figure 2. The unpijotonated aromatic region of the delay-decoupledCP/MAS C NMR spectra of selected softwoods: (a)spruce, (b) cedar and (c) pine. Total spectralintensities are equivalent.
- 15 -

_1 I I I I I I I I L
160 150 140 130 120ppm
Figure 3. The unprotonated aromatic region of the delay-decoupledCP/MAS C NMR spectra of selected hardwoods: (a)poplar, (b) birch, (c) cherry, (d) maple, (e) oak, (f)
basswood and (g) elm. The spectra are arranged fromtop to bottom in order of decreasing S/G. The changein the intensity of the sharp S-unit peak at 133.5 ppmrelative to its upfield wing, due to G units, can be
seen. Total spectral intensities are normalized to anequivalent total of monomeric units by utilizing theaverage S/G values in Table 1.
- 16 -

1 I 1I
I I I I I I
160 150 140 130 120 ppm
Figure 4. Illustration of decomposition method for obtaining theindividual intensities of the S and G components. Theproperly scaled softwood (cedar) spectrum (b) is
subtracted from the hardwood (poplar) spectrum (a) togive its S component (c). (See text for details.)
- 17 -

_l I I I I I I 1 I L
160 150 140 130 120ppm
Figure 5. The S-component spectrum of the following hardwoods:(a) poplar, (b) birch, (c) cherry, (d) maple, (e) oak,(f) basswood and (g) elm. (See text for details.)Total spectral intensities are equivalent.
- 18 -

_l I I I I I 1 I I L
160 150 140 130 120 ppm
Figure 6. The simulated unalkylated S spectrum is shown in (a).Scaled versions of (a) representing the indicatedabundances were subtracted from Fig. 3g and itsdecomposition with the cedar softwood spectrum wasrepeated. The resulting S component spectra arecompared in (b).
- 19 -

NBS-114A (rev. 2 -80 )
U.S. DEPT. OF COMM.
BIBLIOGRAPHIC DATASHEET (See instructions)
1. PUBLICATION ORREPORT NO.
NBSIR-66/3380
2. Performing Organ. Report No. 3. Publication Date
May 1986
4. TITLE AND SUBTITLE
Solid-State NMR Determination of the Syringyl/Guaiacyl Ratio in Hardwood
5. AUTHOR(S)
6 .
William F. MandersPERFORMING ORGANIZATION (If joint or other than NBS. see instructions) 7. Contract/Grant No.
NATIONAL BUREAU OF STANDARDS _DEPARTMENT OF COMMERCE 8
Gaithersburg, MD 20899
9. SPONSORING ORGANIZATION NAME AND COMPLETE ADDRESS (Street. City, State. ZIP
)
. Type of Report & Period Covered
10. SUPPLEMENTARY NOTES
gj Document describes a computer program; SF-185, FIPS Software Summary, is attached.
11. ABSTRACT (A 200-word or less factual summary of most significant information. If document includes a significant
bi bliography or literature survey, mention it here)
1 TThe unprotonated aromatic regions of the solid-state C NMR spectra of several
hardwoods and softwoods are examined. Spectra are acquired with cross polariza-
tion, magic-angle spinning, and delayed proton decoupling. The hardwood spectra
are decomposed into syringyl and guaiacyl components with the aid of a softwood
spectrum, which is assumed to be the same as the guaiacyl component of the hard-
wood spectrum. The molar ratio of syringylpropanoid units to guaiacylpropanoid
units (S/G) in hardwood is determined from the intensities of their respective
component spectra. Radios for elm (0.45), basswood (0.70), oak (0.70), maple (0.85),
cherry (1.00), birch (1.00), and poplar (1.20) are reported. These results were
comparable to literature values that were obtained by a combination of methoxyl and
elemental analyses. Nitrobenzene oxidation gave syringaldehyde/vanillin ratios that
were approximately three times greater than the corresponding NMR S/G ratios.
12. KEY WORDS (Six to twelve entries; alphabetical order; capitalize only proper names; and separate key word-, b, semicolon »
carbon 13; guaiacyl; hardwood; lignin; nuclear magnetic resonance;softwood; syringyl
13. AVAILABILITY
[]X] Uni i mi ted
Q“] For Official Distribution. Do Not Release to NTIS
[" 1 Order From Superintendent of Documents, U.S. Government Printing Office, Washington, D.C." 20402.
fvl Order From National Technical Information Service (NTIS), Springfield, VA. 22161
14. NO. OFPRINTED PAGES
22
15. Price
$9.95
JICOMM-OC #04 • ••* i