solar refrigeration project - core
TRANSCRIPT
Worcester Polytechnic InstituteDigital WPI
Major Qualifying Projects (All Years) Major Qualifying Projects
April 2019
Solar Refrigeration ProjectKyle James HaveyWorcester Polytechnic Institute
Follow this and additional works at: https://digitalcommons.wpi.edu/mqp-all
This Unrestricted is brought to you for free and open access by the Major Qualifying Projects at Digital WPI. It has been accepted for inclusion inMajor Qualifying Projects (All Years) by an authorized administrator of Digital WPI. For more information, please contact [email protected].
Repository CitationHavey, K. J. (2019). Solar Refrigeration Project. Retrieved from https://digitalcommons.wpi.edu/mqp-all/7035
Development of an Off Grid Solar Powered
Milk Refrigeration Solution
25 April 2019
Abad, Brandon, WPI ’19
Curtis, Michael, WPI ’19
Havey, Kyle, WPI ’19
Nash, Peter, WPI ’19
Stapleton, Joseph, WPI ’19
Xu, Luke, WPI ’19
This report is submitted in partial fulfillment of the degree requirements of Worcester
Polytechnic Institute.
The views and opinions expressed herein are those of the authors and do not necessarily reflect
the positions or opinions of Worcester Polytechnic Institute.
1
Abstract
The goal of this project was to design and build a milk refrigerator that could work off-
the-grid. The refrigerator was designed to maintain freshness of 25 liters of milk. Rural farmers
are forced to either discard their “evening milk,” or milk produced by cows in the evening, or
sell it at a fraction of the market price of milk due to deteriorating quality. With the assistance of
the refrigerator in this study, rural farmers in sub-Saharan will be able to sell their “evening
milk” the next morning at full value. The refrigerator was manufactured using a steel frame,
polystyrene insulation, copper tubing, and a repurposed refrigeration system from a mini-fridge.
The refrigerator functions by cooling and freezing water during the day using solar energy, and
using the ice to cool the milk stored in the copper tubes in the evening. While the milk is cooling,
a pump is circulating the milk in the copper tubes to ensure even cooling and a greater heat flux.

2
Individual Responsibilities and Contributions
Brandon Abad
- Photographer
- Assembly Manufacturing
- Arduino Coding and Sensor Integration
- Unit Experimentation
- Data Acquisition
Michael Curtis
- Assembly Manufacturing
- Arduino Coding and Sensor Integration
- Unit Experimentation
- Data Acquisition
Kyle Havey
- Poster Design
- Thermal Analysis
- Section 3.1: Determine Optimal Power Source
- Section 4.2: Design 2 Calculations and Derivations
- Section 5.2: Recommendations
- Appendix
Peter Nash
- Manufacturing Space Logistics
- Assembly Manufacturing
- Unit Experimentation
- Data Acquisition
- Poster Design
- Second CAD Model
- Section 3.3: Construct Prototype
Joseph Stapleton
- Material Acquisition
- Poster Design
- Assembly Manufacturing
- Unit Experimentation
- Data Acquisition

3
- Section 3.2: Create Initial Design
- Section 3.4: Prototype Testing
Luke Xu
- Abstract
- Poster Design and Printing
- Section Introductions
- Proofreading
- Thermal Analysis
- Structural Analysis
- First CAD Model
- Section 3.6: First Design
- Section 3.7: Second Design
- Section 4.2: Design 2 Calculations and Derivations
- Section 5.1: Results
- Appendix
4
Acknowledgements
Our team would like to acknowledge the Hunt Institute for sponsoring this project idea
and offering their support and expertise during our information gathering stage. We would also
like to thank the WPI Mechanical Engineering department for financially supporting this project.
Finally, our team would like to thank our advisor Ahmet Can Sabuncu for the guidance he
provided during the entirety of our project.
5
Table of Contents
Chapter 1: Introduction 7
Chapter 2: Background 9
2.1: Electricity and Industry 9
2.1.1: Electric Grid in Sub-Saharan Africa 9
2.1.2: Solar Power Technology in Sub-Saharan Africa 10
2.2: Farming in Developing Kenya 11
2.3: Dairy Industry in Sub-Saharan Africa 12
2.3.1: Dairy loss 13
2.3.2: Current Methods 13
2.3.3: Rising Technology 13
Chapter 3: Methodology 16
3.1: Determine Optimal Power Source 16
3.2: Create Initial Design 16
3.3: Construct Prototype 17
3.4: Prototype Testing 19
3.5: First Design 19
3.6: Second Design 20
Chapter 4: Mathematical Calculations 21
4.1: Design 1 22
4.2: Design 2 Calculations and Derivations 22
Chapter 5: Results and Recommendations 26
5.1: Results 26
5.2: Recommendations 28
Bibliography 30
Appendix 32
A.1: Refrigeration Unit Manufacturing Process 32
A.2: Arduino Code 37
A.3: Arduino and Accessories 42

6
List of Figures
Figure 1: First Design CAD Model 20
Figure 2: Second Design CAD Model 21
Figure 3: Figure of Water Cooling in the Unit Over 12 Hours 27
Figure 4: Figure of Water and Milk Temperature 28
Figure A.1: The compressor unit that was extracted from an old GE 4.4 cubic foot mini
fridge.
32
Figure A.2: The steel frame used to construct our custom refrigeration unit 33
Figure A.3: The steel frame with the container intended to house the coils and water in 33
Figure A.4: Unit with polystyrene insulation added to surround the steel container 34
Figure A.5: Unit with a second layer of polystyrene and a layer of foil 35
Figure A.6: The compressor unit being fitted on and installed into the unit 35
Figure A.7: Unit with arduino and lid installed 36
Figure A.8: Vinyl tubing in the steel container 36
Figure A.9: Final unit with poster in background 37
7
Chapter 1: Introduction
Globally, it is estimated that 1.2 billion people do not have access to electricity (Odarno,
2017). Electricity allows many modern developments to exist. Things such as global
communication, food preservation, and lighting would not be possible on the current scale
without electricity. Of the 1.2 billion people who do not have access to electricity, Africa
accounts for over 600 million (Howard et al., 2016). Since Africa is predominantly an agrarian
society, this lack of electricity impacts farmers as a group more than any other group in the
continent. According to Brookings Institutions, agriculture supports the African community by
providing up to 60% of all jobs as well as food for the continent (Diop, 2016). The potential
development of African farmers is large. 200 million hectares of land are not utilized and only
2% of renewable resources are used compared to the global average of 5% (Diop, 2016). The
lack of electricity directly impacts the lack of progression present with African farmers today.
Currently, Sub-Saharan Africa is responsible for 18% of the global milk production
(Odero-Waitituh, 2017). Sub-Saharan Africa is the region located south of the Saharan desert
and consists of 46 countries. Kenya, a Sub-Saharan country located in eastern Africa, has a
population of nearly 50 million and produces about 17% of the region’s milk. This makes Kenya
crucial to Sub-Saharan Africa's agrarian economy. Even though Kenya has a high level of
contribution to the regional milk production, only 56% of their population currently has access to
a stable electrical grid (Howard, et al., 2016). It would be an extremely time consuming and
costly process for Kenya to develop the infrastructure necessary to provide the other half of their
population with a source of electricity. For this reason, utilizing small scale, off the grid solutions
will be a much more cost effective and efficient solution to Kenya’s current electrical position.
Because Kenya has not yet fully industrialized themselves, their main source of dairy
products come from small scale rural farmers. With an average of five dairy cows per farm
producing about eight liters of milk each, these farms produce approximately forty liters of milk
per day. A farmer will milk their cows in the morning and at night. The cow will typically
produce 60% of its milk in the morning, and the other 40% at night. A farmer can bring their
morning milk to a centralized town collection site during the day and sell it, but unfortunately
after the second milking at night the collection site will be closed until the following morning.
Due to bacteria and mold growth which ultimately leads to spoiling, this milk cannot be utilized
the next morning. As a result, small-scale dairy farmers in Kenya will have to either consume or

8
discard the milk. If a means to store this milk in an efficient and affordable method arose, they
would be able to preserve it for sale the next day. This could result in as much as a 66% increase
in profit for the farmer. These increases in the profits for small scale dairy farmers would result
in an overall increase of Kenya’s Gross Domestic Product (GDP). These increases could lead to
an overall better quality of life for the farmers, and the population as a whole.
To solve this problem, the goal of our project is to develop a cost effective and efficient
solution to help reduce the financial losses the Kenya farmers experience. We seek to achieve
this goal through a series of objectives. These objectives are to first understand our stakeholders’
perceptions on milk and milk storage, second to identify existing milk storage techniques in
Kenya and other developing agrarian countries, and finally to develop a prototype or a method
for preserving milk. We hope that following our first objective, we will gain a better
understanding of the problem occuring in Kenya. At the end of this project we shall develop an
effective and efficient solution for milk preservation that will improve the daily lives of the dairy
farmers living in Kenya, and ultimately those in Africa.
9
Chapter 2: Background
In modern society, technological advances and utilization are directly related to economic
growth. For developing nations, the lack of access to a reliable source of electricity has stunted
this progression. Several technological innovations such as solar power and biogas can offer
rural regions of these countries access to energy. Currently underutilized due to the informational
and financial barriers presented by new technologies, the gradual adoption of these sources will
allow for future economic growth and result in overall improvements to quality of life.
2.1: Electricity and Industry
According to the Merriam-Webster English Dictionary, Industry is “manufacturing
activity… systematic labor for the creation of something useful,” which means the large scale act
of turning certain materials or resources into other more useful commodities and services. From
physics and thermodynamics, it is known that to cause physical change in a mass or object,
energy is required. This is the basis of industry.
“Before the Industrial Revolution, economies depended on energy from agricultural crops
and wood as well as smaller amounts of wind and waterpower… this is still largely the case in
rural areas of low-income countries,” (Stern, 2017). Though technology and the world economy
have made incredible advances since the Industrial Revolution, many countries still gave pre-
industrial economies due to lack of access to reliable energy sources. According to the studies
done by the Oxford Energy and Economic Growth Applied Research Programme the
availability, reliability, and volume of electricity directly correlates with economic growth over
time (Stern, 2017). Without a consistent and viable source of electricity, the majority of a
country’s economy will be dependent on pre-industrial markets such as agriculture.
2.1.1: Electric Grid in Sub-Saharan Africa
From the colonial times of Africa to today, there has been much improvement to
infrastructure, as well as the development of electricity. However, there still remains much
disparity between developed nations in Africa and developing ones.
“The population of sub-Saharan African countries has the least access to electricity
compared to other emerging countries,” (Bazilian, 2012). As previously referenced, this issue
10
presents itself as disadvantage in regards to a country’s ability to industrialize. This increases
reliance on rural economies. Additionally, “Electrification of rural areas, where most of the
population resided, was not a significant driver of development finance institution anywhere in
the world,” (Marwah, 2017). Areas of Sub-Saharan Africa have the least amount of access to
electricity. This results in a lower quality of life as access to industrialized infrastructure is
restricted.
2.1.2: Solar Power Technology in Sub-Saharan Africa
As the pursuit for a reliable source of energy has developed over the last decade, one
popular solution has been solar energy. Solar energy has emerged as one of the most popular
renewable energy methods because of its availability. Energy is harvested from protons that enter
the atmosphere through the sun, where electrons then come loose inside the solar cells in a solar
panel, creating an electric circuit. This is made possible because the solar panel is made of solar
cells that have both a positive and negative side. This then produces an electric field, which is
converted into DC energy. Solar has already been utilized in sub-Saharan Africa, where the
technology has enabled cooling technologies in the hot climate of sub-Saharan Africa. In
addition to this, in an area where utilization of cellphones is outpacing the development of
infrastructure for landlines, many residents are left without a reliable source of electricity. Small,
home-sized solar power plant units are already being constructed around sub-Saharan Africa,
capable of powering small appliances and lighting homes. This technology is ideal for this area
due to the climate as well as the infrastructure. The climate of sub-Saharan Africa is split
between a rainy season and a dry season, neither of which prevent solar cells from producing
electricity. In addition to this, the lack of energy infrastructure has allowed solar energy to give
residents independence and a more modern lifestyle (McKibben, 2017).
An important factor to consider when developing a solar powered system for off grid use
is the storage. Because solar power produces energy during the day, batteries must be used to
store electricity to be used during the night when the panels are not producing energy. Solar
powered batteries typically have a lifespan of between five and fifteen years depending on how
many cycles of charging and recharging per day are used. In addition to this, multiple batteries
are typically needed to supply a single home in a developed country (EnergySage, 2018). Solar
batteries are rechargeable batteries that are typically made with either lithium-ion, lead acid, or
11
using saltwater. Lithium-ion are the most popular method of solar batteries because of the
comparable safety and the high storage capacity per unit. In order to operate at the highest
efficiency, batteries must also be stored in an environment between 30 and 90 degrees
Fahrenheit. In addition to this, a lithium-ion battery must never utilize 100% of its charge.
Because of the chemical disposition of the battery, doing so will significantly reduce not only the
lifespan of the battery, but will also reduce the capacity (EnergySage, 2018).
In developing countries, particularly ones in Africa, alternative battery options have been
explored due to the high cost of new lithium-ion batteries. One viable alternative that has been
suggested is to repurpose old car batteries. Each retired car battery is rechargeable and has the
capacity to power fifteen homes in developing countries (Hasnie, 2016). Because cars demand
high performance from batteries, when the capacity of a car battery declines to between 70-80%,
the battery is retired and replaced. Although retired, these batteries are still capable of hundreds
of cycles of charge and discharge, and can also be used for stationary storage units. Currently,
there are less than 1% of retired car batteries are being used as second-life batteries (Hasnie,
2016). If retired batteries continue to be discarded instead of repurposed, this percentage will
decline to less than 0.001% by 2025. The financial benefits and environmental benefits of
repurposing retired car batteries not only applies to the consumer of the retired battery, but also
extends to the previous user. New batteries cost $350/kWh, which exceeds the budget of the
majority of second-life consumers. Retired batteries cost only $150/kWh - a much more
affordable price, fully capable of powering an off-grid solar kit for the following three to five
years (Hasnie, 2016). The gradual increase in retired car battery demand will provide an income
for car manufacturers that did not exist before. Electric car manufacturers will be able to lower
vehicle costs because instead of discarding the batteries at the end of their lifespan, car
manufacturers can sell these units, decreasing the reliance on direct vehicle sale price. Previously
viewed as a liability in developing countries, retired batteries could be the source for bringing
power to more than half a billion Africans in the coming years.
2.2: Farming in Developing Kenya
Understanding the methods of dairy farming in developing countries is critical to
procuring a solution. Small scale dairy farmers in Kenya typically own from three to five cows.
Kenya has a total of 850,000 small scale dairy farmers. As of 2015, 85% have zero access to the
12
electrical grid (Dugill et al., 2015). This lack of electricity is responsible for the daily loss of
40% of the milk these dairy farmers produce.
The average cow found in Kenya is milked twice a day. Once in the morning and once in
the evening. The morning milk yield accounts for about 60% of the daily yield. This milk is
then picked up by a milk collection service that then brings the milk to the market for sale. The
remaining 40% of the yield is milked in the evening where it then must be either consumed or
disposed of due to lack of effective preservation methods (Dugill et al., 2015). The US Food and
Drug Administration (FDA)states that milk should not be left at room temperature for longer
than 2 hours.
Although consumable milk is reaching the dairy market, it is made up of mostly poor-
quality milk due to the high count of bacteria from lack of proper preservation methods and
refrigeration (Dugill et al., 2015).
2.3: Dairy Industry in Sub-Saharan Africa
Sub-Saharan Africa’s, specifically the eastern portion, are relatively high consumers of
milk and other dairy products when compared to the rest of the continent. Kenya has the highest
milk consumption rate at an average of 90 liters per capita, and that number is expected to double
by 2030 to almost 200 liters per capita (Bingi, 2015). Population growth, urbanization, and
increased income are the primary causes to this increased demand for milk. As a result, supply
has followed an increasing trend over the past decade. However, some regions still differ in their
production methods. From heavily state-managed industry with the objective of satisfying
domestic food demands, to the reforms that led to a privately driven industry,, the East African
diary production and marketing has gone through broad ranging transformation (Bingi, 2015).
During this period there was an increase in private investment in the dairy industry. Investments
that led to improved breeds, better feed systems, and improved husbandry. These innovations led
to an increase in productivity (Bingi, 2015).
Trade is an important source of revenue for rural dairy farmers in eastern Africa. The
majority of dairy products remain domestic in local communities in this region of Africa. In fact,
only about 15% of the raw milk supply in eastern Africa is marketed and distributed through
formal channels, in addition less than 1% of dairy products are exported outside of their region
of origin (Bingi, 2015). The primary cause for this lack of exporting is due to dairy products
13
being very perishable because of the tropical climate. As a result, milk cannot be transported
over long distances. Another reason for this is the rise in intra-regional trade within these smaller
African communities. Kenya in contrast has to import a large amount of their dairy products to
feed their vastly increasing demand for these products (Bingi, 2015).
2.3.1: Dairy loss
The Food and Agriculture Organization of the United Nations (FAO) has published a
recent study that showed that they are averaging as much as $90 million worth of milk spoilage
and waste in East Africa every year. Kenya, Uganda, and Tanzania alone make up $59.7 million
of the losses in East Africa. Individual dairy farmers lose about 40% of their daily milk due to
poor infrastructure, lack of knowledge of post-harvest practices, and the absence of storage
facilities.
2.3.2: Current Methods
Dairy farming in Kenya is a popular source of income and job for local people. There are
currently over 1 million dairy farmers but only 15% of them have access to the national
electricity grid allowing them to refrigerate their milk. There are also 50 solar milk-cooling
locations that farmers can use to store their milk for a short period of time. This ensures larger
and more reliable profits. These locations are usually government subsidized which allows the
farmers of that region to overcome the large initial cost. This allows farmers to sell all of their
excess milk without worry of it spoiling. The selling process usually proceeds in the order where
a farmer will bring his or her milk to the plant each day. The quantity of the milk will then be
recorded. With this method, at the end of the month the farmers can be paid for their product. It
is commonplace in operations such as these for the government to cede ownership of the plant to
the local dairy industry. This way, all local farmers will be required to maintain and operate the
milk-storage plant. This process is not without its drawbacks. Including the maintenance required
from each farmer, they are charged roughly ten percent of their monthly earnings (Kagondu,
2018).
14
2.3.3: Rising Technology
World Bicycle Relief, the Paul Mueller Company and Simgas are currently making
efforts to advance the milk cooling process by improving milk delivery, collection centers and
on-farm storage. The average distance farmers are expected to travel to bring their milk to a
centralized milk collection center is anywhere between three and fifteen miles away from his or
her farm. These farmers commonly transport their milk using low-grade bicycles, wheelbarrows
or by foot. These low-grade bicycles do not have the ability to carry the 20-40 litres of milk to
the collection center. The bicycles often break down on the way making them an unreliable mode
of transportation.
The World Bicycle Relief has recently provided higher-grade bicycles to volunteer health
care workers and rural students that travel long distances. Once they recognized the difficulties
these farmers were experiencing, they began selling the higher grade bicycles to local dairy
farmers. They developed a list of farmers in need and developed a program that would allow
farmers to purchase the bicycles over a three-month period. These bicycles are made of steel and
can reliably transport over 200 pounds of milk in the rear carrier of the bike per trip. The Paul
Mueller Company, based out of the Netherlands, was presented the problem these African dairy
farmers were facing and reached out to the respective governments to receive funding for the
construction and operation of different collection centers in these countries through grants. The
grants allowed them to purchase improved stainless steel milk tanks, cooling equipment,
generators and heat recovery systems. In Uganda alone, there have already been 150 collection
centers sold and installed. Countries like Ethiopia have not been able to install any collection
centers because the country is far less developed than Uganda and has fewer dairy farms.
Mueller partnered with BoP Inc., to then develop a small solar-powered cooling unit for small
dairy farmers in Ethiopia who do not have access to electricity.
Simgas is a company that produces small biogas facilities for household farms in Africa.
Mueller contacted Simgas when they were looking to add onto their current biogas system.
Together, the two built a biogas-powered milk cooler in 2013 for countries like Ethiopia. Biogas
milk chilling saves time by allowing dairy farmers to deliver their milk once a day instead of
twice. This is a self-sustaining system where cows produce manure, which is then fed into a
biogas digester where the manure is converted to biogas and slurry. The biogas is used for
cooking, cooling, and other appliances while the slurry is used as a high-quality organic
15
fertilizer. The fertilizer results in an increase of crop production which then increases the manure
production ultimately increasing milk production and the dairy farmers overall income.
16
Chapter 3: Methodology
This project developed and designed a unique off the grid preservation solution for rural
Kenyan dairy farmers to preserve their milk. The total cost to manufacture the prototype was
roughly $1,100. The four main objectives our team followed to successfully manufacture our
prototype were:
1. Determine an optimal power source for refrigeration
2. Create initial design
3. Construct prototype
4. Perform testing on prototype to confirm functionality
Our team decided to build a ⅓ scale prototype. We decided this because in our design, to have a
storage capacity of 25 L, we would require metallic tubing in tight coils. This would increase
costs because over 300 feet of metal tubing would need to be purchased. In addition to this, it
would also be extremely time consuming to bend the tubes into coils, but would also add
hundreds of pounds to the unit. After considering our financial and temporal resources, we
decided to pursue a ⅓ scale prototype which would allow us to prove the concept and use vinyl
tubing instead of metallic tubing.
3.1: Determine Optimal Power Source
We determined the optimal source of power for our unit by familiarizing ourselves with
the various electrical options that did not require access to an electric grid. Through our research
and interactions with our sponsor, Hunt Institute, we were able to identify potential power
sources that would be readily available for rural sub-Saharan farmers. We determined that solar
energy would be the most viable for multiple reasons. Solar was decided because it was already
implemented in other areas of sub-Saharan Africa, meaning there would be a familiarity to the
technology. In addition to this, it would be a reliable and cheap power source because of its low
ongoing costs and simple maintenance.
3.2: Create Initial Design
Our team created our first design using the computer modeling program called
SolidWorks. The design was not a full 1:1 representation of our final product, and served only to
produce more ideas and be a reference to what the general refrigeration unit would look like. To

17
successfully build a prototype we planned key steps in the building process prior to the final
construction to ensure a smooth and error-free transition from design to manufacturing. These
key steps were design, determining manufacturing location, selecting and obtaining materials,
and manufacturing.
The design process began by setting parameters that the device should be within. The
parameters included size, weight, cost, energy usage, friendly user interface, operating
temperature, operating noise, and internal temperature. By setting parameters in the beginning,
we were able to make better engineering decisions on our designs. We first confirmed the
feasibility of our parameters, specifically the one involving internal temperature. We calculated
the temperature of the inside of the unit while the refrigeration cycle was off and on, and also
considered the heat gain from the environment. We also calculated how much surface area the
milk would have to be in contact with a cold surface to ensure that the milk did not take longer
than two hours to cool to 45 degrees Fahrenheit. These calculations allowed us to design our
prototype in SolidWorks to reduce the risk of manufacturing a faulty unit. By manufacturing
only what is confirmed to work, we were able to reduce costs associated with error and wasted
material.
3.3: Construct Prototype
After the design was computer modeled with additional preliminary thermal calculations,
the next step was to purchase materials necessary to begin manufacturing. These materials were
pre-selected during the designing process. The entire unit (not including the solar panel) was
designed with the $1500 budget in consideration. As a result, we selected materials that were
inexpensive yet would allow us to manufacture an effective prototype. In addition to the reasons
stated previously, the materials were also considered and purchased because our team would be
able to shape the materials as needed with the tools available on the WPI campus. The ability to
custom manufacture required parts allowed us more creative freedom, but most importantly
allowed us to keep costs low.
The successful prototype began with the construction of our frame. The frame was
constructed from 1 and ⅝ inch galvanized steel Unistrut and necessary bolts, nuts and brackets.
We constructed the frame to be robust and have a high yield strength in order to accommodate
the large volume of water/ice that the unit will need to hold. The frame was constructed to house
18
a 16 inch by 16 inch steel box that will hold the necessary components to cool the milk as well as
the water/ice. This box was constructed using ⅛ inch steel sheet and was formed to be inserted
into the frame. We added a drain to the bottom of the unit using a drill bit and ¾ inch tap to make
a hole in the box. We used a ¾ inch ball valve and necessary plumbing to ensure there was no
leaks. The next step was to add the polystyrene insulation to incase the steel box, which was
done using three 1 inch sheets of polystyrene insulation board. We sealed the insulation board
joints with insulated ducting tape to ensure good insulation of the system. Next, we built an
insulated lid using the same techniques as the frame and attached it to the unit with standard 3.5
inch door hinges. We then covered the unit with Utilite wallboard and trim for aesthetics.
Once the structure was complete, we began to integrate the necessary electrical and
thermal components. We made a mount for the compressor on the back of the unit using Unistrut
and bolted on the compressor to the mount. We then fit the condenser coil around our unit. Our
next step was to add the coils that the milk would flow through. We used a 100 ft tube of ¾ inch
inside diameter vinyl tubing and all necessary plumbing components to make 4.5 inch diameter
coils that were connected in series and had a 12 volt DC transfer pump in line with them in order
to move the milk through the system. We added an inlet with a funnel that allows the farmer to
pour their milk into the coils, this inlet utilizes a check valve that allows the user to pour the milk
in and bleed out air pockets in the line without spilling milk. We also added an outlet on the front
panel of the unit that utilized a gate valve and necessary plumbing components to allow easy
access for the farmer to retrieve their milk. The last step we had to do was integrate our arduino,
temperature sensors and flow meter into the unit. In order to do this we 3-D printed a housing
unit from black PLA plastic that held the LCD screen and electronics necessary for the arduino
to operate. We ran all wires under the wallboard and ran the power sources for the pump, arduino
and compressor to one circuit. Because all three ran on DC current we were able to run all three
to a driver and then ran a standard 120 volt three prong plug so the unit could be powered from a
standard outlet. We also added switches to the pump and compressor so they could be turned on
and off based on what operation the farmer needed the unit to perform. Throughout the
prototyping process the team learned a lot about real time redesigning as well as work around
problem solving. The end result of this process was the completion of a fully functioning
prototype that was low cost and saved materials.

19
3.4: Prototype Testing
Once the prototype was constructed, we performed testing on the unit to determine if it
would function as intended. A successful test would result in the unit freezing water to ice within
a twelve hour period at which point the compressor will be shut off and the pump will turn on.
Milk will then be added and cooled to below 7 degrees celsius within 1.5 hours. Our test
procedures to determine if the unit could perform these functions are as follows.
1. Add eight kilograms of water to the steel box.
2. Shut lid and turn on compressor unit.
3. Record initial water temperature reading.
4. Record water temperature every hour for twelve hours.
5. After twelve hours, turn off compressor and turn on pump.
6. Add eight liters of water at 30 degrees celsius through a funnel to the coils.
7. Record initial “milk’ temperature reading.
8. Record “milk” temperature every 15 minutes for 1.5 hours.
9. Continue running pump and recording “milk” temperature every hour for twelve hours.
10. Drain “milk” allow ice to melt and drain fully then repeat steps 1-9 for additional trials.
Following these ten test procedures we were able to successfully run several trials in
order to validate the functionality of our unit. These trials were run over the course of several
days to allow the unit to return to a constant temperature before another trial was started. By
writing these procedures before attempting to run any trials allowed us to have a standard to
follow and created continuity throughout the testing process.
3.5: First Design
The initial design incorporated four buckets that would hold the milk in ice to be cooled.
These buckets would be constructed of stainless steel and would be capable of holding 6.5 liters
of milk each. The buckets would be inserted into a divided section where ice would surround the
bucket. Underneath the dividers, the cooling system would reside. If any mechanical work
needed to be done to the refrigeration system, the divider can be pulled up and worked on from
the top. The sides are constructed of a two inch polyurethane foam insulator with a sheet metal
20
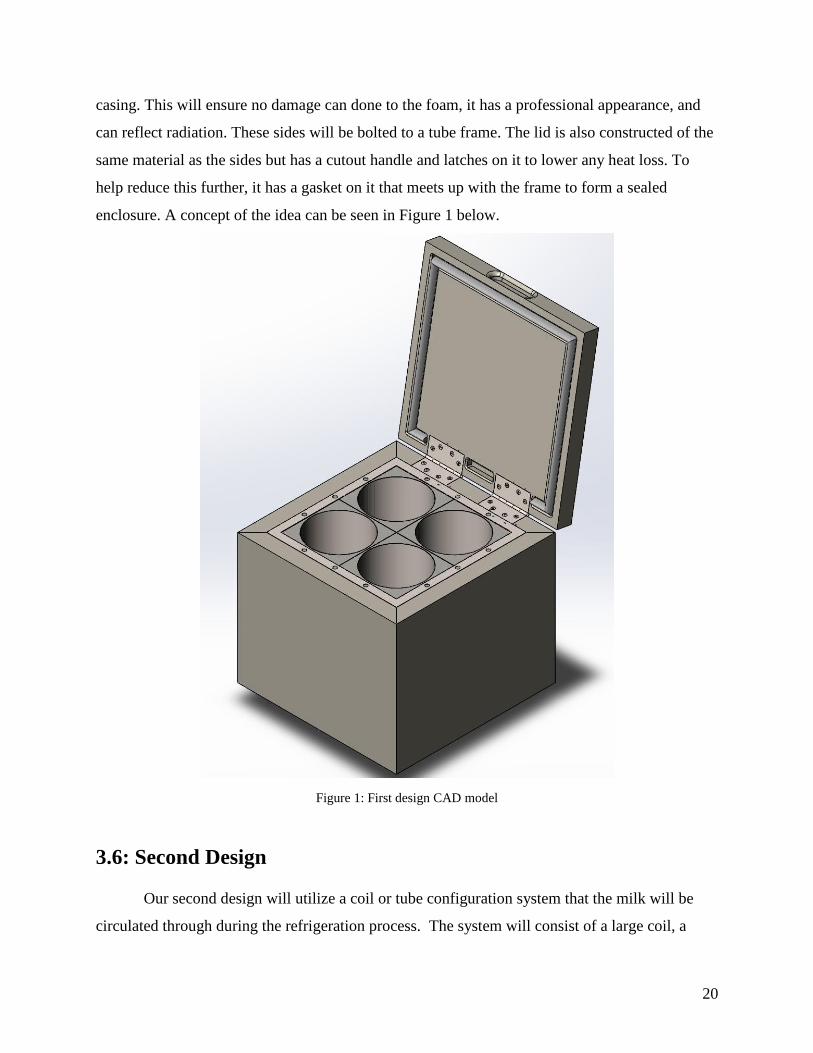
casing. This will ensure no damage can done to the foam, it has a professional appearance, and
can reflect radiation. These sides will be bolted to a tube frame. The lid is also constructed of the
same material as the sides but has a cutout handle and latches on it to lower any heat loss. To
help reduce this further, it has a gasket on it that meets up with the frame to form a sealed
enclosure. A concept of the idea can be seen in Figure 1 below.
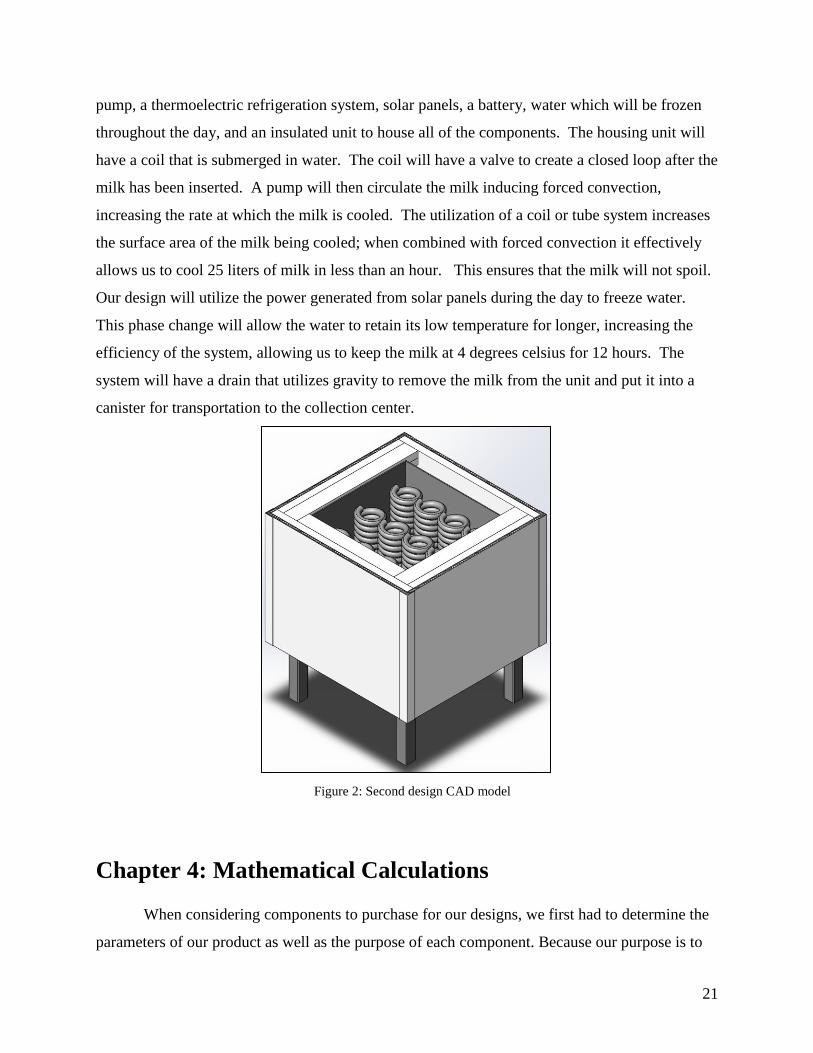
3.6: Second Design
Our second design will utilize a coil or tube configuration system that the milk will be
circulated through during the refrigeration process. The system will consist of a large coil, a
Figure 1: First design CAD model
21
pump, a thermoelectric refrigeration system, solar panels, a battery, water which will be frozen
throughout the day, and an insulated unit to house all of the components. The housing unit will
have a coil that is submerged in water. The coil will have a valve to create a closed loop after the
milk has been inserted. A pump will then circulate the milk inducing forced convection,
increasing the rate at which the milk is cooled. The utilization of a coil or tube system increases
the surface area of the milk being cooled; when combined with forced convection it effectively
allows us to cool 25 liters of milk in less than an hour. This ensures that the milk will not spoil.
Our design will utilize the power generated from solar panels during the day to freeze water.
This phase change will allow the water to retain its low temperature for longer, increasing the
efficiency of the system, allowing us to keep the milk at 4 degrees celsius for 12 hours. The
system will have a drain that utilizes gravity to remove the milk from the unit and put it into a
canister for transportation to the collection center.
Chapter 4: Mathematical Calculations
When considering components to purchase for our designs, we first had to determine the
parameters of our product as well as the purpose of each component. Because our purpose is to
Figure 2: Second design CAD model

22
create an innovative milk refrigeration system for small rural farms in Kenya that is more energy
efficient than the current models in the market, we designed for dimensions and materials that
would result in lower energy consumption. Both designs involved ice as to reduce load on the
compressor by allowing the system to invest cooling energy in the form of ice.
4.1: Design 1
After calculating the heat transfer for our first design, we found that the surface area of
the milk in contact with a cooling surface was insufficient. Because of the insufficient contact
area, the milk would not cool down to the desired temperature of 45 degrees Fahrenheit within
the period of 90 minutes. To obtain an acceptable rate of heat transfer between the milk and the
ice, an extra 1.2 m2 of area would be required. To satisfy this, an unreasonable level of
complexity would be added to the design of the system such as attaching fins to the interior and
exterior of the milk containers, as well as re-organizing the interior to accomodate for the
increased contact area. The milk containers would be both too expensive to manufacture, and
overly difficult for the consumer to clean and maintain. As a result, we decided to pursue a
second design that resembles a long heat exchanger.
4.2: Design 2 Calculations and Derivations
Our second design will incorporate a refrigerated box that will be the housing for a coil
which will hold the milk. The coil will hold the required volume but will increase the surface
area to allow for more heat transfer. It will also use a pump to circulate the milk within the coil
to induce forced convection. In the unit, water will be frozen to ice during the day, and the ice
will cool the milk overnight. The substitution of containers for coils resolved the contact area
insufficiency present in our first design.
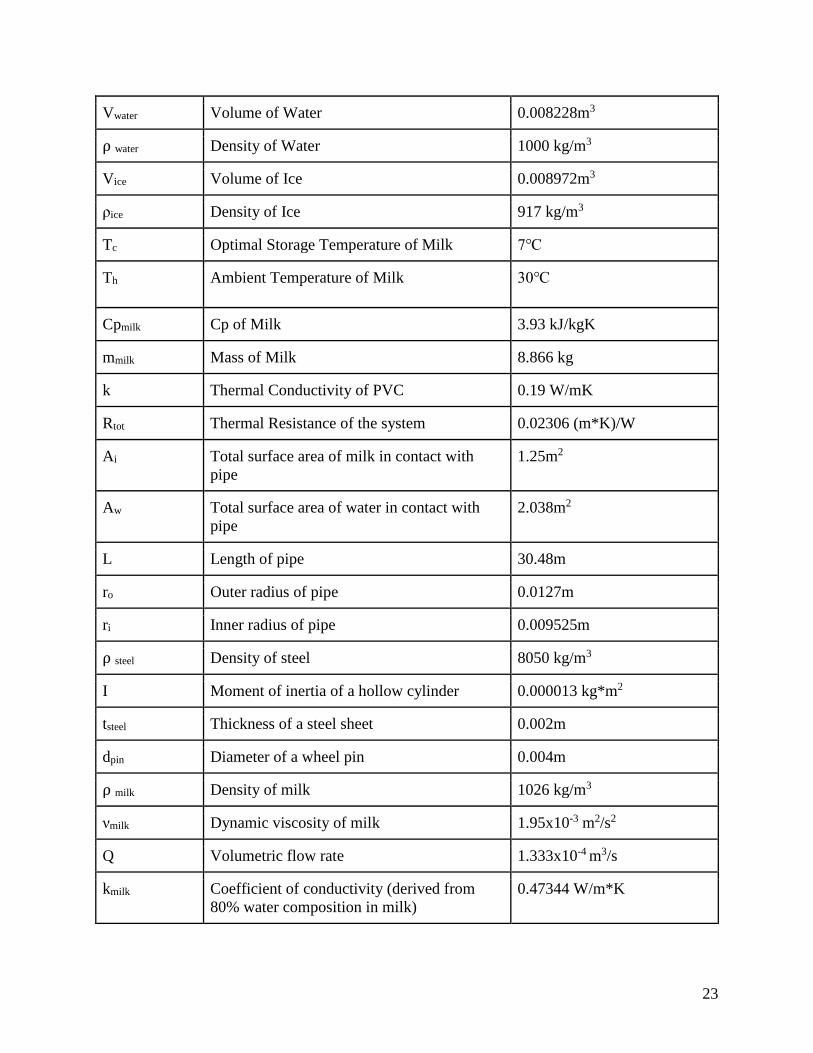
Nomenclature
hifw Heat of Fusion of Water 333.7 kJ/kg
hw Convective coefficient of water 50 W/m2K
mice Mass of Ice 13.4 kg
23
Vwater Volume of Water 0.008228m3
⍴ water Density of Water 1000 kg/m3
Vice Volume of Ice 0.008972m3
ρice Density of Ice 917 kg/m3
Tc Optimal Storage Temperature of Milk 7℃
Th Ambient Temperature of Milk 30℃
Cpmilk Cp of Milk 3.93 kJ/kgK
mmilk Mass of Milk 8.866 kg
k Thermal Conductivity of PVC 0.19 W/mK
Rtot Thermal Resistance of the system 0.02306 (m*K)/W
Ai Total surface area of milk in contact with
pipe
1.25m2
Aw Total surface area of water in contact with
pipe
2.038m2
L Length of pipe 30.48m
ro Outer radius of pipe 0.0127m
ri Inner radius of pipe 0.009525m
⍴ steel Density of steel 8050 kg/m3
I Moment of inertia of a hollow cylinder 0.000013 kg*m2
tsteel Thickness of a steel sheet 0.002m
dpin Diameter of a wheel pin 0.004m
⍴ milk Density of milk 1026 kg/m3
νmilk Dynamic viscosity of milk 1.95x10⁻³ m2/s2
Q Volumetric flow rate 1.333x10⁻⁴ m3/s
kmilk Coefficient of conductivity (derived from
80% water composition in milk)
0.47344 W/m*K
24
Our new design will implement a large tube of copper piping surrounded by ice that will
operate much like a heat exchanger. This new design allows us to drastically increase the surface
area of milk that is in contact with our ice. In addition to this, an active pump will circulate the
milk throughout the piping. This will more evenly cool the milk.
Calculations on the thermal energy needed to be extracted from the milk
Q = mmilk * Cpmilk * (Th-Tc)
Temperature difference represented in degrees Kelvin
Q = 8.866 kg * (3.93 kJ/kg*K) * (23K)
Q =801.4 kJ
Calculations on the required mass of water/ice to match the thermal energy of milk
The mass of ice will be the same as the mass of water (when ice has thawed). However, because
ice occupies a larger volume than water, we will be designing the refrigerator to have enough
free volume not occupied by pipes that would match the volume of ice.
Qmilk = Qice
Qice = 801.4 kJ = mice * (333.7 kJ/kg)
mice = 2.4 kg
Vice = (mice ÷ ρice)
Vice = 0.00219 m3 or 2.19 L
Finding Vwater now to confirm that water indeed occupies a smaller volume
Vwater = (mice ÷ ρwater)
Vwater = 0.0024 m3 or 2.4 L
Calculations for Rtot
Q̇milk = Qmilk ÷ tcool
Q̇milk = 801.4 kJ ÷ 5400 s
Q̇milk = 0.1484 kJ/s or 148.4 W
To cool the milk to 3℃, the rate of heat transfer has to be 174.22 Watts between the milk and ice
Q̇milk = ΔTLM ÷ Rtot
ΔTLM = (30-7) ÷ (ln30 - ln7)
ΔTLM = 15.8
Q̇milk = 15.8 ÷ Rtot = 174.22 W
Rtot = 0.0906 (m*K/W)
Calculations to find hmilk knowing Rtot
25
Rtot = 0.0906 = 1
ℎ𝑖𝐴𝑖 +
𝑙𝑛(𝑟𝑜/𝑟𝑖)
2𝜋𝑘𝐿+
1
ℎ𝑤𝐴𝑤
0.0906 = 0.79765
ℎ𝑖+ 0.008238 + 0.009814
hi = 10.99 W/m2*K
hi of the internal flow of milk must equal at least 10.67 W/m2*K for the desired amount of heat
transfer to occur
Fluid flow calculations and pump power
Information for pump power and fluid velocity are derived from information given by our pump,
Bayite BYT-7A015
Re=(Q*2ri)÷(νmilk*π*ri2)= 4569.8
A Reynolds number of over 4000 is considered fully turbulent. To find the convective heat
transfer coefficient, we must use a series of equations:
Nu= (hmilk*L)÷kmilk
Nu = ((f÷8)*(Re-1000)*Pr)÷(1+12.7*(f÷8)½ * (Pr2/3-1)
f = (0.79*ln(Re) - 1.64)-2 = 0.0397
Pr = νmilk÷(kmilk÷(cpmilk*⍴ milk) = 16.61
Combining these we created the equation:
(hmilk*30.48)÷0.47344 = ((0.0397÷8)*(4569.8-1000)*16.61)÷(1+12.7*(0.0397÷8)½ * (16.612/3-1)
hmilk= 55.9 W/m2*K
Calculations for the mass of the entire unit
Assuming that there is a 10/90 split between steel/water present in the refrigerator
⍴ steel * (0.1) + ⍴ water * (0.9) = ⍴ avg = 1705 kg/m3
Assuming that only half of the 2 x 2 x 2 ft. cube volume is occupied, the effective volume (Veff) is
0.11326 m3
munit = ⍴ avg * Veff = 193.121 kg
Calculations for the force required to lift the unit using handles
Handle dimensions are a hollow cylinder with a 0.5” OD and 0.4” ID. The 2 handles will extend
4” out of the body of the unit
munit * g * (0.3048) = F * (0.7112)
F = 811.936 N
Calculations for the average shear stress experienced by the handles
Because each handle has 2 points of contact with the unit, there force experienced by each
contact will be ¼ of the total force exerted to lift the unit
τavg = F/A ÷ 4
τavg = 161.387 psi
The maximum shear stress for steel is around 12,250 psi. The value calculated reveals that the
handles used in our design will be safe
Calculations for the normal stress experienced by the handles
Because there are 4 points of contact for the two handles used, the force used in the calculations
will be ¼ of the total force exerted to lift the unit
26
σmax = M * c/I
M = F/4 * L
M = 144.362 N*m
σmax = 144.362 * 0.00635/I
σmax = 70545 Pa or 0.07 MPa
Steel has a yield stress of 250 MPa so the handles will retain structural integrity
Calculations for the stresses (bearing and shear) experienced by the wheel pins
Each pin (2 total) is assumed to have a diameter of 4mm, be in contact with two sheets of steel
with a thickness of 2mm, and be a solid cylinder made of steel
ΣFy : m * g ÷ 4 = Fnormal
Fnormal = 473.63 N
τavg = F/A
τavg = 37.69 MPa
Bτ = F ÷ (tsteel * dpin)
Bτ = 59.2 MPa
Steel has a yield stress of 250 MPa so the pins will not yield
Chapter 5: Results and Recommendations
Following the completed manufacturing of our prototype, we obtained data related to the
temperature of the milk, water, and flow rate of the milk in the pipes. The flow rate was not
recorded but instead compared to the required flow rate derived from our calculations. By
connecting the Arduino to a computer, we were able to obtain accurate and real-time data during
our tests. From the recorded data as well as our prior knowledge gained from background
research and during the manufacturing process, we then provided recommendations for future
groups aiming to improve and build upon the project.
5.1: Results
Our refrigeration unit met our expectations during our three tests. During the fourth trail,
our compressor failed due to unknown circumstances and our group was unable to continue
conducting experiments. In all three tests, the refrigerator was able to freeze water within 12
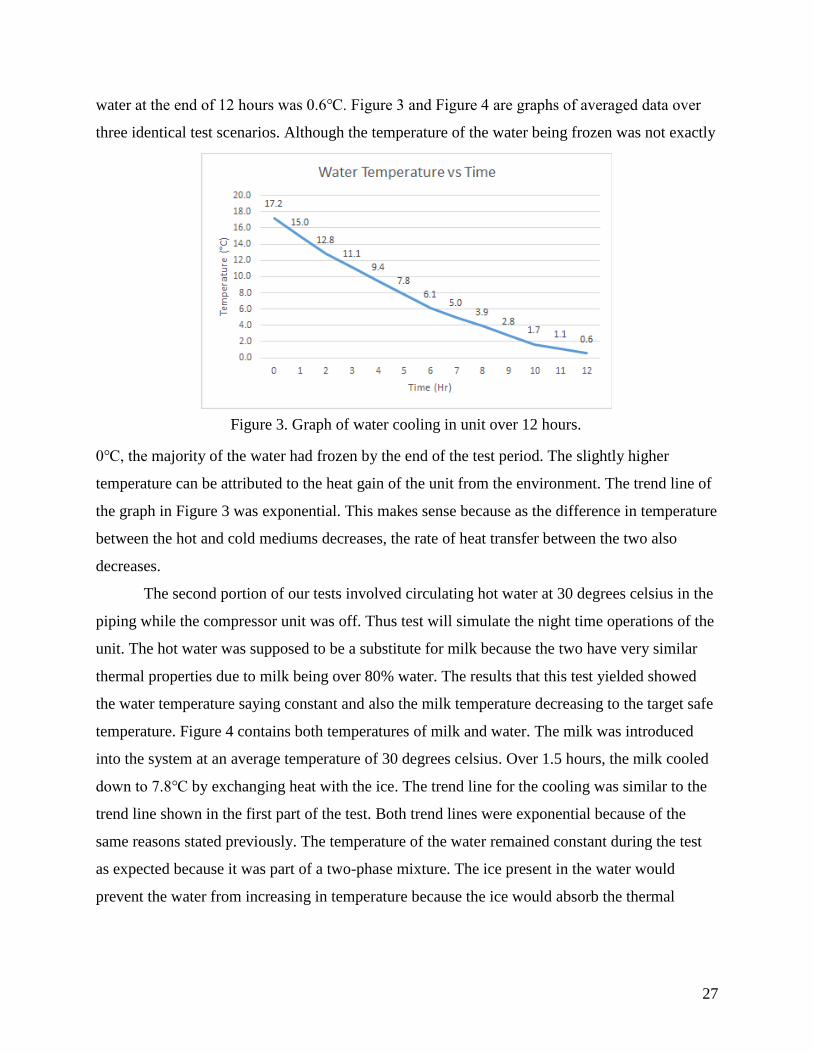
hours of operation. Water was put into the system at 17.2℃. In Figure 3, the temperature of the
27
water at the end of 12 hours was 0.6℃. Figure 3 and Figure 4 are graphs of averaged data over
three identical test scenarios. Although the temperature of the water being frozen was not exactly
0℃, the majority of the water had frozen by the end of the test period. The slightly higher
temperature can be attributed to the heat gain of the unit from the environment. The trend line of
the graph in Figure 3 was exponential. This makes sense because as the difference in temperature
between the hot and cold mediums decreases, the rate of heat transfer between the two also
decreases.
The second portion of our tests involved circulating hot water at 30 degrees celsius in the
piping while the compressor unit was off. Thus test will simulate the night time operations of the
unit. The hot water was supposed to be a substitute for milk because the two have very similar
thermal properties due to milk being over 80% water. The results that this test yielded showed
the water temperature saying constant and also the milk temperature decreasing to the target safe
temperature. Figure 4 contains both temperatures of milk and water. The milk was introduced
into the system at an average temperature of 30 degrees celsius. Over 1.5 hours, the milk cooled
down to 7.8℃ by exchanging heat with the ice. The trend line for the cooling was similar to the
trend line shown in the first part of the test. Both trend lines were exponential because of the
same reasons stated previously. The temperature of the water remained constant during the test
as expected because it was part of a two-phase mixture. The ice present in the water would
prevent the water from increasing in temperature because the ice would absorb the thermal
Figure 3. Graph of water cooling in unit over 12 hours.

28
energy gained from the milk to phase change, allowing the water to remain a constant
temperature.
5.2: Recommendations
Through the course of our team’s project, we encountered several unforeseen obstacles as
well as discoveries in hindsight through both our own discussion and points brought up by
outside sources.
Our first obstacle was in not considering the implications of the peak cooling load that we
had required for our compressor to complete. We thought our 80 Watt output had successfully
completed the task of freezing the water that we required, we had not considered the viability of
using such a low-power compressor over time. With the rather quick occurrence of failure in our
refrigeration system, we recommend that a future group in this project select a compressor which
outputs a cooling load far greater than is required, to allow for a greater lifespan of the device
itself.
Another area of improvement from our design and process is in material selection for the
frame of our device. We decided to build the frame of our device out of stainless steel, which is a
strong and resilient material, but excessively heavy. This requires us to design additional
features, such as wheels and handles, so the unit could feasibly be transportable by a single user.
We suggest that future groups use the techniques that many on-market refrigeration systems use:
Figure 4. Graph of the milk (blue) and water (orange) temperatures
during the second part of the test.
29
insulation as structural support. This will reduce both the weight and total cost of the unit upon
manufacturing.
A fault in our process, which ultimately resulted in a less than perfected end product, was
over designing our system throughout the whole project. We went through several iterations of
our product, with vastly different major systems involved. Instead we suggest a future group do
further research into whichever design or mechanism they choose to use, and optimize that
specific system type, instead of shifting focus.
Regarding the internal design of the storage area of our unit, we weren’t able to maximize
the surface area with which ice would be in contact with the milk-carrying tubing. We attempted
to increase this area, and therefore the rate of heat transfer, by implementing metal fins into the
inner area of our design. Though this did increase the efficiency of our design slightly, we
suggest that a future group design an insert, or change the design of the internal cavity of the unit
to reduce the amount of area where ice and tubing are not in contact, as an increase in the area by
which heat can be conducted also increases the rate of heat transfer.
Our final recommendation is one which addresses both user-friendliness and also easier
recording of results. Upon presenting our project, several viewers asked about active memory in
the Arduino to show history of the readings overnight. An inclusion of an active memory, as well
as a graphical representation of the temperature readings during a given use would help both the
project group to record results without needing to manually record the information at every given
recording period, as well as showing the end user a history of the unit’s effectiveness.
30
Bibliography
Bingi, S. (2015, September 01). Recent developments in the dairy sector in Eastern Africa.
Retrieved October 08, 2018, from https://ecdpm.org/wp-content/uploads/BN-on-dairy-sector-
in-EA_final1.pdf
Brian, M., & Elliott, S. (2006, November 29). How Refrigerators Work. Retrieved October 9,
2018, from https://home.howstuffworks.com/refrigerator5.htm
Diop, M. (2016, January 22). Foresight Africa 2016: Banking on agriculture for Africa's
future. Retrieved September 23, 2018, from https://www.brookings.edu/blog/africa-in-
focus/2016/01/22/foresight-africa-2016-banking-on-agriculture-for-africas-future/
Foster, R., Jensen, B., Dugill, B., Knight, B., Faraj, A., Mwove, J. K., & Hadley, W. (2015,
November 12). Solar Milk Cooling: Smallholder Dairy Farmer Experience in Kenya (Rep.).
Retrieved September 24, 2018, from Internation Solar Energy Society website:
https://www.winrock.org/wp-content/uploads/2017/04/Solar-Milk-Chilling-ABS-T09-T05-
0353.pdf
Hasnie, S. (2016, November 22). Second-life car batteries can bring electricity to millions.
Retrieved September 28, 2018, from https://blogs.adb.org/blog/second-life-car-batteries-can-
bring-electricity-millions
How to choose the best battery for a solar energy system. (2018, April 18). Retrieved
September 28, 2018, from https://www.energysage.com/solar/solar-energy-storage/what-are-
the-best-batteries-for-solar-panels/
Marwah, H. (2017). Electricity access inequality in sub-Saharan Africa, 1950-2000.
African Economic History, 45(2), 113–144. doi:10.1353/aeh.2017.000
McKibben, B. (2017, June 26). The Race to Solar-Power Africa. Retrieved October 2, 2018,
from https://www.newyorker.com/magazine/2017/06/26/the-race-to-solar-power-africa
31
Njagi, Kagondu. “Kenya's Dairy Farmers Use Solar Rays to Keep Milk Cool.” The Christian
Science Monitor, The Christian Science Monitor, 29 Aug. 2018,
www.csmonitor.com/World/Africa/2018/0829/Kenya-s-dairy-farmers-use-solar-rays-to-keep-
milk-cool
Odarno, L. (2017, March 07). 1.2 Billion People Lack Electricity. Increasing Supply Alone
Won't Fix the Problem. Retrieved September 23, 2018, from
https://www.wri.org/blog/2017/03/12-billion-people-lack-electricity-increasing-supply-alone-
wont-fix-problem
Odero-Waitituh, J. (2017, July 2). Irrd.org. Retrieved September 23, 2018, from
http://www.lrrd.org/lrrd29/7/atiw29139.html
Onyeji, I., Bazilian, M., & Nussbaumer, P. (2012). Contextualizing electricity access in
sub-Saharan Africa. Energy for Sustainable Development,16(4), 520-527.
doi:10.1016/j.esd.2012.08.007
Oyuke, A., Penar, P. H., & Howard, B. (2016, March 14). Off-grid or ‘off-on’: Lack of access,
unreliable electricity supply still plague majority of Africans (Rep.). Retrieved September 23,
2018, from Afrobarometer website:
http://afrobarometer.org/sites/default/files/publications/Dispatches/ab_r6_dispatchno75_electri
city_in_africa_eng1.pdf
Schmitz, Audrey. “Cooling Milk in the Heat of Africa.” Progressive Dairyman, 12 Dec. 2016,
www.progressivedairy.com/topics/people/cooling-milk-in-the-heat-of-africa
32
Appendix
The appendix includes information on the manufacturing process of the refrigeration unit.
A.1: Refrigeration Unit Manufacturing Process
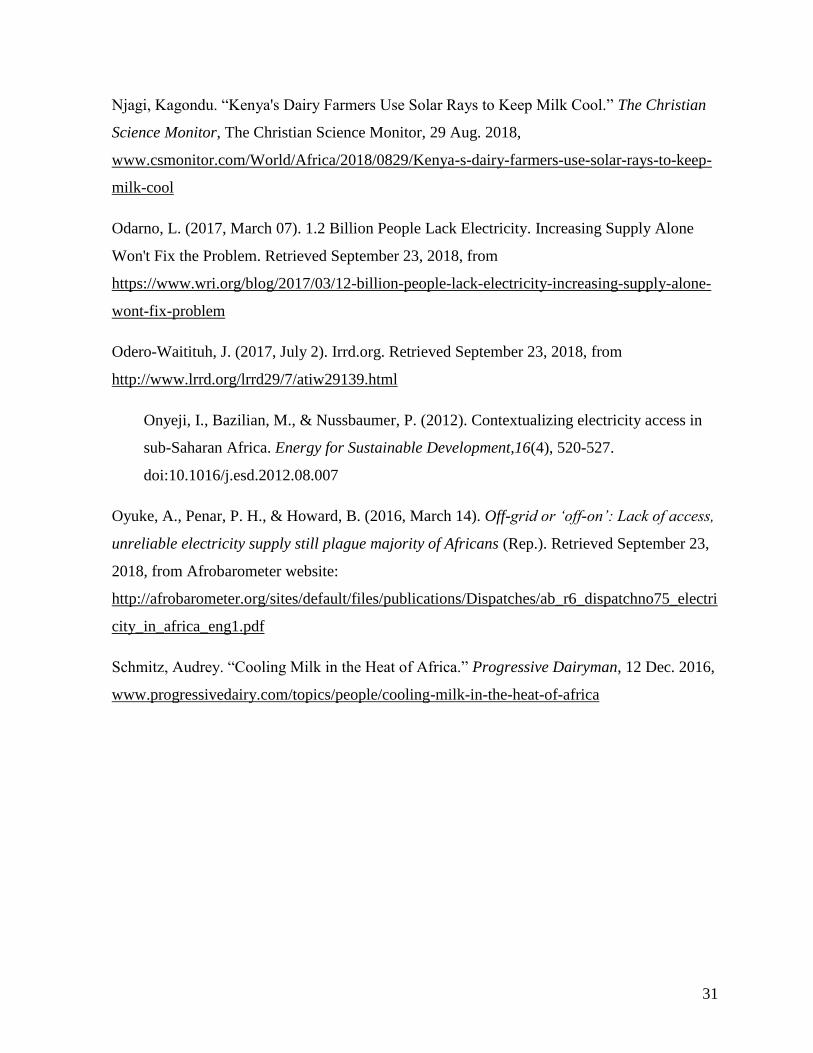
Figure A.1: The compressor unit that was extracted from an old GE 4.4 cubic foot mini
fridge.
Our group repurposed a compressor unit from the mini fridge because the unit was
readily available. This involved removing the exterior plastic housing of the mini fridge and
scraping away the insulation that was adhered to the compressor unit.

33
Figure A.2: The steel frame used to construct our custom refrigeration unit.
Our group decided to overdesign for the frame because the steel was inexpensive and
ensured that our prototype would not collapse. The galvanized steel unit struts were attached
together using nuts and bolts.
Figure A.3: The steel frame with the container intended to house the coils and water in.
We constructed the steel container using sheet steel and welding the edges together. This
allowed us to manufacture an open steel cube that was watertight.
34
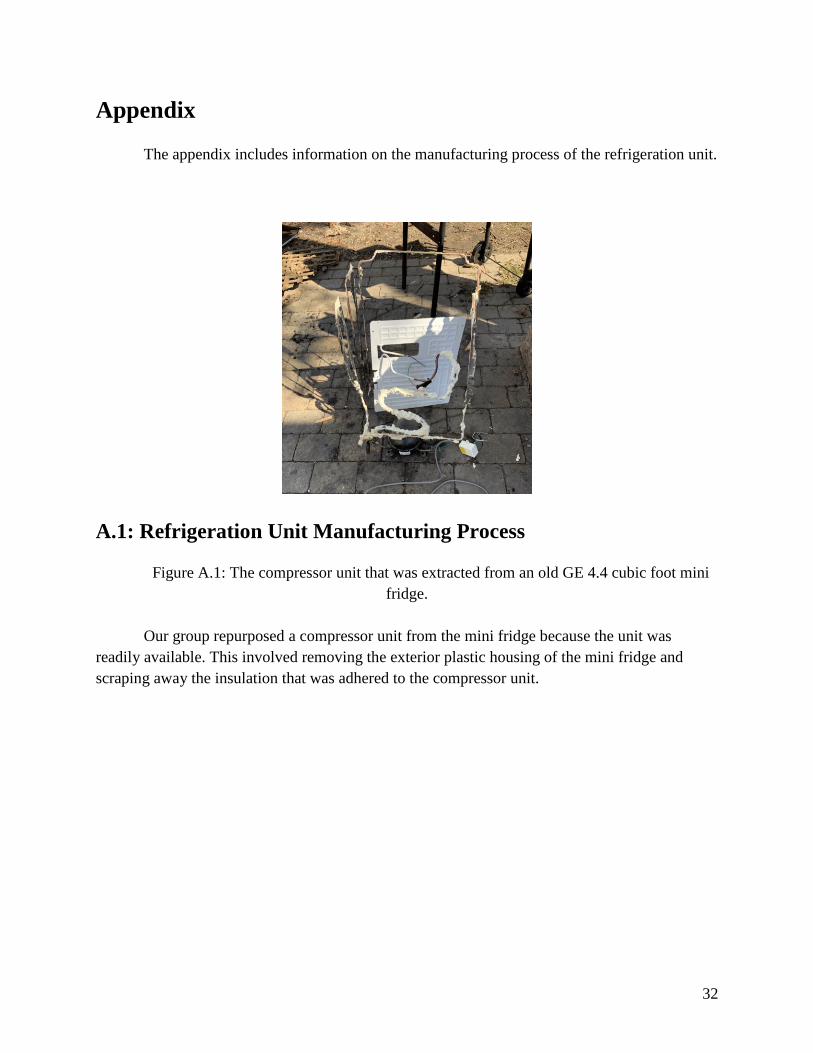
Figure A.4: Unit with polystyrene insulation added to surround the steel container.
We added polystyrene to the exterior of the steel container because we wanted to
minimize the heat gain of the interior of the container from the environment. In addition to this,
the insulation was supported by the frame.
35
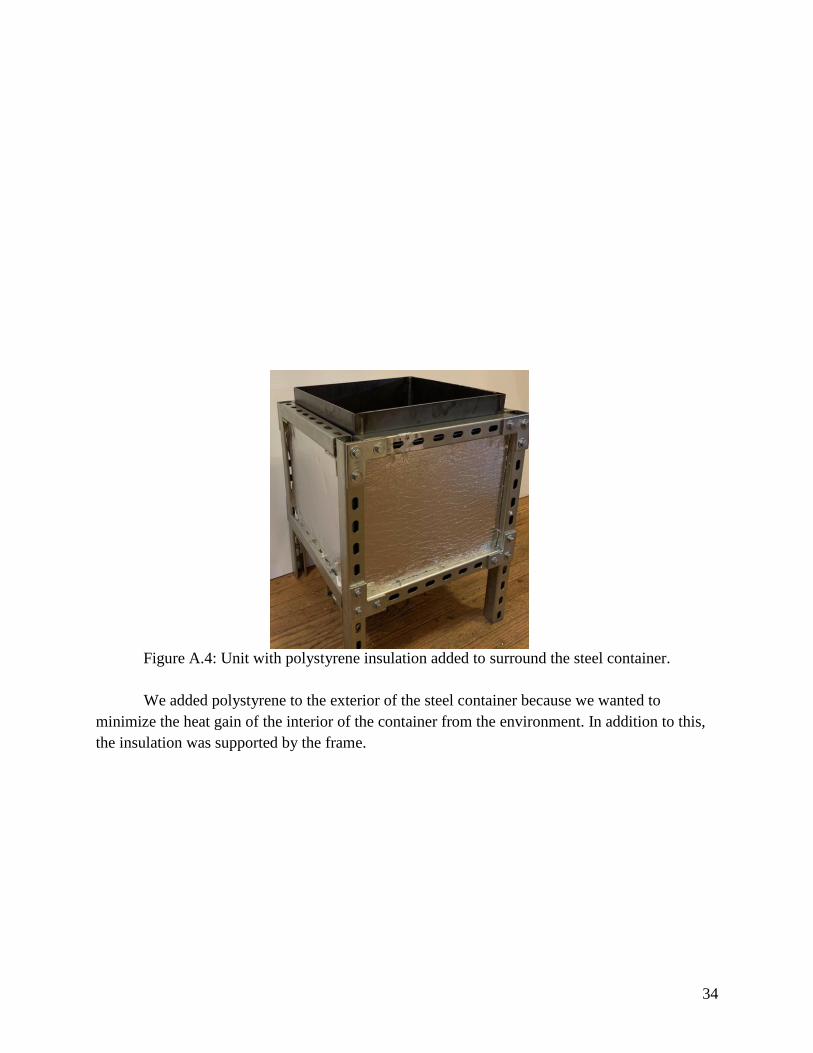
Figure A.5: Unit with a second layer of polystyrene and a layer of foil.
A second layer of polystyrene was added to make the unit flush with the frame. This also
served to further insulate the interior steel container from the ambient heat. A layer of reflective
foil was pasted over the insulation to help reduce heat transfer via radiation and also to cover the
holes present in the frame.
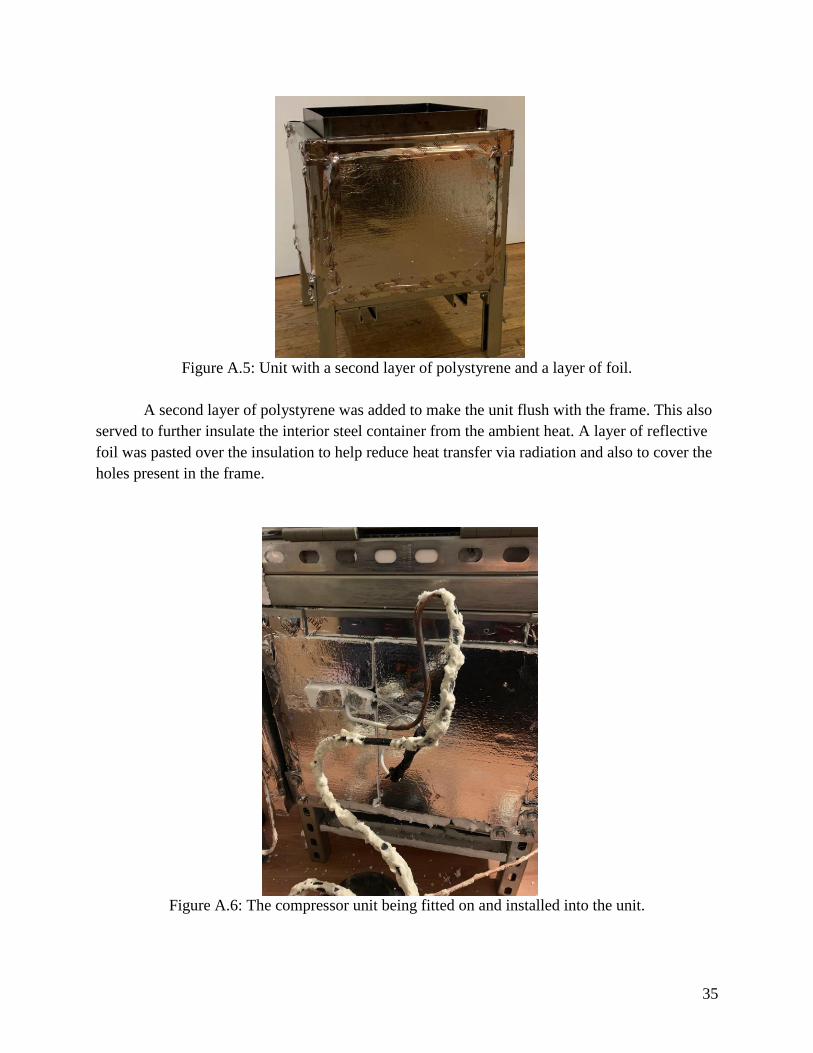
Figure A.6: The compressor unit being fitted on and installed into the unit.
36
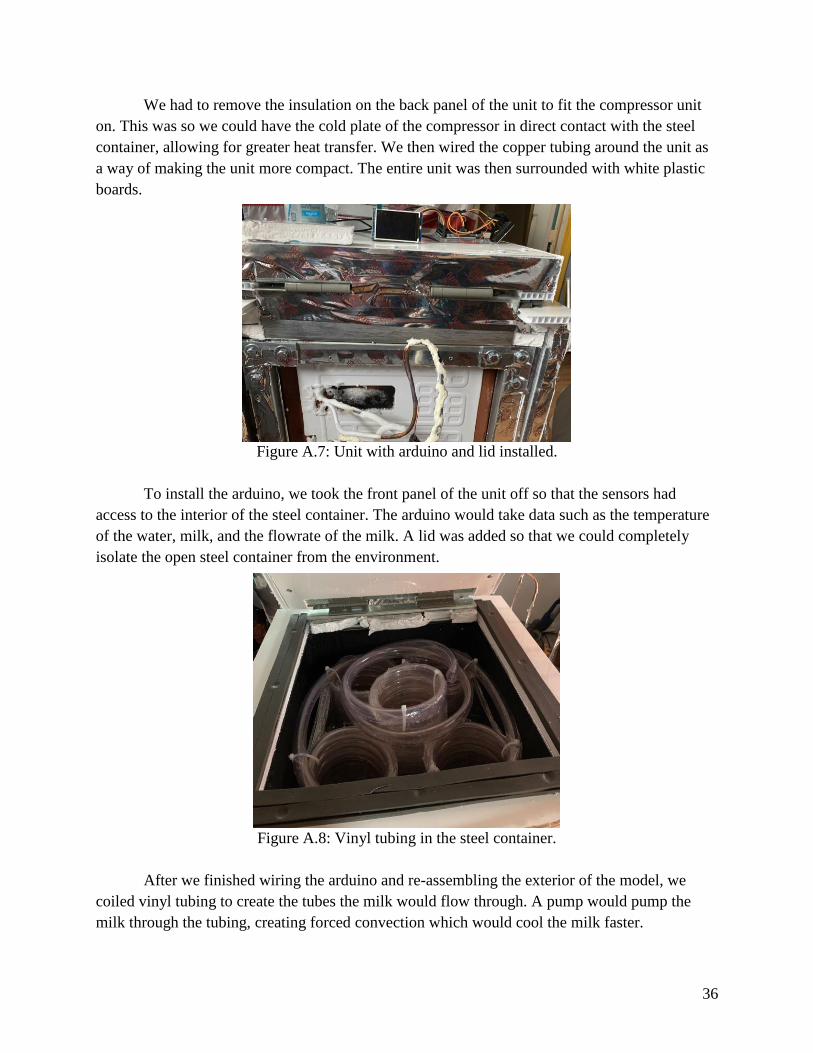
We had to remove the insulation on the back panel of the unit to fit the compressor unit
on. This was so we could have the cold plate of the compressor in direct contact with the steel
container, allowing for greater heat transfer. We then wired the copper tubing around the unit as
a way of making the unit more compact. The entire unit was then surrounded with white plastic
boards.
Figure A.7: Unit with arduino and lid installed.
To install the arduino, we took the front panel of the unit off so that the sensors had
access to the interior of the steel container. The arduino would take data such as the temperature
of the water, milk, and the flowrate of the milk. A lid was added so that we could completely
isolate the open steel container from the environment.
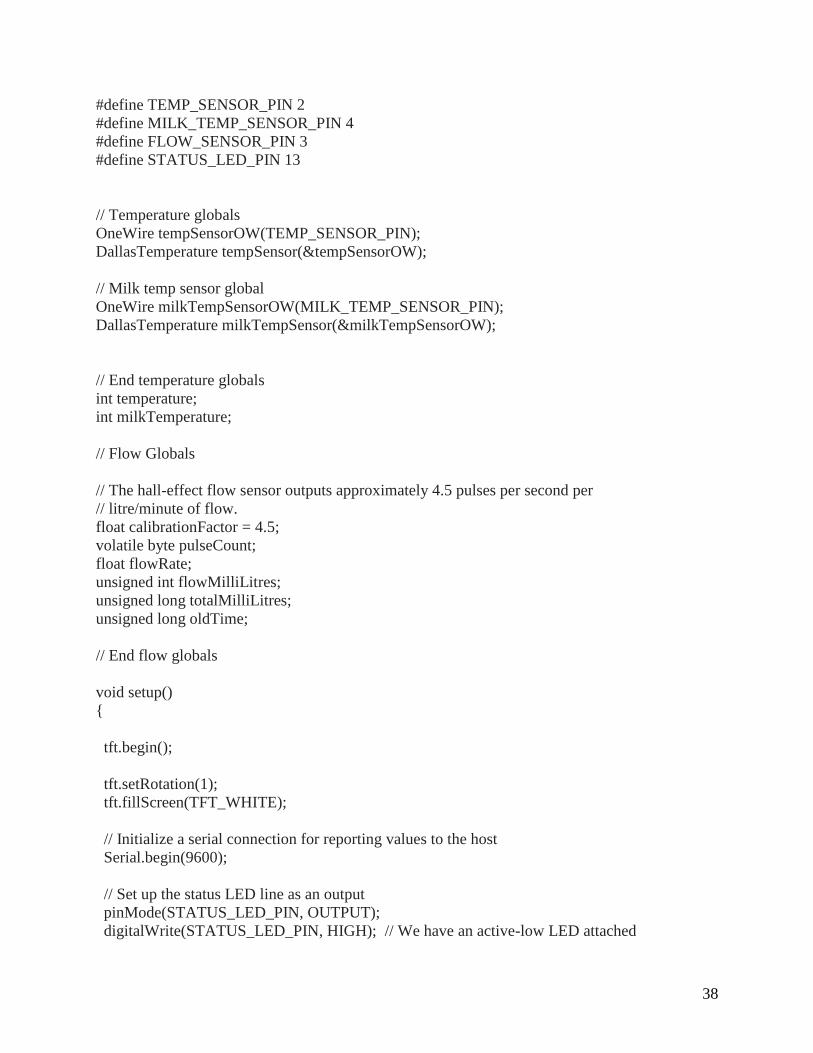
Figure A.8: Vinyl tubing in the steel container.
After we finished wiring the arduino and re-assembling the exterior of the model, we
coiled vinyl tubing to create the tubes the milk would flow through. A pump would pump the
milk through the tubing, creating forced convection which would cool the milk faster.

37
Figure A.9: Final unit with poster in the background.
We presented our project at the annual WPI Mechanical Engineering MQP fair at Alden
Hall. Our poster is in the background and contains Figure 3 and Figure 4 from this paper. The
Arduino on the front panel reports the temperature of the milk, water, and flowrate of the milk.
The valve in the front is to drain the milk from the tubing.
A.2: Arduino Code
#include <OneWire.h>
#include <DallasTemperature.h>
38
#define TEMP_SENSOR_PIN 2
#define MILK_TEMP_SENSOR_PIN 4
#define FLOW_SENSOR_PIN 3
#define STATUS_LED_PIN 13
// Temperature globals
OneWire tempSensorOW(TEMP_SENSOR_PIN);
DallasTemperature tempSensor(&tempSensorOW);
// Milk temp sensor global
OneWire milkTempSensorOW(MILK_TEMP_SENSOR_PIN);
DallasTemperature milkTempSensor(&milkTempSensorOW);
// End temperature globals
int temperature;
int milkTemperature;
// Flow Globals
// The hall-effect flow sensor outputs approximately 4.5 pulses per second per
// litre/minute of flow.
float calibrationFactor = 4.5;
volatile byte pulseCount;
float flowRate;
unsigned int flowMilliLitres;
unsigned long totalMilliLitres;
unsigned long oldTime;
// End flow globals
void setup()
{
tft.begin();
tft.setRotation(1);
tft.fillScreen(TFT_WHITE);
// Initialize a serial connection for reporting values to the host
Serial.begin(9600);
// Set up the status LED line as an output
pinMode(STATUS_LED_PIN, OUTPUT);
digitalWrite(STATUS_LED_PIN, HIGH); // We have an active-low LED attached

39
pinMode(FLOW_SENSOR_PIN, INPUT);
pulseCount = 0;
flowRate = 0.0;
flowMilliLitres = 0;
totalMilliLitres = 0;
oldTime = 0;
// The Hall-effect sensor is connected to pin 2 which uses interrupt 0.
// Configured to trigger on a FALLING state change (transition from HIGH
// state to LOW state)
attachInterrupt(digitalPinToInterrupt(FLOW_SENSOR_PIN), pulseCounter, FALLING);
Serial.println("Initialization Complete.");
// Start up the library
milkTempSensor.begin();
tempSensor.begin();
}
/**
Main program loop
*/
void loop()
{
int xpos = 20;
int ypos = 55;
tft.setTextColor(TFT_BLACK, TFT_WHITE);
tft.setCursor(xpos, ypos); // Set cursor near top left corner of screen
// tft.setFreeFont(FSB24);
tft.setTextSize(3.5);
tft.print("Flow Rate(L/min): ");
tft.println(flowRate);
tft.setCursor(20, 155);
tft.print("Temp(C): ");
tft.print(temperature);
tft.print(" ");
tft.setCursor(20, 255);
tft.print("Milk Temp(C): ");
tft.print(milkTemperature);
tft.print(" ");
40
if ((millis() - oldTime) > 1000) // Only process counters once per second
{
updateFlowData();
updateTempData();
displayFlowData();
displayTempData();
delay(500);
}
}
// Our data display functions
void displayFlowData()
{
// Print the flow rate for this second in litres / minute
Serial.print("Flow rate: ");
Serial.print(int(flowRate)); // Print the integer part of the variable
Serial.print("L/min");
Serial.print("\t"); // Print tab space
// Print the cumulative total of litres flowed since starting
Serial.print("Output Liquid Quantity: ");
Serial.print(totalMilliLitres);
Serial.println("mL");
Serial.print("\t"); // Print tab space
Serial.print(totalMilliLitres / 1000);
Serial.print("L");
}
void displayTempData()
{
Serial.print("Temperature is: ");
Serial.print(temperature);
Serial.print("Milk Temperature is: ");
Serial.print(milkTemperature);
}
// Our data update functions
void updateTempData()
{
Serial.print("Updating Temperature data");
tempSensor.requestTemperatures();
temperature = tempSensor.getTempCByIndex(0);
41
milkTempSensor.requestTemperatures();
milkTemperature = milkTempSensor.getTempCByIndex(0);
// Send the command to get temperature readings
Serial.println("DONE");
}
void updateFlowData()
{
Serial.print("Updating flow data");
// Disable the interrupt while calculating flow rate and sending the value to the host
detachInterrupt(digitalPinToInterrupt(FLOW_SENSOR_PIN));
// Because this loop may not complete in exactly 1 second intervals we calculate we adjust by
the exact time difference
flowRate = ((1000.0 / (millis() - oldTime)) * pulseCount) / calibrationFactor;
// Note the time this processing pass was executed. Note that because we've
// disabled interrupts the millis() function won't actually be incrementing right
oldTime = millis();
// Divide the flow rate in litres/minute by 60 to determine how many litres have
// passed through the sensor in this 1 second interval, then multiply by 1000 to
flowMilliLitres = (flowRate / 60) * 1000;
// Add the millilitres passed in this second to the cumulative total
totalMilliLitres += flowMilliLitres;
// Reset the pulse counter so we can start incrementing again
pulseCount = 0;
// Enable the interrupt again now that we've finished sending output
attachInterrupt(digitalPinToInterrupt(FLOW_SENSOR_PIN), pulseCounter, FALLING);
}
/*
Insterrupt Service Routine
*/
void pulseCounter()
{
// Increment the pulse counter
pulseCount++;
}
42
A.3: Arduino and accessories
1. Arduino Mega 2560 REV3 [A000067]
2. SUNKEE DS18B20 Temperature Sensor – Waterproof Digital Thermal Probe Sensor
(Quantity – 2)
3. Gikfun Water flow sensor 1-30L/min for Arduino EK1457
4. HiLetgo 3.2” IPS TFT LCD Display ILI9481 480X320 36 Pins for Arduino Mega 2560