solar pv where the sun doesn’t shine: estimating the … performance of residential... · solar...
TRANSCRIPT
1
Solar PV where the sun doesn’t shine: Estimating the economic impacts of support
schemes for residential PV with detailed net demand profiling
Sarah LaMonacaac and Lisa Ryanbc
a UCD Michael Smurfit Graduate Business School, Blackrock, Co. Dublin, Ireland. Email:
b UCD School of Economics, Belfield, Dublin 4 Ireland. Email: [email protected]
c UCD Energy Institute, Belfield, Dublin 4, Ireland.
Abstract
Countries with low irradiation and solar PV adoption rates are increasingly considering
policy support for solar PV, although consumer electricity demand and solar generation
profiles are often mismatched. This paper presents a methodology for policymakers in such
conditions to examine more precisely the financial performance of residential solar PV from
the consumer perspective as part of an ex-ante policy assessment. We model a range of
prospective policy scenarios and compare policy mechanisms that compensate homeowners
for generation, those that reduce their upfront costs, and those that assist with financing,
using Ireland as a case study. The results confirm the intuitive notion that more generous
financial remuneration schemes provide quicker payback; however we observe that in low
irradiance regions there is little difference between upfront grants and feed-in-tariffs to
accelerate payback timeframes. We also show the importance of retail tariff structure in
consumer payback for solar PV systems, with one-part tariffs generating shorter paybacks
than two-part tariff structures, although the latter is more likely to secure revenue for
electricity infrastructure investment. Drawing from this analysis, the paper proposes some
options for the design of policy supports and tariff structures to deliver a sustainable
residential renewable electricity system in low-irradiance regions.
2
Keywords: Energy policy; energy economics; residential solar PV; electricity rate structure;
financial performance; distributed generation
1. Introduction
Solar photovoltaic (PV) technology has experienced a dramatic reduction in installed
costs in recent years, falling more than 80% since 2008 (IRENA, 2015). As the technology
becomes more competitive with conventional generation sources, deployment has increased
sharply, reaching 177 GW total installed capacity worldwide in 2014 (REN21, 2015). The
majority of deployment thus far has naturally been concentrated in locations with some
combination of a strong solar resource or sufficiently generous policy supports, which in
some cases have created windfall benefits for asset owners at high public cost, ultimately
leading to unstable, boom-and-bust market dynamics (De Boeck et al, 2016). As PV costs
continue to fall, policymakers in countries with lower solar irradiation are also beginning to
consider whether solar PV might be a viable renewable energy resource and worthy of policy
support. In the development of such policies, these late-adopters have significant opportunity
to avoid the mistakes of others in the design of policy support mechanisms and pricing
through learning from other countries’ experiences. Careful analysis is thus required to assess
whether solar PV is an appropriate technology justifying policy support in such countries.
In carrying out ex-ante solar PV policy assessment, policymakers should consider a range
of key factors, including the system value of increasing the share of solar PV on the
electricity system, the current and future economics of solar PV for different customers—
residential, commercial, and utility-scale—and the environmental and other impacts of
increased solar PV electricity generation. Of these, this paper focusses on the assessment of
consumer economics of residential solar PV using Ireland as a case study, and examines the
effect of remuneration schemes, tariff structures, and financing mechanisms on financial
3
performance. It follows a related paper on the system value of utility-sale solar PV (Ryan et
al., 2016).
Many existing papers offer comparative analysis of financial performance under various
support mechanisms between different countries with varying costs, irradiance profiles, and
other market conditions (see for example: Couture and Gagnon, 2010; Sarasa Maestro et. al.,
2013; Campoccia et al., 2014; Dusonchet and Telaretti, 2015; de Boeck et al., 2016; Lacchini
and Ruther, 2015). As of 2015, feed-in tariffs (FiTs) were in place in 108 national or state
jurisdictions around world (REN21, 2015). While some research shows that feed-in tariffs
“consistently delivered new renewable energy (RE) supply more effectively, and at lower
cost, than alternative policy mechanisms” (Couture and Gagnon, 2010), others offer more
cautionary comments regarding the dangers of overly generous FiTs that are costly to
governments (and ultimately, to ratepayers), and can yield windfall profits for investors
(Sarasa Maestro et. al., 2013). Lacchini and Ruther (2015) find, on the other hand, that
policies should be focussed on reducing upfront investment costs rather than providing
generation-based remuneration. Given the lack of universal agreement on the type of policy
most effective and efficient for solar PV, it is clear that optimal design should be informed by
the solar resource and other market characteristics in the individual country.
A consideration for policy makers in new solar PV jurisdictions, and also the focus of a
growing academic literature, is the detrimental impact of high shares of distributed solar PV
on supplier revenues. In many countries, the costs of distribution, transmission and
generation of electricity are recovered through retail tariffs levied on a volumetric basis
(Darghouth et al., 2016). In such cases, solar PV customers who demand less electricity from
the grid also avoid paying for electricity system costs. With net metering policies, under
which PV customers are paid the retail rate for the total amount of electricity they generate,
this effect is particularly acute, and constitutes an implicit subsidy by which customers are

4
effectively paid for distribution, transmission and generation services that they do not provide
(Kirsch and Morey, 2015).1 In a world with higher shares of distributed renewable
generation, another form of tariff will likely be needed to recover fixed costs of grid services
(Sioshansi, 2016). One option is a two-part tariff that includes a fixed charge for grid services
and a volumetric electricity charge (Darghouth et al., 2011). In any case, the design of the
tariff has a strong impact on the financial performance of PV systems and therefore both the
current and potential future structure of retail tariffs should be considered by policymakers in
assessing the economics of solar PV policies.
The cost of financing also exerts a strong influence on the financial feasibility of solar PV
projects (Ondraczek et al. 2015; Tao and Finenko, 2016). Intuitively, it follows that localities
that offer financial incentives experience increased rates of PV deployment, as confirmed by
Jacobsson and Lauber (2006), Sarzynski et al (2012), and Crago and Chernyakhovskiy
(2017). Notably, the financing conditions and hence options for residential consumers are
different than those applicable to commercial investors. Households may have significant
savings and prefer to pay for a PV system in cash, especially when deposit interest rates are
low. Others may be more likely to use debt finance, in which case lending rates will
determine the cost of servicing that debt. It is critical also to recognise that households use
different decision-making criteria for capital budgeting decisions compared with commercial
entities, and financial performance must be evaluated accordingly. Faiers and Neame (2006)
find that payback period (PBP) is the metric that holds the greatest sway over homeowners’
decision-making process when considering an investment in rooftop PV. Lee et al. (2016)
also use payback period, citing Rai and McAndrews (2012), who find that households require
a payback period of seven to ten years in order to proceed with rooftop PV investment.
1 Conversely, distributed generation may also provide some ancillary services for which asset owners are not
adequately remunerated.
5
Scarpa and Willis (2010) find an even shorter required timeframe of between three and five
years, though a ten year maximum is perhaps more appropriate in the context of an immature
market such as the one examined herein.
Many researchers have provided a critical contribution with regard to the retrospective
assessment of customer economics in a range of policy environments. Necessarily, however,
much of the existing research and ex-post policy analysis examines conditions in countries
where the combination of strong solar resources and supportive policies led to early adoption.
We believe that a more targeted approach is appropriate for the purposes of identifying, ex-
ante, the effect of these policies on prospective PV uptake in the residential sector.
Economists have pointed out that electricity is a heterogeneous product in time, space, and
lead-time dimensions (Hirth et al., 2016; Borenstein, 2012; Joskow, 2011). Therefore, since
the value of electricity and the amount of solar PV generation changes over time, biases occur
when financial performance is based on average values, as is often the case in the existing
solar policy literature. This may be particularly important in jurisdictions where there is a
mismatch between the timing of electricity demand and solar generation, such as in countries
in the northern hemisphere with low solar irradiation and large variations between the length
of day in winter and summer.
While we find no commonly-used scale or ranking for “low irradiance” in the literature,
Ondrececk et al (2015), using data compiled by Breyer and Gerlach (2013), show that the
lowest solar resource of any region in the world is found in Northern European countries with
maximum irradiance of 1,000 kWh/kWp per annum. These countries include the Netherlands,
Belgium, Denmark, Lithuania, Latvia, Ireland, UK, Estonia, Sweden, Finland, and Iceland
(JRC, 2017).While some literature explores the deployment of PV in these countries (see:
Huijben and Verbong, 2013; Leloux et al, 2012; Martins, 2017) - particularly in the UK (e.g.
Colantuono et al, 2014; Balta-Ozkan, et al 2015), which has offered considerable incentive
6
programmes - none, to our knowledge, focus specifically on the low-irradiance characteristics
of these markets, such as the differences in load profile, seasonal peak demand, and effect on
consumer financial performance.
In this paper we present a methodology for assessment of the financial performance of a
rooftop PV installation from the system owner’s perspective with detailed profiling using
hourly generation and demand patterns for the entire system lifetime. Given the sensitivity of
residential solar profitability to self-consumption rates, our detailed analysis offers a more
accurate estimate of self-consumption and net export than is presented in much of the existing
literature, which tends to feature broad assumptions about net output and self-consumption
proportions. Here, we explore potential profitability with greater precision by focussing on
the example of Ireland, which features one market with relatively consistent costs, irradiance,
and consumer profiles in a low solar irradiance location without a solar PV support
mechanism. This approach improves upon previous papers’ findings, which may be of
diminished utility due to the presence of heterogeneous market conditions. Finally, we
examine the influence of the significant determinant factors discussed above on residential
solar PV economics, including remuneration policy supports, different household financing
options and the electricity tariff structure using some traditional discounted cash flow metrics
(net present value and internal rate of return), but with a particular focus on payback period.
Section 2 of the paper provides additional background on the factors affecting financial
performance of residential PV, as well as the renewable energy policy and context in Ireland.
Section 3 details the data and methodology employed; Section 4 presents overall findings and
discussion; and Section 5 concludes with observations on policy implications arising from
our results.
7
2. Background – Solar PV in Ireland
We examine Ireland as a case study for late adoption of solar PV. Ireland has a relatively
low solar resource and only a negligible amount of residential PV currently exists; its
government is in the process of a multi-stage consultation on prospective renewable energy
support schemes (SEAI, 2013; DCENR, 2015). In Ireland, renewable electricity has mainly
been generated by onshore wind, supported by a feed-in tariff since 2006 (DCENR, 2013).
By end of 2015, 21.1% of electricity in Ireland was produced from wind, with 2,440
megawatts (MW) of wind energy installed in the Republic of Ireland (SEAI, 2016).2
The European Union (EU) has set a target of 27% renewable energy by 2030, which will
require additional renewable capacity in Ireland. While it is technically feasible to meet the
target with on-shore wind alone,3 it is likely to be challenging: the current level of public
acceptance of new wind generation and associated infrastructure is low, which may limit the
commissioning of new wind plant. Strategically, solar energy could have several advantages
for Ireland as a way to diversify the fuel mix and renewable electricity portfolio, reduce
dependence on imported fuels - Ireland imports 88% of its total energy fuels at a cost of €4.6
billion in 2015 - and as a pathway to meeting its EU targets (SEAI, 2016). Solar energy may
also provide benefits in reducing wind curtailment if there is a different temporal profile of
solar PV generation compared with wind (Ryan et al., 2016).
As residential PV may be considered as a potential recipient of policy support, it is timely
to examine the economic value currently available to homeowners who might consider
installing solar, and how the asset owners’ financial gains could be affected under different
2 In order to meet 2020 renewable energy targets, Ireland needs to produce 40% electricity from renewable
sources. The share of wind is normalised in line with EU reporting requirements to take account of different
heating degree days year on year. Another 445 MW and 1,357MW of wind generation have been contracted for
connection by end 2016 and 2017 respectively. 3 It should be noted that wind curtailment poses an increasingly important issue for wind energy producers.
Wind curtailment is when wind energy is available but cannot be produced because of power system limitations
8
policy schemes. Such analysis may also inform any deliberations regarding whether and how
to implement policy support schemes.
Previous analysis of the economics of solar PV in Ireland has found that Irish residential
PV was not profitable even with some level of subsidy. For example, Li et al (2011) estimate
that even with a large upfront grant or a generous FiT, residential PV projects in Ireland
never achieve a positive NPV or IRR, and ultimately do not pay back over their lifetime.
Ryan et al (2016) examine the economics of utility-scale PV in Ireland, finding that a
relatively high tariff is required to render projects profitable, however the analysis was only
conducted for utility-scale projects. With substantially altered market conditions in contrast to
Li et al, and extending the work of Ryan et al (2016), this paper updates and extends previous
work on Ireland and is likely to be of interest to policymakers, especially in other below-
average irradiance locations where similar dynamics are at play.
3. Data & Methodology
The analysis begins with the development of a model to estimate the hourly generation of
solar electricity and household electricity demand (the net production model). The cost
figures used are based on data collection and interviews with active market practitioners.
Combining these, we model scenarios of various remuneration and financing strategies and
examine their impacts on the financial performance.
3.1 Net Production Model
We use detailed production time series data to model the generation arising from a PV
installation in Ireland, and compare this to hourly household demand data to ensure an
accurate estimation of self-consumption and net export potential. Generation data is obtained
using the National Renewable Energy Laboratory (NREL) System Advisory Model (SAM)
9
(NREL, 2015).4 Within the SAM tool, generation data was queried for Dublin, Ireland. We
selected three plausible size scenarios for which to obtain generation profiles, based on
interviews with Irish PV installers currently active in the residential PV market. The sizes
range from a relatively small system sized at 3 kWp, to a mid-size system at 4.5 kWp, to the
maximum size allowable before triggering additional planning costs, 6 kWp.
All other parameters for production are automated by SAM, which applies the
PVWATTS production model5. Given that the purpose of this paper is to examine typical
residential PV economics under different support structures, rather than to examine results
that are technology-specific or which arise from modifications to system design, we do not
adjust performance specifications beyond the suggested settings provided in the model.6
SAM generation data is produced using a “typical year” methodology, which analyses a
multi-year data set to select the most representative month from the multi-year set (NREL
2015). The data for Dublin thus represents the most typical values for each month dating
from when Dublin weather data was available in the SAM system. We selected the capital
city of Dublin for modelling generation, as Dublin is home to nearly one third of Irish
households, and because there is relatively low variation in irradiance within the country
(CSO, 2016).7 The SAM tool produces an hourly generation profile for the year, indicating
4 SAM is an open-access performance modelling tool that is widely used for PV research purposes by both
academics and practitioners (https://sam.nrel.gov/). While SAM has the capability to vary a range of technical
inputs for specific PV, inverter, and racking hardware, as well as to provide financial modelling given local
policy circumstances, for the purposes of this analysis, we simply obtain a data set indicating the kWh output for
each hour of a typical year in Dublin, Ireland, as described in the text. 5 PVWATTS, a web-based simulation model also developed by NREL is the underlying production model used
to estimate generation, given a specific range of parameters, within the SAM system (http://pvwatts.nrel.gov/). 6 Standard assumptions include inverter efficiency of 96%, fixed open rack array type, 20 degrees tilt, 180
degrees azimuth, total system losses of 14%, and no shading. 7 According to PVGIS maps available from the E.U. Joint Research Council (JRC), optimised solar in much of
Ireland ranges from approximately 1000 - 1200 kWh/m2, with up to 1400 in coastal locations. However,
compared with utility-scale solar, which might be sited in the most commercially apt locations, the decision to
install rooftop PV would be undertaken by households across the country, not strictly in the most favourable
locations. Thus, a representative, non-optimised locational selection was appropriate for this work.

10
the kWh of generation in each of 8,760 hours. The SAM model estimates that annual energy
yield from solar PV in Dublin is 865 kWh/kWp.
Demand data used in the analysis was obtained from network operator ESB’s
Standard Load Profiles (SLPs), which draw from a sample of metered residences, and
produce a unitised profile, such that the values for each 15-minute increment of each year
reflect the proportion of electricity consumed during that increment. The load profiles are
thus customisable for any annual demand magnitude by multiplying all 15-minute usage
values by a selected annual total use. Profiles are developed annually using the sample meter
data from the previous year. This analysis uses the derived load profiles for 2015. We
selected Load Profile 1 (LP1), derived from users on a 24-hour urban domestic tariff.8 We
select high, middle, and low annual usage scenarios from national average values, obtained
from (CER 2016), as outlined in Table 1: 9
Table 1. Annual Household Electricity Demand Scenarios
Low Usage Mid Usage High Usage
3,100 kWh 5,300 kWh 8,100 kWh
These values serve as the total electricity consumption for households before PV
generation is considered. Figures 1 and 2 illustrate the diurnal and annual distributions of
Irish solar PV generation and household electricity demand produced from the sources
decribed above. In Figure 1, it is clear that daily peak household electricity demand does not
8 The 24-hour urban domestic tariff was selected instead of the Nightsaver tariff, which provides a cheaper
night-time electricity rate, as in practical terms, the presence of a Nightsaver rate may incentivize load-shifting. 9 Average electricity figures are for a 1-bedrom, 3-bedroom, and 5-bedroom household, respectively, as
indicated by the Commission on Energy Regulation (CER) and an accredited electricity supplier aggregator.
Practical limitations of residence size with regard to spatial feasibility of, for instance, a 1-bedroom home
hosting a 6 kWp solar PV installation are outside the scope of this paper; we assume that all hypothetical
residences modelled could accommodate PV systems up to 6 kWp.
11
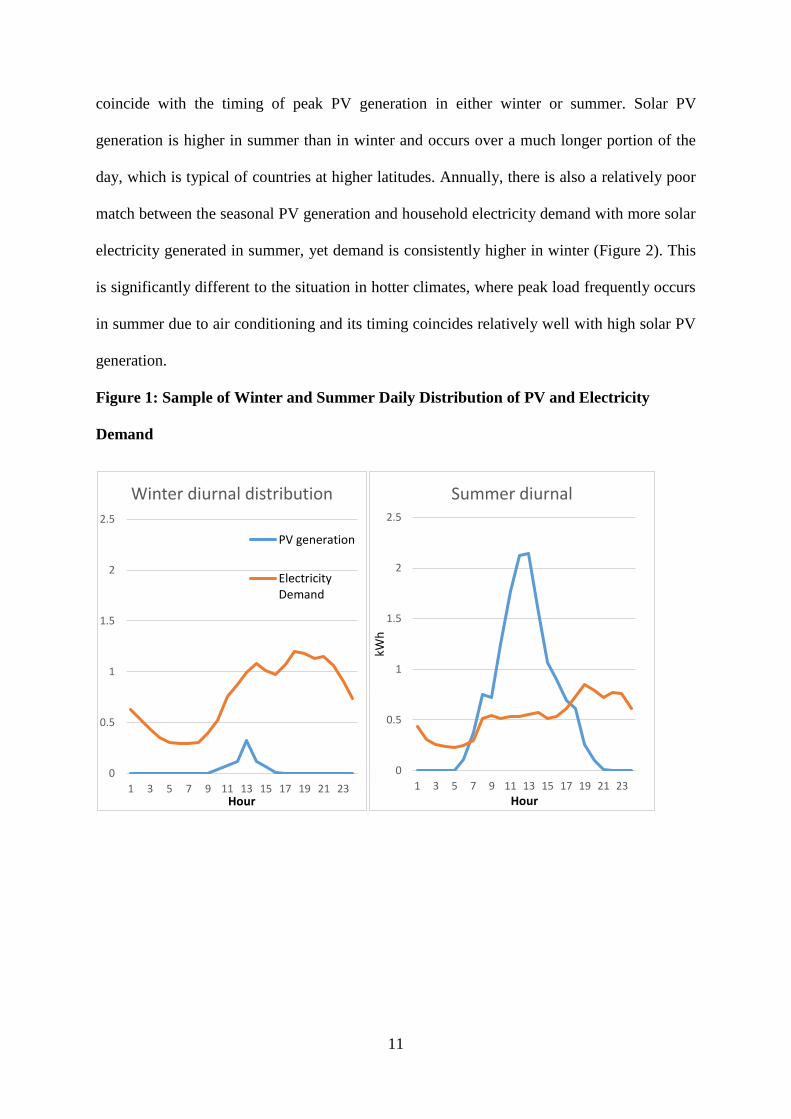
coincide with the timing of peak PV generation in either winter or summer. Solar PV
generation is higher in summer than in winter and occurs over a much longer portion of the
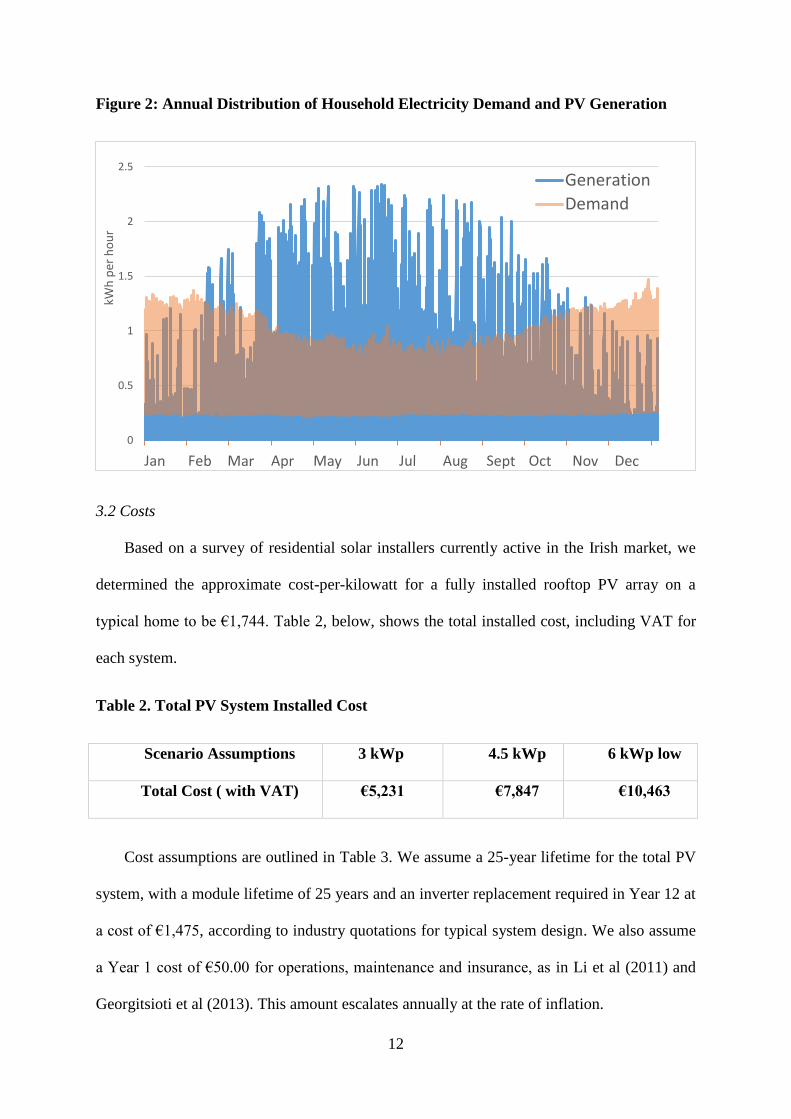
day, which is typical of countries at higher latitudes. Annually, there is also a relatively poor
match between the seasonal PV generation and household electricity demand with more solar
electricity generated in summer, yet demand is consistently higher in winter (Figure 2). This
is significantly different to the situation in hotter climates, where peak load frequently occurs
in summer due to air conditioning and its timing coincides relatively well with high solar PV
generation.
Figure 1: Sample of Winter and Summer Daily Distribution of PV and Electricity
Demand
0
0.5
1
1.5
2
2.5
1 3 5 7 9 11 13 15 17 19 21 23Hour
Winter diurnal distribution
PV generation
ElectricityDemand
0
0.5
1
1.5
2
2.5
1 3 5 7 9 11 13 15 17 19 21 23
kWh
Hour
Summer diurnal
12
Figure 2: Annual Distribution of Household Electricity Demand and PV Generation
3.2 Costs
Based on a survey of residential solar installers currently active in the Irish market, we
determined the approximate cost-per-kilowatt for a fully installed rooftop PV array on a
typical home to be €1,744. Table 2, below, shows the total installed cost, including VAT for
each system.
Table 2. Total PV System Installed Cost
Scenario Assumptions 3 kWp 4.5 kWp 6 kWp low
Total Cost ( with VAT) €5,231 €7,847 €10,463
Cost assumptions are outlined in Table 3. We assume a 25-year lifetime for the total PV
system, with a module lifetime of 25 years and an inverter replacement required in Year 12 at
a cost of €1,475, according to industry quotations for typical system design. We also assume
a Year 1 cost of €50.00 for operations, maintenance and insurance, as in Li et al (2011) and
Georgitsioti et al (2013). This amount escalates annually at the rate of inflation.
0
0.5
1
1.5
2
2.5
kWh
per
ho
ur
Generation
Demand
13
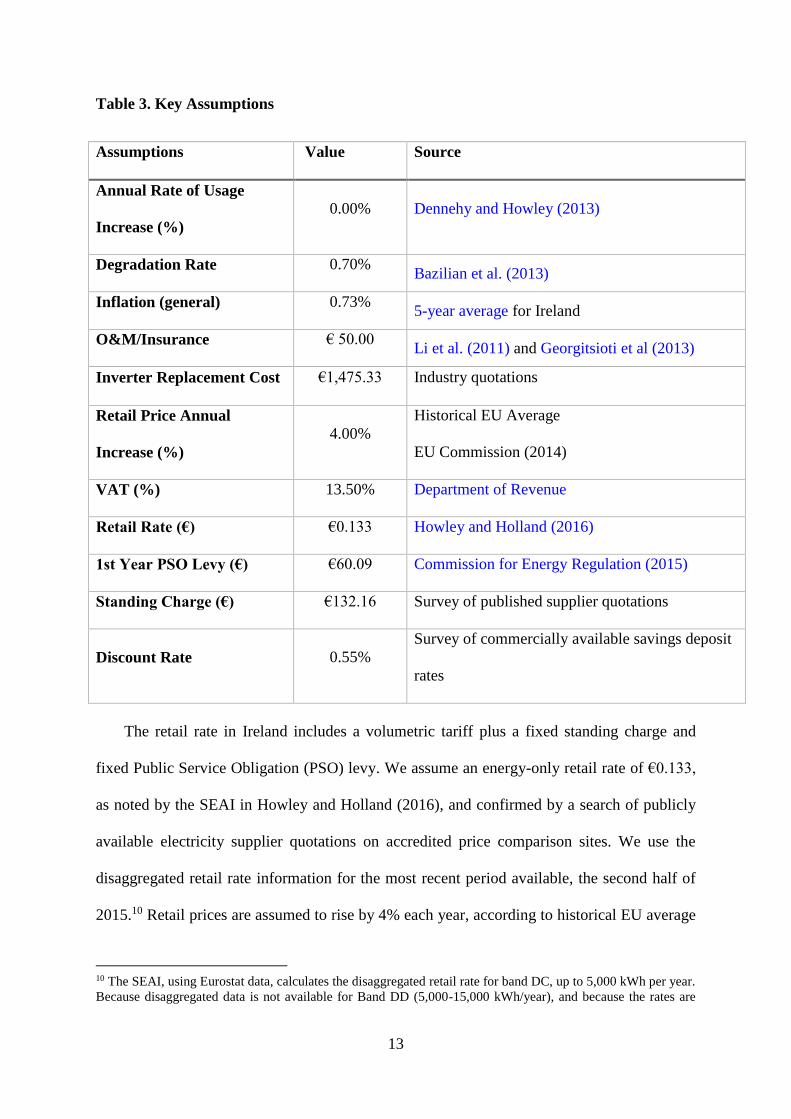
Table 3. Key Assumptions
Assumptions Value Source
Annual Rate of Usage
Increase (%)
0.00% Dennehy and Howley (2013)
Degradation Rate 0.70% Bazilian et al. (2013)
Inflation (general) 0.73% 5-year average for Ireland
O&M/Insurance € 50.00 Li et al. (2011) and Georgitsioti et al (2013)
Inverter Replacement Cost €1,475.33 Industry quotations
Retail Price Annual
Increase (%)
4.00%
Historical EU Average
EU Commission (2014)
VAT (%) 13.50% Department of Revenue
Retail Rate (€) €0.133 Howley and Holland (2016)
1st Year PSO Levy (€) €60.09 Commission for Energy Regulation (2015)
Standing Charge (€) €132.16 Survey of published supplier quotations
Discount Rate 0.55%
Survey of commercially available savings deposit
rates
The retail rate in Ireland includes a volumetric tariff plus a fixed standing charge and
fixed Public Service Obligation (PSO) levy. We assume an energy-only retail rate of €0.133,
as noted by the SEAI in Howley and Holland (2016), and confirmed by a search of publicly
available electricity supplier quotations on accredited price comparison sites. We use the
disaggregated retail rate information for the most recent period available, the second half of
2015.10 Retail prices are assumed to rise by 4% each year, according to historical EU average
10 The SEAI, using Eurostat data, calculates the disaggregated retail rate for band DC, up to 5,000 kWh per year.
Because disaggregated data is not available for Band DD (5,000-15,000 kWh/year), and because the rates are
14
cited in EU Commission (2012). We acknowledge that forecasting retail rates is complex,
and therefore our results present sensitivity analysis for prospective changes to retail rates.
The annual standing charge, which covers a range of supplier and network costs and
which may not be offset by self-consumption of solar, was surveyed from publicly available
commercial quotes at a rate of €132.16, excluding VAT. VAT is added at a rate of 13.5% to
all on-bill charges, including electricity consumed at the retail rate, the standing charge, and
the PSO a levy on all electricity customers which is used to fund existing support schemes,
and which also may not be offset by self-consumption of solar. We begin with a Year 1 PSO
charge of €60.09, the amount applicable for 2016. Because the PSO changes in accordance
with the remuneration programmes it funds, forecasting future increases in PSO is outside the
scope of this work. The same is true of the relationship between network costs and the
standing charge, and therefore we apply only the inflation rate to both the PSO and standing
charge. In any case, because the PSO and the standing charge are fixed amounts charged on
bills with and without PV, the actual amount of these charges does not change the amount of
savings possible from PV self-consumption, and thus does not change the outcome of these
results (see equations 3 and 3a in Section 3.3 below).
3.3 Savings
The electricity that households generate with solar PV for self-consumption offsets
their demand for household grid electricity, which reduces their electricity bills with their
electricity supplier. We refer to the reduction in grid electricity as the self-consumption or
savings and this represents positive cash flows for the household via electricity bill savings.
In order to calculate the savings for the PV cases, as well as to calculate the amount of hourly
net PV export, the quarter-hourly demand data was summed to provide hourly demand
similar in these rate bands, we use the rate for Band DC. Rate accuracy was checked through a public query of
an accredited electricity supplier comparison site.
15
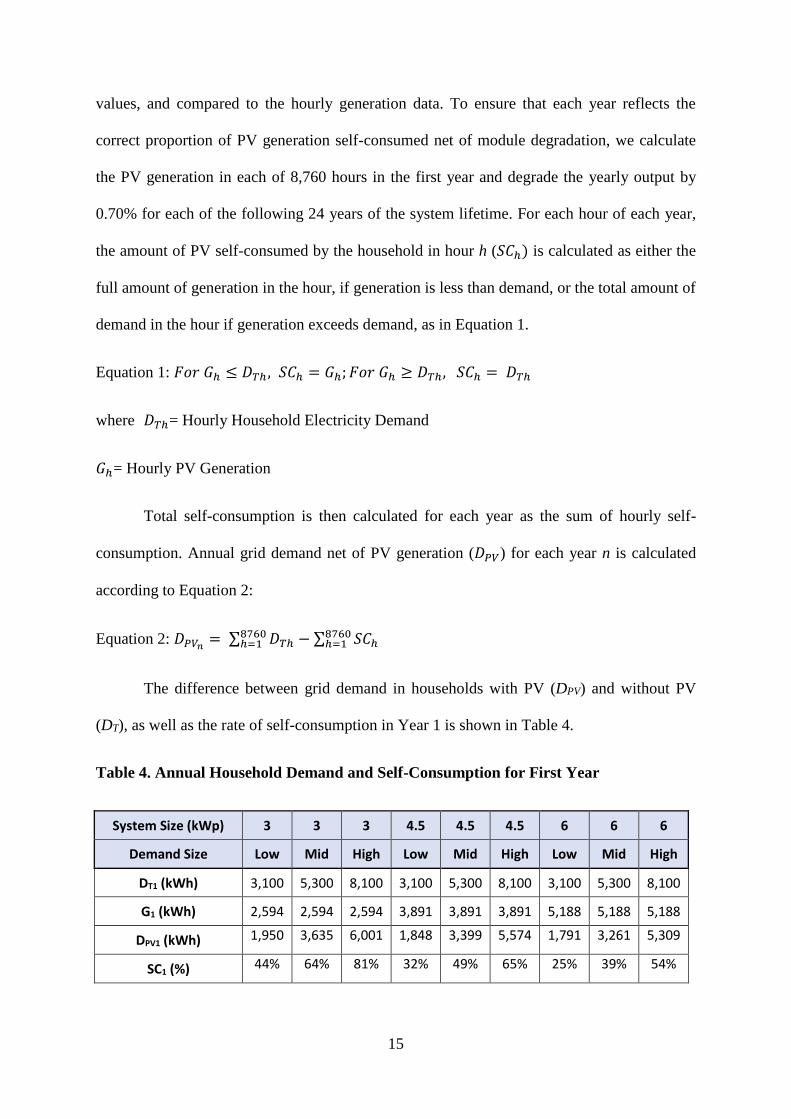
values, and compared to the hourly generation data. To ensure that each year reflects the
correct proportion of PV generation self-consumed net of module degradation, we calculate
the PV generation in each of 8,760 hours in the first year and degrade the yearly output by
0.70% for each of the following 24 years of the system lifetime. For each hour of each year,
the amount of PV self-consumed by the household in hour h (𝑆𝐶ℎ) is calculated as either the
full amount of generation in the hour, if generation is less than demand, or the total amount of
demand in the hour if generation exceeds demand, as in Equation 1.
Equation 1: 𝐹𝑜𝑟 𝐺ℎ ≤ 𝐷𝑇ℎ , 𝑆𝐶ℎ = 𝐺ℎ; 𝐹𝑜𝑟 𝐺ℎ ≥ 𝐷𝑇ℎ, 𝑆𝐶ℎ = 𝐷𝑇ℎ
where 𝐷𝑇ℎ= Hourly Household Electricity Demand
𝐺ℎ= Hourly PV Generation
Total self-consumption is then calculated for each year as the sum of hourly self-
consumption. Annual grid demand net of PV generation (𝐷𝑃𝑉) for each year n is calculated
according to Equation 2:
Equation 2: 𝐷𝑃𝑉𝑛= ∑ 𝐷𝑇ℎ
8760ℎ=1 − ∑ 𝑆𝐶ℎ
8760ℎ=1
The difference between grid demand in households with PV (DPV) and without PV
(DT), as well as the rate of self-consumption in Year 1 is shown in Table 4.
Table 4. Annual Household Demand and Self-Consumption for First Year
System Size (kWp) 3 3 3 4.5 4.5 4.5 6 6 6
Demand Size Low Mid High Low Mid High Low Mid High
DT1 (kWh) 3,100 5,300 8,100 3,100 5,300 8,100 3,100 5,300 8,100
G1 (kWh) 2,594 2,594 2,594 3,891 3,891 3,891 5,188 5,188 5,188
DPV1 (kWh) 1,950 3,635 6,001 1,848 3,399 5,574 1,791 3,261 5,309
SC1 (%) 44% 64% 81% 32% 49% 65% 25% 39% 54%
16
We calculate annual on-bill savings (Sn) as the difference between the annual
household electricity bill with PV and the annual bill without PV. As described in Section
3.3, the annual electricity bill is calculated as total hourly grid demand multiplied by the retail
rate, added to the standing charge and the PSO, all of which is multiplied by the VAT rate.
The savings in year n with PV (𝑆𝑛) are calculated as in Equation 3:
Equation 3: 𝑆𝑛 = [((𝐷𝑇𝑛×𝑟𝑛) + 𝑁𝑛 + 𝑃𝑛) ×𝑣] − [((𝐷𝑃𝑉𝑛
×𝑟𝑛) + 𝑁𝑛 + 𝑃𝑛) ×𝑣]
where 𝐷𝑇𝑛 = Total household electricity demand (before PV)
𝐷𝑃𝑉𝑛 = grid demand net of PV self-consumption
𝑟𝑛 = the retail rate in each year net of annual rate increase
𝑁𝑛 = the standing charge in each year net of inflation
𝑃𝑛 = the PSO levy in each year net of inflation
v = the VAT rate
This can be simplified to read:
Equation 3a: 𝑆𝑛 = (𝐷𝑇𝑛− 𝐷𝑃𝑉𝑛
) × 𝑟𝑛 × 𝑣
The simplification of Equation 3 demonstrates that the bill savings are calculated purely
using the volumetric part of the tariff. While many studies use an aggregate retail rate which
incorporates all taxes and charges, this component-based approach allows us to account for
the fixed portion of Irish electricity bills which must be paid irrespective of the rate of self-
consumption, giving a more precise estimation of annual savings. Indeed, we find that
forecasts of financial benefits to PV system owners are markedly different when applying the
existing 2-part tariff with fixed plus volumetric charges, rather than a 1-part, volumetric-only
17
charge, as is employed by many installers and industry publications (See: ISEA, 2015).
Additional analysis on this point is included in Section IV.
Annual net export for each year n (𝑁𝐸𝑛) of any excess PV generation not self-
consumed is necessary for calculating cash inflows in scenarios with remuneration for excess
generation. It can be calculated by subtracting the number of kilowatt hours self-consumed
from the total generation, as in Equation 4:
Equation 4: 𝑁𝐸𝑛 = ∑ 𝐺ℎ8760ℎ=1 − ∑ 𝑆𝐶ℎ
8760ℎ=1
3.4 Financial Model
We develop a cash flow model using the upfront costs and net cash flows for each
combination of system size (3 kWp, 4.5 kWp, and 6 kWp) and annual household electricity
demand (low, middle, and high) in Excel to calculate the Net Present Value (NPV) for each
PV system size/demand scenario, according to Equation 5:
Equation 5: 𝑁𝑃𝑉 = ∑𝑆𝑛−𝐶𝑛+(𝑁𝐸𝑛 × 𝑡)
(1+𝑑)𝑛25𝑛=1
where 𝑆𝑛 is the savings calculated in year n
𝐶𝑛 is the system cost in year n, including capital costs in year 1, operating expenditures and
inverter replacement where applicable
𝑁𝐸𝑛 is the net export, or amount of excess generation for which the system owner is
compensated
t is the rate at which net export is remunerated, and
d is the discount rate.
When exported generation is remunerated, we assume it is at rate t. This is set equal to
the retail rate, r, in the case of net metering; equal to the FiT rate in the case of a FiT; and
18
equal to zero in the case where no subsidy applies. Because we assume homeowners are
making a binary decision about whether or not to invest in solar, and importantly, do not
consider other investment options, we discount cash flows at the available deposit rate. We
apply a discount rate of 0.55%, reflecting the mid-range of publicly advertised annual
equivalent interest rates on savings accounts in Ireland.
Because homeowners do not typically make capital budgeting decisions on the basis
of net present value, we also calculate the Internal Rate of Return (IRR), indicating the
returns that homeowners may realise over the lifetime of the project, and Payback Period
(PBP), which marks the year in which cumulative savings surpass the initial cost of the PV
system.11
3.5 Scenarios
We identify a base case that reflects a PV system purchased at full cost with no grants,
funded with an outright cash purchase on behalf of the homeowner, i.e. a 100% equity
purchase. The base case also reflects current policy and regulatory conditions, which allow
for self-consumption to offset volumetric costs but provide no additional compensation for
exported generation. There are currently no grants or financing incentives available for solar
PV generation in Ireland. Incentivisation can be pursued through a variety of policy
mechanisms; our analysis is focused on the effects of remuneration schemes, grants, and
favourable financing options. By way of remuneration mechanisms, we model effects of a
feed-in tariff (FiT) and net metering programme on consumer economics.
FiTs offer a guaranteed price for solar PV generation, either on a gross basis, by
awarding a fixed tariff for every kWh generated, or on a net basis, by awarding a fixed tariff
11 In some cases, cumulative savings are positive in one year, but negative in the next due to inverter
replacement which occurs in Year 12. We report payback as the number of years in which cumulative savings
are positive, thus a payback of 13 years, for example, may mean that cumulative savings were positive in Year
11, then dipped to reflect inverter replacement in Year 12, and recovered to a positive status in Year 14.
19
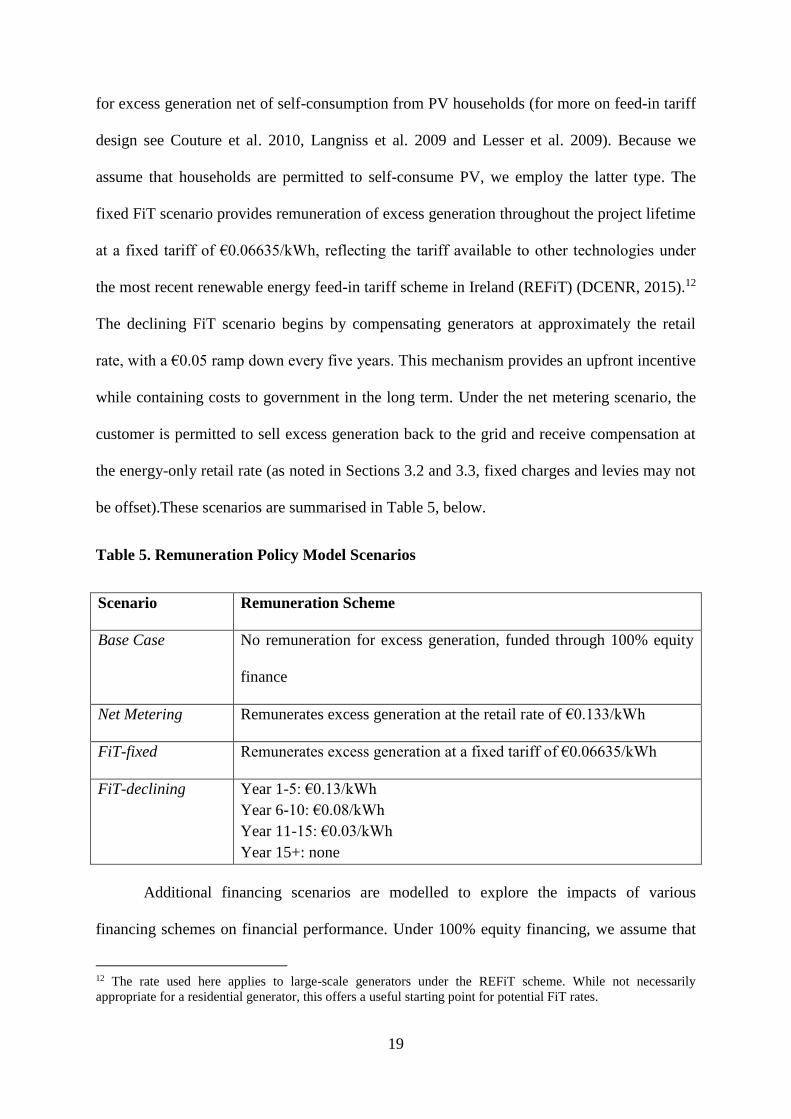
for excess generation net of self-consumption from PV households (for more on feed-in tariff
design see Couture et al. 2010, Langniss et al. 2009 and Lesser et al. 2009). Because we
assume that households are permitted to self-consume PV, we employ the latter type. The
fixed FiT scenario provides remuneration of excess generation throughout the project lifetime
at a fixed tariff of €0.06635/kWh, reflecting the tariff available to other technologies under
the most recent renewable energy feed-in tariff scheme in Ireland (REFiT) (DCENR, 2015).12
The declining FiT scenario begins by compensating generators at approximately the retail
rate, with a €0.05 ramp down every five years. This mechanism provides an upfront incentive
while containing costs to government in the long term. Under the net metering scenario, the
customer is permitted to sell excess generation back to the grid and receive compensation at
the energy-only retail rate (as noted in Sections 3.2 and 3.3, fixed charges and levies may not
be offset).These scenarios are summarised in Table 5, below.
Table 5. Remuneration Policy Model Scenarios
Scenario Remuneration Scheme
Base Case No remuneration for excess generation, funded through 100% equity
finance
Net Metering Remunerates excess generation at the retail rate of €0.133/kWh
FiT-fixed Remunerates excess generation at a fixed tariff of €0.06635/kWh
FiT-declining Year 1-5: €0.13/kWh
Year 6-10: €0.08/kWh
Year 11-15: €0.03/kWh
Year 15+: none
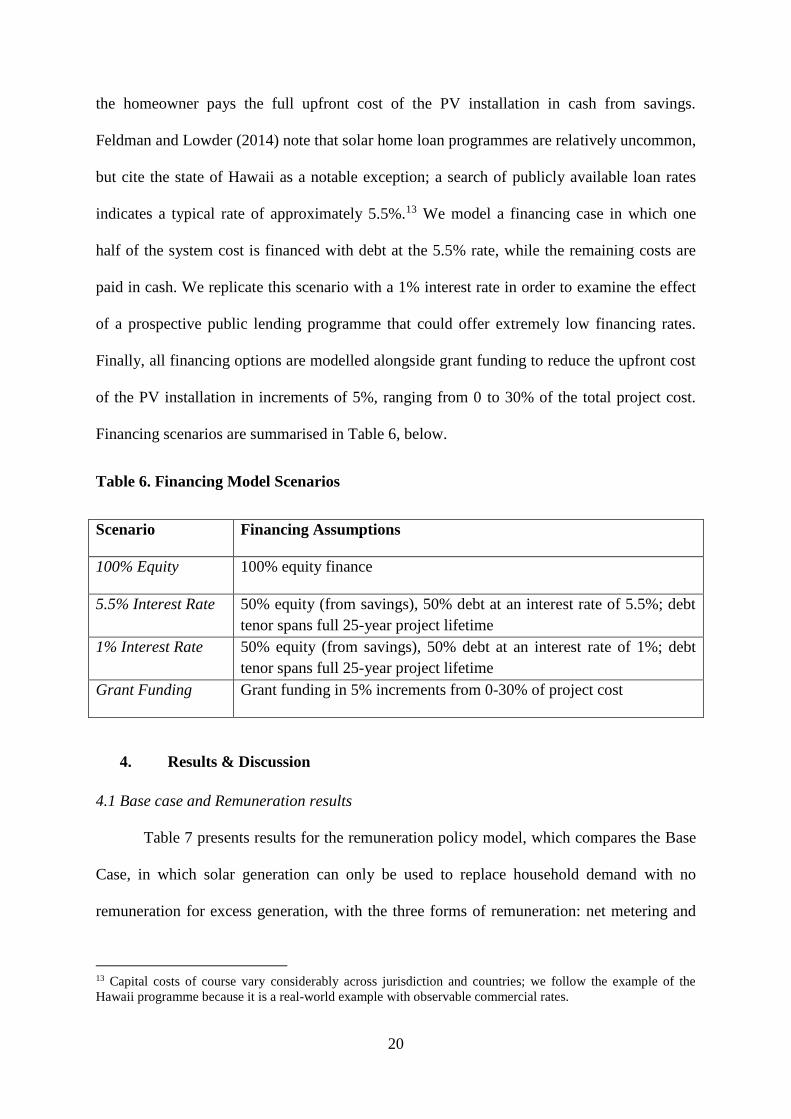
Additional financing scenarios are modelled to explore the impacts of various
financing schemes on financial performance. Under 100% equity financing, we assume that
12 The rate used here applies to large-scale generators under the REFiT scheme. While not necessarily
appropriate for a residential generator, this offers a useful starting point for potential FiT rates.
20
the homeowner pays the full upfront cost of the PV installation in cash from savings.
Feldman and Lowder (2014) note that solar home loan programmes are relatively uncommon,
but cite the state of Hawaii as a notable exception; a search of publicly available loan rates
indicates a typical rate of approximately 5.5%.13 We model a financing case in which one
half of the system cost is financed with debt at the 5.5% rate, while the remaining costs are
paid in cash. We replicate this scenario with a 1% interest rate in order to examine the effect
of a prospective public lending programme that could offer extremely low financing rates.
Finally, all financing options are modelled alongside grant funding to reduce the upfront cost
of the PV installation in increments of 5%, ranging from 0 to 30% of the total project cost.
Financing scenarios are summarised in Table 6, below.
Table 6. Financing Model Scenarios
Scenario Financing Assumptions
100% Equity 100% equity finance
5.5% Interest Rate 50% equity (from savings), 50% debt at an interest rate of 5.5%; debt
tenor spans full 25-year project lifetime
1% Interest Rate 50% equity (from savings), 50% debt at an interest rate of 1%; debt
tenor spans full 25-year project lifetime
Grant Funding Grant funding in 5% increments from 0-30% of project cost
4. Results & Discussion
4.1 Base case and Remuneration results
Table 7 presents results for the remuneration policy model, which compares the Base
Case, in which solar generation can only be used to replace household demand with no
remuneration for excess generation, with the three forms of remuneration: net metering and
13 Capital costs of course vary considerably across jurisdiction and countries; we follow the example of the
Hawaii programme because it is a real-world example with observable commercial rates.
21
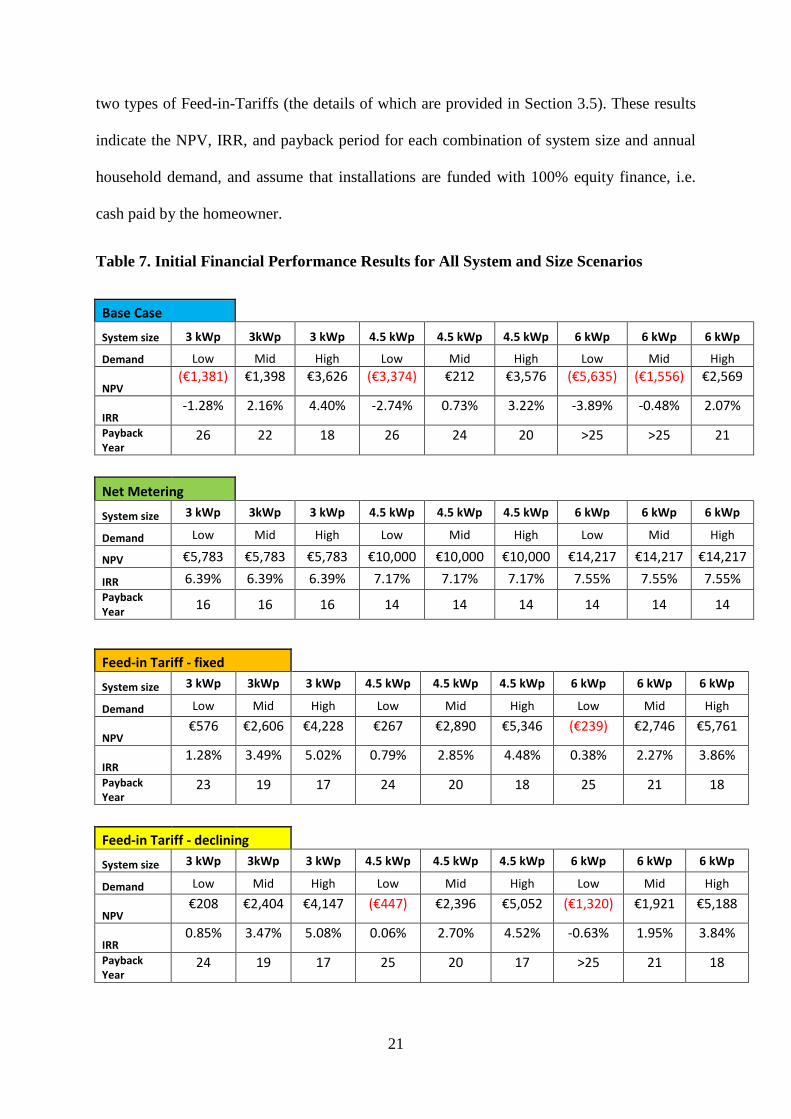
two types of Feed-in-Tariffs (the details of which are provided in Section 3.5). These results
indicate the NPV, IRR, and payback period for each combination of system size and annual
household demand, and assume that installations are funded with 100% equity finance, i.e.
cash paid by the homeowner.
Table 7. Initial Financial Performance Results for All System and Size Scenarios
Base Case System size 3 kWp 3kWp 3 kWp 4.5 kWp 4.5 kWp 4.5 kWp 6 kWp 6 kWp 6 kWp
Demand Low Mid High Low Mid High Low Mid High
NPV (€1,381) €1,398 €3,626 (€3,374) €212 €3,576 (€5,635) (€1,556) €2,569
IRR -1.28% 2.16% 4.40% -2.74% 0.73% 3.22% -3.89% -0.48% 2.07%
Payback Year
26 22 18 26 24 20 >25 >25 21
Net Metering System size 3 kWp 3kWp 3 kWp 4.5 kWp 4.5 kWp 4.5 kWp 6 kWp 6 kWp 6 kWp
Demand Low Mid High Low Mid High Low Mid High
NPV €5,783 €5,783 €5,783 €10,000 €10,000 €10,000 €14,217 €14,217 €14,217
IRR 6.39% 6.39% 6.39% 7.17% 7.17% 7.17% 7.55% 7.55% 7.55% Payback Year
16 16 16 14 14 14 14 14 14
Feed-in Tariff - fixed System size 3 kWp 3kWp 3 kWp 4.5 kWp 4.5 kWp 4.5 kWp 6 kWp 6 kWp 6 kWp
Demand Low Mid High Low Mid High Low Mid High
NPV €576 €2,606 €4,228 €267 €2,890 €5,346 (€239) €2,746 €5,761
IRR 1.28% 3.49% 5.02% 0.79% 2.85% 4.48% 0.38% 2.27% 3.86%
Payback Year
23 19 17 24 20 18 25 21 18
Feed-in Tariff - declining System size 3 kWp 3kWp 3 kWp 4.5 kWp 4.5 kWp 4.5 kWp 6 kWp 6 kWp 6 kWp
Demand Low Mid High Low Mid High Low Mid High
NPV €208 €2,404 €4,147 (€447) €2,396 €5,052 (€1,320) €1,921 €5,188
IRR 0.85% 3.47% 5.08% 0.06% 2.70% 4.52% -0.63% 1.95% 3.84%
Payback Year
24 19 17 25 20 17 >25 21 18

22
We note that most scenarios indicate a positive NPV over 25 years. Cases with
negative NPV occur almost exclusively in cases where low electricity demand diminishes the
value to be gained from self-consumption. In the base case, which reflects the current set of
circumstances for residential PV in Ireland, the best financial performance occurs in the case
of the smallest size of installation, 3kWp, combined with high household demand, with IRR
of 4.4% and NPV of just over €3,600. Payback period is calculated to occur in Year 18. This
is intuitive, as the 3kWp has the lowest capital cost, while with high electricity demand, there
is increased opportunity during the hours with solar generation to replace grid electricity with
electricity from solar generation and generate positive cash flows. By the same logic, in the
base case the worst NPV is the 6kWp system with low electricity demand. The level of
household electricity demand and thus the potential for self-consumption of electricity
generated is a key determinant of the financial performance of all sizes of PV installed for
two reasons: (i) the retail tariff rate is likely to be higher than any remuneration for excess
generation, and (ii) in low irradiance countries there is less excess generation available for
remuneration.
Examining the scenarios in which PV owners are compensated for excess generation,
it is clear that the net metering case offers the best performance of any other scenario studied,
and that NPV and IRR increase with system size. With a net metering rate of €0.133, the
payback period is calculated to occur in Year 16 for the 3 kWp system, whilst the 4.5 and 6
kWp systems pay back in Year 14, the shortest payback period possible under the modelled
scenarios. As expected, we do not observe any difference in financial performance based on
varying demand within the net metering scenarios, for a given PV size, as all kilowatt hours
generated are compensated at the same rate, irrespective of self-consumption. From a
consumer’s perspective, with net metering it makes sense to install a larger size of PV
system, 4.5kWp or 6kWp in the case modelled here, in order to benefit from the high rate of
23
remuneration for excess electricity generated and reduce the payback of the system to 14
years.
There was not a large difference between the fixed feed-in tariff and the declining
feed-in tariff results for all sizes of PV systems. In particular, the IRR was nearly identical
across the medium and high demand scenarios for all sizes, and payback periods tracked
closely for every scenario. This indicates that a fixed tariff, which offers sustained support
throughout the project lifetime, had approximately the same effect on financial performance
as the declining FiT which began relatively higher, but was ramped down to zero after Year
15.
Overall, initial results indicate that while residential PV is a sound investment in
many cases from a classical NPV-perspective, payback periods are well above what
homeowners might require. In terms of policy supports, a net metering scheme that
remunerates the household at the retail rate for excess generation not consumed has the most
significant impact on financial performance. The gap increases further for net metering
schemes with larger PV installations; however, even for 3kWp system with medium
electricity demand the payback is three years shorter for net metering compared with both
FIT designs (this reduces to one year difference with high electricity demand).
4.2 Grant and Debt Scenario Analysis
We present additional analysis to examine the impact of a combination of three
parameters on the payback period:
• Remuneration schemes: base, net export, and FIT design
• Level of grant: in steps of 5% up to 30% of the cost of solar PV installation
• Financing structure: 100% equity, debt finance with 1% and 5.5% interest
rates
24
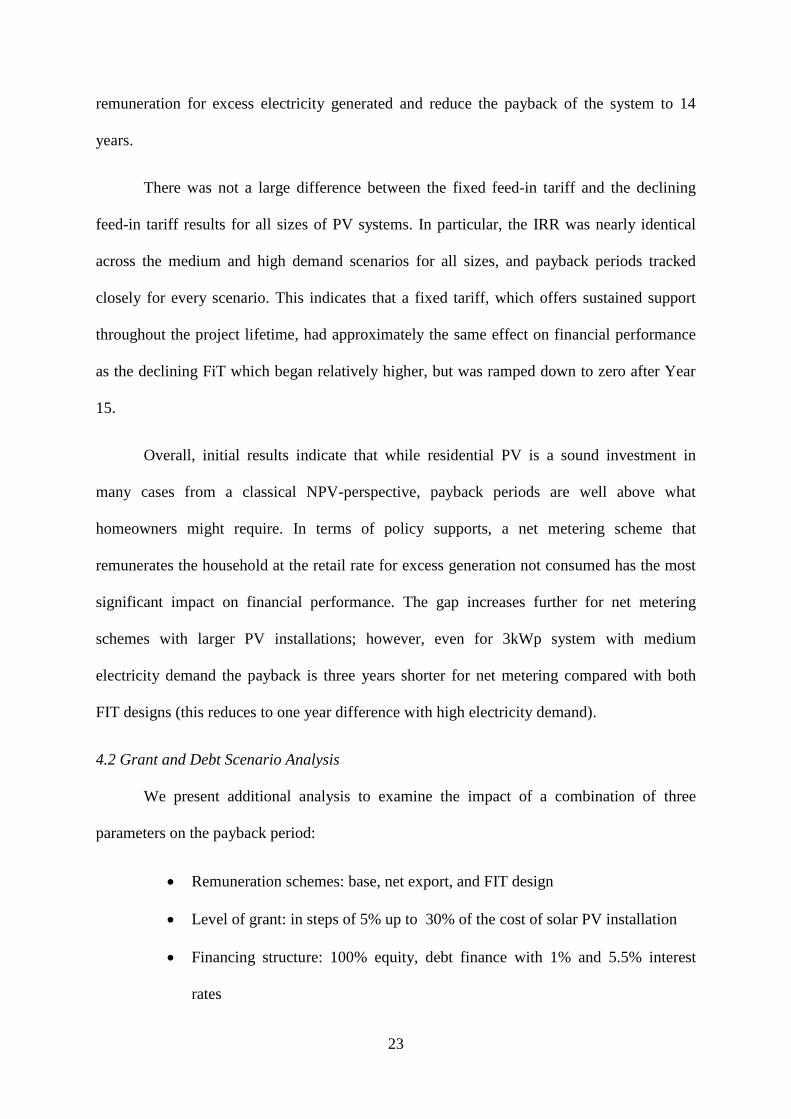
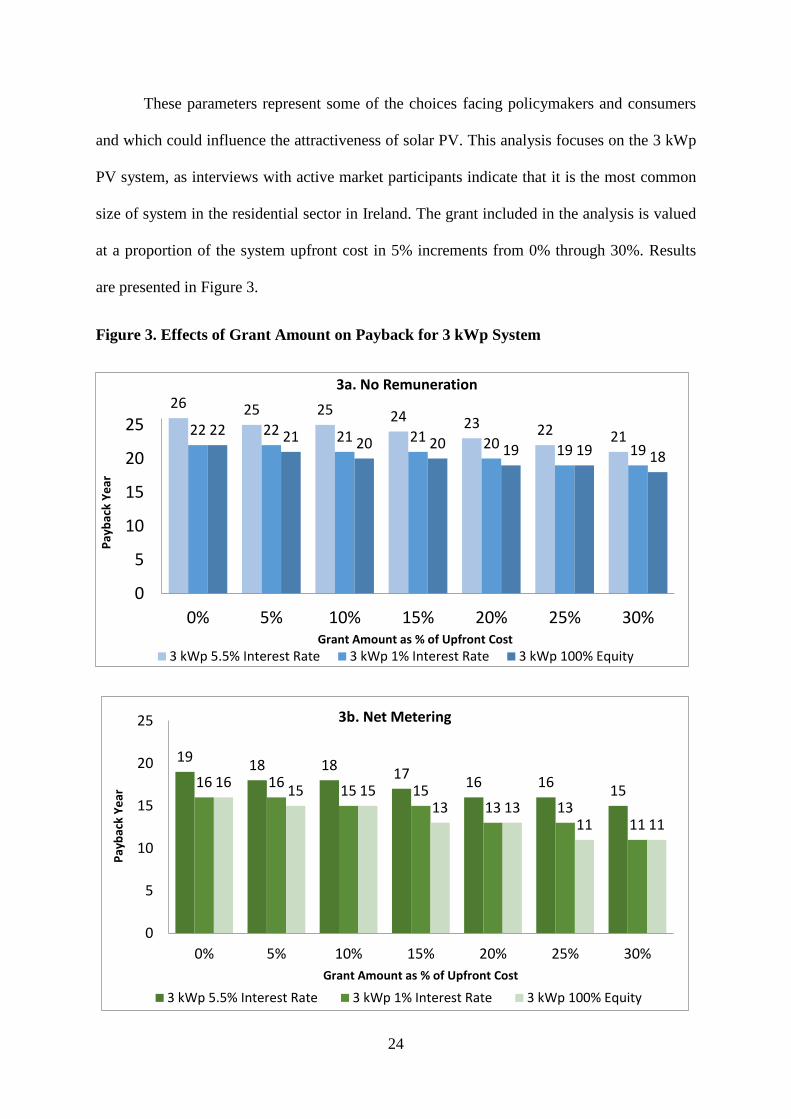
These parameters represent some of the choices facing policymakers and consumers
and which could influence the attractiveness of solar PV. This analysis focuses on the 3 kWp
PV system, as interviews with active market participants indicate that it is the most common
size of system in the residential sector in Ireland. The grant included in the analysis is valued
at a proportion of the system upfront cost in 5% increments from 0% through 30%. Results
are presented in Figure 3.
Figure 3. Effects of Grant Amount on Payback for 3 kWp System
26 25 25 24 23 22 2122 22 21 21 20 19 19
22 21 20 20 19 19 18
0
5
10
15
20
25
0% 5% 10% 15% 20% 25% 30%
Pay
bac
k Y
ear
Grant Amount as % of Upfront Cost
3a. No Remuneration
3 kWp 5.5% Interest Rate 3 kWp 1% Interest Rate 3 kWp 100% Equity
1918 18
1716 16
1516 16
15 1513 13
11
1615 15
13 1311 11
0
5
10
15
20
25
0% 5% 10% 15% 20% 25% 30%
Pay
bac
k Y
ear
Grant Amount as % of Upfront Cost
3b. Net Metering
3 kWp 5.5% Interest Rate 3 kWp 1% Interest Rate 3 kWp 100% Equity
25
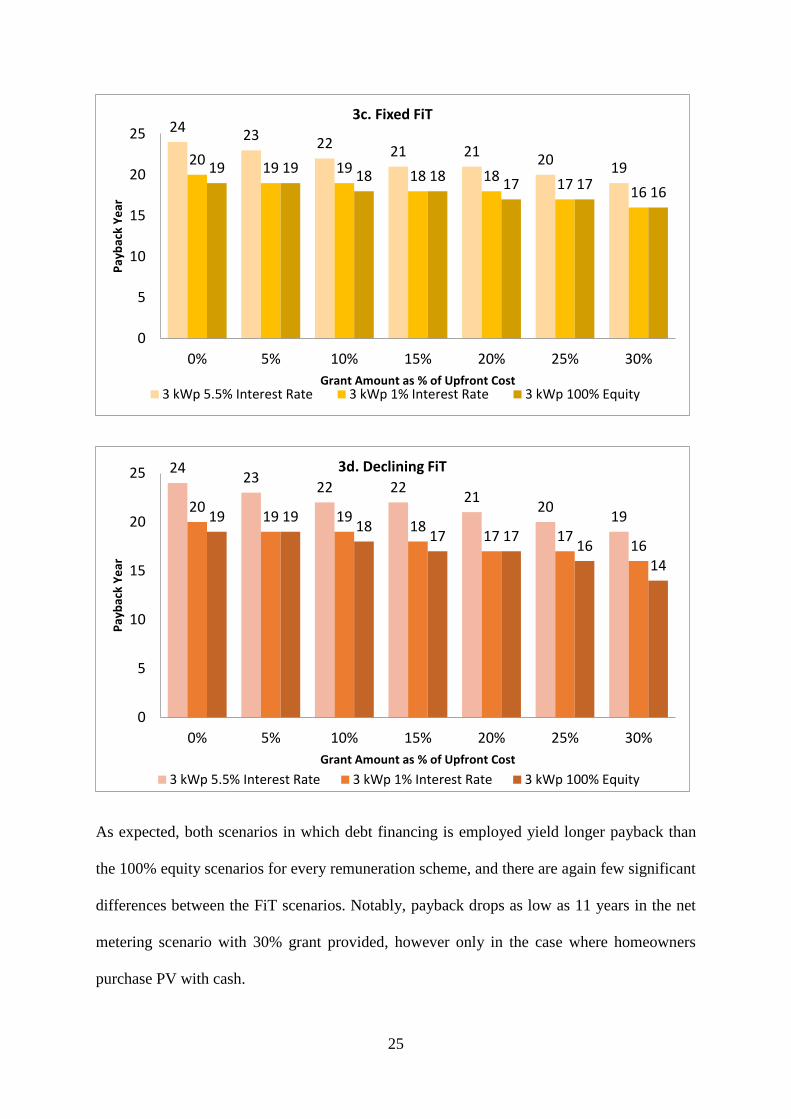
As expected, both scenarios in which debt financing is employed yield longer payback than
the 100% equity scenarios for every remuneration scheme, and there are again few significant
differences between the FiT scenarios. Notably, payback drops as low as 11 years in the net
metering scenario with 30% grant provided, however only in the case where homeowners
purchase PV with cash.
2423
2221 21
2019
2019 19
18 1817
16
19 1918 18
17 1716
0
5
10
15
20
25
0% 5% 10% 15% 20% 25% 30%
Pay
bac
k Y
ear
Grant Amount as % of Upfront Cost
3c. Fixed FiT
3 kWp 5.5% Interest Rate 3 kWp 1% Interest Rate 3 kWp 100% Equity
2423
22 2221
2019
2019 19
1817 17
16
19 1918
17 1716
14
0
5
10
15
20
25
0% 5% 10% 15% 20% 25% 30%
Pay
bac
k Y
ear
Grant Amount as % of Upfront Cost
3d. Declining FiT
3 kWp 5.5% Interest Rate 3 kWp 1% Interest Rate 3 kWp 100% Equity
26
If we compare the results in Figure 3a for a grant with the three remuneration schemes
(Figures 3b – 3d) at 100% equity, the net metering scheme has a greater impact in reducing
payback periods than even a 30% grant, while both FiT schemes have a lower impact. For
example, net metering (Figure 3b) enables a payback period of 16 years for the 100% equity
3 kWp mid-demand system, absent any grant, whilst the results show that a 30% grant
applied to the base case achieves an 18-year payback period (Figure 3a). On the contrary,
both FiT scenarios (Figures 3c and 3d) with 100% equity and no grant achieve a payback of
19 years, equivalent to the payback under a grant worth 20% of capital costs applied to the
100% equity base case scenario.
Of course, not all consumers are in a position to pay for a PV system with 100%
equity. If we examine the results for 1% and 5.5% finance, the rankings in terms of payback
do not change for 1% interest rate for debt finance. When the interest rate is 5.5%, without
policy support the payback period is more than 25 years and therefore the debt renders a
negative NPV to the project within its lifetime. A 30% grant or net metering can reduce the
payback to be equivalent to the baseline 100% equity case. Comparing different policy
supports within the 5.5% interest scenario shows that a grant of 30% (payback = 21 years) is
not as profitable as net metering (payback = 19 years) but better than declining and fixed FiT
(payback = 24 years). A combination of 30% grant and either FiT structure reduces the
payback period to 19 years.
4.3 Sensitivity analyses
4.3.1 Effects of Rate Increase
As noted in Section III, the financial performance of residential PV in the case of a
household purchasing and owning its own PV system is derived from the savings that result
from decreased grid electricity use. That is, savings are a direct result of self-consuming PV
and off-setting the cost of kilowatt hours that would otherwise be purchased from a supplier
27
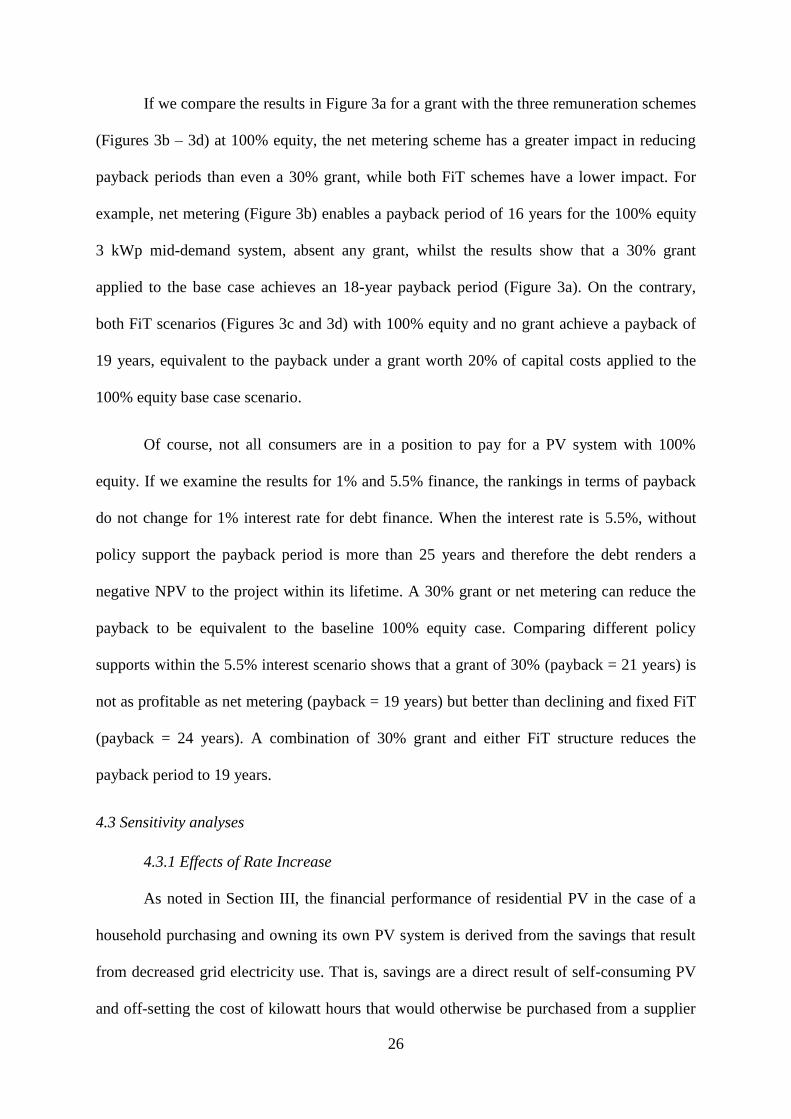
at the retail rate. As such, changes to the retail rate may have significant implications for the
amount of those savings. We conduct sensitivity analyses to determine the effects of different
rates of change in the retail rate, as shown in Figure 4.
Figure 4: Effect of Electricity Tariff Increase on Payback Period for 3kWp system
The results show, predictably, that higher retail tariffs make solar PV installations
more profitable, as the self-consumption savings are worth more. In fact, the payback period
falls by 1-2 years per 1% rate rise in the rate of tariff increase. Conversely, a lower than 4%
increase diminishes performance relative to our base case results. While net-metering clearly
performs better than the other scenarios, achieving a payback as low as 10 years under a 10%
rate increase scenario, the relative benefits are approximately even across each remuneration
case: total payback period improves by 11 years for the base case when the rate of change is
0123456789
1011121314151617181920212223242526
0 1 2 3 4 5 6 7 8 9 10
Pay
bac
k (Y
ear
s)
Rate Increase %
Base Net Metering FiT-fixed FiT-declining

28
increased to 10% from 0%, and improves by 12 years for the three remuneration scheme
scenarios.
4.3.2 Effects of FiT Rate
Figure 5 illustrates the effects of the level of fixed FiT on both the NPV and payback
period for a 3 kWp system under the 100% equity assumption. The descending blue line
shows reductions in payback period for each €0.01 increase in the FiT rate, while the
ascending orange bars indicate NPV.
Figure 5. Effects of FiT Rate on Payback Period and NPV for 3 kWp system
As FiT increases, there is a steady increase in NPV, matched by a slow, graduated
decrease in payback period. Indeed, we note that the increase in FiT affects NPV and
payback period at markedly different rates. For example, tripling the FiT rate from
€0.06/kWh to €0.18/kWh produces a 47% increase in NPV, but only a 4-year improvement,
or 20% decrease, in payback period from 20 to 16 years.
0
5
10
15
20
25
€0
€1,000
€2,000
€3,000
€4,000
€5,000
€6,000
0.060.070.080.09 0.1 0.110.120.130.140.150.160.170.180.19 0.2 0.21
Pay
bac
k Y
ear
NP
V (
EUR
)
FiT Rate (EUR)
NPV Payback Period

29
4.3.3 Tariff Structures
As noted in Section 3.2, Ireland employs a two-part electricity tariff, consisting of a
volumetric rate and a set of fixed bill components that cover network costs and fund support
programmes. Because many academic papers and industry practitioners simplify their
analysis by applying only a so-called “equivalent” 1-part volumetric tariff, we repeat our
modelling using this approach to explore the sensitivity of the selected metrics to changes in
rate structure. The one-part tariff applied here mirrors the two-part tariff as a per-unit
aggregate rate, i.e. the sum of the fixed charges (approximately €200 per year) plus the
volumetric charge (€0.133 per kWh) in the two-part tariff and divided across a typical
household annual load (5,100 kWh) multiplied by VAT that gives €0.21 per kWh. Results are
presented in Figure 6, below.
Figure 6. Payback for 3 kWp System Under One- and Two-Part Rate Structure
22
16
19 1918
11
16 16
0
5
10
15
20
25
Base Case Net Metering Feed-in Tariff - fixed Feed-In Tariff -declining
2-Part Tariff 1-Part Tariff
30
The results indicate that rate structure has a considerable impact on payback period,
accounting for a 3-5 year difference depending on the remuneration scheme assumed. This is
a significant difference: if installers quote savings in terms of an aggregate volumetric tariff
only, prospective consumers would likely receive incorrect predictions for payback. The
difference between the one-part and two-part tariff represents the amount of the fixed charges
that the consumer pays regardless of the amount of PV generation; these charges pay for grid
infrastructure and capacity, and householders are likely to continue to require access to the
grid for the foreseeable future. This contribution to network costs will become more
significant with greater shares of households with solar PV installations in order to avoid a
situation in which residential revenues fail to cover required investments in the physical grid
and generation infrastructure.
5. Conclusion and Policy Implications
This paper presents the results of a detailed model of household electricity demand and
PV generation based on Irish profiling data. The model allows us to model more precisely
than other studies on the same subject the financial gains available to residential customers
who install a rooftop PV system, and explore how those gains are affected by a range of
policy supports and financing options under low-irradiance conditions.
We find that while solar PV is financially viable for Irish households under several
scenarios, there are few circumstances in which payback periods are sufficiently short to be
acceptable to homeowners. That is, even in cases where homeowners would recover their
costs and make a return on their PV investment over its full lifetime, these benefits do not
accrue quickly enough to pay back the customer with medium electricity demand in a period
shorter than 22 years without any policy support, or 11 years under the most favourable
policy scenario modelled. Households with higher electricity demand have the best chance of
a shorter payback period, as they can self-consume a higher share of the solar electricity
31
generated. These results represent a significant departure from previous studies, which
indicated that PV was not financially viable in Ireland by any metric over its assumed
lifetime. This is an indication that falling PV costs are changing the value proposition of solar
PV for consumers in Ireland, and thus similar market dynamics may be present in other low-
irradiance countries. Furthermore, the fact that NPV and IRR are generally above the critical
thresholds required in corporate decision-making (i.e. NPV is positive and IRR exceeds
discount rate), but that payback periods—more salient for households—remain in double-
digit figures, highlights the importance of examining a range of performance metrics.
We model economic policy instruments including financial remuneration and grants to
investigate their impact on the financial performance for residential customers. The three
remuneration policy scenarios modelled (net metering, fixed FiT, and declining FiT) reduce
payback and improve financial performance compared with the base case with no explicit
subsidy. Given the relatively modest FiT rates in both the fixed and declining scenarios, the
result, as expected, is that net-metering provides the best financial returns to prospective
consumers with PV with an improvement of 6 years in the payback period. We find that
increasing FiT rate has a modest impact on payback, despite its relatively meaningful impact
on NPV. This is due to the trade-off between the higher upfront cost from larger PV systems
with future cash flows, and suggests that either further cost reductions of PV systems or
higher support rates at the level of net metering tariffs are required to make PV attractive
using FiT policy schemes. Smaller sized PV systems remain more lucrative than larger sized
PV systems under the FiT schemes modelled here which is due to the low capacity factor of
solar PV in low irradiance zones with low excess generation. This demonstrates that FiT
schemes are less effective in generating positive cashflow than in regions with relatively
higher solar electricity production and therefore smaller sized PV systems are economically
more efficient under these conditions.

32
We also compare the effect of a policy of grants covering a range of shares of the upfront
costs with the remuneration schemes. We find that a grant of 30% is required to deliver the
same benefit to the consumer in terms of payback as net metering and a 20% grant is needed
to provide the same payback period as the FiTs modelled (for a 3kWp system with medium
demand). For a 6kWp system, a 30% grant never reduces the payback to the extent of FiT or
net metering schemes. Therefore from a consumer perspective, in a low irradiance area our
analysis shows that the effectiveness of grants and FiTs can be roughly equivalent in terms of
delivering a reduction in payback periods for 3kWp systems. In regions with higher
irradiance, there is likely to be a divergence in effectiveness between grants and FiTs or net
metering, as customers with higher solar generation will benefit more from larger future cash
flows from remuneration of excess generation. We have not considered the public policy
costs or other non-financial characteristics associated with these schemes that may be
important in a policy context for technology adoption. For example, grants may be more
likely to motivate homeowners to explore PV by offering a clear, easily-understood incentive
compared with remuneration schemes that provide future benefits.
Based on these findings, policymakers wishing to encourage the uptake of residential
solar PV in low irradiance regions should give consideration to grant-based supports as well
as FiT/net metering policies, as they may deliver equivalent benefits compared with
remuneration schemes to consumers in terms of reducing payback period (though, from a
public expenditure perspective, other factors such as cost to governments will also need to be
considered). The primary value to consumers in these regions is self-consumption, as it is
proportionately higher relative to the low amount of excess generation. That is, low excess
generation reduces potential future cash flows from remuneration schemes, and consumers
realise greater value in offsetting electricity bills, and in having their upfront PV costs
defrayed by grant programmes. Conversely, in higher irradiance areas, remuneration schemes

33
for excess generation will be more effective in improving long-term financial performance,
and grants deliver less relative value.
Another key finding is that the rate structure has a strong effect on financial performance.
The one-part tariff structure used mainly in industry solar PV calculations gives estimates of
shorter payback periods than the equivalent two-part tariff. This can be misleading for
consumers in markets with two-part tariff structures therefore this finding may be relevant to
regulators or consumer rights advocates in monitoring how installers market the benefits of
their product offerings. It is also a particularly timely policy concern, given that policymakers
in some mature PV markets are considering revisions to rate structures to ensure an equitable
distribution of network and capacity costs. Additional analysis could add to the existing
literature by examining the interplay between and potential optimisation of rate structures and
network operations in order to determine the optimal share of solar PV and the associated
policy implications. Further analysis would also be useful of the impact of time of use pricing
in low irradiance regions where demand and generation profiles are not well-matched.
Acknowledgements
The authors wish to acknowledge the contribution of Irish solar practitioners who provided
considerable data and market insight in support of this analysis, including Solar Electric
Ireland, BNRG Renewables, Power Capital, Alternative Energy, the Irish Solar Energy
Association, and others.
Funding: This work was conducted in part within the UCD Energy Institute. Lisa Ryan is
funded by Science Foundation Ireland (SFI) under the Energy Systems Integration
Partnership Programme (ESIPP). Sarah La Monaca is funded by the UCD Energy Institute.
34
References
Balta-Ozkan, N., Yildirim, J., Connor, P. M., 2015. Regional distribution of photovoltaic
deployment in the UK and its determinants: A spatial econometric approach. Energy
Economics 51, 417-429.
Bazilian, M., Onyeji, I., Leibreich, M., MacGill, I., Chase, J., Shah, J., Gielen, D., Arent,
D., Landfear, D., Zhengrong, S., 2013. Re-considering the economics of photovoltaic
power. Renewable Energy 53, 329-338.
Borenstein, S., 2012. The Private and Public Economics of Renewable Electricity
Generation. Journal of Economic Perspectives 26 (1), 67-92
Breyer, C., Gerlach, A., 2013. Global overview on grid-parity. Progress in Photovoltaics:
Research and Applications 21, 121–136.
Campoccia, A., Dusonchet, L., Telaretti, E., Zizzo, G., 2014. An analysis of feed in tariffs
for solar PV in six representative countries of the European Union. Solar Energy 107,
530-542.
Central Statistics Office (CSO) (2016). Number of private households and persons in
private households in each Province, County and City. Available at
<http://www.cso.ie/quicktables/GetQuickTables.aspx?FileName=CNA33.asp&TableNam
e=Number+of+private+households+and+persons+in+private+households+in+each+Provi
nce+,+County+and+City&StatisticalProduct=DB_CN> (accessed September 2016)
Colantuono, G., Wang, Y., Hanna, E., Erdelyi, R., 2014. Signature of the North Atlantic
Oscillation on British solar radiation availability and PV potential: The winter zonal
seesaw. Solar Energy 107, 210-219.
Commission for Energy Regulation (CER), 2015. Public Service Obligation Levy
2015/2016 Decision Paper. Available at
<http://www.cer.ie/docs/001034/CER15142%20PSO%20Levy%202015-
16%20%20Decision%20Paper.pdf> (accessed May 2016).
Commission for Energy Regulation (CER), 2016. Electricity and Gas Retail Markets
Annual Report 2015. Available at
<http://www.cer.ie/docs/001082/CER16149%20Retail%20Markets%20Annual%20Repor
t%202015.pdf> (accessed June 2016)
Couture, T., Cory, K., Krycik, C., Williams, E., 2010. A Policymaker’s Guide to Feed-in
Tariff Policy Design. National Renewable Energy Laboratory (NREL) Technical Report
NREL/TP-6A2-44849. Available at <http://www.nrel.gov/docs/fy10osti/44849.pdf>
(accessed November 2016).
Couture, T., Gagnon, Y., 2010. An analysis of feed-in tariff remuneration models:
Implications for renewable energy investment. Energy Policy 38, 955-65
Crago, C., and Chernyakhovskiy, I., 2017. Are policy incentives for solar power
effective? Evidence from residential installations in the Northeast. Journal of
Environmental Economics and Management 81, 132-151.
Darghouth, N. R., Wiser, R., Barbose, G., 2015. Customer economics of residential
photovoltaic systems: Sensitivities to changes in wholesale market design and rate
structures. Renewable and Sustainable Energy Reviews 54, 1459-1469.
35
Darghouth, N.R., Barbose, G., Wiser, R., 2011. The impact of rate design and net
metering on the bill savings from distributed PV for residential customers in California.
Energy Policy 39, 5243-5253.
De Boeck, L., Van Asch, S., De Bruecker, P., Audenaert, A., 2016. Comparison of
support policies for residential photovoltaic systems in the major EU markets through
investment profitability. Renewable Energy 87, 42-53.
Dennehy, E., Howley, M., 2013. Energy in the Residential Sector 2013 Report.
Sustainable Energy Authority Ireland. Available at
<http://www.seai.ie/Publications/Statistics_Publications/Energy-in-the-Residential-
Sector/Energy-in-the-Residential-Sector-2013.pdf > (accessed April 2016)
Department of Communications, Energy & Natural Resources (DCENR) 2015a.
Renewable Electricity Support Scheme Technology Review Consultation. Available at
<http://www.dccae.gov.ie/energy/Lists/Consultations%20Documents/Renewable%20Ene
rgy/Renewable%20Electricity%20Support%20Scheme%20-
%20Technology%20Review%20consultation%20-%20final.pdf> (accessed July 2016).
Department of Communications, Energy & Natural Resources (DCENR) 2015b. A
competition for electricity generation from onshore wind, hydro, biomass landfill gas
technologies 2010-2017. Available at
<http://www.dccae.gov.ie/energy/SiteCollectionDocuments/Renewable-
Energy/Updated%20REFIT%202%20Terms%20and%20Conditions.pdf> (accessed
November 2016).
Department of Communications, Energy & Natural Resources (DCENR), 2013.
Renewable Energy Feed in Tariff: A Competition for Electricity Generation from
Biomass, Hydro, and Wind. Available at
<http://www.dccae.gov.ie/energy/SiteCollectionDocuments/Renewable-
Energy/REFIT1termsandconditionsSept2013.pdf> (accessed November 2016)
Department of Revenue. VAT Rates: Electricity (Energy products and supplies).
Available at <http://www.revenue.ie/en/tax/vat/rates/decision-detail-02757.jsp> (accessed
June 2016).
Dusonchet, L., Telaretti, E., 2015. Comparative economic analysis of support policies or
solar PV in the most representative EU countries. Renewable and Sustainable Energy
Reviews 42, 986-988.
European Union (EU) Commission, 2014. Communication from the Commission to the
European Parliament, the Council, the European Economic and Social Committee and the
Committee of the Regions: Energy Prices and Costs in Europe. Available at
<http://ec.europa.eu/energy/sites/ener/files/documents/20140122_communication_energy
_prices_1.pdf.> (accessed August 2016).
Faiers, A., Neame, C., 2006. Consumer attitudes towards domestic solar power systems.
Energy Policy 34, 1797-1806.
Feldman, D., Lowder, T., 2014. Banking on Solar: An Analysis of Banking Opportunities
in the U.S. Distributed Photovoltaic Market. National Renewable Energy Laboratory
(NREL). Available at <http://www.nrel.gov/docs/fy15osti/62605.pdf> (Accessed
November 2016).
36
Hirth, L., Ueckerdt, F., Edenhofer, O., 2016. Why wind is not coal: On the economics of
electricity generation. The Energy Journal 37(3),1-28.
Howland, M., Holland, M., 2016. Electricity & Gas Prices in Ireland 2nd Semester (July
– December) 2015. Sustainable Energy Authority Ireland. Available at
<http://www.seai.ie/Publications/Statistics_Publications/Electricity_and_Gas_Prices/Pric
e-Directive-2nd-Semester-2015.pdf> (accessed April 2016)
Huijben, J.C.C.M., Verbon, G.P.J., 2013. Breakthrough without subsidies? PV Business
model experiments in the Netherlands. Energy Policy 56, 362-370.
International Renewable Energy Agency (IRENA), 2015. Rethinking Energy 2015.
Available at
<http://www.irena.org/rethinking/IRENA%20_REthinking_Energy_2nd_report_2015.pdf
> (accessed November 2016).
Irish Solar Energy Association, 2015. Response to the Renewable Electricity Support
Scheme Technology Review, DCENR. Available at <http://irishsolarenergy.org/wp-
content/uploads/2015/09/ISEA-Submission-DCENR-18.09.2015.compressed.pdf>
(accessed July 2016).
Joint Research Council (JRC), 2017. PVGIS Photovoltaic Solar Electricity Potential in
European Countries. Available at
<http://re.jrc.ec.europa.eu/pvgis/cmaps/eu_cmsaf_opt/PVGIS-EuropeSolarPotential.pdf>
(accessed March 2017).
Joskow, P.J., 2011. Comparing the Costs of Intermittent and Dispatchable Electricity
Generating Technologies, American Economic Review: Papers & Proceedings 101(3),
238-241.
Kirsch, L., Morey, M., 2015. Pricing Retail Electricity in a Distributed Energy Resources
World. The Electricity Journal 28 (3), 112-121.
Lacchini, C., Ruther, R., 2015. The influence of government strategies on the financial
return of capital invested in PV systems located in different climatic zones in Brazil.
Renewable Energy 83, 786-798.
Langniss, O.; Diekmann, J.; Lehr, U., 2009. Advanced Mechanisms for the Promotion of
Renewable Energy: Models for the Future Evolution of the German Renewable Energy
Act. Energy Policy 37(4), 1289-1297.
Lee, M., Hong, T., Koo, C., 2016. An economic impact analysis of state solar incentives
for improving financial performance of residential solar photovoltaic systems in the
United States. Renewable and Sustainable Energy Reviews 58, 590-607.
Lesser, J., Su, X. 2008. Design of an economically efficient feed-in tariff structure for
renewable energy development. Energy Policy 36(3), 981-990.
Leloux, J., Narvarte, L., Trebosc, D., 2012. Review of the performance of residential PV
systems in Belgium. Renewable and Sustainable Energy Reviews 16, 423-435.
Li, Z., Boyle, F., Reynolds, A., 2011. Domestic application of solar PV systems in
Ireland: the reality of their economic viability. Energy 36, 5865–5876
Martins, F., 2017. PV sector in the European Union countries – Clusters and efficiency.
Renewable and Sustainable Energy Reviews 74, 173-177.
37
National Renewable Energy Laboratory (NREL) 2015. System Advisor Model Manual.
Available at <https://sam.nrel.gov/> (accessed July 2016).
Ondraczek, J., Komendantova, N., Patt, A., 2015. WACC the dog: The effect of financing
costs on the levelized cost of solar PV power. Renewable Energy 75, 888-898.
Rai, V., McAndrews, K., 2012. Decision-making and behavior change in residential
adopters of solar PV. In: Proceedings of the World Renewable Energy Forum, May 13–
17, 2012.
REN21, 2015. Renewables 21 Global Status Report 2015. UNEP. Available at
<www.ren21.net/wp.../2015/07/REN12-GSR2015_Onlinebook_low1.pdf> (accessed
June 2016).
Ryan, L., Dillon, J., La Monaca, S., Byrne, J., O’Malley, M., 2016. Assessing the system
and investor value of utility-scale solar PV. Renewable and Sustainable Energy Reviews
64, 506-517.
Sarasa-Maestro, C., Dufo-López, R.., Bernal-Agustín, J. L., 2013. Photovoltaic
remuneration policies in the European Union. Energy Policy 55, 317-328.
Sarasa-Maestro, C., Dufo-López, R.., Bernal-Agustín, J. L., 2016. Analysis of
Photovoltaic Self-Consumption Systems. Energies 9 (9), 681.
Scarpa, R., Willis, K., 2010. Willingness-to-pay for renewable energy: Primary and
discretionary choice of British households' for micro-generation technologies. Energy
Economics 32, 129-136.
Sioshansi, R., 2016. Retail electricity tariff and mechanism design to incentivize
distributed renewable generation. Energy Policy 95, 498-508.
Sustainable Energy Authority of Ireland (SEAI), 2013. Renewable Energy in Ireland,
2013 Update. Available at
<https://www.seai.ie/Publications/Statistics_Publications/Renewable_Energy_in_Ireland/
Renewable-Energy-in-Ireland-2013-Update.pdf> (accessed August 2016)
SEAI (2016). Energy in Ireland 1990 – 2015: 2016 Report. Available at:
http://www.seai.ie/Publications/Statistics_Publications/Energy_in_Ireland/Energy-in-
Ireland-1990-2015.pdf
Tao, J.Y., Finenko, A., 2016. Moving beyond LCOE: impact of various financing
methods on PV profitability for SIDS. Energy Policy 98, 749-758.