solar power plant performance evaluation: simulation and
TRANSCRIPT

Journal of Physics Conference Series
OPEN ACCESS
Solar power plant performance evaluationsimulation and experimental validationTo cite this article E M Natsheh and A Albarbar 2012 J Phys Conf Ser 364 012122
View the article online for updates and enhancements
You may also likeThe influence of weather regimes onEuropean renewable energy productionand demandKarin van der Wiel Hannah C BloomfieldRobert W Lee et al
-
Early transformation of the Chinese powersector to avoid additional coal lock-inHuan Wang Wenying Chen ChristophBertram et al
-
Observation-based solar and wind powercapacity factors and power densitiesLee M Miller and David W Keith
-
Recent citationsPerformance Evaluation of Solar PVPower Plants in Taiwan Using DataEnvelopment AnalysisJune Raymond Leonen Mariano et al
-
Automated formal verification of stand-alone solar photovoltaic systemsAlessandro Trindade and Lucas Cordeiro
-
Performance Assessment andImprovement of Central Receivers Usedfor Solar Thermal PlantsAlbarbar and Arar
-
This content was downloaded from IP address 5823621355 on 09112021 at 2249
Solar power plant performance evaluation simulation and
experimental validation
E M Natsheh and A Albarbar
Manchester Metropolitan University School of Engineering Manchester UK
E-mail emadnatgmailcom aalbarbarmmuacuk
Abstract In this work the performance of solar power plant is evaluated based on a developed
model comprise photovoltaic array battery storage controller and converters The model is
implemented using MATLABSIMULINK software package Perturb and observe (PampO)
algorithm is used for maximizing the generated power based on maximum power point tracker
(MPPT) implementation The outcome of the developed model are validated and supported by
a case study carried out using operational 288kW grid-connected solar power plant located in
central Manchester Measurements were taken over 21 monthrsquos period using hourly average
irradiance and cell temperature It was found that system degradation could be clearly
monitored by determining the residual (the difference) between the output power predicted by
the model and the actual measured power parameters It was found that the residual exceeded
the healthy threshold 17kW due to heavy snow in Manchester last winter More important
the developed performance evaluation technique could be adopted to detect any other reasons
that may degrade the performance of the PV panels such as shading and dirt Repeatability and
reliability of the developed system performance were validated during this period Good
agreement was achieved between the theoretical simulation and the real time measurement
taken the online grid connected solar power plant
1 Introduction
The global environmental financial and political issues necessitate the use of renewable resources to
meet the fast growth in energy demand Among renewable resources PV systems have received
considerable attentions and it is expected that the penetration of PV energy generation will increase
steadily to become a significant proportion of total energy generation [1] However the power
generated by photovoltaic system suffers from some deficiencies when used as stand-alone energy
sources Natural variations in solar radiation and temperature causes power fluctuations in PV system
To alleviate this problem and to meet sustained load demands during varying natural conditions
energy storage system need to be integrated with the PV system This paper focuses on the
combination of PV panels MPPT controller to operate the PV panel at its maximum power point and
battery storage device As the PV panel output power varies with the solar radiation a battery storage
device can be integrated with the photovoltaic system to ensure that the system performs under all
conditions
In power applications and system design modelling and simulation is essential to optimize control
and enhance system performance Over recent years much research has been carried out on
photovoltaic and battery storage Among them Kim et al [2] developed a grid-connected
photovoltaic model using PSCADEMTDC for electromagnetic transient analysis El-Shatter et al [3]
employed fuzzy logic control to find the maximum power point tracking for both PV and wind
25th International Congress on Condition Monitoring and Diagnostic Engineering IOP PublishingJournal of Physics Conference Series 364 (2012) 012122 doi1010881742-65963641012122
Published under licence by IOP Publishing Ltd 1
energies Tremblay et al [4] developed a generic battery model for the dynamic simulation of hybrid
electric vehicles they used only the battery state-of-charge (SOC) as a state variable in order to avoid
the algebraic loop problem Arribas et al [5] proposed a PVWT hybrid system performance
assessment procedure based on the existing one for PV systems (IEC-61724) Pietruszko et al [6]
summarized one year of monitoring of a roof-mounted 1kW grid-connected PV system in Poland
Omer et al [7] presented monitoring results of two examples of building integrated PV (BIPV)
systems in the UK Tsai [8] implemented an insolation-oriented PV model using
MATLABSIMULINK software package Gow et al [9] developed a general PV model which can be
implemented on simulation platforms such as PSPICE or SABER Chayawatto et al [10] developed a
mathematical model of a dcac full-bridge switching converter with current control for PV grid-
connected system under islanding phenomena this phenomena occur when the grid system is
disconnected for any reason and the distributed generation still supplies to any section of local loads
Although the SimPowerSystem tool in MATLABSIMULINK package conveniently offers a wind
farm model it does not offer a solar power plant model for stand-alone or grid-connected applications
Thus it is difficult to analyze and simulate in the generic modelling of PV power system Adding to
that as PV systems age it would be expected that their overall efficiency would decrease and
currently there is few monitoring system available to diagnose faults as they occur Consequently
these gaps gave the researchers the motivation to evaluate the performance of solar power plant based
on a developed model comprises photovoltaic array battery storage controller and converters The
flowchart of the developed monitoring technique is shown in figure 1
Figure 1 Flowchart of the proposed monitoring system
25th International Congress on Condition Monitoring and Diagnostic Engineering IOP PublishingJournal of Physics Conference Series 364 (2012) 012122 doi1010881742-65963641012122
2
As shown in figure 1 the proposed monitoring system enables early system degradation to be
identified via the calculation of the residual difference in power generation between the model
predicted and the actual PV power plant The outcome of the developed system is then validated and
supported by a case study in Section 32 through monitoring a 288kW solar power plant located in
central Manchester
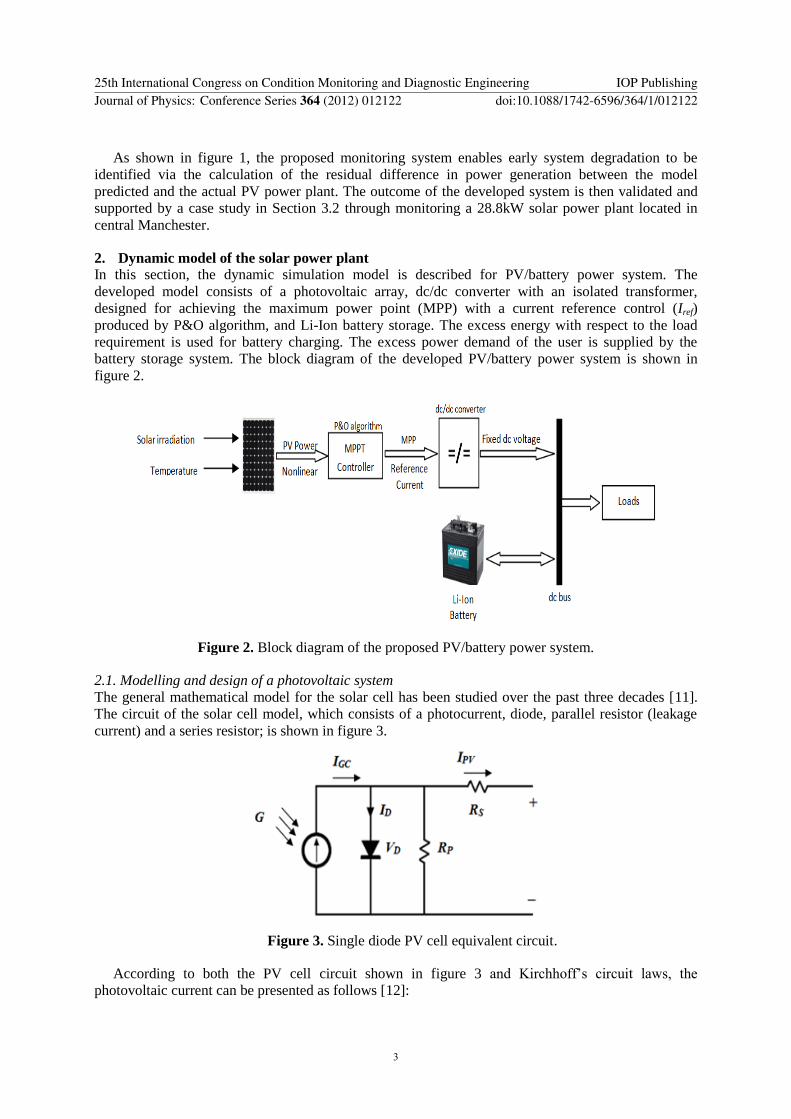
2 Dynamic model of the solar power plant
In this section the dynamic simulation model is described for PVbattery power system The
developed model consists of a photovoltaic array dcdc converter with an isolated transformer
designed for achieving the maximum power point (MPP) with a current reference control (Iref)
produced by PampO algorithm and Li-Ion battery storage The excess energy with respect to the load
requirement is used for battery charging The excess power demand of the user is supplied by the
battery storage system The block diagram of the developed PVbattery power system is shown in
figure 2
Figure 2 Block diagram of the proposed PVbattery power system
21 Modelling and design of a photovoltaic system
The general mathematical model for the solar cell has been studied over the past three decades [11]
The circuit of the solar cell model which consists of a photocurrent diode parallel resistor (leakage
current) and a series resistor is shown in figure 3
Figure 3 Single diode PV cell equivalent circuit
According to both the PV cell circuit shown in figure 3 and Kirchhoffrsquos circuit laws the
photovoltaic current can be presented as follows [12]
25th International Congress on Condition Monitoring and Diagnostic Engineering IOP PublishingJournal of Physics Conference Series 364 (2012) 012122 doi1010881742-65963641012122
3
p
dKFT
ev
ogcpvR
vIII c
d
1exp (1)
Where Igc is the light generated current Io is the dark saturation current dependant on the cell
temperature e is the electric charge = 16 x 10-19
Coulombs K is Boltzmannrsquos constant = 138 x 10-23
JK F is the cell idealising factor Tc is the cellrsquos absolute temperature vd is the diode voltage and Rp
is the parallel resistance The photocurrent (Igc) mainly depends on the solar irradiation and cell
temperature which is described as [12]
GITTI scrcscgc (2)
Where μsc is the temperature coefficient of the cellrsquos short circuit current Tr is the cellrsquos reference
temperature Isc is the cellrsquos short circuit current at a 25oC and 1kWm
2 and G is the solar radiation in
kWm2 Furthermore the cellrsquos saturation current (Io) varies with the cell temperature which is
described as [12]
cr
g
TTKF
ev
r
coo
T
TII
113
exp (3)
c
oc
KFT
ev
sc
o
II
exp
(4)
Where Ioα is the cellrsquos reverse saturation current at a solar radiation and reference temperature Vg is
the band-gap energy of the semiconductor used in the cell and Voc is the cellrsquos open circuit voltage In
this study a general PV model is built and implemented using MATLABSIMULINK to verify the
nonlinear output characteristics for the PV module The proposed model is implemented as shown in
figure 4 In this model whereas the inputs are the solar irradiation and cell temperature the outputs are
the photovoltaic voltage and current The PV models parameters are usually extracted from the
manufactures data sheet
Figure 4 Subsystem implementation of the PV model
An experiment was conducted in order to validate the proposed PV model The experimental rig
consists of one Astronergy CHSM6610P-225 PV module adjustable load resistance and some
measurement instrumentation The PV module was placed at an inclination angle of 10o and azimuth
25th International Congress on Condition Monitoring and Diagnostic Engineering IOP PublishingJournal of Physics Conference Series 364 (2012) 012122 doi1010881742-65963641012122
4
angle of 30o Two digital multi-meters were respectively arranged in series to measure output current
and in parallel to measure working voltage The output power is then the product of measured current
and voltage Observation of solar irradiance and temperature were taken and recorded each time the
load was changed Current and voltage of the PV module where recorded after a delay of 1 minute
after the resistance was changed It was found that both simulated and measured results for the output
characteristics of PV module are good agreement as shown in figures 5(a) and 5(b) This proves the
correctness of the proposed model
(a) P-V output characteristics
(b) I-V output characteristics
Figure 5 Results comparison for the simulation and experimental approaches (850Wm2 45
oC)
22 Modelling and design of Li-Ion battery storage
In the literature several studies have been reported regarding to Li-Ion battery [13] In this paper the
Li-Ion battery is modelled using a simple controlled voltage source in series with a constant resistance
as shown in figure 6
Figure 6 Battery model equivalent circuit
The open voltage source is calculated with a non-linear equation based on the actual SOC of the
battery
The controlled voltage source can be presented as follow [4]
25th International Congress on Condition Monitoring and Diagnostic Engineering IOP PublishingJournal of Physics Conference Series 364 (2012) 012122 doi1010881742-65963641012122
5
During discharge
itBAiitQ
QKit
itQ
QKEE obatt
exp (5)
During charge
itBAiQit
QKit
itQ
QKEE obatt
exp
10
(6)
Thus the open voltage source is
RiEV battbatt (7)
Where Ebatt is the no-load voltage Eo is the battery constant voltage K is the polarisation voltage
Q is the battery capacity it is the actual battery charge i is the low frequency current dynamics A is
the exponential zone amplitude B is the exponential zone time constant inverse (Ah) minus1
Vbatt is the
battery voltage R is the internal resistance and i is the battery current Model parameters can simply
be deduced from a manufacturerrsquos discharge curve as shown in figure 7
Figure 7 Nominal current discharge characteristic
The three necessary points used to extract the model parameters are the fully charged voltage the
end of the nominal zone (voltage and charge) and the end of the exponential zone (voltage and
charge) The exponential part (A exp (minusBit)) is calculated with the fully charge voltage (Efull) and the
end of the exponential zone (Eexp Qexp) as follows [4]
expEEA full (8)
exp
3
QB (9)
The polarisation voltage (K) can be deduced from the fully charged voltage and the end of nominal
zone (Enom Qnom) [4]
nom
nomnomnomfull
Q
QQQBAEEK
1exp (10)
25th International Congress on Condition Monitoring and Diagnostic Engineering IOP PublishingJournal of Physics Conference Series 364 (2012) 012122 doi1010881742-65963641012122
6
Then the voltage constant (E0) can be presented as follows [4]
AiRKEE fullo (11)
The modified model of the Li-Ion battery is implemented in MATLABSIMULINK using several
standard SIMULINK blocks as well as some of the SimPowerSystems blocks [4] In this model the
output is a vector containing three signals SOC battery current and voltage The proposed model is
implemented as shown in figure 8
Figure 8 Subsystem implementation of the Li-Ion battery model
23 Power control system
The output characteristics of the PV model with different solar irradiance and cell temperature are
nonlinear Furthermore the solar irradiation is unpredictable which makes the maximum power point
of the PV module changes continuously Therefore a MPPT technique is needed to operate the PV
module at its maximum power point Perturb and observe algorithm is the MPPT control algorithm
that will be adapted in this model The PampO algorithm operates by periodically incrementing or
decrementing the PV array operating current and comparing the PV output power with the previous
one If itrsquos positive the control system moves the PV array operating point in the same direction
otherwise itrsquos moved in the opposite direction
A MPPT controller model is built and implemented using MATLAB to operate the PV module at
its maximum power point The PampO algorithm requires two measurements measurement of the
current (Ipv) and measurement of the voltage (Vpv) The proposed model is implemented as shown in
figure 9(a)
Figure 9(a) Subsystem implementation of the MPPT controller model
In addition a dc averaged switch model converter with input current control (Iref) is built and
implemented using MATLABSIMULINK to reduce the switching harmonics and to step up the
25th International Congress on Condition Monitoring and Diagnostic Engineering IOP PublishingJournal of Physics Conference Series 364 (2012) 012122 doi1010881742-65963641012122
7
photovoltaic voltage to a higher dc voltage The proposed model is implemented as shown in
figure 9(b)
Figure 9(b) Subsystem implementation of the dcdc converter model
3 Simulation results and performance analysis
31 PVLi-Ion battery power system model
In this Section the proposed model was simulated using MATLAB for stand-alone application The
system consists of 36kW of PV panels (200V 65Ah) Li-Ion battery bank controller and converters
The block diagram of the integrated PVLi-Ion battery system and the power controllers are shown in
figure 2
The major inputs for the proposed PV model were solar irradiation PV panel temperature and PV
manufacturing data sheet informationrsquos In this work Sharprsquos (NU-180) PV panel is taken as example
The Sharprsquos (NU-180) key specification is listed in table 1
Table 1 Sharprsquos (NU-180) specifications (1kWm2 25
o C)
Parameter Variable Value
Maximum power Pm 180 (W)
Open circuit voltage Voc 30 (V)
Voltage at Pm Vamp 237 (V)
Short circuit current Isc 837 (A)
Current at Pm Iamp 76 (A)
Temp coefficient for Voc β -104 mV degC
Temp coefficient for Isc α + 0053 degC
No of cells and connections Ns 48 in series
During the simulation process the aim was to observe the proposed model behaviour under
different operating condition The solar radiation and user load profiles are used to test the
performance of the proposed system model as shown in figures 10(a) and 10(b)
25th International Congress on Condition Monitoring and Diagnostic Engineering IOP PublishingJournal of Physics Conference Series 364 (2012) 012122 doi1010881742-65963641012122
8
Figure 10 (a) Solar radiation profile (b) Load profile
Although the photovoltaic power fluctuates due to solar radiation variations as shown in figure 11
the proposed control system of the solar power plant successfully operates the PV model at the MPP
by periodically incrementing or decrementing the PV array operating current (Ipv = Iref) On the other
hand the dc-dc converter successfully steps up the voltage with an efficiency of 93 as shown in
figure 12
Figure 11 Total power of the solar plant
Figure 12 Efficiency of the dc-dc converter
According to the power profile depicted in figure 10(b) peak load demands would be observed
between 10 to 20min and from 30 to 50min However during these time intervals the PV power is
lower than the demand To overcome this deficiency and to meet the load demand battery bank was
added to the PV system Hence the peak load demand is satisfied by battery bank as shown in
figure 13 The power met by the battery introduces a current change at the battery bank terminal as
depicted in figure 14 When the battery current is positive (time intervals 10ndash20min and 30ndash50min)
25th International Congress on Condition Monitoring and Diagnostic Engineering IOP PublishingJournal of Physics Conference Series 364 (2012) 012122 doi1010881742-65963641012122
9
energy is transferred to the load by the battery bank When the battery current is negative the battery
bank is recharged Figure 15 shows the SOC of the battery during the simulation The power
delivered to the load side by the PVLi-Ion battery system is illustrated in figure 16
Figure 13 Power satisfied by battery bank
Figure 14 Battery current change with
respect to power demand
Figure 15 Battery State-Of-Charge (SOC)
Figure 16 Power delivered to load side by
the PVbattery system
32 Case study performance of PV power stations in Manchester
In 2009 Manchester Metropolitan University (MMU) installed three PV power stations on its campus
in Manchester with a combined maximum power of 558kW (enough power to light 7200 100-watt
light bulbs power 960 student laptops boil 40 kettles or supply electricity to 10 houses) Figure 17(a)
shows the 288kW PV power plant designated as (All Saints building) PV array 1 Figure 17(b) shows
the (All Saints building) PV array 2 Both power stations use the Sharp NU-180 (E1) PV panels and
they were placed at an inclination angle of 10o and azimuth angle of 30
o
As shown in figure 17 the solar power plant is divided into two building Building 1 has its PV
system located on the sixth floor with a total of 160 PV panels Building 2 has its array spread over
two floors (floor 6 and floor 4) There are 150 panels in total 78 PV panels on floor 6 and 72 on
floor 4 The total power delivered to the national grid by the PV systems since their commissioning
back in 2009 is shown in figure 18
25th International Congress on Condition Monitoring and Diagnostic Engineering IOP PublishingJournal of Physics Conference Series 364 (2012) 012122 doi1010881742-65963641012122
10
Figure 17(a) All Saints
building PV array 1
Figure 17(b) All Saints building PV array 2
Furthermore the proposed PV model was simulated using MATLAB to monitor the 288kW grid
connected PV power station by calculating the residual difference between the model predicted and
the actual measured power parameters Measurements were taken over 21 monthrsquos period using
hourly average irradiance and cell temperature
It was found from figure 19(a) that the system has a good performance since the residual
difference between the model prediction and the actual power is less than 17kW The difference
caused due to the clouds dust wire and aging Also it can be observed from figure 19(b) that system
degradation will be indicated when the residual difference is above 19kW due to snow cover
shading or any other reasons that may reduce the efficiency of the PV panels
Figure 18 PV systems total yield (Sep 2009 ndash May 2011)
25th International Congress on Condition Monitoring and Diagnostic Engineering IOP PublishingJournal of Physics Conference Series 364 (2012) 012122 doi1010881742-65963641012122
11
Figure 19(a) System performance during 10 day of Jun 2010
Figure 19(b) System performance during 10 day of Dec 2010
4 Conclusions
In this paper solar power plant performance was evaluated based on a developed model for stand-
alone and grid-connected applications The developed model comprises photovoltaic array Li-Ion
battery and an appropriate power flow controller The model has been implemented using the
MATLABSIMULINK software package and designed with a dialog box like those used in the
SIMULINK block libraries Excellent performance was obtained from the simulation model under
variable solar radiation and load power requirements
The outcome of the developed model were validated and supported by a case study carried out
using operational 288kW grid-connected solar power plant located in central Manchester The study
was carried out through monitoring that system by calculating the residual difference between the
model predicted and the actual measured power parameters Measurements were taken over 21
monthrsquos period using hourly average irradiance and cell temperature Good agreement was achieved
between the theoretical simulation and the real time measurement taken the online grid connected
solar power plant With this model it is possible to identify PV generation problems quickly and
improve system efficiency and performance
Acknowledgement
The authors would like to thank the Manchester Metropolitan University School of Engineering An-
Najah National University Department of Computer Engineering for their kind contribution in
providing financial support for this study
25th International Congress on Condition Monitoring and Diagnostic Engineering IOP PublishingJournal of Physics Conference Series 364 (2012) 012122 doi1010881742-65963641012122
12
References
[1] Photovoltaic Industry Association (EPIA) httpwwwepiaorgpress-roomepia-press-
releaseshtml (Accessed Jun 2011)
[2] Kim S K Jeona J H Choa C H Kima E S and Ahna J B 2009 Modelling and simulation of a
grid-connected PV generation system for electromagnetic transient analysis Solar Energy 83
664
[3] El-Shatter T F Eskander M N and El-Hagry M T 2006 Energy flow and management of a
hybrid windPVfuel cell generation system Energy Conversion and Management 47 1264
[4] Tremblay O Dessaint L A and Dekkiche A I 2007 A Generic Battery Model for the Dynamic
Simulation of Hybrid Electric Vehicles IEEE Vehicle Power and Propulsion Conference
(Arlington TX) p 284
[5] Arribas L Cano L Cruz I Mata M and Llobet E 2010 PVndashwind hybrid system performance A
new approach and a case study Renewable Energy 35 128
[6] Pietruszko S M and Gradzki M 2003 Performance of a grid connected small PV system in
Poland Applied Energy 74 177
[7] Omer S A Wilson R and Riffat S B 2003 Monitoring results of two examples of building
integrated PV (BIPV) systems in the UK Renewable Energy 28 1387
[8] Tsai H L 2010 Insolation-oriented model of photovoltaic module using MatlabSimulink Solar
Energy 84 1318
[9] Gow J A and Manning C D 1999 Development of a photovoltaic array model for use in power-
electronics simulation studies IEE Proceedings- Electric Power Applications 146 193
[10] Chayawatto N Kirtikara K Monyakul V Jivacate C and Chenvidhya D 2009 DCndashAC
switching converter modellings of a PV gridconnected system under islanding phenomena
Renewable Energy 34 2536
[11] Phang J C H Chan D S H and Philips J R 1984 Accurate analytical method for the extraction of
solar cell model parameter IEEE Electronics Letters 20 406
[12] Villalva M G Gazoli J R and Filho E R 2009 Comprehensive approach to modelling and
simulation of photovoltaic arrays IEEE Transactions on Power Electronics 24 1198
[13] Zhang J and Lee J 2011 A review on prognostics and health monitoring of Li-ion battery
Journal of Power Sources 196 6007
25th International Congress on Condition Monitoring and Diagnostic Engineering IOP PublishingJournal of Physics Conference Series 364 (2012) 012122 doi1010881742-65963641012122
13

Solar power plant performance evaluation simulation and
experimental validation
E M Natsheh and A Albarbar
Manchester Metropolitan University School of Engineering Manchester UK
E-mail emadnatgmailcom aalbarbarmmuacuk
Abstract In this work the performance of solar power plant is evaluated based on a developed
model comprise photovoltaic array battery storage controller and converters The model is
implemented using MATLABSIMULINK software package Perturb and observe (PampO)
algorithm is used for maximizing the generated power based on maximum power point tracker
(MPPT) implementation The outcome of the developed model are validated and supported by
a case study carried out using operational 288kW grid-connected solar power plant located in
central Manchester Measurements were taken over 21 monthrsquos period using hourly average
irradiance and cell temperature It was found that system degradation could be clearly
monitored by determining the residual (the difference) between the output power predicted by
the model and the actual measured power parameters It was found that the residual exceeded
the healthy threshold 17kW due to heavy snow in Manchester last winter More important
the developed performance evaluation technique could be adopted to detect any other reasons
that may degrade the performance of the PV panels such as shading and dirt Repeatability and
reliability of the developed system performance were validated during this period Good
agreement was achieved between the theoretical simulation and the real time measurement
taken the online grid connected solar power plant
1 Introduction
The global environmental financial and political issues necessitate the use of renewable resources to
meet the fast growth in energy demand Among renewable resources PV systems have received
considerable attentions and it is expected that the penetration of PV energy generation will increase
steadily to become a significant proportion of total energy generation [1] However the power
generated by photovoltaic system suffers from some deficiencies when used as stand-alone energy
sources Natural variations in solar radiation and temperature causes power fluctuations in PV system
To alleviate this problem and to meet sustained load demands during varying natural conditions
energy storage system need to be integrated with the PV system This paper focuses on the
combination of PV panels MPPT controller to operate the PV panel at its maximum power point and
battery storage device As the PV panel output power varies with the solar radiation a battery storage
device can be integrated with the photovoltaic system to ensure that the system performs under all
conditions
In power applications and system design modelling and simulation is essential to optimize control
and enhance system performance Over recent years much research has been carried out on
photovoltaic and battery storage Among them Kim et al [2] developed a grid-connected
photovoltaic model using PSCADEMTDC for electromagnetic transient analysis El-Shatter et al [3]
employed fuzzy logic control to find the maximum power point tracking for both PV and wind
25th International Congress on Condition Monitoring and Diagnostic Engineering IOP PublishingJournal of Physics Conference Series 364 (2012) 012122 doi1010881742-65963641012122
Published under licence by IOP Publishing Ltd 1
energies Tremblay et al [4] developed a generic battery model for the dynamic simulation of hybrid
electric vehicles they used only the battery state-of-charge (SOC) as a state variable in order to avoid
the algebraic loop problem Arribas et al [5] proposed a PVWT hybrid system performance
assessment procedure based on the existing one for PV systems (IEC-61724) Pietruszko et al [6]
summarized one year of monitoring of a roof-mounted 1kW grid-connected PV system in Poland
Omer et al [7] presented monitoring results of two examples of building integrated PV (BIPV)
systems in the UK Tsai [8] implemented an insolation-oriented PV model using
MATLABSIMULINK software package Gow et al [9] developed a general PV model which can be
implemented on simulation platforms such as PSPICE or SABER Chayawatto et al [10] developed a
mathematical model of a dcac full-bridge switching converter with current control for PV grid-
connected system under islanding phenomena this phenomena occur when the grid system is
disconnected for any reason and the distributed generation still supplies to any section of local loads
Although the SimPowerSystem tool in MATLABSIMULINK package conveniently offers a wind
farm model it does not offer a solar power plant model for stand-alone or grid-connected applications
Thus it is difficult to analyze and simulate in the generic modelling of PV power system Adding to
that as PV systems age it would be expected that their overall efficiency would decrease and
currently there is few monitoring system available to diagnose faults as they occur Consequently
these gaps gave the researchers the motivation to evaluate the performance of solar power plant based
on a developed model comprises photovoltaic array battery storage controller and converters The
flowchart of the developed monitoring technique is shown in figure 1
Figure 1 Flowchart of the proposed monitoring system
25th International Congress on Condition Monitoring and Diagnostic Engineering IOP PublishingJournal of Physics Conference Series 364 (2012) 012122 doi1010881742-65963641012122
2
As shown in figure 1 the proposed monitoring system enables early system degradation to be
identified via the calculation of the residual difference in power generation between the model
predicted and the actual PV power plant The outcome of the developed system is then validated and
supported by a case study in Section 32 through monitoring a 288kW solar power plant located in
central Manchester
2 Dynamic model of the solar power plant
In this section the dynamic simulation model is described for PVbattery power system The
developed model consists of a photovoltaic array dcdc converter with an isolated transformer
designed for achieving the maximum power point (MPP) with a current reference control (Iref)
produced by PampO algorithm and Li-Ion battery storage The excess energy with respect to the load
requirement is used for battery charging The excess power demand of the user is supplied by the
battery storage system The block diagram of the developed PVbattery power system is shown in
figure 2
Figure 2 Block diagram of the proposed PVbattery power system
21 Modelling and design of a photovoltaic system
The general mathematical model for the solar cell has been studied over the past three decades [11]
The circuit of the solar cell model which consists of a photocurrent diode parallel resistor (leakage
current) and a series resistor is shown in figure 3
Figure 3 Single diode PV cell equivalent circuit
According to both the PV cell circuit shown in figure 3 and Kirchhoffrsquos circuit laws the
photovoltaic current can be presented as follows [12]
25th International Congress on Condition Monitoring and Diagnostic Engineering IOP PublishingJournal of Physics Conference Series 364 (2012) 012122 doi1010881742-65963641012122
3
p
dKFT
ev
ogcpvR
vIII c
d
1exp (1)
Where Igc is the light generated current Io is the dark saturation current dependant on the cell
temperature e is the electric charge = 16 x 10-19
Coulombs K is Boltzmannrsquos constant = 138 x 10-23
JK F is the cell idealising factor Tc is the cellrsquos absolute temperature vd is the diode voltage and Rp
is the parallel resistance The photocurrent (Igc) mainly depends on the solar irradiation and cell
temperature which is described as [12]
GITTI scrcscgc (2)
Where μsc is the temperature coefficient of the cellrsquos short circuit current Tr is the cellrsquos reference
temperature Isc is the cellrsquos short circuit current at a 25oC and 1kWm
2 and G is the solar radiation in
kWm2 Furthermore the cellrsquos saturation current (Io) varies with the cell temperature which is
described as [12]
cr
g
TTKF
ev
r
coo
T
TII
113
exp (3)
c
oc
KFT
ev
sc
o
II
exp
(4)
Where Ioα is the cellrsquos reverse saturation current at a solar radiation and reference temperature Vg is
the band-gap energy of the semiconductor used in the cell and Voc is the cellrsquos open circuit voltage In
this study a general PV model is built and implemented using MATLABSIMULINK to verify the
nonlinear output characteristics for the PV module The proposed model is implemented as shown in
figure 4 In this model whereas the inputs are the solar irradiation and cell temperature the outputs are
the photovoltaic voltage and current The PV models parameters are usually extracted from the
manufactures data sheet
Figure 4 Subsystem implementation of the PV model
An experiment was conducted in order to validate the proposed PV model The experimental rig
consists of one Astronergy CHSM6610P-225 PV module adjustable load resistance and some
measurement instrumentation The PV module was placed at an inclination angle of 10o and azimuth
25th International Congress on Condition Monitoring and Diagnostic Engineering IOP PublishingJournal of Physics Conference Series 364 (2012) 012122 doi1010881742-65963641012122
4
angle of 30o Two digital multi-meters were respectively arranged in series to measure output current
and in parallel to measure working voltage The output power is then the product of measured current
and voltage Observation of solar irradiance and temperature were taken and recorded each time the
load was changed Current and voltage of the PV module where recorded after a delay of 1 minute
after the resistance was changed It was found that both simulated and measured results for the output
characteristics of PV module are good agreement as shown in figures 5(a) and 5(b) This proves the
correctness of the proposed model
(a) P-V output characteristics
(b) I-V output characteristics
Figure 5 Results comparison for the simulation and experimental approaches (850Wm2 45
oC)
22 Modelling and design of Li-Ion battery storage
In the literature several studies have been reported regarding to Li-Ion battery [13] In this paper the
Li-Ion battery is modelled using a simple controlled voltage source in series with a constant resistance
as shown in figure 6
Figure 6 Battery model equivalent circuit
The open voltage source is calculated with a non-linear equation based on the actual SOC of the
battery
The controlled voltage source can be presented as follow [4]
25th International Congress on Condition Monitoring and Diagnostic Engineering IOP PublishingJournal of Physics Conference Series 364 (2012) 012122 doi1010881742-65963641012122
5
During discharge
itBAiitQ
QKit
itQ
QKEE obatt
exp (5)
During charge
itBAiQit
QKit
itQ
QKEE obatt
exp
10
(6)
Thus the open voltage source is
RiEV battbatt (7)
Where Ebatt is the no-load voltage Eo is the battery constant voltage K is the polarisation voltage
Q is the battery capacity it is the actual battery charge i is the low frequency current dynamics A is
the exponential zone amplitude B is the exponential zone time constant inverse (Ah) minus1
Vbatt is the
battery voltage R is the internal resistance and i is the battery current Model parameters can simply
be deduced from a manufacturerrsquos discharge curve as shown in figure 7
Figure 7 Nominal current discharge characteristic
The three necessary points used to extract the model parameters are the fully charged voltage the
end of the nominal zone (voltage and charge) and the end of the exponential zone (voltage and
charge) The exponential part (A exp (minusBit)) is calculated with the fully charge voltage (Efull) and the
end of the exponential zone (Eexp Qexp) as follows [4]
expEEA full (8)
exp
3
QB (9)
The polarisation voltage (K) can be deduced from the fully charged voltage and the end of nominal
zone (Enom Qnom) [4]
nom
nomnomnomfull
Q
QQQBAEEK
1exp (10)
25th International Congress on Condition Monitoring and Diagnostic Engineering IOP PublishingJournal of Physics Conference Series 364 (2012) 012122 doi1010881742-65963641012122
6
Then the voltage constant (E0) can be presented as follows [4]
AiRKEE fullo (11)
The modified model of the Li-Ion battery is implemented in MATLABSIMULINK using several
standard SIMULINK blocks as well as some of the SimPowerSystems blocks [4] In this model the
output is a vector containing three signals SOC battery current and voltage The proposed model is
implemented as shown in figure 8
Figure 8 Subsystem implementation of the Li-Ion battery model
23 Power control system
The output characteristics of the PV model with different solar irradiance and cell temperature are
nonlinear Furthermore the solar irradiation is unpredictable which makes the maximum power point
of the PV module changes continuously Therefore a MPPT technique is needed to operate the PV
module at its maximum power point Perturb and observe algorithm is the MPPT control algorithm
that will be adapted in this model The PampO algorithm operates by periodically incrementing or
decrementing the PV array operating current and comparing the PV output power with the previous
one If itrsquos positive the control system moves the PV array operating point in the same direction
otherwise itrsquos moved in the opposite direction
A MPPT controller model is built and implemented using MATLAB to operate the PV module at
its maximum power point The PampO algorithm requires two measurements measurement of the
current (Ipv) and measurement of the voltage (Vpv) The proposed model is implemented as shown in
figure 9(a)
Figure 9(a) Subsystem implementation of the MPPT controller model
In addition a dc averaged switch model converter with input current control (Iref) is built and
implemented using MATLABSIMULINK to reduce the switching harmonics and to step up the
25th International Congress on Condition Monitoring and Diagnostic Engineering IOP PublishingJournal of Physics Conference Series 364 (2012) 012122 doi1010881742-65963641012122
7
photovoltaic voltage to a higher dc voltage The proposed model is implemented as shown in
figure 9(b)
Figure 9(b) Subsystem implementation of the dcdc converter model
3 Simulation results and performance analysis
31 PVLi-Ion battery power system model
In this Section the proposed model was simulated using MATLAB for stand-alone application The
system consists of 36kW of PV panels (200V 65Ah) Li-Ion battery bank controller and converters
The block diagram of the integrated PVLi-Ion battery system and the power controllers are shown in
figure 2
The major inputs for the proposed PV model were solar irradiation PV panel temperature and PV
manufacturing data sheet informationrsquos In this work Sharprsquos (NU-180) PV panel is taken as example
The Sharprsquos (NU-180) key specification is listed in table 1
Table 1 Sharprsquos (NU-180) specifications (1kWm2 25
o C)
Parameter Variable Value
Maximum power Pm 180 (W)
Open circuit voltage Voc 30 (V)
Voltage at Pm Vamp 237 (V)
Short circuit current Isc 837 (A)
Current at Pm Iamp 76 (A)
Temp coefficient for Voc β -104 mV degC
Temp coefficient for Isc α + 0053 degC
No of cells and connections Ns 48 in series
During the simulation process the aim was to observe the proposed model behaviour under
different operating condition The solar radiation and user load profiles are used to test the
performance of the proposed system model as shown in figures 10(a) and 10(b)
25th International Congress on Condition Monitoring and Diagnostic Engineering IOP PublishingJournal of Physics Conference Series 364 (2012) 012122 doi1010881742-65963641012122
8
Figure 10 (a) Solar radiation profile (b) Load profile
Although the photovoltaic power fluctuates due to solar radiation variations as shown in figure 11
the proposed control system of the solar power plant successfully operates the PV model at the MPP
by periodically incrementing or decrementing the PV array operating current (Ipv = Iref) On the other
hand the dc-dc converter successfully steps up the voltage with an efficiency of 93 as shown in
figure 12
Figure 11 Total power of the solar plant
Figure 12 Efficiency of the dc-dc converter
According to the power profile depicted in figure 10(b) peak load demands would be observed
between 10 to 20min and from 30 to 50min However during these time intervals the PV power is
lower than the demand To overcome this deficiency and to meet the load demand battery bank was
added to the PV system Hence the peak load demand is satisfied by battery bank as shown in
figure 13 The power met by the battery introduces a current change at the battery bank terminal as
depicted in figure 14 When the battery current is positive (time intervals 10ndash20min and 30ndash50min)
25th International Congress on Condition Monitoring and Diagnostic Engineering IOP PublishingJournal of Physics Conference Series 364 (2012) 012122 doi1010881742-65963641012122
9
energy is transferred to the load by the battery bank When the battery current is negative the battery
bank is recharged Figure 15 shows the SOC of the battery during the simulation The power
delivered to the load side by the PVLi-Ion battery system is illustrated in figure 16
Figure 13 Power satisfied by battery bank
Figure 14 Battery current change with
respect to power demand
Figure 15 Battery State-Of-Charge (SOC)
Figure 16 Power delivered to load side by
the PVbattery system
32 Case study performance of PV power stations in Manchester
In 2009 Manchester Metropolitan University (MMU) installed three PV power stations on its campus
in Manchester with a combined maximum power of 558kW (enough power to light 7200 100-watt
light bulbs power 960 student laptops boil 40 kettles or supply electricity to 10 houses) Figure 17(a)
shows the 288kW PV power plant designated as (All Saints building) PV array 1 Figure 17(b) shows
the (All Saints building) PV array 2 Both power stations use the Sharp NU-180 (E1) PV panels and
they were placed at an inclination angle of 10o and azimuth angle of 30
o
As shown in figure 17 the solar power plant is divided into two building Building 1 has its PV
system located on the sixth floor with a total of 160 PV panels Building 2 has its array spread over
two floors (floor 6 and floor 4) There are 150 panels in total 78 PV panels on floor 6 and 72 on
floor 4 The total power delivered to the national grid by the PV systems since their commissioning
back in 2009 is shown in figure 18
25th International Congress on Condition Monitoring and Diagnostic Engineering IOP PublishingJournal of Physics Conference Series 364 (2012) 012122 doi1010881742-65963641012122
10
Figure 17(a) All Saints
building PV array 1
Figure 17(b) All Saints building PV array 2
Furthermore the proposed PV model was simulated using MATLAB to monitor the 288kW grid
connected PV power station by calculating the residual difference between the model predicted and
the actual measured power parameters Measurements were taken over 21 monthrsquos period using
hourly average irradiance and cell temperature
It was found from figure 19(a) that the system has a good performance since the residual
difference between the model prediction and the actual power is less than 17kW The difference
caused due to the clouds dust wire and aging Also it can be observed from figure 19(b) that system
degradation will be indicated when the residual difference is above 19kW due to snow cover
shading or any other reasons that may reduce the efficiency of the PV panels
Figure 18 PV systems total yield (Sep 2009 ndash May 2011)
25th International Congress on Condition Monitoring and Diagnostic Engineering IOP PublishingJournal of Physics Conference Series 364 (2012) 012122 doi1010881742-65963641012122
11
Figure 19(a) System performance during 10 day of Jun 2010
Figure 19(b) System performance during 10 day of Dec 2010
4 Conclusions
In this paper solar power plant performance was evaluated based on a developed model for stand-
alone and grid-connected applications The developed model comprises photovoltaic array Li-Ion
battery and an appropriate power flow controller The model has been implemented using the
MATLABSIMULINK software package and designed with a dialog box like those used in the
SIMULINK block libraries Excellent performance was obtained from the simulation model under
variable solar radiation and load power requirements
The outcome of the developed model were validated and supported by a case study carried out
using operational 288kW grid-connected solar power plant located in central Manchester The study
was carried out through monitoring that system by calculating the residual difference between the
model predicted and the actual measured power parameters Measurements were taken over 21
monthrsquos period using hourly average irradiance and cell temperature Good agreement was achieved
between the theoretical simulation and the real time measurement taken the online grid connected
solar power plant With this model it is possible to identify PV generation problems quickly and
improve system efficiency and performance
Acknowledgement
The authors would like to thank the Manchester Metropolitan University School of Engineering An-
Najah National University Department of Computer Engineering for their kind contribution in
providing financial support for this study
25th International Congress on Condition Monitoring and Diagnostic Engineering IOP PublishingJournal of Physics Conference Series 364 (2012) 012122 doi1010881742-65963641012122
12
References
[1] Photovoltaic Industry Association (EPIA) httpwwwepiaorgpress-roomepia-press-
releaseshtml (Accessed Jun 2011)
[2] Kim S K Jeona J H Choa C H Kima E S and Ahna J B 2009 Modelling and simulation of a
grid-connected PV generation system for electromagnetic transient analysis Solar Energy 83
664
[3] El-Shatter T F Eskander M N and El-Hagry M T 2006 Energy flow and management of a
hybrid windPVfuel cell generation system Energy Conversion and Management 47 1264
[4] Tremblay O Dessaint L A and Dekkiche A I 2007 A Generic Battery Model for the Dynamic
Simulation of Hybrid Electric Vehicles IEEE Vehicle Power and Propulsion Conference
(Arlington TX) p 284
[5] Arribas L Cano L Cruz I Mata M and Llobet E 2010 PVndashwind hybrid system performance A
new approach and a case study Renewable Energy 35 128
[6] Pietruszko S M and Gradzki M 2003 Performance of a grid connected small PV system in
Poland Applied Energy 74 177
[7] Omer S A Wilson R and Riffat S B 2003 Monitoring results of two examples of building
integrated PV (BIPV) systems in the UK Renewable Energy 28 1387
[8] Tsai H L 2010 Insolation-oriented model of photovoltaic module using MatlabSimulink Solar
Energy 84 1318
[9] Gow J A and Manning C D 1999 Development of a photovoltaic array model for use in power-
electronics simulation studies IEE Proceedings- Electric Power Applications 146 193
[10] Chayawatto N Kirtikara K Monyakul V Jivacate C and Chenvidhya D 2009 DCndashAC
switching converter modellings of a PV gridconnected system under islanding phenomena
Renewable Energy 34 2536
[11] Phang J C H Chan D S H and Philips J R 1984 Accurate analytical method for the extraction of
solar cell model parameter IEEE Electronics Letters 20 406
[12] Villalva M G Gazoli J R and Filho E R 2009 Comprehensive approach to modelling and
simulation of photovoltaic arrays IEEE Transactions on Power Electronics 24 1198
[13] Zhang J and Lee J 2011 A review on prognostics and health monitoring of Li-ion battery
Journal of Power Sources 196 6007
25th International Congress on Condition Monitoring and Diagnostic Engineering IOP PublishingJournal of Physics Conference Series 364 (2012) 012122 doi1010881742-65963641012122
13
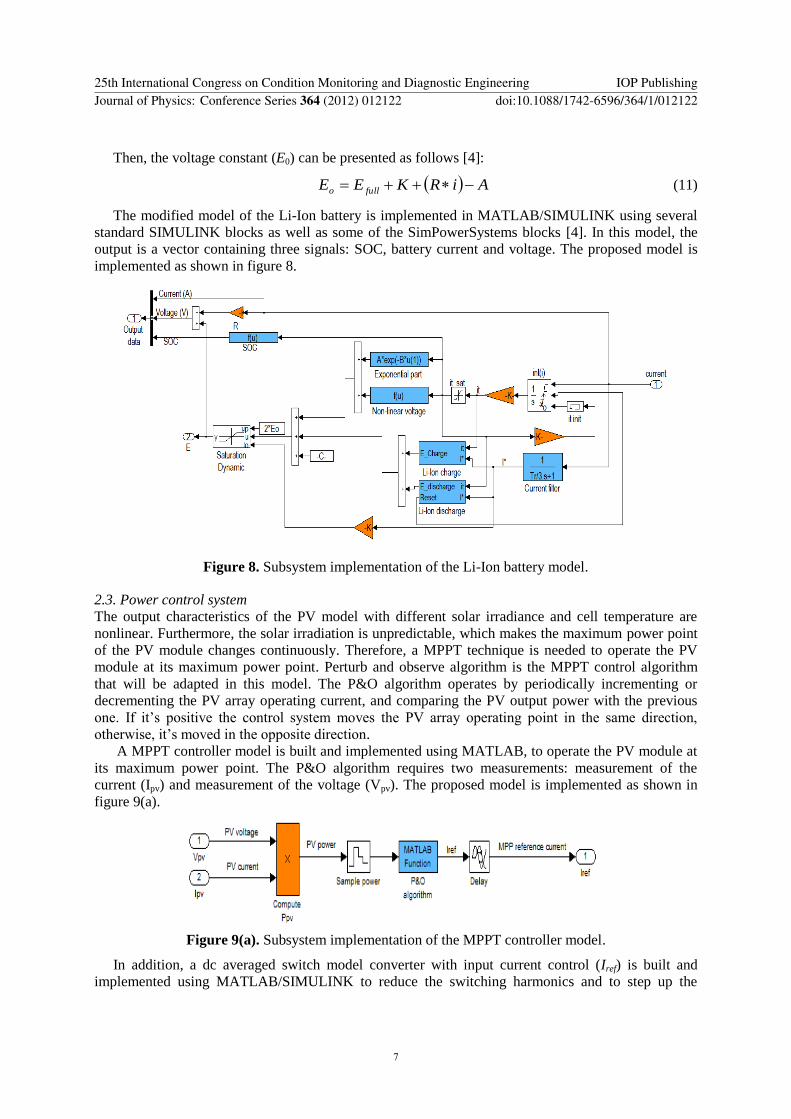
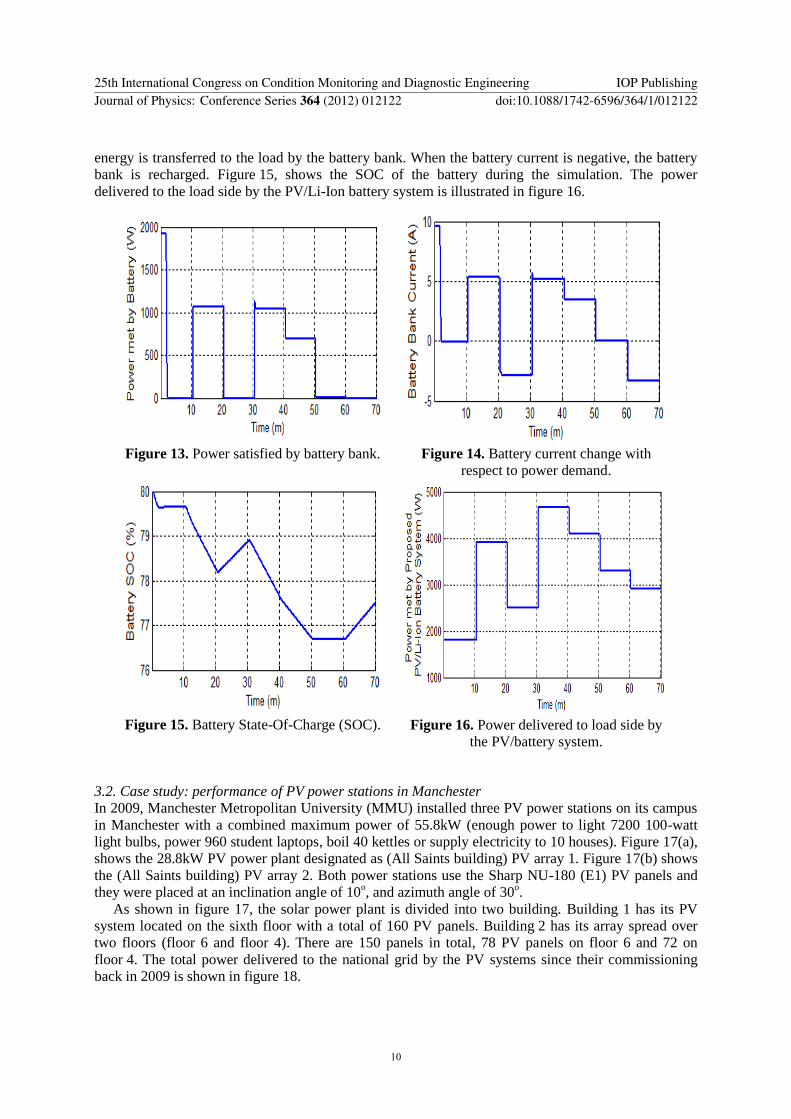
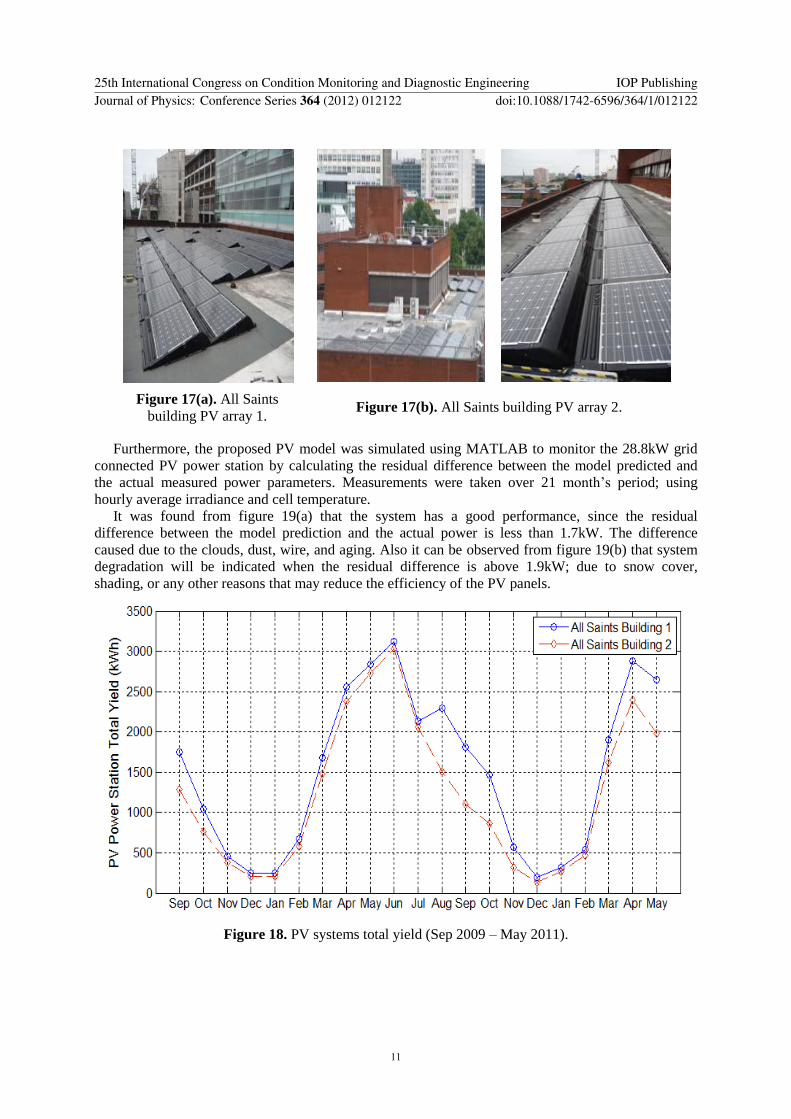
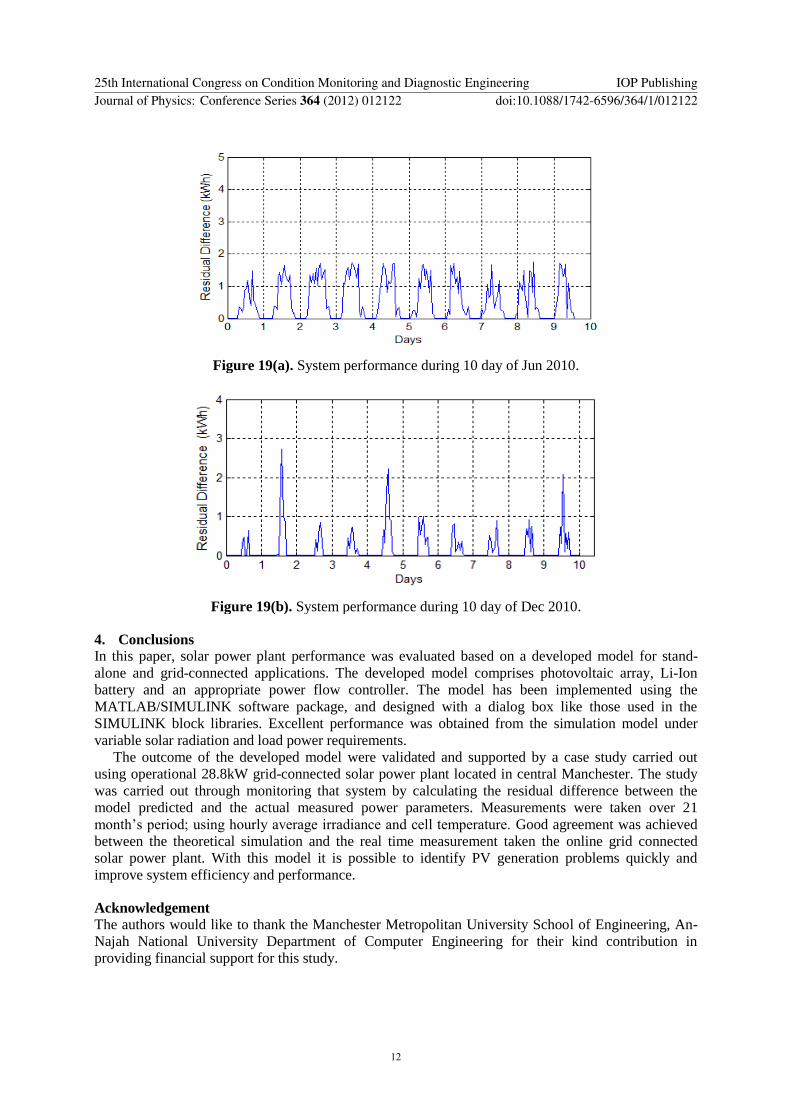