solar heat worldwide-2011
TRANSCRIPT

SOLAR HEAT WORLDWIDE 2011
Solar Heat Worldwide
Markets and Contribution to the Energy Supply 2009E D I T I O N 2 0 1 1
IEA Solar Heating & Cooling Programme, May 2011
Supported by the Austrian Ministry for Transport, Innovation and Technology
Design, Grafics, Typesetting & Imageprocessing: STEINHUBER INFODESIGN, Graz, Austria
Cover Photo: SUNMARK A/S
Werner Weiss Franz Mauthner|
AEE INTEC
AEE - Institute for Sustainable Technologies
A-8200 Gleisdorf, Austria
Notice:
The Solar Heating and Cooling Programme functions within a framework created by the International Energy Agency (IEA).
Views, findings and publications of the Solar Heating and Cooling Programme do not necessarily represent the views or
policies of the IEA Secretariat or of all its individual member countries.

SOLAR HEAT WORLDWIDE 2011

Table of Contents
1 Background · · · · · · · · · · · · · · · · · · · · · · · · · · · · · · · · · · · · · · · · · · · · · · · · · · · · · · · · · · · · · · · · · · · · · · · · · · · · · · · · · · · · · · · · · · · · · · · · · · · · · · · · · · · · · · · · · · · · · · · · 4
2 Summary · · · · · · · · · · · · · · · · · · · · · · · · · · · · · · · · · · · · · · · · · · · · · · · · · · · · · · · · · · · · · · · · · · · · · · · · · · · · · · · · · · · · · · · · · · · · · · · · · · · · · · · · · · · · · · · · · · · · · · · · · · · 5
3 Total installedcapacity inoperation · · · · · · · · · · · · · · · · · · · · · · · · · · · · · · · · · · · · · · · · · · · · · · · · · · · · · · · · · · · · · · · · · · · · · · · · · · · · · · · · · · · · · 8
3.1 Generalmarketoverviewof thetotal installedcapacity inoperation2009 · · · · · · · · · · · · · · · · · · · · · · · · · · · · · · · · · · · · · · · · · · · 8
3.2 Total capacityofglazedwatercollectorsby theendof2009 · · · · · · · · · · · · · · · · · · · · · · · · · · · · · · · · · · · · · · · · · · · · · · · · · · · · · · · · · · · · · · 12
3.3 Total capacityofglazedwatercollectorsbyeconomic regionat theendof2009 · · · · · · · · · · · · · · · · · · · · · · · · · · · · · · · · · · · · 13
3.4 Total capacityofunglazedwatercollectorsby theendof2009 · · · · · · · · · · · · · · · · · · · · · · · · · · · · · · · · · · · · · · · · · · · · · · · · · · · · · · · · · · 14
3.5 Total capacityofunglazedwatercollectorsbyeconomic regionat theendof2009 · · · · · · · · · · · · · · · · · · · · · · · · · · · · · · · · 15
4 Marketdevelopmentofthenewlyinstalledcapacity · · · · · · · · · · · · · · · · · · · · · · · · · · · · · · · · · · · · · · · · · · · · · · · · · · · · · · · · · · · · ·16
4.1 Generalmarketoverviewofnewly installedsystems in2009 · · · · · · · · · · · · · · · · · · · · · · · · · · · · · · · · · · · · · · · · · · · · · · · · · · · · · · · · · · · 16
4.2 Newly installedcapacityofglazedwatercollectors in2009 · · · · · · · · · · · · · · · · · · · · · · · · · · · · · · · · · · · · · · · · · · · · · · · · · · · · · · · · · · · · · · 20
4.3 Marketdevelopmentofglazedwatercollectorsbetween2000and2009 · · · · · · · · · · · · · · · · · · · · · · · · · · · · · · · · · · · · · · · · · · · · 22
4.4 Marketdevelopmentofunglazedwatercollectorsbetween2000and2009 · · · · · · · · · · · · · · · · · · · · · · · · · · · · · · · · · · · · · · · · · 24
5 ContributiontotheenergysupplyandCO2reduction · · · · · · · · · · · · · · · · · · · · · · · · · · · · · · · · · · · · · · · · · · · · · · · · · · · · · · · · · · · ·25
5.1 Annual collectoryieldbyeconomic region · · · · · · · · · · · · · · · · · · · · · · · · · · · · · · · · · · · · · · · · · · · · · · · · · · · · · · · · · · · · · · · · · · · · · · · · · · · · · · · · · · · · 29
5.2 Annualenergysavingsbyeconomic region · · · · · · · · · · · · · · · · · · · · · · · · · · · · · · · · · · · · · · · · · · · · · · · · · · · · · · · · · · · · · · · · · · · · · · · · · · · · · · · · · · 31
5.3 Annual contribution toCO2 reductionbyeconomic region · · · · · · · · · · · · · · · · · · · · · · · · · · · · · · · · · · · · · · · · · · · · · · · · · · · · · · · · · · · · · · · · 33
6 Distributionofsystemsbysystemtypeandapplication · · · · · · · · · · · · · · · · · · · · · · · · · · · · · · · · · · · · · · · · · · · · · · · · · · · · · · · · ·35
6.1 Distributionbyapplicationof the total installedcapacity inoperation · · · · · · · · · · · · · · · · · · · · · · · · · · · · · · · · · · · · · · · · · · · · · · · · · 35
6.2 Distributionbyapplicationof thenewly installedcapacity in2009 · · · · · · · · · · · · · · · · · · · · · · · · · · · · · · · · · · · · · · · · · · · · · · · · · · · · · 36
6.3 Distributionbytypeofsystemof thenewly installedcapacity in2009 · · · · · · · · · · · · · · · · · · · · · · · · · · · · · · · · · · · · · · · · · · · · · · · · · 38
6.4 European largescalesolar thermalapplications · · · · · · · · · · · · · · · · · · · · · · · · · · · · · · · · · · · · · · · · · · · · · · · · · · · · · · · · · · · · · · · · · · · · · · · · · · · · 39
6.5 Worldwide largescalesolar thermalapplications · · · · · · · · · · · · · · · · · · · · · · · · · · · · · · · · · · · · · · · · · · · · · · · · · · · · · · · · · · · · · · · · · · · · · · · · · · · 39
7 Appendix · · · · · · · · · · · · · · · · · · · · · · · · · · · · · · · · · · · · · · · · · · · · · · · · · · · · · · · · · · · · · · · · · · · · · · · · · · · · · · · · · · · · · · · · · · · · · · · · · · · · · · · · · · · · · · · · · · · · · · · · · · · ·40
7.1 Methodological approach for theenergycalculation · · · · · · · · · · · · · · · · · · · · · · · · · · · · · · · · · · · · · · · · · · · · · · · · · · · · · · · · · · · · · · · · · · · · · · · 40
7.2 Referencecollectors · · · · · · · · · · · · · · · · · · · · · · · · · · · · · · · · · · · · · · · · · · · · · · · · · · · · · · · · · · · · · · · · · · · · · · · · · · · · · · · · · · · · · · · · · · · · · · · · · · · · · · · · · · · · · · · · 46
7.3 Referenceclimates · · · · · · · · · · · · · · · · · · · · · · · · · · · · · · · · · · · · · · · · · · · · · · · · · · · · · · · · · · · · · · · · · · · · · · · · · · · · · · · · · · · · · · · · · · · · · · · · · · · · · · · · · · · · · · · · · 46
7.4 Populationdata · · · · · · · · · · · · · · · · · · · · · · · · · · · · · · · · · · · · · · · · · · · · · · · · · · · · · · · · · · · · · · · · · · · · · · · · · · · · · · · · · · · · · · · · · · · · · · · · · · · · · · · · · · · · · · · · · · · · · · 47
7.5 Marketdataof thepreviousyears · · · · · · · · · · · · · · · · · · · · · · · · · · · · · · · · · · · · · · · · · · · · · · · · · · · · · · · · · · · · · · · · · · · · · · · · · · · · · · · · · · · · · · · · · · · · · · · 47
7.6 References to reportsandpersons thathavesupplied thedata · · · · · · · · · · · · · · · · · · · · · · · · · · · · · · · · · · · · · · · · · · · · · · · · · · · · · · · · · 51
7.7 ListofFigures · · · · · · · · · · · · · · · · · · · · · · · · · · · · · · · · · · · · · · · · · · · · · · · · · · · · · · · · · · · · · · · · · · · · · · · · · · · · · · · · · · · · · · · · · · · · · · · · · · · · · · · · · · · · · · · · · · · · · · · · 54
7.8 ListofTables · · · · · · · · · · · · · · · · · · · · · · · · · · · · · · · · · · · · · · · · · · · · · · · · · · · · · · · · · · · · · · · · · · · · · · · · · · · · · · · · · · · · · · · · · · · · · · · · · · · · · · · · · · · · · · · · · · · · · · · · · · 56
3
SOLAR HEAT WORLDWIDE 2011

1 Background
This report was prepared within the framework of the Solar Heating and Cooling Programme (SHC) of the Interna-tional Energy Agency (IEA). The goal of this annual report is to document the solar thermal capacity installed in theimportantmarketsworldwide, and toascertain the contributionof solar thermal systems to the supply of energyandthe CO2 emissions avoided as a result of operating these systems. The collectors documented are unglazed collec-tors, glazed flat-plate and evacuated tube collectors with water as the energy carrier as well as glazed and unglazedair collectors.
The data were collected from a questionnaire survey of the national delegates of the SHC Programme’s ExecutiveCommitteeandothernational expertsactive in the fieldof solar thermal energy.Assomeof the53countries includedin this report have very detailed statistics and others have only estimates from experts, the datawas checked for itsplausibility on the basis of various publications.
Starting with the collector area, respectively the capacity installed, the contributions of solar thermal systems to-wards the supply of energy and the reduction of CO2 were ascertained.
The 53 countries included in this report represent 4.1 billion people, which is about 61% of the world’s population.The installed capacity in these countries is estimated to represent 85–90% of the solar thermal market worldwide.
4
SOLAR HEAT WORLDWIDE 2011
Figure 1:Countries represented in this report

2 Summary
Solar thermal capacity in operation worldwide by the end of 2009
The solar thermal collector capacity in operation worldwide equaled 172.4 GWth corresponding to 246.2 millionsquaremeters1 by theendof theyear2009.Of this, 151.5 GWthwereaccounted for by flat-plateandevacuated tubecollectorsand19.7 GWth forunglazedwatercollectors.Air collectorcapacitywas installed toanextentof1.2 GWth.
The vast majority of glazed and unglazed water and air collectors in operation are installed in China (101.5 GWth),Europe (32.5 GWth), and the United States and Canada (15.0 GWth), which together account for 86.4% of total in-stalled. The remaining installed capacity is shared between Australia and New Zealand (5.2 GWth), Cen-tral and SouthAmerica(4.7 GWth), theAsiancountriesof India,SouthKorea,TaiwanandThailand(4.6 GWth), Japan(4.3 GWth), the Middle East represented by Israel and Jordan (3.5 GWth) and some African countries (1.1 GWth),namely Namibia, South Africa, Tunisia and Zimbabwe.
Newly installed capacity in 2009
In the year 2009 a capacity of 36.5 GWth corresponding to 52.1million squaremeters of solar collectors were newlyinstalled worldwide. This means an increase in collector installations of 25.3% compared to the year 2008.
Themaindriver for theaboveaveragemarketgrowth in2009wasChinawhereas inkeyEuropeanmarketsaswell asin the United States and other important economic regions, such as in Japan, the solar thermal sector suffered fromthe economic downturn, resulting in stagnating or decreasing local markets.
Glazed water col lectors
The main markets for glazed water collectors (flat-plate and evacuated tube collectors) worldwide were in China(29.4 GWth; +35.5%) and Europe (3.6 GWth; –9.9%), which together accounted for 94.7% of the total newly in-stalled glazed water collectors worldwide.
Compared to the year 2008, the worldwide market for glazed water collectors grew by 27.3% in 2009.
In addition to the high growth rate in China, it was also reported fromAustralia that due to a new financial incentivescheme the annual installations of glazed water collectors increased 78.5%. In Mexico, the total number of glazedwater collector installations grewby 31.5%and in Europe, especially inmany of the small and/or emergingmarketswith a volume of below 50,000 m²/a, growth rates were above 50% and up to 100%.
By contrast, some of the key markets worldwide were hit hard by the economic recession. The leading market inEurope, Germany, saw a downturn of 23.1% in the newly installed capacity of glazed water collectors compared to2008. In Japan sales numbers dropped by 31.8% and in the United States installations of glazed water collectorsdecreased by 8.5%.
Unglazed water col lectors
For unglazed water collectors (swimming pool collectors) the number of newly installed systems decreased signifi-cantly by 7.7% compared to 2008, accounting for 1.5 GWth or 2.2 million of square meters in 2009, whereas therewas an increase of 13.9% in the period 2007/2008.
5
SOLAR HEAT WORLDWIDE 2011
1 Making the installed capacity of solar thermal collectors comparable with that of other energy sources, solar thermal experts from sevencountries agreed upon amethodology to convert installed collector area into solar thermal capacity at a joint meeting of the IEA SHC Programmeandmajor solar thermal trade associations held September 2004 in Gleisdorf, Austria. The represented associations from Austria, Canada, Ger-many, the Netherlands, Sweden and United States as well as the European Solar Thermal Industry Federation (ESTIF) and the IEA SHCProgramme agreed to use a factor of 0.7 kWth/m2 to derive the nominal capacity from the area of installed collectors.

In themost importantmarkets for unglazedwater collectors, noteworthy growth rateswere reported fromAustralia(+ 3.3%), Brazil (+ 45.9%), Mexico (+ 51.9%), Portugal (+ 87.0%) and Switzerland (+ 28.6%). Declining trendswere seen in Austria (–45.2%), Canada (–18.5%), South Africa (–46.1%), Spain (-65.6%) and the United States(–23.9%).
Market development
Glazed water col lectors
Between 2004 and 2009 the annually installed glazed water collector area worldwide almost tripled. The worldwideaverage annual growth rate between 2000 and 2009 was 20.8%.
Unglazed water col lectors
Theworldwidemarketof unglazedwater collectors in2008 recordedasignificantgrowth inBrazil, CanadaandSouthAfrica while all othermarkets remained quite stable. In 2009, it wasmore or less only Brazil (+ 45.9%) andMexico(+ 51.9%) that experienced ahigh growth ratewhile the general trend for unglazedwater collectorswas stagnatingor falling.
Distr ibut ion of systems by system type and appl icat ion
The thermal utilization of the energy from the sun greatly varies for different regions on Earth. In terms of collectortypes used, vacuum tube collectors are predominant in China while in other Asian countries, the Middle East andEurope most systems are equipped with flat plate collectors. By contrast, in North America (UnitedStates and Canada)andAustraliaunglazedwatercollectors forswimmingpoolheating is thedominantapplication.
The total installed collector area share of vacuum tube collectors of the total installed collector area in operation bythe end of 2009 accounted for 56.0%. Followed by flat plate collectors accounting for 31.9%, unglazedwater collec-tors for 11.4%andair collectors (glazed and unglazed) for 0.7%. In termsof newly installed collector area, there’s anoticeable trend towards a higher share of vacuum tube collectors, which accounted for 78.3% in 2009.
Themarket for thermosiphonsystems ismoreadvanced in theAsiancountries (especiallyChina),AfricaandtheMid-dle Eastwhile in Europe, theUnitedStates aswell as in Australia and NewZealandpumped systemsare by farmorecommon. In total, 70 – 80%of the total installed systems andmore than 85%of the 2009 newly installed systemsworldwide are thermosiphon systems.
Both trends, for thermosiphon systems and for vacuum tube collectors, are greatly affected by the Chinesemarketthat influences the worldwide figures due to disproportionally high growth rates combined with an absolutemarketdominance of the latter mentioned technologies.
Spain, Germany and Austria have the most sophisticated markets for different solar thermal applications. They in-clude systems for hot water preparation, systems for space heating of single- and multi-family houses and hotels,large-scale plants for district heating and a growing number of systems for air conditioning, cooling and industrialapplications.By theendof2009,115solar supporteddistrict heatingnetworksand11solar supportedcooling systemswithan in-stalled capacity 350 kWth (respectively 500 m²)were installed inEurope. The total capacity installedof these large-scale systems equals to 166 MWth.
Besides Europe, Canada and Saudi Arabia have also installed quite large systems. The district heating system in-stalledatDrakeLanding inCanadahasan installed capacity of 1.6 MWth (2,293 m²). Theworld’s largest systemwitha capacity of 25.4 MWth (36.305 m²) was commissioned in April 2011 in Riyadh, Saudi Arabia.
6
SOLAR HEAT WORLDWIDE 2011

Contribution of solar collectors to the supply of energy
Theannual collector yieldof allwater-basedsolar thermal systems inoperationby theendof2009 in the53 recordedcountries is 141,775 GWh(510,338 TJ). This corresponds toanoil equivalent of 14.4million tonsandanannual CO2saving of 46.1 million tons.
The contribution of the total installed air collector capacity in operation in 2009 (1.2 GWth)wasnot taken into consid-eration – with a share of about 0.7% of the total installed collector capacity, air collectors are excluded from thecalculation.
Employment
Basedondata collected fromdetailed country reports, the number of jobs in the fields of production, installation andmaintenance of solar thermal systems is estimated to be 270,000 worldwide.
Preview 2010
Theestimated total capacity of solar thermal collectors in operationworldwideby theendof 2010 is 196GWth, corre-sponding to 280 million square meters of collector area.
Compared with other forms of renewable energy, solar heating’s contribution in meeting global energy demand is,besides the traditional renewable energies likebiomassandhydropower, secondonly towindpower, andhasamuchlarger contribution than photovoltaic. This fact is still underestimated in energy policies.
7
SOLAR HEAT WORLDWIDE 2011
12.0
38.0
0.6
90.0
39.6
2.4 0.81.0
194.0196.0
417.0
162.0
0
50
100
150
200
250
300
350
400
450
Solar Thermal
Heat
Wind Power Geothermal
Power
Photovoltaic Solar Thermal
Power
Ocean Tidal
Power
Total capacity in operation [GW] 2010
Produced Energy [TWh] 2010
heat power
Total Capacity in Operation [GW ], [GW ] and ProducedEnergy [TWh ], [TWh ], 2010el th el th
Figure 2: Total capacity in operation [GWel], [GWth] 2010 and annually energygenerated [TWhel], [TWhth]. Sources: EWEA, EPIA, GWEC, IEA SHC 2011,
Morse Associates Inc., REN 21

3 Total installed capacity in operation
This report aims to give the actual collector area that is in operation and not the cumulated collector area thathas ever been installed in a country. Todetermine the collector area (and respective capacity) in operation, either of-ficial country reports on the lifetimebasewereusedor, if such reportswerenot available, a25-year lifetime for a sys-tem was calculated. The collector area in operation was then calculated using a linear equation.
3.1 General market overview of the total installed capacity in operation 2009
By theendof2009,an installedcapacityof172.4 GWth corresponding toa total of 246.2million squaremetersof col-lector areawas in operation in the 53 countries recorded in this report. These 53 countries represent 4.1 billion peo-ple, which is 61% of the world’s population. The installed capacity in these countries represents more than 90% ofthe solar thermal market worldwide.Thevastmajorityofglazedandunglazedwaterandair collectors inoperationare installed inChina(101.5 GWth),Eu-rope (32.5 GWth), and the United States and Canada (15.0 GWth), which together account for 86.4% of the total.The remaining installed capacity is shared between Australia and New Zealand (5.2 GWth), Central and SouthAmerica (4.7 GWth), the Asian countries of India, South Korea, Taiwan and Thailand (4.6 GWth), Japan (4.3 GWth),the Middle East represented by Israel and Jordan (3.5 GWth) and some African countries (1.1 GWth), namelyNamibia, South Africa, Tunisia and Zimbabwe.
8
SOLAR HEAT WORLDWIDE 2011
Australia and New Zealand
3.0%
United States and Canada
8.7%
Central and South America
2.7%
Africa
0.6%
Asia
2.7%
Middle East
2.0%
Japan
2.5%
Others
22.2%
Europe
18.9%
China
58.9%
Africa: Namibia, South Africa, Tunisia, ZimbabweAsia: India, South Korea, Taiwan, ThailandCentral + South America: Barbados, Brazil, Chile, Mexico, UruguayEurope: EU 27, Albania, Former Yugoslav Republic of Macedonia, Norway, Switzerland, TurkeyMiddle East: Israel, Jordan
Figure 3:Share of the total installed capacity in operation (glazed and unglazedwater and air collectors)by economic regions at the end of 2009

Asshown inTable1andTable2, the total capacity isdivided into55.1 GWthglazed flat-platecollectors (78.6millionsquaremeters) and 96.4 GWth evacuated tube collectors (137.7million squaremeters), 19.7 GWth unglazed watercollectors (28.2millionsquaremeters)and1.2 GWthglazedandunglazedair collectors (1.7millionsquaremeters).
CountryWater Collectors* Air Collectors*
TOTAL [MWth]unglazed glazed evacuated tube unglazed glazed
Albania 48.8 0.3 49.1
Australia 3,304.0 1,710.5 51.7 5,066.2
Austria 431.9 2,543.8 38.4 0.3 3,014.3
Barbados 92.2 92.2
Belgium 32.8 176.8 18.0 227.6
Brazil 890.3 2,799.7 3,690.0
Bulgaria 26.8 26.8
Canada 407.6 25.6 4.9 152.6 1.6 592.4
Chile 1.0 18.7 19.7
China 7,105.0 94,395.0 101,500.0
Cyprus 598.2 2.7 601.0
Czech Republic 10.2 104.1 23.1 137.4
Denmark 14.4 321.9 5.4 2.3 12.6 356.5
Estonia 1.4 0.3 1.6
Finland 8.2 18.3 1.6 28.2
France 74.0 1,279.1 23.4 1,376.4
FYRM 17.5 0.5 0.003 18.0
Germany 504.0 7,508.7 844.5 23.5 8,880.7
Greece 2,852.2 1.8 2,853.9
Hungary 4.0 73.5 16.7 0.4 0.1 94.6
India 1,987.3 169.6 11.4 2,168.3
Ireland 59.8 24.8 84.7
Israel 20.6 2,827.5 0.3 2,848.5
Italy 30.6 1,263.2 177.1 1,470.9
Japan 3,936.1 68.1 330.7 4,334.8
Jordan 482.6 144.1 626.7
Korea, South 1,047.6 1,047.6
Latvia 4.8 0.10 4.9
Lithuania 2.9 0.1 3.0
Luxembourg 17.1 1.3 18.4
Malta 23.2 8.2 31.4
Mexico 400.5 433.6 49.3 3.8 887.2
Namibia 10.7 0.3 11.0
Netherlands 264.1 264.6 528.7
New Zealand 4.9 100.1 6.8 111.8
Norway 1.3 9.1 0.4 0.8 11.6
Poland 275.9 81.0 356.9
Portugal 1.5 370.4 13.2 385.0
Romania 59.8 6.3 66.1
Slovakia 75.5 9.0 84.5
Slovenia 95.0 6.3 101.3
South Africa 527.6 202.1 14.7 744.4
Spain 77.7 1,319.5 81.2 1,478.4
Sweden 87.5 168.7 34.3 290.5
Switzerland 148.3 435.2 26.8 601.3 1,211.6
Taiwan 1.4 1,299.7 44.9 1,345.9
Thailand 64.0 64.0
Tunisia 268.8 14.7 283.5
Turkey 8,424.5 8,424.5
United Kingdom 254.9 66.8 321.7
United States 12,455.5 1,787.8 61.4 68.5 14,373.2
Uruguay 8.5 8.5
Zimbabwe 12.3 0.1 12.4
TOTAL 19,703.9 54,915.5 96,539.1 757.1 453.1 172,368.6
FYRM Former Yugoslav Republic of Macedonia* If no data is given: no reliable database for this collector type is available** Unglazed air collectors in Switzerland: this is a very simple site-built system for hay drying
Table 1: Total capacity in operation by the end of 2009 [MWth]
9
SOLAR HEAT WORLDWIDE 2011

CountryWater Collectors* Air Collectors*
TOTAL [m²]unglazed glazed evacuated tube unglazed glazed
Albania 69,705 466 70,171
Australia 4,720,000 2,443,569 73,806 7,237,375
Austria 616,952 3,634,012 54,828 378 4,306,170
Barbados 131,690 131,690
Belgium 46,875 252,620 25,713 325,208
Brazil 1,271,849 3,999,547 5,271,396
Bulgaria 38,336 38,336
Canada 582,351 36,569 6,995 217,989 2,349 846,253
Chile 1,470 26,730 28,200
China 10,150,000 134,850,000 145,000,000
Cyprus 854,637 3,883 858,520
Czech Republic 14,621 148,646 33,030 196,298
Denmark 20,515 459,866 7,684 3,264 18,000 509,329
Estonia 1,951 390 2,341
Finland 11,779 26,118 2,342 40,240
France 105,699 1,827,223 33,379 1,966,300
FYRM 25,020 724 4 25,748
Germany 720,000 10,726,731 1,206,423 33,600 12,686,754
Greece 4,074,500 2,500 4,077,000
Hungary 5,688 105,011 23,803 500 200 135,202
India 2,838,948 242,247 16,320 3,097,515
Ireland 85,475 35,493 120,968
Israel 29,495 4,039,324 422 4,069,241
Italy 43,766 1,804,597 252,981 2,101,344
Japan 5,622,949 97,297 472,376 6,192,622
Jordan 689,371 205,916 895,287
Korea, South 1,496,514 1,496,514
Latvia 6,904 140 7,044
Lithuania 4,168 150 4,318
Luxembourg 24,482 1,818 26,300
Malta 33,144 11,723 44,867
Mexico 572,092 619,432 70,430 5,403 1,267,357
Namibia 15,259 447 15,706
Netherlands 377,287 378,051 755,338
New Zealand 7,025 142,975 9,644 159,645
Norway 1,920 13,010 540 1,110 16,580
Poland 394,188 115,648 509,836
Portugal 2,082 529,079 18,839 550,000
Romania 85,496 9,000 94,496
Slovakia 107,892 12,855 120,746
Slovenia 135,656 9,042 144,698
South Africa 753,678 288,710 20,972 1,063,360
Spain 111,000 1,885,000 116,000 2,112,000
Sweden 125,000 241,000 49,000 415,000
Switzerland 211,790 621,780 38,290 859,000 1,730,860
Taiwan 1,937 1,856,659 64,168 1,922,764
Thailand 91,392 91,392
Tunisia 384,000 21,000 405,000
Turkey 12,035,000 12,035,000
United Kingdom 364,138 95,445 459,583
United States 17,793,589 2,553,984 87,755 97,878 20,533,206
Uruguay 12,096 12,096
Zimbabwe 17,509 162 17,671
TOTAL 28,148,459 78,450,665 137,912,968 1,081,553 647,240 246,240,885
FYRM Former Yugoslav Republic of Macedonia* If no data is given: no reliable database for this collector type is available** Unglazed air collectors in Switzerland: this is a very simple site-built system for hay drying
Table 2: Total installed collector area in operation by the end of 2009 [m²]
10
SOLAR HEAT WORLDWIDE 2011

The distribution of theworldwide capacity in operation by the different types of solar collectors is shown in Figure 4
andFigure 5 depicts the distribution of unglazed and glazedwater collectors for the 10 leading countries by the endof 2009.
Figure 5 clearly showshow thedifferent types of collectors are applied in the leading countriesworldwide. China, asworld leader in total capacity, is focusing verymuchonevacuated tube collectors,whereas theUnitedStates is hold-ing second position due to its high installation of unglazed water collectors. Only in Australia and to some extend inBrazil dounglazedcollectorsalsoplayan important role. The restof the“top10countries”areclearly focusingon flat-plate collector technology.
In comparison to 2008, the position of the top 10 nations remained the same.
11
SOLAR HEAT WORLDWIDE 2011
Evacuated tube
56.0%
Unglazed Collector
11.4%
Air collector
0.7%
Flat-plate
31.9%
Figure 4:Distribution of the total installed capacity in operation by collector type in 2009
7,1
05
94
,39
5
0
1,500
3,000
4,500
6,000
7,500
9,000
10,500
12,000
13,500
15,000
China United
States
Germany Turkey Australia Japan Brazil Austria Greece Israel
unglazed glazed evacuated tubeInstalled Capacity [MW ]th
Figure 5: Total installed capacity of water collectors in operation in the 10 leading countries by the end of 2009

3.2 Total capacity of glazed water collectors by the end of 2009
12
SOLAR HEAT WORLDWIDE 2011
8,3
53.2
4,0
04.2
2,8
53.9
2,8
27.5
2,7
99.7
2,5
82.2
2,1
56.8
1,8
49.2
1,7
62.2
1,4
40.3
1,4
00.7
1,3
44.6
1,3
02.4
1,0
47.6
626.7
601.0
482.9
462.0
383.5
356.9
327.3
321.7
283.5
264.6
216.8
203.0
194.8
127.2
106.8
101.3
92.2
90.2
84.7
84.5
66.1
64.0
49.1
31.4
30.5
26.8
19.9
18.7
18.4
18.0
12.4
11.0
9.5
8.5
4.9
3.0
1.6
8,4
24.5
0
1,000
2,000
3,000
4,000
5,000
6,000
7,000
8,000
9,000Chin
a
Turk
ey
Germ
any
Japan
Gre
ece
Isra
el
Bra
zil
Austr
ia
India
United
Sta
tes
Austr
alia
Ita
ly
Spain
Taiw
an
Fra
nce
Kore
a,South
Jord
an
Cypru
s
Mexic
o
Sw
itzerland
Port
ugal
Pola
nd
Denm
ark
United
Kin
gdom
Tunis
ia
Neth
erlands
South
Afr
ica
Sw
eden
Belg
ium
Czech
New
Zeala
nd
Slo
venia
Barb
ados
Hungary
Ire
land
Slo
vakia
Rom
ania
Thailand
Alb
ania
Malta
Canada
Bulg
aria
Fin
land
Chile
Luxem
bourg
Macedonia
Zim
babw
e
Nam
ibia
Norw
ay
Uru
guay
Latv
ia
Lithuania
Esto
nia
Total capacity [MW ]th101,5
00.0
Figure 6: Total capacity of glazed flat-plate and evacuated tube collectors in operation by the end of 2009
323.9
314.5
265.8
109.7
101.5
100.0
82.9
77.5
76.7
60.8
59.5
58.5
50.5
37.4
35.8
31.5
30.3
27.0
25.4
24.8
22.4
21.6
20.2
18.7
18.5
16.5
15.8
15.5
14.1
12.5
9.3
9.0
8.7
6.0
5.2
5.2
4.4
4.3
3.8
3.7
3.0
2.4
2.2
2.0
1.9
1.3
1.1
1.1
1.0
0.9
0.9
390.9
0
50
100
150
200
250
300
350
400
Cypru
s
Isra
el
Barb
ados
Austr
ia
Gre
ece
Turk
ey
Germ
any
Jord
an
Austr
alia
Malta
Chin
a
Sw
itzerland
Denm
ark
Taiw
an
Slo
venia
Luxem
bourg
Port
ugal
Japan
Spain
Tunis
ia
New
Zeala
nd
Ita
ly
Sw
eden
Kore
a,South
Fra
nce
Belg
ium
Ire
land
Alb
ania
Neth
erlands
Slo
vakia
Bra
zil
Czech
Pola
nd
Hungary
Macedonia
United
Sta
tes
Nam
ibia
United
Kin
gdom
South
Afr
ica
Mexic
o
Fin
land
Bulg
aria
Rom
ania
Uru
guay
Latv
ia
Norw
ay
India
Esto
nia
Chile
Zim
babw
e
Thailand
Canada
Lithuania
Total capacity 2009 per 1000 inhabitants [kW /1000inh]th
554.0
Figure 7: Total capacity of glazed flat-plate and evacuated tube collectors in operation in kWth
per 1,000 inhabitants by the end of 2009

3.3 Total capacity of glazed water collectors by economic region at the end of 2009
13
SOLAR HEAT WORLDWIDE 2011
101,500
30,209
4,613 4,004 3,454 3,402 1,880 1,869 524
0
20,000
40,000
60,000
80,000
100,000
120,000
China Europe Asia Japan Middle East Central +
South America
United States
+ Canada
Australia +
NewZealand
Africa
Total capacity [MW ]th
Africa: Namibia, South Africa, Tunisia, ZimbabweAsia: India, South Korea, Taiwan, ThailandCentral + South America: Barbados, Brazil, Chile, Mexico, Uruguay
Europe: EU 27, Albania, Former Yugoslav Republicof Macedonia, Norway, Switzerland, Turkey
Middle East: Israel, Jordan
Figure 8: Total capacity of glazed flat-plate and evacuated tube collectors in operationby economic region at the end of 2009
Central +
South America
United States
+ Canada
Australia +
NewZealand
255.8
76.7 73.4
50.9
31.5
10.3 7.2 5.5 3.6
0
50
100
150
200
250
300
Middle East China Europe Japan Africa Asia
Total capacity per 1000 inhabitants [kW /1000 inhabitants]th
Africa: Namibia, South Africa, Tunisia, ZimbabweAsia: India, South Korea, Taiwan, ThailandCentral + South America: Barbados, Brazil, Chile, Mexico, Uruguay
Europe: EU 27, Albania, Former Yugoslav Republicof Macedonia, Norway, Switzerland, Turkey
Middle East: Israel, Jordan
Figure 9: Total capacity of glazed flat-plate and evacuated tube collectors in operation by economic region and inkWth per 1,000 inhabitants by the end of 2009
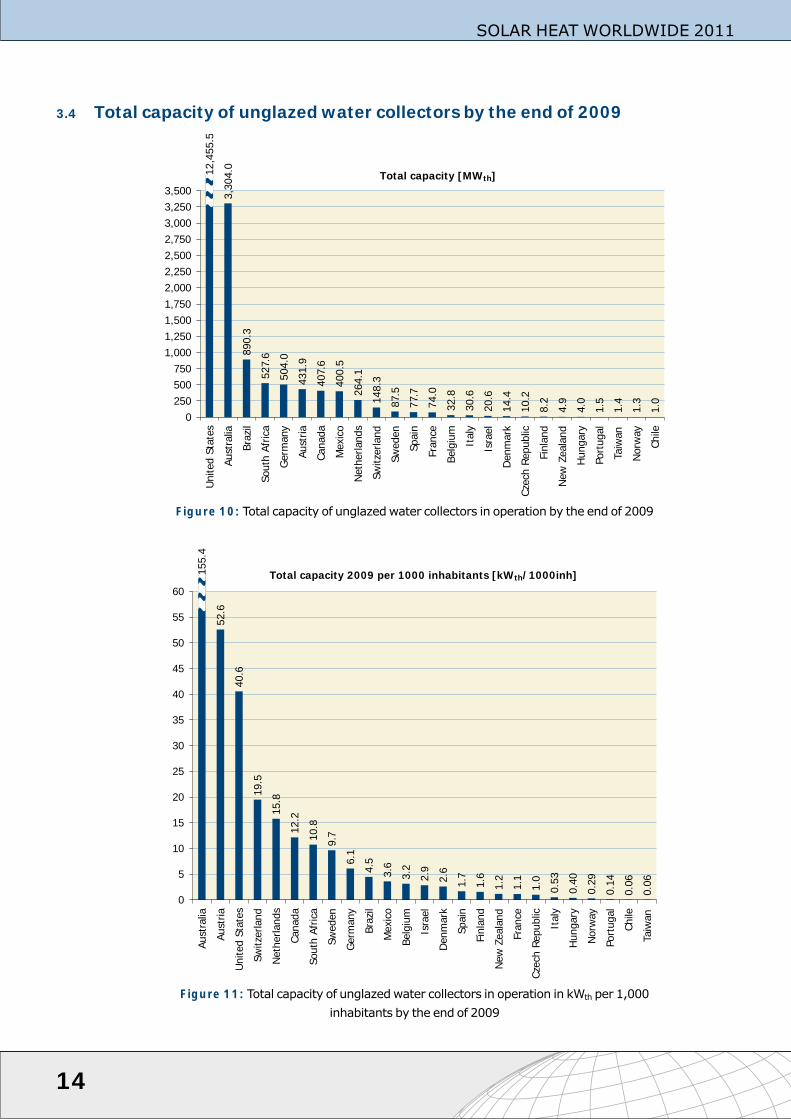
3.4 Total capacity of unglazed water collectors by the end of 2009
14
SOLAR HEAT WORLDWIDE 2011
527.6
504.0
407.6
400.5
264.1
148.3
87.5
77.7
74.0
20.6
14.4
10.2
8.2
4.9
4.0
1.5
1.4
1.3
1.0
3,3
04.0
431.9
890.3
32.8
30.6
0
250
500
750
1,000
1,250
1,500
1,750
2,000
2,250
2,500
2,750
3,000
3,250
3,500
United
Sta
tes
Austr
alia
Bra
zil
South
Afr
ica
Germ
any
Austr
ia
Canada
Mexic
o
Neth
erla
nds
Sw
itzerland
Sw
eden
Spain
Fra
nce
Belg
ium
Ita
ly
Isra
el
Denm
ark
Czech
Republic
Fin
land
New
Zeala
nd
Hungary
Port
ugal
Taiw
an
Norw
ay
Chile
Total capacity [MW ]th
12,4
55.5
Figure 10: Total capacity of unglazedwater collectors in operation by the end of 2009
52.6
19.5
15.8
10.8
9.7
6.1
4.5
3.6
3.2
2.9
1.6
1.2
1.1
1.0
0.5
3
0.4
0
0.2
9
0.1
4
0.0
6
0.0
6
1.72.6
12.2
40.6
0
5
10
15
20
25
30
35
40
45
50
55
60
Austr
alia
Austr
ia
United
Sta
tes
Sw
itzerland
Neth
erlands
Canada
South
Afr
ica
Sw
eden
Germ
any
Bra
zil
Mexic
o
Belg
ium
Isra
el
Denm
ark
Spain
Fin
land
New
Zeala
nd
Fra
nce
Czech
Republic
Ita
ly
Hungary
Norw
ay
Port
ugal
Chile
Taiw
an
Total capacity 2009 per 1000 inhabitants [kW /1000inh]th
155.4
Figure 11: Total capacity of unglazedwater collectors in operation in kWth per 1,000inhabitants by the end of 2009
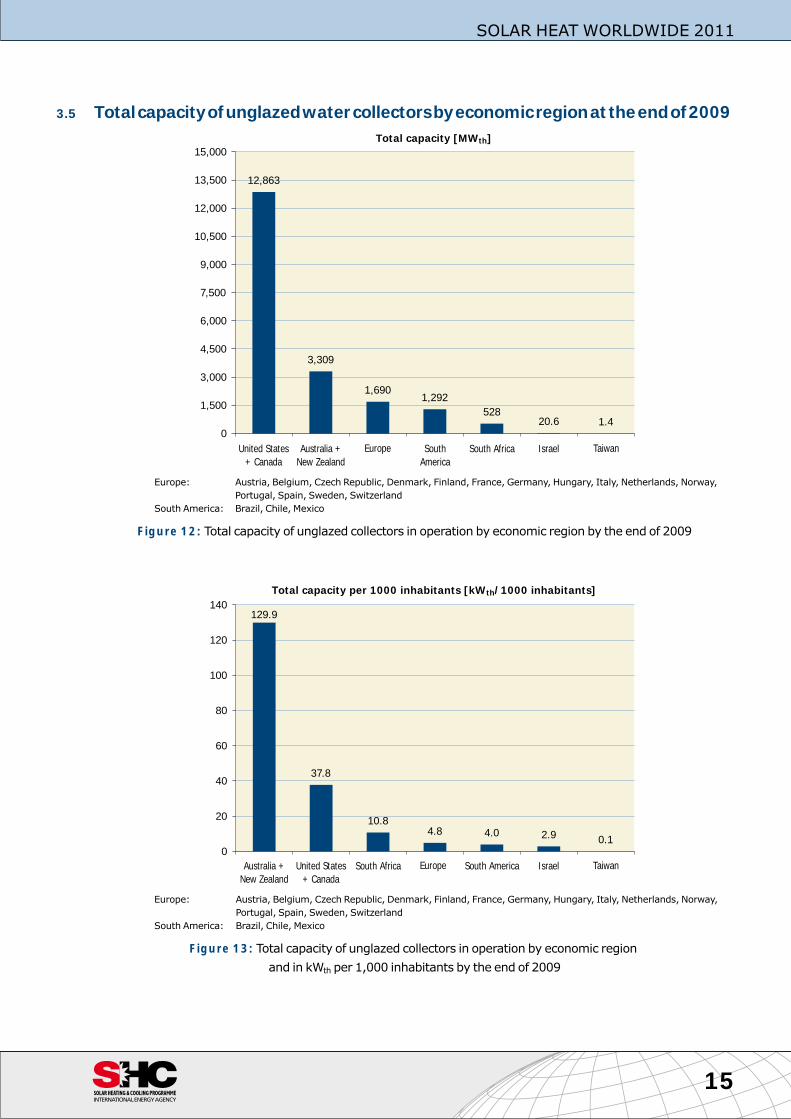
3.5 Totalcapacityofunglazedwatercollectorsbyeconomicregionattheendof2009
15
SOLAR HEAT WORLDWIDE 2011
12,863
3,309
1,6901,292
52820.6 1.4
0
1,500
3,000
4,500
6,000
7,500
9,000
10,500
12,000
13,500
15,000
Europe South
America
South Africa Israel Taiwan
Total capacity [MW ]th
Australia +
New Zealand
United States
+ Canada
Europe: Austria, Belgium, Czech Republic, Denmark, Finland, France, Germany, Hungary, Italy, Netherlands, Norway,Portugal, Spain, Sweden, Switzerland
South America: Brazil, Chile, Mexico
Figure 12: Total capacity of unglazed collectors in operation by economic region by the end of 2009
37.8
10.8
4.8 4.0 2.9
129.9
0.1
0
20
40
60
80
100
120
140
Australia +
New Zealand
United States
+ Canada
South Africa Europe South America Israel Taiwan
Total capacity per 1000 inhabitants [kW /1000 inhabitants]th
Europe: Austria, Belgium, Czech Republic, Denmark, Finland, France, Germany, Hungary, Italy, Netherlands, Norway,Portugal, Spain, Sweden, Switzerland
South America: Brazil, Chile, Mexico
Figure 13: Total capacity of unglazed collectors in operation by economic regionand in kWth per 1,000 inhabitants by the end of 2009

4 Market development of the newly installed capacity
In theyear2009a total capacityof36.5 GWth corresponding to52.1millionsquaremetersof solar collectorswere in-stalled worldwide. This means an increase in new collector installations of 25.3% compared to the year 2008.
Themain driver for the above averagemarket growth in 2009was China, whereas in key Europeanmarkets as wellas in the United States and other important economic regions, such as in Japan, the solar thermal sector sufferedfrom the economic downturn, resulting in stagnating or decreasing local markets.
4.1 General market overview of newly installed systems in 2009
Themainmarkets forglazedandunglazedwaterandair collectorsworldwidewere inChina(29.40 GWth)andEurope(3.7 GWth), which together account for 90.8% of the overall new collector installations in 2009.
The rest of the market is shared between the United States and Canada (0.82 GWth), Australia and New Zealand(0.82 GWth), Central and South America represented by Barbados, Brazil, Chile, Mexico and Uruguay (0.74 GWth),the Asian countries of India, South Korea, Taiwan and Thailand (0.52 GWth), the Middle East represented by IsraelandJordan(0.22 GWth),Africa representedbyNamibia,SouthAfrica,TunisiaandZimbabwe(0.12 GWth;)andJapan(0.11 GWth).
The total capacity is divided into 6.33 GWth glazed flat-plate collectors (9.04 million square meters), 28.56 GWth
evacuated tube collectors (40.80million square meters), 1.53 GWth unglazed water collectors (2.19million squaremeters) and 0.05 GWth glazed and unglazed air collectors (0.08million square meters) (Table 3 and Table 4).
In theAppendix, the tables containingdataof the installed collector area for theyears2007and2008 (Table15andTable 16) can be found as well as the total installed collector area in 2008 (Table 17).
16
SOLAR HEAT WORLDWIDE 2011
China
80.6%
Europe
10.2%
United States + Canada 2.3%
Australia + New Zealand 2.2%
Central + South America 2.0%
Asia 1.4%
Middle East 0.6%
Africa 0.3%
Japan 0.3%
Others
9.2%
Africa: Namibia, South Africa, Tunisia, ZimbabweAsia: India, South Korea, Taiwan, ThailandCentral + South America: Barbados, Brazil, Chile, Mexico, Uruguay
Europe: EU 27, Albania, Former Yugoslav Republicof Macedonia, Norway, Switzerland, Turkey
Middle East: Israel, Jordan
Figure 14:Share of the newly installed capacity (glazed and unglazedwater and air collectors)by economic regions in 2009

CountryWater Collectors* Air Collectors*
TOTAL [MWth/a]unglazed glazed evacuated tube unglazed glazed
Albania 7.0 0.1 7.1
Australia 434.0 338.1 25.4 797.6
Austria 5.8 243.9 5.4 0.3 255.4
Barbados 4.9 4.9
Belgium 31.9 3.6 35.5
Brazil 284.9 273.8 558.7
Bulgaria 5.6 5.6
Canada 51.1 6.4 0.8 31.7 0.6 90.6
Chile 6.3 6.3
China 1,400.0 28,000.0 29,400.0
Cyprus 37.1 1.4 38.5
Czech Republic 21.0 7.0 28.0
Denmark 36.4 1.8 38.2
Estonia 0.04 0.3 0.3
Finland 2.0 0.8 2.8
France 185.5 185.5
FYRM 2.1 0.0 2.1
Germany 1,001.0 129.5 1,130.5
Greece 143.2 1.1 144.2
Hungary 2.1 9.8 5.6 0.4 0.14 18.0
India 263.6 121.4 385.0
Ireland 18.5 11.3 29.8
Israel* 2.0 186.5 188.5
Italy 4.9 283.8 47.3 336.0
Japan 97.9 1.2 8.5 107.5
Jordan 21.3 6.4 27.7
Korea, South* 48.1 48.1
Lativa 0.03 0.10 0.1
Lithuania 0.04 0.11 0.1
Luxembourg 2.6 0.7 3.3
Malta 3.1 2.9 6.0
Mexico 52.9 57.4 49.3 3.8 163.3
Namibia 2.8 0.2 3.0
Netherlands 20.2 31.7 51.9
New Zealand* 0.3 17.2 17.6
Norway 0.2 1.2 0.15 1.5
Poland 74.5 26.5 101.0
Portugal 1.1 91.0 9.5 101.5
Romania 7.7 6.3 14.0
Slovak Republic 8.1 1.3 9.5
Slovenia 11.9 3.5 15.4
South Africa 37.8 21.3 2.5 61.6
Spain 7.7 262.5 11.2 281.4
Sweden 17.5 9.2 5.7 32.4
Switzerland 8.4 94.7 7.2 7.7 118.1
Taiwan 72.9 8.6 81.6
Thailand* 10.3 10.3
Tunisia 49.1 10.4 59.5
Turkey 668.5 668.5
United Kingdom 36.4 26.0 62.4
United States 599.6 111.6 18.7 1.3 731.2
Uruguay* 5.1 5.1
Zimbabwe 0.2 0.1 0.2
TOTAL 1,530.5 6,326.5 28,561.3 40.0 14.2 36,472.5
FYRM Former Yugoslav Republic of Macedonia* If no data is given: no reliable database for this collector type is available** Estimated data (Israel, South Korea, New Zealand, Thailand, Uruguay. Based on data of previous years)*** Unglazed air collectors in Switzerland: this is a very simple site-built system for hay drying
Table 3:Newly installed capacity in 2009 [MWth/a]
17
SOLAR HEAT WORLDWIDE 2011

CountryWater Collectors* Air Collectors*
TOTAL [m²]unglazed glazed evacuated tube unglazed glazed
Albania 10,035 116 10,151
Australia 620,000 483,019 36,356 1,139,375
Austria 8,342 348,408 7,759 378 364,886
Barbados 7,051 7,051
Belgium 45,500 5,200 50,700
Brazil 407,051 391,089 798,140
Bulgaria 8,000 8,000
Canada 73,026 9,186 1,083 45,331 792 129,418
Chile 9,000 9,000
China 2,000,000 40,000,000 42,000,000
Cyprus 53,000 2,000 55,000
Czech Republic 30,000 10,000 40,000
Denmark 52,000 2,500 54,500
Estonia 60 390 450
Finland 2,800 1,200 4,000
France 265,000 265,000
FYRM 3,002 4 3,006
Germany 1,430,000 185,000 1,615,000
Greece 204,500 1,500 206,000
Hungary 3,000 14,000 8,000 500 200 25,700
India 376,505 173,495 550,000
Ireland 26,383 16,131 42,514
Israel* 2,795 266,446 269,241
Italy 7,046 405,389 67,565 480,000
Japan 139,821 1,682 12,110 153,613
Jordan 30,435 9,091 39,526
Korea, South* 68,680 68,680
Lativa 40 140 180
Lithuania 50 150 200
Luxembourg 3,650 1,050 4,700
Malta 4,386 4,122 8,508
Mexico 75,501 82,002 70,430 5,403 233,336
Namibia 3,979 244 4,224
Netherlands 28,814 45,260 74,074
New Zealand* 481 24,614 25,095
Norway 270 1,680 210 2,160
Poland 106,494 37,814 144,308
Portugal 1,500 130,000 13,500 145,000
Romania 11,000 9,000 20,000
Slovak Republic 11,600 1,900 13,500
Slovenia 17,000 5,000 22,000
South Africa 54,000 30,396 3,604 88,000
Spain 11,000 375,000 16,000 402,000
Sweden 24,993 13,126 8,183 46,302
Switzerland 12,057 135,355 10,285 11,000 168,697
Taiwan 104,214 12,305 116,519
Thailand* 14,650 14,650
Tunisia 70,188 14,812 85,000
Turkey 955,000 955,000
United Kingdom 51,975 37,125 89,100
United States 856,517 159,471 26,728 1,793 1,044,509
Uruguay* 7,235 7,235
Zimbabwe 217 138 355
TOTAL 2,186,393 9,037,891 40,801,807 57,209 20,302 52,103,602
FYRM Former Yugoslav Republic of Macedonia* If no data is given: no reliable database for this collector type is available** Estimated data (Israel, South Korea, New Zealand, Thailand, Uruguay. Based on data of previous years)*** Unglazed air collectors in Switzerland: this is a very simple site-built system for hay drying
Table 4:Newly Installed collector area in 2009 [m²/a]
18
SOLAR HEAT WORLDWIDE 2011

Flat-plate and evacuated tube collectors accounted for 34.9 GWth of the overallmarket in 2009, representing 95.7%of the total newly installed systems.
The distribution of the 2009 newly installed capacity by the different types of solar collectors worldwide is shown inFigure 15.
The strong Chinese market focuses on vacuum tube technology. It has been reported that more than 95% of thenewly installed systemswereequippedwith this collector type.Consequently, thegrowth ratesby typeof glazedwa-ter collector in 2009 are high for vacuum tubes (+ 34.5%) and almost stagnating (+ 2.4%) for flat plate collectors.Many of the flat plate collector manufacturers in Europe therefore faced a challenging economic year in 2009, rightafter the tremendous growth rates in 2008.
In total numbers, the newly installed capacity of glazed and unglazedwater collectors is shown in Figure 16 for the10 leadingmarkets in 2009.
19
SOLAR HEAT WORLDWIDE 2011
Air collector
0.1%
Unglazed Collector
4.2%
Evacuated tube
78.3%
Flat-plate
17.3%
Figure 15:Distribution of the newly installed capacity by collector type in 2009
1,4
00
28
,00
0
0
200
400
600
800
1,000
1,200
1,400
1,600
1,800
2,000
China Germany Australia United
States
Turkey Brazil India Italy Spain Austria
Installed Capacity [MW /a]th unglazed flat plate evacuated tube
Figure 16: Total capacity of newly installed glazed and unglazedwater collectors in the 10 leading countries in 2009
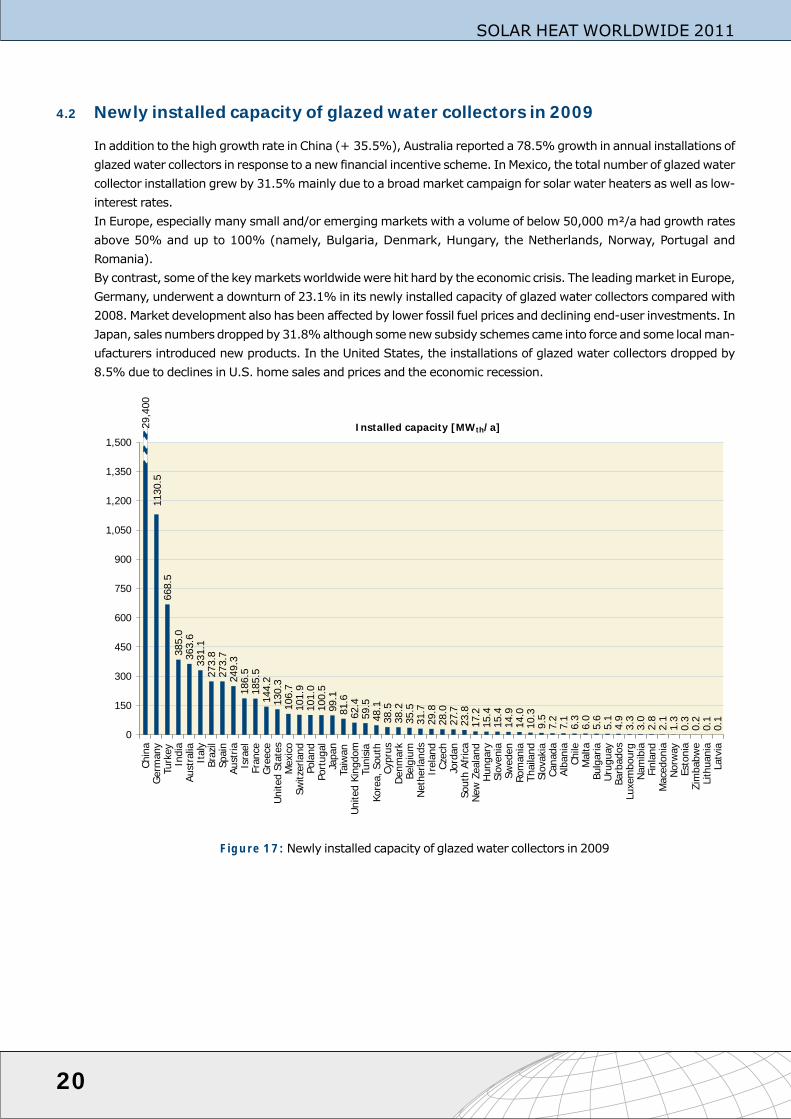
4.2 Newly installed capacity of glazed water collectors in 2009
In addition to the high growth rate in China (+ 35.5%), Australia reported a 78.5%growth in annual installations ofglazedwater collectors in response to a new financial incentive scheme. InMexico, the total number of glazedwatercollector installation grew by 31.5%mainly due to a broadmarket campaign for solar water heaters as well as low-interest rates.In Europe, especially many small and/or emerging markets with a volume of below 50,000 m²/a had growth ratesabove 50% and up to 100% (namely, Bulgaria, Denmark, Hungary, the Netherlands, Norway, Portugal andRomania).By contrast, someof the keymarketsworldwidewere hit hard by the economic crisis. The leadingmarket in Europe,Germany, underwent a downturn of 23.1% in its newly installed capacity of glazed water collectors compared with2008. Market development also has been affected by lower fossil fuel prices and declining end-user investments. InJapan, sales numbers droppedby31.8%although somenewsubsidy schemes came into force and some localman-ufacturers introduced new products. In the United States, the installations of glazed water collectors dropped by8.5% due to declines in U.S. home sales and prices and the economic recession.
20
SOLAR HEAT WORLDWIDE 2011
668.5
385.0
363.6
331.1
273.8
273.7
249.3
186.5
185.5
144.2
130.3
106.7
101.9
101.0
100.5
99.1
81.6
62.4
59.5
48.1
38.5
38.2
35.5
31.7
29.8
28.0
27.7
23.8
17.2
15.4
15.4
14.9
14.0
10.3
9.5
7.2
7.1
6.3
6.0
5.6
5.1
4.9
3.3
3.0
2.8
2.1
1.3
0.3
0.2
0.1
0.1
1130.5
0
150
300
450
600
750
900
1,050
1,200
1,350
1,500
Chin
a
Germ
any
Turk
ey
India
Austr
alia
Ita
ly
Bra
zil
Spain
Austr
ia
Isra
el
Fra
nce
Gre
ece
United
Sta
tes
Mexic
o
Sw
itzerland
Pola
nd
Port
ugal
Japan
Taiw
an
United
Kin
gdom
Tunis
ia
Kore
a,South
Cypru
s
Denm
ark
Belg
ium
Neth
erlands
Ire
land
Czech
Jord
an
South
Afr
ica
New
Zeala
nd
Hungary
Slo
venia
Sw
eden
Rom
ania
Thailand
Slo
vakia
Canada
Alb
ania
Chile
Malta
Bulg
aria
Uru
guay
Barb
ados
Luxem
bourg
Nam
ibia
Fin
land
Macedonia
Norw
ay
Esto
nia
Zim
babw
e
Lithuania
Latv
ia
Installed capacity [MW /a]th
29,4
00
Figure 17:Newly installed capacity of glazedwater collectors in 2009

21
SOLAR HEAT WORLDWIDE 2011
25.8
22.2
17.3
17.1
14.7
13.7
13.4
13.4
9.4
8.7
7.7
6.9
6.7
6.5
5.9
5.7
5.7
4.4
4.1
3.6
3.4
2.9
2.7
2.6
2.4
1.9
1.7
1.6
1.5
1.4
1.4
1.4
1.0
1.0
1.0
1.0
0.8
0.8
0.6
0.5
0.5
0.4
0.4
0.3
0.3
0.2
0.2
0.2
0.1
0.0
2
0.0
4
30.4
35.5
0
3
6
9
12
15
18
21
24
27
30
33
36Cypru
s
Austr
ia
Isra
el
Chin
a
Barb
ados
Austr
alia
Malta
Germ
any
Gre
ece
Sw
itzerland
Port
ugal
Turk
ey
Slo
venia
Denm
ark
Luxem
bourg
Ire
land
Spain
Ita
ly
Tunis
ia
Jord
an
New
Zeala
nd
Taiw
an
Belg
ium
Fra
nce
Czech
Republic
Pola
nd
Alb
ania
Neth
erlands
Slo
vakia
Sw
eden
Hungary
Uru
guay
Nam
ibia
Bra
zil
Macedonia
United
Kin
gdom
Kore
a,South
Mexic
o
Japan
Bulg
aria
Rom
ania
Fin
land
South
Afr
ica
United
Sta
tes
Chile
India
Norw
ay
Esto
nia
Canada
Thailand
Latv
ia
Lithuania
Zim
babw
e
Installed capacity 2009 [kW /a/1,000 inh]th
Figure 18:Newly installed capacity of glazedwater collectors in 2009 in kWth per 1,000 inhabitants

4.3 Market development of glazed water collectors between 2000 and 2009
Analysis of theworldwidemarket of glazedwater collectors shows in an impressiveway that themarket evolution ischaracterized by an over proportional growth (see Figure 19 for the period between 2000 and 2009).
Between 2004 and 2009 the annually installed glazed water collector area worldwide almost tripled. The worldwideaverage annual growth rate between 2000 and 2009 was 20.8%.
Compared to the year 2008, theworldwidemarket for glazedwater collectors grew by 27.3% in 2009 (compared to36.5% in the period 2007/2008).
Regardless of the downturns in the European (–9.9%), Middle Eastern (–6.7%) and North American (–9.8%)mar-kets, the Chinesemarket (+ 35.5%) and to a certain extent the strong Australianmarket (+ 78.5%) is responsiblefor the above average growth in 2009.
22
SOLAR HEAT WORLDWIDE 2011
Annual installed capacity [MW /a]th
0
3,000
6,000
9,000
12,000
15,000
18,000
21,000
24,000
27,000
30,000
33,000
36,000
2000 2001 2002 2003 2004 2005 2006 2007 2008 2009
Africa
Japan
United States and Canada
Middle East
Australia and New Zealand
Central and South America
Asia
Europe
China
Africa: Namibia, South Africa, Tunisia, ZimbabweAsia: India, South Korea, Taiwan, ThailandCentral + South America: Barbados, Brazil, Chile, Mexico, Uruguay
Europe: EU 27, Albania, Former Yugoslav Republicof Macedonia, Norway, Switzerland, Turkey
Middle East: Israel, Jordan
Figure 19:Annually installed capacity of flat-plate and evacuated tube collectors from2000 to 2009

For 2009 the “Top 10” countries in terms of newly installed glazedwater capacity per 1,000 inhabitants are shown inFigure 21.
23
SOLAR HEAT WORLDWIDE 2011
2000 2001 2002 2003 2004 2005 2006 2007 2008 2009
Africa
Japan
United States and Canada
Middle East
Australia and New Zealand
Central and South America
Asia
Europe
China
Annually installed capacity [kW /a/1,000 inhabitants]th
0.0
2.5
5.0
7.5
10.0
12.5
15.0
17.5
20.0
22.5
Africa: Namibia, South Africa, Tunisia, ZimbabweAsia: India, South Korea, Taiwan, ThailandCentral + South America: Barbados, Brazil, Chile, Mexico, Uruguay
Europe: EU 27, Albania, Former Yugoslav Republicof Macedonia, Norway, Switzerland, Turkey
Middle East: Israel, Jordan
Figure 20:Annually installed capacity of flat-plate andevacuated tube collectors in kWth per 1,000 inhabitants from2000 to 2009
0
5
10
15
20
25
30
35
40
Cyprus Austria Israel China Barbados Australia Malta Germany Greece Switzerland
Installed Capacity [kW /a/1,000 inhabitants]th
flat plate collector evacuated tube collector
Figure 21:Newly installed capacity of glazedwater collectors per 1,000 inhabitantsin the 10 leading countries 2009

4.4 Market development of unglazed water collectors between 2000 and 2009
The worldwidemarket of unglazed collectors recorded a significant increase in 2001 and remained steady between2001and2003.Afteraslight increase from2004to2006, the installedcapacity ratedecreasedagain in2007,mainlydue to themajor market decline in the United States and Canada.In 2008, significant growth was recorded in Brazil, Canada and South Africa while all other markets remained quitestable. In2009, itwasmoreor lessonlyBrazil (+ 45.9%)andMexico (+ 51.9%) thatgained fromahighgrowth ratewhile the general trend for unglazed water collectors was stagnating or falling.In total, new installations of unglazed water collectors decreased significantly by 7.7% in 2009 compared to 2008,accounting for 1.5 GWth representing 2.2 million of squaremeters in 2009 compared to an increase of 13.9% in theperiod 2007/2008.
In theUnitedStatesandAustralia, unglazedcollectorshavea longhistoryandstill playan important role, butemerg-ing players, especially countries from South America (namely Brazil and Mexico) and South Africa are benefittingfrom this low cost technology that fits perfectly to the moderate climate conditions. Nevertheless, in case of theUnited States (–23.9%), Canada (–18.5%) and South Africa (–46.1%) a vast decrease of unglazed water collectorinstallations were reported in 2009.
In other largemarkets, such as China, Turkey, India and Japan, unglazed collectors almost do not exist. In Europe,the annual installations of unglazed collectors are far below 5%of the total newly installed collector area, and in theperiod 2008/2009 unglazed water collector installations further dropped by 20.5% to a total installed capacity of68.0 MWth.
24
SOLAR HEAT WORLDWIDE 2011
0
200
400
600
800
1,000
1,200
1,400
1,600
1,800
2000 2001 2002 2003 2004 2005 2006 2007 2008 2009
Annual installed capacity [MW /a]th
South Africa
Europe
South America (Brazil, Mexico)
Australia and New Zealand
United States and Canada
Europe (new installations 2009): Austria, Hungary, Netherlands, Norway, Portugal, Spain, Sweden, Switzerland
Figure 22:Annually installed capacity of unglazedwater collectors from2000 to 2009

5 Contribution to the energy supply and CO2 reduction
In this section, the contribution of the total installed glazedandunglazedwater collectors in operation to the thermalenergy supply and CO2 reduction is shown.
The basis for these calculations is the total glazed and unglazed water collector area in operation in each country asshown inTable1. The correspondingannual energyyields, energy savings in termsof oil equivalents andCO2 savingsare calculated bymeans of the simulation tool T-Sol expert 4.5 [T-Sol, Version 4.5 Expert, Valentin Energiesoftware,www.valentin.de].
Theannual collector yieldof allwater-basedsolar thermal systems inoperationby theendof2009 in the53 recordedcountries is 141,775 GWh (= 510,338 TJ). This corresponds to an oil equivalent of 14.4million tons and an annualCO2 savings of 46.1 million tons.
For glazedwater collectors, the total installed capacity in operation in2009of 151.5 GWth led to anannual solar ther-mal collector yield of 130,668 GWh (= 470,406 TJ/a). This corresponds to annual oil savings of 13.4 million tons re-spectively to annual CO2 savings of 42.8 million tons.
For unglazed water collectors, the total installed capacity in operation in 2009 of 19.7 GWth led to an annual solarthermal collector yield of 11,106 GWh(= 39,983 TJ/a). This corresponds to annual oil savingsof 1.0 million tons re-spectively to annual CO2 savings of 3.3 million tons.
The contribution of the total installed air collector capacity in operation in 2009 (1.2 GWth)wasnot taken into consid-eration – with a share of about 0.7% of the total installed collector capacity air collectors were omitted from thecalculation.
Within thestandardizationofdefinitions for renewableheatbyEUROSTATandIEASHC,anewcalculationmethod forthe annual solar yield was used for this report:
“Solar thermal production (solar yield) is equal to the solar collector output”.
This new definition led to higher annual solar yields than reported in previous publications.
Please find the issue of the methodology in the appendix (see Chapter 7.1).
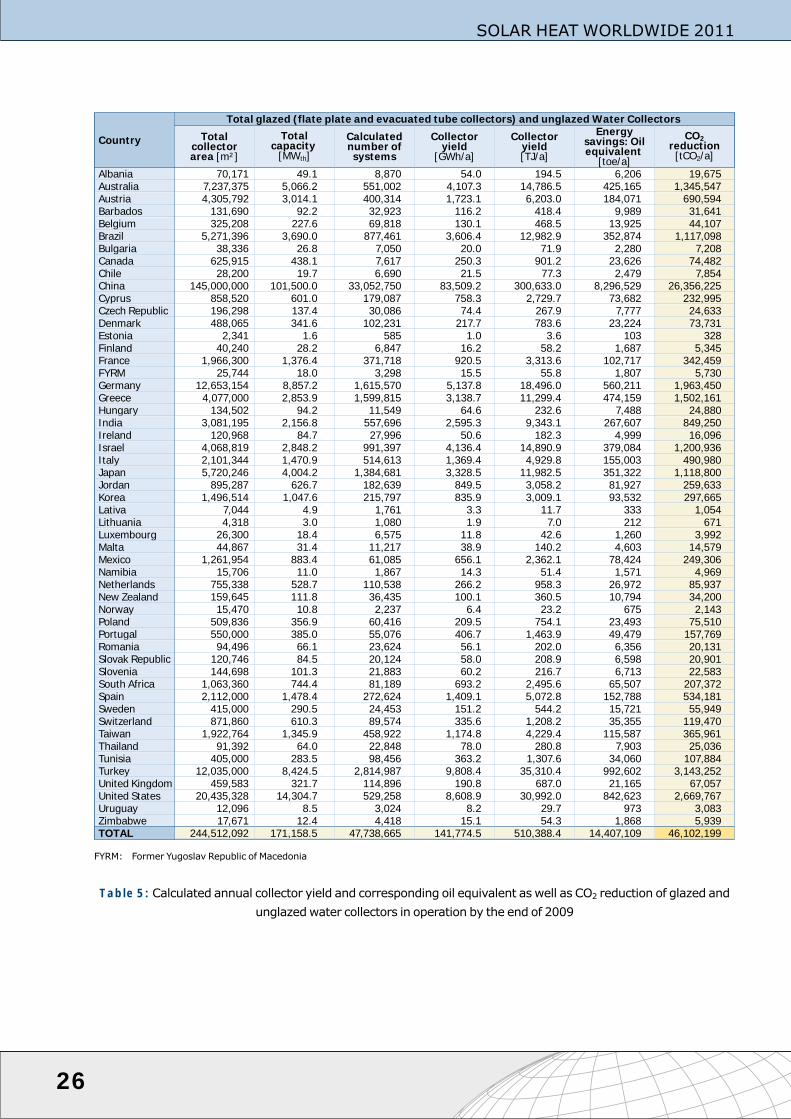
Table 5 summarizes the calculatedannual collector yields and the correspondingoil equivalents andCO2 reductionsofall solar thermal systems(systems forhotwater, spaceheatingandswimmingpool heating) installedby theendof2009.
Table 6 and Table 7 show the results for glazed and unglazed water collectors.
In Chapters 5.1 to 5.3, the annual collector yield, energy savings and CO2 savings by economic regions for totalnumbers and per 1,000 inhabitants are graphed.
25
SOLAR HEAT WORLDWIDE 2011
Country
Total glazed (flate plate and evacuated tube collectors) and unglazed Water Collectors
Total
collector
area [m²]
Total
capacity
[MWth]
Calculated
number of
systems
Collector
yield
[GWh/a]
Collector
yield
[TJ/a]
Energy
savings: Oil
equivalent
[toe/a]
CO2
reduction
[tCO2/a]
Albania 70,171 49.1 8,870 54.0 194.5 6,206 19,675
Australia 7,237,375 5,066.2 551,002 4,107.3 14,786.5 425,165 1,345,547
Austria 4,305,792 3,014.1 400,314 1,723.1 6,203.0 184,071 690,594
Barbados 131,690 92.2 32,923 116.2 418.4 9,989 31,641
Belgium 325,208 227.6 69,818 130.1 468.5 13,925 44,107
Brazil 5,271,396 3,690.0 877,461 3,606.4 12,982.9 352,874 1,117,098
Bulgaria 38,336 26.8 7,050 20.0 71.9 2,280 7,208
Canada 625,915 438.1 7,617 250.3 901.2 23,626 74,482
Chile 28,200 19.7 6,690 21.5 77.3 2,479 7,854
China 145,000,000 101,500.0 33,052,750 83,509.2 300,633.0 8,296,529 26,356,225
Cyprus 858,520 601.0 179,087 758.3 2,729.7 73,682 232,995
Czech Republic 196,298 137.4 30,086 74.4 267.9 7,777 24,633
Denmark 488,065 341.6 102,231 217.7 783.6 23,224 73,731
Estonia 2,341 1.6 585 1.0 3.6 103 328
Finland 40,240 28.2 6,847 16.2 58.2 1,687 5,345
France 1,966,300 1,376.4 371,718 920.5 3,313.6 102,717 342,459
FYRM 25,744 18.0 3,298 15.5 55.8 1,807 5,730
Germany 12,653,154 8,857.2 1,615,570 5,137.8 18,496.0 560,211 1,963,450
Greece 4,077,000 2,853.9 1,599,815 3,138.7 11,299.4 474,159 1,502,161
Hungary 134,502 94.2 11,549 64.6 232.6 7,488 24,880
India 3,081,195 2,156.8 557,696 2,595.3 9,343.1 267,607 849,250
Ireland 120,968 84.7 27,996 50.6 182.3 4,999 16,096
Israel 4,068,819 2,848.2 991,397 4,136.4 14,890.9 379,084 1,200,936
Italy 2,101,344 1,470.9 514,613 1,369.4 4,929.8 155,003 490,980
Japan 5,720,246 4,004.2 1,384,681 3,328.5 11,982.5 351,322 1,118,800
Jordan 895,287 626.7 182,639 849.5 3,058.2 81,927 259,633
Korea 1,496,514 1,047.6 215,797 835.9 3,009.1 93,532 297,665
Lativa 7,044 4.9 1,761 3.3 11.7 333 1,054
Lithuania 4,318 3.0 1,080 1.9 7.0 212 671
Luxembourg 26,300 18.4 6,575 11.8 42.6 1,260 3,992
Malta 44,867 31.4 11,217 38.9 140.2 4,603 14,579
Mexico 1,261,954 883.4 61,085 656.1 2,362.1 78,424 249,306
Namibia 15,706 11.0 1,867 14.3 51.4 1,571 4,969
Netherlands 755,338 528.7 110,538 266.2 958.3 26,972 85,937
New Zealand 159,645 111.8 36,435 100.1 360.5 10,794 34,200
Norway 15,470 10.8 2,237 6.4 23.2 675 2,143
Poland 509,836 356.9 60,416 209.5 754.1 23,493 75,510
Portugal 550,000 385.0 55,076 406.7 1,463.9 49,479 157,769
Romania 94,496 66.1 23,624 56.1 202.0 6,356 20,131
Slovak Republic 120,746 84.5 20,124 58.0 208.9 6,598 20,901
Slovenia 144,698 101.3 21,883 60.2 216.7 6,713 22,583
South Africa 1,063,360 744.4 81,189 693.2 2,495.6 65,507 207,372
Spain 2,112,000 1,478.4 272,624 1,409.1 5,072.8 152,788 534,181
Sweden 415,000 290.5 24,453 151.2 544.2 15,721 55,949
Switzerland 871,860 610.3 89,574 335.6 1,208.2 35,355 119,470
Taiwan 1,922,764 1,345.9 458,922 1,174.8 4,229.4 115,587 365,961
Thailand 91,392 64.0 22,848 78.0 280.8 7,903 25,036
Tunisia 405,000 283.5 98,456 363.2 1,307.6 34,060 107,884
Turkey 12,035,000 8,424.5 2,814,987 9,808.4 35,310.4 992,602 3,143,252
United Kingdom 459,583 321.7 114,896 190.8 687.0 21,165 67,057
United States 20,435,328 14,304.7 529,258 8,608.9 30,992.0 842,623 2,669,767
Uruguay 12,096 8.5 3,024 8.2 29.7 973 3,083
Zimbabwe 17,671 12.4 4,418 15.1 54.3 1,868 5,939
TOTAL 244,512,092 171,158.5 47,738,665 141,774.5 510,388.4 14,407,109 46,102,199
FYRM: Former Yugoslav Republic of Macedonia
Table 5:Calculated annual collector yield and corresponding oil equivalent as well as CO2 reduction of glazed andunglazedwater collectors in operation by the end of 2009
26
SOLAR HEAT WORLDWIDE 2011

Country
Glazed (flate plate and evacuated tube collectors) Water Collectors
Total
collector
area [m²]
Total
capacity
[MWth]
Calculated
number of
systems
Collector
yield
[GWh/a]
Collector
yield
[TJ/a]
Energy
savings: Oil
equivalent
[toe/a]
CO2
reduction
[tCO2/a]
Albania 70,171 49.1 8,870 54.0 194.5 6,206 19,675
Australia 2,517,375 1,762.2 412,178 1,907.3 6,866.3 220,978 699,975
Austria 3,688,840 2,582.2 397,229 1,548.2 5,573.4 167,487 637,885
Barbados 131,690 92.2 32,923 116.2 418.4 9,989 31,641
Belgium 278,333 194.8 69,583 117.8 424.2 12,783 40,498
Brazil 3,999,547 2,799.7 871,101 3,130.0 11,268.1 312,277 988,752
Bulgaria 38,336 26.8 7,050 20.0 71.9 2,280 7,208
Canada 43,564 30.5 4,705 25.4 91.3 2,836 8,954
Chile 26,730 18.7 6,683 20.6 74.2 2,399 7,600
China 145,000,000 101,500.0 33,052,750 83,509.2 300,633.0 8,296,529 26,356,225
Cyprus 858,520 601.0 179,087 758.3 2,729.7 73,682 232,995
Czech Republic 181,677 127.2 30,013 70.0 251.9 7,366 23,330
Denmark 467,550 327.3 102,128 211.6 761.8 22,638 71,889
Estonia 2,341 1.6 585 1.0 3.6 103 328
Finland 28,461 19.9 6,788 12.5 45.2 1,336 4,232
France 1,860,601 1,302.4 371,190 885.8 3,188.8 99,387 331,960
FYRM 25,744 18.0 3,298 15.5 55.8 1,807 5,730
Germany 11,933,154 8,353.2 1,611,970 4,912.0 17,683.2 538,438 1,894,993
Greece 4,077,000 2,853.9 1,599,815 3,138.7 11,299.4 474,159 1,502,161
Hungary 128,814 90.2 11,520 62.7 225.6 7,309 24,314
India 3,081,195 2,156.8 557,696 2,595.3 9,343.1 267,607 849,250
Ireland 120,968 84.7 27,996 50.6 182.3 4,999 16,096
Israel 4,039,324 2,827.5 991,250 4,119.6 14,830.6 377,548 1,196,080
Italy 2,057,578 1,440.3 514,395 1,350.1 4,860.2 153,220 485,347
Japan 5,720,246 4,004.2 1,384,681 3,328.5 11,982.5 351,322 1,118,800
Jordan 895,287 626.7 182,639 849.5 3,058.2 81,927 259,633
Korea 1,496,514 1,047.6 215,797 835.9 3,009.1 93,532 297,665
Lativa 7,044 4.9 1,761 3.3 11.7 333 1,054
Lithuania 4,318 3.0 1,080 1.9 7.0 212 671
Luxembourg 26,300 18.4 6,575 11.8 42.6 1,260 3,992
Malta 44,867 31.4 11,217 38.9 140.2 4,603 14,579
Mexico 689,862 482.9 58,224 478.0 1,720.8 62,085 197,657
Namibia 15,706 11.0 1,867 14.3 51.4 1,571 4,969
Netherlands 378,051 264.6 108,652 163.5 588.6 17,147 54,815
New Zealand 152,620 106.8 36,400 97.2 350.0 10,517 33,322
Norway 13,550 9.5 2,227 5.8 21.0 618 1,964
Poland 509,836 356.9 60,416 209.5 754.1 23,493 75,510
Portugal 547,918 383.5 55,066 405.8 1,460.8 49,399 157,514
Romania 94,496 66.1 23,624 56.1 202.0 6,356 20,131
Slovak Republic 120,746 84.5 20,124 58.0 208.9 6,598 20,901
Slovenia 144,698 101.3 21,883 60.2 216.7 6,713 22,583
South Africa 309,682 216.8 77,420 312.5 1,125.0 30,370 96,208
Spain 2,001,000 1,400.7 272,069 1,356.8 4,884.4 147,986 519,041
Sweden 290,000 203.0 23,828 114.3 411.6 12,151 44,689
Switzerland 660,070 462.0 88,515 277.0 997.4 29,751 101,813
Taiwan 1,920,827 1,344.6 458,912 1,174.2 4,227.2 115,531 365,783
Thailand 91,392 64.0 22,848 78.0 280.8 7,903 25,036
Tunisia 405,000 283.5 98,456 363.2 1,307.6 34,060 107,884
Turkey 12,035,000 8,424.5 2,814,987 9,808.4 35,310.4 992,602 3,143,252
United Kingdom 459,583 321.7 114,896 190.8 687.0 21,165 67,057
United States 2,641,739 1,849.2 440,290 1,718.9 6,188.2 199,919 633,264
Uruguay 12,096 8.5 3,024 8.2 29.7 973 3,083
Zimbabwe 17,671 12.4 4,418 15.1 54.3 1,868 5,939
TOTAL 216,363,633 151,454.5 47,482,700 130,668.3 470,405.8 13,375,329 42,835,926
FYRM: Former Yugoslav Republic of Macedonia
Table 6:Calculated annual collector yield and corresponding oil equivalent as well as CO2 reduction of glazedwa-ter collectors in operation by the end of 2009
27
SOLAR HEAT WORLDWIDE 2011
Country
Unglazed Water Collectors (swimming pool collectors)
Total
collector
area [m²]
Total
capacity
[MWth]
Calculated
number of
systems
Collector
yield
[GWh/a]
Collector
yield
[TJ/a]
Energy
savings: Oil
equivalent
[toe/a]
CO2
reduction
[tCO2/a]
Albania
Australia 4,720,000 3,304.0 138,824 2,200 7,920 204,187 645,572
Austria 616,952 431.9 3,085 175 630 16,584 52,709
Barbados
Belgium 46,875 32.8 234 12 44 1,142 3,609
Brazil 1,271,849 890.3 6,359 476 1,715 40,597 128,347
Bulgaria
Canada 582,351 407.6 2,912 225 810 20,790 65,528
Chile 1,470 1.0 7 1 3 80 254
China
Cyprus
Czech Republic 14,621 10.2 73 4 16 411 1,303
Denmark 20,515 14.4 103 6 22 586 1,843
Estonia
Finland 11,779 8.2 59 4 13 351 1,113
France 105,699 74.0 528 35 125 3,330 10,500
FYRM
Germany 720,000 504.0 3,600 226 813 21,773 68,457
Greece
Hungary 5,688 4.0 28 2 7 179 566
India
Ireland
Israel 29,495 20.6 147 17 60 1,536 4,855
Italy 43,766 30.6 219 19 70 1,783 5,633
Japan
Jordan
Korea
Lativa
Lithuania
Luxembourg
Malta
Mexico 572,092 400.5 2,860 178 641 16,339 51,649
Namibia
Netherlands 377,287 264.1 1,886 103 370 9,825 31,122
New Zealand 7,025 4.9 35 3 10 277 879
Norway 1,920 1.3 10 1 2 56 179
Poland
Portugal 2,082 1.5 10 1 3 80 254
Romania
Slovak Republic
Slovenia
South Africa 753,678 527.6 3,768 381 1,371 35,136 111,164
Spain 111,000 77.7 555 52 188 4,802 15,140
Sweden 125,000 87.5 625 37 133 3,570 11,260
Switzerland 211,790 148.3 1,059 59 211 5,604 17,657
Taiwan 1,937 1.4 10 1 2 56 177
Thailand
Tunisia
Turkey
United King-
dom
United States 17,793,589 12,455.5 88,968 6,890 24,804 642,704 2,036,502
Uruguay
Zimbabwe
TOTAL 28,148,459 19,703.9 255,966 11,106.3 39,982.6 1,031,780 3,266,273
FYRM: Former Yugoslav Republic of Macedonia
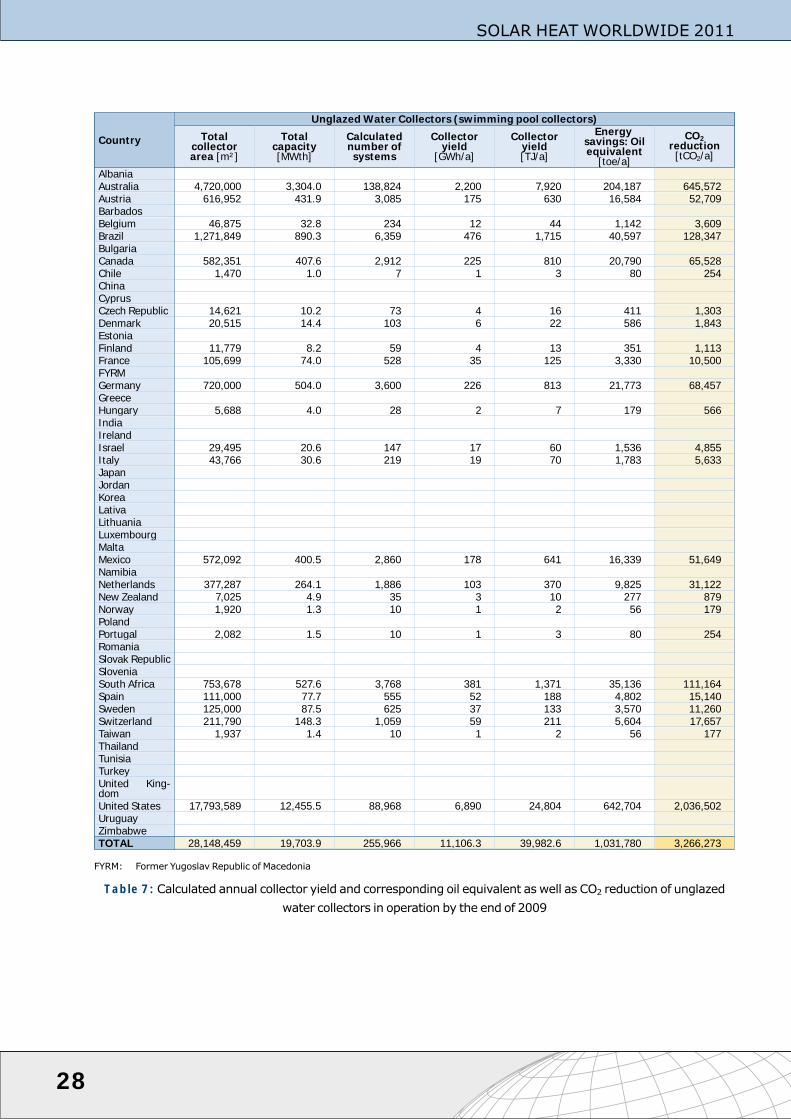
Table 7:Calculated annual collector yield and corresponding oil equivalent as well as CO2 reduction of unglazedwater collectors in operation by the end of 2009
28
SOLAR HEAT WORLDWIDE 2011

5.1 Annual collector yield by economic region
5.1.1 Collector yield of glazed flat-plate and evacuated tube collectors by economic region in 2009
29
SOLAR HEAT WORLDWIDE 2011
83,509
25,971
4,969 4,683 3,753 3,328 2,005 1,744 705
0
10,000
20,000
30,000
40,000
50,000
60,000
70,000
80,000
90,000
100,000
Collector yield [GWh/a]
Central +
South America
United States
+ Canada
Australia +
NewZealand
Europe AsiaMiddle East AfricaChina Japan
Africa: Namibia, South Africa, Tunisia, ZimbabweAsia: India, South Korea, Taiwan, ThailandCentral +South America: Barbados, Brazil, Chile, Mexico, Uruguay
Europe: EU 27, Albania, Former Yugoslav Republicof Macedonia, Norway, Switzerland, Turkey
Middle East: Israel, Jordan
Figure 23:Annual collector yield of glazed flat-plate and evacuated tube collectorsin operation by economic region in 2009
78.763.1
43.8
26.211.4 9.7 5.1 3.6
368.0
0
50
100
150
200
250
300
350
400
Collector yield per 1,000 Inabitants [MWh/a/1,000 Inh.]
Central +
South America
United States
+ Canada
Australia +
NewZealand
Europe AsiaMiddle East AfricaChina Japan
Africa: Namibia, South Africa, Tunisia, ZimbabweAsia: India, South Korea, Taiwan, ThailandCentral +South America: Barbados, Brazil, Chile, Mexico, Uruguay
Europe: EU 27, Albania, Former Yugoslav Republicof Macedonia, Norway, Switzerland, Turkey
Middle East: Israel, Jordan
Figure 24:Annual collector yield of glazed flat-plate and evacuated tube collectorsin operation by economic region inMWh per 1,000 inhabitants in 2009
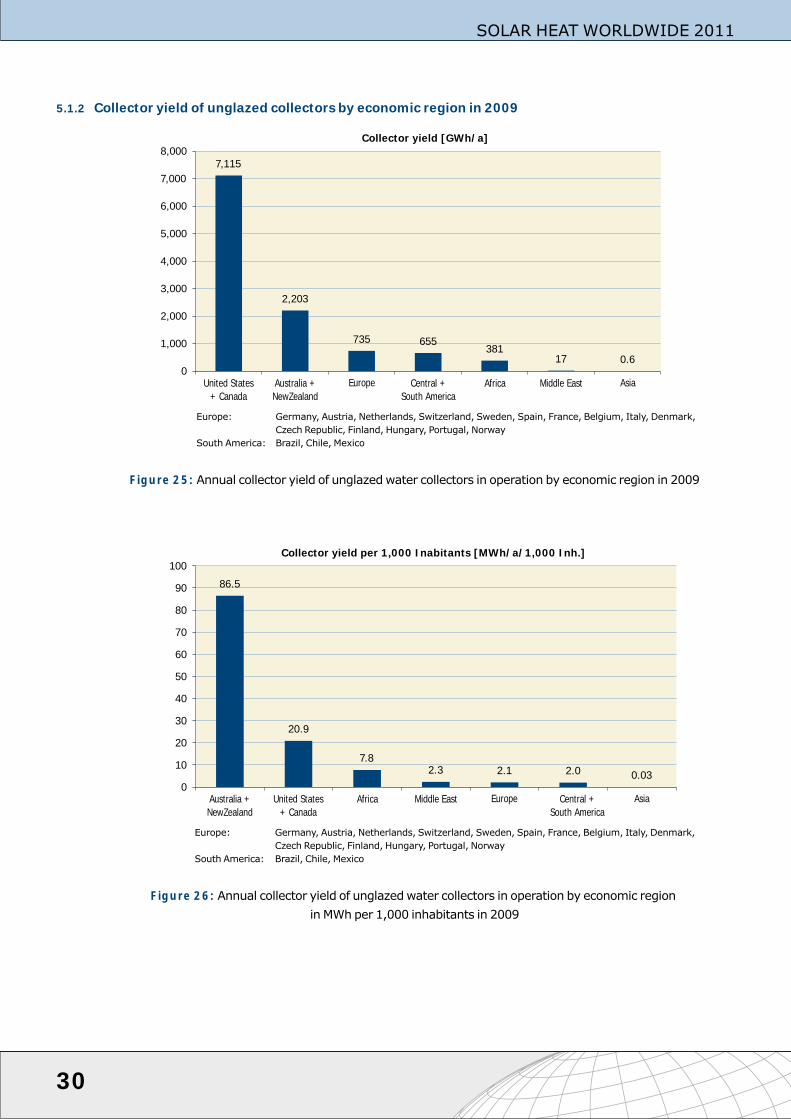
5.1.2 Collector yield of unglazed collectors by economic region in 2009
30
SOLAR HEAT WORLDWIDE 2011
Central +
South America
United States
+ Canada
Australia +
NewZealand
7,115
2,203
735 655381
17 0.6
0
1,000
2,000
3,000
4,000
5,000
6,000
7,000
8,000
Europe AsiaMiddle EastAfrica
Collector yield [GWh/a]
Europe: Germany, Austria, Netherlands, Switzerland, Sweden, Spain, France, Belgium, Italy, Denmark,Czech Republic, Finland, Hungary, Portugal, Norway
South America: Brazil, Chile, Mexico
Figure 25:Annual collector yield of unglazedwater collectors in operation by economic region in 2009
Central +
South America
United States
+ Canada
Australia +
NewZealand
Europe AsiaMiddle EastAfrica
86.5
20.9
7.8
2.3 2.1 2.00.03
0
10
20
30
40
50
60
70
80
90
100
Collector yield per 1,000 Inabitants [MWh/a/1,000 Inh.]
Europe: Germany, Austria, Netherlands, Switzerland, Sweden, Spain, France, Belgium, Italy, Denmark,Czech Republic, Finland, Hungary, Portugal, Norway
South America: Brazil, Chile, Mexico
Figure 26:Annual collector yield of unglazedwater collectors in operation by economic regioninMWh per 1,000 inhabitants in 2009

5.2 Annual energy savings by economic region
5.2.1 Energy savings in oil equivalents by glazed flat-plate and evacuated tube collectors by economic
region in 2009
31
SOLAR HEAT WORLDWIDE 2011
Central +
South America
United States
+ Canada
Australia +
NewZealand
Europe AsiaMiddle East Africa
8.30
2.89
0.46 0.48 0.39 0.35 0.23 0.070.20
0.0
1.0
2.0
3.0
4.0
5.0
6.0
7.0
8.0
9.0
10.0
China Japan
Energy savings in oil equivalent [Mio. t/a]
Africa: Namibia, South Africa, Tunisia, ZimbabweAsia: India, South Korea, Taiwan, ThailandCentral + South America: Barbados, Brazil, Chile, Mexico, UruguayEurope: EU 27, Albania, Former Yugoslav Republic of Macedonia, Norway, Switzerland, TurkeyMiddle East: Israel, Jordan
Figure 27:Annual energy savings in oil equivalent by glazed flat-plate and evacuated tube collec-tors in operation by economic region in 2009
Central +
South America
United States
+ Canada
Australia +
NewZealand
Europe AsiaMiddle East Africa
9.09
6.27
4.88
2.76
1.170.93
0.600.37
0.0
1.0
2.0
3.0
4.0
5.0
6.0
7.0
8.0
9.0
10.0
Energy savings in oil equivalent per 1,000 Inhabitants [t/a/1,000 Inh.]
China Japan
34.03
Africa: Namibia, South Africa, Tunisia, ZimbabweAsia: India, South Korea, Taiwan, ThailandCentral + South America: Barbados, Brazil, Chile, Mexico, UruguayEurope: EU 27, Albania, Former Yugoslav Republic of Macedonia, Norway, Switzerland, TurkeyMiddle East: Israel, Jordan
Figure 28:Annual energy savings in oil equivalent by glazed flat-plate and evacuated tube collec-tors in operation by economic region per 1,000 inhabitants in 2009

5.2.2 Energy savings in oil equivalents by unglazed water collectors by economic region 2009
32
SOLAR HEAT WORLDWIDE 2011
Central +
South America
United States
+ Canada
Australia +
NewZealand
Europe AsiaMiddle EastAfrica
204,465
70,076 57,01735,136
663,494
1,536 56
0
100,000
200,000
300,000
400,000
500,000
600,000
700,000
800,000
Energy Savings - Oil equivalent [t/a]
Europe: Germany, Austria, Netherlands, Switzerland, Sweden, Spain, France, Belgium, Italy,Denmark, Czech Republic, Finland, Hungary, Portugal, Norway
South America: Brazil, Chile, Mexico
Figure 29:Annual energy savings in oil equivalents by unglazedwater collectors in opera-tion by economic region in 2009
Central +
South America
United States
+ Canada
Australia +
NewZealand
Europe AsiaMiddle EastAfrica
8.0
1.9
0.7
0.21 0.20 0.170.002
0.0
1.0
2.0
3.0
4.0
5.0
6.0
7.0
8.0
9.0
Energy Savings - Oil equivalent per 1,000 Inhabitants [t/a/1,000 Inh.]
Europe: Germany, Austria, Netherlands, Switzerland, Sweden, Spain, France, Belgium,Italy, Denmark, Czech Republic, Finland, Hungary, Portugal, Norway
South America: Brazil, Chile, Mexico
Figure 30:Annual energy savings in oil equivalent by unglazedwater collectors inoperation by economic region per 1,000 inhabitants in 2009
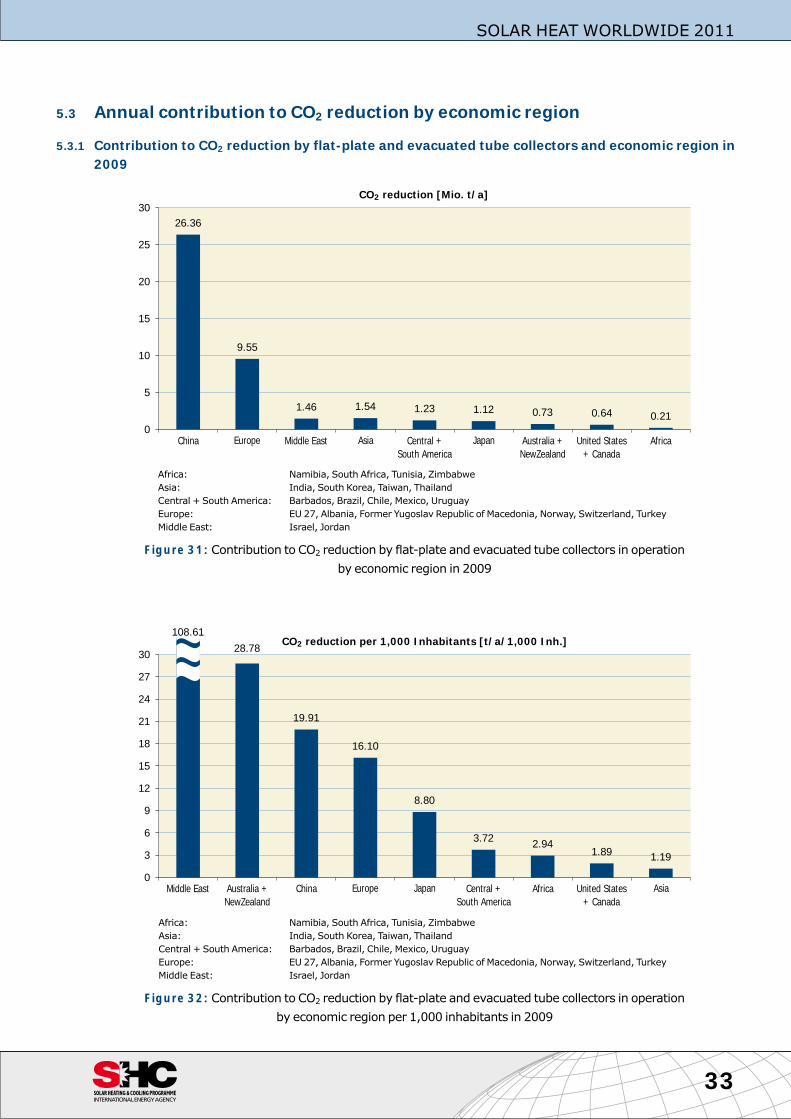
5.3 Annual contribution to CO2 reduction by economic region
5.3.1 Contribution to CO2 reduction by flat-plate and evacuated tube collectors and economic region in
2009
33
SOLAR HEAT WORLDWIDE 2011
Central +
South America
United States
+ Canada
Australia +
NewZealand
Europe AsiaMiddle East AfricaChina Japan
26.36
9.55
1.46 1.54 1.23 1.12 0.73 0.64 0.21
0
5
10
15
20
25
30
CO reduction [Mio. t/a]2
Africa: Namibia, South Africa, Tunisia, ZimbabweAsia: India, South Korea, Taiwan, ThailandCentral + South America: Barbados, Brazil, Chile, Mexico, UruguayEurope: EU 27, Albania, Former Yugoslav Republic of Macedonia, Norway, Switzerland, TurkeyMiddle East: Israel, Jordan
Figure 31:Contribution to CO2 reduction by flat-plate and evacuated tube collectors in operationby economic region in 2009
Central +
South America
United States
+ Canada
Australia +
NewZealand
Europe AsiaMiddle East Africa
19.91
16.10
8.80
3.722.94
1.891.19
28.78
0
3
6
9
12
15
18
21
24
27
30
CO reduction per 1,000 Inhabitants [t/a/1,000 Inh.]2
China Japan
108.61
Africa: Namibia, South Africa, Tunisia, ZimbabweAsia: India, South Korea, Taiwan, ThailandCentral + South America: Barbados, Brazil, Chile, Mexico, UruguayEurope: EU 27, Albania, Former Yugoslav Republic of Macedonia, Norway, Switzerland, TurkeyMiddle East: Israel, Jordan
Figure 32:Contribution to CO2 reduction by flat-plate and evacuated tube collectors in operationby economic region per 1,000 inhabitants in 2009
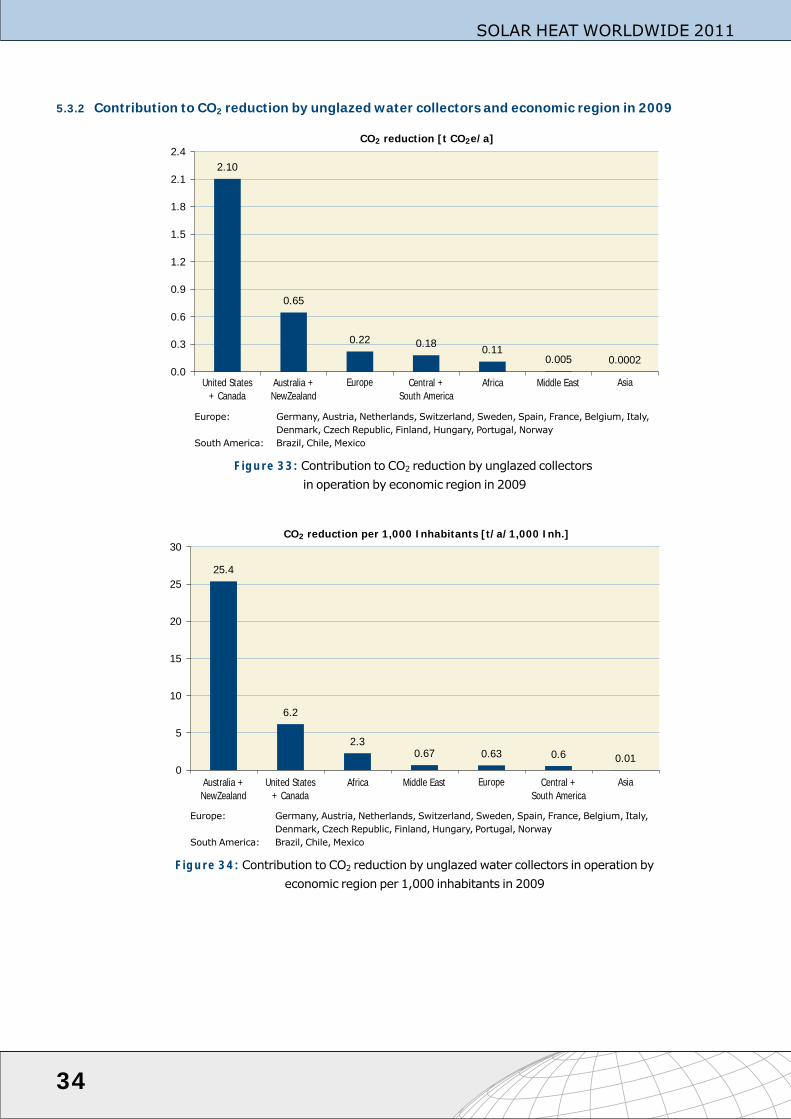
5.3.2 Contribution to CO2 reduction by unglazed water collectors and economic region in 2009
34
SOLAR HEAT WORLDWIDE 2011
Central +
South America
United States
+ Canada
Australia +
NewZealand
Europe AsiaMiddle EastAfrica
2.10
0.65
0.22 0.180.11
0.00020.005
0.0
0.3
0.6
0.9
1.2
1.5
1.8
2.1
2.4
CO reduction [t CO e/a]2 2
Europe: Germany, Austria, Netherlands, Switzerland, Sweden, Spain, France, Belgium, Italy,Denmark, Czech Republic, Finland, Hungary, Portugal, Norway
South America: Brazil, Chile, Mexico
Figure 33:Contribution to CO2 reduction by unglazed collectorsin operation by economic region in 2009
Central +
South America
United States
+ Canada
Australia +
NewZealand
Europe AsiaMiddle EastAfrica
25.4
6.2
2.3
0.60.630.670.01
0
5
10
15
20
25
30
CO reduction per 1,000 Inhabitants [t/a/1,000 Inh.]2
Europe: Germany, Austria, Netherlands, Switzerland, Sweden, Spain, France, Belgium, Italy,Denmark, Czech Republic, Finland, Hungary, Portugal, Norway
South America: Brazil, Chile, Mexico
Figure 34:Contribution to CO2 reduction by unglazedwater collectors in operation byeconomic region per 1,000 inhabitants in 2009

6 Distribution of systems by system type and application
If one observes the thermal utilization of the energy from the sun, it becomes clear that it greatly varies in differentregions on Earth. In terms of the type of collectors used, in China vacuum tube collectors predominatewhile in otherAsian countries, the Middle East and Europe most systems are equipped with flat plate collectors. By contrast, inNorthAmerica (UnitedStates and Canada) andAustralia unglazedwater collectors for swimmingpool heating is thedominant application.
Another distinction can be made between pumped systems and thermosiphon systems. The market for thermo-siphon systems is more advanced in the Asian countries (especially China), Africa and the Middle East while in Eu-rope, the United States, and Australia and New Zealand pumped systems are by far more common.
For glazedwater collectors, themarket hasbecomemore sophisticated in thepast years. In severalwell-establishedmarkets in Europe aswell as in someSouthAmerican (Brazil, Mexico) andAsian (China, India, Japan) countries, themarketpenetrationof solarcombi-systems,solarsupporteddistrictheatingnetworks, industrial applicationsandso-lar cooling systems is increasing.
6.1 Distribution by application of the total installed capacity in operation
While in a worldwide context domestic hot water systems for single-family houses are predominant, especially insomeEuropeanmarkets and in India, a remarkable shareof the total installed capacity in operation is largedomestichot water applications and solar combi- systems.
35
SOLAR HEAT WORLDWIDE 2011
Other (Solar process heat, solar cooling)
Solar combi systems (DHW and space heating) for single and multiple family houses
Large DHW systems (multiple family houses, tourism and public sector, district heating …)
DHW System for single family houses
0%
10%
20%
30%
40%
50%
60%
70%
80%
90%
100%
Europe Central +
South America
Asia China Middle East Africa Australia +
New Zealand
United States
+ Canada
Middle East: Israel, JordanAfrica: Namibia, South Africa, TunisiaCentral + South America: Barbados, Brazil, MexicoAsia: India, South Korea, TaiwanEurope: EU 27, Albania, Former Yugoslav Republic of Macedonia, Norway, Switzerland, TurkeyDHW: Domestic HotWater
Figure 35:Weighted distribution of solar thermal systems by application for the total installed glazedwater collector capacity in operation by the end of 2009
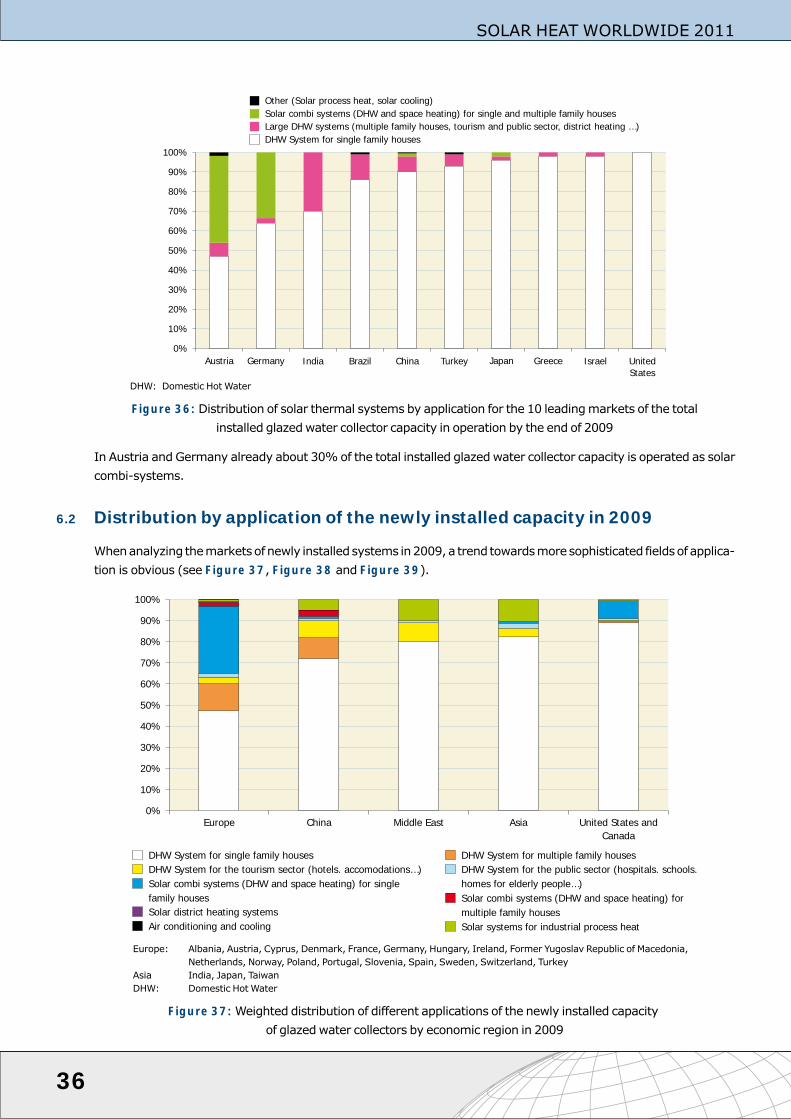
In Austria andGermany already about 30%of the total installed glazedwater collector capacity is operated as solarcombi-systems.
6.2 Distribution by application of the newly installed capacity in 2009
Whenanalyzing themarketsofnewly installedsystems in2009,a trend towardsmoresophisticated fieldsofapplica-tion is obvious (see Figure 37, Figure 38 and Figure 39).
36
SOLAR HEAT WORLDWIDE 2011
0%
10%
20%
30%
40%
50%
60%
70%
80%
90%
100%
Austria Germany India Brazil China Turkey Japan Greece Israel United
States
Other (Solar process heat, solar cooling)
Solar combi systems (DHW and space heating) for single and multiple family houses
Large DHW systems (multiple family houses, tourism and public sector, district heating …)
DHW System for single family houses
DHW: Domestic HotWater
Figure 36:Distribution of solar thermal systems by application for the 10 leadingmarkets of the totalinstalled glazedwater collector capacity in operation by the end of 2009
0%
10%
20%
30%
40%
50%
60%
70%
80%
90%
100%
Europe China Middle East Asia United States and
Canada
DHW System for multiple family houses
DHW System for the public sector (hospitals. schools.
homes for elderly people…)
Solar combi systems (DHW and space heating) for
family housesmultiple
Solar systems for industrial process heat
DHW System for single family houses
DHW System for the tourism sector (hotels. accomodations…)
Solar combi systems (DHW and space heating) for single
housesfamily
Solar district heating systems
Air conditioning and cooling
Europe: Albania, Austria, Cyprus, Denmark, France, Germany, Hungary, Ireland, Former Yugoslav Republic of Macedonia,Netherlands, Norway, Poland, Portugal, Slovenia, Spain, Sweden, Switzerland, Turkey
Asia India, Japan, TaiwanDHW: Domestic HotWater
Figure 37:Weighted distribution of different applications of the newly installed capacityof glazedwater collectors by economic region in 2009
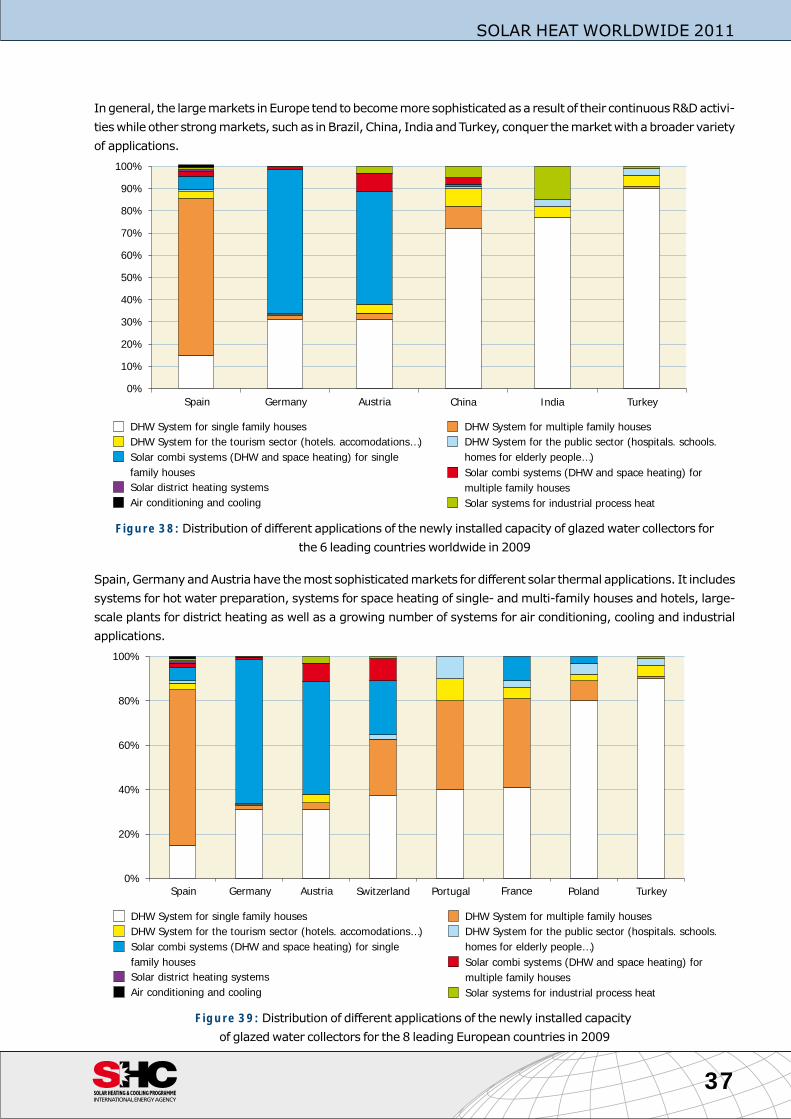
Ingeneral, the largemarkets inEurope tend tobecomemoresophisticatedasa result of their continuousR&Dactivi-tieswhile other strongmarkets, suchas inBrazil, China, India andTurkey, conquer themarketwithabroader varietyof applications.
Spain,GermanyandAustria have themost sophisticatedmarkets for different solar thermal applications. It includessystems for hot water preparation, systems for space heating of single- andmulti-family houses and hotels, large-scale plants for district heating as well as a growing number of systems for air conditioning, cooling and industrialapplications.
37
SOLAR HEAT WORLDWIDE 2011
0%
10%
20%
30%
40%
50%
60%
70%
80%
90%
100%
Spain Germany Austria China India Turkey
DHW System for multiple family houses
DHW System for the public sector (hospitals. schools.
homes for elderly people…)
Solar combi systems (DHW and space heating) for
family housesmultiple
Solar systems for industrial process heat
DHW System for single family houses
DHW System for the tourism sector (hotels. accomodations…)
Solar combi systems (DHW and space heating) for single
housesfamily
Solar district heating systems
Air conditioning and cooling
Figure 38:Distribution of different applications of the newly installed capacity of glazedwater collectors forthe 6 leading countries worldwide in 2009
0%
20%
40%
60%
80%
100%
Spain Germany Austria Switzerland Portugal France Poland Turkey
DHW System for multiple family houses
DHW System for the public sector (hospitals. schools.
homes for elderly people…)
Solar combi systems (DHW and space heating) for
family housesmultiple
Solar systems for industrial process heat
DHW System for single family houses
DHW System for the tourism sector (hotels. accomodations…)
Solar combi systems (DHW and space heating) for single
housesfamily
Solar district heating systems
Air conditioning and cooling
Figure 39:Distribution of different applications of the newly installed capacityof glazedwater collectors for the 8 leading European countries in 2009

6.3 Distribution by type of system of the newly installed capacity in 2009
Figure40andFigure41showthemarketshareof thenewly installed thermosiphonandpumpedsystems forboth,the most important economic regions as well as for the 10 leading countries for glazed water collectors in the year2009.
38
SOLAR HEAT WORLDWIDE 2011
0% 20% 40% 60% 80% 100%
Austria
Germany
Spain
Italy
Australia
Israel
Brazil
India
Turkey
China
Thermosyphon Solar Heating Systems Pumped Solar Heating Systems
Europe: Cyprus, France, Germany, Greece, Hungary, Ireland, Italy, Former Yugoslav Republic of Macedonia,Netherlands, Norway, Poland, Portugal, Slovenia, Spain, Sweden, Switzerland, Turkey, United States
Middle East: Israel, JordanAsia: India, Japan, South Korea, Taiwan
Figure 40:Weighted share between thermosiphon and pumped systemsby economic region for newly installed glazedwater collectors in 2009
0%
10%
20%
30%
40%
50%
60%
70%
80%
90%
100%
United States
+ Canada
Europe Australia Middle East Asia Brazil China Africa
(Namibia +
Tunisia)
Thermosiphon Systems Pumped Systems
Figure 41:Share between thermosiphon and pumped systems for newly installed glazedwater col-lectors for the 10 leading countries worldwide in 2009
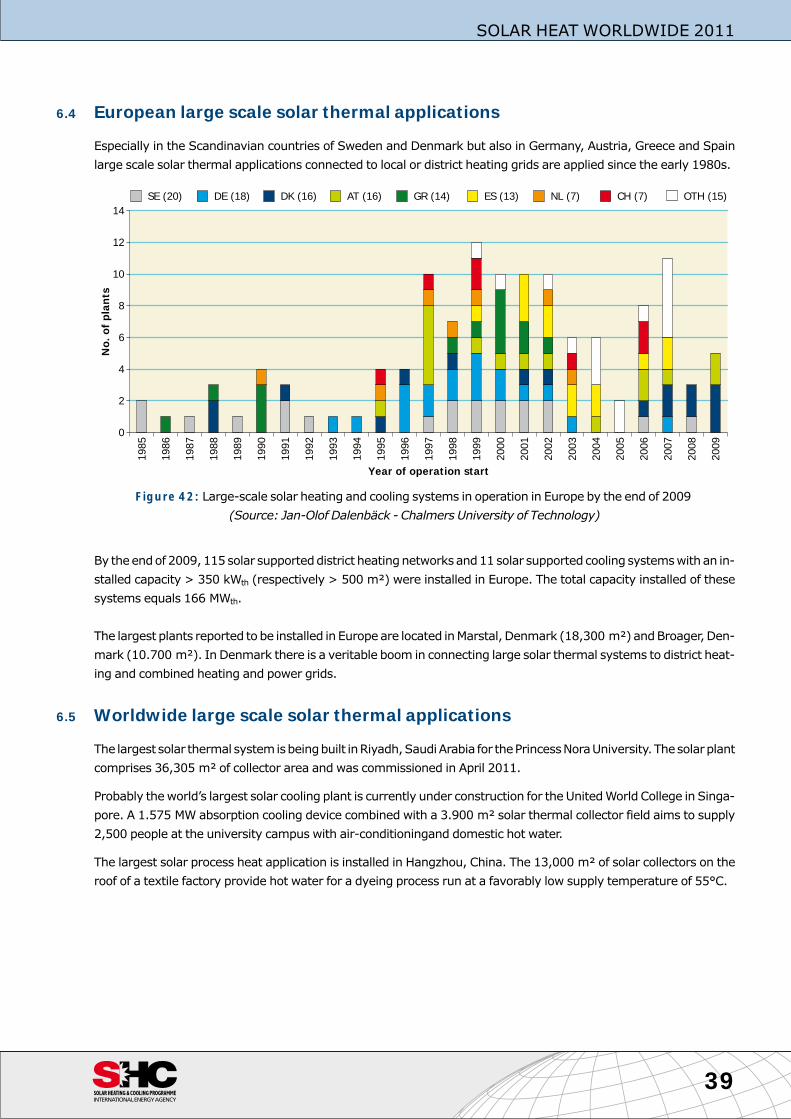
6.4 European large scale solar thermal applications
Especially in the Scandinavian countries of Sweden and Denmark but also in Germany, Austria, Greece and Spainlarge scale solar thermal applications connected to local or district heating grids are applied since the early 1980s.
By theendof2009,115solar supporteddistrict heatingnetworksand11solar supportedcooling systemswithan in-stalled capacity > 350 kWth (respectively > 500 m²) were installed in Europe. The total capacity installed of thesesystems equals 166 MWth.
The largest plants reported tobe installed inEuropeare located inMarstal, Denmark (18,300 m²)andBroager,Den-mark (10.700 m²). In Denmark there is a veritable boom in connecting large solar thermal systems to district heat-ing and combined heating and power grids.
6.5 Worldwide large scale solar thermal applications
The largestsolar thermal systemisbeingbuilt inRiyadh,SaudiArabia for thePrincessNoraUniversity.Thesolarplantcomprises 36,305 m² of collector area and was commissioned in April 2011.
Probably theworld’s largest solar cooling plant is currently under construction for theUnitedWorld College in Singa-pore. A 1.575 MW absorption cooling device combined with a 3.900 m² solar thermal collector field aims to supply2,500 people at the university campus with air-conditioningand domestic hot water.
The largest solar process heat application is installed in Hangzhou, China. The 13,000 m² of solar collectors on theroof of a textile factory provide hot water for a dyeing process run at a favorably low supply temperature of 55°C.
39
SOLAR HEAT WORLDWIDE 2011
0
2
4
6
8
10
12
14
1985
1986
1987
1988
1989
1990
1991
1992
1993
1994
1995
1996
1997
1998
1999
2000
2001
2002
2003
2004
2005
2006
2007
2008
2009
Year of operation start
No
.o
fp
lan
ts
SE (20) DE (18) DK (16) AT (16) GR (14) ES (13) NL (7) CH (7) OTH (15)
Figure 42: Large-scale solar heating and cooling systems in operation in Europe by the end of 2009(Source: Jan-Olof Dalenbäck - Chalmers University of Technology)

7 Appendix
7.1 Methodological approach for the energy calculation
In order to obtain theenergy yield of solar thermal systems, theoil equivalent savedand theCO2 emissions avoided,the following procedure was used:
• Onlywater collectorswereused in the calculations (unglazed, flat-plateandevacuated tubecollectors). Air collec-tors were not included.
• Foreachcountry, theoverall collectorarea installed(watercollectors)wasallocatedto the four typesofsystems:
• Solar thermal systems for swimming pool heating with unglazed collectors,
• Solar domestic hot water systems for single-family houses,
• Solar domestic hot water systems for multi-family houses, hotels and district heating, and
• Solar combi-systems2 for domestic hot water and space heating for single- andmulti-family houses.
• Reference systems were defined for each country and for each type of system.
• Thenumberof systems foreachcountrywasdetermined fromtheshareof collectorarea foreachsystemtypeandthe collector area per reference system.
Referencecollectorsanda referenceclimateweredetermined foreachcountryapart fromthereferencesystems.Onthe basis of these reference conditions, simulations were performed with the simulation program T-Sol [T-Sol, Ver-sion4.5Expert,ValentinEnergiesoftware,www.valentin.de] toobtain thesolaryields,energysavingsandCO2emis-sions.
The annual collector yield per squaremeter of collector area, depending on the application (swimming pool heating,domestic hot water preparation, space heating, etc.), the local climatic conditions and the plant dimensions (high orlowsolar fraction)werecalculated foreachcountryandeachsystem.Theenergysavingswereobtained fromtheen-ergy equivalent of the fuel used and the rate of efficiency of the auxiliary heating system.
For the auxiliary heating system, oil was taken as the fuel for all plants and the energy equivalent per liter of fuel oil38,052 kJ (higher heating value) respectively 10.57 kWh was used in all countries in order to achieve comparableresults.
To obtain an exact statement about the CO2 emissions avoided, the substituted energy source would have to be as-certained for each country. Since this could only be done in a very detailed survey, which goes beyond the scope ofthis report, the energy savings and the CO2 emissions avoided relate to fuel oil.
It is obvious that not all solar thermal systems just replace systems running on oil. This represents a simplificationsincegas, coal,biomassorelectricitycanbeusedas theenergysource for theauxiliaryheatingsysteminsteadofoil.
TheCO2emissionsavoidedby solar systemswereascertained fromtheenergy savings (oil equivalent). As theemis-sion factor 0.0733 g CO2/kJ respectively 2.79 kg CO2 / l was used.
The following tables describe the key data of the reference systems in the different countries, the location of the ref-erence climate used and the share of the total collector area in use for the respective application. Furthermore, a hy-draulic scheme is shown for each reference system.
40
SOLAR HEAT WORLDWIDE 2011
2 Solar combi-systems are solar heating installations that provide both space heating and domestic hot water
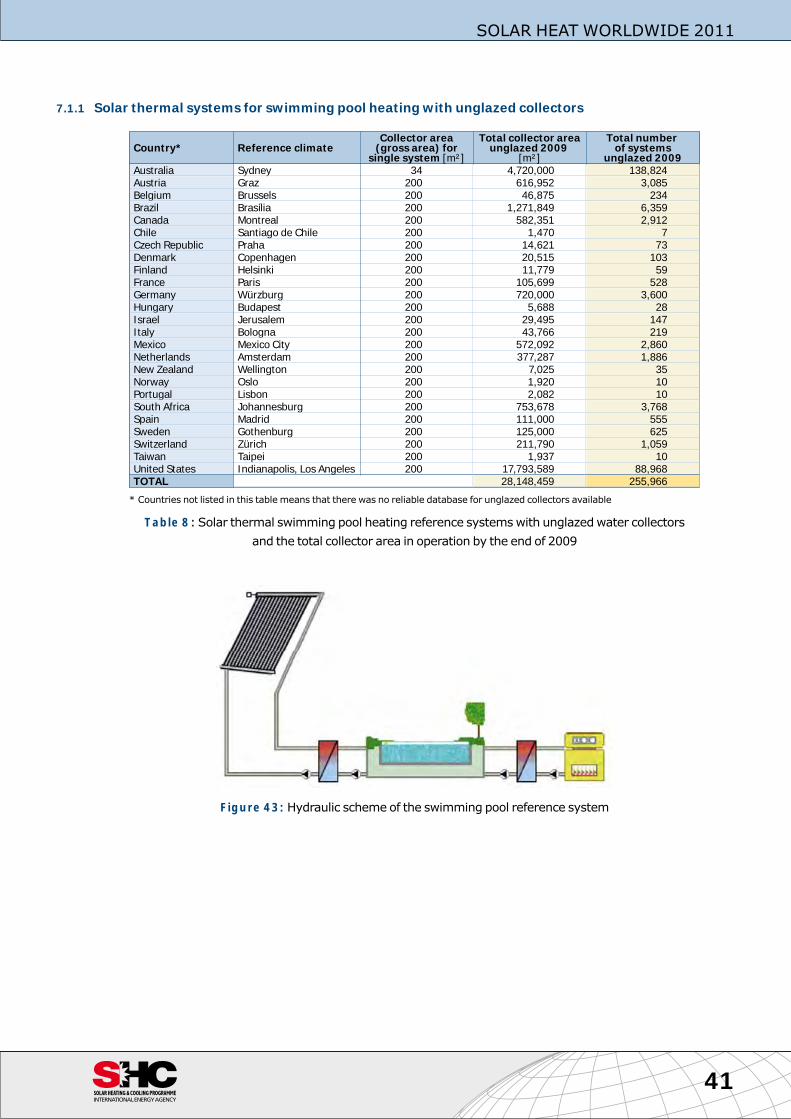
7.1.1 Solar thermal systems for swimming pool heating with unglazed collectors
Country* Reference climate
Collector area
(gross area) for
single system [m²]
Total collector area
unglazed 2009
[m²]
Total number
of systems
unglazed 2009
Australia Sydney 34 4,720,000 138,824
Austria Graz 200 616,952 3,085
Belgium Brussels 200 46,875 234
Brazil Brasília 200 1,271,849 6,359
Canada Montreal 200 582,351 2,912
Chile Santiago de Chile 200 1,470 7
Czech Republic Praha 200 14,621 73
Denmark Copenhagen 200 20,515 103
Finland Helsinki 200 11,779 59
France Paris 200 105,699 528
Germany Würzburg 200 720,000 3,600
Hungary Budapest 200 5,688 28
Israel Jerusalem 200 29,495 147
Italy Bologna 200 43,766 219
Mexico Mexico City 200 572,092 2,860
Netherlands Amsterdam 200 377,287 1,886
New Zealand Wellington 200 7,025 35
Norway Oslo 200 1,920 10
Portugal Lisbon 200 2,082 10
South Africa Johannesburg 200 753,678 3,768
Spain Madrid 200 111,000 555
Sweden Gothenburg 200 125,000 625
Switzerland Zürich 200 211,790 1,059
Taiwan Taipei 200 1,937 10
United States Indianapolis, Los Angeles 200 17,793,589 88,968
TOTAL 28,148,459 255,966
* Countries not listed in this table means that there was no reliable database for unglazed collectors available
Table 8: Solar thermal swimming pool heating reference systemswith unglazedwater collectorsand the total collector area in operation by the end of 2009
41
SOLAR HEAT WORLDWIDE 2011
Figure 43:Hydraulic scheme of the swimming pool reference system

7.1.2 Solar domestic hot water systems for single-family houses
Themarket share in the following table refers to the total capacity in operation of flat-plate and evacuated tube col-lectorsby theendof2009 for eachcountry. Itmustbepointedout that themarket shareof thenew installed capacityin the year 2009 can differ significantly from the total market share.
Country Reference climate
Collector area [m²] Share of
DHW-
SFH [%]
Number of
systems
DHW-SFH
Hot water Storage
capacity
[l]
Sys-
temfor single
system*
total of DHW-
SFH 2009
demand
[l/d]
temp.
[°C]
Albania Tirana 2.5 19,648 28 7,859 150 60 150 TS
Australia Sydney 4.0 2,467,028 98 616,757 170 60 300 PS
Austria Graz 6.0 1,731,993 47 288,665 150 60 300 PS
Barbados Grantley Adams 4.0 131,690 100 32,923 150 60 200 TS
Belgium Brussels 4.0 278,333 100 69,583 150 60 200 PDS
Brazil Brasília 4.0 3,439,610 86 859,903 150 60 200 TS
Bulgaria Sofia 4.0 27,320 71 6,830 150 60 200 PS
Canada Montreal 6.0 26,138 60 4,356 150 60 200 PS
Chile Santiago de Chile 4.0 26,730 100 6,683 150 60 200 PS
China Shanghai 4.0 130,500,000 90 32,625,000 150 60 200 TS
Cyprus Nicosia 4.0 703,986 82 175,997 150 60 200 TS
Czech Republic Praha 6.0 179,860 99 29,977 150 60 300 PS
Denmark Copenhagen 4.0 402,093 86 100,523 150 60 200 PS
Estonia Tallin 4.0 2,341 100 585 150 60 200 PS
Finland Helsinki 4.0 27,038 95 6,759 150 60 200 PS
France Paris 4.0 1,395,451 75 348,863 150 60 200 PS
FYRM Skopje 4.0 12,100 47 3,025 150 60 200 PS
Germany Würzburg 6.0 7,637,218 64 1,272,870 150 60 300 PS
Greece Athens 4.0 3,995,460 98 998,865 150 60 200 TS
Hungary Budapest 6.0 51,526 40 8,588 150 60 300 PS
India Neu-Delhi 4.0 2,156,837 70 539,209 150 60 200 TS
Ireland Dublin 4.0 108,871 90 27,218 150 60 200 PS
Israel Jerusalem 4.0 3,958,537 98 989,634 150 60 200 TS
Italy Bologna 4.0 2,057,578 100 514,395 150 60 200 PS
Japan Tokyo 4.0 5,491,436 96 1,372,859 150 60 200 TS
Jordan Amman 4.0 716,230 80 179,057 150 60 200 TS
South Korea Seoul 4.0 808,118 54 202,029 150 60 200 PS
Lativa Riga 4.0 7,044 100 1,761 150 60 200 PS
Lithuania Vilnius 4.0 4,318 100 1,080 150 60 200 PS
Luxembourg Luxembourg 4.0 26,300 100 6,575 150 60 200 PS
Malta Luqa 4.0 44,867 100 11,217 150 60 200 PS
Mexico Mexico City 4.0 193,161 28 48,290 150 60 200 PS
Namibia Windhoek 4.0 6,754 43 1,688 150 60 200 TS
Netherlands Amsterdam 3.0 313,782 83 104,594 110 60 100 PDS
New Zealand Wellington 4.0 144,989 95 36,247 170 60 300 PS
Norway Oslo 6.0 13,279 98 2,213 150 60 300 PS
Poland Warsaw 6.0 331,393 65 55,232 150 60 300 PS
Portugal Lisbon 4.0 191,771 35 47,943 150 60 200 PS
Romania Bucharest 4.0 94,496 100 23,624 150 60 200 PS
Slovak Republic Bratislava 6.0 120,746 100 20,124 150 60 300 PS
Slovenia Ljubjana 6.0 120,099 83 20,017 150 60 300 PS
South Africa Johannesburg 4.0 309,682 100 77,420 150 60 200 TS
Spain Madrid 4.0 700,350 35 175,088 150 60 200 PS
Sweden Gothenburg 6.0 29,000 10 4,833 150 60 300 PS
Switzerland Zürich 6.0 442,247 67 73,708 150 60 300 PS
Taiwan Taipei 4.0 1,828,243 95 457,061 150 60 200 TS
Thailand Bangkok 4.0 91,392 100 22,848 150 60 200 TS
Tunisia Tunis 4.0 392,850 97 98,213 150 60 200 TS
Turkey Ankara 4.0 11,192,550 93 2,798,138 150 60 200 TS
United Kingdom London 4.0 459,583 100 114,896 150 60 200 PS
United States Indianapolis, Los Angeles 6.0 2,641,739 100 440,290 150 60 200 PS
Uruguay Montevideo 4.0 12,096 100 3,024 150 60 200 PS
Zimbabwe Harare 4.0 17,671 100 4,418 150 60 200 PS
TOTAL 188,083,573 45,939,552
*) gross area
FYRM: Former Yugoslav Republic of MacedoniaDHW-SFH: domestic hot water systems for single family housesPS: pumped system
TS: thermo siphon systemPDS: pumped drain back systemAuxiliary heating device: oil boiler
Table 9:Domestic hot water reference systems for single family housesand the total collector area in operation by the end of 2009
42
SOLAR HEAT WORLDWIDE 2011

Figure 44 shows the hydraulic scheme used for the energy calculation for all pumped solar thermal systems andFigure 45 refers to the thermosiphon systems.
For the Chinese thermosiphon systems, the above reference systemwas used but instead of a flat plate collector asshown in Figure 45 a representative Chinese vacuum tube collector was used for the simulation.
43
SOLAR HEAT WORLDWIDE 2011
Figure 44:Hydraulic scheme of the DHWpumped reference system
Figure 45:Hydraulic scheme of the DHW thermosiphonreference system

7.1.3 Solar domestic hot water systems for multi-family houses, hotels and district heating
Themarket share shown inTable 10 refers to the total capacity in operation of flat-plate and evacuated tube collec-tors by theendof 2009 for each country. Itmust bepointedout that themarket shareof thenew installed capacity inthe year 2008 can differ greatly from the total market share.
CountryReference
climate
Collector area [m²] Share
of DHW-
MFH [%]
Number of
systems
DHW-MFH
Hot water Storage
capacity
[l]
Sys-
temfor single
system
total of DHW-
MFH 2009
demand
[l/d]
temp.
[°C]
Albania Tirana 50.0 50,523 72 1,010 2000 60 2500 PS
Australia Sydney 50.0 50,348 2 1,007 2000 60 2500 PS
Austria Graz 50.0 322,531 9 6,451 2000 60 2500 PS
Brazil Brasília 50.0 559,937 14 11,199 2000 60 2500 PS
Bulgaria Sofia 50.0 11,016 29 220 2000 60 2500 PS
Canada Montreal 50.0 17,426 40 349 2000 60 2500 PS
China Shanghai 50.0 12,325,000 9 246,500 2000 60 2500 PS
Cyprus Nicosia 50.0 154,534 18 3,091 2000 60 2500 PS
Czech Republic Praha 50.0 1,817 1 36 2000 60 2500 PS
Denmark Copenhagen 50.0 60,781 13 1,216 2000 60 2500 PS
Finland Helsinki 50.0 1,423 5 28 2000 60 2500 PS
France Paris 50.0 186,060 10 3,721 2000 60 2500 PS
FYRM Skopje 50.0 13,644 53 273 2000 60 2500 PS
Germany Würzburg 50.0 298,329 3 5,967 2000 60 2500 PS
Greece Athens 50.0 81,540 2 1,631 2000 60 2500 PS
Hungary Budapest 50.0 55,390 43 1,108 2000 60 2500 PS
India Neu-Delhi 50.0 924,359 30 18,487 2000 60 2500 PS
Ireland Dublin 50.0 3,629 3 73 2000 60 2500 PS
Israel Jerusalem 50.0 80,786 2 1,616 2000 60 2500 PS
Japan Tokyo 50.0 114,405 2 2,288 2000 60 2500 PS
Jordan Amman 50.0 179,057 20 3,581 2000 60 2500 PS
Korea, South Seoul 50.0 688,396 46 13,768 2000 60 2500 PS
Mexico Mexico City 50.0 496,701 72 9,934 2000 60 2500 PS
Namibia Windhoek 50.0 8,952 57 179 2000 60 2500 PS
Netherlands Amsterdam 50.0 45,366 12 907 2000 60 2500 PS
New Zealand Wellington 50.0 7,631 5 153 2000 60 2500 PS
Norway Oslo 50.0 136 1 3 2000 60 2500 PS
Poland Warsaw 50.0 152,951 30 3,059 2000 60 2500 PS
Portugal Lisbon 50.0 356,147 65 7,123 2000 60 2500 PS
Slovenia Ljubjana 50.0 2,894 2 58 2000 60 2500 PS
Spain Madrid 50.0 180,090 9 3,602 2000 60 2500 PS
Sweden Gothenburg 50.0 43,500 15 870 2000 60 2500 PS
Switzerland Zürich 50.0 52,806 8 1,056 2000 60 2500 PS
Taiwan Taipei 50.0 92,584 5 1,852 2000 60 2500 PS
Tunisia Tunis 50.0 12,150 3 243 2000 60 2500 PS
Turkey Ankara 50.0 842,450 7 16,849 2000 60 2500 PS
TOTAL 18,475,288 369,506
FYRM: Former Yugoslav Republic of MacedoniaDHW-MFH: domestic hot water systems for multi family houses
PS: pumped systemAuxiliary heating device: oil boiler
Table 10:Domestic hot water reference systems formulti-family houses, hotels and district heating and the totalcollector area in operation in 2009 (flat-plate and evacuated tube collectors)
Figure 46:Hydraulic scheme of the DHWsystem formulti-family houses
44
SOLAR HEAT WORLDWIDE 2011

7.1.4 Solar combi-systems for domestic hot water and space heating for single- family houses
The market share of combi-systems in the following table refers to the total capacity in operation of flat-plate andevacuated tubecollectorsat theendof2009 foreachcountry. Itmustbepointedout that themarketshareof thenewinstalled capacity in the year 2009 can differ significantly from the total market share. The reference system is de-signed for a single-family house with a 140 m² heated floor area.
CountryReference
climate
Collector area [m²]Share of CS
(2010) [%]
Number
of CS
2009
Storage
capacity
[l]
Space heat
demand
[kWh/m²�a] Sys-
te
mfor single
system
total of CS
2009
Austria Graz 16.0 1,633,809 44 102,113 1,000 80 PS
China Shanghai 12.0 2,175,000 2 181,250 800 80 PS
Denmark Copenhagen 12.0 4,675 1 390 1,000 100 PS
France Paris 15.0 279,090 15 18,606 1,000 80 PS
Germany Würzburg 12.0 3,997,607 34 333,134 800 80 PS
Hungary Budapest 12.0 21,898 17 1,825 800 90 PS
Ireland Dublin 12.0 8,468 7 706 1,000 100 PS
Japan Tokyo 12.0 114,405 2 9,534 800 50 PS
Netherlands Amsterdam 6.0 18,903 5 3,150 500 80 PS
Norway Oslo 12.0 136 1 11 1,000 100 PS
Poland Warsaw 12.0 25,492 5 2,124 1,000 100 PS
Slovenia Ljubjana 12.0 21,705 15 1,809 800 80 PS
Spain Madrid 12.0 1,120,560 56 93,380 1,000 60 PS
Sweden Gothenburg 12.0 217,500 75 18,125 1,000 100 PS
Switzerland Zürich 12.0 165,018 25 13,751 800 80 PS
TOTAL 9,804,264 779,908
Combi-system systems for the supply of hot water and space heatingPS: pumped systemAuxiliary heating device: oil boiler
Table 11:Reference systems for combi-systems (CS) for single-family housesand the percentage of the total collector area in operation
45
SOLAR HEAT WORLDWIDE 2011
Figure 47:Hydraulic scheme of the solar combi reference system

7.2 Reference collectors
7.2.1 Data of the reference unglazed water collector for swimming pool heating
�=0.85 a1 = 20 [W/m²K] a2 = 0.1 [W/m²K²]
7.2.2 Data of the reference collector for all other applications except for China
�=0.8 a1 = 3.69 [W/m²K] a2 = 0.007 [W/m²K²]
7.2.3 Data of the Chinese reference vacuum tube collector
�=0.74 a1 = 2.5 [W/m²K] a2 = 0.013 [W/m²K²]
7.3 Reference climates
CountryReference
climate
Horizontal
irradiation G0
[kWh/m²*a]
Avg. Outside air
temperature
[°C]
Albania Tirana 1604.3 13.5
Australia Sydney 1674.0 18.1
Austria Graz 1126.0 9.2
Barbados Grantley Adams 2016.3 27.4
Belgium Brussels 971.1 10.0
Brazil Brasília 1792.5 22.0
Bulgaria Sofia 1187.5 10.1
Canada Montreal 1351.4 6.9
Chile Santiago de Chile 1752.7 14.5
China Shanghai 1281.9 17.1
Cyprus Nicosia 1885.5 19.9
Czech Republic Praha 998.4 7.9
Denmark Copenhagen 989.4 8.1
Estonia Tallin 960.2 5.3
Finland Helsinki 948.0 4.6
France Paris 1112.4 11.0
FYRM Skopje 1380.8 12.5
Germany Würzburg 1091.3 9.5
Greece Athens 1584.6 18.5
Hungary Budapest 1198.7 11.0
India Neu-Delhi 1960.5 24.7
Ireland Dublin 948.7 9.5
Israel Jerusalem 2198.0 17.3
Italy Bologna 1419.0 14.3
Japan Tokyo 1175.2 16.7
Jordan Amman 2145.4 17.9
Korea, South Seoul 1161.1 12.7
Latvia Riga 991.2 6.3
Lithuania Vilnius 1001.2 6.2
Luxembourg Luxembourg 1037.4 8.4
Malta Luqa 1901.9 18.7
Mexico Mexico City 1706.3 16.6
Namibia Windhoek 2363.0 21.0
Netherlands Amsterdam 999.0 10.0
New Zealand Wellington 1401.2 13.6
Norway Oslo 971.1 5.8
Poland Warsaw 1024.2 8.1
Portugal Lisbon 1686.4 17.4
Romania Bucharest 1324.3 10.6
Slovakia Bratislava 1213.8 10.3
Slovenia Ljubjana 1114.6 9.8
South Africa Johannesburg 2075.1 15.6
Spain Madrid 1643.5 15.5
Sweden Gothenburg 933.9 7.2
Switzerland Zürich 1093.8 9.6
Taiwan Taipei 1372.2 20.8
Thailand Bangkok 1764.8 29.1
Tunisia Tunis 1808.2 19.3
Turkey Ankara 1700.9 12.0
United Kingdom London 942.6 12.0
United StatesIndianapolis
Los Angeles
1,492.3
1,799.8
11.3
17.2
Uruguay Montevideo 1,534.2 15.9
Zimbabwe Harare 2,017.1 18.9
FYRM: Former Yugoslav Republic of Macedonia
Table 12:Reference climates for the 53 countries surveyed
46
SOLAR HEAT WORLDWIDE 2011
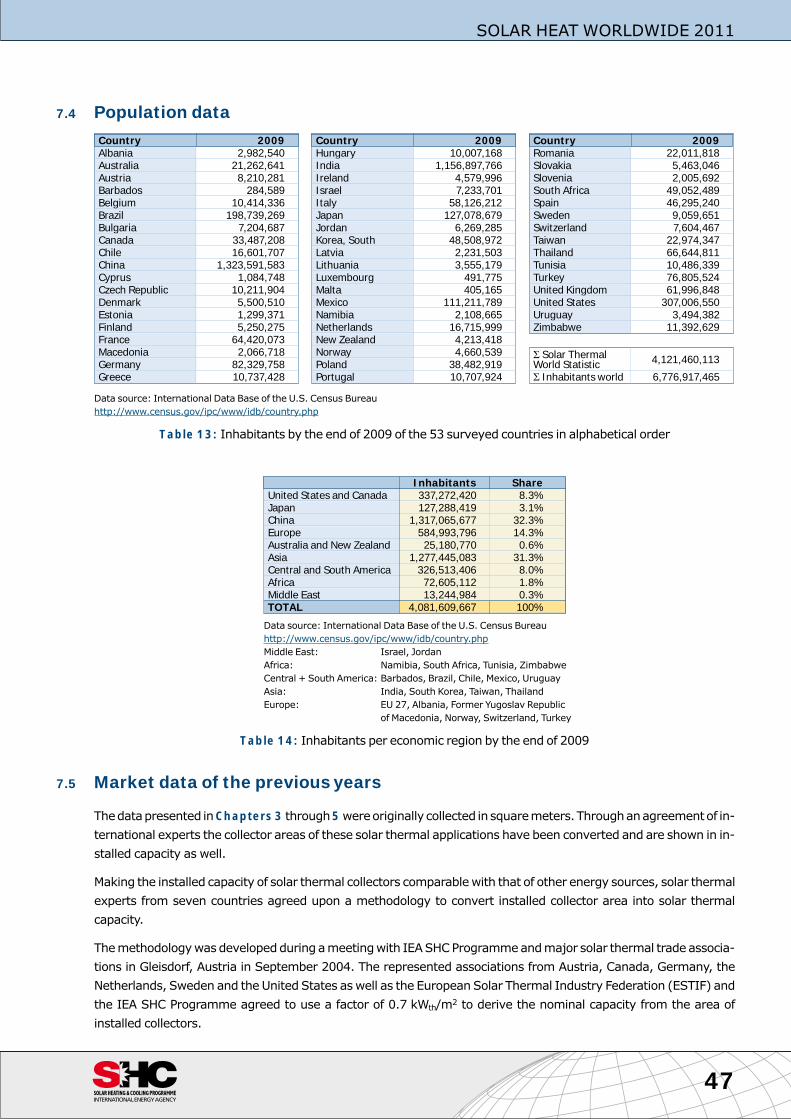
7.4 Population data
Data source: International Data Base of the U.S. Census Bureauhttp://www.census.gov/ipc/www/idb/country.php
Table 13: Inhabitants by the end of 2009 of the 53 surveyed countries in alphabetical order
Inhabitants Share
United States and Canada 337,272,420 8.3%
Japan 127,288,419 3.1%
China 1,317,065,677 32.3%
Europe 584,993,796 14.3%
Australia and New Zealand 25,180,770 0.6%
Asia 1,277,445,083 31.3%
Central and South America 326,513,406 8.0%
Africa 72,605,112 1.8%
Middle East 13,244,984 0.3%
TOTAL 4,081,609,667 100%
Data source: International Data Base of the U.S. Census Bureauhttp://www.census.gov/ipc/www/idb/country.phpMiddle East: Israel, JordanAfrica: Namibia, South Africa, Tunisia, ZimbabweCentral + South America: Barbados, Brazil, Chile, Mexico, UruguayAsia: India, South Korea, Taiwan, ThailandEurope: EU 27, Albania, Former Yugoslav Republic
of Macedonia, Norway, Switzerland, Turkey
Table 14: Inhabitants per economic region by the end of 2009
7.5 Market data of the previous years
Thedatapresented inChapters3 through5wereoriginally collected insquaremeters.Throughanagreementof in-ternational experts the collector areas of these solar thermal applications have been converted and are shown in in-stalled capacity as well.
Making the installed capacity of solar thermal collectors comparablewith that of other energy sources, solar thermalexperts from seven countries agreed upon a methodology to convert installed collector area into solar thermalcapacity.
Themethodologywasdevelopedduringameetingwith IEASHCProgrammeandmajor solar thermal tradeassocia-tions in Gleisdorf, Austria in September 2004. The represented associations from Austria, Canada, Germany, theNetherlands, Sweden and theUnited States aswell as the European Solar Thermal Industry Federation (ESTIF) andthe IEA SHC Programme agreed to use a factor of 0.7 kWth/m2 to derive the nominal capacity from the area ofinstalled collectors.
47
SOLAR HEAT WORLDWIDE 2011
Country 2009
Albania 2,982,540
Australia 21,262,641
Austria 8,210,281
Barbados 284,589
Belgium 10,414,336
Brazil 198,739,269
Bulgaria 7,204,687
Canada 33,487,208
Chile 16,601,707
China 1,323,591,583
Cyprus 1,084,748
Czech Republic 10,211,904
Denmark 5,500,510
Estonia 1,299,371
Finland 5,250,275
France 64,420,073
Macedonia 2,066,718
Germany 82,329,758
Greece 10,737,428
Country 2009
Hungary 10,007,168
India 1,156,897,766
Ireland 4,579,996
Israel 7,233,701
Italy 58,126,212
Japan 127,078,679
Jordan 6,269,285
Korea, South 48,508,972
Latvia 2,231,503
Lithuania 3,555,179
Luxembourg 491,775
Malta 405,165
Mexico 111,211,789
Namibia 2,108,665
Netherlands 16,715,999
New Zealand 4,213,418
Norway 4,660,539
Poland 38,482,919
Portugal 10,707,924
Country 2009
Romania 22,011,818
Slovakia 5,463,046
Slovenia 2,005,692
South Africa 49,052,489
Spain 46,295,240
Sweden 9,059,651
Switzerland 7,604,467
Taiwan 22,974,347
Thailand 66,644,811
Tunisia 10,486,339
Turkey 76,805,524
United Kingdom 61,996,848
United States 307,006,550
Uruguay 3,494,382
Zimbabwe 11,392,629
� Solar Thermal
World Statistic4,121,460,113
� Inhabitants world 6,776,917,465

Nevertheless, solar thermal collectors are traditionally quoted in squaremeters and therefore Table 15 and Table
16 provide the 2007 and 2008 data in m² as well as the total installed collector area in 2008 (Table 17).
CountryWater Collectors* Air Collectors*
TOTAL [m²]Unglazed Glazed evacuated tube Unglazed Glazed
Albania 9,290 88 9,378
Australia 576,000 203,000 3,000 782,000
Austria 8,662 277,620 3,399 289,681
Barbados 6,438 6,438
Belgium 8,828 37,000 5,000 50,828
Brazil 97,442 475,394 350 573,186
Bulgaria 2,500 2,500
Canada 39,879 1,462 2,385 17,056 128 60,910
Chile 6,200 6,200
China 1,150,000 21,850,000 23,000,000
Cyprus 15,000 1,000 16,000
Czech Republic 6,000 18,900 6,100 31,000
Denmark 600 23,000 400 3,400 3,500 30,900
Estonia 350 350
Finland 2,100 622 2,722
France 5,300 305,000 12,700 323,000
FYRM 1,952 200 2,152
Germany 30,000 840,000 100,000 5,000 975,000
Greece 279,000 4,000 283,000
Hungary 6,000 2,000 8,000
India 424,150 7,000 431,150
Ireland 14,872 4,799 19,671
Israel 700 301,000 301,700
Italy 5,138 295,596 49,266 350,000
Japan 166,223 4,051 12,509 182,783
Jordan 7,666 3,600 11,266
Korea, South 38,700 38,700
Latvia 1,500 1,500
Lithuania 700 700
Luxembourg 3,000 3,000
Malta 5,500 5,500
Mexico 46,281 107,989 154,270
Namibia 2,810 190 3,001
Netherlands 27,722 19,920 47,642
New Zealand 600 11,800 5,150 17,550
Norway 200 720 50 970
Poland 47,032 21,115 68,147
Portugal 618 44,483 5,696 50,797
Romania 6,500 6,500
Slovakia 15,554 9,911 25,465
Slovenia 6,515 1,150 7,665
South Africa 67,300 14,000 81,300
Spain 3,000 251,000 11,000 265,000
Sweden 20,435 15,554 9,911 45,900
Switzerland 10,320 63,022 2,554 2,000 77,896
Taiwan 125,000 9,900 134,900
Thailand 8,000 8,000
Tunisia 39,000 1,000 40,000
Turkey 700,000 700,000
United Kingdom 27,000 27,000 54,000
United States 1,125,441 130,089 20,527 1,267 1,277,324
Uruguay 2,857 2,857
Zimbabwe 171 171
TOTAL 2,080,465 6,558,131 22,178,114 22,456 29,404 30,868,570
FYRM: Former Yugoslav Republic of Macedonia* Countries not listed in this table means that there was no reliable database for unglazed collectors available** Unglazed air collectors in Switzerland: this is a very simple site-built system for hay drying
Table 15:Newly installed collector area in 2007 [m2/a]
48
SOLAR HEAT WORLDWIDE 2011

CountryWater Collectors* Air Collectors*
TOTAL [m²]Unglazed Glazed evacuated tube Unglazed Glazed
Albania 9,740 104 9,844
Australia 600,000 277,000 14,000 891,000
Austria 15,220 343,617 4,086 362,923
Barbados 7,051 7,051
Belgium 82,000 9,000 91,000
Brazil 278,910 392,246 671,156
Bulgaria 4,000 4,000
Canada 89,577 13,173 1,083 34,135 1,191 139,159
Chile 7,000 7,000
China 1,240,000 29,760,000 31,000,000
Cyprus 40,290 1,000 41,290
Czech Republic 26,500 8,500 35,000
Denmark 31,000 2,000 33,000
Estonia 500 500
Finland 270 3,905 650 4,825
France 390,000 390,000
FYRM 3,866 554 4,420
Germany 1,900,000 200,000 6,900 2,106,900
Greece 298,000 298,000
Hungary 8,500 2,500 11,000
India 463,487 23,174 486,662
Ireland 31,727 11,883 43,610
Israel 2,500 278,000 280,500
Italy 7,340 422,280 70,380 500,000
Japan 205,622 1,946 13,386 220,954
Jordan 20,041 30,062 50,103
Korea, South 51,552 51,552
Latvia 1,800 1,800
Lithuania 840 840
Luxembourg 2,800 800 3,600
Malta 6,000 6,000
Mexico 49,690 115,943 165,633
Namibia 3,952 203 4,154
Netherlands 28,216 23,414 51,630
New Zealand 600 20,379 20,979
Norway 180 1,030 210 1,420
Poland 89,820 39,812 129,632
Portugal 802 78,858 7,160 86,820
Romania 8,000 8,000
Slovakia 12,000 1,500 13,500
Slovenia 14,000 2,500 16,500
South Africa 100,222 21,397 18,092 139,710
Spain 32,000 409,000 25,000 466,000
Sweden 28,648 14,530 12,283 55,461
Switzerland** 9,374 104,040 8,793 7,000 129,207
Taiwan 330 105,683 11,751 117,764
Thailand 9,939 9,939
Tunisia 75,000 5,000 80,000
Turkey 930,000 930,000
United Kingdom 47,250 33,750 81,000
United States 1,125,771 175,272 28,194 2,249 1,331,486
Uruguay 4,213 4,213
Zimbabwe 336 24 360
TOTAL 2,369,649 8,826,593 30,335,994 41,135 23,727 41,597,098
FYRM: Former Yugoslav Republic of Macedonia* Countries not listed in this table means that there was no reliable database for unglazed collectors available** Unglazed air collectors in Switzerland: this is a very simple site-built system for hay drying
Table 16:Newly installed collector area in 2008 [m2/a]
49
SOLAR HEAT WORLDWIDE 2011

CountryWater Collectors* Air Collectors*
TOTAL [m²]Unglazed Glazed evacuated tube Unglazed Glazed
Albania 57,283 336 57,619
Australia 4,100,000 1,960,550 37,450 6,098,000
Austria 624,110 3,293,175 47,069 3,964,354
Barbados 129,516 129,516
Belgium 46,875 207,120 20,513 274,508
Brazil 864,798 3,608,458 4,473,256
Bulgaria 30,336 30,336
Canada 509,325 27,383 5,912 172,658 1,557 716,835
Chile 1,470 17,730 19,200
China 10,243,297 114,756,703 125,000,000
Cyprus 801,637 1,883 803,520
Czech Republic 14,621 118,646 23,030 156,298
Denmark 20,515 407,866 5,184 3,264 18,000 454,829
Estonia 1,891 1,891
Finland 11,779 23,318 1,142 36,240
France 100,320 1,734,240 31,680 1,866,240
FYRM 22,018 724 22,742
Germany 720,000 9,296,731 1,021,423 33,600 11,071,754
Greece 3,870,000 3,870,000
Hungary 2,688 47,846 4,858 55,392
India 2,508,948 22,247 16,320 2,547,515
Ireland 57,009 19,001 76,010
Israel 26,700 3,772,878 422 3,800,000
Italy 36,719 1,399,208 185,417 1,621,344
Japan 5,772,026 101,618 441,856 6,315,500
Jordan 642,477 250,588 893,065
Korea, South 1,427,834 1,427,834
Latvia 6,864 6,864
Lithuania 4,118 4,118
Luxembourg 20,832 768 21,600
Malta 33,946 33,946
Mexico 496,591 537,430 1,034,021
Namibia 6,365 377 6,742
Netherlands 360,815 342,926 703,741
New Zealand 6,544 118,361 9,644 134,550
Norway 1,709 11,760 346 1,152 14,966
Poland 1,248 276,186 73,474 2,880 2,400 356,188
Portugal 1,340 340,700 12,131 354,172
Romania 74,496 74,496
Slovakia 96,292 10,955 107,246
Slovenia 118,656 4,042 122,698
South Africa 699,678 258,314 17,368 975,360
Spain 86,400 1,459,200 96,000 1,641,600
Sweden 105,000 235,000 41,000 381,000
Switzerland** 211,800 509,980 29,930 845,000 1,596,710
Taiwan 1,860 1,648,836 46,991 1,697,686
Thailand 76,742 76,742
Tunisia 279,862 6,218 286,080
Turkey 10,636,800 10,636,800
United Kingdom 312,163 58,320 370,483
United States 17,382,099 3,391,405 59,643 148,798 20,981,945
Uruguay 4,861 4,861
Zimbabwe 17,292 24 17,316
TOTAL 26,435,004 72,298,810 117,004,008 1,024,224 663,682 217,425,729
FYRM: Former Yugoslav Republic of Macedonia* Countries not listed in this table means that there was no reliable database for unglazed collectors available** Unglazed air collectors in Switzerland: this is a very simple site-built system for hay drying
Table 17: Total collector area in operation by the end of 2008 [m2]
50
SOLAR HEAT WORLDWIDE 2011

7.6 References to reports and persons that have supplied the data
The production of the solar heat worldwide report 2009 was kindly supported by national representatives of the re-corded countries.
COUNTRY CONTACT SOURCE
Remarks
Albania Edmond M. Hido Albania-EU Energy Efficiency Centre (EEC)
Australia Sonja Ott Renewable Energy Team- Sustainability Victoria
new installed capacity in 2009 from Sonja Ott - totals projected by AEE INTEC
Austria Werner Weiss;
Manuela Eberl
AEE INTEC
Barbados James Husbands Solar Dynamics Ltd
Belgium ESTIF 2010 new installed according to ESTIF 2010 -
total installed projected from AEE INTEC database
Brazil Marcelo Mesquita;
Ronaldo Yano Toraiwa
Gestor do DASOL
Depto. Nac. Aquecimento Solar da ABRAVA
Bulgaria Ivanka Pandelieva Sofia energy center (SEC)
new installed from SEC; Ivanka Pandelieva - totals projected by AEE INTEC
Canada Doug McClenahan;
Reda Djebbar
Natural Resources Canada; SAIC Canada
Chile Cristian Yanez CDT Chile
China Hu Runqing Center for Renewable Energy Development -
Energy Research Institute (NDRC)
Share between types of collectors estimated by Hu Runqing
Cyprus ESTIF 2010 new installed according to ESTIF 2010 -
total installed projected from AEE INTEC database
Czech Republic ESTIF 2010 new installed according to ESTIF 2010 -
total installed projected from AEE INTEC database
Denmark Jens Windeleff ESTIF 2009 / Danish Energy Authority
new installed according to ESTIF 2010 -
total installed projected from AEE INTEC database
Estonia ESTIF 2010 (estimation) new installed according to ESTIF 2010 -
total installed projected from AEE INTEC database
Finland ESTIF 2010 (estimation) new installed according to ESTIF 2010 -
total installed projected from AEE INTEC database
France Céline Coulaud ADEME - Centre de Sophia Antipolis
Share between types of collectors /
applications according to AEE INTEC database
Germany ESTIF 2010 new installed according to ESTIF 2010 -
total installed projected from AEE INTEC database
51
SOLAR HEAT WORLDWIDE 2011

Greece Costas Travasaros;
Vassiliki Drosou
Centre for Renewable Energy Sources (CRES)
Hungary Pal Varga Association of Hungarian Building Engineers (MÉGSZ)
personal estimation Pal VARGA
India Jaideep Malaviya;
Prashant Bhanware
Greentech Knowledge Solutions Pvt. Ltd.
and Ministry of New and Renewable energies (MNRE)
http://mnes.nic.in/pdf/greentech-SWH-MarketAssessment-report.pdf
Ireland Amanda Barriscale Sustainable Energy Ireland
(Grant scheme data; GHS and REHEAT programmes)
Israel ESTIMATION AEE INTEC 2010
Italy Valeria Verga Associazione Italiana Solare Termico (Assolterm)
Assolterm-Assotermica market study;
Share between types of collectors edited by AEE INTEC
Japan Yamashita Noriaki ISEP - Institute for Sustainable Energy Policies
(ISEP, SSDA, METI)
Jordan Nidal Abdalla National Energy Research Center (NERC)
Korea, South ESTIMATION AEE INTEC 2010
Latvia ESTIF 2010 (estimation) new installed according to ESTIF 2010 - total installed projected from AEE
INTEC database
Lithuania ESTIF 2010 new installed according to ESTIF 2010 - total installed projected from AEE
INTEC database
Luxembourg ESTIF 2010 new installed according to ESTIF 2010 - total installed projected from AEE
INTEC database
Former Yugoslav
Republic of
Macedonia
Sanja
Popovska-Vasilevska
Solar Macedonia, Company Information and
Ministry of Economy of Republic of FYRM
new installed from Solar Former Yugoslav Republic of Macedonia; Sanja
Popovska-Vasilevska - totals projected by AEE INTEC
Malta Godwin Sant Malta Resources Authority
Mexico ANES Asociación Nacional de Energía Solar, A.C. (ANES),
Solarthermalworld
new installed systems from ANES, Solarthermalworld -
totals projected by AEE INTEC
Namibia Kudakwashe Ndhlukula Renewable Energy & Energy Efficiency Institute (REEEI)
REEEI Annual Market Survey
Netherlands Reinoud Segers Statistics Netherlands (CBS)
New Zealand ESTIMATION AEE INTEC 2010
Norway Fritjof Salvesen
Peter Bernhard
KanEnergi AS
52
SOLAR HEAT WORLDWIDE 2011

Poland Grzegorz Wisniewski;
Aneta Wiecka
Institute for Renewable Energy Ltd. (EC BREC)
glazed water collectors from EC BREC
Portugal João Farinha Mendes Unidadede Energia Solar
(sources: APISOLAR [Associação Portuguesa
da Indústria Solar] and ADENE [Agência para a Energia])
Romania ESTIF 2009 (estimation) new installed according to ESTIF 2010 -
total installed projected from AEE INTEC database
Slovakia ESTIF 2009 new installed according to ESTIF 2010 -
total installed projected from AEE INTEC database
Slovenia ESTIF 2009 new installed according to ESTIF 2010 -
total installed projected from AEE INTEC database
South Africa Dieter Holm SESSA
Spain Pascual Polo;
Esther Rojas
Asociación Solar de la Industria Térmica (ASIT)
Sweden Jan-Olof Dalenbäck Svensk solenergi; CHALMERS University of Technology
Switzerland Urs Wolfer SWISSOLAR
Taiwan K.M. Chung Energy Research Center - National Cheng Kung University
Thailand ESTIMATION AEE INTEC 2010
Tunisia Moncef Njaimi National Agency of Energy Conservation (ANME)
Turkey A. Kutay Ulke EZINC Metal San. Tic. A.S.
United Kingdom ESTIF 2009 new installed according to ESTIF 2010 -
total installed projected from AEE INTEC database
United States Peter Wong U.S. Department of Energy (DoE) -
Energy Information Administration (EIA)
Uruguay ESTIMATION AEE INTEC 2010
Zimbabwe Anton Schwarzlmüller DSH, Soltrain Market Report 2010
53
SOLAR HEAT WORLDWIDE 2011

7.6.1 Additional literature and web sources used
The following reports and statistics were used in this report.
• European Solar Thermal Industry Federation (ESTIF): Solar Thermal Markets in Europe, Trends andMarketStatistics 2009; Belgium - Brussels; June 2010
• Bundesamt für Energie (BFE): Markterhebung Sonnenenergie 2009 - Teilstatistik der Schweizerischen Statistikder erneuerbaren Energien, Switzerland - Bern; July 2010
• Bundesministerium für Verkehr, Innovation und Technologie (BMVIT): Innovative Energietechnologien inÖsterreich –Marktentwicklung 2009;Wien;May 2010
• U.S. Department of energy (DoE) - Energy Information Administration (EIA): Solar Thermal Collector Manufac-turing Activities 2009, U.S. Energy Information Administration DOE/EIA,Washington: December 2010
• Bank Sarasin & Cie AG: Solarwirtschaft – Uterwegs in neueDimensionen (Technologien, Märkte und IndustrienimVergleich); Bank Sarasin & Co. Ltd (“BSC”), Switzerland – Basel: November 2010
• REN 21: Renewables 2010 Global Status Report; Revised edition as of September 2010
• Eskom: The South African Solar Water Heater Industry, August 2009
• Global Solar Thermal Energy Council: http://www.solarthermalworld.org/
• SOLRICO: http://www.solrico.com/
• TECH4CDM - Renewable technologies and energy efficiency in Latin America; http://www.tech4cdm.com/
7.7 List of Figures
Figure 1: Countries represented in this report . . . . . . . . . . . . . . . . . . . . . . . . . . . . . . . . . . . . . . . . . . . . . . . . . . . . . . . . . . . . . . . . . . . . . . . . . . . . . . . . . . . . . . . . 4
Figure 2: Total capacity in operation [GWel], [GWth] 2009 and annually energy generated [TWhel], [TWhth].
Sources: EWEA, EPIA, GWEC, IEA SHC 2011, Morse Associates Inc., REN 21 . . . . . . . . . . . . . . . . . . . . . . . . . . . . . . . . . . . . . . . . 7
Figure 3: Share of the total installed capacity in operation (glazed and unglazedwater and air collectors)
by economic regions at the end of 2009 . . . . . . . . . . . . . . . . . . . . . . . . . . . . . . . . . . . . . . . . . . . . . . . . . . . . . . . . . . . . . . . . . . . . . . . . . . . . . . . . . . . . 8
Figure 4: Distribution of the total installed capacity in operation by collector type in 2009 . . . . . . . . . . . . . . . . . . . . . . . . . . . . . . . . . . . . 11
Figure 5: Total installed capacity of water collectors in operation in the 10 leading countries by the end of 2009 . . . . . . . . . . 11
Figure 6: Total capacity of glazed flat-plate and evacuated tube collectors in operation by the end of 2009 . . . . . . . . . . . . . . . . 12
Figure 7: Total capacity of glazed flat-plate and evacuated tube collectors in operation in kWthper1,000 inhabitants
by theendof2009 . . . . . . . . . . . . . . . . . . . . . . . . . . . . . . . . . . . . . . . . . . . . . . . . . . . . . . . . . . . . . . . . . . . . . . . . . . . . . . . . . . . . . . . . . . . . . . . . . . . . . . . . . . . . 12
Figure 8: Total capacity of glazed flat-plate and evacuated tube collectors in operation by economic region
at the end of 2009 . . . . . . . . . . . . . . . . . . . . . . . . . . . . . . . . . . . . . . . . . . . . . . . . . . . . . . . . . . . . . . . . . . . . . . . . . . . . . . . . . . . . . . . . . . . . . . . . . . . . . . . . . . . 13
Figure 9: Total capacity of glazed flat-plate and evacuated tube collectors in operation by economic region and in kWthper1,000 inhabitantsby theendof2009 . . . . . . . . . . . . . . . . . . . . . . . . . . . . . . . . . . . . . . . . . . . . . . . . . . . . . . . . . . . . . . . . . . . . . . . . . . . . . . . . . . . . 13
Figure 10: Total capacity of unglazedwater collectors in operation by the end of 2009 . . . . . . . . . . . . . . . . . . . . . . . . . . . . . . . . . . . . . . . . . 14
Figure 11: Total capacity of unglazedwater collectors in operation in kWthper1,000 inhabitantsby theendof2009 . . . . . . . . . 14
Figure 12: Total capacity of unglazed collectors in operation by economic region by the end of 2009 . . . . . . . . . . . . . . . . . . . . . . . . . 15
Figure 13: Total capacity of unglazed collectors in operation by economic region and in kWthper1,000 inhabitants
by theendof2009 . . . . . . . . . . . . . . . . . . . . . . . . . . . . . . . . . . . . . . . . . . . . . . . . . . . . . . . . . . . . . . . . . . . . . . . . . . . . . . . . . . . . . . . . . . . . . . . . . . . . . . . . . . . . 15
Figure 14: Share of the newly installed capacity (glazed and unglazedwater and air collectors)
by economic regions in 2009 . . . . . . . . . . . . . . . . . . . . . . . . . . . . . . . . . . . . . . . . . . . . . . . . . . . . . . . . . . . . . . . . . . . . . . . . . . . . . . . . . . . . . . . . . . . . . . . 16
Figure 15: Distribution of the newly installed capacity by collector type in 2009 . . . . . . . . . . . . . . . . . . . . . . . . . . . . . . . . . . . . . . . . . . . . . . . . . 19
Figure 16: Total capacity of newly installed glazed and unglazedwater collectors in the 10 leading countries in 2009 . . . . . 19
Figure 17: Newly installed capacity of glazedwater collectors in 2009 . . . . . . . . . . . . . . . . . . . . . . . . . . . . . . . . . . . . . . . . . . . . . . . . . . . . . . . . . . . . 20
Figure 18: Newly installed capacity of glazedwater collectors in 2009 in kWthper1,000 inhabitants . . . . . . . . . . . . . . . . . . . . . . . . . . . 21
54
SOLAR HEAT WORLDWIDE 2011

Figure 19: Annually installed capacity of flat-plate and evacuated tube collectors from2000 to 2009 . . . . . . . . . . . . . . . . . . . . . . . . 22
Figure 20: Annually installed capacity of flat-plate and evacuated tube collectors in kWthper1,000 inhabitants
from2000to2009 . . . . . . . . . . . . . . . . . . . . . . . . . . . . . . . . . . . . . . . . . . . . . . . . . . . . . . . . . . . . . . . . . . . . . . . . . . . . . . . . . . . . . . . . . . . . . . . . . . . . . . . . . . . . 23
Figure 21: Newly installed capacity of glazedwater collectors per 1,000 inhabitants in the 10 leading countries 2009 . . . . . 23
Figure 22: Annually installed capacity of unglazedwater collectors from2000 to 2009 . . . . . . . . . . . . . . . . . . . . . . . . . . . . . . . . . . . . . . . . . 24
Figure 23: Annual collector yield of glazed flat-plate and evacuated tube collectors in operation by economic region in
2009 . . . . . . . . . . . . . . . . . . . . . . . . . . . . . . . . . . . . . . . . . . . . . . . . . . . . . . . . . . . . . . . . . . . . . . . . . . . . . . . . . . . . . . . . . . . . . . . . . . . . . . . . . . . . . . . . . . . . . . . . . . . 29
Figure 24: Annual collector yield of glazed flat-plate and evacuated tube collectors in operation by economic region
inMWhper 1,000 inhabitants in 2009 . . . . . . . . . . . . . . . . . . . . . . . . . . . . . . . . . . . . . . . . . . . . . . . . . . . . . . . . . . . . . . . . . . . . . . . . . . . . . . . . . . . . 29
Figure 25: Annual collector yield of unglazedwater collectors in operation by economic region in 2009 . . . . . . . . . . . . . . . . . . . . . 30
Figure 26: Annual collector yield of unglazedwater collectors in operation by economic region inMWh
per 1,000 inhabitants in 2009 . . . . . . . . . . . . . . . . . . . . . . . . . . . . . . . . . . . . . . . . . . . . . . . . . . . . . . . . . . . . . . . . . . . . . . . . . . . . . . . . . . . . . . . . . . . . . . 30
Figure 27: Annual energy savings in oil equivalent by glazed flat-plate and evacuated tube collectors in operation
by economic region in 2009 . . . . . . . . . . . . . . . . . . . . . . . . . . . . . . . . . . . . . . . . . . . . . . . . . . . . . . . . . . . . . . . . . . . . . . . . . . . . . . . . . . . . . . . . . . . . . . . . 31
Figure 28: Annual energy savings in oil equivalent by glazed flat-plate and evacuated tube collectors in operation
by economic region per 1,000 inhabitants in 2009 . . . . . . . . . . . . . . . . . . . . . . . . . . . . . . . . . . . . . . . . . . . . . . . . . . . . . . . . . . . . . . . . . . . . . . 31
Figure 29: Annual energy savings in oil equivalents by unglazedwater collectors in operation
by economic region in 2009 . . . . . . . . . . . . . . . . . . . . . . . . . . . . . . . . . . . . . . . . . . . . . . . . . . . . . . . . . . . . . . . . . . . . . . . . . . . . . . . . . . . . . . . . . . . . . . . . 32
Figure 30: Annual energy savings in oil equivalent by unglazedwater collectors in operation by economic region
per 1,000 inhabitants in 2009 . . . . . . . . . . . . . . . . . . . . . . . . . . . . . . . . . . . . . . . . . . . . . . . . . . . . . . . . . . . . . . . . . . . . . . . . . . . . . . . . . . . . . . . . . . . . . . 32
Figure 31: Contribution to CO2 reduction by flat-plate and evacuated tube collectors in operation by economic region in
2009 . . . . . . . . . . . . . . . . . . . . . . . . . . . . . . . . . . . . . . . . . . . . . . . . . . . . . . . . . . . . . . . . . . . . . . . . . . . . . . . . . . . . . . . . . . . . . . . . . . . . . . . . . . . . . . . . . . . . . . . . . . . 33
Figure 32: Contribution to CO2 reduction by flat-plate and evacuated tube collectors in operation by economic region
per 1,000 inhabitants in 2009 . . . . . . . . . . . . . . . . . . . . . . . . . . . . . . . . . . . . . . . . . . . . . . . . . . . . . . . . . . . . . . . . . . . . . . . . . . . . . . . . . . . . . . . . . . . . . . 33
Figure 33: Contribution to CO2 reduction by unglazed collectors in operation by economic region in 2009 . . . . . . . . . . . . . . . . . . 34
Figure 34: Contribution to CO2 reduction by unglazedwater collectors in operation by economic region
per 1,000 inhabitants in 2009 . . . . . . . . . . . . . . . . . . . . . . . . . . . . . . . . . . . . . . . . . . . . . . . . . . . . . . . . . . . . . . . . . . . . . . . . . . . . . . . . . . . . . . . . . . . . . . 34
Figure 35: Weighted distribution of solar thermal systems by application for the total installed glazedwater collector
capacity in operation by the end of 2009 . . . . . . . . . . . . . . . . . . . . . . . . . . . . . . . . . . . . . . . . . . . . . . . . . . . . . . . . . . . . . . . . . . . . . . . . . . . . . . . . . 35
Figure 36: Distribution of solar thermal systems by application for the 10 leadingmarkets of the total installed glazed
water collector capacity in operation by the end of 2009 . . . . . . . . . . . . . . . . . . . . . . . . . . . . . . . . . . . . . . . . . . . . . . . . . . . . . . . . . . . . . . . 36
Figure 37: Weighted distribution of different applications of the newly installed capacity of glazedwater collectors
by economic region in 2009 . . . . . . . . . . . . . . . . . . . . . . . . . . . . . . . . . . . . . . . . . . . . . . . . . . . . . . . . . . . . . . . . . . . . . . . . . . . . . . . . . . . . . . . . . . . . . . . . 36
Figure 38: Distribution of different applications of the newly installed capacity of glazedwater collectors
for the 6 leading countries worldwide in 2009 . . . . . . . . . . . . . . . . . . . . . . . . . . . . . . . . . . . . . . . . . . . . . . . . . . . . . . . . . . . . . . . . . . . . . . . . . . . . 37
Figure 39: Distribution of different applications of the newly installed capacity of glazedwater collectors
for the 8 leading European countries in 2009 . . . . . . . . . . . . . . . . . . . . . . . . . . . . . . . . . . . . . . . . . . . . . . . . . . . . . . . . . . . . . . . . . . . . . . . . . . . . 37
Figure 40: Weighted share between thermosiphon and pumped systems by economic region for newly installed
glazedwater collectors in 2009 . . . . . . . . . . . . . . . . . . . . . . . . . . . . . . . . . . . . . . . . . . . . . . . . . . . . . . . . . . . . . . . . . . . . . . . . . . . . . . . . . . . . . . . . . . . . 38
Figure 41: Share between thermosiphon and pumped systems for newly installed glazedwater collectors
for the 10 leading countries worldwide in 2009 . . . . . . . . . . . . . . . . . . . . . . . . . . . . . . . . . . . . . . . . . . . . . . . . . . . . . . . . . . . . . . . . . . . . . . . . . . 38
Figure 42: Large-scale solar heating and cooling systems in operation in Europe by the end of 2009
(Source: Jan-Olof Dalenbäck - Chalmers University of Technology) . . . . . . . . . . . . . . . . . . . . . . . . . . . . . . . . . . . . . . . . . . . . . . . . . . 39
Figure 43: Hydraulic scheme of the swimming pool reference system . . . . . . . . . . . . . . . . . . . . . . . . . . . . . . . . . . . . . . . . . . . . . . . . . . . . . . . . . . . . 41
Figure 44: Hydraulic scheme of the DHWpumped reference system . . . . . . . . . . . . . . . . . . . . . . . . . . . . . . . . . . . . . . . . . . . . . . . . . . . . . . . . . . . . . . 43
Figure 45: Hydraulic scheme of the DHW thermosiphon reference system . . . . . . . . . . . . . . . . . . . . . . . . . . . . . . . . . . . . . . . . . . . . . . . . . . . . . . . 43
Figure 46: Hydraulic scheme of the DHW system formulti-family houses . . . . . . . . . . . . . . . . . . . . . . . . . . . . . . . . . . . . . . . . . . . . . . . . . . . . . . . . 44
Figure 47: Hydraulic scheme of the solar combi reference system . . . . . . . . . . . . . . . . . . . . . . . . . . . . . . . . . . . . . . . . . . . . . . . . . . . . . . . . . . . . . . . . . 45
55
SOLAR HEAT WORLDWIDE 2011
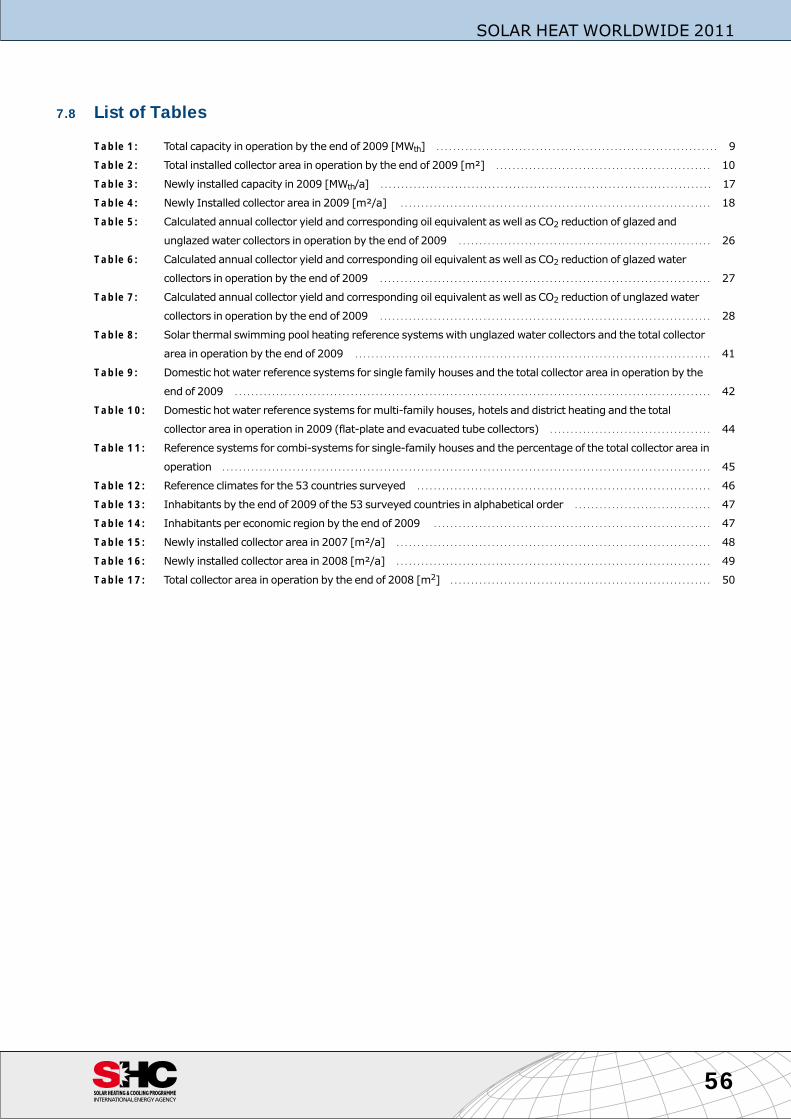
7.8 List of Tables
Table 1: Total capacity in operation by the end of 2009 [MWth] . . . . . . . . . . . . . . . . . . . . . . . . . . . . . . . . . . . . . . . . . . . . . . . . . . . . . . . . . . . . . . . . . . . . 9
Table 2: Total installed collector area in operation by the end of 2009 [m²] . . . . . . . . . . . . . . . . . . . . . . . . . . . . . . . . . . . . . . . . . . . . . . . . . . . . 10
Table 3: Newly installed capacity in 2009 [MWth/a] . . . . . . . . . . . . . . . . . . . . . . . . . . . . . . . . . . . . . . . . . . . . . . . . . . . . . . . . . . . . . . . . . . . . . . . . . . . . . . . . 17
Table 4: Newly Installed collector area in 2009 [m²/a] . . . . . . . . . . . . . . . . . . . . . . . . . . . . . . . . . . . . . . . . . . . . . . . . . . . . . . . . . . . . . . . . . . . . . . . . . . . 18
Table 5: Calculated annual collector yield and corresponding oil equivalent as well as CO2 reduction of glazed and
unglazedwater collectors in operation by the end of 2009 . . . . . . . . . . . . . . . . . . . . . . . . . . . . . . . . . . . . . . . . . . . . . . . . . . . . . . . . . . . . . 26
Table 6: Calculated annual collector yield and corresponding oil equivalent as well as CO2 reduction of glazedwater
collectors in operation by the end of 2009 . . . . . . . . . . . . . . . . . . . . . . . . . . . . . . . . . . . . . . . . . . . . . . . . . . . . . . . . . . . . . . . . . . . . . . . . . . . . . . . . 27
Table 7: Calculated annual collector yield and corresponding oil equivalent as well as CO2 reduction of unglazedwater
collectors in operation by the end of 2009 . . . . . . . . . . . . . . . . . . . . . . . . . . . . . . . . . . . . . . . . . . . . . . . . . . . . . . . . . . . . . . . . . . . . . . . . . . . . . . . . 28
Table 8: Solar thermal swimming pool heating reference systemswith unglazedwater collectors and the total collector
area in operation by the end of 2009 . . . . . . . . . . . . . . . . . . . . . . . . . . . . . . . . . . . . . . . . . . . . . . . . . . . . . . . . . . . . . . . . . . . . . . . . . . . . . . . . . . . . . . 41
Table 9: Domestic hot water reference systems for single family houses and the total collector area in operation by the
end of 2009 . . . . . . . . . . . . . . . . . . . . . . . . . . . . . . . . . . . . . . . . . . . . . . . . . . . . . . . . . . . . . . . . . . . . . . . . . . . . . . . . . . . . . . . . . . . . . . . . . . . . . . . . . . . . . . . . . . . 42
Table 10: Domestic hot water reference systems formulti-family houses, hotels and district heating and the total
collector area in operation in 2009 (flat-plate and evacuated tube collectors) . . . . . . . . . . . . . . . . . . . . . . . . . . . . . . . . . . . . . . . 44
Table 11: Reference systems for combi-systems for single-family houses and the percentage of the total collector area in
operation . . . . . . . . . . . . . . . . . . . . . . . . . . . . . . . . . . . . . . . . . . . . . . . . . . . . . . . . . . . . . . . . . . . . . . . . . . . . . . . . . . . . . . . . . . . . . . . . . . . . . . . . . . . . . . . . . . . . . . 45
Table 12: Reference climates for the 53 countries surveyed . . . . . . . . . . . . . . . . . . . . . . . . . . . . . . . . . . . . . . . . . . . . . . . . . . . . . . . . . . . . . . . . . . . . . . . 46
Table 13: Inhabitants by the end of 2009 of the 53 surveyed countries in alphabetical order . . . . . . . . . . . . . . . . . . . . . . . . . . . . . . . . . 47
Table 14: Inhabitants per economic region by the end of 2009 . . . . . . . . . . . . . . . . . . . . . . . . . . . . . . . . . . . . . . . . . . . . . . . . . . . . . . . . . . . . . . . . . . . 47
Table 15: Newly installed collector area in 2007 [m²/a] . . . . . . . . . . . . . . . . . . . . . . . . . . . . . . . . . . . . . . . . . . . . . . . . . . . . . . . . . . . . . . . . . . . . . . . . . . . . 48
Table 16: Newly installed collector area in 2008 [m²/a] . . . . . . . . . . . . . . . . . . . . . . . . . . . . . . . . . . . . . . . . . . . . . . . . . . . . . . . . . . . . . . . . . . . . . . . . . . . . 49
Table 17: Total collector area in operation by the end of 2008 [m2] . . . . . . . . . . . . . . . . . . . . . . . . . . . . . . . . . . . . . . . . . . . . . . . . . . . . . . . . . . . . . . . 50
56
SOLAR HEAT WORLDWIDE 2011