sol: transport sector flood recovery project- social ... · transport sector flood recovery project...
TRANSCRIPT

Social Monitoring Report Report September 2015
SOL: Transport Sector Flood Recovery Project-Social Impact Assessment Report Prepared by the Ministry of Infrastructure Development for the Solomon Islands Government and the Asian Development Bank.
This social monitoring report is a document of the borrower. The views expressed herein do not necessarily represent those of ADB's Board of Directors, Management, or staff, and may be preliminary in nature. In preparing any country program or strategy, financing any project, or by making any designation of or reference to a particular territory or geographic area in this document, the Asian Development Bank does not intend to make any judgments as to the legal or other status of any territory or area.

Transport Sector Flood Recovery Project
Solomon Islands
FEASIBILITY REPORT
7. Social Impact Assessment Report
23 September 2015
Prepared By: SMEC International Pty Ltd in Association with IMC Worldwide Ltd
For: Ministry of Infrastructure Development, Government of the Solomon Islands
The Asian Development Bank

FEASIBILITY REPORT: 7. Social Impact Assessment Report
Loan No. 3152-SOL and Grant 0403-SOL: TSFRP and Grant 0243-SOL: TSDP – Design and Supervision Consulting Services
FEASIBILITY REPORT: 7. Social Impact Assessment
23-Sep-15
ii
FEASIBILITY STUDY REPORT REGISTER
S. No Abbreviation Report Title Author Submission Date
1 OAR Option Assessment Report Bridge/Structural Design Engineer 04-Sep-15
2 HHAR Hydrologic and Hydraulic Analysis Report
Hydrology & Hydraulics Engineer 04-Sep-15
3 CC&DRM Climate Change Impact & Disaster Risk Management Report
CCA&DRM Specialist
4 EER Economic Evaluation Report Transport Economist 04-Sep-15
5 CCR Community Consultation Report Social Safeguards Specialist 14-Sep-15
5.1 CPP Consultation and Participation Plan CCA&DRM Specialist 22-Sep-15
6 PER Preliminary Environmental Report Environmental Safeguards Specialist
7 SIA Social Impact Assessment Report Social Safeguards Specialist 23-Sep-15
8 RP Resettlement Plan Social Safeguards Specialist
FEASIBILITY REPORT: 7. Social Impact Assessment Report
Loan No. 3152-SOL and Grant 0403-SOL: TSFRP and Grant 0243-SOL: TSDP – Design and Supervision Consulting Services
FEASIBILITY REPORT: 7. Social Impact Assessment
23-Sep-15
iii
TABLE OF CONTENTS
FEASIBILITY STUDY REPORT REGISTER .................................................................................................... II TABLE OF CONTENTS ....................................................................................................................................... III LIST OF TABLES .................................................................................................................................................. V
LIST OF FIGURES ................................................................................................................................................. V
ABBREVIATIONS AND DEFINITIONS ........................................................................................................... VI
A. EXECUTIVE SUMMARY .......................................................................................................................... 1
B. INTRODUCTION....................................................................................................................................... 4
B.1 General................................................................................................................................................................... 4
B.2 The Subprojects and Locations .............................................................................................................................. 4
C. OBJECTIVE AND METHODOLOGY OF THE SOCIAL IMPACT ASSESSMENT .......................... 5
C.1 Objectives and Scope of the Social Impact Assessment ....................................................................................... 5
C.2 Working Methodology ............................................................................................................................................. 5
D. DEMOGRAPHIC ANALYSIS ............................................................................................................... 7
D.1 Population in the Project Area ................................................................................................................................ 7
D.2 Major Demographic Characteristics of the Surveyed Population ........................................................................... 7
D.2.1 Age Structure .................................................................................................................................................................... 7
D.2.2 Literacy ............................................................................................................................................................................. 7
D.2.3 Marital Status .................................................................................................................................................................... 8
D.3 Household Characteristics ..................................................................................................................................... 8
D.3.1 Structure of Family............................................................................................................................................................ 8
D.3.2 Gender .............................................................................................................................................................................. 8
D.3.3 Household Size................................................................................................................................................................. 9
D.3.4 Religion ............................................................................................................................................................................. 9
E. SOCIOECONOMIC ANALYSIS .............................................................................................................. 10
E.1 Income and Source .............................................................................................................................................. 10
E.1.1 Household Income .......................................................................................................................................................... 10
E.1.2 Source of Earned Income ............................................................................................................................................... 11
E.1.3 Source of Non-earned Income........................................................................................................................................ 11
E.2 Expenditure ................................................................................................................................................................ 12
E.3 Poverty Situation ........................................................................................................................................................ 13
F. IMPACT OF THE 2014 FLOOD IN THE PROJECT AREA ............................................................. 14
F.1 Impacts on Assets and Income .................................................................................................................................. 14
F.2 Impact on Access to Facilities and Transportation ..................................................................................................... 14
F.3 Impact on Women ...................................................................................................................................................... 15
G. COMMUNITY CONSULTATION AND PARTICIPATION ............................................................... 16
H. SOCIAL SAFEGUARD ASPECT ............................................................................................................ 18
H.1 Project’s Land Acquisition Strategy ...................................................................................................................... 18
H.2 Preliminary Identification of LAR Impact ............................................................................................................... 18
H.3 Resettlement Plan ................................................................................................................................................ 19
I. RISK ASSESSMENT AND MITIGATION PLAN ................................................................................... 20
I.1 Potential Risks Associated with the Project................................................................................................................. 20
I.1.1 Anti-social Behavior ............................................................................................................................................................ 20
I.1.2 Noise, Disturbance and other Social Nuisance ................................................................................................................... 20
I.1.3 Disruption to Traffic ............................................................................................................................................................. 20
I.1.4 Accidents ..................................................................................................................................................................... 20
I.1.5 Transmission of communicable diseases such as STD/HIV/AIDS ............................................................ 20

FEASIBILITY REPORT: 7. Social Impact Assessment Report
Loan No. 3152-SOL and Grant 0403-SOL: TSFRP and Grant 0243-SOL: TSDP – Design and Supervision Consulting Services
FEASIBILITY REPORT: 7. Social Impact Assessment
23-Sep-15
iv
H.2 RISK MITIGATION MEASURES ............................................................................................................................... 21
I.2.1 Mitigation of Anti-social Behavior ........................................................................................................................................ 21
I.2.2 Mitigation of Noise, Disturbance and other Social Nuisance .............................................................................................. 21
I.2.3 Mitigation of Disruption of Traffic......................................................................................................................................... 21
I.2.4 Mitigation of Accidents ........................................................................................................................................................ 21
I.2.5 Mitigation of Transmission of STD, HIV/AIDS ..................................................................................................................... 21
J. CONCLUSION AND RECOMMENDATION ........................................................................................... 22
J.1 Conclusion............................................................................................................................................................ 22
J.2 Recommendations ............................................................................................................................................... 22
APPENDICES ....................................................................................................................................................... 23
APPENDIX 1 – TSFRP Subproject Location Map ................................................................................... 24
APPENDIX 2 – Household Socioeconomic Survey Questionnaire .................................................. 26
APPENDIX 3 – Participatory Assessment Checklist ............................................................................ 37

FEASIBILITY REPORT: 7. Social Impact Assessment Report
Loan No. 3152-SOL and Grant 0403-SOL: TSFRP and Grant 0243-SOL: TSDP – Design and Supervision Consulting Services
FEASIBILITY REPORT: 7. Social Impact Assessment
23-Sep-15
v
LIST OF TABLES Table 1. Age structure of the Surveyed Population ......................................................................................................................................... 7
Table 2. Literacy among the Surveyed Population .......................................................................................................................................... 7
Table 3. Marital Status of the Surveyed Population ........................................................................................................................................ 8
Table 4. Family Structure in Different Wards .................................................................................................................................................. 8
Table 5. Gender of Household Heads ............................................................................................................................................................. 8
Table 6. Household Size of the Surveyed Families ......................................................................................................................................... 9
Table 7. Income Range of Surveyed Households ......................................................................................................................................... 10
Table 8. Ward Specific Income for the Households ...................................................................................................................................... 10
Table 9. Ward Specific Annual Average Household Expenditure ................................................................................................................. 12
Table 10. Percentage of Surveyed Households Living Below the Poverty Line ............................................................................................ 13
Table 11. Percentage of Surveyed Households Affected in Income for 2014 Flood ..................................................................................... 14
Table 12. Households' perception regarding different services after 2014 flood ........................................................................................... 14
Table 13. Expression of Support from the Community Representatives ....................................................................................................... 16
Table 14. Community Peoples' Perceived Benefits of the Project ................................................................................................................ 16
Table 15. Perceived Negative Impacts of the Project ................................................................................................................................... 17
Table 16. Overall Potential Impact of the Project on Assets ......................................................................................................................... 18
Table 17. Details of Impact on Structures ..................................................................................................................................................... 18
Table 18. Potential Impact on Trees ............................................................................................................................................................. 19
LIST OF FIGURES
Figure 1. West Guadalcanal SP Locations ...................................................................................................................................................... 4
Figure 2. East Guadalcanal SP Locations ....................................................................................................................................................... 4
Figure 3. Tambea Market Household Survey (27/07/15) ................................................................................................................................ 6
Figure 4. Mbalasuna Bridge Household Survey (03/08/15) ............................................................................................................................ 6
Figure 5. Belamatanga Bridge Household Survey (05/08/15) ......................................................................................................................... 6
Figure 6. Poha Bridge Household Survey (07/08/15) ...................................................................................................................................... 6
Figure 7. Different Sources for Earned Income in Surveyed Households ..................................................................................................... 11
Figure 8. Sources for Non-earned Income of the Surveyed Households ...................................................................................................... 11
Figure 9. Different Areas of Food Expenditure for the Households (Annual Expenditure) ............................................................................ 12
Figure 10. Different Areas of Non-food Expenditure of the Households ....................................................................................................... 13
Figure 11. Tambea Market Culvert Community Consultation (27/07/15) ...................................................................................................... 17
Figure 12. Mberande Bridge Community Consultation (12/08/15) ................................................................................................................ 17

FEASIBILITY REPORT: 7. Social Impact Assessment Report
Loan No. 3152-SOL and Grant 0403-SOL: TSFRP and Grant 0243-SOL: TSDP – Design and Supervision Consulting Services
FEASIBILITY REPORT: 7. Social Impact Assessment
23-Sep-15
vi
ABBREVIATIONS AND DEFINITIONS
ADB Asian Development Bank
ACOM Anglican Church of Melanesia
AP Affected Person
CPIU Central Project Implementation Unit
CSS Census and Socioeconomic Survey
DSC Design and Supervision Consultant
EA Executing Agency
HIES Household Income and Expenditure Survey
HIV/AIDs Human Immunodeficiency Virus / Acquired Immunodeficiency Syndrome
IA Implementing Agency
LAR Land Acquisition and Resettlement
MID Ministry of Infrastructure Development
NGO Non-Government Organisation
RP Resettlement Plan
SIA Social Impact Assessment
SIG Solomon Islands Government
SIRIP Solomon Islands Road Improvement Project
SP Subproject
STD Sexually Transmitted Disease
TOR Terms of Reference
TSFRP Transport Sector Flood Recovery Project (this Project)

FEASIBILITY REPORT: 7. Social Impact Assessment Report
Loan No. 3152-SOL and Grant 0403-SOL: TSFRP and Grant 0243-SOL: TSDP – Design and Supervision Consulting Services
FEASIBILITY REPORT: 7. Social Impact Assessment
23-Sep-15
1
A. EXECUTIVE SUMMARY
The Solomon Islands Government (SIG), with assistance from the Asian Development Bank (ADB), has undertaken the Transport
Sector Flood Recovery Project (TSFRP) (the Project) for reconstruction and rehabilitation of bridges, culverts and causeways including
associated infrastructure that were damaged by severe flooding during early April 2014 as a result of Cyclone Ita. The Ministry of
Infrastructure Development (MID) as the Executing Agency (EA) is responsible on behalf of the SIG to implement the TSFRP through its
existing Central Project Implementation Unit (CPIU) as the Implementing Agency (IA). CPIU is supported by SMEC International Pty
Limited of Australia in Joint Venture with IMC Worldwide of the UK as the Design and Supervision Consultant (DSC).
The Project has been initiated for improvement of 19 Subprojects (SPs) which includes bridges, causeways, culverts, and associated
improvements including road approaches, embankment protection and river training. All SPs, except Goldridge Bridge, are located on
the Guadalcanal Road that runs between east and west within the Guadalcanal Province, having the capital city Honiara in the middle.
The Goldridge Bridge is located on a connecting road which feeds into the Guadalcanal Road from the Goldridge mine site.
Of the 19 SPs; six bridges, six culverts and two causeways are located in West Guadalcanal Province. The remaining four bridges and
one culvert are located in East Guadalcanal Province. The TSFRP does not include any development initiative within the Honiara City
Council area. Locations of the SPs are shown in Section B and Appendix 1.
The Design and Supervision Consultant (DSC) conducted household surveys as well as participatory assessments covering all SP areas
between 27 July and 17 August 2015. Data collection was carried out to generate a socioeconomic baseline of the households likely to
be affected by the project interventions and to measure the potential impacts. A total of 112 households, selected on a random basis,
were surveyed. Primary data and information were collected by using a Household Survey Questionnaire and a Participatory
Assessment Checklist (Appendix 2 and 3 respectively).
Following this data collection exercise, the data was then consolidated and analyzed. Identification of potential mitigation measures were
also part of the analysis process. After completion of the analysis, the present document has been framed as the draft Social Impact
Assessment (SIA) Report.
As part of the project implementation assistance, and in fulfillment of the requirements of ADB policy on Involuntary Resettlement, it is a
requirement to prepare this SIA, covering the whole area of the TSFRP. The objective is to expose the adverse social impact of the
Project, and hence to develop strategies to manage these impacts focusing on the enhancement of positive impacts and the mitigation
of potential negative impacts. The data and information in this SIA will provide the basis for developing a Resettlement Plan (RP) for the
Project, and thereby to address the social issues and potential impacts on local community and the affected persons (APs) of the project
area. In developing the RP, the SIA will assist in providing baseline information on the existing socioeconomic status of the APs, as well
as providing possible socioeconomic impacts of the proposed project in advance.
Geographic coverage of the Project is six wards within the Guadalcanal Province comprising East Tasimboko, Ghaobata, Sahalu,
Savulei, Tandai and Vulolo. At the time of Census in 2009, the population of the Province was estimated at 93,613. Considering the
growth rate of 4.4%1, estimated population of the Guadalcanal Province is 118,327. Within the Saghalu Ward there are four SPs
comprising of Araligo, Sasa, Tambea and Selwyn College Causeway, with an approximate population of 6,429. Tandai to Turtle Beach
component has an approximate population of 14,995. Population in the Gold Ridge area is approximately 10,532. These are the major
populous areas between the SPs. Across the total project area, approximate population is about 48,871. Male to female ratio in this
population is about 50.7:49.3.
The majority of the surveyed population (39%) was found to be within the age group of 25-59 years, while 33% was found to be under 14
years of age. With regard to the educational attainment, elementary school level was found to be the highest (39%), while junior high
school level education was found to be 28%, and senior high school level 19%. The majority of the surveyed population was found to be
married (44%), while 38% was found to be under marital age or having other type of marital status, with16% unmarried.
More than half (58 of 112) of the surveyed families in the project area were found to be nuclear, and around one third are joint families
(37 of 112). All of the surveyed household heads in East Tasimboko and Suvelei were found to be male. Vulolo has some households
with female heads. Average size of the surveyed households was found to be 6.03, with male members on an average 3.05 per
household and 2.97 women. All the surveyed households were found to be followers of Christianity.
1 Provincial Profile of the 2009 Population and Housing Census, Guadalcanal, Solomon Islands Government

FEASIBILITY REPORT: 7. Social Impact Assessment Report
Loan No. 3152-SOL and Grant 0403-SOL: TSFRP and Grant 0243-SOL: TSDP – Design and Supervision Consulting Services
FEASIBILITY REPORT: 7. Social Impact Assessment
23-Sep-15
2
Average total household income was found to be SBD 37,578 annually, out of which almost three forth was seen coming from different
income earning activities, i.e. earned income. Businesses other than trade and sales generate the highest portion of the earned income
for the families. Agriculture also has a high contribution in this type of income. “Public service” and “trade or sales” have significant
contribution in households’ annual income. Non-earned income of the households was seen to be dominated by land lease. More than
two thirds of the total non-earned annual income of the households was seen to be from this source.
Average household annual expenditure was found to be SBD 21,037 in the studied area. Among this, nearly 40% of the expenditure was
found to be for food. Expenditure on rice was found to be the principal food related expenses, which is almost half of the total food
expenditure of the surveyed households. In case of different non-food related expenditure, education constitutes 40% of the total annual
expenditure (non-food) for the surveyed households. Clothing and social activities are two other major non-food expenditure areas,
resulting in 21% and 15% of the total annual non-food expenditure of the household respectively.
According to the Household Income and Expenditure Survey (HIES) 2006, 22.7% of the total population of Solomon Island lives under
the poverty line. This definition of poverty line counts 1.25 USD (equivalent to 9.96 SBD) per day per capita income. Considering this
definition, the poverty situation in the surveyed area is not encouraging. It seemed from the survey that around 62% of the households
live under the poverty line.
Significant impact was found to be on the livelihood of the surveyed households due to the 2014 flooding. The impact can be measured
in terms of income loss, loss of possession, loss of crops and other assets. 71% of the surveyed households lost their income in one
way or the other. On average, SBD 5,111 worth of crop was lost per household. Surveyed households also lost an average of SBD
2,654 worth of household possessions or assets. Also, there were impacts on the social and economic life of the households which
cannot be measured in terms of financial indicators. Access to school, hospitals and other social facilities became difficult. Employment
opportunities also became difficult. For around half the households surveyed, access to transport became worse after the flood. For
them, travel time increased, travel speeds reduced, travel comfort reduced, and passenger transport quality overall was reduced
because of the 2014 flood. Damage of bridges, culverts and causeways can directly be attributed to these
Women were found to be directly affected due to the 2014 flood having impact on food crop cultivation and marketing. Due to the
damaged culverts, bridges and causeways, women have had to use alternative routes to carry garden products across rivers and have
had difficult and costly access to town markets. Production cost has also become higher due to increased travel cost, increased travel
time and difficulty in accessing market for inputs and sales. The April 2014 flood took almost a year before women and children could
have proper shelter. This was a significant impact on the daily life of women. They had to face hardship living in a crowded atmosphere
and had to be dependent on food supply from NGOs and the National Disaster Office for their livelihood. The situation resulted in
deterioration of health for women and children, even after almost one and a quarter year following the flood. 71% of the surveyed
households expressed that there was illness among the family members during the last one year period. In almost all the cases, the
diseases were found to be malaria and pneumonia.
In line with the scope of works defined for the DSC in the Terms of Reference (TOR), a series of community consultations were
conducted to ensure the full awareness and participation of community people, and to carry out an initial assessment of social impact
and to identify the issues and the level of support of the community to the Project. A total of 12 community consultation sessions were
conducted between 27 July and 12 August 2015.
The majority of the community consultation participants thought that the Project will reduce time for local people in terms of
transportation. They all expressed that the Project would re-establish their access to health and educational facilities, which is a bit
troublesome at this moment. The community participants also perceived some negative impacts. The majority expressed that there
would be loss of land, increased accidents and hazards, noise, disturbance and nuisance during implementation of the Project. Some of
the participants were found to be worried about the privacy of their lives, especially for women and girls. A small portion of the
participants also showed concerns about other negative impacts resulting from the influence of outsiders.
Although implementation of physical works will be carried out mostly on existing land, owned by the SIG, a certain scale of land
acquisition and resettlement (LAR) impacts are almost inevitable. This will have some impact on private, as well as communal assets,
including land and structures. It will be necessary to compensate all land owners for loss of land and other assets, as well as non-titled
owners of the affected property, including their loss of income and employment. The preliminary analysis reveals that several
households will be faced with potential impact on different types of assets - land, structure and trees. Initial estimates indicate that there
will be impact on one piece of land in East Guadalcanal with a magnitude of 4,000 m2, including impact on 8 structures and 1,037 plants
and trees in both West and East Guadalcanal. To address the adverse social impacts and as a measure to safeguard the interest of the
Affected Persons (AP) and their community, the SIG will prepare a Resettlement Plan (RP) for the Project to ensure that the APs are not

FEASIBILITY REPORT: 7. Social Impact Assessment Report
Loan No. 3152-SOL and Grant 0403-SOL: TSFRP and Grant 0243-SOL: TSDP – Design and Supervision Consulting Services
FEASIBILITY REPORT: 7. Social Impact Assessment
23-Sep-15
3
disadvantaged as a result of the acquisition of their assets.
As expressed by the community people and drawing on the experience of field observations there are some risk elements associated
with this Project. However, the majority of these risks are related to the physical works period of the Project, and are expected to be
temporary and localized. Some of these risk elements indicated by the local people are anti-social behavior; noise, disturbance and
other social nuisance, disruption to traffic; accidents; and transmission of communicable diseases such as STD/HIV/AIDS. Local
communities have already been consulted on the risk elements, and have been informed about appropriate measures to be adopted by
the Project during implementation of physical works.
In summary, the Project will contribute to economic growth and poverty reduction by reducing vehicle operating costs, improving
accessibility to market opportunities and economic and social services, as well as generating employment opportunities and income.
FEASIBILITY REPORT: 7. Social Impact Assessment Report
Loan No. 3152-SOL and Grant 0403-SOL: TSFRP and Grant 0243-SOL: TSDP – Design and Supervision Consulting Services
FEASIBILITY REPORT: 7. Social Impact Assessment
23-Sep-15
4
B. INTRODUCTION
B.1 General
The Solomon Islands Government (SIG), with assistance from the Asian Development Bank (ADB), has undertaken the Transport
Sector Flood Recovery Project (TSFRP) (the Project) for reconstruction and rehabilitation of bridges, culverts and causeways including
associated infrastructure that were damaged by severe flooding during early April 2014 as a result of Cyclone Ita. The Ministry of
Infrastructure Development (MID) as the Executing Agency (EA) is responsible on behalf of the SIG to implement the TSFRP through its
existing Central Project Implementation Unit (CPIU) as the Implementing Agency (IA). CPIU is supported by SMEC International Pty
Limited of Australia in Joint Venture with IMC Worldwide of the UK as the Design and Supervision Consultant (DSC).
B.2 The Subprojects and Locations
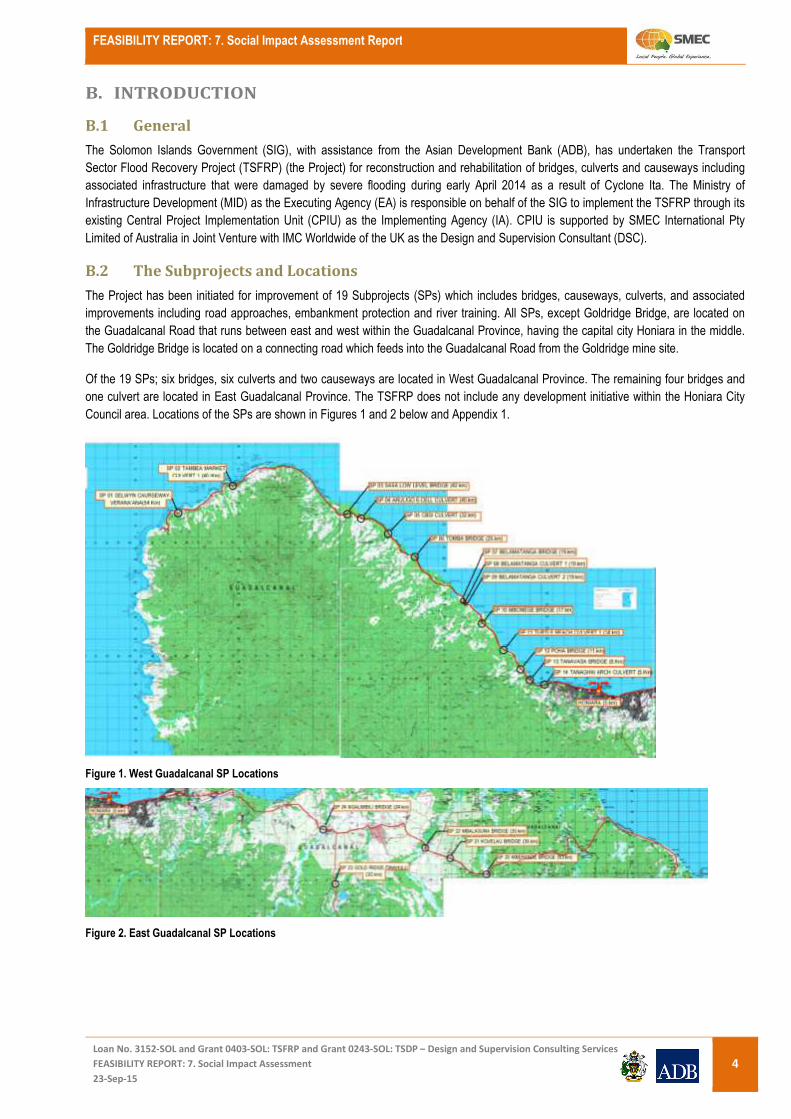
The Project has been initiated for improvement of 19 Subprojects (SPs) which includes bridges, causeways, culverts, and associated
improvements including road approaches, embankment protection and river training. All SPs, except Goldridge Bridge, are located on
the Guadalcanal Road that runs between east and west within the Guadalcanal Province, having the capital city Honiara in the middle.
The Goldridge Bridge is located on a connecting road which feeds into the Guadalcanal Road from the Goldridge mine site.
Of the 19 SPs; six bridges, six culverts and two causeways are located in West Guadalcanal Province. The remaining four bridges and
one culvert are located in East Guadalcanal Province. The TSFRP does not include any development initiative within the Honiara City
Council area. Locations of the SPs are shown in Figures 1 and 2 below and Appendix 1.
Figure 1. West Guadalcanal SP Locations
Figure 2. East Guadalcanal SP Locations

FEASIBILITY REPORT: 7. Social Impact Assessment Report
Loan No. 3152-SOL and Grant 0403-SOL: TSFRP and Grant 0243-SOL: TSDP – Design and Supervision Consulting Services
FEASIBILITY REPORT: 7. Social Impact Assessment
23-Sep-15
5
C. OBJECTIVE AND METHODOLOGY OF THE SOCIAL IMPACT ASSESSMENT
C.1 Objectives and Scope of the Social Impact Assessment
This is to reiterate that the TSFRP has been initiated for reconstruction and rehabilitation of 19 SPs, spreading over east and west of
Guadalcanal Province of the Solomon Islands. The broad objective of the Project is to contribute to the SIG’s plan of developing the
transport infrastructure and hence improving access and connectivity of communities, boost local economic growth and poverty
reduction in the country. It is consistent with the country’s National Transport Strategy. The scope of works includes improving 6 bridges,
6 culverts and 2 causeways that are located in West Guadalcanal, with the remaining 4 bridges and 1 culvert located in East
Guadalcanal Province. The Project does not however include any development initiative within the vicinity of Honiara City Council area.
As part of the project implementation assistance, and in fulfillment of the requirements of ADB policy on Involuntary Resettlement, it is a
requirement to prepare this SIA, covering the whole area of the TSFRP. The objective is to expose the adverse social impact of the
Project, and hence to develop strategies to manage these impacts focusing on the enhancement of positive impacts and the mitigation
of potential negative impacts. The data and information in this SIA will provide the basis for developing a Resettlement Plan (RP) for the
Project, and thereby to address the social issues and potential impacts on local community and the affected persons (APs) of the project
area. In developing the RP, the SIA will assist in providing baseline information on the existing socioeconomic status of the APs, as well
as providing possible socioeconomic impacts of the proposed project in advance.
C.2 Working Methodology
The DSC conducted household surveys as well as participatory assessments covering all the SP areas between 27 July and 17 August
2015. Data collection was carried out to generate a socioeconomic baseline of the households likely to be affected by the Project
interventions and to measure the potential impacts. The representatives’ leaders were gathered at convenient meeting places in the
villages near to the SP locations with numbers ranging from 15 to 25. Survey explanatory sessions were held before filling in the survey
forms. A total of 112 households, selected on a random basis, were surveyed. Mention should be made that the data derived from this
survey may not be 100% accurate, but rather is to help in understanding the overall situation in the Project area, and that it can be
considered that the situation in many of the SP areas is closely or nearly similar to each other.
Primary data and information were collected by using a Household Survey Questionnaire and a Participatory Assessment Checklist
(Appendix 2 & 3 respectively). The enumerators or interviewers were provided a briefing on the contents of the survey instrument and
the procedure on how the interviews should be conducted. To ensure uniformity in getting field data, the DSC Social Safeguards Team
paid careful attention to check the accuracy of data collected. Coordination with the Engineers assigned to the technical component of
the Project was maintained as and when required.
The questionnaire used in the survey was similar to the questionnaire already used on the ADB funded Solomon Islands Road
Improvement Project (SIRIP). The records of primary data and information collected by using the Household Survey Questionnaire and
Participatory Assessment Checklist have not been reproduced as part of this report, but are retained in the DSC’s Project Office,
Honiara for inspection at any time, should this be deemed necessary.
Following this data collection exercise, the data was then consolidated and analyzed. Identification of potential mitigation measures were
also part of the analysis process. After completion of the analysis, the present document has been framed as the draft SIA Report.
The following images (Figures 3 to 6) show Household Surveys being implemented by the DSC Social Safeguards Team.

FEASIBILITY REPORT: 7. Social Impact Assessment Report
Loan No. 3152-SOL and Grant 0403-SOL: TSFRP and Grant 0243-SOL: TSDP – Design and Supervision Consulting Services
FEASIBILITY REPORT: 7. Social Impact Assessment
23-Sep-15
6
Figure 4. Mbalasuna Bridge Household Survey (03/08/15)
Figure 6. Poha Bridge Household Survey (07/08/15)
Figure 3. Tambea Market Household Survey (27/07/15)
Figure 5. Belamatanga Bridge Household Survey (05/08/15)

FEASIBILITY REPORT: 7. Social Impact Assessment Report
Loan No. 3152-SOL and Grant 0403-SOL: TSFRP and Grant 0243-SOL: TSDP – Design and Supervision Consulting Services
FEASIBILITY REPORT: 7. Social Impact Assessment
23-Sep-15
7
D. DEMOGRAPHIC ANALYSIS
D.1 Population in the Project Area
Geographic coverage of the Project is six wards within the Guadalcanal Province comprising East Tasimboko, Ghaobata, Sahalu,
Savulei, Tandai and Vulolo. At the time of Census in 2009, the population of the Province was estimated at 93,613. Considering the
growth rate of 4.4%2, estimated population of the Guadalcanal Province is 118,327. Within the Saghalu Ward there are four SPs
comprising of Araligo, Sasa, Tambea and Selwyn College Causeway, with an approximate population of 6,429. Tandai to Turtle Beach
component has an approximate population of 14,995. Population in the Gold Ridge area is approximately 10,532. These are the major
populous areas between the SPs. Across the total project area, approximate population is about 48,871. Male to female ratio in this
population is about 50.7:49.3.
D.2 Major Demographic Characteristics of the Surveyed Population
D.2.1 Age Structure
Table 1 shows that majority of the surveyed population (39%) was found to be within the age group of 25-59 years. Another significant
portion (33%) was found to be under 14 years of age.
Table 1. Age structure of the Surveyed Population
Age Group Number of Surveyed Population in this Age Group
Percentage of Surveyed Population
0-14 223 33% 15-24 155 23% 25-59 263 39% 60+ 34 5%
Total 675 100%
D.2.2 Literacy
Elementary school level (Table 2) was found to be the highest educational attainment for majority of the surveyed population (39%).
Another significant portion was found to have junior high school level education (28%). A significant portion also was found in the level of
senior high school (19%).
Table 2. Literacy among the Surveyed Population
Educational Status No of Surveyed Population with
this Educational Status % of Surveyed Population with
this Educational Status
Illiterate 76 11%
Elementary School 260 39%
Junior High School 189 28%
Senior High School 128 19%
Graduate or Equivalent 13 2%
Above Graduate 9 1%
Total 675 100%
2 Provincial Profile of the 2009 Population and Housing Census, Guadalcanal, Solomon Islands Government
FEASIBILITY REPORT: 7. Social Impact Assessment Report
Loan No. 3152-SOL and Grant 0403-SOL: TSFRP and Grant 0243-SOL: TSDP – Design and Supervision Consulting Services
FEASIBILITY REPORT: 7. Social Impact Assessment
23-Sep-15
8
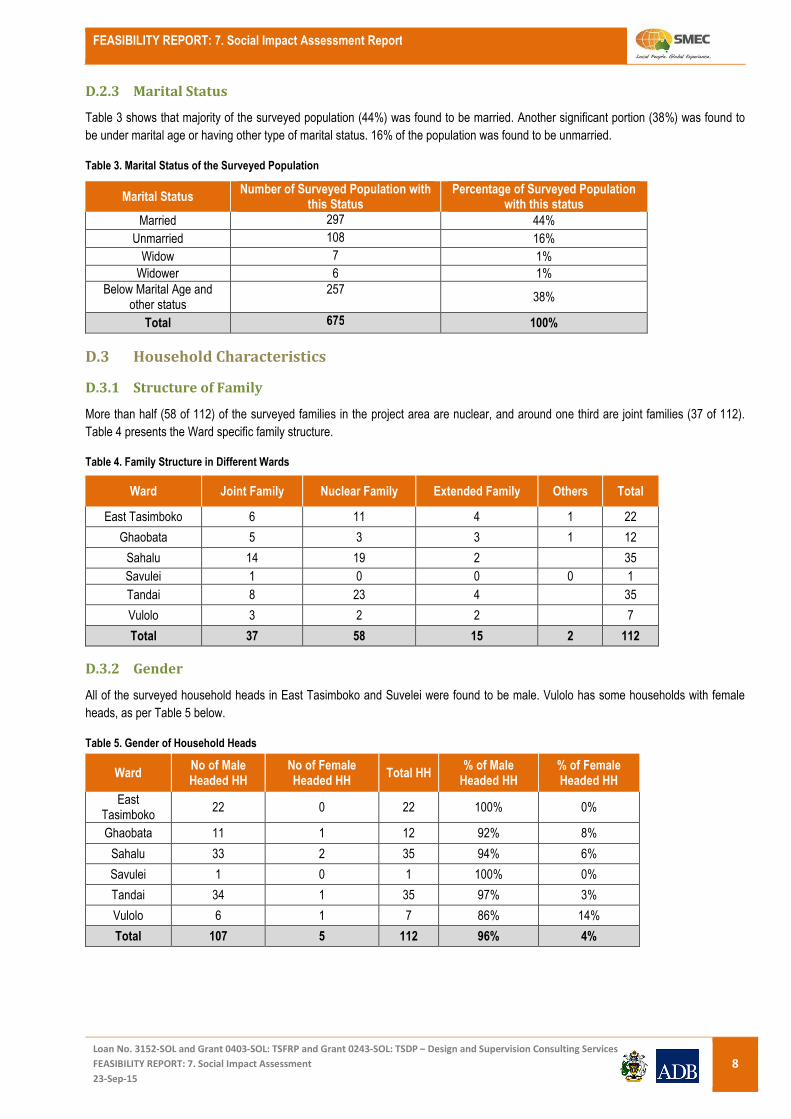
D.2.3 Marital Status
Table 3 shows that majority of the surveyed population (44%) was found to be married. Another significant portion (38%) was found to
be under marital age or having other type of marital status. 16% of the population was found to be unmarried.
Table 3. Marital Status of the Surveyed Population
Marital Status Number of Surveyed Population with
this Status Percentage of Surveyed Population
with this status
Married 297 44%
Unmarried 108 16%
Widow 7 1%
Widower 6 1% Below Marital Age and
other status 257
38%
Total 675 100%
D.3 Household Characteristics
D.3.1 Structure of Family
More than half (58 of 112) of the surveyed families in the project area are nuclear, and around one third are joint families (37 of 112).
Table 4 presents the Ward specific family structure.
Table 4. Family Structure in Different Wards
Ward Joint Family Nuclear Family Extended Family Others Total
East Tasimboko 6 11 4 1 22
Ghaobata 5 3 3 1 12
Sahalu 14 19 2
35
Savulei 1 0 0 0 1
Tandai 8 23 4
35
Vulolo 3 2 2
7
Total 37 58 15 2 112
D.3.2 Gender
All of the surveyed household heads in East Tasimboko and Suvelei were found to be male. Vulolo has some households with female
heads, as per Table 5 below.
Table 5. Gender of Household Heads
Ward No of Male Headed HH
No of Female Headed HH
Total HH % of Male
Headed HH % of Female Headed HH
East Tasimboko
22 0 22 100% 0%
Ghaobata 11 1 12 92% 8%
Sahalu 33 2 35 94% 6%
Savulei 1 0 1 100% 0%
Tandai 34 1 35 97% 3%
Vulolo 6 1 7 86% 14%
Total 107 5 112 96% 4%

FEASIBILITY REPORT: 7. Social Impact Assessment Report
Loan No. 3152-SOL and Grant 0403-SOL: TSFRP and Grant 0243-SOL: TSDP – Design and Supervision Consulting Services
FEASIBILITY REPORT: 7. Social Impact Assessment
23-Sep-15
9
D.3.3 Household Size
Average size of the surveyed households was found to be 6.03. Male members were found to be on an average 3.05 per household,
while 2.97 of the household members were found to be women. Savulei has the highest household size of 7, while Sahalu has the least
at 5.91. Table 6 shows the Ward specific household size.
Table 6. Household Size of the Surveyed Families
Ward Avg. HH Size Avg. No of Male
Members Avg. No of Female
Members
East Tasimboko 5.82 3.00 2.82
Ghaobata 5.92 2.83 3.08
Sahalu 5.91 2.94 2.97
Savulei 7.00 4.00 3.00
Tandai 6.11 3.20 2.91
Vulolo 6.86 3.29 3.57
Total 6.03 3.05 2.97
D.3.4 Religion
All the surveyed households were found to be the followers of Christianity.

FEASIBILITY REPORT: 7. Social Impact Assessment Report
Loan No. 3152-SOL and Grant 0403-SOL: TSFRP and Grant 0243-SOL: TSDP – Design and Supervision Consulting Services
FEASIBILITY REPORT: 7. Social Impact Assessment
23-Sep-15
10
E. SOCIOECONOMIC ANALYSIS
E.1 Income and Source
E.1.1 Household Income
Household annual income was seen from two perspectives - the earned income from different income earning activities (e.g. agriculture,
service, etc.) and the income that was not earned through direct involvement from the household into any income generating activity
(e.g. remittance, government support, etc.). Average total household income was found to be SBD 37,578 annually, out of which almost
three quarters was seen coming from different income earning activities, i.e. earned income. Households in East Tasimboko seemed to
have the highest annual income, although the bulk of this was found to be coming from non-earned income, mainly from leasing out
land. Households in Sahalu were found to have the least annual income. Table 7 presents the income range of the surveyed
households, and Table 8 the Ward specific income of the households.
Table 7. Income Range of Surveyed Households
HH Annual Income Range (SBD)
No of HH % of HH in this
range
0 to $ 2500 25 22%
$ 2501 to $ 5000 15 13%
$ 50001 to $ 10,000 5 4%
$ 10,001 to $ 20,000 20 18%
$ 20,001 to $ 50,000 26 23%
$ 50,001 to $ 100,000 11 10%
$ 100,001 and Above 10 9%
Total 112 100%
Table 8. Ward Specific Income for the Households
Ward Average Household Annual Income (SBD)
Average Household Annual Earned Income
(SBD)
Average Household Annual Non-earned Income
(SBD)
East Tasimboko 62,259 22,170 40,089
Ghaobata 57,658 57,033 625
Sahalu 17,242 15,453 1,789
Tandai 31,987 29,230 2,757
Vulolo 58,664 49,236 9,428
Total Average 37,578 27,627 9,951

FEASIBILITY REPORT: 7. Social Impact Assessment Report
Loan No. 3152-SOL and Grant 0403-SOL: TSFRP and Grant 0243-SOL: TSDP – Design and Supervision Consulting Services
FEASIBILITY REPORT: 7. Social Impact Assessment
23-Sep-15
11
E.1.2 Source of Earned Income
Figure 7 shows the different sources for earned income in the surveyed households. Businesses other than trade and sales generate the
highest portion of the earned income for the families. Agriculture also has a high contribution in this type of income. “Public Service” and
“trade or sales” have significant contribution in households’ annual income.
Figure 7. Different Sources for Earned Income in Surveyed Households
E.1.3 Source of Non-earned Income
Non-earned income of the households was seen to be dominated by land lease. More than two thirds of the total non-earned annual
income of the households was seen from this source. However, as shown in the previous section, this is a predominant scenario in East
Tasimboko Ward and not common for all other Wards. Income from rent was found to be another significant source for non-earned
income of the surveyed households.
Figure 8. Sources for Non-earned Income of the Surveyed Households
FEASIBILITY REPORT: 7. Social Impact Assessment Report
Loan No. 3152-SOL and Grant 0403-SOL: TSFRP and Grant 0243-SOL: TSDP – Design and Supervision Consulting Services
FEASIBILITY REPORT: 7. Social Impact Assessment
23-Sep-15
12
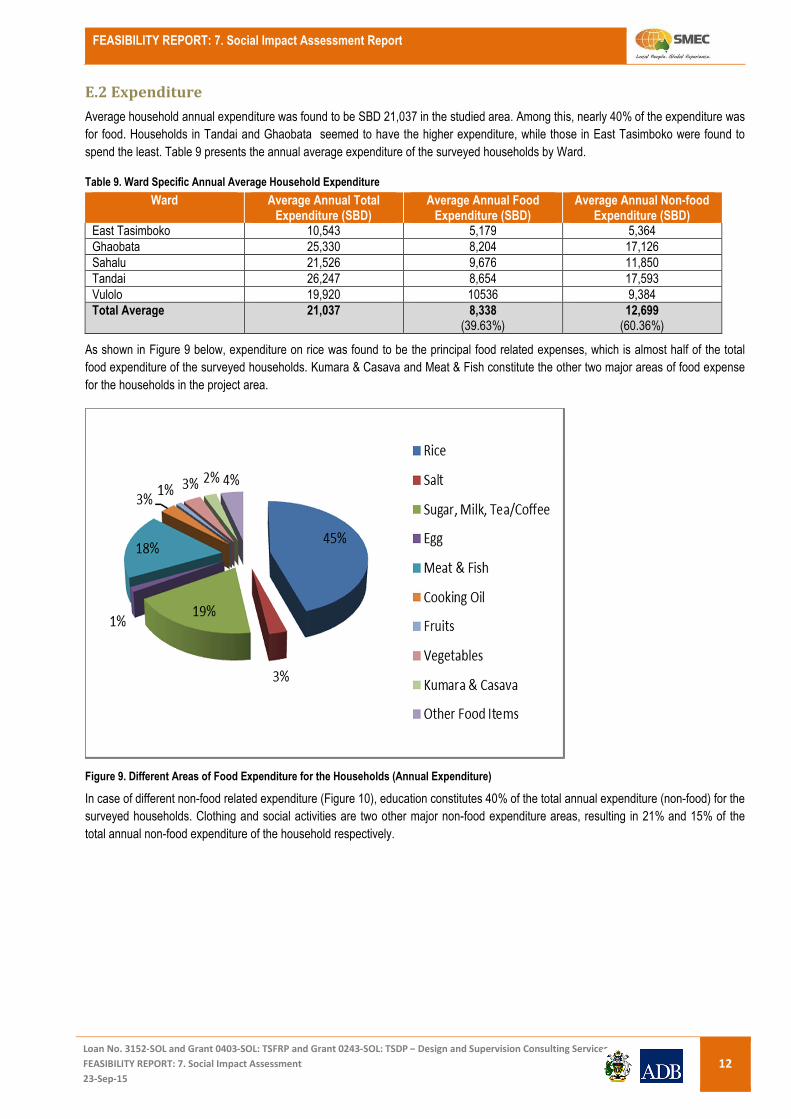
E.2 Expenditure
Average household annual expenditure was found to be SBD 21,037 in the studied area. Among this, nearly 40% of the expenditure was
for food. Households in Tandai and Ghaobata seemed to have the higher expenditure, while those in East Tasimboko were found to
spend the least. Table 9 presents the annual average expenditure of the surveyed households by Ward.
Table 9. Ward Specific Annual Average Household Expenditure
Ward Average Annual Total Expenditure (SBD)
Average Annual Food Expenditure (SBD)
Average Annual Non-food Expenditure (SBD)
East Tasimboko 10,543 5,179 5,364 Ghaobata 25,330 8,204 17,126 Sahalu 21,526 9,676 11,850 Tandai 26,247 8,654 17,593 Vulolo 19,920 10536 9,384 Total Average 21,037 8,338
(39.63%) 12,699
(60.36%)
As shown in Figure 9 below, expenditure on rice was found to be the principal food related expenses, which is almost half of the total
food expenditure of the surveyed households. Kumara & Casava and Meat & Fish constitute the other two major areas of food expense
for the households in the project area.
Figure 9. Different Areas of Food Expenditure for the Households (Annual Expenditure)
In case of different non-food related expenditure (Figure 10), education constitutes 40% of the total annual expenditure (non-food) for the
surveyed households. Clothing and social activities are two other major non-food expenditure areas, resulting in 21% and 15% of the
total annual non-food expenditure of the household respectively.

FEASIBILITY REPORT: 7. Social Impact Assessment Report
Loan No. 3152-SOL and Grant 0403-SOL: TSFRP and Grant 0243-SOL: TSDP – Design and Supervision Consulting Services
FEASIBILITY REPORT: 7. Social Impact Assessment
23-Sep-15
13
Figure 10. Different Areas of Non-food Expenditure of the Households
E.3 Poverty Situation
According to the HIES, 2006, 22.7% of the total population of Solomon Islands lives under the poverty line. This definition of poverty line
counts 1.25 USD (equivalent to 9.96 SBD) per day per capita income3. Considering this definition, the poverty situation in the surveyed
area is not encouraging. It seemed from the survey that around 62% of the households live under the poverty line. The situation is worse
in Sahalu where 71% of the households seem to live under the poverty line.
Table 10. Percentage of Surveyed Households Living Below the Poverty Line
Ward No of Surveyed Household Living
below Poverty Line (SBD 9.96 per capita per day)
% of Surveyed Household Living below Poverty Line
(SBD 9.96 per capita per day) East Tasimboko 14 64% Ghaobata 5 42% Sahalu 27 77% Tandai 18 51% Vulolo 1 14%
Total 65 59%
2 http://data.worldbank.org/indicator/SI.POV.DDAY

FEASIBILITY REPORT: 7. Social Impact Assessment Report
Loan No. 3152-SOL and Grant 0403-SOL: TSFRP and Grant 0243-SOL: TSDP – Design and Supervision Consulting Services
FEASIBILITY REPORT: 7. Social Impact Assessment
23-Sep-15
14
F. IMPACT OF THE 2014 FLOOD IN THE PROJECT AREA
The flood in early April 2014 is considered to be one of the most severe natural disasters in the history of the Solomon Islands. Heavy
rain from a tropical depression, which later became Tropical Cyclone Ita, caused severe flooding in the Solomon Islands at the beginning
of April 2014, killing 22 people and affecting over 50,000. The worst affected area was the capital Honiara after the Mataniko River burst
its banks. Houses were washed away and infrastructure was damaged, leaving an estimated 12,000 affected people (APs). Over 9,000
households in Honiara, Guadalcanal and Isabel had lost 75 to 100% of their food gardens. Drinking water remained a concern for an
estimated 50% of the 50,000 APs.
F.1 Impacts on Assets and Income
Significant impact was found to be on the livelihood of the surveyed households due to the 2014 flooding (Table 11). The impact can be
measured in terms of income loss, loss of possession, loss of crops and other assets. 71% of the surveyed households lost their income
in one way or the other. On average, SBD 5,111 worth of crop was lost per household. Surveyed households also lost an average of
SBD 2,654 worth of household possessions or assets. The loss was most severe in East Tasimboko in terms of value of crop and asset
loss. Ghaobata also faced severe loss in terms of crop loss. Crop loss in Vulolo was not as severe as these two wards faced, but the
loss of assets and possessions was quite significant.
Table 11. Percentage of Surveyed Households Affected in Income for 2014 Flood
Ward No of Households
Affected in Income due to 2014 Flood
% of Households Affected in Income due to
2014 Flood
Value of Average Crop Lost (SBD/HH)
Value of Average Assets & Possessions Lost
(SBD/HH) East Tasimboko 15 68% 7,984 7,138 Ghaobata 8 67% 7,519 2,229 Sahalu 26 74% 5,847 680 Tandai 26 74% 2,308 2,100 Vulolo 4 57% 4,625 3,900
Total Average 79 71% 5,111 2,654
F.2 Impact on Access to Facilities and Transportation
Apart from these monetary losses, there were impacts on the social and economic life of the households as shown in the Table 12,
which cannot be measured in terms of financial indicators. Access to school, hospitals and other social facilities became difficult.
Employment opportunities also became difficult. For around half the households surveyed, access to transport became worse after the
flood. For them, travel time increased, travel speeds reduced, travel comfort reduced, and passenger transport quality overall was
reduced because of the 2014 flood. Damage of bridges, culverts and causeways can directly be attributed to these.
Table 12. Households' perception regarding different services after 2014 flood
Facilities No of HH thinking access to this facility has become worse after
2014 flood
% of HH thinking access to this facility has become worse after
2014 flood School 53 47% Health Facilities 50 45% Employment Opportunities 47 42% Access to Public Transport 49 44% Travel Time 55 49% Travel Speed 57 51% Travel Comfort 62 55% Passenger Transport Quality 58 52%

FEASIBILITY REPORT: 7. Social Impact Assessment Report
Loan No. 3152-SOL and Grant 0403-SOL: TSFRP and Grant 0243-SOL: TSDP – Design and Supervision Consulting Services
FEASIBILITY REPORT: 7. Social Impact Assessment
23-Sep-15
15
F.3 Impact on Women
The economic role of men and women, especially in rural areas of the Solomon Islands is quite distinguished - with men responsible for
cultivation of cash crops, while women are responsible for food crops. The 2014 flood had a direct impact on women involvement of food
crop cultivation and marketing. Due to the damaged culverts, bridges and causeways, women had to use alternative routes to carry
garden products across rivers and experienced difficult and costly access to town markets. Production costs also became higher due to
increased travel costs, increased travel times and difficulty in accessing markets for inputs and sales. In the Solomon Islands, women
are also responsible for daily household activities. Before the flood they used to take shorter, more frequent and more dispersed trips
during the day to fetch water, collect firewood, raise livestock, etc. These tasks also became difficult due to the damaged bridge, culverts
and causeways.
The April 2014 flood took almost a year before women and children could have proper shelter. This was a significant impact on the daily
life of women. They had to face hardship living in crowded atmospheres and had to be dependent on food supply from NGOs and the
National Disaster Office for their livelihood. The situation resulted in deterioration of health for women and children, even after almost
one and a quarter year after the flood. 71% of the surveyed households expressed that there was illness among the family members
during last one year period. In almost all the cases, the diseases were found to be malaria and pneumonia. Women and children were
found to be exposed to these diseases.

FEASIBILITY REPORT: 7. Social Impact Assessment Report
Loan No. 3152-SOL and Grant 0403-SOL: TSFRP and Grant 0243-SOL: TSDP – Design and Supervision Consulting Services
FEASIBILITY REPORT: 7. Social Impact Assessment
23-Sep-15
16
G. COMMUNITY CONSULTATION AND PARTICIPATION
In line with the scope of works defined for the DSC in the TOR a series of community consultations were conducted to ensure the full
awareness and participation of community people, and to carry out an initial assessment of social impact and identify the issues and the
level of support of the community to the Project.
A total of 12 community consultation sessions were conducted between 27 July and 12 August 2015. These were held in Cholala
Village, Tanavasa, Kolotoha Village, Boom Gate Market, Ndadava, Tamboko Clinic, Vura Village, Selwyn College Market, Ndova Village,
Tutumu and Gilo PSS. A total of 199 community people participated in these sessions.
While asking the participants regarding their support towards the Project, 100% of the community representatives supported the idea of
the Project being implemented in the target areas. As mentioned before, the aftermath of the flood resulted in discomfort in travel,
excessive travel time, decreased travel speed and increased waiting time for transportation. From this point of view, all the community
consultation participants have the perception that the Project will be beneficial for them. As a matter of fact, everyone expressed their
willingness to participate in the project implementation process. However, only 13% of them expressed that they will participate, even on
a voluntary basis. These results are summarised in Table 13 below.
Table 13. Expression of Support from the Community Representatives
Statement of Support No of participants
expressing % of total
participants Supporting the idea of project being implemented in the locality
199 100%
Having perception of the project being beneficial 199 100% Willing to participate the project implementation 199 100% Willing to participate the project without being paid 26 13%
The majority of the community consultation participants thought that the Project would reduce time for local people in terms of
transportation. They all expressed that the Project would reestablish their access to health and educational facilities, which is a bit
troublesome at this moment. At the same time, it would reestablish access to important government facilities and other social services.
They also thought that with the bridge, culverts and causeways being repaired, travel would be safer. The majority of them added that
the transportation would also be cheaper. These results are summarised in Table 14 below.
Table 14. Community Peoples' Perceived Benefits of the Project
Perceived Benefit of the Community Participants No of participants
expressing % of total
participants The project will reduce travel time for local people 172 86% The project will re-establish access to education and health facilities
199 100%
The project will result in safer travel 199 100% The project will result in cheaper travel 180 90% The project will re-establish access to government and social facilities
199 100%
The community participants also perceived some negative impacts. The majority expressed that there would be loss of land due to the
project implementation. Another significant portion of the participants expressed that there would be increased accidents and hazards
with the Project being implemented, due to increased traffic and vehicle speed. A large number of the participants expressed their
concern regarding noise, disturbance and nuisance during implementation of the Project, especially during different civil constructions.
Some of the participants were found to be worried about the privacy of their lives, especially for women and girls that might be hampered
during the implementation process. A small portion of the participants also showed concerns about other negative impacts resulting from
the influence of outsiders. These results are summarised in Table 15 below.

FEASIBILITY REPORT: 7. Social Impact Assessment Report
Loan No. 3152-SOL and Grant 0403-SOL: TSFRP and Grant 0243-SOL: TSDP – Design and Supervision Consulting Services
FEASIBILITY REPORT: 7. Social Impact Assessment
23-Sep-15
17
Table 15. Perceived Negative Impacts of the Project
Perceived Negative Impacts No of Participants
thinking there will be this impact
No of Participants thinking there will be high severity for this
impact
Total number of Participants in the
Community Consultation
There will be loss of land due to project implementation
189 176 199
There will be noise, disturbance and discomfort during implementation
91 91 199
Impact on privacy, especially for women and girls
48 46 199
Increased accidents and hazards 129 126 199 Negative impact on local lives from the influence of outsiders during project implementation period
23 4 199
Other bad impacts of the project 57 23 199
The following images (Figures 11 to 12) show Community Consultations being implemented by the DSC Social Safeguards Team.
Figure 11. Tambea Market Culvert Community Consultation (27/07/15)
Figure 12. Mberande Bridge Community Consultation (12/08/15)

FEASIBILITY REPORT: 7. Social Impact Assessment Report
Loan No. 3152-SOL and Grant 0403-SOL: TSFRP and Grant 0243-SOL: TSDP – Design and Supervision Consulting Services
FEASIBILITY REPORT: 7. Social Impact Assessment
23-Sep-15
18
H. SOCIAL SAFEGUARD ASPECT
H.1 Project’s Land Acquisition Strategy
The strategy for the TSFRP is to avoid or minimize the adverse impact of acquisition of private land except in absolute necessity.
Although implementation of physical works will be carried out mostly on existing land owned by the SIG, certain scale of land acquisition
and resettlement (LAR) impacts are inevitable. This will have some impact on private, as well as communal assets, including land and
structures. It will be necessary to compensate all land owners for loss of land and other assets, as well as non-titled owners of the
affected property, including their loss of income and employment. However, careful attention will be paid during implementation to make
sure that the improvement works do not cause any major impact involving complete demolishing of any house, physical displacement of
any household from his/her existing dwelling, or disruption of income and livelihoods.
H.2 Preliminary Identification of LAR Impact
The preliminary analysis reveals that several households will be faced with potential impact on different types of assets - land, structure
and trees. As shown in Table 16, there will be impact on one piece of land in West Guadalcanal with a magnitude of 4,000 m2, apart
from the impact on eight structures and 1,037 plants and trees in both West and East Guadalcanal.
Table 16. Overall Potential Impact of the Project on Assets
Type of Impact Magnitude Land Impact 4,000 m2 Structure Impact 8 Nos Plants & Trees 1,037 Nos
This 4,000 m² piece of affected area is communal land belonging to Lathi Tribe and Pipo / Saulogo Tribes in West Guadalcanal. Also,
impacts on other assets have been assessed during the survey, such as impact on eight structures with cumulative impact area of 133.7
m2. Among these, five structures are in West Guadalcanal and three are in East Guadalcanal, as shown in Table 17.
Table 17. Details of Impact on Structures
Ward No of Structures to be Affected
Area of Potential Impact (m2)
West Guadalcanal 5 87.8 East Guadalcanal 3 45.9 Total 8 133.7
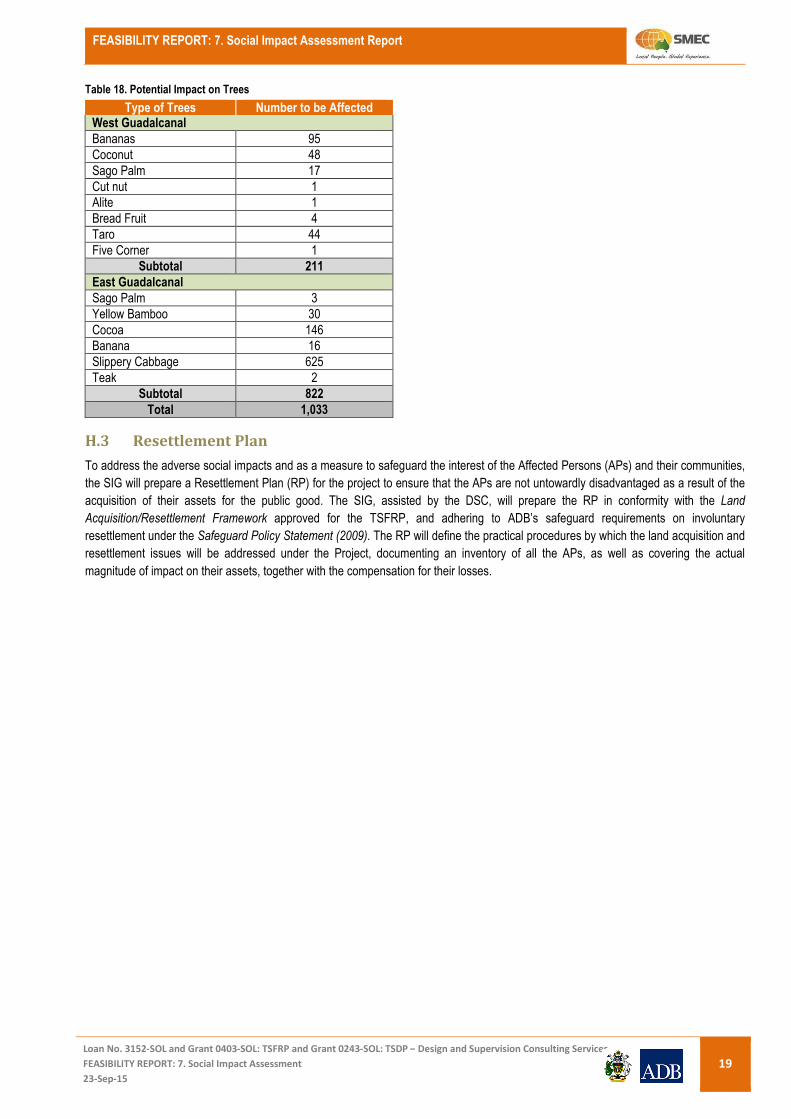
Table 18 shows that a substantial number of trees and plants are likely to affected, estimated at about 1,033 trees - 211 are in West
Guadalcanal and 822 in East Guadalcanal. The majority of the trees are slippery cabbages. Other species include banana, coconut,
cocoa, sago palm, yellow bamboo, etc.
FEASIBILITY REPORT: 7. Social Impact Assessment Report
Loan No. 3152-SOL and Grant 0403-SOL: TSFRP and Grant 0243-SOL: TSDP – Design and Supervision Consulting Services
FEASIBILITY REPORT: 7. Social Impact Assessment
23-Sep-15
19
Table 18. Potential Impact on Trees
Type of Trees Number to be Affected West Guadalcanal
Bananas 95 Coconut 48 Sago Palm 17 Cut nut 1 Alite 1 Bread Fruit 4 Taro 44 Five Corner 1
Subtotal 211
East Guadalcanal
Sago Palm 3 Yellow Bamboo 30 Cocoa 146 Banana 16 Slippery Cabbage 625 Teak 2
Subtotal 822
Total 1,033
H.3 Resettlement Plan
To address the adverse social impacts and as a measure to safeguard the interest of the Affected Persons (APs) and their communities,
the SIG will prepare a Resettlement Plan (RP) for the project to ensure that the APs are not untowardly disadvantaged as a result of the
acquisition of their assets for the public good. The SIG, assisted by the DSC, will prepare the RP in conformity with the Land
Acquisition/Resettlement Framework approved for the TSFRP, and adhering to ADB’s safeguard requirements on involuntary
resettlement under the Safeguard Policy Statement (2009). The RP will define the practical procedures by which the land acquisition and
resettlement issues will be addressed under the Project, documenting an inventory of all the APs, as well as covering the actual
magnitude of impact on their assets, together with the compensation for their losses.
FEASIBILITY REPORT: 7. Social Impact Assessment Report
Loan No. 3152-SOL and Grant 0403-SOL: TSFRP and Grant 0243-SOL: TSDP – Design and Supervision Consulting Services
FEASIBILITY REPORT: 7. Social Impact Assessment
23-Sep-15
20
I. RISK ASSESSMENT AND MITIGATION PLAN
I.1 Potential Risks Associated with the Project
As expressed by the community participants and drawing on the experience of field observations there are some risk elements
associated with the TSFRP. However, the majority of these risks are related to the physical works period of the Project, and are
expected to be temporary and localized. Some of these risks elements are discussed below.
I.1.1 Anti-social Behavior
During project implementation, there will be external people coming into the campsites (established in the community areas) as workers,
technicians and in other roles. As they are not from the community, they might not understand the local norms and rules and might show
some behavior that might be considered as antisocial; including drunkenness, theft, unsocial attitude towards local women and
adolescent girls, etc. Such behavior might result in grievances among local people, and may even create conflicts.
I.1.2 Noise, Disturbance and other Social Nuisance
Physical facilities development during the Project will involve utilization of heavy equipment that can be expected to create noise,
disturbance and other relevant social nuisance for local community people. This issue was discussed in the community participation
sessions. This might especially create disturbance for women and children.
I.1.3 Disruption to Traffic
Traffic movement in the SP areas is already disrupted compared to the pre flood situation since vehicles use alternative routes for travel.
During the construction and development process, even these alternative routes might be disturbed causing increased traffic congestion
and decreasing traffic speed.
I.1.4 Accidents
This is another concern shown by the community people. The physical development process might cause occupational hazards and
operational safety issues for workers, even for community people who might come near the construction sites. Such accidents might
cause physical injuries, and even fatalities.
I.1.5 Transmission of communicable diseases such as STD/HIV/AIDS
Although the existing infestation of HIV/AIDS is not very significant at this moment, however, because of the high number of STDs, low
access to testing, and known risk behaviors in some populations, the number of people infected with HIV is thought to be significantly
higher than the recorded cases. During project implementation, as mentioned before, there will be regular interaction between outsiders
and the local community people, leading to possible sexual interaction of outsider (labors, technicians, etc.) with local women. This might
result in contamination of communicable diseases like STD, HIV/AIDS, etc. in the local community. This is another potential risk of the
Project.

FEASIBILITY REPORT: 7. Social Impact Assessment Report
Loan No. 3152-SOL and Grant 0403-SOL: TSFRP and Grant 0243-SOL: TSDP – Design and Supervision Consulting Services
FEASIBILITY REPORT: 7. Social Impact Assessment
23-Sep-15
21
H.2 RISK MITIGATION MEASURES
I.2.1 Mitigation of Anti-social Behavior
Local communities have already been consulted. There will be further consultation during the final design process so that the issues are
considered and captured in the Civil Works Bidding Documents. There should be awareness raised among the local people regarding
the problem, in which, local government and non-government entities can contribute. The contractors responsible for physical facilities
development should take appropriate measures to ensure that such behavior is not displayed from their workers. In that regard,
contractor should orient those regarding local norms, values and cultural issues.
I.2.2 Mitigation of Noise, Disturbance and other Social Nuisance
The contractor should ensure that the construction activities are carried out during day time, or suiting a convenient time for the local
community. A schedule can be developed in discussion with the community leaders in this regard. Also, the contractor should ensure
limiting the noise level. Use of proper equipment (e.g. noise level meter) and proper maintenance of construction vehicles and equipment
will be helpful for this.
I.2.3 Mitigation of Disruption of Traffic
There should be careful planning of traffic during implementation process. There should be discussions with community people and the
contractor in this plan. The plan should identify and ensure usage of alternative routes during work in a particular bridge or causeway. If
access to properties is disrupted, the contractor should arrange for alternative access. Duration and schedule of construction should be
notified to local community people in advance so that they can take appropriate measures.
I.2.4 Mitigation of Accidents
The contractor should provide proper safety equipment to the workers and should provide appropriate training. This will reduce
operational hazards to a great extent for the workers. At the same time, there should be measures to separate the construction sites and
restrict movement of local community people.
I.2.5 Mitigation of Transmission of STD, HIV/AIDS
The contractor should maintain proper hygiene and cleanliness in the camp and the surroundings. There should be appropriate
awareness program conducted both among the construction workers and among local people regarding STD, HIV and AIDS.
Recruitment process should ensure workers having a clean medical record.

FEASIBILITY REPORT: 7. Social Impact Assessment Report
Loan No. 3152-SOL and Grant 0403-SOL: TSFRP and Grant 0243-SOL: TSDP – Design and Supervision Consulting Services
FEASIBILITY REPORT: 7. Social Impact Assessment
23-Sep-15
22
J. CONCLUSION AND RECOMMENDATION
J.1 Conclusion
All the people in the project area being the users of the bridges and culverts will be direct or indirect beneficiaries of the TSFRP both in
the short and long term. The short term effects are expected to include reduced transportation time and cost of passengers, especially
from the rural areas to the capital city of Honiara. Goods transportation time and cost can also be expected to be reduced, which would
be beneficial in reducing transportation loss for agricultural products, and would ensure a better price since the products can be more
efficiently transported to market areas and Honiara. The agro-input transportation would be better, for which farmers can have better
production. With better transportation and better connectivity, local businesses can be expected to improve, generating income for the
inhabitants in the SP areas. There would also be short term benefits for women as the improved bridges and culverts would ease their
present burden of transportation of household items and agricultural inputs and products. Employment opportunities are also available
by engaging the local communities in the implementation (construction) of the SPs.
Apart from these short term benefits, the long term positive impacts of the Project are immense. Present troublesome access to
educational facilities are expected to improve with the Project as local students would have options to go to better educational facilities in
distant places. Similar benefits would also be achieved in case of health facilities. Improved bridges and culverts would ease
transportation with which local farmers would be able to transport their products to city markets. They would also be able to get better
access to important government and social facilities.
In summary, the TSFRP is expected to contribute to economic growth and poverty reduction by reducing vehicle operating costs,
improving accessibility to market opportunities and economic and social services, as well as generating employment opportunities and
income.
J.2 Recommendations
In addition to mitigating social impacts (or managing the social risks), there are measures that can be included in the Project to maximize
benefits. Skills development and community awareness building can be one of such components. This will support skills development for
rural poor and vulnerable groups (including poor household, disadvantaged women, unemployed youth) through literacy, numeracy,
basic business skills (agriculture and horticulture) training, and raising community awareness through life skills program on safety,
health, especially HIV and STD, etc.
In parallel, skill development programs can be initiated so that the local community people can be engaged in the project implementation
as laborers or technicians. This will reduce the adverse anticipated impact from outsiders, as well as generate income for the local poor
and vulnerable households.

FEASIBILITY REPORT: 7. Social Impact Assessment Report
Loan No. 3152-SOL and Grant 0403-SOL: TSFRP and Grant 0243-SOL: TSDP – Design and Supervision Consulting Services
FEASIBILITY REPORT: 7. Social Impact Assessment
23-Sep-15
23
APPENDICES

FEASIBILITY REPORT: 7. Social Impact Assessment Report
Loan No. 3152-SOL and Grant 0403-SOL: TSFRP and Grant 0243-SOL: TSDP – Design and Supervision Consulting Services
FEASIBILITY REPORT: 7. Social Impact Assessment
23-Sep-15
24
APPENDIX 1 – TSFRP Subproject Location Map


FEASIBILITY REPORT: 7. Social Impact Assessment Report
Loan No. 3152-SOL and Grant 0403-SOL: TSFRP and Grant 0243-SOL: TSDP – Design and Supervision Consulting Services
FEASIBILITY REPORT: 7. Social Impact Assessment
23-Sep-15
26
APPENDIX 2 – Household Socioeconomic Survey Questionnaire

FEASIBILITY REPORT: 7. Social Impact Assessment Report
Loan No. 3152-SOL and Grant 0403-SOL: TSFRP and Grant 0243-SOL: TSDP – Design and Supervision Consulting Services
FEASIBILITY REPORT: 7. Social Impact Assessment
23-Sep-15
27
HOUSEHOLD SURVEY QUESTIONNAIRE
(Socioeconomic Profile of the Affected Households)
(Insert additional row/column where necessary)
Date of Survey: ....................... / 2015 Name of Investigator/Surveyor : .............................................................................
1. GENERAL Code
1.1 Name of Sub Project : ............................................ 1.2: Province…………………………….. 1.3 District:........................................................ 1.4 Ward : ..........................................
2. HOUSEHOLD IDENTIFICATION
2.1 Name of the Affected Household Head : ...................................................................... 1. Male 2. Female
2.2 National ID Number: (if any)........................................................................
2.3 Father’s Name:……………………………………………………………
2.4 Address of the Household : ............................................................................ ………………………………………………………………………………………,,,
2.5 Family Type : 1. Joint 2. Nuclear 3. Extended 4. Other
2.6 Religious Group :
1. Christian 2. Buddhist 3.Hindu 4. Muslim 5. Other (mention)
2.7 Number of Family Members : 1. Male ................... 2. Female....................
2.8 Details of Family Members (Demography and Education)
Sl. No.
Name of the Family Member
Sex 1.Male
2.Female
Age (year)
Marital Status 1.Married 2.Unmarried 3.Widow 4.Widower 5. Other
Education 1. Illiterate 2.Elementary School 3.Junior High School 4.Senior High School 3. Graduate/Equivalent 4. Above Graduate
Occupation 1. Service 2. Business 3. Agriculture 4. Study 5. Housewife 6. Labour 7. Professional 8. Unemployed
1. 2. 3. 4. 5. 6. 7. 8. 9. 10. # of physically handicapped members, if any 1. 2. 3.
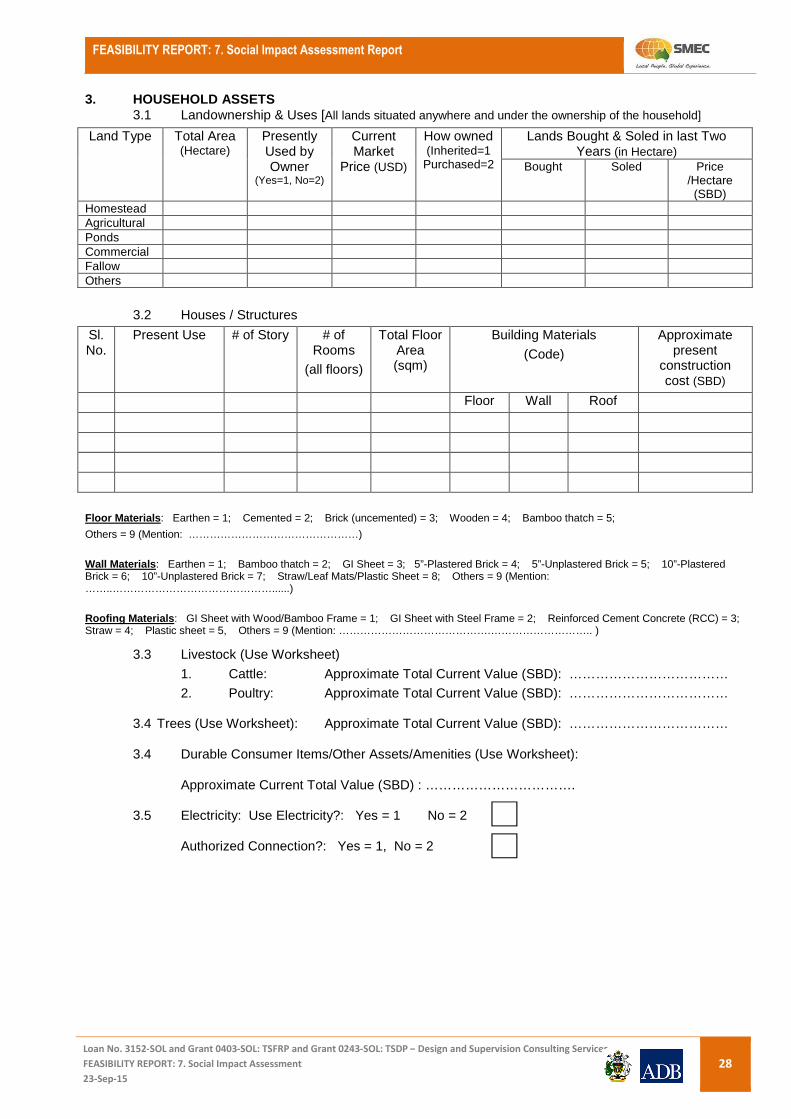
FEASIBILITY REPORT: 7. Social Impact Assessment Report
Loan No. 3152-SOL and Grant 0403-SOL: TSFRP and Grant 0243-SOL: TSDP – Design and Supervision Consulting Services
FEASIBILITY REPORT: 7. Social Impact Assessment
23-Sep-15
28
3. HOUSEHOLD ASSETS 3.1 Landownership & Uses [All lands situated anywhere and under the ownership of the household]
Land Type Total Area (Hectare)
Presently Used by Owner
(Yes=1, No=2)
Current Market
Price (USD)
How owned (Inherited=1
Purchased=2
Lands Bought & Soled in last Two Years (in Hectare)
Bought Soled Price /Hectare (SBD)
Homestead Agricultural Ponds Commercial Fallow Others
3.2 Houses / Structures
Sl. No.
Present Use # of Story # of Rooms
(all floors)
Total Floor Area (sqm)
Building Materials
(Code)
Approximate present
construction cost (SBD)
Floor Wall Roof
Floor Materials: Earthen = 1; Cemented = 2; Brick (uncemented) = 3; Wooden = 4; Bamboo thatch = 5;
Others = 9 (Mention: …………………………………………) Wall Materials: Earthen = 1; Bamboo thatch = 2; GI Sheet = 3; 5”-Plastered Brick = 4; 5”-Unplastered Brick = 5; 10”-Plastered Brick = 6; 10”-Unplastered Brick = 7; Straw/Leaf Mats/Plastic Sheet = 8; Others = 9 (Mention: ……..………………………………………......) Roofing Materials: GI Sheet with Wood/Bamboo Frame = 1; GI Sheet with Steel Frame = 2; Reinforced Cement Concrete (RCC) = 3; Straw = 4; Plastic sheet = 5, Others = 9 (Mention: …………………………………….……………………….. )
3.3 Livestock (Use Worksheet)
1. Cattle: Approximate Total Current Value (SBD): ………………………………
2. Poultry: Approximate Total Current Value (SBD): ………………………………
3.4 Trees (Use Worksheet): Approximate Total Current Value (SBD): ………………………………
3.4 Durable Consumer Items/Other Assets/Amenities (Use Worksheet): Approximate Current Total Value (SBD) : …………………………….
3.5 Electricity: Use Electricity?: Yes = 1 No = 2
Authorized Connection?: Yes = 1, No = 2

FEASIBILITY REPORT: 7. Social Impact Assessment Report
Loan No. 3152-SOL and Grant 0403-SOL: TSFRP and Grant 0243-SOL: TSDP – Design and Supervision Consulting Services
FEASIBILITY REPORT: 7. Social Impact Assessment
23-Sep-15
29
Worksheet for Valuation of Cattle & Poultry CATTLE # of Heads Approx Total
Value (SBD) Poultry # of Birds Approx Total
Value (SBD)
Bullock Chicken
Cow Duck
Goat Pigeon
Sheep
Buffalo
Horse
Camel
Ass
Others (Mention)
9 = Others (Mention)
Worksheet for Valuation of Trees ( Local names of the trees to be included)
Major Timber Trees Major Fruit Trees Other Trees Name # Approx
Value (USD)
Name # Approx Value
(SBD)
Name # Approx Value
(SBD)
Etc. Etc. Etc.
Worksheet for Valuation Durable Consumer Items and Other Assets & Amenities
Items # Approx Total Value (SBD)
Television
Radio
Music System
Refrigeration
Washing Machine
Air Conditioner
Oven
L.P.G. connection
Motor Bike
Bicycle
Car
Bus/Microlet
Furniture
Tube-well
Sanitary Latrine
Others (name)

FEASIBILITY REPORT: 7. Social Impact Assessment Report
Loan No. 3152-SOL and Grant 0403-SOL: TSFRP and Grant 0243-SOL: TSDP – Design and Supervision Consulting Services
FEASIBILITY REPORT: 7. Social Impact Assessment
23-Sep-15
30
4. AGRICULTURE: OPERATION & PRODUCTION AND INCOME
4.1 Landuse
Cultivable Non-Cultivable Total Land Area (Hectare)
4.2 Cropping Pattern
Sl. No. Type of Crops Total Cultivated Land (Hectare)
Total Yield
I ii Iii Summer Crop
Total
4.3 Income from Agriculture
Sl. No. Type of Crops Income (SBD) 1 Vegetables(pumpkin, potatoes, cassava, cabbage, tomato etc. 2 Fruit (melon, lime, mango, pawpaw etc.) 3 Cocoa 4 Copra 5 Other crop 6 Sale of Livestock(pigs, cow) 7 Sale of poultry(chicken, geese, ducks) 8 Sale of timber/wood forest products 9 Sale of non-timber forest products(palm leaf, honey, etc. other)
Total 5. ANNUAL INCOME (EARNED INCOME)
Sl. No. Source Income4 (BSD) 1 Education or health services 2 Government/Public service 3 Private Services 4 Trade/Sales (Small Business) 5 Other Business 6 Self-employed Professional (e.g. doctor, lawyer) 7 Tourism 8 Construction 9 Transport
10 Fishing 11 Others
Grand Total
4 Cumulative of all household members’ income

FEASIBILITY REPORT: 7. Social Impact Assessment Report
Loan No. 3152-SOL and Grant 0403-SOL: TSFRP and Grant 0243-SOL: TSDP – Design and Supervision Consulting Services
FEASIBILITY REPORT: 7. Social Impact Assessment
23-Sep-15
31
6. ANNUAL INCOME (NON-EARNED INCOME)
Sl. No. Source Income5 (BSD) 1 Government assistance 2 Remittance from relatives or friends 3 Rental income 4 Income from leased land 5 Other, Specify
Grand Total 7. INDEBTEDNESS
(Please indicate, your borrowings during last one year)
Sl. No. Source Amount taken (in SBD)
Amount returned (in SBD)
Balance
1. Bank (specify which bank) 2. Cooperatives NGO
3. Private money lender Relatives
4. Others (mention) Total
8. HOUSEHOLD SAVINGS
8.1 Does the household as a whole have any savings? 1. Yes 2. No
If yes, total amount of savings: SBD ………….... 8.2 The money is kept in (Use applicable codes below):
At home=1; With relatives=2; With friends=3; Bank/Cooperatives=4; NGOs=5; Others=6 (Mention: .…….........................………………) .
9. OVERALL ECONOMIC STATUS 9.1 According to the respondent, which of the following best describes the
household’s overall economic status with the present income and expenditure needs?
1 = Surplus 2 = Breaks even 3 = Occasionally deficit 4 = Always deficit
10. CONSUMPTION PATTERN (Please indicate the consumption/expenditure on different items on last one year)
Sl. No. Particulars / Source Expenditure (SBD) Monthly Annual
A Food 1. Cereal 2. Pulses 3. Milk 4. Oil 5. Vegetable 6. Fruits 7. Meat/Fish 8. Eggs 9. Sugar
Sub Total (A) B Cooking fuel/gas/wood C Clothing D Health
5 Cumulative of all household members’ income

FEASIBILITY REPORT: 7. Social Impact Assessment Report
Loan No. 3152-SOL and Grant 0403-SOL: TSFRP and Grant 0243-SOL: TSDP – Design and Supervision Consulting Services
FEASIBILITY REPORT: 7. Social Impact Assessment
23-Sep-15
32
E Education F Communication G Social Function H Agriculture (such as seeds,
hiring of farm implements etc.)
I Others (specify .....................) Grand Total (A+I)
10. COVERAGE UNDER GOVERNMENT/DONORS DEVELOPMENT SCHEMES
10.1 Have you availed any benefit under any govt. Scheme ? 1. Yes 2. No
If Yes, please give us the following details :
Name of the Scheme Kind of Help
1. Loan, 2. Training, 3. Employment
If “1”, please indicate the amount SBD ........................ If “2”, please indicate the type of training ...........................................................................
10.2 After availing this scheme did your annual income increase? 1. Yes 2. No If “Yes”, how much? SBD ..............................
If “N0”, why? ..................................................................................................................... ......................................................................................................................
11. HEALTH STATUS
11.1 Was any member of your family affected by any illness in last one year?
1. Yes 2.No
11.2 If “Yes”, please indicate the details No. of Cases Type of Diseases/Illness Treatment taken
1. Allopathic 2. Homeopathic 3. Traditional 4. No treatment
12. IMPACT OF 2014 FLOOD
12.1. Did your household income change due to the flooding in 2014? Yes (1) No (2) 12.2. If yes, what was the impact?

FEASIBILITY REPORT: 7. Social Impact Assessment Report
Loan No. 3152-SOL and Grant 0403-SOL: TSFRP and Grant 0243-SOL: TSDP – Design and Supervision Consulting Services
FEASIBILITY REPORT: 7. Social Impact Assessment
23-Sep-15
33
12.3. If yes, did you lose household possessions? (indicate what was lost and value if possible)
Items Lost Quantity Value
12.4. If yes, did you lose crops? (indicate what was lost and value if possible)
Items Lost Quantity Value
12.5. If yes, were you prevented from working? Yes (1) No (2)
12.6. For how long and what was the impact? ……………………..
12.7. Did you receive any assistance after the following? Yes (1) No (2)
12.8. If yes, what and from whom (list) (include aid from family members).
What Assistance Received Quantity From whom?
12.9. What money did you spend yourself on recovering from the flood?
Money spent on Quantity Cost
12.10. Do you think you have recovered from the flooding? 1. Yes 2. No
13. USAGE OF TRANSPORT INFRASTRUCTURE
13.1. Do you use the bridge/causeway/culvert at the subproject site? 1. Yes 2. No 13.2. If yes, how do you travel along the road?
a. Private Car/Ute b. Public Bus c. Truck d. Taxi e. Bicycle f. Walk g. Other 13.2.1. Please estimate in minutes your present total travel time for your most frequent trip using the
bridge/causeway/culvert? 13.3. Can you estimate by how much your travel time has changed from before the flood in April
2014? a. Yes b. Unsure c. Don’t Know 13.4. If yes, has your travel time decreased or increased? a. Decreased b. Increased
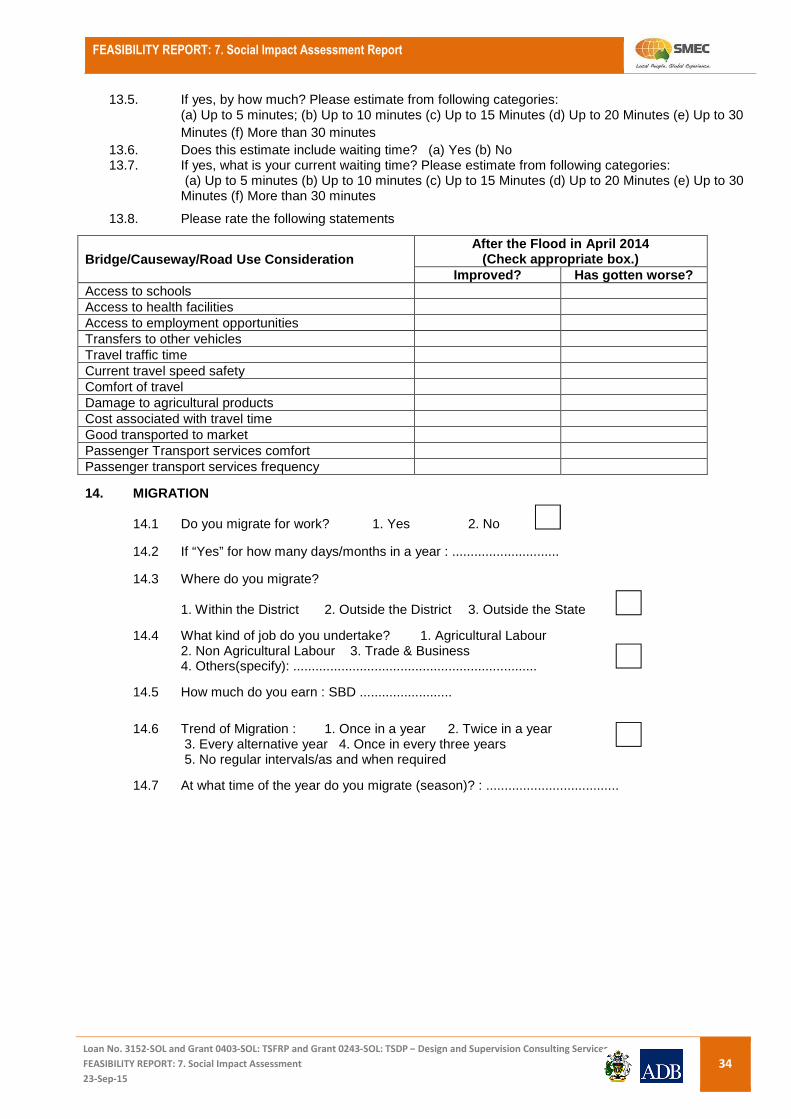
FEASIBILITY REPORT: 7. Social Impact Assessment Report
Loan No. 3152-SOL and Grant 0403-SOL: TSFRP and Grant 0243-SOL: TSDP – Design and Supervision Consulting Services
FEASIBILITY REPORT: 7. Social Impact Assessment
23-Sep-15
34
13.5. If yes, by how much? Please estimate from following categories: (a) Up to 5 minutes; (b) Up to 10 minutes (c) Up to 15 Minutes (d) Up to 20 Minutes (e) Up to 30 Minutes (f) More than 30 minutes
13.6. Does this estimate include waiting time? (a) Yes (b) No 13.7. If yes, what is your current waiting time? Please estimate from following categories:
(a) Up to 5 minutes (b) Up to 10 minutes (c) Up to 15 Minutes (d) Up to 20 Minutes (e) Up to 30 Minutes (f) More than 30 minutes
13.8. Please rate the following statements
Bridge/Causeway/Road Use Consideration After the Flood in April 2014
(Check appropriate box.) Improved? Has gotten worse?
Access to schools Access to health facilities Access to employment opportunities Transfers to other vehicles Travel traffic time Current travel speed safety Comfort of travel Damage to agricultural products Cost associated with travel time Good transported to market Passenger Transport services comfort Passenger transport services frequency
14. MIGRATION 14.1 Do you migrate for work? 1. Yes 2. No
14.2 If “Yes” for how many days/months in a year : ............................. 14.3 Where do you migrate?
1. Within the District 2. Outside the District 3. Outside the State
14.4 What kind of job do you undertake? 1. Agricultural Labour 2. Non Agricultural Labour 3. Trade & Business 4. Others(specify): ..................................................................
14.5 How much do you earn : SBD .........................
14.6 Trend of Migration : 1. Once in a year 2. Twice in a year 3. Every alternative year 4. Once in every three years 5. No regular intervals/as and when required
14.7 At what time of the year do you migrate (season)? : ....................................

FEASIBILITY REPORT: 7. Social Impact Assessment Report
Loan No. 3152-SOL and Grant 0403-SOL: TSFRP and Grant 0243-SOL: TSDP – Design and Supervision Consulting Services
FEASIBILITY REPORT: 7. Social Impact Assessment
23-Sep-15
35
15. WOMEN STATUS
15.1 Please give the following details Sl. No Economic / Non-economic Activities Engagement in Activities
1. Yes 2. No 1. Cultivation 2. Allied Activities* 3. Sale of forest products 4. Trade & Business 5. Agricultural Labour 6. Non Agricultural Labour 7. Household Industries 8. Service 9. Household Work 10. Entertainment 11. Others (specify) ...........................
Dairy, Poultry, Piggery, Sheep rearing etc
If engaged in economic activities, total income of the year : SBD .........................
15.2 Do your women member have any say in decision making of household matters?
1. Yes 2. No
15.3 If “Yes”, give the following details: Sl. No Issues 1 Yes 2 No
1. Financial matters 2. Education of child 3. Health care of child 4. Purchase of assets 5. Day to day activities 6. On social functions and
marriage
7. Others (mention)
Physical Relocation of Affected Households
[Applicable to the households whose homesteads would be affected partially and fully, and will have to relocate their homes.]
� If the household is aware of displacement from the present homestead, its plan/thinking about relocation: ………………………………………………………………………………………………………… ……………………………………………………………………………………………………………………………………………………………………………………………………………………
� Can the affected household relocate on the same home-lot/dwelling plot by moving the houses? 1=Yes;
2=No
� Does the household have lands in the locality which are suitable for relocation?
� 1=Yes; 2=No
� Does the household have lands in the locality that can be developed into home-lot for relocation?
1=Yes 2=No
� Can the household find land for purchase at a location it would like to relocate?
� 1=Yes; 2=No
� Are there public lands (govt. & other lands owned by any department of the Govt. of Solomon Islands ) in the vicinity of the project? Yes / No
• If ‘Yes’, approx. distance from the project: ………….km
• Approximate amount: ………….
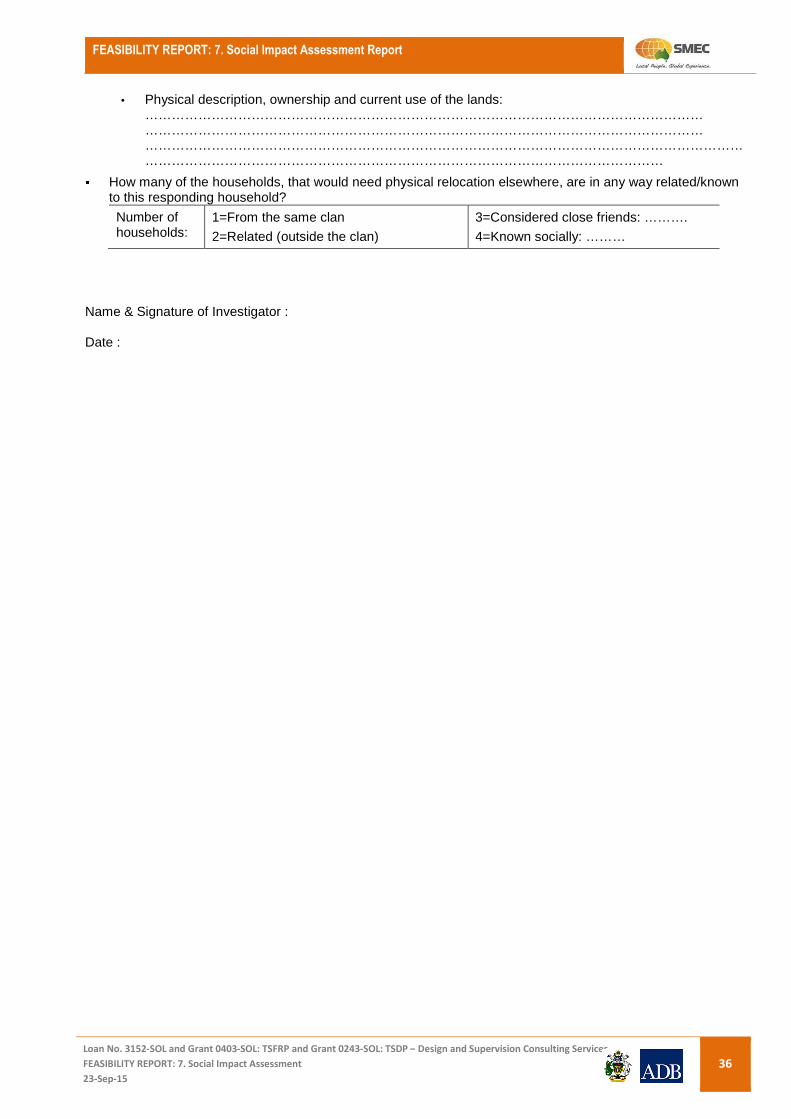
FEASIBILITY REPORT: 7. Social Impact Assessment Report
Loan No. 3152-SOL and Grant 0403-SOL: TSFRP and Grant 0243-SOL: TSDP – Design and Supervision Consulting Services
FEASIBILITY REPORT: 7. Social Impact Assessment
23-Sep-15
36
• Physical description, ownership and current use of the lands: ……………………………………………………………………………………………………………… ……………………………………………………………………………………………………………… ………………………………………………………………………………………………………………………………………………………………………………………………………………………………
� How many of the households, that would need physical relocation elsewhere, are in any way related/known to this responding household?
Number of households:
1=From the same clan
2=Related (outside the clan)
3=Considered close friends: ……….
4=Known socially: ………
Name & Signature of Investigator : Date :

FEASIBILITY REPORT: 7. Social Impact Assessment Report
Loan No. 3152-SOL and Grant 0403-SOL: TSFRP and Grant 0243-SOL: TSDP – Design and Supervision Consulting Services
FEASIBILITY REPORT: 7. Social Impact Assessment
23-Sep-15
37
APPENDIX 3 – Participatory Assessment Checklist
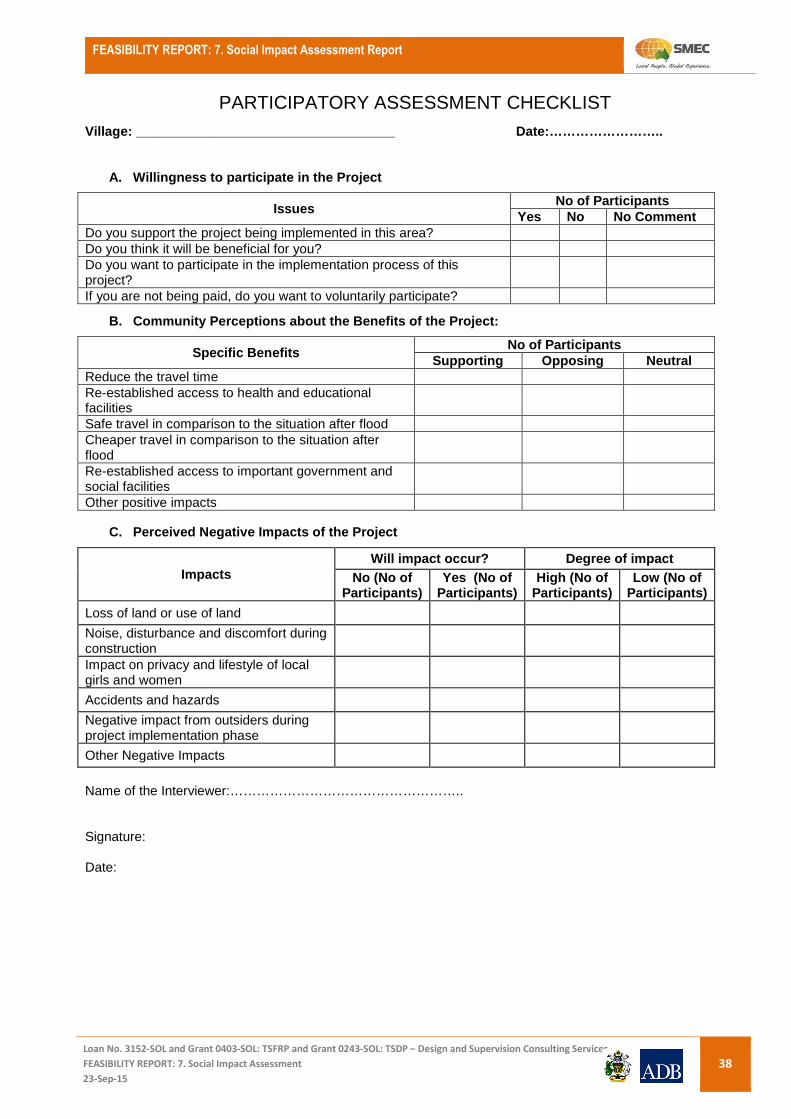
FEASIBILITY REPORT: 7. Social Impact Assessment Report
Loan No. 3152-SOL and Grant 0403-SOL: TSFRP and Grant 0243-SOL: TSDP – Design and Supervision Consulting Services
FEASIBILITY REPORT: 7. Social Impact Assessment
23-Sep-15
38
PARTICIPATORY ASSESSMENT CHECKLIST Village: ___________________________________ Date:……………………..
A. Willingness to participate in the Project
Issues No of Participants
Yes No No Comment Do you support the project being implemented in this area? Do you think it will be beneficial for you? Do you want to participate in the implementation process of this project?
If you are not being paid, do you want to voluntarily participate?
B. Community Perceptions about the Benefits of the Project:
Specific Benefits No of Participants
Supporting Opposing Neutral Reduce the travel time Re-established access to health and educational facilities
Safe travel in comparison to the situation after flood Cheaper travel in comparison to the situation after flood
Re-established access to important government and social facilities
Other positive impacts
C. Perceived Negative Impacts of the Project
Impacts Will impact occur? Degree of impact
No (No of Participants)
Yes (No of Participants)
High (No of Participants)
Low (No of Participants)
Loss of land or use of land
Noise, disturbance and discomfort during construction
Impact on privacy and lifestyle of local girls and women
Accidents and hazards
Negative impact from outsiders during project implementation phase
Other Negative Impacts
Name of the Interviewer:…………………………………………….. Signature: Date: