soil survey and mapping using remote sensing -
TRANSCRIPT

MANCHANDA, KUDRAT & TIWARI 61
Tropical Ecology 43(1): 61-74, 2002 ISSN 0564-3295 © International Society for Tropical Ecology
Soil survey and mapping using remote sensing
M.L.MANCHANDA, M.KUDRAT & A.K.TIWARI
Regional Remote Sensing Service Centre, Dehradun 248001, India
Abstract: Soil survey constitutes a valuable resource inventory linked with the survival of life on the earth. The technological advancements in the field of remote sensing and Geo-graphical Information System have been a boon for such surveys. Present paper describes the role of remote sensing and Geographical Information System (GIS) technologies for mapping and characterizing soils at various scales. The spectral behaviour of soil and its components, which is fundamental to deriving information from remote sensing data, is also discussed with illustrations. Furthermore, the scope of present day remote sensing data for varying levels in-formation generation is also reviewed.
Resumen: El levantamiento de suelos constituye un valioso inventario de recursos ligado a
la supervivencia de la vida en la tierra. Los avances tecnológicos en el campo de la percepción remota y los Sistemas de Información Geográfica han representado un gran adelanto para este tipo de levantamientos. El presente artículo describe el papel de las tecnologías de percepción remota y de Sistemas de Información Geográfica (SIG) para la elaboración de mapas y la carac-terización de suelos a varias escalas. También se discute e ilustra el comportamiento espectral del suelo y sus componentes, el cual es fundamental para derivar información a partir de datos de percepción remota. Además, se revisa el ámbito y alcance de los datos actuales de percepción remota para varios niveles de generación de información.
Resumo: A prospecção do solo constitui um precioso elemento no inventário de recursos de
que depende a sobrevivência da vida na terra. Os avanços tecnológicos no campo da detecção remota e dos Sistema de Informação Geográfica constituíram um impulso notável para tais prospecções. O presente artigo descreve o papel da detecção remota e das tecnologias do Sis-tema de Informação Geográfica (SIG) no mapeamento e caracterização do solo em diferentes escalas. O comportamento espectral do solo e dos seus componentes, que são fundamentais para obter informação dos dados da detecção remota, é também discutido e ilustrado. Revê-se, além disso, o objectivo dos dados da detecção remota actual, para vários níveis de produção de informação.
Key words: Carbonates, mineralogy, moisture, organic matter, remote sensing, salinity, spectral
behaviour, soil, texture.
Introduction
Soil systems like most natural systems, are in dynamic equilibrium. Most changes are slow and
imperceptible particularly when viewed in the time frame of human lifespan. However, catastro-phic events such as high intensity storms can ac-celerate erosion processes resulting in measurable
Address for Correspondence: M.L.Manchanda, Regional Remote Sensing Service Centre, Indian Space Research Or-ganisation, 4, Kalidas Road, Dehradun 248001, India.

62 SOIL SURVEY AND MAPPING
changes. The changes are mainly in the structure and composition of the material and such changes are referred to as ‘structural changes’. Changes are measurable directly or indirectly or may be in-ferred from behaviour of the system. Many of the changes are related to uses of the soil. These ‘per-formance-related changes are more important as they can be quantified, particularly in economic value terms (Szabolcs 1994).
An intimate knowledge of the kind of soils their spatial distribution is a prerequisite in developing rational land use plan for agriculture, forestry, irri-gation, drainage etc. Soil resource inventory pro-vides an insight into the potentialities and limita-tion of soil for its effective exploitation. Soil survey provides an accurate and scientific inventory of dif-ferent soils, their kind and nature, and extent of distribution so that one can make prediction about their characters and potentialities. It also provides adequate information in terms of land form, ter-races, vegetation as well as characteristics of soils (viz., texture, depth, structure, stoniness, drainage, acidity, salinity and so on) which can be utilized for the planning and development.
More than ninety percent of world’s food pro-duction is dependent on soil (Venkataratnam & Manchanda 1997). The scientific documentation of the properties of Indian soils dates back to 1898 when J.W Leather distinguished four major groups of soils namely Indo-gangetic alluvial soils, black-cotton or regular soils, red soils lying on metamor-phic rocks and lateritic soils (Velayutham 2000). The earliest proposals for study of soils of India on a nationwide scale can be traced back to 1940 when Rao Bahadur B. Vishwanath, the then Impe-rial Agricultural Chemist, mould the idea of taking up soil survey on a country wide basis with co-operation from soil scientists of the states. During 1948, Dr. A.B. Stewart of Macaulay Institute, Ab-readeen carried out studies on fertility of Indian soils and submitted a report entitled “Simple Ex-periments on Cultivators’ Field”. He suggested that soil survey based on soil climatic zones should be conducted so that a correlation could be made between soil types and crop yields. In the year 1954, Dr. F.F. Raickens, a soil specialist from USA was invited by Govern-ment of India to advise on soil survey work to be taken up in India. Based on the recommendations of Dr. Raickens, the All In-dia Soil Survey scheme was initiated in 1956 at the Indian Agricultural Research Institute (IARI) with four regional centres located at Delhi, Cal-
cutta, Nagpur and Bangalore to carry out recon-naissance soil survey, correlate and classify soils and prepare small scale soil maps. A soil survey manual describing the methods of conducting soil survey to suit our conditions was prepared and made available in 1960. A revised soil map of India was brought out in 1962 on the basis of soil survey and soil classification done by the State and Cen-tral Soil Survey Organization. During 1969, the All India Soil and Landuse Survey Organization was bifurcated on the basis of developmental and research work. A new organization “National Bu-reau of Soil Survey and Landuse Planning” was established in Nagpur. The establishment of In-dian Photointerpretation Institute (IPI, now In-dian Institute of Remote Sensing) in 1966 provided the training support to various soil surveyors on the use of aerial photographs. The initial soil sur-veys were based on either ground methods or through on a systematic aerial photointerpretation approach. A number of studies on soil survey were carried out by various workers in India in different regions using aerial photographs. Use of satellite remote sensing for soil survey and mapping re-ceived appreciation during early 1980s in India, and based on the potential of remote sensing tech-niques it was decided to map all the States and Union Territories of India on 1:250,000 scale fol-lowing a multiphased approach consisting of image interpretation, field survey, soil analysis, classifi-cation, cartography and printing (Velayutham 1999).
The use of digital image processing for soil survey and mapping was initiated with the estab-lishment of National Remote Sensing Agency and Regional Remote Sensing Service Centres. The initial works carried out by Venkatratnam (1980); Kudrat et al (1990) and Karale (1992) demon-strated the potential of digital image processing techniques for soil survey. A number of modelling studies were simultaneously carried out to derive a variety of information from soil maps, e.g. land evaluation, land productivity, soil erosion and hydrologic budget (Kudrat et al 1990; Saha et al 1991; Kudrat 1996; Kudrat et al 1995, Kudrat et al 1997).
Development of satellite remote sensing for soil studies
Before the launch of Landsat-1 (in 1972), ae-rial photographs were being used as a remote sens-

MANCHANDA, KUDRAT & TIWARI 63
ing tool for soil mapping, and, exhibited their po-tential in analysing physiography, land use and erosion status. Subsequently, 1972 onwards satel-lite data in both digital and analog have been util-ized for preparing small scale soil resource maps showing soil sub-groups and their association. The high resolution Landsat TM and Indian Remote Sensing Satellite (IRS) LISS II data which became available during mid eighties, enabled soil scien-tists to map soils at 1:50,000 scale, which is used for district level planning. At this scale soils could be delineated at association of soil series/family level. The SPOT and IRS -PAN data offered stereo capability, which has improved the soil mapping efforts.
Indian Remote Sensing satellites (IRS-1A, 1B, 1C and 1D) provide state-of-the-art database for natural resources inventories. Many studies have been conducted to explore the potential of LISS-I and LISS-II data for soil resource mapping both at 1:250,000 and 1:50,000 scale. Several studies have
been initiated on potential use of IRS-1C, LISS III and PAN data for mapping soils and it is expected that information on scale 1:25,000 to 1:12,500 scale could be generated through combination of these data (Kudrat et al 2000). Studies are also being carried out to explore potential of Synthetic Aperture Radar (SAR) data for soil moisture (Mohan et al 1990) estimation.
Spectral behaviour of soils Spectral response pattern of soil is generally
governed by a number of factors. The properties of soils that govern their spectral reflectance are col-our, texture, structure, mineralogy, organic mat-ter, free carbonates, salinity, moisture and the ox-ides/hydroxides of iron and manganese. Chemical compositions of the soil influences spectral signa-ture of soils through the absorption processes. In near infrared (NIR) and middle infrared (MIR) domain, absorption feature of soil components in
Table 1. Summary of vibrational features (Source: Bear 1968).
Constituents/Modes Reactions Absorption wavelength (nm)
H2O - Symmetric stretch 3106
- Asymmetric stretch 2903 - H-O-H bend 6080 Stretching fundamental 2770 A1-or Mg-OH bend 2200 or 2300 Oxides - Fundamental stretching 5000 Hematite - Fe-O fundamental stretching 20000 Carbonates 7000, 11000-12000 13000-15000 Phosphates 9250, 10300,18000 28500 Sulphates 9000, 10, 200, 16000, 22200 Gypsum - Overtones and combination of OH stretching in molecular
water 1750, 2300
- Fundamental bending mode of constitutional water 6000 - Si-O bending around 5000 Silicates - Si-O stretching 1000 - Si-O-Si, A1-O-Si stretches 12000-15000 - (Si, A1)-O-(A1, Si) stretch 15000-20000 - Deformation and bending modes of O-(Al, Si)-O,
(Si, A1)-O-(Si, A1) O-(A1,Si)-O 20000-40000
- A1, Si-O metal valence stretching 20000-40000

64 SOIL SURVEY AND MAPPING
solid phase originate primarily from the vibrations of bounded nuclei. A summary of vibration fea-tures and corresponding absorption wavelengths are presented in Table 1. In addition to vibrations, molecular rotation and transition may occur in the pores where gas and water molecules reside, which also results in higher absorption in MIR region. Soil water exhibits absorption peaks (Fig. 1) at about 1450 nm, 1880 nm and 2660 nm (Hoffer 1978). Electronic transition processes require much higher energy levels which causes absorp-tion of light at lower wavelengths. Transition ele-ments (Fe, Mn, Ti etc.) explain most of the de-crease in reflectance observed towards the lower wavelength spectral domain (Hunt & Salisbury 1976; Hunt 1980). Organic matter absorbs strongly in shorter wavelength as well as in the infrared region due to the presence of various functional groups and conjugate bonds (Hoffer 1978; Hunt 1980). Drake (1995) studied the reflectance spectra of evaporite minerals, which have diagnostic spec-tra due to vibration of H and NO bonds. Only the anhydrous Cl- and SO4- salts do not contain any diagnostic features and cannot be distinguished from each other. Large grain size samples exhibit numerous well developed absorption features at wavelengths less than 1600 nm and smaller grains exhibit fewer less developed features in this region and well developed features at wave lengths more than > 1600 nm (Fig. 2).
Absorption features that appear in the spectra of minerals and rocks are due to either electronic or vibration processes. However, it is vibration process that is important in evaporite minerals (Crowley 1991). Vibration absorption features are
caused by excitation of bonds between anion groups. Many of the spectral features in the min-erals studied here can be explained by vibration absorption due to water molecules in or on these minerals. Other features are caused by vibration of carbonate (CO3-), nitrate (NO3-) and ammonium (NH4+) bonds.
The spectral response of water illustrates many of the properties of vibration features. For a molecule of n particles there are 3n-6 fundamental vibrations. As water has three particles it has three fundamental vibrational modes that occur at wavelengths longer than 2500 nm. The exact fre-quency of these fundamental adsorptions depends on the strength of the hydrogen bonds and thus varies according to whether the water is gas, solid or liquid. Absorption features at shorter wave-lengths than these fundamentals arise from linear combinations and overtones of these fundamental adsorptions. These are seen in the 400 to 2500 nm region.
Water molecules in minerals may occur in five different ways: (1) as water molecules physically absorbed to the surface of mineral grains; (2) as water in fluid inclusions; (3) as water in ill-defined sites in the crystal structure; (4) as water in chan-nels in the crystals that are not essential to the crystal structure (zeolitic water); and (5) as water that forms an essential part of the crystal lattice (Hunt et al. 1971a, 1971b; Hunt 1972). Water oc-curring in the first three ways is largely unrelated
Fig. 1. Effect of iron oxide and organic matter on spec-tral reflectance of soil (Source: Sinha 1987).
Fig. 2. Characteristic peaks of water and hydroxylbonds (Source: Baumgardner et al. 1985).

MANCHANDA, KUDRAT & TIWARI 65
to mineralogy and its absorption feature near 1400 and 1900 nm is indicative of this. Many of the an-hydrous salts investigated exhibit these absorption features as they have hydroscopic properties. Wa-ter occurring in the last two ways produces nu-merous features arising from overtones and com-binations of fundamental absorptions long ward of 2500 nm.
Spectra acquired from different specimens of the same mineral exhibit variations due to changes in grain size, shape and structural order (Crowley 1991; Gaffey 1987). For example, arago-nite and calcite have features due to the vibration of C-O bonds, although they are chemically identi-cal the absorption features have slightly different positions (Gaffey 1987). As some of the minerals examined in this study have numerous crystal forms (e.g., gypsum) the positions of their absorp-tion features can be expected to vary slightly.
Apart from the absorption processes, dielectric discontinuities encountered in the soil background media cause scattering. Other sources of variations in soil optical properties are linked to the porosity and both microscopic and macroscopic surface roughness. The presence of -OH group and H2O molecule in soil minerals is also responsible for low reflectance of soils (Hunt 1980; Irons et al. 1989).
Soil texture refers to relative proportion of sand, silt & clay and affects the spectral reflectance of the soils due to its influence on water holding capacity and the size of soil particles. Finer the particles
size, the soil surface becomes smoother and more incoming solar energy is reflected. An increase in particle size causes a decrease in reflectance. How-ever, silt content of soil is considered as major con-trolling factor for spectral reflectance. The reflec-tance becomes lower as the silt content decreases (Hoffer 1978). However, it is commonly observed that sandy soil exhibits higher reflectance than that of clayey soil, which is due to abundance of macro pores and air-soil interface that cause multiple re-flection/scattering. Spectral signatures of a few soils are presented in Fig. 3.
Soil erosion, an important soil degradation process can influence soil spectra. Soil erosion in-fluences indirectly by influencing soil surface roughness and iron content in top soils. So the more is the erosion the more will be soil reflectance (Latz et al. 1984) in the longer wave length of visi-ble and NIR region.
Need and scale of soil mapping The soil maps are required on different scales
varying from 1:1 million to 1:4,000 to meet the re-quirements of planning at various levels . Because the scale of a soil map has direct correlation with the information content and field investigations that are carried out. Small scale soil maps of 1:1 million are needed for macro level planning at na-tional level. The soil maps at 1:250,000 scale pro-vide information for planning at regional or state level with generalized interpretation of soil infor-mation for determining the suitability and limita-tions for several agricultural uses and requires less intensity of soil observations and time. The soil maps at 1:50,000 scale where association of soil series are depicted, serve the purpose for planning resources conservation and optimum land use at district level and require moderate in-tensity of observations in the field. The large scale soil maps at 1:8,000 or 1:4,000 scale are specific purpose maps which can be generated through high intensity of field observations based on maps at 1:50,000 scale of large scale aerial photographs or very high resolution satellite data. Similarly, information on degraded lands like salt affected soils, eroded soils, waterlogged areas, jhum lands (shifting cultivation) etc., is required at different scales for planning strategies for reclamation and conservation of degraded lands (Venkataratnam 1999).
Fig. 3. Typical spectral curves for various soils and nonsoil classes (Source: Venkataratnam 1980).

66 SOIL SURVEY AND MAPPING
State of the art: remote sensing technology for soil and land degradation mapping
Though conventional soil surveys were provid-ing information on soils they are subjective, time consuming and laborious. Remote sensing tech-niques have significantly contributed speeding up conventional soil survey programmes. In conven-tional approach approximately 80% of total work requires extensive field traverses in identification of soil types and mapping their boundaries and 20% in studying soil profiles, topographical fea-tures and for other works. In the case of soil sur-veys with aerial photographs or satellite data con-siderable field work with respect to locating soil types and boundaries is reduced owing to synoptic view. Remote sensing techniques have reduced field work to a considerable extent and soil boundaries are more precisely delineated than in conventional methods.
The satellite data were utilized in preparing small scale soil resource maps showing soil sub-groups and their association for about three dec-ades (Mirajkar & Srinivasan 1975; NRSA 1976; 1978; 1979 & 1981). Survey of literature reveals that remote sensing data from Landsat MSS were used for mapping soils (NRSA 1978; 1979; 1981) and degraded lands like eroded lands, ravinous lands (Kudrat et al. 1977; NRSA 1981), salt-affected soils (Venkataratnam & Rao 1977; Venkataratnam 1980) and shifting cultivation ar-eas (NRSA 1979). Landsat TM, SPOT and IRS sat-ellites enabled to map soils at 1:50,000 scale at the level of association of soil series due to higher spa-tial and spectral resolutions. In one of the major projects in Department of Space, Government of India – “Integrated Mission for Sustainable Devel-opment”-the soil mapping has been taken up at 1:50,000 scale for about 175 districts/blocks in the country. With the availability of PAN data with 5.8 m spatial resolution from IRS-1C/1D satellites soil resources mapping at 1:25,000 or larger scale has been attempted using PAN merged LISS-III data. The IKONOS data has the potential for farm level soil mapping (>1:10,000).
At NRSA, the maps of salt-affected soils for en-tire country have been prepared at 1:250,000 scale using satellite data from Landsat TM / IRS sensors with accepted nation-wide legend for mapping salt affected soils in association with Central and State government organizations. The salt-affected soils are also mapped at 1:50,000 scale on limited scale
using satellite data. Multitemporal satellite data is being used for monitoring salt-affected soils on op-erational basis. Satellite data have also been util-ized in qualitative assessment of soil erosion in North Eastern states of Manipur, Tripura and Arunachal Pradesh and to monitor eroded and shifting cultivation areas in Tripura (NRSA 1990). Similarly, remotely sensed data from TM and IRS-LISS-I/II, have also been used in studying ravi-nous lands, waterlogged areas and impact of min-ing on forest environment.
Soil mapping methods
Soil surveyors consider the topographic varia-tion as a base for depicting the soil variability. Even with the aerial photographs only physiographic variation in terms of slope and aspects and land cover are being practiced for delineating the soil boundary. Multispectral satellite data are being used for mapping soil upto family association level (1:50,000). The methodology in most of the cases involves visual interpretation (Biswas 1987; Karale et al. 1981). However, computer aided digital image processing technique has also been used for map-ping soil (Epema 1986; Korolyuk & Sheherbenko 1994; Kudrat et al. 1990) and advocated to be a po-tential tool (Kudrat et al. 1992; Lee et al. 1988).
Visual image interpretation Visual interpretation is based on shape, size,
tone, shadow, texture, pattern, site and associa-tion. This has the advantage of being relatively simple and inexpensive. Soil mapping needs iden-tification of a number of elements. The elements which are of major importance for soil survey are land type, vegetation, landuse, slope and relief. Soils are surveyed and mapped, following a 3 tier approach, comprising interpretation of remote sensing imagery and/or aerial photograph (Mulder 1987), field survey (including laboratory analysis of soil samples) and cartography (Sehgal et al. 1989). Several workers (Karale 1992; Kudrat & Saha 1993; Kudrat et al. 1990; Sehgal 1995) have concluded that the technology of remote sensing provides better efficiency than the conventional soil survey methods (USDA 1951) at the recon-naissance (1:50,000) and detailed (1:10,000) scale of mapping. A soil map generated through visual interpretation of satellite images at 1: 50,000 scale is given in Fig 4.

MANCHANDA, KUDRAT & TIWARI 67
Computer-aided approach Numerical analysis of remote sensing data
utilizing the computers has been developed be-cause of requirement to analyze faster and extract information from the large quantities of data. The computer aided techniques utilize the spectral variations for classification. The pattern recogni-tion in remote sensing assists in identication of homogeneous areas, which can be used as a base for carrying out detailed field investigations, and generating models between remote sensing and field parameters.
The major problem faced in conventional soil survey and soil cartography is the accurate de-lineation of boundary. Field observations based on conventional soil survey are tedious and time con-suming. The remote sensing data in conjunction with ancillary data provide the best alternative, with a better delineation of soil mapping units
(Karale 1992; Kudrat et al 1990; 1992; Mulders & Epema 1986; Sehgal 1995). However, there is a need to have an automated method for accurate soil boundary delineation (Harmswarth et al 1995) with a transdisciplinary and integrated approach.
Case study
Kudrat et al (2000) evaluated the capability of various IRS sensors for soil mapping, ranging from Wide Field Imaging Sensor (WiFS) to IRS-LISS III and PAN data. The study was carried out in part of Doon valley in India (Fig. 5). An improvement in the delineation of soil boundaries has been ob-served owing to increased spatial resolution. The number of classes were expected to be proportional to the spatial resolution of the sensor. The fractal dimension for possible number of classes in a given spatial resolution was computed using total num-
Fig. 4. Large scale soil map of part of Doon valley prepared from PAN and LISS III merged data.

68 SOIL SURVEY AND MAPPING
ber of classes detectable using WiFS and other sensor data. The total number of classes were re-lated to the increased resolution in comparison to WiFS as:
Y = Sd
where, Y is the multiplication factor for obtaining total number of classes in a given sensor data with reference to WiFS data, S is the resolution enlargement factor with reference to WiFS data and d is the fractal dimension.
The study indicated that in comparison to 8 no. of soil classes delineated from WiFS data, potential classes delineable from merged product of IRS 1C PAN and LISS III data is 57 (Table 2) whereas the actual number of classes delineated was 34. The IRS PAN and LISS III merged product was gener-ated by using Hue, Saturation and Intensity (HSI) transformation images of LISS III data, replacing the intensity image with PAN image, and, trans-forming the HSI (PAN replaced) image back to RGB. In this process, though the images of the spatial resolution of 5.8m could be generated, it
exhibited inherent crudeness due to poor radiome-try of PAN data and the resampling of the LISS III data. Authors concluded that improvement of PAN to multispectral mode with increased radiometric resolution may nearly double the number of delin-eable classes. However, since the fractal dimension is area specific, total number of classes/units may get limited due to variability of actual soil units on the ground.
Fig. 5. Soil map of Doon valley prepared from WiFS.
Table 2. Total number of classes actually ap-peared on soil maps generated for part of Doonvalley and potential classes computed throughfractal analysis.
Sensor Actual classes Potential classes
IRS WiFS 8 8
IRS-LISS-II 21 21
IRS LISS-III 24 26
IRS PAN + LISS III 34 57
MANCHANDA, KUDRAT & TIWARI 69
Kudrat et al. (2000) suggested that minimum fieldwork for WiFS data for ground truth verifica-tion and sample collection for about 600 km2 area is about 10 days. For preparing 1:50,000 scale map for the same area using LISS II and LISS III data the field work requirement was worked out as minimum of 32 days and 36 days. respectively. For mapping at 1:12,500 scale using combination of IRS PAN and LISS III data, a minimum of 90 days are required for the field verification and sampling. The field work includes verification of boundary, profile observation, correlation and fixation of series. The efforts for chemical analy-sis also increase with the increase in scale, which is mainly due to the increased number of soil samples as a result of increase in soil mapping units.
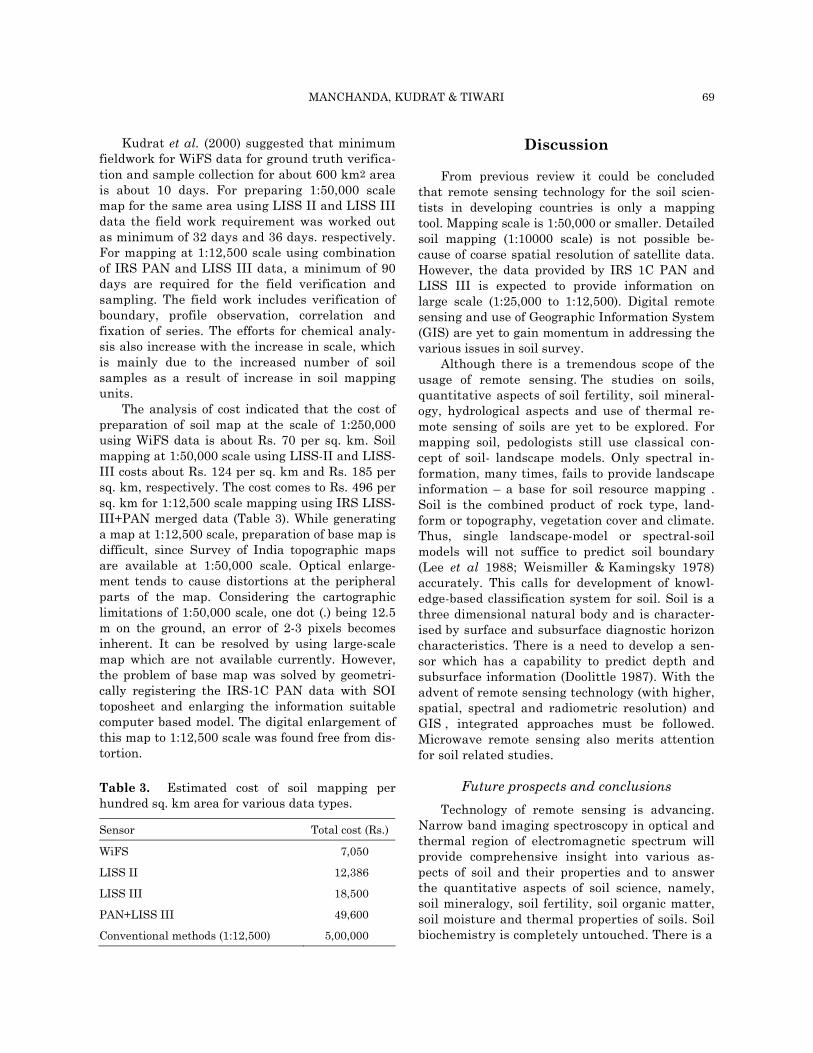
The analysis of cost indicated that the cost of preparation of soil map at the scale of 1:250,000 using WiFS data is about Rs. 70 per sq. km. Soil mapping at 1:50,000 scale using LISS-II and LISS-III costs about Rs. 124 per sq. km and Rs. 185 per sq. km, respectively. The cost comes to Rs. 496 per sq. km for 1:12,500 scale mapping using IRS LISS-III+PAN merged data (Table 3). While generating a map at 1:12,500 scale, preparation of base map is difficult, since Survey of India topographic maps are available at 1:50,000 scale. Optical enlarge-ment tends to cause distortions at the peripheral parts of the map. Considering the cartographic limitations of 1:50,000 scale, one dot (.) being 12.5 m on the ground, an error of 2-3 pixels becomes inherent. It can be resolved by using large-scale map which are not available currently. However, the problem of base map was solved by geometri-cally registering the IRS-1C PAN data with SOI toposheet and enlarging the information suitable computer based model. The digital enlargement of this map to 1:12,500 scale was found free from dis-tortion.
Discussion
From previous review it could be concluded that remote sensing technology for the soil scien-tists in developing countries is only a mapping tool. Mapping scale is 1:50,000 or smaller. Detailed soil mapping (1:10000 scale) is not possible be-cause of coarse spatial resolution of satellite data. However, the data provided by IRS 1C PAN and LISS III is expected to provide information on large scale (1:25,000 to 1:12,500). Digital remote sensing and use of Geographic Information System (GIS) are yet to gain momentum in addressing the various issues in soil survey.
Although there is a tremendous scope of the usage of remote sensing. The studies on soils, quantitative aspects of soil fertility, soil mineral-ogy, hydrological aspects and use of thermal re-mote sensing of soils are yet to be explored. For mapping soil, pedologists still use classical con-cept of soil- landscape models. Only spectral in-formation, many times, fails to provide landscape information – a base for soil resource mapping . Soil is the combined product of rock type, land-form or topography, vegetation cover and climate. Thus, single landscape-model or spectral-soil models will not suffice to predict soil boundary (Lee et al 1988; Weismiller & Kamingsky 1978) accurately. This calls for development of knowl-edge-based classification system for soil. Soil is a three dimensional natural body and is character-ised by surface and subsurface diagnostic horizon characteristics. There is a need to develop a sen-sor which has a capability to predict depth and subsurface information (Doolittle 1987). With the advent of remote sensing technology (with higher, spatial, spectral and radiometric resolution) and GIS , integrated approaches must be followed. Microwave remote sensing also merits attention for soil related studies.
Future prospects and conclusions Technology of remote sensing is advancing.
Narrow band imaging spectroscopy in optical and thermal region of electromagnetic spectrum will provide comprehensive insight into various as-pects of soil and their properties and to answer the quantitative aspects of soil science, namely, soil mineralogy, soil fertility, soil organic matter, soil moisture and thermal properties of soils. Soil biochemistry is completely untouched. There is a
Table 3. Estimated cost of soil mapping perhundred sq. km area for various data types.
Sensor Total cost (Rs.)
WiFS 7,050
LISS II 12,386
LISS III 18,500
PAN+LISS III 49,600
Conventional methods (1:12,500) 5,00,000

70 SOIL SURVEY AND MAPPING
Table 4. Spectral/Dielectric/lonic conductivity features of soil.
Objective/Phenomena Relevant Spectra Region Optimum Spectral Resolution VIS (445 to 700 nm)
Soil Colour 445nm 10-20 nm Organic matter 490 nm 10-20 nm Broadband absorption due to 520 nm 10-20 nm (i) Fe-bearing minerals 565 nm 10-20 nm (ii) Carbonates 620 nm 10-20 nm (iii) Sulphate 670 nm 10-20 nm Erosional features 683 nm 10-20 nm
NIR (745 TO 1035 nm) Vegetative cover 711 nm 10-20 nm Human content 720 nm 10-20 nm Weak absorption due to 780 nm 10-20 nm Fe-bearing minerals 880 nm 10-20 nm
SiO2 960 nm 10-20 nm Erosional features 1035 nm 19-20 nm
SWIR 1: (1500 to 1800 nm) Soil moisture 1500 nm 350nm (qualitative) 1680 nm Weak absorption bands of carbonates 1740 nm 10-20 nm
SWIR II ( 2000 TO 2400 NM) 2320 nm 10 nm Characteristic absorption bands of –CO3, -OH and
SO4 bearing minerals e.g. Carbonates and layer silicates 2310 nm 10 nm 2200 nm 10 nm -OH and AIOH bearing minerals e.g. kaolinite
MuscoviteAlunite 2300 nm 10nm 2340 nm 10 nm
MgOH bearing minerals e.g. Talc, Brucite 2400 nm 10 nm
Soil moisture 2160/2040 nm 20 nm 3000-5000 nm Atmospheric Window
Characteristic emission 3400 nm Spectra 3400 nm Absorption bands due to (i) quartz 4000 nm 1000 nm (ii) carbonates 4500 nm 1000-2000 nm (iii) organic matter 4700 1000-2000 nm
8000-1400 nm Thermal Infrared Region Thermal inertia 10300-11300 nm - Emission spectra 11500-12500 nm Thermal regime (large scale)
Microwave Region (1GHz to 20 GHz) Dielectric response 1.125 GHz (L band) Ionic conductivity (salinity) Soil moisture regime (smaller scale) 5.4 GHz (C-band) Profile moisture estimation 20 GHz (X-band) Erosion and micro-relief feature

MANCHANDA, KUDRAT & TIWARI 71
tremendous scope for the study of soil organic mat-ter utilising narrow band spectroscopy especially in middle and thermal infrared region of electro-magnetic spectra. Attempt for soil mapping follow-ing digital image processing and GIS is very lim-ited (Lee et al 1988). Microwave remote sensing is still at the experimental stage. Tables 1 and 4 ex-hibit the potentiality of narrow band imaging spec-troscopy in characterizing soil mineralogy.
Spectral properties of soils which are governed by the heterogeneous combination of mineral, or-ganic substances, soil moisture and various salts contain the valuable information related to the crucial soil parameters viz., humic substances, soil texture, thermal properties and primary and sec-ondary minerals. The special feature of soils in the visible (0.4-0.7 µ), near infrared (0.7-1.0 µ) and shortwave infrared (1.0-2.5 µ) spectral regions are associated with physico-chemical properties, emis-sion properties. Thermal infrared region (8-14µ) and different microwave frequencies such as C-bands (5.4 GHz) and L-band (1.25 GHz) reveal the temperature regime and hydrologic regime of soils (Foster 1990). These information are of tremen-dous value in predicting the biogenic gases from soils quantitatively and in classifying the soils as per Soil Taxonomy. The biogenic gases, viz., meth-ane, nitrous oxide, carbon dioxide etc. are the products of soil biochemical processes. The fluxes of biogenic gases can be modelled with various soil properties namely organic matter content, nitro-gen content, free iron content, soil reaction, soil moisture status and so on. The potential aspects of the studies on soil, for example, quantitative as-pects of soil fertility, soil mineralogy, hydrological aspects and soil biology, need remote sensing and GIS based research.
A few new promising techniques and tools, still under trial, should improve our capacity for identi-fying and mapping external as well as internal features (Zinck 1990). Doolittle (1987) reported that ground-penetrating radar (GPR) device can provide precise images of complete soil sequences. The GPR is a broad band, impulse radar system whose soil penetration capacity ranges from ap-proximately one meter depth in compact clayey soils to approximately 25 meters in sandy soils. Relevant soil features and diagnostic horizons can be identified in vertical and horizontal extent. Ranges of soil variability can be quantitatively es-tablished. The use of remote sensing for soil sci-ence can certainly be further advanced by en-
hanced understanding of the process of interaction of electromagnetic spectrum with soil.
Acknowledgements
Authors express their sincere thanks to Shri S. Adiga, Director, NNRMS/RRSSC, Bangalore for encouragement and extending facilities. Thanks are due to Dr. L. Venkatratnam of NRSA, Hydera-bad, Dr. A.N. Singh of U.P.RSAC, Lucknow, Dr. S.N. Das of AIS&LUS, New Delhi and Dr. M. Ve-layutham of NBSS & LUP, Nagpur, for providing relevant literature. Valuable suggestions from one of the anonymous referees are gratefully acknowl-edged.
References
Baumgardner, M.F., L.F. Silva, L.L. Biehl & E.R. Stoner. 1985. Reflectance properties of soils. Ad-vances in Agronomy 38: 1-44.
Bear, F.I. 1968. A Text Book of Soil Chemistry. John Wiley Publication, New York.
Biswas, R.R. 1987. A soil map through landsat satellite imagery in part of the Auranga catchment in Ranchi and Palamon district of Bihar, India. International Journal of Remote Sensing 4: 541-543.
Crowley, J.K. 1991. Visible and near-infrared (0.4-2.5 microns) reflectance spectra of playa evaporite min-erals. Journal of Geophysical Research 96:16231-16240.
Doolittle, J.A. 1987. Using Grand-Penetrating Radar to increase the quality and Efficiency of Soil Surveys. Soil Science Society of America. Special Publ. No. 20, Madison.
Drake, N. 1995. Reflectance spectra of evaporate miner-als (400-2500 nm): Applications for remote sensing. International Journal of Remote Sensing 14: 2555-2571.
Epema, G.F. 1986. Processing thematic mapper data for mapping in Tunisia. ITC Journal 1986:30-34.
Foster, G.R. 1990. Process-based modelling of soil erosion by water on agricultural land. pp. 429-445. In: J.Boardman, G.R Foster & J.A. Dearing (eds.) Soil Ero-sion and Agricultural Land. John Wiley & Sons. Ltd.
Gaffey, S.J. 1987. Spectral reflectance of carbonate min-erals in the visible and near infrared (0.35-2.55 mi-crons) anhydrous carbonate minerals. Journal of-Geophysical Research 92:1429-1440.
Harmswarth, G.R., J.R Dymond & M. Meleod 1995. Automated mapping of soils in hilly terrain using DTMS: A new zeal and example. ITC Journal 1995: 87-95.

72 SOIL SURVEY AND MAPPING
Hoffer, R.M. 1978. Biological and physical considerations in application computer aided analysis techniques to remote sensing. pp 237-286. In: P.H. Swain & S.M. Davis (eds.) Remote Sensing: Quantitative Approach. McGraw-Hill International Book Co.
Hunt, G.R. & J.W. Salisbury 1976. Visible and near in-frared spectra of minerals and rocks: XI. Sedimen-tary rocks. Modern Geology 5: 211-217.
Hunt, G.R. 1980. Electromagnetic radiation: The com-munication link in remote sensing. pp. 5-46 In: B.S Siegal & A.R. Gillesppie (eds.) Remote Sensing in Geology. John Wiley & Sons. New York.
Hunt, G.R., J.W. Salisbury & C.J. Leohoff. 1971a. Visi-ble and near infrared spectra of minerals and rocks: 3.oxide and hydroxides. Modern Geology 2: 195-205.
Hunt, G.R., J.W. Salisbury & C.J. Leohoff. 1971b. Visi-ble and near infrared spectra of minerals and rocks: 4.Sulphides and sulphates. Modern Geology 3:1-13.
Hunt, G.R., J.W. Salisbury & C.J. Leohoff. 1972. Visible and near infrared spectra of minerals and rocks: V. Halides, phosphates, arsenates, vanadates and bo-rates. Modern Geology 3:121-132.
Irons, J.R., R.A. Weissmiller & G.W. Peterson 1989. Soil reflectance. pp. 107-141. In: G. Asrar (ed.) Theory and Application of Optical Remote Sensing. Wiley Interscience. New York.
Karale, R.L., Y.P. Bali & K.V. Rao 1981. Soil mapping using remote sensing techniques. Proceedings Indian Acad-emy of Science and Engineering Sciences 3:197-208.
Karale, R.L.1992. Remote sensing with IRS-1A in soil studies: development, status and prospects. pp. 128-143. In: R.L. Karale (ed.) Natural Resources Man-agement-A New Perspective. NNRMS, Bangalore.
Korolyuk, T.V. & H.V. Shcherbenko. 1994. Compiling soil maps on the basis of remotely sensed data digi-tal processing: Soil interpretation. International Journal of Remote Sensing 15: 1379-1400.
Kudrat, M., A.K. Tiwari, S.K. Saha & S.K. Bhan. 1992. Soil resource mapping sing IRS-1A LISS II digital data- A case study of Kandi area adjacent to Chandigarh (India). International Journal of Re-mote Sensing 13: 3287-3302.
Kudrat, M. & S.K. Saha. 1993. Land productivity as-sessment and mapping through integration of satel-lite and terrain slope data). Indian Journal of Re-mote Sensing 21: 151-166.
Kudrat, M. 1996. Remote Sensing and Geographical In-formation System for Management of Jainti Water-shed, Bihar. Regional Remote Sensing Service cen-tre, Dehradun.
Kudrat, M., A.K.Sinha & M.L.Manchanda. 2000. Multi-level Soil Mapping using IRS1C WiFS, LISS III and Pan Data. Indian Space Research Organisation, Bangalore. India.
Kudrat, M., A.K. Tiwari & S.K. Saha. 1997. Modelling sediment yield for prioritization of sub-watersheds using remote sensing and GIS techniques. Geocarto International 12: 31-38.
Kudrat, M., B. Prabhakaran, T.R.S.V.S. Sastry, A.K. Tiwari, K.P. Sharma & M.L. Manchanda. 1995. Quantative estimation of soil loss through remote sensing: A case study of part of Chotanagpur Pla-teau, India. pp. 37-44. In: C.V.J. Varma & A.R.G. Rao (eds.) Management of Sediments: Philosophy, Aims and Techneques. Central Board of Irrigation and Power, New Delhi.
Kudrat, M., S.K. Saha & A.K.Tiwari. 1990. Potential use of IRS LISS II digital data in soil landuse mapping and productivity assessment. Asian Pacific Remote Sensing Journal 2: 73-78
Latz, K., R.A. Weismiller, G.E. Van Scoyoc & M.F. Baumgardner. 1984. Characteristic variations in spectral reflectance of selected eroded soils. Soil Science Society of America Journal 48: 1130-1134.
Lee, K.S., G.B. Lee & J. Tyler. 1988. Determination of soil characteristics from thematic mapper data of a cropped organic- inorganic soil landscape. Soil Sci-ence Society of America Journal 52: 1100-1104.
Mirajkar M.A. & T.R. Srinivasan. 1975. Landsat Photo-interpretation for preparation of small scale maps through a multistage approach. Photonirvachak 3: 87.
Mohan, S., N.S. Mehta & P. Patel. 1990. Radar Remote Sensing for Land Resources - A Review. Scientific Report No. ISRO-SAC-SR-36-91. Space Applications Centre, Ahmedabad.
Mulders 1987. Remote Sensing in Soil Science Develop-ment in Soil Science. Elsevier. Amstardam. The Netherland.
Mulders & G.F. Epema. 1986. The thematic mapper: A new tool for soil mapping in arid area. ITC Journal, 1986: 24-29.
NRSA 1976. An Application of Satellite Remote Sensing Techniques for Integrated Pilot Survey of Natural Resources in Parts of Punjab and Haryana – An Ab-stract Report, National Remote Sensing Agency, Secunderabad, India.
NRSA 1978. Satellite Remote Sensing Survey of Natural Resources of Andhra Pradesh. Project report, Na-tional Remote Sensing Agency, Secunderabad, In-dia.
NRSA 1979. Satellite Remote Sensing Survey of Natural Resources of Haryana. Project Report, National Re-mote Sensing Agency, Secunderabad, India
NRSA 1981. Satellite Remote Sensing Survey for Soil and Land Use in Part of Uttar Pradesh. Project Re-port, National Remote Sensing Agency. Hyderabad, India.

MANCHANDA, KUDRAT & TIWARI 73
NRSA 1990. IRS-Utilisation Programme: Soil Erosion Mapping. Project Report National Remote Sensing Agency, Hyderabad, India.
Page, W.R. 1974. Effect of organic matter in Atlantic coastal plain soils with a color difference meter. Ag-ronomic Journal 66: 652-653.
Saha, S.K., M. Kudrat & S.K. Bhan 1991. Erosional soil loss prediction using digital satellite data and uni-versal soil loss prediction-soil loss mapping in Si-walik Hills in India. pp. 369-372. In: S. Murai (ed.) Applications of Remote Sensing in Asia and Oce-ania. Asian Association on Remote Sensing, Tokyo.
Sehgal, J.L., O. Challa, B.L Gajja, B.L. & S.C. Yadav 1989. Suitability of swell Shrinik Soil of India for crop growth. pp. 29-53. In: O. Van. Cempat (ed.) Proceedings of 25th Anniversary of the ITC. State University Ghent (Belgium) ITC-Ghent Publ. Sr. No. 1.
Sehgal, J.L. 1995. Land resource appraisal for landuse Planning to meet the challenges of 21st Century. Journal of Indian Society of Soil Science 43: 504-528.
Sinha, A.K. 1987. Variation in soil spectral reflectance related to soil moisture, organic matter and particle size. Journal of Indian Society of Remote Sensing 15: 7-12.
U.S.D.A. 1951. Soil Survey Manual. Hand Book No. 18. U.S.D. Printing office, Washington D.C.,
Szabolcs, I. 1994. The concept of soil resilience. pp. 33-40. In: D.J. Greenland & I. Szabolcs (eds.) Soil Re-silience and Sustainable Use. CAB International, Wallingford.
Velayutham, M. 1999. National Soil Resources Mapping. National Beurau of Soil Survey and Landuse Plan-ning. Nagpur, India.
Velayutham, M. 2000. Available soil information and the need for the systematic classification of soils of In-dia. Journal of Indian Society of Soil Science 48: 683-689.
Venkataratnam L. & K.R. Rao 1977. Computer aided classification and mapping soils and soil limitations using landsat multispectral data. pp. 101-104. In: Proceedings of Symposium on Remote Sensing for Hydrology, Agriculture and Mineral Resources. Space Applications Centre, Ahmedabad, India.
Venkataratnam L. & M.L. Manchanda. 1997. Remote sensing in soil resource management. ISPRS Work-shop on Application of Remote Sensing and GIS for Sustainable Development. National Remote Sensing Agency, Hyderabad, Nov. 24-25.
Venkataratnam, L. 1980. Use of remotely sensed data for soil mapping. Photonirvachak 8: 19-26.
Venkataratnam, L. 1999. National soil and land degra-dation mapping-remote sensing perspective. pp. 29-37. In: Proceedings of Workshop on Environmental Modelling using Remote Sensing and GIS for Sus-tainable Development. Vol. 32, Part 7-w9. Interna-tional Society of Photogrammetry and Remote Sens-ing.
Weismiller A. & S.A. Kamingsky 1978. Application of remote sensing technology to soil survey research. Journal of Soil and Water Conservation 33:288-295.
Zinck, J.A. 1990. Soil survey: epistemology of avital dis-cipline. ITC Journal 1990: 335-351.
Annexure 1: Explanation of legend of Fig. 5
Symbol Description of the units Soil Association (Family) H Siwalik hill
H11 Southern aspects of Siwalik hill, Escarpments Loamy skeletal Lithic Udorthents, Loamy skeletal Typic Udorthents
H12 Southern aspects very sleep slope moderate dense forest Loamy skeletal Mollic Eutrochrepts, Loamy skeletal Typic Udorthents
H13 Southern aspects, strong slope, moderate forest Coarse loamy Mollic Eutrochrepts, Loamy skeletal Dystric Eutrochrepts
H21 Northern aspects, Crest Fragmental Typic Udorthents, Loamy skeletal Lithic Udorthents
H22 Northern aspects, side slope having steep to very steep slopes, dense forests
Fine loamy Mollic Hapludalfs, Fine loamy Typic Argiudolls
H23 Foot hills of Siwalik/Residual hills Fine loamy Typic Hapludalfs, Fine Loamy Dystric Eutrochrepts
P Piedmont
P11 Undulating upper piedmont, slope (5-50%) Loamy skeletal Typic Udorthents, Loamy skeletal, Dystric Eutrochrepts

74 SOIL SURVEY AND MAPPING
Annexure 1 Contd. Symbol Description of the units Soil Association (Family)
P12 Gently sloping upper piedmont cultivation Fine loamy Typic Hapludalfs, Fine loamy Dystric Eutrochrepts, Fine loamy Mollic Hapludalfs
P13 Upper piedmont forested Fine loamy Typic/Mollic Hapludalfs, Loamy skeletal Dystric Eutrochrepts
P2 Lower piedmont Fine loamy Mollic/Typic Hapludalfs, Loamy skeletal Dystric Eutrochrepts
AT Asan river terrace
AT1 Lower Asan river terrace Typic Udipsamments, Coarse loamy Typic Eutrochrepts
AT2 Middle Asan terrace Fine loamy Dystric Eutrochrepts, Fine loamy Mollic Eutrochrepts
AT3 Upper Asan terrace Fine loamy Mollic Hapludalfs, Fine loamy Dystric Eutrochrepts
GT Ganga terraces
GT1 Lower Ganga terraces Coarse loamy Typic Udifluvents, Typic Udipsamments
GT2 Upper Ganga terraces Fine loamy Mollic Hapludalfs, Fine loamy Typic Eutrochrepts
ST Song river terraces
ST1 Lower terraces of Song river Coarse loamy Dystric Eutrochrepts, Loamy skeletal Typic Udorthents, Typic Udipsamments
ST2 Middle terraces of Song river Fine loamy Typic Hapludalfs, Fine loamy Dystric Eutrochrepts
ST3 Upper terraces of Song river Fine loamy Typic Hapludalfs, Fine loamy Mollic Hapludalfs
RH Residual hill Fragmental Typic Udorthents, Loamy skeletal Typic Udorthents
M2 Lower mountain
M21 Southern aspect Fragmental Lithic Udorthents, Loamy skeletal Typic Udorthents, Loamy skeletal Dystric Eutrochrepts
M22 Northern aspects Fragmental Typic Udorthents, Loamy skeletal Dystric Eutrochrepts, Fragmental Dystric Hapludolls