soil structure interaction for integral abutment bridge using spring
TRANSCRIPT

IOP Conference Series Materials Science and Engineering
OPEN ACCESS
Soil Structure Interaction for Integral AbutmentBridge Using Spring Analogy ApproachTo cite this article W A Thanoon et al 2011 IOP Conf Ser Mater Sci Eng 17 012035
View the article online for updates and enhancements
You may also likeSafety Assessment Technology ofConcrete Arch DamJiahong Zhang Xiulin Li and Yuelin Sun
-
Study on Mechanical Properties of SimplySupported Girder Bridge after JointlessWQ Guo XY Luo YF Tang et al
-
Formation of bridge end bumps due tosettlement at bridge approachesM Aziman M R Raizal Saifulnaz FHejazi et al
-
This content was downloaded from IP address 191240117149 on 27012022 at 1344
Soil Structure Interaction for Integral Abutment Bridge Using Spring Analogy Approach
W A Thanoon3 A A Abdulrazeg1 J Noorzaei2 M S Jaafar1 O Kohnehpooshi1 1Department of Civil Engineering University Putra Malaysia 43400 Serdang Selangor Malaysia 2Institute of Advance Technology University Putra Malaysia 43400 Serdang Selangor Malaysia 3Faculty Engineering Nizwa University Oman Email jamalengupmedumy Abstract The reaction of the backfill behind the abutments and adjacent to the piles plays a significant role in the behavior of the Integral bridge The handling of soil-structure interaction in the analysis and design of integral abutment bridges has always been problematic due to its complexity This study describes the implementation of a 2-D finite element model of IAB system which explicitly incorporates the soil response The superstructure members and the pile have been represented by means of three-node isoperimetric beam elements with three degree of freedom per node The Eight node isoperimetric quadrilateral element has been used to model the abutment The backfill was idealized by uncoupled lsquoWinklerrsquo spring The applic1ability of this model is demonstrated by analyzing a single span IA bridge The results have shown that the shear forces at the tops of the supported piles were only 12 to 16 of the load which at the top of abutment
1 Introduction Integra abutment bridges are bridges which generally built with their superstructures integral with the abutment and without expansion or contraction joints for the entire length of the superstructure avoid expansion joints and movement bearings that otherwise need regular maintenance The integral abutment bridge (IAB) is one of the significant developments in road bridge technology during the latter part of the 20th century Unfortunately the elimination of expansion joints which can be costly structural maintenance problem with conventional bridge and is the key benefit of an IAB has resulted in other unanticipated maintenance problems that turn out to be geotechnical in nature In a sense road agencies worldwide have simply exchanged one type of maintenance problem for another(Hovarth 2000) IABs have been used for road since at the least the early 1930s in the USA However they seen more-extensive use worldwide in recent years because of their economy of construction in a wide range of condition Joint less bridge can be classified into four groups (Arsoy and Barker 1999) Flexible arch bridges Slip joint bridges Abutment less bridges and integral bridge
CAMAN IOP PublishingIOP Conf Series Materials Science and Engineering 17 (2011) 012035 doi1010881757-899X171012035
Published under licence by IOP Publishing Ltd 1
Research work on integral abutment bridge has started since the latter part of 20th century From that time many mathematical numerical models have been proposed to predict the real behavior of integral bridge
Springman et al (1996) investigated the behavior of integral abutment bridge under the cyclical temperature change on the bridge deck Their study has shown that the cyclical temperature changes will result imposition of cyclical horizontal displacements to the backfill soil of the abutments
Arsoy and Barker (1999) modelled the Integral abutment bridge as a plane strain problem The abutment was modelled using four node quadrilateral elements with linear stress-strain properties The loads applied represent the forces exerted on the abutment by the superstructure Finite element analyses show that the zone of surface deformation extends from the back of the abutment to a distance equal to about three to four times the height of the abutment The movement of the abutment into the approach fill develops passive earth pressure that is displacement-dependent The ground around the piles moves along with the movement of the abutment The relative movement between the pile and ground is therefore reduced resulting in relatively low shear forces at the top of the pile
S Faraji (2001) used a three-dimensional finite element model to simulate interaction between the integral bridge and surrounding soil ) in this study the superstructure was modeled as plate element for slab and beam element for diaphragms The abutment modeled as plate element and the soil was represented by series of uncoupled Winkler spring Noorzaei et al (2004) in this work an attempt was made to carry out three dimensional finite elements modeling of integral abutment bridge- foundation backfill system subjected to temperature loading Sixteen node isoperimetric brick element was used to model the abutment foundation backfill and supporting soil system
J L Fennema et al(2005) [6] determined the effect of the superstructure thermal loading and soil stiffness on the pile behavior In this study pile- soil media interaction was modelled using P-y curve The result show that the primary mode of movement of the integral abutment is through rotation about the base of the abutment not longitudinal displacement of the abutment as typically assumed for design
D DREIER (2008) [7] investigated the structural behaviour of piers of integral bridges considering the interaction between the foundations of the piers and the surrounding soil The cracking limit state is investigated considering short-term imposed strains in the bridge deck as a function of the maximal horizontal displacement allowable at the top of the pier
The main objective of this study is analyses the integral bridge ndash pile ndashsoil foundation system as a single compatible unit to present the real behavior of such structure under real life loads ( Gravity load tracks laod) 12 Proposed physical model
In order to numerically simulate the integral bridge ndash foundations and soil media the following elements are utilized i Three node isoparametric beam bending element with three degrees of freedom per node to
represent the superstructure and pile (EHanton and DRJOwen 1977) ii Eight node conventional parabolic finite element to represent the abutment (Zienkiewicz et al
1983) iii Winkler model (Spring Model) to present the soil reaction
A brief description of three above elements is discussed here in 13 Three node isoparametric beam bending element The proposed element is of isoparametric family with three degree of freedoms per node as shown in (Figure1) The shape function of this element can be written as N113 =13 minus13 12ξ1minusξ
N213 =13 1minusξ2 (1)
CAMAN IOP PublishingIOP Conf Series Materials Science and Engineering 17 (2011) 012035 doi1010881757-899X171012035
2
N313 =13 13 12ξ1+ξ
Nodal displacements at any node i are taken as
δi13 =ui13 vi13 θiT (2)
Where empty is the effective rotation due to transverse shear Further displacements and rotations at any point may be expressed in terms of shape functions in the conventional manner as u13 =i=13Ni13 ui13 13 13 13 13 13 13 13 13 v=i=13Ni13 vi13 13 13 θ13 =i=13Ni13 θi
φ13 =minusi=13partNipartxi+i=13Ni13 θi (4)
Figure 1Parabolic isoperimetric Beam Element
2 Eight node parabolic finite element Eight-node iso-parametric finite element is one of the most commonly used elements The proposed element is of isoparametric family with two degree of freedoms per node as shown in (Figure2) The shape function of this element can be written as
Figure 2 2-D isoperimetric quadrilateral Element Shape function For corner nodes 13 =13 13 141+1++minus1 (5) For midside nodes 13 =241+1+2+221+1+2 (6)
3 Modulus of subgrade reaction Ks
CAMAN IOP PublishingIOP Conf Series Materials Science and Engineering 17 (2011) 012035 doi1010881757-899X171012035
3
Unfortunately there is no direct formula that gives the value of initial subgrade reaction modulus for a particular type of soil Therefore in this study the initial subgrade Modulus was calculated based on the Table 1 which is obtained from experimental tests (plate test) In Table 1 the value of Ks comes in terms of KN msup3 so to add this Ks value to structurersquos stiffness matrix it has been multiplied by the effective area of spring as shown Figure3
Table 1 Typical values for the modulus of subgrade reaction
Soil ks KNmsup3 Loose sand 4800-16000 Medium dense sand 9600-80000 Dense sand 64000-128000 Clayey medium dense sand 32000-80000 Silty medium dense sand 24000-48000 Clayey soil qa le 200 kap 12000-24000 200 lt qa le 800 kap 24000-48000 qa gt 800 kap gt48000
Figure3Typical Soil Spring
Ks (coefficient) = Ks (Module) h L (7)
Where h is the effective length of spring L is the effective depth which is taken 1 meter in case of plane strain
4 Computer Code Based on the proposed physical and material models the finite element code which was developed
by (Noorzaei1991) has been further modified for the inclusion of spring constant The current
CAMAN IOP PublishingIOP Conf Series Materials Science and Engineering 17 (2011) 012035 doi1010881757-899X171012035
4
version of the program has several 2-D isoperimetric Elements one dimensional beam isoperimetric element with three degree of freedom per node (u υ θ) two dimensional infinite elements and joint elements in its element library
5 Calibration of Program Before the application of the code against full-scale problems of real bridge analysis it is verified by solving a few examples available in the literature and only results of one of these examples is presented herein ie beam with elastic support as shown in Figure 4
Figure4 Beam with elastic support Table 2 Comparison of displacement rotation shear and moment for the given example
6 Problem Analyzed The application of the proposed physical and constitutive model is shown by analyzing an actual integral bridge in Malaysia (Figure5) shows the front view of Sun GIA TITI GANTUNG Highway Bridge in Malaysia The geometrical detail of a the bridge are tabulated in (Table 3)
Figure5 Elevation View Schematic of Sun GIA TITI GANTUNG Malaysia
The bridge loading has been calculated based on loads for highway bridges (BD3788 1989) The following loadings are the different combinations for Highway bridges
i First load Combination HA loading consists of uniformly distributed load (UDL) and a Knife edge load (kEL)
1st13 load13 Com=HAminusUDL+(HA13 ndash13 KEL) (8) ii Second Load Combination
Term Max Deflection
Max Ration
Shear
Moment
Literature -0082949 -0000517
5 000 100
Present Study
-0083729 - 0005296
49987
99895
Difference 093 23 1 2
CAMAN IOP PublishingIOP Conf Series Materials Science and Engineering 17 (2011) 012035 doi1010881757-899X171012035
5
HB loading is a load of abnormal vehicle The HB vehicle replaces one lane of HA loading and is positioned for worst effect
2nd13 load13 Com=HAminusUDL+(HB) (9)
Table 3Geomtrical details of bridge
7 Proposed Model Finite element model of integral Bridge- Abutment- Pile- Soil System are Shown in (Figure6)
Figure6 Finite element discretization of IA Bridge- Foundation ndashsoil sys Where element A is eight- node isoperimetric element element B is three- node isoperimetric beam element and C is Winkler spring element
8 Result and Discussion The lateral soil resistance both behind the abutment wall and next to piles can be thought of as a series of uncoupled lsquoWinklerrsquo spring where these series of spring represent the interaction between structure and soil( S Faraji 2001) The profile deflection of superstructure is logically follows the shape of saucer where the maximum deflection will be too closed to middle of span and that depends on the load position for the first load combination the position of load not that significant as the second load combination which maximum deflection varying along the span Figure7 (a)amp(b)
Descriptions Length (m)
Total span length Total width of bridge Clear distance between parapets Carriageway width
3940 1150 1050 0950
CAMAN IOP PublishingIOP Conf Series Materials Science and Engineering 17 (2011) 012035 doi1010881757-899X171012035
6
Figure7 (a) Profile deflection of slab for various loads position (Case No One)
Figure7 (b) Profile deflection of slab for various loads position (Case No two)
The analysis result has shown also the profile deflection of slab for various combination loads where (05 L) middle span position was selected as critical position where the maximum deflection has been occurred Figure7(c) Obviously the second load combination which takes HB loading in to account has been found to be more significant than first load combination From basic of structural analysis the magnitude and diagram of bending moment is effectuated by many factors such as magnitude position of load along the slab type of load (distributed load or concentrated load) length of span and boundary condition Since the study doesnrsquot touch the geometry parts (length of span is constant) the discussion will be done regarding to the position and different combination of load
Figure7 (c) Profile deflection of slab for various loads combination
Regarding to the bending moment of girder first load combination was more effective and gave maximum moment which is support the basic principle where structure will be designed for first load combination and check serviceability for second load combination Figure 8(a)amp (b) have shown the variation of moment of girder for various load position Figure 8(c) has shown Variation of moment
CAMAN IOP PublishingIOP Conf Series Materials Science and Engineering 17 (2011) 012035 doi1010881757-899X171012035
7
of girder for various load combination where the difference of maximum moment is almost three times
Figure 8 (a)Variation of moment of girder for various load position (First load combination)
Figure8 (b)Variation of moment of girder for various load position (Second load combination)
Table 4 Bending moment of girder for different load position
Position COM Load
000 L
025 L
05 L
L4
562867 KN m
607110 KN m
467187 KN m
First load
combination
L2 7403 KN m
7710 KN m
809823 KN m
L4
482 KN m
19101 KN m
254261 KN m
Second
load combination
L2
20405 KN m
3033 KN
m
31132 KN m
CAMAN IOP PublishingIOP Conf Series Materials Science and Engineering 17 (2011) 012035 doi1010881757-899X171012035
8
Figure8 (c) Variation of moment of girder for various load combination
All the discussion above was for superstructure for the substructure components the displacement differential stress will be discussed in detail in order to study behavior of superstructures components (abutment and piles)
As the load applied to superstructure it will deflected as illustrated since there is no lateral load applied yet the abutments they will follow the girder and rotated toward as shown in Figure 9(a)(b)amp (c) Clearly we can see that the position of HB loading (vehicle) has a significant effect on displacement of abutment Maximum displacement will occur at the top of abutment where the pressure load of soil is neglect able However if we go deeper the resistance pressure will increase to reach the maximum value at the bottom of abutment
Figure9(a) Displacement of abutment for various load position (`Case No One)
CAMAN IOP PublishingIOP Conf Series Materials Science and Engineering 17 (2011) 012035 doi1010881757-899X171012035
9
Figure9(b) Displacement of abutment for various load position (Case No Two)
Figure 9(c) Displacement of abutment for various load Combination
As the abutment deflects under load the piles that support it also deflect as shown in Figure 9 (a)amp (b) Figure 10 (a)amp (b) Shown the lateral movement of piles due to vertical loading The vertical displacement is not due to the lateral loading only it takes place also due to the vertical loading Therefore the lateral loading causes lateral displacement on planes perpendicular to the vertical axis of the pile along the pile length It is usually of greatest interest to know the largest displacement on these planes particularly at the ground level The bending moment and the applied torsion are also of interest The position of vertical load is very effective the close load to the abutment the high lateral displacement at the top of pile Table 5 shows maximum lateral displacement for various load combination
CAMAN IOP PublishingIOP Conf Series Materials Science and Engineering 17 (2011) 012035 doi1010881757-899X171012035
10
Table 5 Maximum lateral displacement of pile
Position COM Load
000 L
025 L
05 L
First load
combination
6718 mm
600 mm
56 mm
Second load combination
500 mm
45 mm
400 mm
Figure10 (a) Lateral movement of piles for first load combination
Figure10(b) Lateral movement of piles for second load combination
To see clear picture of effect of various loads combination on the lateral movement Figure 10(c) shown the lateral movement of piles for different loads combination
CAMAN IOP PublishingIOP Conf Series Materials Science and Engineering 17 (2011) 012035 doi1010881757-899X171012035
11
Figure10(c) Displacement of pile for various load combination
The results of the analyses have shown that the shear forces at the tops of the piles were only 12 to 16 of the nodal load which at the top of abutment as shown in Figure10(d) This is due to the fact that the relative Displacement between the pile and the surrounding ground is small which results in low shear forces at the top of the pile
Figure10(d) Free body diagram of the abutment and piles
Stresses variation of abutments due to applied load (vertical load) σ y has maximum magnitude compared to stresses in other directions because only vertical load has been taken in account in this study Since 2-D finite element has been used to idealize the abutment it is not difficult to calculate stress by using Gaussian points In this study three Gaussian points for each element have been adopted Figure11
Figure11Gauss integration points in two-dimensional parent elements
in order to present the variation of σy Figures 12(a) (b)amp(c) have been plotted to show the stress concentration contour and wireframe It can be seen clearly from Figures that the stress is highly concentrated at connection of the abutment with pile and with approach slab as well
CAMAN IOP PublishingIOP Conf Series Materials Science and Engineering 17 (2011) 012035 doi1010881757-899X171012035
12
Figure12 (a) concentration σy of abutment for various load combination
Figure12 (b) Contour of variation σy of abutment for various load combination
(1) First Load Combination (Left Abutment)
CAMAN IOP PublishingIOP Conf Series Materials Science and Engineering 17 (2011) 012035 doi1010881757-899X171012035
13
(2) Second Load Combination (Left Abutment)
(3) First Load Combination (Right Abutment)
(4) Second Load Combination (Right Abutment)
Figure12 (d) Wireframe of variation of σy for various load combination (Second load case)
From stresses plots above the most critical zone is the connection between the abutment and girder In order to check this zone against the failure whether is cracking or crushing the allowable tinsel and compressive strength must be compared with the actual stresses on this zones The compressive strength was calculating based on the formulation given in ACI =4750prime (8) Where prime is the compressive stress of concrete MPa For calculating the direct tensile strength the next equation has been used =015prime0744 (9)
CAMAN IOP PublishingIOP Conf Series Materials Science and Engineering 17 (2011) 012035 doi1010881757-899X171012035
14
From the program the maximum tensile stress is 600 KNm2 (tension zone Figure13) and maximum compressive stress is 2800 KNm2 comparing them with allowable ones form Equs(8 amp 9) the abutment is consider safe against cracking and crushing
Figure13 Contour of concentration of stresses in the abutment
9 Conclusion In this study the formulation of a beam bending element which takes into account effect of transverse shear deformation and the axial interaction is given An attempt has been made to apply this element along with other conventional finite elements to analyze Integral bridge abutment - pile foundation -soil media Based on the finding of the present study the following conclusions can be drawn bull An attempt has been made in the present study to model an integral abutment bridge with
foundation and backfill system as a single compatible unit using coupled 2-D finite- element formulation ndashWinkler spring
bull This study has shown that the integral abutment bridge is behaving as one unit and its components
moved sequencely Since the superstructure members are connected to the abutment thus any movement in the superstructure will cause a consequence movement in the abatement The pile as a mean of support connected to the abutment the movement of abutment will create a shear force on the top of pile which leads to lateral displacement of pile
bull The results of the analyses have shown that the shear forces at the tops of the piles were only 12 to 16 of the nodal load which at the top of abutment This is due to the fact that the relative Displacement between the pile and the surrounding ground is small which results in low shear forces at the top of the pile
bull The stress concentration is highly concentrated at connection of the abutment with pile and approach slab as well
References [1] J M Duncan and CY Chang1970 Nonlinear analysis of stress and strain in soil J SMFE
ASCE 96 1629-1654 [2] J L FennemaJ A Laman D G Linzell2005 Predicted and Measured Response of an Integral
Abutment Bridge ASCE [3] OC Zienkiewicz C Emson and P Bettes1983 A novel boundary infinite element IntJNumer
Meth Engng 17347-355 [4] P B1977Infinite element IntJNumer Meth Engng 11 53-64 [5] P N Godbole M N Viladkar and j Noorzaei 1991Nonlinear Soil-structure interaction
analysis using coupled finite-infinite elements Comput Struct 39 525-534 [6] S Faraji amp John M Ting2001 Nonlinear Analysis of Integral Bridges Finite Element Model
Geotech and Geoenvir Engrg Volume 127 Issue 5 pp 454-461
Compression13 Zone13 13
Tension13 Zone13 13
CAMAN IOP PublishingIOP Conf Series Materials Science and Engineering 17 (2011) 012035 doi1010881757-899X171012035
15
[7] Y A Khodair S Hassiotis2005 Analysis of soil ndashpile interaction in integral bridge Computers and Geotechnics Volume 32 Issue 3
[8] Arsoy amp Richard M Barker1999 The Behavior of Integral Abutment BridgesReport [9] EHanton and DRJOwen1977 Finite Element Programming Academic Press London [10] Horvath J S (2000) Integral-abutment bridges problems and innovative solutions using EPS
geofoam and other geosynthetics Res Rpt No CEGE-00-2 Manhattan Coll Sch of Engr Civil Engr Dept Bronx NY
[11] J Noorzaei1997 Non-linear soil-structure interaction in framed structure PhD thesis Department of civil Engineering University of Roorkee Roorkee
[12] Springman et al 1996 Cyclic loading of sand behind integral bridge abutments TRL Report TRL 146 Crowthorne TRL Limited
[13] D Dreier 2008Influence of soil-structure interaction on structural behaviour of integral bridge piers 7th fib PhD Symposium in Stuttgart Germany
[14] JNoorzaei MSJaffar WAThanoon2004 3-D Modeling of Abutment- Foundation -Backfill in Integral Bridge International Conference on Bridge Engineering amp Hydraulic Structures Selangor Malaysia
[15] British code Department of Transport Highways and Traffic Load for Highway Bridges 37881989
CAMAN IOP PublishingIOP Conf Series Materials Science and Engineering 17 (2011) 012035 doi1010881757-899X171012035
16
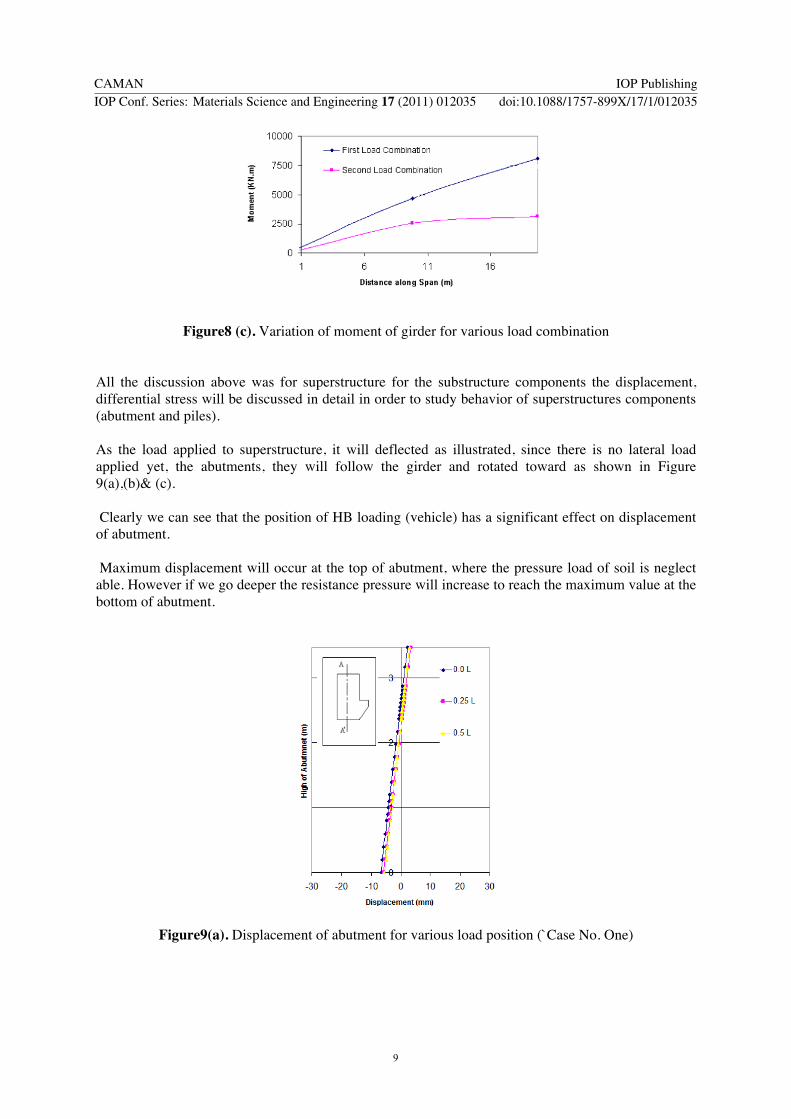