soil sampling on an extreme terrain rover: a pneumatic...
TRANSCRIPT

1
Soil Sampling on an Extreme Terrain Rover: A Pneumatic Device Kristen Holtz
Mentor: Professor Joel W. Burdick Co-mentor: Melissa Tanner
Abstract: A key problem in rover exploration missions is that many of the scientifically interesting areas to investigate are extremely difficult to access given typical flat-topography rovers. The Axel rover was designed to rappel down steep cliffs using a tether held securely at the top. It is very important that this rover is capable of taking and analyzing samples of soil on Mars. Goals for such a sampling mechanism are to collect a sample of at least 2 grams and store it, and to repeat this. The system developed here is a preliminary system that takes one sample and stores it using a pneumatic device. A pneumatic approach was chosen due to its simplicity, as minimal actuation will be needed to move soil. This design can be easily integrated with a multi-sample system later on. Tests to maximize soil collection were done to choose a design for the system, and this design will be implemented on Axel soon to test its effectiveness. This work was done in conjunction with another SURF student. Introduction:BackgroundThere are many promising areas on Mars that are impossible to investigate with the current rovers, such as those in the Pathfinder, MER, and MSL missions. These rovers are not capable of going down cliffs, or into craters or canyons, making these interesting geological features hard to study. The Axel rover is able to rappel down steep cliffs using a tether that wraps around the body of Axel. Axel spools and unspools the tether to go higher or lower. The caster arm through which the tether runs also assists in climbing over obstacles and holding Axel to a central module with another Axel rover. With two Axel rovers connected to a central body, the rover will be able to go to the edge of a cliff and then lower one Axel down. The rest of the body will act as an anchor.
The rover must be able to take samples of different kinds of soil that might be found on Mars. The purpose of an extreme terrain rover and moreover of any rover going to Mars is to discover more about the composition, history and habitability of Mars. To satisfy this purpose on Axel, instruments come out of instrument bays in the wheels and lower to the ground. Instruments already installed in Axel include a microscopic imager and a thermal probe. The sampling mechanism will go in these instrument bays. [1] Objective There are two very different objectives a sampling system could aim for: to obtain and analyze the samples in situ, meaning on board the rover or central module, or to obtain and cache the samples, leaving them on Mars for a future Mars Sample Return (MSR) mission to pick up and bring back to Earth. For the scope of this summer project though, the goal is simply to obtain and store a sample of about 2 grams.
Figure 1: Computer-Aided Design Model of the Axel Rover [2]

2
A pneumatic approach to sample capture has many advantages. The soil sample can be transported easily into and within the instrument bay with just a puff of gas. There is minimal actuation with only two actuators necessary: one to release the puff of gas and another to open and close the sample container. Also, a small amount of gas can lift a large amount of soil. In one study, it was shown that 5000 grams of regolith could be lifted with just 1 gram of gas at 5psi under Mars conditions [3]. Thus pneumatics would use stored potential energy, in the form of a small, pressurized gas canister or a combustible solid, instead of using solar power harnessed by the rover. However, this means that the number of samples is limited. This can be avoided by using an air compressor, but this would have a high energy cost and likely occupy a large portion of Axel. Therefore, it is favorable for the number of samples to be limited, and for the stored gas or combustible solid to be optimized. It was considered that a vacuum be used to suck in the soil, instead of or in addition to a pneumatic system to blow sand up into a container. The key reason a vacuum design was not pursued is because the air pressure on Mars is very low, so the pressure of the vacuum would have to be even lower. The amount of sand that could be pulled up by a vacuum depends on the pressure difference between the vacuum and the outside atmosphere. Because the air pressure on Mars is so much lower than that on Earth, a vacuum will be much less effective. Ideally the sample container would seal hermetically so that any volatile materials captured could be analyzed. However, creating a hermetic seal that can be reopened for analysis in situ would be very difficult. One idea is to have a quartz window on the sample container that analysis can be done through. For now though, the goal is a relatively simple container that will trap solids but not necessarily gases. Design and Testing: The overall goal of our design is to obtain and store at least 2 grams of sand or soil using a pneumatic device. Given this concept, we needed a design for an air nozzle that would effectively use a puff of pressurized gas to move the soil up the nozzle and to a collection container. The soil will be suspended in the gas and carried up, and it seems simpler to separate the soil from the gas before storage than to store pressurized, dusty gas. Storing the pressurized gas may be difficult because the air and sample might escape the sample container due to the pressure and velocity of the stream. A passive device called a cyclone separator can take in a stream of dirt-filled gas and separate the gas from the soil. Thus, the design will consist of a system to regulate the air output, a nozzle to utilize that air output to lift soil, a cyclone separator to separate gas and soil, and a sample collection container. Design: Z-Axis Mechanism The purpose of the Z-axis mechanism is to reach the nozzle closer to the soil, ideally digging it about an inch into the soil. Additionally, the extra motion down the Z-axis can prevent the instrument bay plate from being contaminated when it touches the dirt. For minimal actuation and build time, we decided to implement another four-bar linkage that will be coupled with the four-bar linkage currently responsible for lowering the instrument bay plate to the soil surface.
Figure 2: Instruments deployed out of wheel of Axel. [2]

3
Air Output An air canister that can be opened and closed electronically is needed for this system. After trying out different types of canisters, including paintball canisters, we found small CO2 canisters are used to fill bicycle tires. These gas canisters contain between 16 and 20 grams of CO2. In order to control the output pressure, attached a pressure. There was a solenoid valve attached to the pressure regulator that would open and close based on the application of current. This can be easily integrated into Axel.
We wanted to find the optimal air pressure. We tested this using airflow from the laboratory wall at 90 psi. A higher pressure will result in higher mass flow rate of air through the nozzle and to the soil or sand. These results might not be the best indicator of what would happen under Mars conditions, but the relative pressure needed on Mars should be similar to that on Earth. The pressure on Mars is much lower, with a high of about 0.17psi, where the air pressure at sea level on Earth is about 14.7psi [4]. The large difference in pressure between Earth and Mars may cause the pressurized air to act in unpredictable ways. We were unable to simulate Mars conditions to run any of the tests and so any differences are thus unobserved, but it is expected that pneumatics would be more effective on Mars. Due to the results of Figure 4, a pressure of 25psi was used for almost all tests of the nozzle design, as seen in the next section. Another key component to test was the length of the pulse of air, and how that affects the
Instrument Bay Plate
Nozzle Plate
Axel Instrument Bay
Figure 3a (to the left): This is a CAD model of the Z-Axis lowering mechanism for the nozzle. The top four-bar linkage is currently in Axel, and the bottom linkage will be added. The two four-bar linkages will be coupled by gears where circled in yellow.
Four Bar Linkage #1
Four Bar Linkage #2
Figure 3b (to the right): This is the actual built model of the Z-Axis lowering mechanism for the nozzle. The four bar linkage of Axel is replaced with a handle, and the bottom linkage is coupled with this handle by the circled gears. A nozzle is attached.

4
amount of sand collected. This test was done with and without the use of a cyclone separator, so the results of these tests averaged is shown in Figure 5. The pressure for each of these tests was 25psi. A pressure of 25psi, a pressure ratio of about 1.7, was therefore chosen for the final design. Higher pressures appeared to be much less effective, possibly due to the mass flow rate of air being so high that air would not be directed the desired way through the nozzle, and instead go in all directions.
Nozzle Toward the beginning of this project, we created numerous different nozzle designs and rapid-prototyped and tested them. The design was then modified several times to make it more effective until a final design was selected. At first we had two basic shapes and three methods of applying the air to obtain soil. There was a straight nozzle that was intended to come straight out of the instrument bay and contact the soil directly, and there was an L-shaped nozzle that would theoretically scoop into the soil before blowing it up into the collection system. The L-shaped nozzle could be deployed from the instrument bay at an angle that would not contact the ground, and then wheel actuation could assist the scooping motion. Of the three methods of applying air, two depended primarily on lifting the soil and one depended on entraining the soil with the air. One method proposed of lifting the soil was having an outer and inner tube of the nozzle, where the outer tube would be used for air injection and the inner tube would be open to the soil. There would be holes to allow air to flow from the outer air tube to the inner soil tube, close to or below the soil surface. These holes would be normal to the tube surface, approximately horizontal to the soil surface. The other method of lifting the soil was very similar, but with a hole directed towards the collection system. This method would increase the push behind the soil and rely less on the pressure differences that the nozzle will create between the nozzle and the surroundings. The third method of entrainment would direct airflow at the soil surface, ideally blowing the dirt up and carrying it into the collection system.
Figure 4: A simple test was done to compare the different air pressures, set by a pressure regulator. The figure above shows the results. Each of these tests was done using the same setup and the gas was puffed (the valve was open for the airflow) for two seconds. The sand used for each of the tests was 390µm in diameter. See Appendix A for raw data.
0 0.5
1 1.5
2 2.5
3 3.5
4
15 25 35
Aver
age
Sand
Col
lect
ed (g
)
Pressure (psi)
Comparing Effectiveness at Different Air Pressures

5
A key reason why the designs of entrainment and perpendicular injection holes were proposed was because it was thought that the pressurized air would travel the path of least resistance, moving up and out of the soil, to the sample container, instead of down through the soil. The directed injection holes seemed to be more likely to work because it would take a significant amount of resistance to change the direction of the airflow, so the regolith could be lifted or entrained into the air that would most likely continue to travel upward.
Figure 6: Straight-shaped nozzle with perpendicular holes. This example only had one hole, nozzles in later iterations had the same holes radially and linearly patterned.
Air inlet
Dirt-filled air outlet
Supports for inner tube
Air enters inner tube from outer tube
Figure 7: L-shaped nozzle with perpendicular holes, similar to the nozzle in figure 5. This nozzle was made with a 0.25-inch inner diameter as well as a 0.5-inch inner diameter.
Inner Diameter
0
2
4
6
8
10
12
0 2 4 6 8 10
Aver
age
Sand
Col
lect
ed (g
ram
s)
Pulse Length (seconds)
Comparing Cyclones and Pulse Lengths
Straight Cyclone
No Cyclone
3-Holed Directed Cyclone
Figure 5: The amount of sand collected given different pulse lengths and cyclones was measured. The cyclones will be explained more in the cyclone section, but it appears from this data that a pulse length over 2 seconds has little to no effect if the system includes a cyclone to separate the soil from the pressurized gas. See Appendix A for raw data.

6
Figure 9: This nozzle also depended on the air entraining the sand, but instead had the air entering through the inner tube and the regolith-filled air ideally exiting up and through the outer tube for collection.
Figure 11: Results of the L-shaped nozzle in Figure 8 inspired a redesign of the straight nozzle, with directed holes. This nozzle had 9 directed inlet holes from the outer air tube to the inner soil tube – 3 arranged in a linear pattern going up the nozzle, with that pattern repeated two more times radially.
Clean Air Inlet
Figure 10: L-shaped nozzle with directed air injection point. This is not an ideal geometry as the outer placement of the injection point where it is exposed to rough terrain would expose it to more stresses, making breakage more likely.
Clean Air
Figure 8: This nozzle depended on the air entraining the sand. Air would enter through the outer tube and ideally entrain the air into the inner tube for collection. Other geometries including a bulb-shaped nozzle were to be considered if this nozzle was promising.

7
After the nozzles were designed, they were created in a rapid-prototyping machine out of ABS plastic. The nozzles were tested as consistently as possible in the lab setup shown in Figure 12. The bottom of each nozzle was placed 0.75 inches below the sand surface, and the grain diameter of the sand was kept constant at 390µm, unless otherwise noted. The collection tube was sometimes preceded by the cyclone separator, but not in initial testing. The tape on the collected tube did not form an airtight seal, because that would pressurize the collection tube and significantly change the results. The collection tube was weighed before and after every puff of air in order to determine how much sand could be collected. The nozzle was reset in the sand at the proper height
between each puff.
The results of the tests are shown in Figure 13. The straight nozzle collected almost no sand, and instead caused the sand to blow up and around the bottom of the nozzle. The L-shaped nozzle with a quarter-inch inner diameter performed similarly, blowing sand out of the nozzle instead of pushing it up and into the collection tube. The L-shaped .5” diameter very inconsistent, would often blow sand out of nozzle as well. However, when placed carefully at the correct depth, this nozzle showed good, albeit very inconsistent, results. Similarly, the entrainment nozzle show in figure 7 would blow sand everywhere, rarely collecting any unless the nozzle was at a very exact depth and the sand was arranged in an ideal way. For both the 0.5-inch diameter L-nozzle and the entrainment nozzle, trials that were perceived to be bad due to how our placing the nozzle in the sand at the incorrect depth were often redone, and the data from these trials went unrecorded. Had this data been recorded, it would have significantly lowered the average amount of sand collected for the L-shaped 0.5-inch diameter nozzle and the entrainment nozzle. The L-shaped nozzle with directed air injection was designed and tested in the first iteration of testing. It appeared to produce much more promising results than any of the other nozzles. Additionally, there were fewer problems with the placement of the nozzle than there were with the other nozzles. Therefore it was hypothesized, due to the large different between the performances of the L-shaped nozzles with perpendicular air inlets and the L-shaped nozzle with a directed inlet, that the angle of air injection is very important. This is supported by the large improvement in performance between the straight nozzle with 9 directed injection holes and the straight nozzle with a perpendicular air inlet.
Pressurized Air Source
Nozzle in Sand
Test Stand
Collection Tube
Figure 12: Our preliminary test setup to test nozzle and cyclone design, as well as contamination of the system, is shown in this figure. The pressurized air source came from the lab and was around 90 psi, brought down to 25psi (or other given pressure) for testing by a pressure regulator. Pressurized air was released in pulses by hand.

8
It was preferred to have a straight nozzle over an L-shaped nozzle for several reasons. For one, it was observed that dirt would sometimes get stuck in the bend of the nozzle, indicating that the dirt-air suspension was losing momentum at that point. This is concerning because dirt might get stuck in the nozzle or tube, contaminating other samples or even the Axel science bay. Secondly, the four-bar linkage that lowers the mechanism to the sand surface was not built to be capable of taking loads in that direction. Extending the nozzle then rotating the
wheel to use the nozzle as a scoop would put to much force on the four-bar linkage. For these reasons, the L-shape was not pursued further for nozzle designs. In order to improve the performance of the straight nozzle with 9 directed air inlet holes, the number of air inlet holes was reduced to 3, arranged radially. It was hypothesized that this would increase the momentum of the air coming out of each inlet hole, increasing the amount of sand collected. Figure 14 shows an image of the nozzle with 3 directed air inlet holes. Figure 15 shows the results of tests done to compare the two nozzles.
0 1 2 3 4 5 6 7 8 9
10
Straight L-Shaped, .25" Diameter
L-Shaped, .5" Diameter
Entrainment, Air on Outside
L-shaped, Directed Injection
Straight, Directed 9-Hole Injection
Aver
age
Sand
Col
lect
ed (g
ram
s)
Initial Nozzle Comparison
Figure 13: This figure compares the performances of the six initial nozzle designs, including the standard deviation of the tests. Each test measured the mass of 390 µm-diameter sand collected given a two second-long pulse of air at 25psi. Each nozzle was tested 5 times. See Appendix A.
Figure 14: This image is of the final straight nozzle design. There are 3 holes, all at the same height, from the outer section to the inner section that will let air blow into the dirt.
9
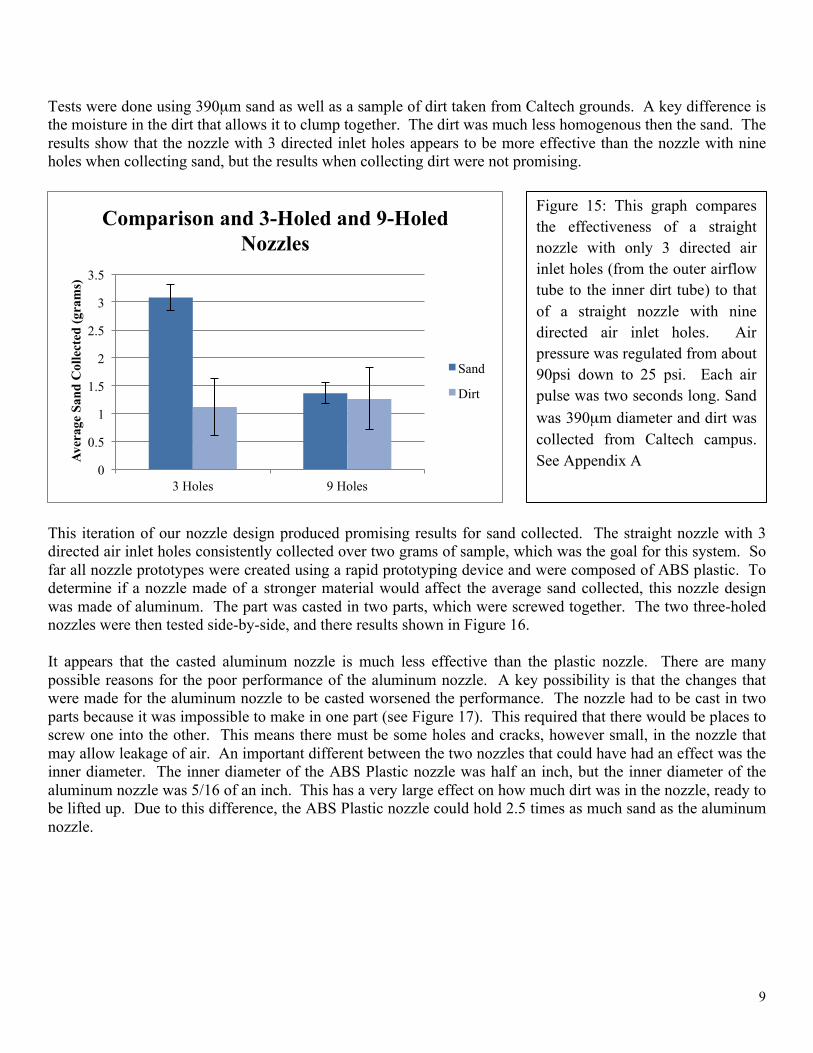
Tests were done using 390µm sand as well as a sample of dirt taken from Caltech grounds. A key difference is the moisture in the dirt that allows it to clump together. The dirt was much less homogenous then the sand. The results show that the nozzle with 3 directed inlet holes appears to be more effective than the nozzle with nine holes when collecting sand, but the results when collecting dirt were not promising.
This iteration of our nozzle design produced promising results for sand collected. The straight nozzle with 3 directed air inlet holes consistently collected over two grams of sample, which was the goal for this system. So far all nozzle prototypes were created using a rapid prototyping device and were composed of ABS plastic. To determine if a nozzle made of a stronger material would affect the average sand collected, this nozzle design was made of aluminum. The part was casted in two parts, which were screwed together. The two three-holed nozzles were then tested side-by-side, and there results shown in Figure 16. It appears that the casted aluminum nozzle is much less effective than the plastic nozzle. There are many possible reasons for the poor performance of the aluminum nozzle. A key possibility is that the changes that were made for the aluminum nozzle to be casted worsened the performance. The nozzle had to be cast in two parts because it was impossible to make in one part (see Figure 17). This required that there would be places to screw one into the other. This means there must be some holes and cracks, however small, in the nozzle that may allow leakage of air. An important different between the two nozzles that could have had an effect was the inner diameter. The inner diameter of the ABS Plastic nozzle was half an inch, but the inner diameter of the aluminum nozzle was 5/16 of an inch. This has a very large effect on how much dirt was in the nozzle, ready to be lifted up. Due to this difference, the ABS Plastic nozzle could hold 2.5 times as much sand as the aluminum nozzle.
0
0.5
1
1.5
2
2.5
3
3.5
3 Holes 9 Holes
Aver
age
Sand
Col
lect
ed (g
ram
s)
Comparison and 3-Holed and 9-Holed Nozzles
Sand
Dirt
Figure 15: This graph compares the effectiveness of a straight nozzle with only 3 directed air inlet holes (from the outer airflow tube to the inner dirt tube) to that of a straight nozzle with nine directed air inlet holes. Air pressure was regulated from about 90psi down to 25 psi. Each air pulse was two seconds long. Sand was 390µm diameter and dirt was collected from Caltech campus. See Appendix A

10
Cyclone Separator After the soil is blown up through the nozzle it will go to the cyclone separator. A cyclone separator is cylindrical and conical body that has a specific geometry that separates particulates out of air using inertia. The soil-filled air comes in tangential to the cyclone and goes around and down the cyclone. Particles will drop as the air speed increases, pushing the particles to the wall of the cyclone and downwards. This design was obtained from Honeybee Robotics’ Kris Zacny, and scaled down slightly to fit our system. There are many parameters that control the cutoff radius of the cyclone, which is the maximum radius a particle can have and still be collected by the cyclone with 50% efficiency [5]. Changing dimensions of the cyclone will change the
0 0.5
1 1.5
2 2.5
3 3.5
4
Aluminum, 2-piece Casted Nozzle ABS Plastic Rapid-Prototyped Nozzle
Aver
age
Sand
Col
lect
ed (g
ram
s)
Comparing Aluminum vs. Rapid-Prototyped Nozzles
Figure 16: This graph shows the average 390µm-diameter sand collected with a 2-second-long puff of 25psi air. As shown, this test was done using the straight nozzle with 3 directed holes made out of ABS plastic and made out of casted aluminum in two pieces. See Appendix A.
Inner piece
Outer Piece
Assembled Nozzle Pieces screwed together here
Figure 17: The image to the left shows an exploded view of the assembly, showing the two pieces of the aluminum nozzle and how they will connect to form the image on the left, the fully assembled nozzle.

11
efficiency/cutoff radius. This cyclone was analyzed using equations from Ingham and Ma, and appears to collect particles that are 100 microns in diameter with 68.87% efficiency [6]. Larger particles will be captured with a higher efficiency, because they will have greater inertia. A uniform soil density of 1500 kg/m3 was approximated. It should be noted that some assumptions about flow rate and tangential velocity were made in this calculation, but based on our observations this seems reasonable. Calculations can be seen in Appendix C.
The effectiveness of the cyclone separator is demonstrated in Figure 5. The results indicate that less sand is collected when the cyclone separator is used. The key reason for using the cyclone separator is that the pressurized air is difficult to contain. However, a sufficient amount of sand can be collected with the cyclone separator. A much larger problem with the cyclone separator is that sand and especially dirt gets stuck in the cyclone separator due to the piece at the bottom that directs the particles into the sample container. In general contamination of the system was not a large problem, except in the cyclone separator with dirt. Tests were run where each part was measure before and after sand collection and the data can be found in Appendix B. It showed that with 390µm sand, about 0.5% of the sand would exit the cyclone but miss the sample container, and would therefore go into the Axel instrument bay. 1.4% of the sand would penetrate the cyclone, or would not be collected, and 2.8% of the sand would get stuck in the cyclone. However, with dirt it was clear that the dirt would completely clog the system, making the cyclone unusable after the troublesome sample. This is a significant problem that indicates a need for redesigning the cyclone, or possibly the cyclone-sample container interaction.
Vortex Finder
Clean Air Outlet
Dirt Particle Outlet
Dirt-filled Air Inlet
Figure 18: This figure shows the cyclone separator. Most of the design is from Honeybee Robotics, with an added part at the bottom to direct the soil into the sample container.

12
Sample Container For simplicity, we wanted to avoid actuation and complex geometries that were unlikely to work. The basic idea behind this design is that the cyclone separator could be pushed down on the top of the container. This motion would open the sample container, then a sample would be captured and the cyclone separator would be raised again to close the container. A container with a spring-loaded cap was chosen to achieve this.
Final System Implementation: A test bench model of the system was built to demonstrate functionality. It was observed that a 16-gram canister of CO2 held enough gas to collect eight samples, given the puffs of gas were two seconds long each. The CO2 was released using a solenoid valve, and a pressure regulator was used to bring the pressure down to 25psi. The solenoid valve was turned on and off with a switch. In the future this can be operated by a digital signal instead. A four-bar linkage was built to show how the nozzle would descend to the sand, and a stand for the cyclone was built. The cyclone stand lined up the end of the cyclone with the center of the sample container, and a handle was extended so the cyclone could be moved up and down via a rotary motion. This rotary motion could be replaced with a motor. See Figure 21. Measurements were taken to compare the effectiveness of the bench top system, with pressurized air from a CO2 canister, to the testing system, with pressurized air flowing from the laboratory air supply. Figure 22 shows the results of this test, and the test bench was able to collect near two grams of soil regularly, which is a key goal for analysis.
Figure 19: The sample container will be built of 5 parts, four of which are shown here. There is the main body of the container that will include a tube that will hold the sample cap straight. Inside the tube there will be a spring (not shown), which will be connected to a baseplate. To seal the sample container using the cap, we have the lid that the cap will press against.
Cap (seals) Compressed spring
Lid
Main Body Baseplate
Figure 20 (to the right): This figure shows the sample container made of ABS Plastic. The lid is removed in this image to shown the sand collected.
Sand

13
Discussion and Future Work: A pneumatic system has many advantages and disadvantages for a sample acquisition system. One advantage is its simplicity. A pneumatic system has the potential of using only two degrees of freedom: one to open and close the pressurize air canister, and one to insert and exchange the sample containers. It can use energy stored on board instead of using solar energy that may be better used for some other function. In addition, soil can be transported from one area of the instrument bay to another area very easily. Therefore the design of the system is not restricted by the deployable volume of the instrument bay, or even by the immediate surrounding area.
0 0.5
1 1.5
2 2.5
3 3.5
4
Stand-alone CO2 Canister Wall/Shop Air
Aver
age
Sand
Col
lect
ed (g
)
Comparing the Testing Configuration and Standalone
System
Figure 21: This shows the test bench set up. Cyclone
Sample Container
Solenoid Valve
Nozzle & Four bar linkage
Air Canister & Pressure Regulator
Figure 22: There appears to be some difference between the standalone system that uses the pressurized CO2 canister and the testing configuration using pressurized air from the lab. There are many possible causes of this difference. The pressure in the air canister might be much lower than the wall air, resulting in a lower flow rate. The pressure regulators used were also different. Each test was done with two second-long pulses of air, hand-controlled, and the pressurized air sources were regulated down to 25psi. The nozzle was stuck in 390µm sand.

14
One disadvantage is the limited resource of pressurized air. The rover will either need to carry some source of pressurized air or have a compressor on board, which would take up a lot of energy and space. Additionally, there is a problem in storing the sample after the pressurized air obtains it. This was solved in the current design by using a cyclone separator, but it is clear that the cyclone separator decreased the amount of sample that the system was able to collect. This could be solved by a redesign of the sample container and how the cyclone separator will lead to the open sample container, or by avoiding the cyclone separator altogether. Many parameters were discovered to be very important to the functionality of this system, particularly in regards to nozzle design. Given more time, more nozzles that would more carefully vary the parameters could be built and tested for a more thorough understanding of the important of certain features. For example, it seems that the inner diameter of the nozzle is very important, as it determines the amount of sand the nozzle will contact. The size, number, and direction of the air inlet holes are also important for the flow of the sand. In addition, it would be good to continue to design for wet soil collection, although that may not be feasible with a pneumatic system. Lastly, it would be very useful to produce an exact replica of the 3-directed-holes ABS Plastic nozzle in Aluminum, to see if the metal nozzle would be more effective. Furthermore, a goal for the future of this project is to integrate the system into Axel. It will be necessary to control the solenoid valve via digital signal and to redesign the sample-capturing concept. Additionally, a sample exchange and caching system would be very useful in further iterations of this design, as well as an air canister exchange system. Overall, the nozzle design seems to be capable of achieving the design goals. One remaining question is whether the compressed air will behave the same way in the nozzle under Mars conditions. If possible, testing the system under Mars conditions would be very helpful. Acknowledgements: I would like to thank Yifei Huang, a fellow Summer Undergraduate Research Fellowship student who did this work with me. I thank Professor Joel Burdick and Melissa Tanner for all of their guidance and assistance, as well as the entire Axel team at Caltech and the Jet Propulsion Laboratory. I thank Kris Zacny from Honeybee Robotics for all of his help and the design for the cyclone separator. In addition I thank the Keck Institute for Space Studies as well as the SURF office, which provided funding for this project. I also would like to thank Professor Melanie Hunt for her advice and the use of her sand, as well as Professor Tim Colonius for his advice. Citations: [1] Keck Institute for Space Studies Student-Led Mini-Program Proposal. Mini-Program Name: Tools and
Algorithms for Sampling Extreme Terrain. [2] Tanner, Melissa. All pictures found at: http://robotics.caltech.edu/~melissa/best_of_axel.zip Accessed
February 17, 2012. [3] Zacny, K; McKay, D.; Beegle, L.; Onstott, T.; Mueller, R.; Mungas, G.; Chu, P.; Craft, J. “Novel
method of regolith sample return from extraterrestrial body using a puff of gas.” Aerospace Conference, 2010 IEEE.
[4] Wikipedia. “Atmosphere of Mars.” http://en.wikipedia.org/wiki/Atmosphere_of_Mars. [5] Wikipedia. “Cyclonic Separation.” http://en.wikipedia.org/wiki/Cyclonic_separation. [6] Ingham, D.B.; Ma, L. “Predicting the performance of air cyclones.” International Journal of Energy
Research, 2002; 26:633-652.

15
Appendix A Data Corresponding to Figure 4:
Pressure 15 psi 25 psi 35 psi
Total Mass of Sand Collected
(g)
3.26 3.71 1.50 3.44 3.34 1.24 3.50 3.76 1.55 3.01 3.48 1.54
3.43 3.39 1.31
Average 3.33 3.54 1.43
Standard Deviation 0.20 0.19 0.14
Data Corresponding to Figure 5:
Cyclone Type Pulse Length (s) Start Weight (g) End Weight (g)
NO CYCLONE
2
12.89 17.82 12.89 18.01 12.89 18.73
12.9 17.56 12.9 17.39
5
12.89 21.64 12.89 20.73 12.89 21.88
12.9 18.58 12.89 20.12
10
12.89 23.7 12.89 24.13 12.88 22.08 12.89 24.85 12.89 24.1
STRAIGHT CYCLONE
2
12.94 16.98 12.93 16.12 12.92 15.78 12.91 15.74
12.9 17.3
5
12.92 16.75 12.9 17.34 12.9 17.53 12.9 17.36 12.9 17.76

16
10
12.9 18.11 12.9 17.62 12.9 17.45 12.9 17.53
12.88 18.1
DIRECTED CYCLONE, 3
HOLES
2
12.88 16.68 12.91 16.94 12.97 17.68 12.95 16.98 12.93 17.41
5
12.96 17.43 12.98 17.43 12.92 17.42 12.91 16.73 12.91 17.59
10
12.9 18.18 12.9 17.87
12.94 18.44 12.91 18.11 12.92 18.3
Data Corresponding to Figure 13: Straight Nozzle:
Begin Weight (g) End Weight (g) Total (g)
12.85 13.34 0.49
12.84 13.09 0.25
12.84 13.06 0.22
12.85 13.03 0.18
12.83 13.12 0.29
Pressure (psi) 25 Grain Diameter (µm) 390 Average Collection 0.29 Stand. Dev 0.12
L-Shaped, 0.25” Inner Diameter:
Begin Weight (g) End Weight (g) Total (g)
12.84 13.51 0.67
12.84 13.49 0.65
12.85 13.43 0.58
12.84 13.26 0.42
12.84 13.2 0.36
Pressure (psi) 25 Grain Diameter (µm) 390 Average Collection 0.54 Stand. Dev 0.14

17
L-Shaped, 0.5” Inner Diameter:
Begin Weight (g) End Weight (g) Total (g)
12.83 16.04 3.21
12.84 15.14 2.3
12.84 15.19 2.35
12.84 12.84 0
12.84 15.03 2.19
Pressure (psi) 25 Grain Diameter (µm) 390 Average Collection 2.01 Stand. Dev 1.2
Entrainment, Air Tube on Outside:
Begin Weight (g) End Weight (g) Total (g)
12.83 15.1 2.27
12.84 14.21 1.37
12.85 15.17 2.32
12.86 15.06 2.2
12.86 15.08 2.22
Pressure (psi) 25 Grain Diameter (µm) 390 Average Collection 2.08 Stand. Dev 0.4
L-Shaped, Directed Injection:
Begin Weight (g) End Weight (g) Total (g)
12.84 21.76 8.92
12.85 21.5 8.65
12.87 19.28 6.41
12.85 19.24 6.39
12.84 22.35 9.51
Pressure (psi) 25 Grain Diameter (µm) 390 Average Collection 7.98 Stand. Dev 1.47
Straight, 9-Hole Directed Injection:
Begin Weight (g) End Weight (g) Total (g)
12.81 13.99 1.18
12.81 14.26 1.45
12.81 14.46 1.65
12.82 14.13 1.31
12.82 14.06 1.24
Pressure (psi) 25 Grain Diameter (µm) 390 Average Collection 1.37 Stand. Dev 0.19
Data Corresponding to Figure 15:
Number of Injection Holes Three Nine
Type of Soil Sand (.39mm) Dirt Sand (.39mm) Dirt
Mass of Collection in Grams (g)
3.22 0.90 1.18 0.79 3.27 1.31 1.45 1.68 2.73 0.36 1.65 0.54 2.95 1.69 1.31 1.71
3.23 1.34 1.24 1.59 Average (g) 3.08 1.12 1.37 1.26
Standard Deviation 0.23 0.51 0.19 0.55

18
Data Corresponding to Figure 16:
Aluminum, 2-piece
Casted Nozzle ABS Plastic Rapid-Prototyped Nozzle
Amount of Sand Collected (g)
0.59 2.11 0.72 3.91 0.90 2.06 0.85 3.12 0.93 1.88
Average (g) 0.80 2.62
Standard Deviation 0.14 0.87 Data Corresponding to Figure 15: Data concerning performance with pressurized air from the wall is the same as the data on the ABS Plastic Nozzle in the Data Corresponding to Figure 14. The data below refers to the sample collection with the pressurized air canister.
Begin Weight (g) End Weight (g) Total Collected (g) 16.30 18.39 2.09 16.30 18.66 2.36 16.31 18.11 1.80 16.33 18.44 2.11 16.31 18.39 2.08
Average 2.09 Standard Deviation 0.20

19
Appendix B – Contamination Data Study on Contamination: How much sand penetrates the cyclone (how much sand is not collected by the cyclone, but flies out of the top instead)
Sand Penetrating Cyclone (g) Sand Collected (g)
0.020 2.860 0.040 2.430 0.030 2.920 0.060 3.170 0.060 4.030
Average 0.042 3.082 Percentage of Sand Penetrating Cyclone 1.363%
Study on Contamination: How much sand is stuck in the bottom of the cyclone
Sand Stuck in Cyclone (g) Sand Collected (g)
0.040 1.720
0.100 3.950
0.110 3.550
0.060 1.890
0.050 1.550
Average 0.072 2.532 Percentage of Sand Stuck in Cyclone 2.844%
This percentage is MUCH larger if dirt is used, indicating the need for a redesign of the end of the cyclone separator, one that has a larger outlet and will provide less resistance to larger clumps of soil that are collected. Study on Contamination: How much sand comes out of the cyclone but does not make it into the sample container
Sand Collected Outside of Container (g) Sand Collected (g)
0.02 1.69
0.00 3.78
0.02 4.49
0.05 4.19
0.01 4.71
Average 0.02 3.77 Percentage of Sand Lost 0.53%
Note: Contamination in tubing and nozzle comparatively small to that above.

20
Appendix C MathWorks MATLAB Script for Calculating Efficiency: Rin = 5/12; % largest radius of cyclone d = 1/10000; % 100 micrometer diameter sand mu = 1.9; % Dynamic viscosity of air % Assuming choked flow, Mach num will be 1, so the speed of flow at start: Vin = 340.29; %m/s rho = 1.977; % approximate density for carbon dioxide at 25 psi rhop = 1500; % approximate density of particles (sand) %%% Find the Line of Zero Vertical Velocity alpha = 10*pi/180; % alpha represents the semi-angle of the cone (in rads) R = 0:.005:Rin; % R represents all possible radii of the cyclone Zzerovertvel = 5.*R./(3*alpha); % The Z coordinate of a particle of no % vertical velocity, at a cyclone radius % Plot the line of zero vertical velocity plot(R,Zzerovertvel) %%% Find the Equilibrium Line Vl = Vin.*R./Rin; % Vl represents the azimuthal velocity (horizontal,angular) Q = .0112; %kg/s, the approximate mass flow rate of the air c = .234375; % c is outer radius of vortex finder l = .26855 + .39154/tan(alpha); % l is distance between vortex finder % entrance and the (nonexistant) vertex of the cone B = Q/(2*pi*(c^3/2)*(alpha-c/l)); % B is a constant needed for equilibrium % line calculations, and others. % Calculate and plot the equilibrium line for the particle Zeq = sqrt(18.*B.*(R.^2.5).*mu./((rhop-rho).*(d^2).*(Vl.^2))); hold on plot(R,Zeq) %%% Now find where the Equilibrium Line and the Line of Zero Vertical %%% Velocity intersect ss = length(R); [Mr,Mz] = polyxpoly(R(2:ss),Zzerovertvel(2:ss),R(2:ss),Zeq(2:ss)); %%% Establish Particle Trajectory based on Point of Intersection % The particle trajectory equation relies on the velocity and position of % the particle, so we'll take the known velocity and position at the point % of intersection and backtrack upwards (larger radius) to plot the path h = .01; % step size n = (Rin-Mr)/h + 1; % number of steps Rpath = zeros(size(1:n)); % for radius coordinates of particle trajectory Zpath = Rpath; % for z coordinates of particle trajectory Rpath(1) = Mr;

21
Zpath(1) = Mz; % Use Runge-Kutta to propagate the particle backwards! for i = 2:n % find particle trajectory (dz/dr) for previous R and Z coordinates vz = VerticalVelocity(B,alpha,Rpath(i-1),Zpath(i-1)); vr = RadialVelocity(B,Rpath(i-1),Zpath(i-1)); dzdr(i) = vz/(vr+(rhop-rho)*(d^2)*((Vin*Rpath(i-1)/Rin)^2)/(18*mu*Rin)); % Increment the radius and z-coordinate Rpath(i) = Rpath(i-1)+h; Zpath(i) = Zpath(i-1) + h*dzdr(i-1); end % Plot the trajectory! Zpath = Zpath.*(Zpath>0); plot(Rpath,Zpath,'k') % Plot cyclone boundary height = l + 1.0416666667; plot([0,Rin],[height,height],'g') plot([Rin Rin],[0,height],'r') %%% Now find the efficiency. The radius of the particle at the top of the %%% cyclone given the particle trajectory is Rtop, and why finding the %%% particle trajectory was necessary. [Rtop, ~] = polyxpoly(Rpath,Zpath,[0 Rin],[height,height]); if Rtop ~= 0 beta = ((alpha*l/c)^1.5)/(1-(c/(alpha*l))); % just a constant. Eff = beta*((Rtop/Rin)^1.5)*(1 - (Rtop/Rin)); else Eff = NaN; End Functions used: function vr = RadialVelocity(B,R,Z)
vr = - B*(R^1.5)/(Z^2); end function vz = VerticalVelocity(Be,alpha1,aR,Ze)
vz = (3*alpha1-5*aR/Ze)*Be/(2*sqrt(aR)); end