soil quality and productivity - gpi atlantic
TRANSCRIPT

M E A S U R I N G S U S T A I N A B L E D E V E L O P M E N T
A P P L I C A T I O N O F T H E G E N U I N E P R O G R E S S I N D E X T O N O V A S C O T I A
GPI AGRICULTURE ACCOUNTS,PART TWO:
RESOURCE CAPACITY AND USE:SOIL QUALITY AND PRODUCTIVITY
Prepared by: Jennifer Scott, MES and Julia Cooper, MSc
September, 2002

GENUINE PROGRESS INDEX Measuring Sustainable Developmentii
EXECUTIVE SUMMARY
Soil is the natural capital asset upon which our agricultural system is based. It is vital tomaintain healthy and productive soil if our agricultural system is to continue to functionoptimally.
Soil is currently undervalued in our food production system. Methods of agriculture that degradethe soil are profitable in the short term under our current system of accounting. This is becausethe losses of natural capital due to soil erosion or degradation are invisible in conventionaleconomic accounts, and not included directly in the costs of food production.
Soil degradation that results in soil compaction and reductions in the soil’s inherent fertility iscompensated for by increases in purchased agricultural inputs, such as fertilizer. These inputscan mask, or compensate for the degradation of our soils by allowing crop yields to be sustainedand profitable in the short term, at the expense of long-term productivity. By contrast, the GPInatural resource accounts recognize the long-term value of our soil assets.
Soil quality is more than the sustained capability of a soil to accept, store, and recycle water,nutrients, and energy. Soil quality is the capacity of soil to sustain ecological productivity,maintain environmental quality, and promote plant and animal health. In this report, soilecological productivity is emphasized. Ecological productivity minimizes both non-renewableinputs and polluting outputs, while ensuring optimal production over the long term.
Farmers face an important challenge in their attempts to maintain soil quality and productivity.This is not an easy or straightforward task, particularly when faced with an uncertain climate,sloping topography, shallow soils, and/or narrow economic margins, as is frequently the case inNova Scotia.
In order to achieve genuine progress in agriculture, society as a whole must ensure that soilquality is maintained or improved according to a set of proposed indicators. They can be trackedover time to help us achieve optimal long-term ecological productivity. The soil quality andproductivity indicators proposed here include soil organic matter (or soil organic carbon); soilstructure; soil conservation; and soil foodweb health. For each indicator, measurement methodsare presented, sustainability objectives are proposed, trends are highlighted, and preliminarymonetary values are estimated.
Soil Organic Matter or Soil Organic Carbon
The maintenance of soil organic matter is the key to sustaining soil quality. Although estimatesshow that soils in Eastern Canada are presently losing 23 kg of carbon per hectare (ha) annually,the potential to reverse this trend exists in Nova Scotia. Growing perennial forages is one well-established method of improving soil organic matter levels. An indirect measure of the organicmatter status of Nova Scotia’s soils is the percentage of land in rotation that is planted to aperennial forage. The proposed objective for this indicator is 50% of the land in rotation. On aprovincial basis Nova Scotia had 80% of its rotation land in forages in 2001. This is

GENUINE PROGRESS INDEX Measuring Sustainable Developmentiii
encouraging, as it indicates the potential for all row crop and cereal cropped land to be rotatedwith perennial forages. On a national basis, only 30% of rotation land is in forages, which iswell below the objective of 50%. This indicator should be developed further as more databecome available to take into account the extent of actual rotation (i.e. is land used to grow rowcrops rotated into perennial forages at least 50% of the time?), as well as other means of buildingup soil organic matter (incorporation of manure, composts, residues, and cover crops).
Table 1 summarizes the methods of estimating the soil organic matter indicator.
Table 1: Summary of Soil Organic Matter Measures, Objectives, Results
Results available for Nova Scotia are marked with an asterisk.Measure
of Soil Organic Matter(SOM)
Objective Range and Results1
Soil organic carbon (SOC)from soil samples or frommodeling (e.g. CenturyModel) (% by weight or tSOC/ha). SOC x 1.7 = SOM
At least 3.8% SOM (or2.2% SOC); no netlong-term losses ofSOC (some degradedsoils will require netincreases in SOC).
Soils range from 1-10% SOC; 0-29 t SOC/hain top 15 cm; soils can have 53+ t/ha SOC. * Average losses of 23 kg C/ha on EasternCanadian farms, 2000.
Average annual return ofresidues and livestockmanure to the soil (t/ha)
Enough to ensure nonet long-term losses ofSOC, at a rate thatprevents nutrientoverloading.
Dependent on soil texture, condition, andcropping system. Data not availableprovincially.
Portion of farm land inrotation occupied by soil-building crops (perennialforage)
At least 50%
Farm land ranges from 0-100% * NS farms have achieved and surpassed the50% objective as an average, although we donot know if the soil-building crops areadequately rotated with potentially soil-degrading crops.
It is expensive for a farmer who does not have livestock to replace lost soil organic matter.Purchased compost is costly, and replacing a cash crop with a forage will mean a reduction in netannual income. Local manure sources are the best way to replace lost soil organic matterbecause they supply crop nutrients as well as humus. Integration of livestock farms into cropproducing areas of the province would be the most effective way to ensure that soil organicmatter is maintained on all agricultural land, because these farms provide both manure and ademand for forage crops – both of which enhance soil organic matter content.
Table 2 summarizes examples of values associated with soil organic matter. The first is anestimate of the annual fertilizer value contributed by soil organic matter. If the soil organicmatter were seriously depleted, approximately $102/ha per year in fertilizer would be required to
1 References for figures listed in executive summary tables are marked in the report text.

GENUINE PROGRESS INDEX Measuring Sustainable Developmentiv
compensate for the nitrogen and phosphorous it would have contributed to the crop. This valueis not complete as it does not account for the other services, such as water retention and pest anddisease control, which would have to be replaced if soil organic matter were lost. The secondvaluation outlines two methods of maintaining soil organic matter so that it is not lost in the firstplace (avoidance value). Integrating forage into a corn system may require a $70 per ha annualinvestment (lost income when corn is rotated with forages). Manure additions would bring netbenefits of approximately $288 per ha per year due to the fertilizer-saving potential of thenutrients in manure. In this example, avoiding soil organic matter loss is more economical thancompensating for, or replacing it. The third valuation in Table 2 estimates what it would cost toreplace the soil organic matter if it were lost – a significantly higher investment of $682 per haannually.
Table 2: Summary of the Value of Soil Organic Matter (SOM)
Results available for Nova Scotia are marked with an asterisk.
Valuation method Stock of resources Flow of resources
1. Partial estimate: N & P fertilizerrequired to compensate for the contributionof nutrients from SOM (compensatoryvalue)
*$945 million (N fertilizer only)
*$17.5 million per year or $102/ha
*$70/ha annually in lost income toimplement corn/forage rotation
2. Investment in maintaining SOC so it isnot lost in the first place (5.8 t C/ha annualaddition to the soil in crop residues andmanure addition) (avoidance value)
*$288/ha annual net benefit forspreading beef manure
3. Cost of replacing SOC lost bycontinuous vegetable cropping (5.8 t C/ha)annual addition to the soil (restorationvalue)
*$682/ha per year for purchasedcompost
Soil Structure
Good soil structure is an indication of soil quality. Soils with good structure are more productivedue to better root penetration, more efficient uptake of water and nutrients, resistance to soilerosion, and a reduced need for energy during cultivation. Soil compaction is sometimes a resultof soil structure deterioration. Inputs of soil organic matter are part of a comprehensivemanagement strategy to reduce or prevent soil compaction. Minimizing trips around the fieldand reducing the pressure on soils by using ‘reduced ground pressure systems’ will also lessencompaction due to wheel traffic.
In Nova Scotia, farming practices may be increasing soil compaction. This trend seems to be aresult of an intensification of row crop production in certain areas of the province and a reductionof area in tame pasture. Remediation of soil compaction requires a short-term investment, butadoption of methods to prevent further compaction should prove profitable in the long term dueto improvements in nutrient use efficiency, reduced fuel costs, increased crop yields, and avoided

GENUINE PROGRESS INDEX Measuring Sustainable Developmentv
climate change damages (many of these damages may already be affecting farm profitability).Table 3 outlines four ways to assess soil structure along with sustainability objectives.
Table 3: Summary of Methods for Assessing Soil Structure
Results available for Nova Scotia are marked with an asterisk.Assessment methods –
Soil structureObjective Range of values and results
Bulk density (g/cm3)Depends on soil textureLower values are better
The bulk density of agricultural soilsranges from 1.0 to 2.0 g/cm3
Soil aggregate stability(% 1-2 mm diameter in top7.5 cm of soil)
Higher values are betterThe aggregate stability of agriculturalsoils ranges from 0-17%
Porosity(% pore space in a soil)
Optimum values of about 50%are better than too little or toomuch
The porosity of agricultural soilsranges from 20 to 80%
Increase area of soils undermanagement that will reducecompaction
*Decrease in area of 18%
Decrease area of soils undermanagement that could causefurther compaction
*Increase in area of 38.5%
Risk of soil compaction(McRae et al.,2000).
*Neither objective was met between1982 and 1996
Table 4 summarizes the benefits of reducing or avoiding soil structure degradation. Yieldbenefits and increased efficiencies can to some degree offset costs incurred to avoid soil structuredegradation. When farmers invest in good soil structure, society also benefits by reductions ingreenhouse gas emissions (due to decreased nitrous oxide emissions from soil with goodaeration).
In the long-term, it may be prudent to examine the province’s cropping mix relative to livestockfeed needs. A farmer may be very attracted to the income per hectare of grain corn or other rowcrop production, but that income must be adjusted to include the two or more years of soil-building crops required to remedy the soil damage that occurs when growing corn. Long-termmaintenance of the soil’s productive capacity may force us to consider feeding livestockrelatively less corn and more forage. This question is examined more thoroughly in aforthcoming report specifically on Livestock Productivity and Health.

GENUINE PROGRESS INDEX Measuring Sustainable Developmentvi
Table 4: Summary of the Value of Soil Structure
Results available for Nova Scotia are marked with an asterisk.Valuation method Results
1. Direct benefits from non-compacted vs.compacted soils (Moerman, 1994)
* yield benefits of 10-15%* better rooting efficiency, fertilizer use efficiency,N-mineralization (increased by 22 kg N/ha)
2. Avoid compaction by rotation with forages(avoidance value)
* $125.50 per ha, annual cost for a corn productionsystem
3. Avoid compaction by reduced ground pressuresystems (avoidance value)
* $66/ha per year net benefit
4. Societal (off-farm) benefit of non-compactedsoils due to reduced greenhouse gas emissions
* Between $74,518 and $2,039,440 in avoidedglobal costs due to climate change.
Note: A combination of the two avoidance practices (items 2 and 3) may be required to maintain good soil structure.
Soil Erosion and Conservation
The risk of soil erosion on cultivated land in Nova Scotia is high, due to the nature of our soilsand topography, coupled with the high rates of precipitation in the spring and fall. Maintainingsoil organic matter, reducing the speed of water movement over the land, and increasing waterinfiltration, can reduce soil erosion. This can be accomplished in the following ways: byincorporating forage crops into a row crop rotation; applications of manure to increase soilorganic matter; conservation tillage; using vegetative cover strips; and contour farming. If soil isnaturally formed at a rate of 1 t/ha per year, then losses of more than that will represent adegradation of the resource. Annual soil loss from row crops in Nova Scotia may be as high as30 t/ha per year (equivalent to about 2 large dump trucks full, per ha), although average rates ofsoil loss on cultivated lands are estimated to be 6.3 t/ha per year.
Soil erosion is particularly evident where soil is used for row cropping, and where it is left bareover the winter. One way to conserve soil is to minimize the number of days a soil is left bare.The number of days the soil is left bare in a year (bare soil days) can be calculated to indicateprogress towards reductions in soil loss. The number of bare soil days declined by 31% between1981 and 1996 in Nova Scotia, a positive indicator of progress. The area in row crops in NovaScotia in recent years has increased, while soil conserving practices such as the use of covercrops and conservation tillage are also on the increase.
Table 5 presents a summary of methods to track soil erosion and conservation. Sustainabilityobjectives are proposed, and some trends are presented.
The use of some soil-conserving practices is clearly cost-effective for farmers (Table 6).Estimates of farm losses due to soil erosion are in the millions of dollars annually. It issignificant that incorporating manure and forages into a rotation has significant soilconservation value, with potentially no net cost. Conservation tillage equipment is lessexpensive to purchase and maintain than conventional equipment. The implementation ofcontour farming practices represents a one-time expense for the farmer that will pay off in the

GENUINE PROGRESS INDEX Measuring Sustainable Developmentvii
long term with improved soil quality. The expenses associated with adopting soil-conservingpractices will be more than offset by the reductions in damage costs due to soil loss experienceddirectly by the farmer.
Table 5: Summary of Methods for Assessing Soil Erosion and Conservation
Results available for Nova Scotia are marked with an asterisk.Methods of assessing
Soil Erosion &Conservation
Objectives Range of Values and Results
1. Rate of erosion (cm depthor t/ha) determined byRUSLE or cesium 137method.
- loss of no more than 1t/ha annually- 6 t/ha/yr ‘tolerable’
- 30 t/ha potato/cereal rotation- 20 t/ha potato/cereal/hay rotation* Nova Scotia average in 1991 = 6.3 t percultivated ha (Statistics Canada, 1996)
2. Soil conservationpractices- leaving crop residue on soilsurface
As much as possible*Up from 8% to 20% of crop area (1991-2001)
- planting cover crops so thesoil is covered during highrisk periods
As much as possible
One study showed soil erosion reduced by83%*Down from 10% to 6% of crop area (1991-2001)
- strip cropping and terracingAs much as possible
Can reduce erosion by as much as 74%* Approx. 4% of crop area (2001)
- use of windbreaks andshelterbelts
As much as possible * Approx. 7% of crop area (2001)
3. Number of bare soil daysper ha per year (McRae etal., 2000)
Decrease in number ofdays soil is bare
*The average number of bare soil days (perha, annually) has declined by 31% from 50 in1981 to 34 in 1996.

GENUINE PROGRESS INDEX Measuring Sustainable Developmentviii
Table 6: Summary of the Value of Soil Conservation
Results available for Nova Scotia are marked with an asterisk.Direct Value Results
1. Revenue and expense differences due toeroded soil in 1986
Yields 5-50% higher on non-eroded vs. eroded soils* $11.5 million annual farm losses due to eroded soil
2. Average annual cost of soil degradation(erosion and compaction) (1986) NS farms * $64/ha of improved land (crop and tame pasture) PEI farms $99/ha of improved land NB potato farms $332/ha of potato land
Indirect Value Results3. Nutrient replacement of eroded topsoil(compensatory value)
* $682,500/year provincially
4. Increasing soil organic matter (avoidancevalue)
Incorporating manure ($288/ha net benefit) and forages($70/ha cost) into a rotation potentially has no net cost.
5. Covering bare soil with hay mulch(avoidance value)
May reduce soil loss by as much as 40 times comparedwith bare soil, and costs $105-135/ha annually.* Covering all row crop area in NS would cost $1.6million annually.
6. Conservation tillage (avoidance value) Costs of conservation tillage are not different fromconventional tillage: no net cost.
7. Strip cropping and terracing (avoidancevalue)
Costs range from $0 to $525/ha to implement (a one-time cost). * An estimated $3.1 million one-time costfor implementation on all 2001 row crop land in NovaScotia.
Soil Foodweb Health
Soil foodweb analysis is a relatively new approach to describing soil health. The health of thesoil foodweb has been proposed as an indicator of soil quality. The soil foodweb is the complexmixture of bacteria, fungi, protozoa, nematodes, and microarthropods that control the cycling ofnutrients within an ecosystem. Bacteria convert additions of easily decomposable organic matterinto humus. Fungi convert more recalcitrant organic matter, such as lignin, into humus.Protozoa feed on bacteria and release nutrients to the soil solution as a by-product of thisactivity. Nematodes and microarthropods consume both bacteria and fungi and also releasenutrients to the soil solution.
The soil foodweb structure can be disrupted by excessive pesticide or fertilizer use, and bygrowing intensive field and row crops year after year. When the soil foodweb is out of balance,the soil’s ‘digestive system’ doesn’t work, decomposition rates are low, nutrients are not retainedby the soil, and losses of nutrients to groundwater and surface water can result. It is no surprisethat amending soils with composted manure or grass/legume residues not only increases soilorganic matter, improves soil structure and reduces soil erosion, but also creates a healthier soilfoodweb. Researchers and farmers have found that the use of manure, and the reduction ofsynthetic fertilizer and pesticide use, all contribute positively to soil biological activity.

GENUINE PROGRESS INDEX Measuring Sustainable Developmentix
Several measures of soil biological activity can be used as part of the soil foodweb healthassessment. These are summarized in Table 7.
Applications of animal manures are known to promote a healthy microbial population (andincrease soil organic matter). In 2000, about 33% of Nova Scotian farm area that had fertilityadded received applications of manure, compared to only 7.5% nationally, while about 62%received synthetic fertilizer compared to 66% nationally. Thus NS farms are in a favourableposition to enhance soil foodweb health with manure additions relative to Canadian farms as awhole.
Another indirect way to measure soil foodweb health is to assess the potential of livestock in thearea to contribute manure to nearby soils. An evaluation of livestock concentration (ManureAnumal Units – MAU – per hectare) in Nova Scotia shows that there needs to be more livestockraised in many areas of the province in order to provide enough manure to keep the soil foodwebhealthy.
Table 7: Summary of Soil Foodweb Health Assessment Methods
Results available for Nova Scotia are marked with an asterisk.Methods to Assess
Soil Foodweb HealthObjectives Range of Values and Results
1. Ratio of fungal to bacterialbiomass (F:B)
F:B ratios of less than 1.0 Forest soils: F:B >1.0Prairie grassland soils: F:B<1.0
2. Soil organic carbon See section on soilorganic matter
3. Number of earthworms per m2
(top 15 cm of soil)Higher values are better 0-200/m2
4. Microbial biomass carbon(kg/ha, top 15 cm of soil)
Higher values are better 0-375 kg/ha (Glover et al.,2000)111-1760 kg/ha (Carter et al., 1998)226-474 kg/ha (Patriquin et al.,1986)
5. Microbial biomass nitrogen(kg/ha, top 15 cm of soil)
Higher values are better 0-100 kg/ha (Glover et al., 2000)
6. Area fertilized with manure Higher values are better,as long as the rate ofmanure application is notexcessive.
*33% of crop and tame pasture land inNS was fertilized with manure in 2000
7. Livestock concentration anddistribution
1.7 to 3.3 manure animalunits (MAU)/ha
*2 NS counties have MAU concentrationin the desirable range. *Province-wide,the concentration is 0.87 MAU/ha, whichis low
The value of a healthy soil foodweb is very difficult to quantify. A summary of estimated valuesassociated with the health of soil life is presented in Table 8. Soil microorganisms perform avariety of ecosystem services including nutrient cycling, fixation and retention, purification ofwaste products, and detoxification of pesticides and chemicals, to name but a few. The rotationeffect is one benefit attributed to a healthy soil foodweb. We can estimate that crop yields on

GENUINE PROGRESS INDEX Measuring Sustainable Developmentx
land with a healthy soil microbial population are 10% higher than yields on land with poor soilhealth because of the competitive interactions between a diversity of soil microorganisms, whichprevent the proliferation of deleterious rhizobacteria.
Investing in the maintenance of a healthy soil foodweb by applying manure annually should notbe expensive if a manure source is locally available. Using perennial forages in a crop rotationwhen manure is not available will benefit the cash crop farmer through reductions in disease andpest problems, reduced fertilizer costs, and the maintenance of sustained yields of valuable crops.The current system of accounting does not place adequate value on soil quality – our naturalwealth – or on perennial forage crops, which can maintain and enhance soil quality. Thisomission makes such forage crops appear to be an uneconomical approach to soil foodwebmaintenance in the short term. This is misleading. If our natural wealth were properly and fullyvalued, there would be financial incentives to support such investments.
The estimates in Table 8 show again that preventing soil quality deterioration may have no netcost if manure is spread. Incorporating forage into the crop rotation would require Nova Scotiafarmers to invest about $8 million annually (depending on the farm system), but will likely yieldbenefits that are close to or surpass the costs of avoiding the problem in the first place (possibly$6 to 14 million annually).
Table 8: Summary of Foodweb Health Values
Results available for Nova Scotia are marked with an asterisk.
Valuation method Value Net result
1. Microbial biomass carbonyield effect (direct value)
$0.50/kg of microbial biomass C *$6.0 million benefit per year forall crop land, 2001
2. Microbial biomass – yieldeffect (direct value)
10% of crop value lost ifmicrobial biomass is degraded
*$14.0 million benefit (10% ofcrop receipts for 1999) per year.
3. Application of livestockmanure at 2t dry matter per ha(avoidance value)
$10/ha to spread, $26/ha innutrient benefit
*No net cost
4. Incorporating forage into thecropping rotation (avoidancevalue)
See SOM section *$70/ha per year in lost incomemultiplied by 119,219 ha cropland = $8.3 million annualinvestment required
Estimates shown here for all the indicators of soil quality and productivity have the samepattern. Investing in the soil to avoid degradation will pay greater dividends in terms ofproductivity. Attempts to compensate for soil degradation, or replace productive capacity willoften be more expensive than the cost of avoiding the problem in the first place, especially in thelong run, as we will see in the next section.

GENUINE PROGRESS INDEX Measuring Sustainable Developmentxi
Long Term Soil Quality and Productivity Studies
Most of the discussion in the previous sections assumes a short time frame for benefits and costsof maintaining soil quality and productivity. In this section, a number of multiple-year studiesare reviewed to assess the long-term effects of soil management. The longest-running studyreported here is 122 years in duration, and the shortest studies are 10 years.
Long-term field studies (of 10 or more consecutive years) indicate the value and contribution oforganic matter to long-term productivity, and the increasing costs over time of allowing a soil tobecome degraded. Since soils differ considerably in their inherent ability to withstand practicessuch as continuous cropping, it is necessary to interpret studies and trends based on indicators ofone soil relative to itself, rather than relative to another soil. Many soils in Nova Scotia areinherently shallower, more acid, and more easily degraded than the soils studied in some of thereports summarized below. Keeping this in mind, the long-term studies are neverthelessinstructive, as they indicate that pushing a soil too hard today may have serious ramifications inthe future.
The studies reviewed here measure some indicators of soil quality and productivity, such as soilorganic matter (organic carbon) levels, bulk density (a measure of soil structure), soil erosion,and soil foodweb health. A summary of soil quality and productivity indicators, their measures,and proposed objectives are presented in Table 9 for reference when discussing study results.
Table 9: Summary of Soil Quality and Productivity Indicators
Indicator Measure Objective% soil organic matter by weight 3.8%% soil organic carbon by weight 2.2%t SOC / ha
Soil organicmatter (SOM)or soil organiccarbon (SOC) (SOM= SOC * 1.7)
No net loss over time, in some casesnet gain may be necessary
Bulk density (g/cm3) Lower values are betterSoil aggregate stability (various units) Higher values are better
Soil structure
Porosity (%) Optimum values of about 50% arebetter than too little or too much
Rate of erosion (tonnes/ha) Less than 1 t/ha per year.6 t/ha is considered to be ‘tolerable’
Soil erosion
Topsoil depth No net loss, prefer gain.
Ratio of fungal to bacterial biomass (F:B) F:B<1.0Soil organic matter or carbon (SOM, SOC) See SOM aboveNumber of earthworms per m2 (top 15 cm ofsoil)
Higher values are better
Microbial biomass carbon (kg/ha, top 15 cmof soil)
Higher values are better
Soil foodwebhealth
Microbial biomass nitrogen (kg/ha, top 15 cmof soil)
Higher values are better

GENUINE PROGRESS INDEX Measuring Sustainable Developmentxii
The pattern that emerges from the studies is that soil quality and productivity is often based ontwo critical factors: the application of manures and integration of grass/legume forages into therotation. Synthetic fertilizer can be beneficial to soil quality and productivity indicators in theshort-term if it increases the crop biomass and consequently the residues returned to the soil.However, longer-term comparative studies demonstrate that synthetic fertilizer treatments havethe potential to have a cumulative negative effect on yield, crop quality, and soil quality if notused in combination with crop rotation and organic matter inputs.
Often it is the combination of manure applications and perennial forage rotation that keeps a soilproductive over the long-term, not either of these methods alone. Long-term studies demonstratethat soil biological activity (soil foodweb health) is consistently greater where manure is applied,and synthetic pesticides and fertilizer avoided.
Experience of Soil Quality and Productivity in Kings County
Comments and examples from farmers in Kings County, Nova Scotia about soil quality andproductivity are presented below.
Comments:
“I can’t say that we have been the best stewards. We lose a lot of soil in the ditch and the pond. Idon’t like to see it.”
-Kings County pork and poultry farmer.
“I feel very personal about all of our land. I want to build it up in quality. Luckily this isn’t toohard since it was mostly forage and orchard…”
-Kings County mixed farmer.
“…Erosion is the difficult thing. The problem is there isn’t much animal agriculture in the Valleyanymore and not much money in hay. We could have a rotation of sod, but in the Valley theclimate lends itself to vegetable production. Really we need [ruminant] animals for hay rotationand manure.”
-Kings County poultry and vegetable producer.
“… We struggle to do the right things…. We have a responsibility to maintain our agriculturaland land resources. The burden on farmers is unfair.”
-Kings County vegetable farmer.
“Organic people are bringing out the importance of maintaining the soil and the environmentaround us. We should have an awareness of these. We have changed practices and are evolvingto reflect this new thinking. But there is so much information that it is hard to keep up.”
-Kings County vegetable farmer.
“Do you know who is the biggest [soil] eroder? Man. With every house built that land is lost. Itcan never go back into agricultural land, as with every highway.”
-Kings County vegetable farmer.

GENUINE PROGRESS INDEX Measuring Sustainable Developmentxiii
“There is no question but that land is alive. All in a life cycle…. To have productivity you have tohave life for the breakdown process. We have been lucky… we have 18 [inches of topsoil]. That’swhy people are practising minimum till or no till. To preserve this topsoil.”
-Kings County poultry farmer.
“Valley farms are losing the livestock sector and I’m concerned about the need for diversity. Itwould be ideal to turn the soil back into sod for two to three years [between annual crops], andcrop rotation is really important. The reason I pay attention to soil organic matter was the soilerosion and yield losses I saw with continuous potatoes… the soil around Canning has beenreally depleted over time.”
-Kings County pork, grain, & beef farmer.
“In general, soil organic matter is increasing due to green manure use, although it is morechallenging to build up in sandy soils. We are developing an understanding of how to work itbetter.”
-Kings County poultry and field vegetable farmer
“Organic matter is incorporated routinely. Plant health, weed, insect, and bird life are all usedas indicators of soil quality. It’s been a modest, slow process, with noticeable improvement.”
-Kings County mixed farmer.
“Soil organic matter is building up slowly with the use of composted manure and green manures.It’s a slow process.”
-Kings County dairy farmer.
“The purpose of farming is to increase the resource; the crop is a by-product.”-Kings County garlic grower.
Examples:
Soil organic matter levels range from 1-2% (low) in some areas, and 3-4% (good) in others.Corn stalks, wheat stubble, and green manures are used to increase soil organic matter. Highsoil organic matter helps to retain calcium in the soil.
-Kings County pork, grain, & beef farmer.
In the past, up to 50% of the soil was left bare, because one main crop was harvested late, withno time to establish a green manure. Now 20% is left bare because they no longer grow thatcrop. On 35 acres, straw was used to cover the soil over the winter.
-Kings County poultry and field vegetable farmer
Composted manure and green manures have been used to improve soil. No synthetic fertilizersor pesticides have been used for 11 years.
-Kings County dairy farmer.

GENUINE PROGRESS INDEX Measuring Sustainable Developmentxiv
The yields were low initially, but now the crops are 70% or better than they were before no-till.No-till saves on tilling costs and decreases soil compaction.
-Kings County pork, grain, & beef farmer.
Although the comments and experience of this small sample of farmers may not adequatelyrepresent farming in the county, it does show how much these producers are doing to learn aboutand preserve soil quality. They see it is in their interest to do so. Because average figures on aprovincial or national basis do not show the wealth of interesting detail, thought, caring, andinnovation that are evident on a daily basis at the farm level, this short section of personalcomments is useful to supplement the statistical analysis in this report.
There are some documented negative trends in soil quality and productivity on Nova Scotiafarms, such as declines in soil organic carbon, potential soil structure problems, increased ratesof erosion, and inadequate integration of livestock into cropping areas. However, we have alsodocumented that Nova Scotia farms have good potential for enhancing soil quality andproductivity relative to the average figures for Canada. On average, farmers have a goodproportion of farm land in perennial forages, which is encouraging, as long as these perennialforages are being rotated with the annual crops. It is obvious from the comments above thatgrowers have a vested interest in keeping their soil productive, but the decline of livestockfarming in the areas most suited to potentially soil-degrading row crops is a major stumblingblock for all soil quality and productivity indicators.
By estimating the value of the investments required to maintain soil quality, it is apparent thatmeasures taken to avoid soil quality problems will cost less than the losses suffered as a result ofsoil quality problems, or attempts to replace what is lost. Long-term studies show thatcompensating for lost soil quality and productivity by using synthetic fertilizer may createaccumulated problems and expenses that only become apparent after a number of years.
It is very important to track trends in soil quality and productivity over a long time period, as soilis the foundation of our productive wealth and represents our potential to produce food forgenerations to come. If society cares about farmers and local food production, farmers, in turn,will more likely have the resources to care for the land.

GENUINE PROGRESS INDEX Measuring Sustainable Developmentxv
ACKNOWLEDGEMENTS
GPIAtlantic would like to thank the National Round Table on the Environment and theEconomy, the Rural Secretariat, the Canadian Rural Partnership, and an anonymous donor, forthe funding they provided for the GPI Agriculture Accounts. In addition, GPI Atlantic is gratefulfor start-up funding provided by the Nova Scotia Department of Economic Development andACOA for the Nova Scotia Genuine Progress Index, which included the initial research for thisstudy. These soils and agriculture accounts also include findings for the Kings CountyCommunity Genuine Progress Index, which is supported by the Rural Secretariat and theCanadian Rural Partnership. Financial support for this project does not imply support for theapproach, findings or conclusions of this report for which GPI Atlantic takes full responsibility.
A sincere and special thank you is extended to the farmers who took the time to explain theirexperience with soil quality and productivity, to Wendy Johnston and Fredr’c Morgan whoconducted most of the interviews, and those who kindly reviewed the text and made constructivesuggestions: Dr. Ronald Colman, director, GPI Atlantic, Gary Patterson, Soil Specialist,Agriculture and Agri-Food Canada, and Dr. Neal Stoskopf, National President of ResourceEfficient Agricultural Production (REAP), NERARITE International Consulting, and retiredUniversity of Guelph faculty member. Special thanks are also due to Hans Messinger, Director,Industry Measures and Analysis, Statistics Canada, for his continuous and ongoing support,advice, and encouragement for the Nova Scotia Genuine Progress Index project.
Needless to say, any errors or misinterpretations, and all viewpoints expressed, are the soleresponsibility of the authors and GPIAtlantic.
©GPIATLANTIC & THE NATIONAL ROUNDTABLE ON ENVIRONMENT & ECONOMY
Written permission from GPI Atlantic and the National Round Table on the Environment and theEconomy is required to reproduce this report in whole or in part. Copies of this report and otherGPI Atlantic publications may be ordered through the GPI web site at www.gpiatlantic.org.Membership information is also available at this web site. Members receive a 25% discount onall publications, a subscription to Reality Check: The Canadian Review of Wellbeing, publishedfour times a year, and a subscription to the GPI News, published eight times a year, whichcontains updates on recent and upcoming GPI Atlantic activities, work in progress and latestresults.

GENUINE PROGRESS INDEX Measuring Sustainable Developmentxvi

GENUINE PROGRESS INDEX Measuring Sustainable Developmentxvii
TABLE OF CONTENTS
1. Introduction.....................................................................................................................12. Soil Organic Matter (SOM).............................................................................................3
Measures of Soil Organic Matter .....................................................................................5State of the Resource & Trends .......................................................................................7Values and Costs........................................................................................................... 10Conclusion – Soil Organic Matter ................................................................................. 14
3. Soil Structure ................................................................................................................ 16Measures of Soil Structure ............................................................................................ 16State of the Resource & Trends ..................................................................................... 18Values and Investments in Soil Structure....................................................................... 21Conclusion – Soil Structure ........................................................................................... 24
4. Soil Erosion and Conservation ...................................................................................... 25Measures of Soil Loss & Conservation.......................................................................... 26State of the Resource & Trends ..................................................................................... 28Benefits and Costs of Soil Conserving Practices............................................................ 30Conclusion – Soil Conservation Practices...................................................................... 33
5. Soil Foodweb Health..................................................................................................... 35Measures of Soil Foodweb Health ................................................................................. 36State of the Resource & Trends ..................................................................................... 39Values and Investments Associated with Soil Foodweb Health...................................... 41Conclusion – Soil Foodweb Health ............................................................................... 44
6. Long-term Soil Quality and Productivity Studies........................................................... 45Conclusion – Long term studies .................................................................................... 56
7. Conclusion .................................................................................................................... 568. References .................................................................................................................... 629. Glossary........................................................................................................................ 68

GENUINE PROGRESS INDEX Measuring Sustainable Developmentxviii
LIST OF TABLES
Table 1: The Value of Ecosystem Services Provided By Agricultural Land ($1997/ha/yr) ..........2Table 2: Estimates of Root Residues Produced by Different Crops, PEI......................................4Table 3: Prevalence of Potentially Building, Neutral, or Degrading Crops on Rotation Land,
2001....................................................................................................................................8Table 4: Summary of Soil Organic Matter Measures, Objectives, Results ..................................9Table 5: A comparison of revenues and expenses, continuous corn vs. corn/hay rotation .......... 14Table 6: Summary of the Value of Soil Organic Matter (SOM)................................................ 15Table 7: Summary of Methods for Assessing Soil Structure...................................................... 21Table 8: Selected Costs and Benefits to the Farmer of Using a Reduced Ground Pressure System
in Grain Corn Production .................................................................................................. 23Table 9: Summary of the Value of Soil Structure ...................................................................... 25Table 10: Inherent (Bare Soil) Risk of Water Erosion on Nova Scotia’s Cultivated Land .......... 26Table 11: Average Number of Bare Soil Days, Canada and Provinces ...................................... 27Table 12: Percentage of Farms in Nova Scotia Reporting Soil Conservation Practices .............. 29Table 13: Summary of Methods for Assessing Soil Erosion and Conservation .......................... 29Table 14: Relative Productivity (%) of Crops Affected by Soil Erosion Losses, Nova Scotia .... 31Table 15: Total Annual On-Farm Cost of Soil Degradation in Nova Scotia, 1981 ..................... 31Table 16: Annual Cost of Soil Degradation Per Hectare of Improved Land (1986).................... 32Table 17: Cost Comparison of Conservation Tillage Methods vs. Conventional Tillage............ 33Table 18: Summary of the Value of Soil Conservation............................................................. 34Table 19: Area of Land with Manure or Synthetic Fertilizer Applied ........................................ 38Table 20: Manure Animal Units (MAU) in Nova Scotia Counties, 1991,1996........................... 39Table 21: Summary of Soil Foodweb Health Assessment Methods ........................................... 41Table 22: Summary of Foodweb Health Values ........................................................................ 44Table 23: Summary of Soil Quality and Productivity Indicators................................................ 46Table 24: Effect of Long Term FYM Applications on Soil Physical Properties, UK.................. 47Table 25: Soil Organic Matter, Bulk Density, and pH After 100 Years...................................... 48Table 26: Coefficient of Variation (CV) of Yield Data.............................................................. 49Table 27: Sixty-one Year Wheat Production Experiment, Breton AB........................................ 50Table 28: Effect of 46 Years of Continuous Cropping on Soil Quality Indicators ...................... 51Table 29: Treatments for 30-Year Experiment Comparing Pasture and Arable Cropping .......... 52Table 30: Soil Quality Parameters for 30-Year Arable and Pasture Systems, UK ...................... 53Table 31: Swiss Experiment Comparing Four Farming Systems with Identical Rotations ......... 54Table 32: Treatments and Results of Three Farming Systems, US Midwest .............................. 55Table 33: Soil Organic Matter Levels on Surveyed Farms......................................................... 58Table 34: Soil Left Bare Over Winter, Surveyed Farms ............................................................ 59Table 35: Manure Use............................................................................................................... 60

GENUINE PROGRESS INDEX Measuring Sustainable Developmentxix
LIST OF FIGURES
Figure 1: Area of Nova Scotia's Farm Land in Forage (Hay and Pasture) and Crops (ha) ............8Figure 2: Numbers of Ruminants and Horses Relative to Land Available for Forage Production,
Nova Scotia Counties, 1996 (Forage Animal Units per ha)..................................................9Figure 3: Trends in Cropping Systems Affecting Soil Structure in Nova Scotia, 1982-1996 (ha)
......................................................................................................................................... 19Figure 4: Area on Nova Scotia Farms in Potentially Soil-Degrading Crops, 1971-2001 (ha) ..... 19Figure 5: Area of NS Farms in Potentially Soil-Building Crops (Hay), 1971-2001 (ha)............. 20Figure 6: Area of NS Farms in Potentially Soil-Building Crops (Pasture), 1971-2001 (ha)........ 20Figure 7: Manure Animal Units (MAU) per ha, Nova Scotia Farms, 1971-1996 ....................... 40Figure 8: Profitable Rate of N-Fertilization at Chinguacousy .................................................... 55

GENUINE PROGRESS INDEX Measuring Sustainable Developmentxx
LIST OF ABBREVIATIONS
AU Animal unitsC Carbonc. Circa = around, or approximatelyCPI Consumer Price IndexDM Dry MatterECSWCC Eastern Canada Soil and Water Conservation CentreF:B Fungal to bacterial biomass ratio in soilFYM Farm Yard ManureGPI Genuine Progress Indexha Hectare (2.5 acres)K Potassiumkg Kilogram (2.24 pounds)MAU Manure animal unitsN NitrogenNB New BrunswickNS Nova ScotiaNPK Nitrogen, Phosphorous, Potassium synthetic fertilizerNSDAF Nova Scotia Department of Agriculture and Fisheries (as of 2000)NSDAM Nova Scotia Department of Agriculture and Marketing, now changed to Nova
Scotia Department of Agriculture and Fisheries (NSDAF)P PhosphorousPEI Prince Edward IslandS SulphurSOC Soil organic carbon (SOM/1.7)SOM Soil organic matter (SOC*1.7)t Tonne (metric)USLE Universal Soil Loss Equationyr Year

SOIL QUALITY AND PRODUCTIVITY
1. Introduction
Soil is both a physical and a living entity, composed of weathered rock, inorganic chemicals,dead plant and animal residues, as well as thousands of living organisms. Soil quality has beendefined as the sustained capability of a soil to accept, store, and recycle water, nutrients andenergy (Gregorich et al., 1994). In addition, soil quality is the capacity of a soil to sustainecological productivity, maintain environmental quality, and promote plant and animal health(Doran & Parkin, 1994). Over time a soil may be sustained in its ability to function as a viablecomponent of an ecosystem, it may be degraded, or it may be improved (Gregorich et al., 1994).
While production is measured in terms of the yields of crops a particular soil can produce,productivity is its yield per unit of input, in a given unit of time. Inputs in this case includeenergy, costs, time, labour, area, nutrients, etc. Productivity is often measured based on the mostlimiting or expensive input. The input chosen for determinations of productivity should alwaysbe made explicit, as it will change according to the endowments and limitations of each site andsituation. Ecological productivity minimizes both non-renewable inputs and polluting outputs,while ensuring optimal production over the long-term.
The productivity of a soil is a function, not only of its quality, but also of a variety ofenvironmental factors, of which climate and topography are the most significant. Two soils mayhave equivalent quality, in terms of the indicators listed in this section, yet one may be lessproductive than the other. This may be due to climate. For example, one soil may be located ina cooler location with a shorter growing season. Topography may also limit productivity. Soilswith excellent quality may not be farmed to their full yield potential due to steep slopes. Thesame may also be true for soils of good quality that have limitations due to stoniness, drainage,or parent material.
In order to achieve genuine progress in agriculture we must ensure that soil quality is maintainedor improved according to a set of proposed indicators discussed below, so that we can achieveoptimal long-term ecological productivity, given our topography, climate, and other naturalresource endowments.
Farmers face an important challenge in their attempts to maintain soil quality and productivity.It is not an easy or straightforward task, particularly when faced with an uncertain climate,sloping topography, shallow soils, and/or narrow economic margins.
The soil quality and productivity indicators proposed here include soil organic matter (or soilorganic carbon); soil structure; soil conservation; and soil foodweb health. Each of theseindicators can be tracked over time using a number of different methods.
GENUINE PROGRESS INDEX Measuring Sustainable Development2
Value
Soil is the natural capital asset upon which our agricultural system is based. It is vital tomaintain a healthy and productive soil if our agricultural system is to continue to functionoptimally.
Soil is currently undervalued in our food production system. Methods of agriculture that degradethe soil are profitable in the short term under our current system of accounting. This is becausethe losses of natural capital due to soil erosion or degradation are invisible in conventionaleconomic accounts, and not included directly in the costs of food production.
Soil degradation that results in soil compaction and reductions in the soil’s fertility iscompensated for by increases in agricultural inputs such as fuel and fertilizer. These inputs canmask the degradation of our soils by allowing crop yields to be sustained and profitable in theshort term, at the expense of long-term productivity. Ironically, these additional fuel andfertilizer inputs are counted in our conventional measures as contributions to economic growthand ‘prosperity’ even though they may potentially represent a decline in ecological productivity,and additional costs to the farmer and society. By contrast, the GPI natural resource accountsrecognize the long-term value of our soil assets.
Attempts have been made to place a monetary value on a range of ecosystem services providedby agricultural soils. Costanza et al. (1997) assigned values for land in grass or forage, and forland in crops, based on the ecosystem services provided by these lands. A higher value wasplaced on agricultural land that is under grass or forage, because of the importance of grass andforage in maintaining and protecting soil as a natural capital asset, as emphasized below. Table 1shows the ecosystem services provided by these two classes of agricultural land, and the valueassigned by Costanza and his international team of scientists to these lands.
Table 1: The Value of Ecosystem Services Provided By Agricultural Land ($1997/ha/yr)
Ecosystem Service2 Grass or forage land CroplandGas regulation 9 -Water supply 4 -Erosion control 41 -Soil formation 1 -Waste treatment 123 -Pollination 35 20Biological control 32 34Food production 94 76Recreation 3 -Total value ($/ha/yr) 342 130
Source: Costanza et al., 1997.
2 1994 U.S. dollars quoted in the article were converted to Canadian dollars using a conversion rate of 1.3557 andthen converted to 1997$ using the Nova Scotia CPI.

GENUINE PROGRESS INDEX Measuring Sustainable Development3
These values are international averages for the value of grass or forage land, and cropland. Inthe following sections we will account for some of the specific differences in productive capacityof Nova Scotia soils that occur as a result of different management practices.
2. Soil Organic Matter (SOM)
Soil organic matter (SOM) is the dead and decaying plant and animal material in the soil - suchas plant residues, animal manure, and dead insects - which are primarily made up of carbon.Most scientific studies report soil organic matter as soil organic carbon (SOC); a factor of 1.7 isused to convert SOC to SOM. Organic matter is critical for maintaining soil productivitybecause of the beneficial effects it has on soil moisture, fertility and structure. It is the mostimportant indicator of soil health and productivity in agricultural systems (Glover et al., 2000).
Maintenance of soil organic matter is a dynamic process that depends on how much is added tothe soil (as crop residue or manure) and how much is lost (through decomposition or erosion).Thus trends are based on net organic matter losses or gains over time. Soil organic matter isdecomposed by soil micro-organisms and provides a source of nutrients for plants.3 The rate ofdecomposition is influenced by soil moisture, temperature, texture, and aeration. Agriculturalsoils can contain from 1 to 10% organic matter by weight (Acton and Gregorich 1995)depending on their geographic location and management. The soils of Nova Scotia arepredominantly Podzolic and even in undisturbed forest conditions, their organic matter contentwill only range from 2.8% to 5.8% in the top 30 cm. Cultivation of these soils results in thebreakdown of organic matter with declines of 35% of initial soil organic matter reported (Carteret al. 1998). In some cases growing forage crops on these soils can restore soil organic matter tolevels equivalent to forested sites, or even greater (Carter et al. 1998).
Maintenance of at least 3.8% organic matter (2.2% carbon) has been suggested as a minimumlevel required for “moderate structural stability” (Greenland et al., 1975). This level will serveas a goal for sustainable agricultural production in the GPI Atlantic Agriculture Accounts.
Humus is organic matter which has been processed by soil organisms into a more stable form. Humus isdark in colour, and the original source of this organic material is impossible to distinguish visually.
3 It is impossible to calculate precisely how much available nitrogen (N) is being contributed by SOM to crops, butestimates can be made based on soil sample information. Highest levels of available N, a principal crop nutrient,occur in soils with about 3 to 4% SOM (1.8 to 2.4% SOC). This SOM decomposes at a rate of 3 to 4% per year(Smillie & Gershuny, 1999). In Nova Scotia, decomposition is estimated to be about 1.5% per year (Moncayo,1992) due to our cold climate. If a soil sample indicates 4% organic matter, this translates into about 90 t of SOM(or 53 t SOC) per ha in the top 15 cm of soil (The top 15 cm of soil in 0.405 ha weighs about 908,000 kg.Therefore, the top 15 cm of soil in a hectare weighs 2,241,975 kg. 4% of 2,241,975 kg = 89,679 kg, rounded to 90 tSmillie & Gershuny, 1999). About 5% of SOM is N, which gives us 4.5 t of N (90 t * 0.05). If the N is madeavailable for crops through decomposition at a rate of 1.5% per year, this yields 68 kg N/ha per year. To replaceorganic matter that has been decomposed (1.5% of 90,000 kg = 1,350 kg), more than a tonne of organic matter perha should be added to the soil per year. To build up SOM levels or correct a depleted state, even more would haveto be added. This example would need to be adjusted according to the cropping patterns, tillage, soil texture, soiltemperature, and soil moisture conditions.

GENUINE PROGRESS INDEX Measuring Sustainable Development4
The maintenance of soil organic matter is vital to the long-term productivity of an agriculturalsystem for the following reasons:• It is necessary for the formation of stable soil aggregates (see section on Soil Structure)
which provide the soil with good aeration, drainage and resistance to erosion and degradation(see section on Soil Conservation).
• It provides the soil with a negatively charged exchange complex (see box) which preventsleaching of positively charged nutrients into groundwater and holds them in the soil,available for plant use.
• Organic matter itself is a reservoir of nutrients, particularly nitrogen, phosphorous andsulphur, which become slowly available to crops through processes of biologicaldecomposition (see section on Soil Foodweb).
• It functions like a sponge to hold water in the soil and release it as needed by crops. Thisreduces drought-related problems in crops.
• It is essential as a food source for the many soil microorganisms that provide vital ecosystemservices (including pesticide degradation, nutrient cycling, pathogen control, see SoilFoodweb section)
• It sequesters carbon and can be used to counteract greenhouse gas emissions.
The cation exchange complex is the negatively charged surface of soil particles which attracts and retainspositively charged ions (cations) such as potassium (K+), calcium (Ca2+) and magnesium (Mg2+). Clayand organic matter both contribute to the soil’s cation exchange capacity. Retained cations are released tothe soil solution as needed for uptake by plants.
Organic matter is formed by returning organic material to the soil. This can be achieved byadding manure (particularly composted solid manure) to land, or by returning crop residues tothe soil. Plants with fibrous root systems, for example ryegrass, hay, or pasture, have immensepotential to increase soil organic matter. These crops are considered soil building because eachyear their roots produce far more organic matter than is lost through normal SOMdecomposition. Table 2 lists the residue contributions of roots to the soil annually, whichdirectly relates to the soil-building properties of these crops.
Table 2: Estimates of Root Residues Produced by Different Crops, PEI
Crop species Root residues per year (kg/ha)Italian ryegrass 3000-5000Winter cereals 2500-3000Red clover 2200-3000Spring cereals 1500-2000Soybeans 600-1000Potatoes 300-700
Source: Acton & Gregorich, 1995.

GENUINE PROGRESS INDEX Measuring Sustainable Development5
In addition to contributions from roots, a large amount of above-ground crop residues arereturned to the soil when sod crops are plowed under and when straw or stover are left on thefield.
Organic matter can also be lost or degraded. Tillage, crop growth, crop harvest, and erosion areseveral of the loss pathways for organic matter. The cultivation of some types of crops can havea negative effect on soil quality, by causing net losses of soil organic matter. These potentiallysoil degrading crops include cultivated row crops such as corn, beans, potatoes and othervegetables. The between-row area in row crops is open and cultivated for the first part of thegrowing season accelerating the microbial breakdown of soil organic matter.
Furthermore, row crops have modest root systems and consequently do not contribute enoughnew organic matter to replace that lost from the open soil between rows. In most cases above-ground crop residues make only minor contributions to replacing lost organic matter. Crops suchas cereals (oats, barley, rye, wheat) are more closely spaced and have more extensive rootsystems than row crops, greatly reducing the amount of soil exposed to degradation. These cropshave a neutral effect on soil organic matter if their residues (such as straw) are left in the field.
Organic matter is decomposed by soil microorganisms. Decomposition is a normal part of the nutrientcycle which transfers nutrients from organic matter to growing plants (a process known asmineralization). However, if the breakdown of organic matter exceeds its build-up over the long run,organic matter levels will decline. The process of organic matter breakdown speeds up when air is mixedwith the soil during cultivation. The tillage associated with growing annual crops is generally depletingto soil organic matter. Growing hay crops for several years in a row without tillage will help to re-buildsoil organic matter levels.
Measures of Soil Organic Matter
1) Soil organic matter from soil samples. Soil organic matter is reported on most standard agricultural soil tests. Historical figures on soilorganic matter levels on farms over the last thirty years would provide an interesting insight intothe overall status of this indicator. However, the information would be very expensive to collectand analyze in a way that would allow for meaningful comparisons over time.
Changes in the level of soil organic matter on Nova Scotia farms are not easy to estimate.Although some farmers track soil organic matter levels in their fields as a way to assess progressin maintaining or enhancing productive capacity, this information is not available at a provinciallevel. 2) Century Model The Agri-Environmental Indicator Project (MacRae et al., 2000) used the Century Model4 toestimate rates of change in soil organic matter on soils across Canada between 1970 and the
4 The Century model uses simplified relationships of soil-plant-climate interactions to describe the dynamics of soilcarbon and nitrogen. It has been used extensively in Canada, the United States, and Europe to predict soil carbonchanges under different cropping practices.
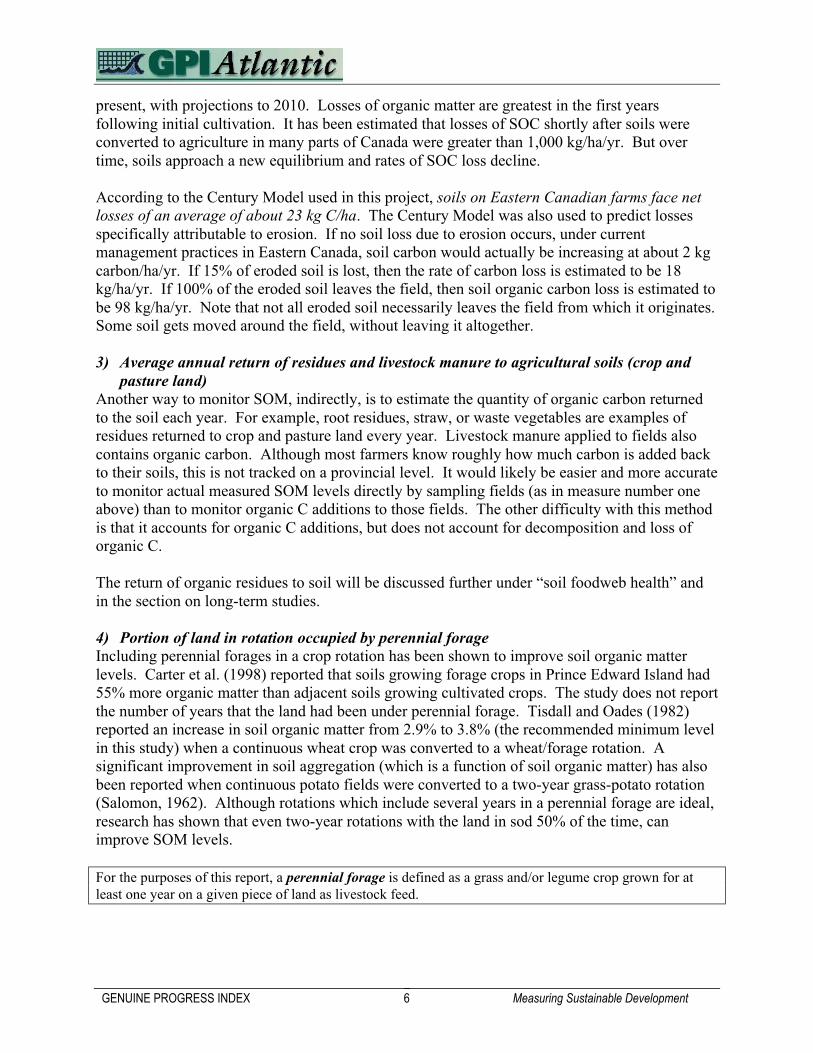
GENUINE PROGRESS INDEX Measuring Sustainable Development6
present, with projections to 2010. Losses of organic matter are greatest in the first yearsfollowing initial cultivation. It has been estimated that losses of SOC shortly after soils wereconverted to agriculture in many parts of Canada were greater than 1,000 kg/ha/yr. But overtime, soils approach a new equilibrium and rates of SOC loss decline.
According to the Century Model used in this project, soils on Eastern Canadian farms face netlosses of an average of about 23 kg C/ha. The Century Model was also used to predict lossesspecifically attributable to erosion. If no soil loss due to erosion occurs, under currentmanagement practices in Eastern Canada, soil carbon would actually be increasing at about 2 kgcarbon/ha/yr. If 15% of eroded soil is lost, then the rate of carbon loss is estimated to be 18kg/ha/yr. If 100% of the eroded soil leaves the field, then soil organic carbon loss is estimated tobe 98 kg/ha/yr. Note that not all eroded soil necessarily leaves the field from which it originates.Some soil gets moved around the field, without leaving it altogether. 3) Average annual return of residues and livestock manure to agricultural soils (crop and
pasture land) Another way to monitor SOM, indirectly, is to estimate the quantity of organic carbon returnedto the soil each year. For example, root residues, straw, or waste vegetables are examples ofresidues returned to crop and pasture land every year. Livestock manure applied to fields alsocontains organic carbon. Although most farmers know roughly how much carbon is added backto their soils, this is not tracked on a provincial level. It would likely be easier and more accurateto monitor actual measured SOM levels directly by sampling fields (as in measure number oneabove) than to monitor organic C additions to those fields. The other difficulty with this methodis that it accounts for organic C additions, but does not account for decomposition and loss oforganic C. The return of organic residues to soil will be discussed further under “soil foodweb health” andin the section on long-term studies.
4) Portion of land in rotation occupied by perennial forage Including perennial forages in a crop rotation has been shown to improve soil organic matterlevels. Carter et al. (1998) reported that soils growing forage crops in Prince Edward Island had55% more organic matter than adjacent soils growing cultivated crops. The study does not reportthe number of years that the land had been under perennial forage. Tisdall and Oades (1982)reported an increase in soil organic matter from 2.9% to 3.8% (the recommended minimum levelin this study) when a continuous wheat crop was converted to a wheat/forage rotation. Asignificant improvement in soil aggregation (which is a function of soil organic matter) has alsobeen reported when continuous potato fields were converted to a two-year grass-potato rotation(Salomon, 1962). Although rotations which include several years in a perennial forage are ideal,research has shown that even two-year rotations with the land in sod 50% of the time, canimprove SOM levels.
For the purposes of this report, a perennial forage is defined as a grass and/or legume crop grown for atleast one year on a given piece of land as livestock feed.

GENUINE PROGRESS INDEX Measuring Sustainable Development7
The Census of Agriculture does not provide information on the number of years that a givenpiece of land has been planted to a particular crop, so it is impossible to determine the length ofcrop rotations. The best that we can do is to determine the percentage of land in rotation5 that isunder perennial forage at any one time. The proposed threshold level for this indicator is 50%.That is, at least half of the land in rotation should be planted to a perennial forage at any giventime to preserve and maintain adequate levels of soil organic matter.
This indicator does not account for additions of organic matter from other sources. If additionsof manure, compost, cover crops, or crop residues are being made annually to cultivated land,organic matter levels may be sustained without incorporating a forage into the rotation. Ideally,both additions of organic matter and rotation of row crops and cereals with perennial foragewould be part of every farm system.
State of the Resource & Trends
The area on Nova Scotia farms allocated to forage production (all tame pasture and hay land) hasdeclined by about 23% between 1951 and 2001 (Figure 1). Table 3 shows the proportion of landin rotation planted to potentially soil building (perennial forage), neutral (cereal) and degrading(row) crops in Nova Scotia at the time of the 2001 census. It shows that the current state of theresource is very good, assuming that annual crops are being rotated into and out of perennialforages. It is impossible to determine from the census data if this is the case.
On average, Canadian farms do not meet the threshold of rotation land being occupied by at least50% soil-building perennial forage crops, while Nova Scotian farms significantly exceed the50% threshold (Table 3).
In localized regions of the province, degrading crops may be dominating. The variability in cropdistribution is illustrated when we compare the figures for these categories of crops in Kingscounty (which has more vegetable and intensive row crop production) and Colchester county(the main dairy-producing county in the province, relying heavily on perennial forages). InKings county, 51% of the land in rotation is in a building phase (perennial forage) while 30% ofthis land is planted to potentially soil-degrading row crops. In Colchester county, the figures aredramatically different, with nearly 83% of the rotation land in a building crop in 2001.
This analysis by county illustrates the need for a careful soil-building program in areas wherepotentially soil-degrading crops are prominent. Farmers may not include perennial forages intheir crop rotations if there is no demand for this feed. Ruminants (dairy, beef, sheep) and horsesare the main consumers of perennial forages. An analysis of the numbers of ruminants andhorses6 in each county relative to the land available for forage production7 illustrates thevariation in this demand across the province. The graph in Figure 2 shows that the demand for 5 Land in rotation was calculated as the sum of the 1996 Census of Agriculture land use categories: land in crops(excluding perennial crops i.e. tree fruit, nuts, berries, nursery products, sod, Christmas trees) and tame pasture.6 A unit of measurement was developed for this indicator: forage animal unit, which is equivalent to a manureanimal unit, since manure production is directly proportional to feed intake. One manure animal unit is equivalentto one adult dairy or beef cow.7 Land available for forage production was calculated from Census of Agriculture data as Total Area of Farms minusAll Other Land. The result would be the sum of crop land, summerfallow, and pasture land.

GENUINE PROGRESS INDEX Measuring Sustainable Development8
forages in Colchester is 30% higher than the demand in Kings County. If livestock production(particularly ruminant) were better integrated into the crop-producing areas of the province, thedemand for forages would increase in these areas. This would make it more probable thatforages would be incorporated into crop rotations.
Figure 1: Area of Nova Scotia's Farm Land in Forage (Hay and Pasture) and Crops (ha)8
0
20,000
40,000
60,000
80,000
100,000
120,000
140,000
1950 1960 1970 1980 1990 2000
Year
area in tame hay (ha)
area in tame pasture (ha)
area in crops (excluding hay) (ha)
Source: Statistics Canada, 2002,1997a and b, 1992, 1987, 1982, 1978, 1973
Table 3: Prevalence of Potentially Building, Neutral, or Degrading Crops on RotationLand, 2001
Prevalence of Crop Type on Rotation Land (%)Crop TypeCanada Nova Scotia Colchester Co Kings Co
Potentially building (hay & tame pasture) 30 80 83 51Potentially neutral (cereals) 61 10 8 19Potentially degrading (row crops) 9 10 9 30
Source: Statistics Canada, 2002.
Table 4 presents a summary of the proposed indicators of soil organic matter (SOM), theobjectives for each indicator, and the range of values available for each. Data available for thisregion on any indicators is marked with an asterisk. Although average losses of 23 kg SOC/hahave been estimated for Eastern Canadian farms, in Nova Scotia losses are likely to be lowerthan in New Brunswick and Prince Edward Island (because Nova Scotia does not grow vast
8 Forage land includes all pasture and hay land. Crop land includes ‘crop land,’ plus summerfallow, minus hay land.

GENUINE PROGRESS INDEX Measuring Sustainable Development9
acreages of potatoes which can reduce SOC), and land use statistics show that farms here havegreat potential to achieve soil organic matter targets if the forage land is rotated with crop land.
Figure 2: Numbers of Ruminants and Horses Relative to Land Available for ForageProduction, Nova Scotia Counties, 1996 (Forage Animal Units per ha)
0
0.1
0.2
0.3
0.4
0.5
0.6
Kings Colchester Lunenburg Yarmouth
Source: Statistics Canada, 1997a.
Table 4: Summary of Soil Organic Matter Measures, Objectives, Results
Results available for Nova Scotia are marked with an asterisk.Measure
of Soil Organic Matter(SOM)
Objective Range and Results
Soil organic carbon (SOC)from soil samples or frommodelling (e.g. CenturyModel) (% by weight or tSOC/ha). SOC x 1.7 = SOM
At least 3.8% SOM (or2.2% SOC); no netlong-term losses ofSOC (some degradedsoils will require netincreases in SOC).
Soils range from 1-10% SOC (Acton &Gregorich, 1995); 0-29 t SOC/ha in top 15 cm(Glover et al., 2000); soils can have 53+ t/haSOC (Smillie & Gershuny, 1999). * Average losses of 23 kg C/ha on EasternCanadian farms, 2000 (McRae et al., 2000).
Average annual return ofresidues and livestockmanure to the soil (t/ha)
Enough to ensure nonet long-term losses ofSOC, at a rate thatprevents nutrientoverloading.
Dependent on soil texture, condition, andcropping system. Data not availableprovincially.
Portion of farm land inrotation occupied by soil-building crops (perennialforage)
At least 50%
Farm land ranges from 0-100% * NS farms have achieved and surpassed the50% objective as an average, although we donot know if the soil-building crops areadequately rotated with potentially soil-degrading crops.

GENUINE PROGRESS INDEX Measuring Sustainable Development10
Vegetable rotations -- an example from Kings County Nova Scotia (November, 1999)
A poultry and field crops producer in Kings County, Bill Swetnam, was asked what motivation he had toinclude ryegrass or other soil-building crop in his carrot/onion crop. He stated that if he could get morefor his crop, then it would be easier to justify rotating the cash crops with soil-building crops. If he gotmore income from his vegetable crop, then what is to stop him from just planting every year to increasereturns? Mr. Swetnam explains that it is ncessary to rotate the land out of carrots and onions on accountof disease. He would like to have 3 to 5 years between onion crops, for example, in order to keep the soilin good shape. In economic terms, Mr. Swetnam thinks it would pay to grow crops such as hay (timothyand clover), or a ryegrass and clover cover crop. He is particularly interested in ryegrass because it hasan excellent root system and it builds up soil organic matter.
However, it is difficult to go two years with no income on a field in ryegrass when the returns on the cashcrop are so low and the margins are so narrow between crop income and expenses. If Mr. Swetnamcould get a better price for his crop or a better yield, he would not have to ensure there is income fromevery single field on the farm.
Growing large amounts of vegetables in the Annapolis Valley has only been the dominant pattern in thelast 10 years or so, according to Swetnam. “We’d be mining the soil if we run too close a rotation. Andwe’ll pay for it down the road. I’m sure with a soil-building phase in my rotation, I’ll see yield benefitswithin 5 years. I have to invest now to get the benefit later.”
In addition to higher returns for his vegetable crop, Swetnam says it would be ideal if there were morecattle being raised in Kings County. Why? There would be more demand for hay and pasture, which areexcellent crops for rotating with vegetables. “But there just isn’t the cattle anymore, it isn’t viable,”Swetnam concludes.
Values and Costs
Value of Soil Organic Matter
It is difficult to estimate the total value of all the ecosystem services provided by soil organicmatter, but we can estimate its annual contribution of plant nutrients to crops. Carter et al.(1998) report an average soil nitrogen (N) content of 5,800 kg/ha for cultivated Podzols (thepredominant soil type in Nova Scotia). Although some of that nitrogen exists in the inorganic(nitrate, ammonium, and amino acid) form, the majority of soil N is tied up in soil organicmatter. This nitrogen is released to the growing crop through the process of mineralization.Moncayo (1992) estimated the annual contribution of organic N mineralization in Nova Scotia tobe 1.5% of the total soil N content. Using this factor, we can estimate an annual contribution ofN from soil organic matter of 87 kg N/ha. Fertilizer N is currently worth almost $1/kg.9
Therefore organic matter is contributing $82/ha/yr worth of nitrogen. The reservoir (stock) ofsoil organic N on farmed land is worth more than $5,400/ha ($945 million provincially).10 On aprovincial basis, the annual N contribution from soil organic matter on farms (flow) is worth $14million per year.11
9 Based on prices quoted by Truro Agromart in January 2001. Price includes delivery.10 $5,400 * 174,959 (area of crops, tame and natural pasture) = $944,780,000.11 Based on a figure for agricultural land in 2001 of 174,959 ha.

GENUINE PROGRESS INDEX Measuring Sustainable Development11
Organic matter also supplies some phosphorus (P) to growing crops. The P content of organicmatter has been estimated at about one-tenth the N content (Tisdale et al. 1985). Using thisfigure, we can calculate an annual contribution of P to cropland of about 21 kg P2O5 /ha.12
Fertilizer P is worth about $1/kg P2O5, so the value of phosphorus supplied by organic matter isapproximately $20/ha annually or $3.5 million province-wide.
Because this remarkable contribution is provided ‘freely’ by nature, it appears nowhere instandard accounting systems. And when farmland is managed so that soil organic matter is lost,this loss of value also remains invisible. Ironically, the cost to the farmer of replacing this lostasset through synthetic fertilizer is then counted as a contribution to general economic prosperity,simply because the exchange of money now enters the economy.
Lost Organic Matter
Another method of determining the value of organic matter is to analyze the effects associatedwith its loss. If sustainable farming practices are not adopted, soil organic matter levels willdecrease and then stabilize at a new, lower equilibrium level. Researchers at the Eastern CanadaSoil and Water Conservation Centre (ECSWCC) have estimated that fields in monoculturepotatoes will have an equilibrium soil organic matter content 0.5% lower than fields in a potato-grass rotation (perennial forage fifty percent of the time)13 (ECSWCC 1993). Farmers on the monoculture potato fields will be spending approximately $10/ha/yr more thanthe farmers using potato-grass rotations to supply the N and P that could have been provided bythe lost soil organic matter. If the farmers using rotations switched to a leguminous forage crop(which ‘fixes’ atmospheric nitrogen and adds it to the soil), they could expect to spend up to$114/ha/yr less than the monoculture potato farmers in the year after plowdown, to meet theirpotato crop’s N needs.14
This 0.5% loss of soil organic matter represents a decrease in stock value (based only on N and Pfertilizer value) of $650/ha.15 This lost natural capital could be restored if the monoculture fieldswere converted to a forage-potato rotation. We can expect a new, higher soil organic matterequilibrium level to be reached after about twenty years, the amount of time it would take toincrease soil organic matter by 0.5%.
These figures give some idea of the value of organic matter just as a free and natural source offertilizer. In that capacity alone, soil organic matter enhances soil productivity, and avoidsexpensive synthetic fertilizer input costs. However there are also other, less tangible benefitsderived from soil organic matter, including improvements to soil structure, which can reduce
12 Fertilizer phosphorus is expressed as P2O5. 1 kg P is equivalent to 2.29 kg P2O5.13 Assuming initial soil organic matter of 3.5%, the equilibrium soil organic matter levels in continuous potato fieldswill be 2.2% compared to 2.7% in potato-grass rotated fields after twenty years.14 Assuming a N contribution from a forage stand that contained 50% or more legume of 110 kg/ha (AdvisoryCommittees on Cereal, Protein, Corn and Forage Crops 1991).15 Assuming conservatively that 0.5% organic matter represents approximately 561 kg N/ha and 128 kg P2O5/ha.0.5% of the weight of the top 15 cm of soil (2,241,975 kg) = 11,210 kg organic matter. 5% of organic matter is N(Carter et al. 1998) content = 561 kg N. One tenth of N content is P content = 56 kg P x 2.29 = 128 kg P205.

GENUINE PROGRESS INDEX Measuring Sustainable Development12
tillage costs, and improved water holding capacity, which reduces the need for irrigation andincreases yields. If these benefits were quantified, we would find the annual contribution of soilorganic matter to farmland productivity in Nova Scotia to be in the tens of millions of dollarsannually.
Defensive Expenditures to Replace Annual Organic Matter Losses
As noted above, cultivated row crop production with no forage rotation potentially degrades soilquality and results in a loss of soil organic matter. Cash crop farmers in areas with no livestockor other demand for forage crops may therefore have to use an off-farm fertilizer (as notedabove) or bring in an organic amendment to maintain adequate levels of soil organic matter ontheir land. We can assume an initial soil carbon (C) level of 58 t C/ha (average figure forcultivated Podzols reported by Carter et al. 1998) and estimate an annual rate of C loss incontinuous vegetable production of 2.5% per year (based on the rate for potatoes reported inEastern Canada Soil and Water Conservation Centre, 1993). Using this information, plus acoefficient of conversion of added C to soil organic C of 0.25 (Martin and Fredeen, 1999) we cancalculate that 5.8 t C/ha/yr needs to be added to cultivated cash crop soils in order to replacecarbon loss.
Purchased Compost
This replacement carbon can be purchased in the form of compost. Clare Organic Products ofDigby County sells its composted peat moss product for $39/m3 including shipping to theKentville area.16 This material is high in carbon (56%), and an application rate of 10.4 t/ha peryear would be sufficient to replace the estimated annual C losses of 5.8 t/ha in continuousvegetable production. It is apparent that using purchased compost is a prohibitively expensivemethod of increasing soil carbon on a field scale. If purchased compost were used to replace thecarbon lost annually on all the vegetable land in Kings county (2522 ha) in 2001, the total cost toKings county farmers would be $1.7 million per year. Manure There are some sources of manure, particularly in Kings county, which may be available tofarmers for free if they are willing to pick it up. Warman & Cooper (1993) investigated thepotential use of poultry manure as a C source, but discovered that it is so high in nutrients(average values of 6.4% N and 4.6% P2O5 on a dry basis) that nutrient pollution could become arisk if this were used as a carbon source. To a lesser extent, similar problems would also arise ifsolid swine manure were used as a carbon source (4.0%N, 1.3%P2O5, NSDAM 1991). Thesemanures would have to be mixed with other materials to lower their nutrient content beforeapplication.
16 Pricing, composition and weight information provided by Gerald Thimot, Clare Organic Products, Saulnierville,NS. Approximate price $36/yd3 ($2001) with a ten percent discount for large volumes. Weights range from 900 to1100 lbs/ yd3 depending on the moisture content. If one m3 = 594 kg, then 10.4 t/594 kg = 17.5 m3/ha * $39/m3 =$682/ha * 2522 ha = $1,720,004.

GENUINE PROGRESS INDEX Measuring Sustainable Development13
Beef manure is lower in nutrients and higher in carbon than poultry or swine manure (2%N, 1%P2O5, 2.5% K20 and approximately 50% C, on a dry basis (vanRoestel 1995)). Application ofabout 12 t dry beef manure per hectare annually will provide enough carbon to replace carbonloss associated with row crop production. It will also provide approximately 106 kg of plant-available N/ha17 to the growing crop as well as a total of 48 kg plant-available P2O5/ha and 270kg plant-available K20.18 The total cost to spread this manure can be estimated as $10/ha, but thenutrient value that will be provided totals $298/ha. The minimum net benefit of spreadingmanure in this example would be $288/ha. This is a minimum estimate because manureadditions continue to provide nutrients for growing crops (to a lesser degree) in subsequent years(Mathers & Goss, 1979). Manure also provides other nutrients such as calcium (Ca), magnesium(Mg) and micronutrients required by growing crops. We also have not counted the other benefitsnoted above that are associated with the carbon added as a result of manure additions, such ascontributions to soil structure and water holding capacity. The farmer who chooses to use manure to replace lost carbon, may therefore be reducing hisinput costs significantly, depending on the cost to transport the manure to the farm. Annualmonitoring of soil fertility would be required since excessive phosphorus levels can accumulatein soils that receive frequent manure applications.
Using Perennial Forages in Rotation
Farmers who choose to sustain soil organic matter levels by growing forages on their cropland50% of the time, may suffer a decline in income due to the lower value of forages compared tocash crops such as vegetables or corn. This temporary decline in income can be considered aninvestment by the farmer to protect the soil’s natural capital in the longer term, because it willyield a return over time in avoided losses due to soil degradation. In Table 5 we compare therevenues and expenses over four years for a hectare of land in continuous grain corn production,compared to land in a two-year corn, two-year hay rotation.
The continuous corn farmer earns approximately $138/ha/yr (not including fixed costs) while theaverage income for the farm using a crop rotation is only $68/ha/yr. The farmer using a croprotation benefits from the fertilizer contribution from the plowed-down hay crop in the first yearof corn production, but this does not compensate for the cost of establishing the hay crop, and therelatively low value of oats and hay compared to corn. Under our current system of accounting,it would be financial suicide for a grain corn farmer to convert from continuous corn production,to a two years clover, two years corn rotation.
Three major caveats are necessary when considering this example:• The yield estimate for grain corn was 5.2 t/ha (this was the assumed yield used to determine
all input costs). In reality, average grain corn yields in Nova Scotia during the past ten years 17 Plant-available N is the portion of total nitrogen applied which will be available for crop use in the year ofapplication. This was calculated as 0.75 of the manure’s ammonium-N content (assuming immediate incorporationof manure after application) plus 0.35 of the manure’s organic-N content (Total N subtract ammonium-N). In futureyears, the remaining organic N will have a residual effect on plant-available N (Commonwealth of Virginia,Virginia Nutrient Management Standards and Criteria, Revised 1995).18 Plant-available P2O5 was assumed to be 0.4 of total P2O5 ; plant-available K20 was assumed to be 0.9 of the totalK20 (Brenton and Mellish 1996).
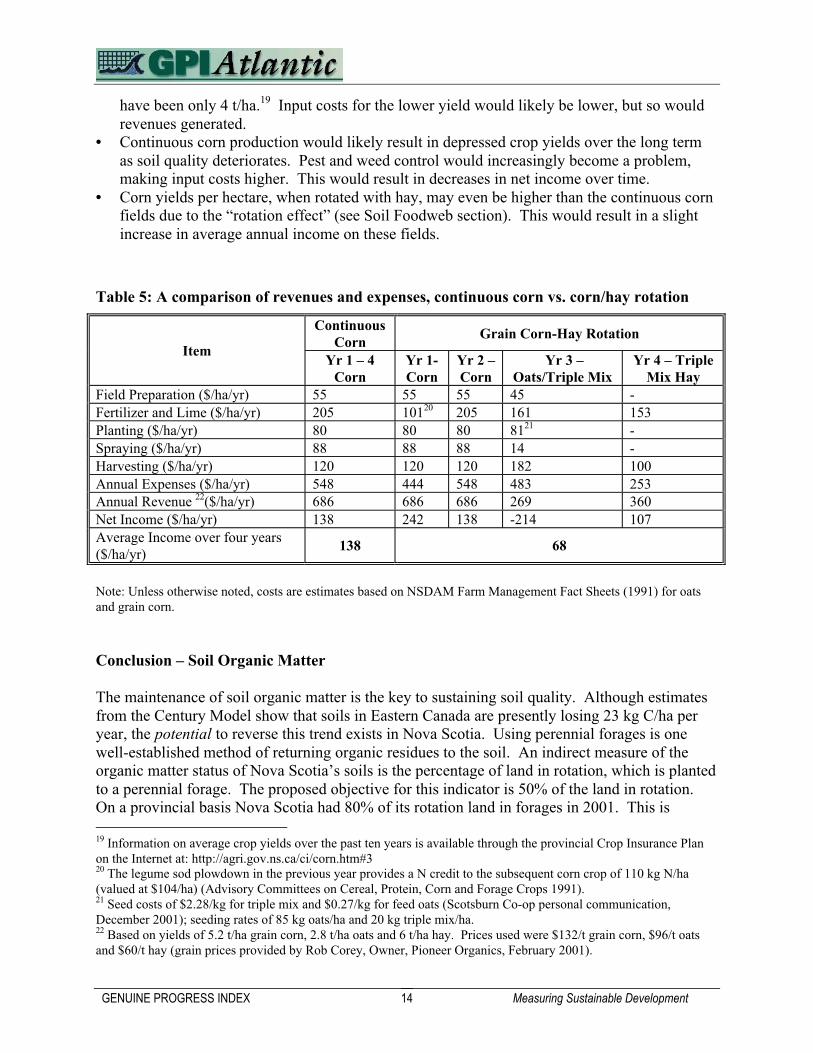
GENUINE PROGRESS INDEX Measuring Sustainable Development14
have been only 4 t/ha.19 Input costs for the lower yield would likely be lower, but so wouldrevenues generated.
• Continuous corn production would likely result in depressed crop yields over the long termas soil quality deteriorates. Pest and weed control would increasingly become a problem,making input costs higher. This would result in decreases in net income over time.
• Corn yields per hectare, when rotated with hay, may even be higher than the continuous cornfields due to the “rotation effect” (see Soil Foodweb section). This would result in a slightincrease in average annual income on these fields.
Table 5: A comparison of revenues and expenses, continuous corn vs. corn/hay rotation
ContinuousCorn
Grain Corn-Hay RotationItem
Yr 1 – 4Corn
Yr 1-Corn
Yr 2 –Corn
Yr 3 –Oats/Triple Mix
Yr 4 – TripleMix Hay
Field Preparation ($/ha/yr) 55 55 55 45 -Fertilizer and Lime ($/ha/yr) 205 10120 205 161 153Planting ($/ha/yr) 80 80 80 8121 -Spraying ($/ha/yr) 88 88 88 14 -Harvesting ($/ha/yr) 120 120 120 182 100Annual Expenses ($/ha/yr) 548 444 548 483 253Annual Revenue 22($/ha/yr) 686 686 686 269 360Net Income ($/ha/yr) 138 242 138 -214 107Average Income over four years($/ha/yr)
138 68
Note: Unless otherwise noted, costs are estimates based on NSDAM Farm Management Fact Sheets (1991) for oatsand grain corn.
Conclusion – Soil Organic Matter
The maintenance of soil organic matter is the key to sustaining soil quality. Although estimatesfrom the Century Model show that soils in Eastern Canada are presently losing 23 kg C/ha peryear, the potential to reverse this trend exists in Nova Scotia. Using perennial forages is onewell-established method of returning organic residues to the soil. An indirect measure of theorganic matter status of Nova Scotia’s soils is the percentage of land in rotation, which is plantedto a perennial forage. The proposed objective for this indicator is 50% of the land in rotation.On a provincial basis Nova Scotia had 80% of its rotation land in forages in 2001. This is 19 Information on average crop yields over the past ten years is available through the provincial Crop Insurance Planon the Internet at: http://agri.gov.ns.ca/ci/corn.htm#320 The legume sod plowdown in the previous year provides a N credit to the subsequent corn crop of 110 kg N/ha(valued at $104/ha) (Advisory Committees on Cereal, Protein, Corn and Forage Crops 1991).21 Seed costs of $2.28/kg for triple mix and $0.27/kg for feed oats (Scotsburn Co-op personal communication,December 2001); seeding rates of 85 kg oats/ha and 20 kg triple mix/ha.22 Based on yields of 5.2 t/ha grain corn, 2.8 t/ha oats and 6 t/ha hay. Prices used were $132/t grain corn, $96/t oatsand $60/t hay (grain prices provided by Rob Corey, Owner, Pioneer Organics, February 2001).
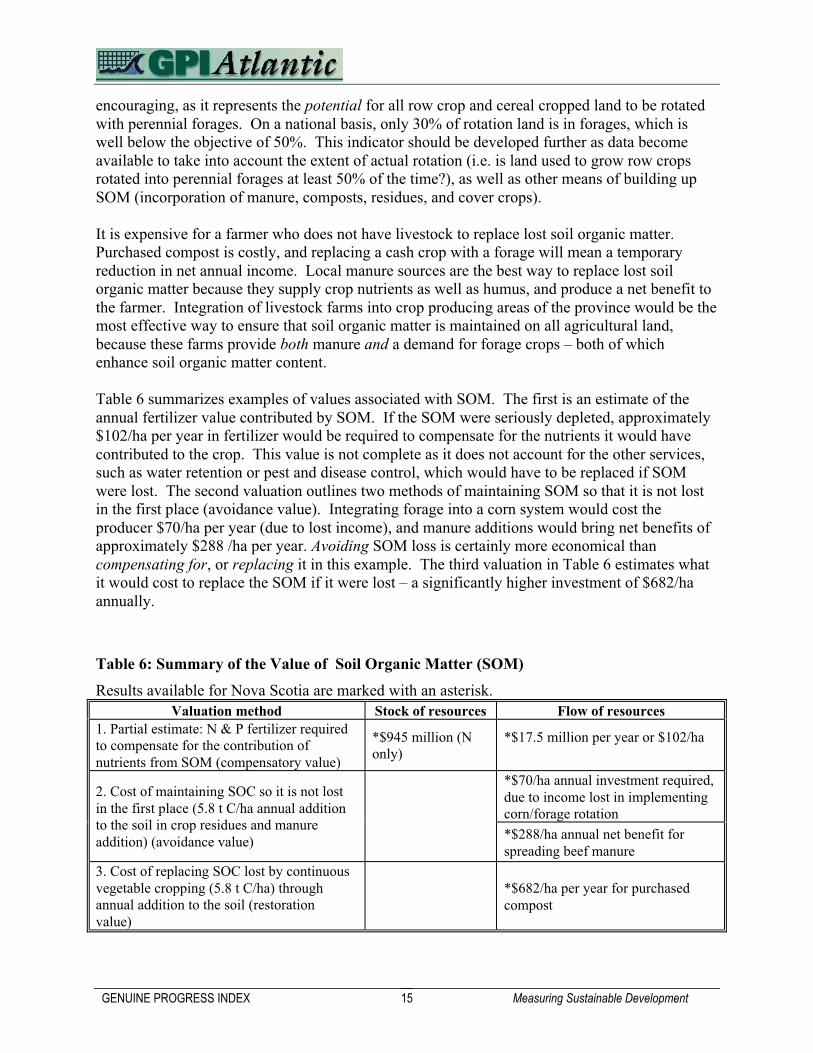
GENUINE PROGRESS INDEX Measuring Sustainable Development15
encouraging, as it represents the potential for all row crop and cereal cropped land to be rotatedwith perennial forages. On a national basis, only 30% of rotation land is in forages, which iswell below the objective of 50%. This indicator should be developed further as data becomeavailable to take into account the extent of actual rotation (i.e. is land used to grow row cropsrotated into perennial forages at least 50% of the time?), as well as other means of building upSOM (incorporation of manure, composts, residues, and cover crops).
It is expensive for a farmer who does not have livestock to replace lost soil organic matter.Purchased compost is costly, and replacing a cash crop with a forage will mean a temporaryreduction in net annual income. Local manure sources are the best way to replace lost soilorganic matter because they supply crop nutrients as well as humus, and produce a net benefit tothe farmer. Integration of livestock farms into crop producing areas of the province would be themost effective way to ensure that soil organic matter is maintained on all agricultural land,because these farms provide both manure and a demand for forage crops – both of whichenhance soil organic matter content.
Table 6 summarizes examples of values associated with SOM. The first is an estimate of theannual fertilizer value contributed by SOM. If the SOM were seriously depleted, approximately$102/ha per year in fertilizer would be required to compensate for the nutrients it would havecontributed to the crop. This value is not complete as it does not account for the other services,such as water retention or pest and disease control, which would have to be replaced if SOMwere lost. The second valuation outlines two methods of maintaining SOM so that it is not lostin the first place (avoidance value). Integrating forage into a corn system would cost theproducer $70/ha per year (due to lost income), and manure additions would bring net benefits ofapproximately $288 /ha per year. Avoiding SOM loss is certainly more economical thancompensating for, or replacing it in this example. The third valuation in Table 6 estimates whatit would cost to replace the SOM if it were lost – a significantly higher investment of $682/haannually.
Table 6: Summary of the Value of Soil Organic Matter (SOM)
Results available for Nova Scotia are marked with an asterisk.Valuation method Stock of resources Flow of resources
1. Partial estimate: N & P fertilizer requiredto compensate for the contribution ofnutrients from SOM (compensatory value)
*$945 million (Nonly)
*$17.5 million per year or $102/ha
*$70/ha annual investment required,due to income lost in implementingcorn/forage rotation
2. Cost of maintaining SOC so it is not lostin the first place (5.8 t C/ha annual additionto the soil in crop residues and manureaddition) (avoidance value) *$288/ha annual net benefit for
spreading beef manure3. Cost of replacing SOC lost by continuousvegetable cropping (5.8 t C/ha) throughannual addition to the soil (restorationvalue)
*$682/ha per year for purchasedcompost

GENUINE PROGRESS INDEX Measuring Sustainable Development16
Bulk density is a physical measurement used todescribe soils. It is calculated by dividing theoven-dry weight of soil by its volume. It isusually expressed in g/cm3 or kg/m3. Typical bulkdensities in agricultural soils range from 1.1 to 1.7g/cm3 depending on various factors includingtexture, organic matter content, and soilmanagement practices.
3. Soil Structure
Soil structure is defined as the physical properties of a soil relating to the arrangement andstability of soil particles and pores (McBride et al., 2000). Structure is a qualitative characteristicof soil. We can describe a soil with ‘good’ structure as being friable, light, and workable, withgood tilth. Soil aggregation is a component of soil structure. This is the arrangement of soilparticles in granules or crumbs which are held together by organic compounds known aspolysaccharides (complex sugars). A soil with good structure and aggregation will have:• increased pore space• good aeration and drainage• good moisture-holding capacity• better root penetration• reduced energy expenditures during
tillage operations• resistance to soil erosion Compaction can be defined as a process bywhich external forces compress the soil,making it more dense, less porous, and lesscapable of performing the functions just listed (Moerman, 1994).
Running heavy equipment over fields will contribute to compaction, particularly when the soil iswet, the texture is fine, and/or the organic matter content is depleted. Tillage is a necessary partof crop production in order to prepare the land for seeding or control weeds. ‘No-till’ is afarming practice that replaces tillage functions with herbicide use. ‘Minimum’ or ‘reducedtillage’ is a set of techniques that reduce the need for moldboard plowing by using chisel plowsand other strategies to break up hard soil, while leaving crop residues on the surface. No-till isnot widely practiced in NS because it is not practical on heavier-textured soils. Of all landprepared for seeding in 2001, 8% was no-till, 20% was minimum-till, and 71% was prepared byregular plowing (Statistics Canada, 2002).
Measures of Soil Structure
Soil structure is evaluated by assessing thedegree of compaction (measured by bulkdensity), soil organic matter content, type ofcrops grown, and type/amount of tillage used.Generally, soils with lower bulk densities havebetter structure. High bulk densities andpenetrometer resistance are indicative of poor structure, and high compaction (McBride et al.,2000). Fine- textured soils are most prone to soil compaction. The structure of these soils iseasily destroyed by excessive tillage, especially when the soil is cultivated during wet periods.
Soil compaction caused by wheel traffic and tillage isone form of soil degradation. This process leaves thesoil denser, less permeable to air and water, slower towarm up in the spring, more difficult to till, and moreresistant to the penetration of plant roots. Reducedefficiency of nutrient uptake results in impeded plantgrowth. Compaction is a particular problem in fine-textured soils.

GENUINE PROGRESS INDEX Measuring Sustainable Development17
Soil aggregate stability and bulk density are two important indicators of soil structure (Glover etal., 2000). Aggregates are the structures, or clumps, formed when soil minerals and organicmatter are bound together with the help of organic molecules, plant roots, fungi, and clays(Magdoff & van Es, 2000). The strength of the soil aggregates (granules or crumbs) willdetermine the soil’s resistance to compaction. This ‘aggregate stability’ has been stronglycorrelated with soil organic matter content (Glover et al., 2000).
Soil bulk density and aggregate stability are not tracked or measured for farms as a whole inNova Scotia. Therefore, it is necessary to find another way to assess soil structure. McBride et al. (2000) link a recent increase in soil compaction risk in the Annapolis Valleyregion of Nova Scotia to the introduction of grain corn farming which has been made possible bythe development of short season corn hybrids. Row cropping of crops like corn and potatoes canresult in soil compaction because of the extra tillage required to keep the inter-row spaces weed-free until the crop canopy fills in. Compaction can be reduced by certain soil management practices. Methods that return organicmatter to the soil will improve soil structure, result in better soil aggregate formation, and reducecompaction. These methods include:• Additions of manure and compost to the soil• Crop rotations that include deep-rooted crops such as alfalfa and sweet clover. Not only do
these crop residues improve soil organic matter, but the roots can break up any compactlayers in the subsoil. Angers et al. (1987) report improvements in aggregate strength andinteraggregate porosity after only two years of bromegrass following twelve years of cornmonoculture.
Since excessive wheel traffic contributes to soil compaction, farming practices which minimizethe number of trips the farmer must make around the field should also reduce soil compaction.These methods include:• Reduced tillage techniques; reducing fall plowing; and using chisel plows which break up
hard pans and leave more crop residue on the soil surface• Minimizing the number of pre-plant tillage operations to reduce the direct effects of wheel
traffic on compaction and also to reduce the destruction of soil structure which can resultfrom excessive tillage
• Integrated pest management (IPM) strategies for pest control so that trips over the field withspray equipment are kept to a minimum.
Large loads and high surface pressure from wheel traffic in the field also contribute tocompaction. Farmers can reduce the effects of wheel traffic on soil compaction by usingreduced ground pressure systems. This involves selecting equipment that:• uses dual or flotation tires which spread the load, thereby reducing the pressure per square
inch of soil;• has more axles, thereby distributing the load over more wheels; and• weighs less, thereby reducing the total pressure applied to the soil.

GENUINE PROGRESS INDEX Measuring Sustainable Development18
An approach to soil management that incorporates these three strategies (return of organicresidues to the soil, minimal wheel traffic over the field, and the use of reduced ground pressuresystems), should ensure the maintenance of good soil structure and the reduction of soilcompaction.
State of the Resource & Trends
The Agri-Environmental Indicator Project (McRae et al., 2000) has developed a “Risk of SoilCompaction” indicator. This is designed to assess the likelihood that major agricultural soils inOntario and the Maritimes will become more compacted, stay the same, or become lesscompacted under prevailing cropping systems in 1981, 1991 and 1996. The susceptibility ofsoils to compaction is related to soil organic carbon content, bulk density and texture, as well ashistorical cropping systems. Soils that are already very compacted have a low susceptibility tofurther compaction, whereas soils with low or moderate compactness are much more susceptibleto further compaction. The indicator is divided into two components:
3. The first component describes soils that are susceptible to compaction under managementwhich could cause further compaction. Row crops such as corn, vegetables, and root crops(potatoes) were considered likely to cause further compaction.
4. The second component describes soils that are already highly compacted under managementexpected to reduce their compaction. This includes soils cropped to alfalfa, hay, andimproved and unimproved pasture.
The objective for this indicator is to have a decrease in the area of soils under management thatcould cause further compaction and an increase in the area of soils that are under managementthat will reduce their compaction.
Figure 3 shows that soil structure is not likely to improve if present trends continue. The area ofhighly-compacted soils under cropping systems that reduce soil compactness has gone down by17.7%. The area of soils susceptible to compaction under cropping systems that causecompaction has gone up 38.5%. This may be partly due to the decrease in land in potentiallysoil-building crops (hay and tame pasture) relative to land in potentially soil-degrading crops(row crops) (Figures 4-6). Between 1991 and 2001, crop area allocated to potentially soil-degrading crops has increased by 30% (~ 3,000 ha). This area will have to be balanced with soil-building crop rotations in order to retain its productivity. Fortunately crops considered to bebeneficial to soil structure predominate in most areas of Nova Scotia.

GENUINE PROGRESS INDEX Measuring Sustainable Development19
Figure 3: Trends in Cropping Systems Affecting Soil Structure in Nova Scotia, 1982-1996(ha)
0
5,000
10,000
15,000
20,000
25,000
30,000
1980 1982 1984 1986 1988 1990 1992 1994 1996 1998
Soils suceptible to compaction under cropping systems that cause compaction
Highly compacted soils under cropping systems that reduce soil compactness
Source: McRae et al., 2000.
Figure 4: Area on Nova Scotia Farms in Potentially Soil-Degrading Crops, 1971-2001 (ha)
7,000
8,000
9,000
10,000
11,000
12,000
13,000
1970 1975 1980 1985 1990 1995 2000
Year
Area of land in row crops (ha)
0
/ /
Note: The trendline is indicated by a straight, thin black line on the figure.
Source: Statistics Canada, 2002; 1997a; 1992; 1987; 1982; 1978; 1973.

GENUINE PROGRESS INDEX Measuring Sustainable Development20
Figure 5: Area of NS Farms in Potentially Soil-Building Crops (Hay), 1971-2001 (ha)
60,000
62,000
64,000
66,000
68,000
70,000
72,000
74,000
76,000
1970 1975 1980 1985 1990 1995 2000
Year
Area of land in tame hay (ha)
0
/ /
Note: The trendline is indicated by a straight, thin black line on the figure.
Source: Statistics Canada, 2002; 1997a; 1992; 1987; 1982; 1978; 1973.
Figure 6: Area of NS Farms in Potentially Soil-Building Crops (Pasture), 1971-2001 (ha)
15,000
20,000
25,000
30,000
35,000
40,000
45,000
50,000
1970 1975 1980 1985 1990 1995 2000
Year
Area of land in tame pasture (ha)
0
/ /
Note: The trendline is indicated by a straight, thin black line on the figure.
Source: Statistics Canada, 2002; 1997a; 1992; 1987; 1982; 1978; 1973.
GENUINE PROGRESS INDEX Measuring Sustainable Development21
Table 7 is a summary of soil structure indicators, objectives, and range of values.
Table 7: Summary of Methods for Assessing Soil Structure
Results available for Nova Scotia are marked with an asterisk.Assessment methods –
Soil structureObjective Range of values and results
1. Bulk density (g/cm3)Depends on soil textureLower values are better
The bulk density of agricultural soilsranges from 1.0 to 2.0 g/cm3 (Gloveret al., 2000)
2. Soil aggregate stability(% 1-2 mm diameter in top7.5 cm of soil)
Higher values are betterThe aggregate stability of agriculturalsoils ranges from 0-17%
3. Porosity(% pore space in a soil)
Optimum values of about 50%are better than too little or toomuch
The porosity of agricultural soilsranges from 20 to 80% (Glover et al.,2000)
Increase area of soils undermanagement that will reducecompaction
*Decrease in area of 18%
Decrease area of soils undermanagement that could causefurther compaction
*Increase in area of 38.5%4. Risk of soil compaction(McRae et al.,2000).
*Neither objective was met between1982-1996 (McRae et al., 2000).
Values and Investments in Soil Structure
Value of Non-compacted vs. Compacted Soils
A range of yield and income benefits is reported for crops grown on non-compacted vs. cropsgrown on compacted soils. Moerman (1994) reported yield increases up to 45% for grain corn,although yield benefits of 10-25% are more likely. It has been estimated that Canadianproducers lose $130 million/yr due to soil compaction (Acton and Gregorich, 1995). Non-compacted soils provide a better rooting environment and fertilizer efficiency for growing crops(whether the fertilizer is synthetic or organic, or derived from biological fixation) compared tocompacted soils. Moerman (1994) also reported differences in N-mineralization of –22 kg N/hafor compacted soils relative to non-compacted soils and reductions in power required for tillageof 37-70% for non-compacted soils relative to compacted soils. Farmers are aware that lesspowerful tractors are required to pull tillage implements through non-compacted soils relative tocompacted soils.
Investing in Crop Rotation
The use of crop rotation and crop selection can alleviate compacted conditions in soils. As notedabove, Angers et al. (1987) report significant improvements in aggregate strength andinteraggregate porosity after only 2 years of bromegrass following 12 years of continuous corn.

GENUINE PROGRESS INDEX Measuring Sustainable Development22
However, studies in Ontario show that most of the improvement gained from 3 years of growingforage on a silt loam is lost within a few months after returning to conventional-till cornproduction (Acton and Gregorich, 1995, Chapter 5). This indicates that we need better ways ofgrowing corn in addition to the forage rotation between corn crops.
We can calculate the cost of remediating the 1,800 ha of land in Nova Scotia in 1996 classifiedunder the ‘soils susceptible to compaction under management which causes compaction’category of the Risk of Compaction indicator. These soils could be removed from row cropproduction and planted to 2 years of a deep-rooted forage crop such as red clover to reducecompaction risk and restore soil structure and organic matter.
We can estimate that farmers growing grain corn on compacted soils have a net annual income of$72/ha (based on the figures in Table 5 and assuming a very conservative 10% lower yield due tocompaction).23 If the farmer grows a crop of hay for two years in an attempt to alleviate soilcompaction, he or she can expect to incur an annual average cost of $125.50/ha in forgonerevenues from lost grain corn production and the excess of expenses over revenues from redclover production. On a province-wide basis we can therefore calculate that the investmentrequired to remediate the 1,800 ha of soils under cropping systems which cause compaction in1996 would be approximately $451,800 over two years. Investing in Reduced Ground Pressure Systems Once the soil’s structure has been improved by a remedial measure such as a two-year period inred clover, the farmer can opt to eliminate the risk of compacting his or her soils again under rowcrop production by minimizing tillage and by using a reduced ground pressure system. Theeffects of these systems on crop yields, fertilizer use efficiency, and energy use during tillage arereported in the literature (Moerman, 1994). We can use this information to estimate the financialimpacts of converting a farm located on a soil with a high susceptibility to compaction to areduced ground pressure system (Table 8). The value of increased fertilizer use efficiency onnon-compacted soils is not included in Table 8 because it has not been monetized here. If it wereincluded, the savings in fertilizer costs would clearly show an even higher aggregate benefit tothe farmer remediating compacted soils. Therefore, switching to a reduced ground pressuresystem is clearly cost effective and will save the farmer money in reduced fuel costs and highercrop yields as soil quality improves.
This simple analysis shows that the added expense of purchasing dual tires for the tractor iscompensated for by a reduction in the fuel expenses required to cultivate non-compacted land.The differences in costs per hectare for the reduced ground pressure system compared to theconventional approach are negligible. Revenues from the non-compacted land can be higherbecause of the increased yield potential of the soil. If the 1,800 ha of land in Nova Scotia undercropping systems likely to cause compaction in 1996 were managed with reduced groundpressure systems, a net increase of $118,000 per year in farm revenues could be realized.
23 Although yield reductions on compacted soils for grain corn of up to 45% have been reported (Moerman 1994),we have used a conservative figure of 10% reductions in yield in this example.

GENUINE PROGRESS INDEX Measuring Sustainable Development23
Table 8: Selected Costs and Benefits to the Farmer of Using a Reduced Ground PressureSystem in Grain Corn Production
Cost/Benefits24 Compacted Soil,Conventional System
Non-compacted Soil, ReducedGround Pressure System
Tires (cost per year/ha)25 $2.76 $5.52Extra tire rims (cost per year/ha)26 - $1Fuel (for plowing, disking andharrowing, 2.2 hours/ha)27
37.2 L @ $0.60/L = $22.32 28.6 L @ $0.60/L = $17.16
Total Costs/ha $25.08 $23.68Yield 4.7 t/ha @ $132/t = $620 5.2 t/ha @ $132/t = $686Revenue Difference +$66/ha
Note: Assuming a 75 hp tractor using dual tires in the reduced ground pressure system and a 100 hp tractor for theconventional system; 60 hectares of grain corn under production.
Investing in Societal Benefits: Reduced Compaction = Reduced Greenhouse Gas Emissions We have already explained the direct economic benefits to farmers of good soil structure. Thebottom line is that crop yields will increase, while fertilizer and fuel bills will decrease.Conversely, there are direct costs incurred by the farmer when soils are compacted, includingdeclining crop yields, and increased fertilizer and fuel bills. But there are also societal (off-farm) costs associated with poor soil structure. It has beenreported that compact soils can lose over 20% of applied nitrogen due to denitrification(Moerman, 1994). Denitrification is the conversion of nitrate-N to nitrogen gas that occurs inoxygen-limited conditions. Denitrification occurs in the anaerobic portions of soil aggregates.Some denitrification is normal in all soils, but the reduced aeration and porosity of compact soilsexacerbates this phenomenon. Nitrogen lost due to denitrification enters the atmosphere asnitrogen gas and nitrous oxide, although it is difficult to estimate the relative proportions of thesegases.
Nitrous oxide has 310 times the reflective capacity of carbon dioxide, making it the most potent of thethree main greenhouse gases (carbon dioxide, methane, and nitrous oxide).
We used a conservative estimate for nitrous oxide emissions from fertilizer N applications of1.5%.28 If we assume that the 1,800 ha of soils susceptible to compaction in 1996 are receiving
24 Only costs which differ between systems are included here.25 Based on an average tire cost of $438 for a 30-inch rim (A-1 Tires, Truro, January 2001) with an expected tire lifeof five years.26 Based on a cost of $600 for extra tire rims on a 100 hp tractor with a useful life of 10 years (Cameron Equipment,Truro, January 2001).27 A 75 hp John Deere tractor has an optimum fuel consumption of 210 g/kWh compared to 203 g/kWh for a 100 hptractor (available from: http://www.deere.com/deerecom/_UK/Agricultural+Equipment/Tractors/6010+SE+-+75-115+hp/4+Cyl+Specifications/default.htm). Diesel fuel price $0.569/L (Co-op fuels, January 2001).
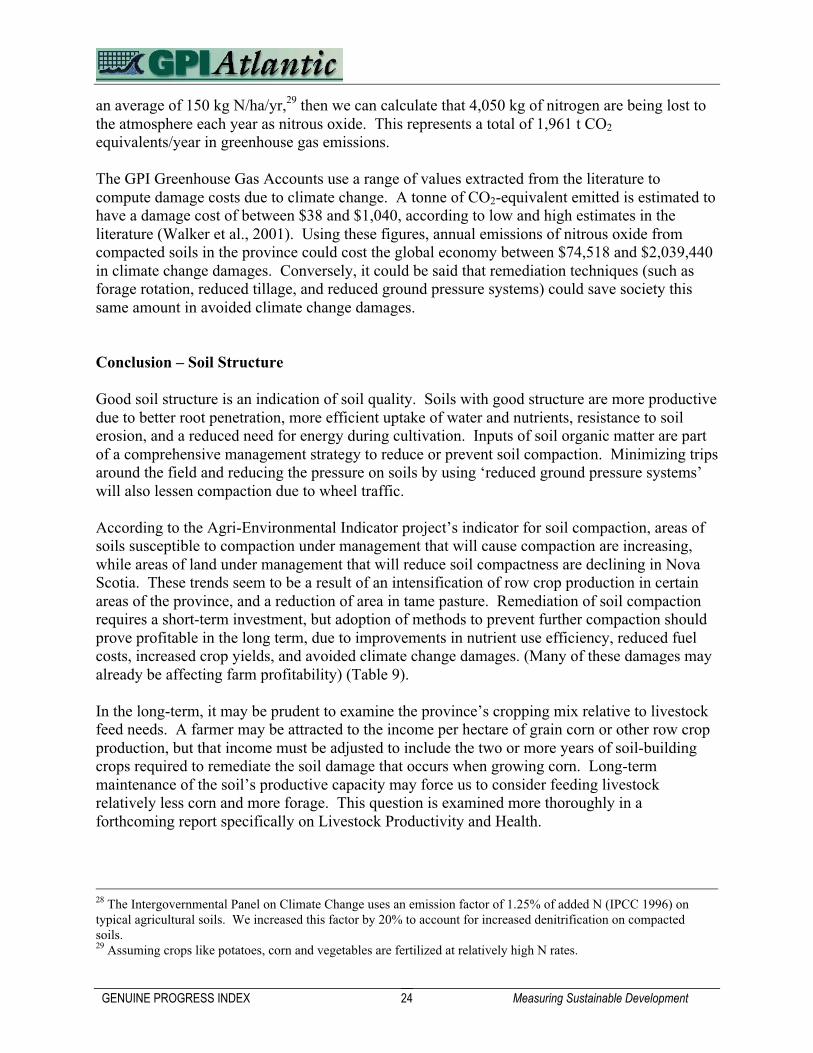
GENUINE PROGRESS INDEX Measuring Sustainable Development24
an average of 150 kg N/ha/yr,29 then we can calculate that 4,050 kg of nitrogen are being lost tothe atmosphere each year as nitrous oxide. This represents a total of 1,961 t CO2
equivalents/year in greenhouse gas emissions. The GPI Greenhouse Gas Accounts use a range of values extracted from the literature tocompute damage costs due to climate change. A tonne of CO2-equivalent emitted is estimated tohave a damage cost of between $38 and $1,040, according to low and high estimates in theliterature (Walker et al., 2001). Using these figures, annual emissions of nitrous oxide fromcompacted soils in the province could cost the global economy between $74,518 and $2,039,440in climate change damages. Conversely, it could be said that remediation techniques (such asforage rotation, reduced tillage, and reduced ground pressure systems) could save society thissame amount in avoided climate change damages.
Conclusion – Soil Structure
Good soil structure is an indication of soil quality. Soils with good structure are more productivedue to better root penetration, more efficient uptake of water and nutrients, resistance to soilerosion, and a reduced need for energy during cultivation. Inputs of soil organic matter are partof a comprehensive management strategy to reduce or prevent soil compaction. Minimizing tripsaround the field and reducing the pressure on soils by using ‘reduced ground pressure systems’will also lessen compaction due to wheel traffic.
According to the Agri-Environmental Indicator project’s indicator for soil compaction, areas ofsoils susceptible to compaction under management that will cause compaction are increasing,while areas of land under management that will reduce soil compactness are declining in NovaScotia. These trends seem to be a result of an intensification of row crop production in certainareas of the province, and a reduction of area in tame pasture. Remediation of soil compactionrequires a short-term investment, but adoption of methods to prevent further compaction shouldprove profitable in the long term, due to improvements in nutrient use efficiency, reduced fuelcosts, increased crop yields, and avoided climate change damages. (Many of these damages mayalready be affecting farm profitability) (Table 9).
In the long-term, it may be prudent to examine the province’s cropping mix relative to livestockfeed needs. A farmer may be attracted to the income per hectare of grain corn or other row cropproduction, but that income must be adjusted to include the two or more years of soil-buildingcrops required to remediate the soil damage that occurs when growing corn. Long-termmaintenance of the soil’s productive capacity may force us to consider feeding livestockrelatively less corn and more forage. This question is examined more thoroughly in aforthcoming report specifically on Livestock Productivity and Health.
28 The Intergovernmental Panel on Climate Change uses an emission factor of 1.25% of added N (IPCC 1996) ontypical agricultural soils. We increased this factor by 20% to account for increased denitrification on compactedsoils.29 Assuming crops like potatoes, corn and vegetables are fertilized at relatively high N rates.
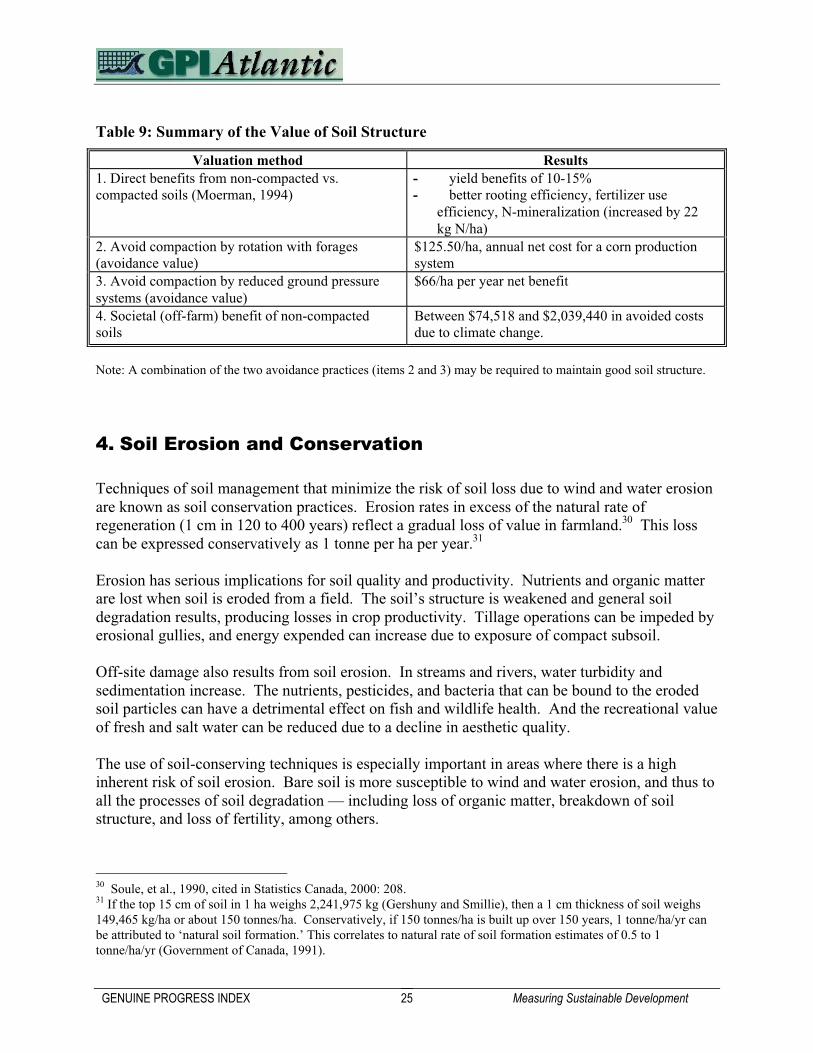
GENUINE PROGRESS INDEX Measuring Sustainable Development25
Table 9: Summary of the Value of Soil Structure
Valuation method Results1. Direct benefits from non-compacted vs.compacted soils (Moerman, 1994)
- yield benefits of 10-15%- better rooting efficiency, fertilizer use
efficiency, N-mineralization (increased by 22kg N/ha)
2. Avoid compaction by rotation with forages(avoidance value)
$125.50/ha, annual net cost for a corn productionsystem
3. Avoid compaction by reduced ground pressuresystems (avoidance value)
$66/ha per year net benefit
4. Societal (off-farm) benefit of non-compactedsoils
Between $74,518 and $2,039,440 in avoided costsdue to climate change.
Note: A combination of the two avoidance practices (items 2 and 3) may be required to maintain good soil structure.
4. Soil Erosion and Conservation
Techniques of soil management that minimize the risk of soil loss due to wind and water erosionare known as soil conservation practices. Erosion rates in excess of the natural rate ofregeneration (1 cm in 120 to 400 years) reflect a gradual loss of value in farmland.30 This losscan be expressed conservatively as 1 tonne per ha per year.31
Erosion has serious implications for soil quality and productivity. Nutrients and organic matterare lost when soil is eroded from a field. The soil’s structure is weakened and general soildegradation results, producing losses in crop productivity. Tillage operations can be impeded byerosional gullies, and energy expended can increase due to exposure of compact subsoil.
Off-site damage also results from soil erosion. In streams and rivers, water turbidity andsedimentation increase. The nutrients, pesticides, and bacteria that can be bound to the erodedsoil particles can have a detrimental effect on fish and wildlife health. And the recreational valueof fresh and salt water can be reduced due to a decline in aesthetic quality.
The use of soil-conserving techniques is especially important in areas where there is a highinherent risk of soil erosion. Bare soil is more susceptible to wind and water erosion, and thus toall the processes of soil degradation — including loss of organic matter, breakdown of soilstructure, and loss of fertility, among others.
30 Soule, et al., 1990, cited in Statistics Canada, 2000: 208.31 If the top 15 cm of soil in 1 ha weighs 2,241,975 kg (Gershuny and Smillie), then a 1 cm thickness of soil weighs149,465 kg/ha or about 150 tonnes/ha. Conservatively, if 150 tonnes/ha is built up over 150 years, 1 tonne/ha/yr canbe attributed to ‘natural soil formation.’ This correlates to natural rate of soil formation estimates of 0.5 to 1tonne/ha/yr (Government of Canada, 1991).

GENUINE PROGRESS INDEX Measuring Sustainable Development26
Table 10 shows the inherent risk of soil erosion on cultivated land in Nova Scotia. These figuresare related to the climate of Nova Scotia, soil type and topography. A large part of the cultivatedland in the province (84%) has a severe risk of water erosion because of the province’s highprecipitation and sloping topography.
Table 10: Inherent (Bare Soil) Risk of Water Erosion on Nova Scotia’s Cultivated Land
Risk Class % Cultivated Landnegligible 3low 6moderate 4high 3severe 84
Source: Acton and Gregorich, 1995
Strategies to reduce soil erosion include:• Organic matter maintenance and improvement. Soil organic matter is vital for the formation
of stable soil aggregates (see discussions of soil organic matter and structure above). Plantroots and microbes produce mucilage, which in effect ‘glues’ together soil mineral andorganic particles. The resulting improvement in soil structure decreases the soil’s erodibility.Erodibility is the soil’s susceptibility to detachment and transport by erosive agents(ECSWCC, 1993). Crop rotation and manure additions are two techniques used to increasesoil organic matter.
• Residue management. Management practices which leave 30% of crop residue or more onthe soil surface reduce soil erosion by obstructing overland flow, reducing the velocity of therunoff, and increasing water infiltration into the soil.
• Vegetative cover. Planting crops specifically to cover the soil during periods of high erosionrisk – (in Prince Edward Island 85% of the erosion occurs between October and the end ofApril) – can reduce soil loss significantly. Edwards and Barney (1987) report a reduction insoil loss of 1.8 t/ha (0.36 t/ha versus 2.16 t/ha) when soil loss from a cover crop of winter ryewas compared to bare soil.
• Strip cropping and terracing. Cropping the land across the longest slope in the field, ratherthan up and down the slope, can reduce soil erosion by as much as 75% (DeHaan 1994).
Measures of Soil Loss & Conservation
1) The Universal Soil Loss Equation (USLE)
If annual soil loss could be measured, it would be a direct way to assess the status of soilconservation in the province: As soil losses from agricultural land decrease, soil conservation, asa component of soil quality, would improve. Soil losses on agricultural land can be estimatedusing the Revised Universal Soil Loss Equation (RUSLE) (see box). Vegetative cover (C) andsoil management (P) are the two components of the RUSLE over which the farmer has control.

GENUINE PROGRESS INDEX Measuring Sustainable Development27
Incorporating some or all of the strategies outlined above, can reduce the C and P values, therebyreducing total soil loss per hectare. The RUSLE is the main method used by Agriculture andAgri-Food Canada scientists for estimating soil erosion at this time.32
The Universal Soil Loss Equation (USLE), A=RKLSCP, computes annual soil loss as a function ofrainfall (R), soil erodibility (K), slope length (L), slope gradient (S), vegetative cover (C), and soilmanagement (P). It can be used to estimate soil losses for a given piece of land under differentmanagement systems. The Revised USLE was released in 1992 with refined factor values generated fromimproved data and computer modeling. Agriculture Canada researchers have adapted RUSLE for use inCanadian conditions using climatic information on freeze-thaw cycles, rainfall on frozen ground andsnowmelt data. This has improved the predictability of winter soil losses.
2) Bare Soil Days
An indirect way to assess the current status of soil erosion and conservation is to count thenumber of days (on average) per year that a field has exposed bare soil. Ideally, if crop residuesare left on the soil surface, and if perennial crops and ‘cover crops’ are used, the number of ‘baresoil days’ will go down. Scientists at Agriculture and Agri-Food Canada have developed anindicator of Soil Cover by Crops and Residue that assesses how many days of the yearagricultural soils are left bare. They have tallied bare soil days based on typical croppingpractices and crop statistics. Table 11 shows the results of their analysis for each province inCanada.
Table 11: Average Number of Bare Soil Days, Canada and Provinces
Number of bare-soil days per hectare per yearProvince
Cropland area (’000 ha) 1981 1991 1996 % reduction from 1981
to 1996 British Columbia 566 45 37 34 25 Alberta 9,547 86 73 67 22
Saskatchewan 14,399 111 93 88 21
Manitoba 4,699 81 65 65 20 Ontario 3,545 113 110 96 16 Quebec 1,739 63 61 62 0
New Brunswick 135 66 59 57 14
Nova Scotia 112 50 35 34 31 Prince Edward Island 170 103 96 94 9
Newfoundland 7 43 25 24 44
Canada 34,919 98 83 78 20
Source: McRae et al., 2000
32 We will not cover the cesium activity method here.

GENUINE PROGRESS INDEX Measuring Sustainable Development28
The 31% reduction in Nova Scotia’s number of bare soil days per hectare per year isencouraging, as is the fact that Nova Scotia has the second lowest number of bare soil days perhectare of any province. But the impressive decline in bare soil days, and the low overall levelof bare soil days relative to other provinces are tempered by the fact that Nova Scotia has asevere ‘risk of water erosion’ rating as a result of this province’s particular rainfall patterns andtopography. Therefore, Nova Scotia should strive to have very low number of bare soil days,because it has the most precipitation of the Maritime provinces and thus the greatest potential forerosion by rainfall, snowmelt, and winter runoff. The target for this indicator should be to have asteady reduction in the number of bare soil days.
State of the Resource & Trends
Estimates of annual soil loss under row crop conditions are as high as 30 t/ha for continuouspotato rotations in Prince Edward Island (Edwards et al. 1995; 1996; 1998). Edwards et al.(1996) assessed soil erosion using actual field measurements on PEI. They found total annualsoil loss to be about 30 t/ha/yr (equivalent to about 2 large dump trucks full, per ha) for 2-yearpotato/grain rotations, and 20 t/ha/yr for a 3-year grain/hay/potato rotation. This level of soilloss represents the highest losses to be found on cultivated land in the Maritimes. Fox and Coote(1986) estimated that the average rate of soil erosion in the Maritime provinces is 3.3 t/percultivated hectare. In 1991, estimates of the rate of soil erosion were 6.3 t/per cultivated ha inNova Scotia, which is the lowest average rate in the Maritime provinces, but higher than theCanadian average of 4.3 t/cultivated ha (Statistics Canada, 1995).
The question, then, is what is a ‘tolerable’ level of soil erosion? Shelton et al (2000) considersoil erosion losses of less than 6 t/ha/yr to be ‘tolerable’, i.e. able to sustain long-term cropproduction. Losses of more than 6 t/ha/yr require the implementation of soil conservationstrategies. In 1991, Canadian government sources considered losses exceeding 5-10 t/ha/yr tohave the potential for long-term damage to farm productivity. But any soil loss beyond thenatural rate of soil formation (0.5 to 1.0 t/ha/yr) “will eventually reduce the quality of the soil”(Government of Canada, 1991), particularly in Nova Scotia where soils are relatively shallow tobegin with.
Acton and Gregorich (1995) present data on trends in the risk of water erosion on cropland inNova Scotia between 1981 and 1991. They found that water erosion risk as a result of croppingpractice increased by 3% during this period. Figure 4 shows that over the thirty-year periodbetween 1971 and 2001, the area of Nova Scotia cropland planted to potentially soil-degradingcrops such as corn and potatoes, increased by 24%. These are the areas most likely to experiencesoil loss due to water erosion if measures are not taken to protect them. Between 1981 and 1991, risk of water erosion resulting from tillage decreased by 3%. Thissuggests that farmers were adopting more soil-conserving tillage practices during this decade.The Census of Agriculture divides tillage systems into three categories: conventional,conservation and no-till. Conservation tillage is defined in the census as the use of fieldequipment designed to leave most of the crop residue on the surface, or the use of fewer passesthan with conventional cultivators. From a genuine progress perspective, the use of conservation

GENUINE PROGRESS INDEX Measuring Sustainable Development29
tillage techniques is desirable where they are appropriate. Conservation tillage is more difficultand less effective on heavy clay soils. No-till methods tend to be dependent on the use ofherbicides for weed control, which can lead to increased costs due to pollution, increased farminput use, and health risks for the farmer.
Table 12: Percentage of Farms in Nova Scotia Reporting Soil Conservation Practices
Practice 1991 1996 2001Crop rotation (using clover, alfalfa etc.) 28 29 31Winter cover crops 10 6 6Grassed waterways 7 5 7Strip cropping 2 3 3Contour cultivation 6 4 4Permanent grass cover - 38 40Windbreaks or shelterbelts - 6 7
Source: Statistics Canada, 2002; 1997a; 1993
Table 13: Summary of Methods for Assessing Soil Erosion and Conservation
Results available for Nova Scotia are marked with an asterisk.Methods of assessing
Soil Erosion &Conservation
Objectives Range of Values and Results
1. Rate of erosion (cm depthor t/ha) determined byRUSLE or cesium 137method.
- loss of no more than 1 t/ha annually (Governmentof Canada, 1991)- 6 t/ha/yr ‘tolerable’(Shelton et al., 2000)
- 30 t/ha potato/cereal rotation- 20 t/ha potato/cereal/hay rotation (Edwardset al., 1996)* Nova Scotia average in 1991 = 6.3 t percultivated ha (Statistics Canada, 1996)
2. Soil conservationpractices- leaving crop residue on soilsurface
As much as possible*Up from 8% to 20% of crop area (1991-2001)
- planting cover crops so thesoil is covered during highrisk periods
As much as possible
One study showed soil erosion reduced by83% (Edwards & Barney, 1987)*Down from 10% to 6% of crop area (1991-2001)
- strip cropping and terracingAs much as possible
Can reduce erosion by as much as 74%(DeHaan, 1994).* Approx. 4% of crop area (2001)
- use of windbreaks andshelterbelts
As much as possible* Approx. 7% of crop area (2001)
3. Number of bare soil daysper ha per year (McRae etal., 2000)
Decrease in number ofdays soil is bare
*The average number of bare soil days (perha, annually) has declined by 31% from 50 in1981 to 34 in 1996.

GENUINE PROGRESS INDEX Measuring Sustainable Development30
The amount of land in Nova Scotia prepared for seeding using conservation tillage methodsjumped from 7.8% in 1991 to 20.4% in 2001. This could partly account for the decrease in therisk of water erosion from tillage during that time period. In 1991 Statistics Canada began toinclude questions about soil conserving practices in the agricultural census. Table 12 shows theresults of this portion of the census for 1991, 1996, and 2001.
The use of most of these practices changed very little during the period from 1991-2001.Monitoring of trends in the use of soil conserving practices will indirectly provide an indicationof changes in soil quality over time.
A summary of methods for assessing soil erosion and conservation is presented in Table 13.Although the incidence of soil conservation practices is on the rise in some cases, soil erosionlevels are higher than both proposed objectives (item 1).
Benefits and Costs of Soil Conserving Practices
Value of Soil Conservation
The value of soil lost by erosion from cultivated land in the Maritimes, based on its nutrientcontent alone, can be estimated as $682,500 per year.33 This is a very conservative estimate,taking into account lost nutrients only. It does, however, show how important it is to prevent soilloss caused by erosion.
The benefits associated with preventing soil loss also include the avoidance of direct costs ofdeteriorating soil structure and costs associated with tillage of compact soil. Estimates of yield losses due to soil degradation on Nova Scotia farms in the 1980s showsignificant on-farm economic benefits associated with soil conservation. Areas with no soil lossdue to erosion have higher estimated yields (5-50%) relative to crops grown on eroded soils(Table 14) (Jacques, Whitford & Associates, 1995). Based on 1981 yield and crop acreages,Agriculture Canada (Fox and Coote, 1986) estimated yield losses and tillage expenses due towater erosion added up to $7 million per year ($9.5 million in $1997), with total on-farm lossesdue to soil degradation totaling $8.5 million ($11.5 million in $1997) (Table 15). Losses due totwo different potential rates of erosion were also calculated based on 1981 crop price andacreage (Jacques, Whitford & Associates, 1995). If erosion occurred on all crop land at anannual rate of 10 t/ha, farmers would lose $4.6 million34 in crop value. If erosion occurred on allcrop land at an annual rate of 25 t/ha, farmers would lose $27.8 million35 in crop value.
33 Based on a value of lost nutrients in $1994 of $3.25/t (DeHaan 1994) and an annual total soil loss from cultivatedland of 200,000 tonnes (Fox and Coote 1986).34 The original figure was $2.6 million, multiplied by 1.77 to convert $1981 to $1997.35 The original figure was $15.7 million, multiplied by 1.77 to convert $1981 to $1997. These figures are based onestimates that assume no compensating inputs or soil conservation practices are implemented.

GENUINE PROGRESS INDEX Measuring Sustainable Development31
While the annual cost of soil degradation on NS farms was estimated in 1986 to be $64 per ha ofimproved land, PEI farmers and New Brunswick potato farms were estimated to be losing $99and $332/ha due to soil degradation, respectively (Table 16). Since these estimates (the mostrecent available) are now 16 years out of date, newer estimates of the cost of soil degradation forpresent conditions are required.
Table 14: Relative Productivity (%) of Crops Affected by Soil Erosion Losses, NovaScotia36
Land UseNo erosion
(0t/ha)Medium potential soil
loss (17.5 t/ha)High potential soil
loss (25 t/ha)Crops highly affected by erosionGrain corn 100% 70 50Beans 100% 80 50Vegetables 100% 80 50Potatoes 100% 75 50Crops less affected by erosionSpring cereals 100% 76 60Strawberries 100% 80 70Crops least affected by erosionWinter cereals 100% 90 80Hay 100% 95 90Tree fruit 100% 90 85Pasture 100% 95 90
Source: Jacques, Whitford & Associates, 1985.
Table 15: Total Annual On-Farm Cost of Soil Degradation in Nova Scotia, 1981
Soil Degradation EffectEstimated On-Farm Cost37
($1986)Estimated On-Farm Cost
($1997)Water erosion 7,030,500 9,491,175Soil acidity 247,000 333,450Soil compaction 1,216,000 1,641,600Total costs 8,493,500 11,466,22538
Source: Fox and Coote, 1986.
36 The figures in this table are derived assuming no compensating inputs or soil conservation practices are beingimplemented.37 Due to yield loss and extra tillage expense.38 This figure is not necessarily the costs of soil degradation in 1997; rather it is the cost of soil degradation in 1986,presented in 1997 dollar value.

GENUINE PROGRESS INDEX Measuring Sustainable Development32
Table 16: Annual Cost of Soil Degradation Per Hectare of Improved Land (1986)
Area Watererosion($/ha)
Winderosion($/ha)
Soilacidity($/ha)
SoilCompaction
($/ha)
Total costs($1986/ha)
Total costs($1997/ha)
NS 39.5 0 1 7 47.5 64.1PEI 25 1 4 43 73 98.6NB potato belt 141 0 3 102 246 332.1
Source: Fox and Coote, 1986.
Investments in Soil Conservation
DeHaan (1994) provides economic details about several soil conserving practices now beingtested on Prince Edward Island farms. His results are used below to estimate the cost ofinvestments in soil conservation.
Hay Mulch
The spreading of hay on potato land after fall harvest is gaining popularity with farmers. Thehay mulch protects the soil surface from the impact of rainfall, slows down the rate of runofffrom the fields, and increases water infiltration into the soil. All of these effects reduce the netsoil loss from the field by a factor as high as 40x. Mulching costs have been estimated as $105 -$131/ha. If this practice had been adopted by all the potato farmers in Nova Scotia in 2001, thetotal defensive expenditure for this soil conserving practice would be $217,350 to $271,170 peryear.39 The practice would also be appropriate on lands in other degrading crops such as graincorn and vegetables. The total annual defensive expenditure for hay mulching on all of theselands in 2001 would range from $1.3 million to $1.6 million.40
Conservation Tillage The traditional method of land preparation for most row crops in Nova Scotia is to till using amoldboard plow in the fall, then spring disc twice, followed by harrowing. An alternativeconservation tillage method (in some areas, according to soil texture) might be to fall cultivateusing a chisel plow equipped with sweeps, or a set of tandem discs operated at a shallow depth,and then spring cultivate using a single pass with a chisel plow followed by a rear mounted spiketooth harrow.
According to our estimates, it should not be any more expensive to adopt conservation tillagetechniques from a labour or fuel perspective (Table 17), and these conservation methods maywell save money. When the long-term benefits to yields of healthy soil and erosion avoidanceare added, there is no doubt that conservation tillage is highly cost effective.
39 2001 potato area in NS: 2,070 ha40 2001 row crop area in NS: 12,291 ha

GENUINE PROGRESS INDEX Measuring Sustainable Development33
Initial investments for conservation tillage systems are also favourable. Purchase cost for a new,five-furrow moldboard plow would be approximately $11,000 while the equivalent sized chiselplow sells for approximately $7,550. Replacement parts for the moldboard (sheers, points,moldboards and coulters) could amount to $1,600 every five years, while a chisel plow shouldonly require about $660 in replacement parts over the same time period.41 Althoughconservation tillage is considered a ‘defensive’ measure to control soil erosion, in fact, it mayprove to be the most economical choice for the farmer, as well as effectively improving his orher soil quality.
Table 17: Cost Comparison of Conservation Tillage Methods vs. Conventional Tillage42
System OperationHours perHectare
LabourFuel and
LubeTotal
Conventional Plowing 1 $7.63 $17.44 $25.07Discing (2x) 0.8 $6.10 $13.95 $20.05Harrowing 0.4 $3.05 $6.98 $10.03
Total cost per ha $16.78 $38.37 $55.15Conservation Plowing (fall) 1 $7.63 $17.44 $25.07
Plowing andHarrowing(spring)
1 $7.63 $17.44 $25.07
Total cost per ha $15.26 $34.88 $50.14
Strip Cropping and Terracing (contour farming)
DeHaan (1994) also estimates the costs to implement strip cropping and terracing on slopingcropland. Depending on the crop rotation, topography and other agronomic practices being used,contour farming can cost from $0 to $525/ha to implement. Assuming an intermediate cost of$250/ha, if these practices were implemented on all of the cropland in Nova Scotia that is plantedto erosion-prone crops (i.e. row crops) in 2001, the total one-time defensive expenditure wouldbe $3.1 million.43
Conclusion – Soil Conservation Practices
The risk of soil erosion on cultivated land in Nova Scotia is high, due to the nature of our soilsand topography, coupled with the high rates of precipitation in the province. Maintaining soilorganic matter, reducing the speed of water movement over the land, and increasing waterinfiltration, can reduce soil erosion. This can be accomplished by incorporating forage crops intoa row crop rotation, applications of manure (both to increase SOM), as well as conservationtillage, using vegetative cover strips, and contour farming. Annual soil loss from row crops in
41 All prices quoted by MacLeods Farm Equipment, Truro, January 2001.42 Based on costs for tillage quoted in NSDAM Farm Management Fact Sheet for grain corn, 1991.43 2001 row crop area in NS: 12,291 ha

GENUINE PROGRESS INDEX Measuring Sustainable Development34
Nova Scotia may be as high as 30 t/ha, although average rates of soil loss on cultivated lands areestimated at 6.3 t/ha/yr.
The number of bare soil days in a year can be calculated to indicate progress towards reductionsin soil loss. The number of bare soil days has declined by 31% between 1981 and 1996 in NovaScotia. The area in row crops in Nova Scotia in recent years has increased, while soil conservingpractices such as the use of cover crops and conservation tillage are also on the increase.
The use of some soil conserving practices is clearly cost-effective for farmers (Table 18).Conservation tillage equipment is less expensive to purchase and maintain than conventionalequipment. The implementation of contour farming practices represents a one-time expense forthe farmer, which will pay off in the long term with improved soil quality. The expensesassociated with adopting soil conserving practices will be more than offset by the reductions indamage costs due to soil loss experienced directly by the farmer. The off-farm costs of erosionto other sectors (e.g. the Department of Transportation digging eroded soil from ditches, or theloss of stream quality due to sedimentation) will have to be included in future updates of thisreport.
Table 18: Summary of the Value of Soil Conservation
Results available for Nova Scotia are marked with an asterisk.Direct Value Results
1. Revenue and expense differences due toeroded soil in 1981 (Fox and Coote, 1986)
Yields 5-50% higher on non-eroded vs. eroded soils* $11.5 million annual farm losses due to eroded soil
2. Average annual cost of soil degradation (Foxand Coote, 1986) NS farms * $64/ha of improved land (crop and tame pasture) PEI farms $99/ha of improved land NB potato farms $332/ha of potato land
Indirect Value Results3. Nutrient replacement of eroded topsoil(compensatory value)
$682,500/year provincially
4. Increasing soil organic matter Incorporating both manure ($288/ha net benefit) andforages ($70/ha cost) into a rotation potentially has nonet cost.
5. Covering bare soil with hay mulch(avoidance value)
May reduce soil loss by as much as 40 times comparedwith bare soil, and costs $105-135/ha annually.* Covering all row crop area in NS would cost $1.6million.
6. Conservation tillage (avoidance value) Costs of conservation tillage are not different fromconventional tillage: no net cost.
7. Strip cropping and terracing (avoidancevalue)
Costs range from $0 to $525/ha to implement (a one-time cost). An estimated $3.1 million one-time cost forimplementation on all 2001 row crop land in NovaScotia.

GENUINE PROGRESS INDEX Measuring Sustainable Development35
5. Soil Foodweb Health
Soil foodweb analysis has been proposed as an indicator of soil quality. The soil foodweb is thecomplex mixture of bacteria, fungi, protozoa, nematodes and microarthropods, which control thecycling of nutrients within an ecosystem. Bacteria convert easily decomposable organic matteradditions into humus. Fungi convert more recalcitrant organic matter, such as lignin, intohumus. Protozoa feed on bacteria and release nutrients to the soil solution as a by-product of thisactivity. Nematodes and microarthropods consume both bacteria and fungi and also releasenutrients to the soil solution.
Elaine Ingham explains that: “The numbers, biomass, activity and community structure of theorganisms which comprise the soil foodweb can be used as indicators of ecosystem healthbecause these organisms perform critical processes and functions” (Ingham, 2000). In healthyecosystems, while nutrient cycling and productivity increases, nutrient loss is minimized. This ismade possible by the increasing complexity of the soil foodweb.
As soil organic matter is built up, soil organisms feed on it and decompose the complex organiccompounds to their mineral components. The living soil is a central part of soil fertility, becausethe activity of soil organisms renders available the elements in plant residues and organic debrisentering the soil. Part of this material, however, remains in the soil (humus) and contributes toits stabilization (Fleissbach et al., 2000).
A healthy soil foodweb has adequate populations of soil decomposers (bacteria and fungi) toretain nutrients within the soil. In agricultural systems it is in our best interest to promote ahealthy soil foodweb so that we can make the most efficient use of plant nutrients. When weminimize nutrient losses from the soil, we are saving dollars spent on purchased fertilizers. Wealso minimize off-site damage from lost nutrients, which can end up in groundwater. That, inturn, can produce health-related costs including nitrate toxicity, which particularly affects youngchildren and livestock. Nutrients that do not leach to the groundwater can be lost in surfacewaters. This form of pollution can result in eutrophication of inland and marine water, whicheventually decreases the productivity of the fishery. In short, preventing nutrient loss through ahealthy soil foodweb enhances productivity and avoids both fertilizer costs and water qualitydeterioration.
The soil foodweb structure can be disrupted by excessive pesticide or fertilizer use. When thefoodweb is out of balance, the soil’s ‘digestive system’ doesn’t work, decomposition rates arelow, nutrients are not retained by the soil, and losses of nutrients to groundwater and surfacewater can result. Changes in the foodweb structure also result from changes in surfacevegetation. For example, the foodweb in the soil of a healthy coniferous forest is very differentfrom the foodweb in a healthy garden soil. In each case, the balance of soil organisms hasevolved to reflect the needs of that particular ecosystem for nutrients. And in each case, lossesof nutrients from a healthy ecosystem are minimal.

GENUINE PROGRESS INDEX Measuring Sustainable Development36
Eutrophication is the accumulation of plant nutrients in surface water. These nutrients promote growthof aquatic plants that may not be desirable. Excess plant growth in water can deprive other aquatic life ofoxygen, adversely affecting respiration, growth, and reproduction. Light may also become limiting toplants growing below the algae. The prime culprits in promoting eutrophication are nitrogen (saltwatersystems) and phosphorous (freshwater systems).
Measures of Soil Foodweb Health
There are many ways to study soil organisms and relate the results to ecosystem health. Thebiomass and activity of both fungi and bacteria can be measured. The ratio of fungal to bacterialbiomass is a useful indicator of foodweb structure. Forest soils are typically dominated by fungiand have a fungal:bacterial biomass ratio (F:B) of greater than one. Fungi effectively decomposerecalcitrant organic matter producing secondary metabolites which make the soil more acidic.Most of the nitrogen in fungi-dominated soils is in the form of ammonium, which favours thegrowth of certain shrubs and most trees. Prairie grasslands tend to be dominated by bacteria(F:B<1). These soils are characterized by alkaline conditions and nitrate/nitrite as the dominantform of soil N. These conditions are beneficial for grasses and row crops.
Infertile agricultural soils in Nova Scotia are probably characterized by an excess of fungirelative to bacteria (F:B>1). Fungi tend to dominate in acidic soil conditions, typical of thePodzolic soils of this region.44 Soil acidity also becomes a problem when synthetic nitrogenfertilizers are used on crop land. The ammonium contained in commercial fertilizers isconverted to nitrate (nitrification) in the soil and hydrogen ions are released, contributing toacidification. In Nova Scotia, this acidification results in the constant need to lime agriculturalsoils. Acidic conditions decrease the productivity of agricultural soils because of problems suchas nutrient toxicities and reduced availability of certain essential plant nutrients, especiallyphosphorus.
Research has also shown that growing crops in rotation rather than as monocultures willdiscourage the proliferation of disease-causing fungi in agricultural soils. This has beenattributed to the increase in ecosystem diversity of land under rotation. Some spin-off benefitsinclude reductions in disease-causing fungi such as Fusarium and suppression of deleteriousrhizobacteria, which can build up under continuous cropping (Dick 1992).
In the soil quality index developed by Glover et al. (2000), several measures of soil foodwebhealth (biological activity) are used. In the top 15 cm of soil, they assess (in order ofimportance)
- soil organic carbon (t/ha);- the number of earthworms per m2;- microbial biomass carbon (kg/ha); and- microbial biomass nitrogen (kg/ha).
44 Forest podzolic soils of the region typically have pH values in the Bf or Bhf horizon of 4.3-5.1 (Webb et al. 1991).

GENUINE PROGRESS INDEX Measuring Sustainable Development37
Soils amended with composted manure or grass/legume residues have shown higher levels ofmicrobial biomass carbon than conventionally managed soils (Glover et al., 2000). InSwitzerland, researchers assessed microbial biomass carbon in treatments using compostedmanure and no synthetic fertilizer or pesticides. These treatments had 20-40% higher microbialbiomass compared to treatments fertilized with manure plus synthetic fertilizer and pesticides,and 60-85% higher microbial biomass compared to treatments with synthetic fertilizer andpesticides (Fleissbach et al., 2000). Earthworm density and biomass followed a similar trend,where treatments receiving composted manure and no synthetic pesticides had 30 to 80% higherearthworm density and biomass compared to treatments using synthetic fertilizer and pesticides(Fleissbach et al., 2000). Thus the use of manure and the reduction of synthetic fertilizer andpesticide use all contribute positively to soil biological activity.
Very little research has been done on soil foodweb analysis in Nova Scotia. Research intomicrobial activity (a component of soil foodweb analysis) is also scarce. In the early nineties,Cooper and Warman (1997) conducted an experiment in which they added either fresh orcomposted manure, or synthetic (NPK) fertilizer, to hayfields near Truro, every year for threeyears. Microbial activity was measured using the dehydrogenase enzyme activity assay.45 Ofthe two sites they used, the one with the lower soil organic carbon levels showed a biologicalresponse to organic matter additions; plots that had been amended with either manure or compostalways had higher dehydrogenase enzyme activity (microbial activity) than syntheticallyfertilized plots. This suggests that the microorganisms in the soil were stimulated by compost ormanure additions. Soil levels of plant-available nutrients and soil pH were also increased afteradditions of compost or manure. Since applications of animal manures are known to promote ahealthy microbial population, a measure of animal manure use has been selected as an indirectway to assess soil foodweb health.
Use of Manure and Synthetic Fertilizer
The use of manure, particularly composted manure, as a source of fertility stimulates soilbiological activity (Magdoff and vanEs, 2000). Synthetic fertilizer, on the other hand, only hasthe potential to stimulate microbial activity if it is used in combination with manure and carbon-rich crop residue additions. Table 19 shows the percentage of crop and pasture land fertilizedwith manure and synthetic fertilizer. About 33% of the area had manure applied, and about 62%had synthetic fertilizer applied in 2000. Synthetic fertilizer use has increased dramatically since1980 when it was used on only 24% of crop and tame pasture area. If this increase in area ofsynthetic fertilizer use is to replace manure use or soil-building crop rotation, then it could signala loss in soil foodweb health. At this point, there is insufficient evidence to know whether this ishappening. Nationally, 66% of farmed area had synthetic fertilizer applied to it, while only 7.5%had manure applied in 2000. Thus NS farms could be in a favourable position to enhance soilfoodweb health relative to Canadian farms as a whole.
45 Biological oxidation of organic compounds (decomposition) is generally a dehydrogenation process in whichdehydrogenase enzyme systems transfer hydrogen ions from organic compounds to acceptors. The dehydrogenaseenzyme assay is considered one of the best indicators of soil microbial activity because these enzymes only occurwithin living cells. The result of the dehydrogenase enzyme activity assay gives an approximation of the activity ofthe active microbial population in the soil.

GENUINE PROGRESS INDEX Measuring Sustainable Development38
Table 19: Area of Land with Manure or Synthetic Fertilizer Applied
Area of syntheticfertilizer use
Area of manure usePlace &Year
Total landfarmed46
(ha) % (ha) Total (%) Solid (%) Liquid (%)NS 2000 142,092 88,374 62.2 46,344 32.6 22 10NS 1995 136,068 88,552 65.1 45,529 33.5 25 9NS 1990 136,954 82,267 60.1 39,786 29.1 N/A N/ANS 1985 145,747 85,042 58.3 N/A N/A N/A N/ANS 1980 158,888 38,647 24.3 N/A N/A N/A N/ACanada 2000 36,395,198 24,014,813 66.0 2,715,289 7.5
Source: Statistics Canada, 2002; 1997a; 1993; 1987; 1982.
Livestock Concentration and Distribution
The application of organic amendments to agricultural soil is the primary method of ensuring ahealthy soil foodweb. Warman and Cooper (1994) found that a relatively low rate of compostedmanure application (about 2 t dry matter/ha) every year effectively increased biological activityrelative to unamended or synthetically fertilized treatments. They also found that after threeyears, forage yields from compost-only treatments were approaching yields in NPK fertilizedplots. We converted 2 t dry matter/ha/yr to manure animal units47 (MAU) to generate aminimum threshold level of 1.7 MAU/ha required to produce enough manure to maintain soilbiological activity.48 In 1996 sixteen of the eighteen counties in the province fell below the 1.7MAU/ha threshold level.49
Since manure often contains large amounts of water, transport can become costly. It isunrealistic to expect manure to be transported more than 10 km from the storage facility to thefield. For this reason, it is important for livestock operations to be interspersed with the croplandin the province. A county-by-county analysis of livestock concentration is used in this measureto address the issue of distribution of livestock around the province.
Additions of manure to the soil can be beneficial for soil life. If manure is applied at excessiverates, however, problems can result from pollution, due to leaching of nutrients and pathogens togroundwater, and run-off to surface water. The manure management guidelines for Nova Scotia(NSDAM, 1991) provide recommendations for minimum hectarage required for environmentallysafe manure application. These figures range from 5.1 MAU/ha for loam or clay soils, to 3.3
46 Crop land plus tame pasture.47 One manure animal unit (MAU) produces an amount of manure equivalent to one adult dairy or beef cow.48 Adult dairy cattle have been reported to produce 1195 kg dry manure per year. This figure was used to convertthe 2 t dry matter/ha per year necessary for soil biological activity maintenance, to a minimum MAU value of 1.7MAU/ha.49 Based on data from the 1996 Census of Agriculture: total MAU divided by land in crops plus improved pasture.

GENUINE PROGRESS INDEX Measuring Sustainable Development39
MAU/ha for sandy soils. We have therefore set the optimum range for livestock concentration at1.7 - 3.3 MAU/ha. The lower end of the range represents the minimum number of animalsrequired to promote a healthy soil foodweb. The upper end of the range is a conservative figureto ensure that environmental damage from excessive rates of manure application does not occur.We also assume that nutrient management planning principles are used on individual farms todetermine manure application rates and further safeguard against pollution. The target for thisindicator is to have all the counties in Nova Scotia fall within the optimum range for livestocknumbers relative to cropland (land in crops plus improved pasture).
State of the Resource & Trends
The results of the county-by-county analysis of livestock distribution in Nova Scotia in 2001 areshown in Table 20. Only 11% of the counties in Nova Scotia (2 out of 18) have a livestockconcentration within the desirable range (1.7 – 3.3 MAU/ha) for promotion of a healthy soilfoodweb through manure additions. Digby county has the highest concentration of livestockrelative to cultivated land (2.5 MAU/ha). This is due to the emphasis on mink production in thisregion, and the comparative lack of crop farming in the area. Shelburne and Yarmouth countiesalso have relatively high MAU/ha (1.5 and 1.8 respectively), not because there are highconcentrations of livestock in these regions, but because arable farmland is limited in thesecounties.
The province-wide figure for MAU per hectare of cropland is 0.87, which indicates that even iflivestock were evenly distributed throughout the province, there would not be enough manureproduction to provide a moderate rate of manure application of just 2 t dry matter/ha/yr. Thisanalysis shows that promotion of a healthy soil foodweb through manure additions alone may notbe a realistic goal unless overall livestock numbers are increased and distribution is improved.
Table 20: Manure Animal Units (MAU) in Nova Scotia Counties, 1991,1996
Number of Counties in NS with…Year
>3.3 MAU/ha 1.7 – 3.3 MAU/ha <1.7 MAU/ha1996 0 2 161991 1 0 17
Source: Statistics Canada, 1997a; 1992
Nova Scotia has a high rate of manure use on cultivated land compared to the other Canadianprovinces. Dumanski et al. (1994) compiled data on manure use from the 1991 Census ofAgriculture. They found that 70% of farms in Nova Scotia report use of manure compared to theCanadian average of 42%. A total of 37% of cultivated land in Nova Scotia received manure in1991, which was a higher percentage than all the other provinces except Newfoundland. Farmswith dairy cattle are most likely to use manure on cropland. These farms house their cattleindoors for a significant percentage of the time so that manure collection is feasible. Dairy farmsalso usually produce a large portion of their own feed, particularly forage, providing aconvenient crop for manure application.

GENUINE PROGRESS INDEX Measuring Sustainable Development40
There have not been enough livestock raised in the province between 1971 and 1996 to produceadequate manure for all of the crop and tame pasture land (Figure 7). The dramatic drop inlivestock relative to cultivated land between 1971 and 1976 reflects a drop in numbers of cowsrecorded by Statistics Canada from 77,896 in the 1971 census to 66,961 in the 1976 census.Meanwhile, the number of pigs in the province has increased by 78% since 1976 and poultrynumbers have also gone up by 16% in that time period, which may explain the gradual upwardtrend in MAU/ha between 1976 and 1996 (Statistics Canada, 1997a; 1992; 1987; 1982; 1978;1973).
Figure 7: Manure Animal Units (MAU) per ha, Nova Scotia Farms, 1971-1996
0.00
0.50
1.00
1.50
2.00
2.50
3.00
3.50
1970 1975 1980 1985 1990 1995
Year
MAU/ha
desirable range: 1.7 - 3.3 MAU/ha
Note: The trendline is indicated by a straight thin black line on the figure.
Source: Statistics Canada, 1997a; 1992; 1987; 1982; 1978; 1973).
Table 21 summarizes the proposed assessment methods for soil foodweb health along withobjectives, ranges, and (where possible) results.

GENUINE PROGRESS INDEX Measuring Sustainable Development41
Table 21: Summary of Soil Foodweb Health Assessment Methods
Results available for Nova Scotia are marked with an asterisk.Methods to Assess
Soil Foodweb HealthObjectives Range of Values and Results
1. Ratio of fungal to bacterialbiomass (F:B)
F:B ratios of less than 1.0 Forest soils: F;B >1.0Prairie grassland soils: F:B<1.0
2. Soil organic carbon See section on soilorganic matter
3. Number of earthworms per m2
(top 15 cm of soil)Higher values are better 0-200/m2 (Glover et al.,2000)
4. Microbial biomass carbon(kg/ha, top 15 cm of soil)
Higher values are better 0-375 kg/ha (Glover et al.,2000)111-1760 kg/ha (Carter et al., 1998)226-474 kg/ha (Patriquin et al.,1986)
5. Microbial biomass nitrogen(kg/ha, top 15 cm of soil)
Higher values are better 0-100 kg/ha (Glover et al., 2000)
6. Area fertilized with manure vs.synthetic fertilizer
More manure vs.synthetic fertilizer
*32% of crop and tame pasture land inNS was fertilized with manure in 2000*62% of crop and tame pasture land inNS had synthetic fertilizer applications in2000
7. Livestock concentration anddistribution
1.7 to 3.3 manure animalunits (MAU)/ha
*2 NS counties have MAU concentrationin the desirable range. *Province-wide,the concentration is 0.87 MAU/ha, whichis low
Values and Investments Associated with Soil Foodweb Health
Quantity of Soil Micro-organisms
Soil microorganisms perform a variety of ecosystem services that are valuable for society. Theseservices include:• nutrient cycling – conversion of nutrients from organic residues into plant available forms
ready for plant uptake.• pesticide degradation – conversion of active ingredients in pesticides into less harmful
products, and their eventual conversion into CO2 and water• pollution control – conversion of labile plant nutrients such as nitrate and phosphate, into
more stable organic forms• carbon storage – formation of stable humus from organic residues.• nitrogen fixation – fixation of 140 to 170 million tonnes of N each year in agricultural and
natural systems by free-living and symbiotic microorganisms• pathogen control – neutralization of disease organisms that could attack crops; control of
disease organisms found in animal wastes applied to agricultural land Estimates of soil biomass carbon (an estimate of microbial biomass) on cultivated lands rangefrom figures of 111 kg C/ha (Carter et al., 1998) in moldboard plowed soils in Prince EdwardIsland, to 1760 kg C/ha in the surface soil of no-till wheat fields in Idaho. Patriquin et al. (1986)

GENUINE PROGRESS INDEX Measuring Sustainable Development42
reported a range from 226 to 474 kg biomass C/ha for cultivated fields on a farm under transitionto organic production in the Annapolis Valley of Nova Scotia. If we take a conservative view,we can assume that there are at least 100 kg C/ha of soil microorganisms in Nova Scotia’scropland. This amounts to a total weight of soil microbial carbon on cropland in Nova Scotia in2001 of 11.9 million kilograms.50
It is nearly impossible to place a dollar value on the range of services provided by soilmicroorganisms. We can look at yield differences between fields with healthy microbialpopulations and fields with dysfunctional soil foodwebs, to make a rough estimate of microbialvalue. Continuous monoculturing of a single crop species typically results in a reduction in cropyields compared to the same species in rotation, and these reductions are not usually associatedwith fertility or pest interactions. Deleterious rhizobacteria – which lessen plant vigour, reduceroot length, and increase susceptibility to disease – may build up under continuous cropping.The ‘rotation effect’ is the enhancement of crop yields in rotation systems thought to be due tothe suppression of these rhizobacteria. Turco et al. (1990) studied the rotation effect in corncrops and found that yield increases of approximately 10% could be attributed to thisphenomenon. We can use the 10% figure to estimate the corn yield benefits derived from a healthy soilmicrobial population. Ten percent of the yield of a corn crop in Nova Scotia is worthapproximately $53/ha.51 If each hectare of cropland contains 100 kg of biomass C, then eachkilogram of microbial biomass can be valued at approximately $0.50. Using this figure, the totalvalue of the microbial biomass C on all the cropland in Nova Scotia can be estimated as $6.0million per year.52
Another way to calculate the value of soil microorganisms is to consider the loss of croprevenues that would result if the soil foodweb were not healthy. If we assume that 10% of cropyield is due to a healthy soil foodweb, then a ten per cent reduction in crop receipts would resultif soil microbial populations suddenly died out. This loss of crop receipts in 1999 would total$14.0 million.53
Avoidance Expenditures
Manure Application Costs Farmers who spread their own livestock’s manure on their land incur some expenses associatedwith this operation. If the manure is not supplying all of the crop’s fertilizer needs then we canassume that manure spreading is an additional field operation, on top of synthetic fertilizerspreading. In this scenario, the cost of manure spreading is assumed to be $10/ha.54 But even at 50 Based on a figure for land in crops in 2001 of 119,219 ha.51 Based on an average grain corn yield of 4 t/ha and a corn value of $132/t ( Price estimate, R. Corey, PioneerOrganics, January, 2001).52 100 kg biomass C/ha cropland @ $0.50/kg * 119,219 ha cropland = $7,104.600.53 Total crop receipts in 1999 for Nova Scotia farms totaled $142,763,000 (Statistics Canada Agriculture EconomicStatistics. Cat. No. 21-603-UPE). $142,763,000 * 0.10 = 14,276,300 * 0.977 to convert to $1997.54 Using the figure for plowing costs from NSDAM Farm Management Fact Sheets (1991).

GENUINE PROGRESS INDEX Measuring Sustainable Development43
this low rate of application (2 t dry matter/ha), there is a fertilizer contribution from the manure,which totals approximately $26/ha55 (van Roestel, 1995). If farmers reduce their fertilizer usageto compensate for the nutrients provided by the manure, then they should not be incurring a netcost from this operation.
For farmers who do not own livestock, using manure to promote a healthy soil foodweb becomesmore expensive. They must locate a manure source within a reasonable distance from their landand transport the manure back to their farm. In many cases there will be no charge for themanure since it is considered a waste product by farmers who do not grow crops (some minkfarmers for example). It is not realistic to expect farmers to drive more than 10 km to pick upmanure to spread on their land. A trip of this distance would add an additional $8.50/ha to thecost of manure spreading,56 making the practice still profitable when manure nutrients are takeninto consideration. It seems that using a local source of manure as a soil amendment for farmersis an economical approach to maintaining a healthy soil foodweb.
Forage in Rotation Costs
In many cases there is no manure available to farmers within a distance that makes transporteconomical. We have already discussed the overall shortage of livestock in the province relativeto the numbers necessary to supply adequate manure for healthy soil foodweb maintenance. Theuse of perennial forages in rotation is another approach to soil foodweb maintenance for farmersin areas with intensive cash crop production. In the section on Soil Organic Matter weinvestigated the costs associated with incorporating forage crops into a cash crop rotation. Acash crop grain farmer would lose an average of $70/ha/yr by converting a four-year cornmonoculture system to a two-years-corn, two-years-forage rotation. This example illustrates how our current system of accounting in agriculture undervalues thecontributions of practices such as crop rotation to the maintenance of soil quality. Since forages,which are a vital component of a soil health program, are not as profitable to produce as manycash crops, the farmer has to incur an avoidance expenditure, in order to ensure the long termproductivity and health of his or her soil. With the chronic narrow economic margins farmersare faced with, investing in soil health may not be an option. On the other hand, long-term soildegradation and lack of a healthy soil foodweb may reduce soil productivity to the point wherelosses become increasingly common.
55 Based on 4 t solid manure per hectare (50% dry matter) with a total N-P-K value of 20 kg N/ha, 12 kg P2O5/haand 23 kg K2O/ha, assuming availabilities in the first year of 50%, 40% and 90% respectively. Priced at $1/kg N,$1/kg P2O5, and $0.60/kg K2O (Truro Agromart, January 2001).56 Assuming an 8,000 L spreader and an hour for the round trip to pick up the manure. Fuel costs for the trip wouldbe $9 plus $8 labour.

GENUINE PROGRESS INDEX Measuring Sustainable Development44
Table 22: Summary of Foodweb Health Values
Results available for Nova Scotia are marked with an asterisk.
Valuation method Value Net result
1. Microbial biomass carbon yieldeffect (direct value)
$0.50/kg of microbial biomassC
*$6.0 million per year for allcrop land, 2001
2. Microbial biomass – yield effect(direct value)
10% of crop value lost ifmicrobial biomass is degraded
*$14.0 million ($10% of cropreceipts for 1999) per year.
3. Application of livestock manureat 2t dry matter per ha (avoidancevalue)
$10/ha to spread, $26/ha innutrient benefit
*No net cost
4. Incorporating forage into thecropping rotation (avoidance value)
See SOM section *$70.00/ha per year in lostincome multiplied by 119,219 hacrop land = $8.3 million annually
Conclusion – Soil Foodweb Health
Soil foodweb analysis is a relatively new approach to describing soil health. The biomass ratiosof the different types of soil microorganisms can be used to indicate the suitability of the soil forforestry, perennial forages, or cultivated crops. Infertile soils in Nova Scotia tend to have a lowpH and a high fungal to bacterial biomass. These soils would benefit from increased bacterialnumbers. This can be promoted by mixing organic residues into the soil, and by periodic tillage. Calculating the concentration and distribution of livestock relative to cultivated land can providean indication of the status of soil foodweb health. Ideally, this indicator should fall within therange of 1.7 to 3.3 manure animal units (MAU)/ha. Analysis on a county-by-county basis in1996 showed that only two of the counties in Nova Scotia fell within the optimum range, andmost counties had too few manure animal units to sustain a healthy soil foodweb by manureapplication alone. Average numbers of livestock in the province relative to cultivated land havebeen below the target level of 1.7 MAU/ha since the early 1970s. The value of a healthy soil foodweb is very difficult to quantify. Soil microorganisms perform avariety of ecosystem services including nutrient cycling, fixation and retention, purification ofwaste products, and detoxification of pesticides and chemicals, to name a few. The rotationeffect is one benefit attributed to a healthy soil foodweb. We can estimate that crop yields onland with a healthy soil microbial population are 10% higher than yields on land with poor soilhealth because of the competitive interactions between a diversity of soil microorganisms whichprevent the proliferation of deleterious rhizobacteria. Costs to maintain a healthy soil foodweb by applying manure annually should be low if a manuresource is locally available. Using perennial forages in a crop rotation when manure is notavailable will benefit the cash crop farmer through reductions in disease and pest problems,

GENUINE PROGRESS INDEX Measuring Sustainable Development45
reduced fertilizer costs, and the maintenance of sustained yields of valuable crops. The currentsystem of accounting does not place adequate value on soil quality – our natural wealth – or onperennial forage crops, which can maintain and enhance soil quality. This makes such foragecrops appear to be an uneconomical approach to soil foodweb maintenance in the short term. Ifour natural wealth were properly and fully valued for the benefits it provides to society at large,there would be financial incentives to support such investments.
An ecological dairy farmer’s thoughts on soil quality, by Ted Zettel, Ecological Farmers Association ofOntario“My own farm and many others managed [ecologically], achieve yields in line with the county averages.What is really encouraging is that our most precious resource, the soil, continues to improve. In the firstfive years after my transition, potash and phosphorous levels rose in every field, with [significant annualincreases in] organic matter…. The improved soil condition is visible without analysis too. Earthwormsabound, our land drains better in wet periods and holds onto water more effectively during drought. Thesoil structure is superior, making it easier to work and more productive. I have helped many otherfarmers to go this route in the last few years and I am convinced that what we’re doing will work on anyfarm where the farmer wants it to. We live in a world of increasing consumption and diminishingresources. It doesn’t take a scholar to figure out that farms which make the best use of their own internalresources will be better equipped to respond to a changing, challenging world.”
6. Long-term Soil Quality and Productivity Studies
Most of the discussion in the previous sections assumes a short time-frame for benefits and costsof maintaining soil quality and productivity. In this section, a number of multiple-year studiesare reviewed to assess the long-term effects of soil management. The longest-running studyreported here is 122 years in duration, and the shortest studies are 10 years. They are presentedin order of the study length.
Long-term field studies (of ten or more consecutive years) indicate the value of organic matter tolong term productivity, and the increasing costs over time of allowing a soil to become degraded.Since soils differ considerably in their inherent ability to withstand practices such as continuouscropping, it is necessary to interpret studies and trends based on indicators of one soil relative toitself, rather than relative to another soil. Also, studies of soil quality and productivity based inthe fertile midwest of Canada and the US, or in certain areas of the UK would not apply directlyto Nova Scotian farm land. Many soils in Nova Scotia are inherently shallower, more acid, andmore easily degraded than the soils studied in some of the reports summarized below. Keepingthis in mind, the long-term studies are nevertheless instructive, as they demonstrate that pushinga soil too hard does have ramifications in the future.
The studies reviewed here measure some indicators of soil quality and productivity, such as soilorganic matter (organic carbon) levels, bulk density (a measure of soil structure), soil erosion,and soil foodweb health. A summary of soil quality and productivity indicators, their measures,and proposed objectives are presented in Table 23 for reference when discussing study results.

GENUINE PROGRESS INDEX Measuring Sustainable Development46
Table 23: Summary of Soil Quality and Productivity Indicators
Indicator Measure Objective% soil organic matter by weight 3.8%% soil organic carbon by weight 2.2%t SOC / ha
Soil organicmatter (SOM)or soil organiccarbon (SOC) (SOM= SOC * 1.7)
No net loss over time, in some cases netgain may be necessary
Bulk density (g/cm3) Lower values are betterSoil aggregate stability (various units) Higher values are better
Soil structure
Porosity (%) Optimum values of about 50% are betterthan too little or too much
Rate of erosion (tonnes/ha) Less than 1 t/ha per year (the natural rateof regeneration). 6 t/ha is considered tobe ‘tolerable’
Soil erosion
Topsoil depth No net loss, prefer gain.Ratio of fungal to bacterial biomass (F:B) F:B<1.0Soil organic matter or carbon (SOM, SOC) See SOM aboveNumber of earthworms per m2 (top 15 cmof soil)
Higher values are better
Microbial biomass carbon (kg/ha, top 15cm of soil)
Higher values are better
Soil foodwebhealth
Microbial biomass nitrogen (kg/ha, top 15cm of soil)
Higher values are better
The effect of long-term applications of farm yard manure (FYM) on soil physical properties inthe UK is reported by Rose (1991). Table 24 summarizes the data from this review. Long-termFYM applications increased soil organic C and total porosity (another positive indicator of soilquality) while decreasing soil bulk density, relative to soils receiving no FYM. The increase inporosity indicates that there is more space for air and plant-available water in the soil, which canreduce the negative effects of drought on crops.

GENUINE PROGRESS INDEX Measuring Sustainable Development47
Table 24: Effect of Long Term FYM Applications on Soil Physical Properties, UK
Location CropLengthof trial
(yr)
Soiltexture
Annual FYMaddition
(t/ha)
Bulkdensity(g/cm3)
SOC(%)
SOM(%)
Treatmentdifference
in SOC(%)
31.36 1.033 2.23 3.79 + 223%Barnfield(Rothamstead)
Man-golds
122 SCL0 1.104 0.69 1.1731.36 0.969 3.12 5.30 + 259%Broadbalk
(Rothamstead)Wheat 122 Clay
loam 0 1.050 0.87 1.4831.36 0.949 3.52 5.98 + 254%Hoos
(Rothamstead)Barley 113 SCL
0 1.041 1.02 1.7313.44 1.081 3.06 5.20 + 103%Saxmundham Wheat 67 Clay
loam 0 1.098 1.51 2.5760.48 1.032 3.39 5.76 + 176%Wellbourne Vege-
tables13 Sandy
loam 0 1.064 1.63 2.7767.2 1.006 3.03 5.15 + 66%Woburn
(Lansome)Vege-tables
24 Sandyloam 0 1.037 1.83 3.11
Note: SOM is determined by multiplying SOC by 1.7. SCL = Silty Clay Loam
Source: from Rose (1991)
At the University of Missouri, the effects of 100 years of cultivation were evaluated (Anderson etal., 1990). Twelve treatments were compared.
Cropping treatments included5. Continuous cropping of wheat (Wheat)6. Continuous cropping of corn (Corn)7. Continuous timothy (Timothy)8. Rotation of corn, wheat, and red clover (Rotation)
Fertilization treatments included• No fertility additions (U)• Annual synthetic fertilization with NPK according to soil test recommendations (F)• Annual additions of 13.5 t/ha of manure (M)
Soil organic matter (SOM) and pH of soils in the manured treatments were higher and bulkdensity was lower than those in the unfertilized or synthetically fertilized treatments (Table 25).Bulk density of manured plots was signficantly lower than unmanured plots. Only the soil in themanured timothy treatment maintained a SOM level above 3.8%.

GENUINE PROGRESS INDEX Measuring Sustainable Development48
Table 25: Soil Organic Matter, Bulk Density, and pH After 100 Years
Treatment SOM (%) Bulk density (g/cm3) pHWheat - U 1.45 1.45 4.5Wheat - F 2.18 1.25 4.8Wheat - M 2.70 1.15 5.7Corn - U 0.90 1.20 4.5Corn - F 1.90 1.13 5.4Corn - M 2.48 1.13 6.3Timothy - U 2.45 1.24 5.0Timothy - F 2.38 1.34 5.6Timothy - M 4.03 1.18 6.2Rotation - U 2.05 1.32 5.2Rotation - F 2.50 1.28 5.0Rotation - M 3.23 1.27 5.7
Source: Anderson et al., 1990
The authors observed that plots with corn had much higher clay contents compared to the othertreatments, primarily because of topsoil erosion and the subsequent mixing of higher clay contentmaterial with the remaining topsoil. Except for the corn treatments, manured plots had thehighest water content at saturation. This was attributed to higher organic matter contents andslightly lower bulk densities present in manured plots.
Although the use of synthetic fertilizers did not directly add as much organic matter to the soil,its beneficial effects in promoting better plant growth and, thus, more residue, caused thefertilized treatment not to be significantly different from that of manuring for the soil propertiesmonitored.
One long-term experiment that did show significant differences between manured andsynthetically fertilized treatments took place at the Nappan Experimental Research Station inNova Scotia (Papadopoulos et al., 1991). The effects of 64 years of various fertility strategies onforage dry matter (DM) yield were evaluated on dykeland soil.
The three treatments included in the experiment were:• No fertilizer• 18 t manure/ha every 4 years (for the first 41 years); 45 t manure/ha every 2 years (for years
42-64)• synthetic fertilizer (36 kg/ha N, 11 kg/ha P) applied annually until year 42 when rates were
increased to 153 kg/ha N, 25 kg/ha P, and one of four levels of K (0-282 kg/ha).
As expected, the application of manure and synthetic fertilizer substantially increased forageyields over the no fertilizer treatment. Over the 64-year period, a gradual decline in yieldoccurred with the synthetic fertilizer treatment (despite the increase in nutrients applied afteryear 41). A gradual increase in yield occurred with the manure treatment. The authors suggestthis is a result of the depletion of nutrients not included in the synthetic fertilizer, and reduced pHassociated with the use of synthetic N.

GENUINE PROGRESS INDEX Measuring Sustainable Development49
The highest average yields were obtained with synthetic fertilizer treatment. However, yieldsfrom manured areas were about the same as yields from areas treated with synthetic fertilizer by1989, with manure plots’ yield increasing thereafter, and synthetically fertilized treatmentsdeclining in yield thereafter. The manured plots had the lowest year-to-year fluctuation in yield(Table 26).
Table 26: Coefficient of Variation (CV) of Yield Data
% CVTime period Manure
treatmentSynthetic fertilizer
treatmentNo fertilization
treatment1921-61 17.8 n/a 22.01966-89 9.6 15.3 35.1
Source: Papadopoulos et al., 1991
Soil organic matter levels were higher in manure and synthetic fertilizer treatments relative tounfertilized treatments. They were highest in the manured treatment, but not significantly so.
The authors note that “it appears that the application of commercial mineral fertilizer had apositive effect on yield but it also increased the removal of nutrients from the soil….[Otherstudies show that] when high rates of mineral fertilizer were applied to forage fields, themicronutrient content of the forage tissue and soil were not depleted in the short term (10 years).However, their data suggest that the continued removal of many micronutrients may lead to theappearance of deficiency symptoms in the long term.”
The long-term increase in yield on the manure treatment is probably due to two factors,according to the study’s authors. First, manure applications provide a wider range of nutrientsthan synthetic fertilizer, and second, manure applications increase soil organic matter content,which is likely to have beneficial effects on soil structure, nutrient holding capacity, and possiblymicrobial activity.
In Alberta, long term evaluations of wheat production on a Gray Luvisol loam indicate thebenefits of crop rotation and manure applications over 61 years (Monreal et al., 1995). Thestudy authors used the Cesium 137 (137Cs) method to estimate soil erosion losses and topsoilthickness over the 61 years. The treatments, average yields, and soil properties measured in1990, are reported in Table 27.
The effect of the rotation is interesting in this case. The 5-year rotation reduced soil loss by 53%relative to the 2-year rotation.
In the wheat/fallow experiment, adding manure reduced soil loss by 47% relative to non-manured control treatment, possibly because of additional soil organic matter and increasedcrop/root growth. The additional straw and root mass left in the field would have beneficialeffects. In the 5-year rotation, adding manure decreased soil loss by 77% relative to non-
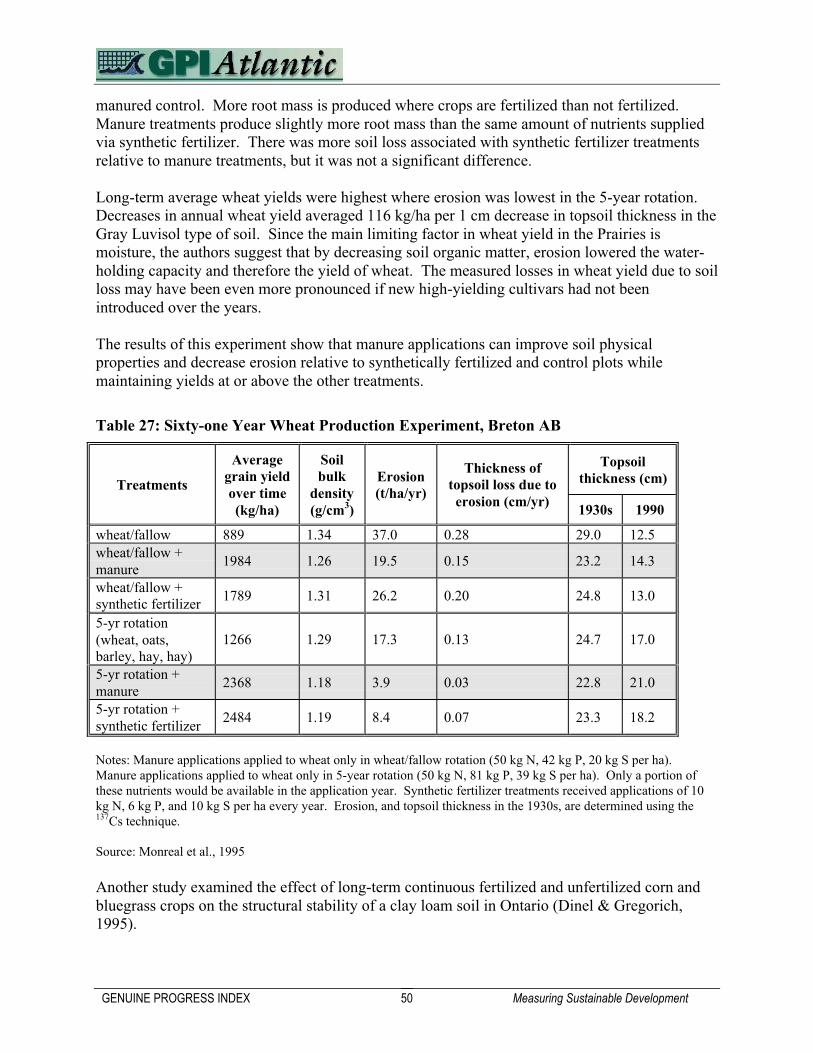
GENUINE PROGRESS INDEX Measuring Sustainable Development50
manured control. More root mass is produced where crops are fertilized than not fertilized.Manure treatments produce slightly more root mass than the same amount of nutrients suppliedvia synthetic fertilizer. There was more soil loss associated with synthetic fertilizer treatmentsrelative to manure treatments, but it was not a significant difference.
Long-term average wheat yields were highest where erosion was lowest in the 5-year rotation.Decreases in annual wheat yield averaged 116 kg/ha per 1 cm decrease in topsoil thickness in theGray Luvisol type of soil. Since the main limiting factor in wheat yield in the Prairies ismoisture, the authors suggest that by decreasing soil organic matter, erosion lowered the water-holding capacity and therefore the yield of wheat. The measured losses in wheat yield due to soilloss may have been even more pronounced if new high-yielding cultivars had not beenintroduced over the years.
The results of this experiment show that manure applications can improve soil physicalproperties and decrease erosion relative to synthetically fertilized and control plots whilemaintaining yields at or above the other treatments.
Table 27: Sixty-one Year Wheat Production Experiment, Breton AB
Topsoilthickness (cm)Treatments
Averagegrain yieldover time(kg/ha)
Soilbulk
density(g/cm3)
Erosion(t/ha/yr)
Thickness oftopsoil loss due toerosion (cm/yr)
1930s 1990
wheat/fallow 889 1.34 37.0 0.28 29.0 12.5wheat/fallow +manure
1984 1.26 19.5 0.15 23.2 14.3
wheat/fallow +synthetic fertilizer
1789 1.31 26.2 0.20 24.8 13.0
5-yr rotation(wheat, oats,barley, hay, hay)
1266 1.29 17.3 0.13 24.7 17.0
5-yr rotation +manure
2368 1.18 3.9 0.03 22.8 21.0
5-yr rotation +synthetic fertilizer
2484 1.19 8.4 0.07 23.3 18.2
Notes: Manure applications applied to wheat only in wheat/fallow rotation (50 kg N, 42 kg P, 20 kg S per ha).Manure applications applied to wheat only in 5-year rotation (50 kg N, 81 kg P, 39 kg S per ha). Only a portion ofthese nutrients would be available in the application year. Synthetic fertilizer treatments received applications of 10kg N, 6 kg P, and 10 kg S per ha every year. Erosion, and topsoil thickness in the 1930s, are determined using the137Cs technique.
Source: Monreal et al., 1995
Another study examined the effect of long-term continuous fertilized and unfertilized corn andbluegrass crops on the structural stability of a clay loam soil in Ontario (Dinel & Gregorich,1995).

GENUINE PROGRESS INDEX Measuring Sustainable Development51
Soil aggregate stability was assessed after 46 years of continuous treatment. Aggregates are thestructures or clumps formed when soil minerals and organic matter are bound together with thehelp of organic molecules, plant roots, fungi, and clays (Magdoff & van Es, 2000). Aggregatestability is considered to be one of the most important indicators of soil quality (Glover et al.,2000), and the ability to resist decomposition positively affects water infiltration and drainage,and helps to reduce erosion, compaction, and crusting (Dinel & Gregorich, 1995). Perennialcrops such as alfalfa and hay promote the formation of water stable aggregates, suggesting that acontinuous supply of organic matter to the soil and fine roots and fungal hyphae are required tomaintain stability of soil aggregates. The authors maintain that the lipid fraction of organicmatter is very resistant to decomposition and it plays an important role in the water stability ofsoil aggregates.
In the study reported by Dinel & Gregorich (1995), sod and wooded plots had three to four timesmore stable aggregates relative to continuous corn treatments. Table 28 shows the soil organic Cand lipid portion of the organic C for all treatments.
Table 28: Effect of 46 Years of Continuous Cropping on Soil Quality Indicators
Treatment Water stableaggregates
(g/kg)
Soil organicC (%)
Soil OrganicMatter (%)(SOC * 1.7)
Unbound extractablelipid portion of SOC (%)
Fertilized maize 255 1.8 3.1 9.8Unfertilized maize 182 1.6 2.7 8.1Fertilized sod 695 4.6 7.8 11.3Unfertilized sod 730 3.8 6.5 10.5Wooded 798 5.0 8.5 22.9
Note: Synthetic NPK fertilizer was used in fertilized plots. Maize treatments had residues ploughed under each fall.
Source: Dinel & Gregorich, 2000.
Fertilized treatments improved soil organic matter (SOM) relative to unfertilized treatments ofthe same crop (14 to 21% higher in this case). Sod crops had 156% higher SOM than continuousmaize (fertilized treatments). The differences in SOM between maize and sod or forestedtreatments were due, in part, to the increased tillage intensity associated with maize production,which mixes materials from lower soil horizons into the soil surfaces and redistributes SOMwithin the tilled zone.
An Ottawa field experiment started in 1913 allowed a 40 year comparison of manure andsynthetic fertilizer on a rotation of mangels, oats, clover, and timothy on a sandy loam soil(Cordukes et al., 1955). Unlike the other experiments reviewed here, this experiment was neitherreplicated nor randomized. Manure applied at a rate of 13.6 tonnes for each cycle of the rotationmaintained the yield of each crop over 40 years. This treatment produced the highest averageyield over the 40-year period, and values of N, SOM, and available P tended to be higher inmanure-amended soil than synthetically fertilized plots. The synthetically fertilized treatmentmaintained the yield of mangels, increased the yield of oats, and reduced the yield of hay over

GENUINE PROGRESS INDEX Measuring Sustainable Development52
time. Soil from both treatments was used in a follow-up greenhouse experiment (replicated andrandomized) that produced significantly higher yields from manure-treated soils than fromsynthetically fertilized soils.
A study in the UK assessing yields and soil properties after 30 years of grass-clover pasture vs.arable plots demonstrated the distinct advantages of forage crops to soil quality (Tyson et al.,1990). The treatments were set up in 1954 on land used for continuous cultivation of crops formany years, with a sandy loam texture. Treatment details are outlined in Table 29. Soil waslimed after 1962 to maintain plots in a range between pH 6.5 and 7.0. The same amount of limewas used for both treatments.
Yield results in the arable treatment showed declines over time even though the level of inputsincreased over time. Significant inputs were required to maintain yields near those at thebeginning of the experiment.
Table 29: Treatments for 30-Year Experiment Comparing Pasture and Arable Cropping
Treat-ment
Details Fertilization
Arable 1955-62: Rotation of crops1962-80: Spring barley, plowed each autumn1980-84: Winter barley (soil too degraded to work in the spring)
1954-69: 45 kg N, 20 kg P, 56 kg K per ha per year.1970: 56 kg N, 25 kg P, 66 kg K per ha per year.1960: plots split and half were topdressed with an additional 100 kg N/ha/year
Pasture Pasture sown 1954. Grazed by beef,dairy cattle, and sheep. No herbicidesused.
1954-69: 45 kg N, 20 kg P, 56 kg K per ha per year.1970: 56 kg N, 25 kg P, 66 kg K per ha per year. Grazing animals’ excrement provides extra fertility.
Source: Tyson et al., 1990
The initial barley yields of more than 4 t/ha declined to 2.9 t/ha by 1962 because the soil becametoo acid in places. After liming began in 1962, yields picked up again but then declined evenfurther due to soil structure deterioration. Between 1962 and 1980, yields averaged 3.1 t/ha andonly 1.96 t/ha in the last three years spring barley was grown. Yields from plots given an extra100 kg N/ha had an average yield of 4.1 t/ha.
The progressive decline in soil structure and fertility was reflected in the decline in yield (Table30). Failure to maintain barley yield after many years of continuous arable cropping on this soilseries (in the presence of adequate fertilizer) appears to have resulted from the continuing declineof SOM coupled with small earthworm populations, causing loss of soil structure to plow depth.The formation of a compacted layer at plow depth, (despite attempts to rip it up), restricted rootgrowth and hence the vigour of the crop.

GENUINE PROGRESS INDEX Measuring Sustainable Development53
Table 30: Soil Quality Parameters for 30-Year Arable and Pasture Systems, UK
Soil Quality Parameter(top 15 cm of soil)
Pasture Arable
Pore space (% of volume) 20years after establishment
47.1 (23% higher than arable) 38.2
Bulk density (g/cm3) 20 yearsafter establishment
1.335 1.585 (19% higher than pasture)
Soil organic carbon (kg/ha) Increased at a rate of ~1000 kg/ha/ year in the first 10 years thenremained constant
Decreased at a rate of 290 kg/ha/ year
Soil organic carbon (%) Increased from 1.2% to over 2.0% Decreased from 1.2% to 0.83%
Soil organic nitrogen (kg/ha) Increased at a rate of ~ 75 kg/haper year in the first 10 years thenremained constant
Decreased at a rate of 25 kg/haper year
Soil organic nitrogen (%) Increased from 0.13% to 0.20% Decreased from 0.13% to 0.10%Soil phosphorous (P) andmagnesium (Mg)
Increased soil P & K, and soil Mgremained steady
Increased soil P, soil K remainedsteady, and soil Mg was reducedby 50%
Earthworm numbers 28 yearsafter establishment
769,290 earthworms per ha 174,840 earthworms per ha
Earthworm weight 28 years afterestablishment
393 kg/ha 32 kg/ha
Source: Tyson et al., 1990
Dry matter (DM) yield of pasture declined from 9.6 t DM/ha in the first 5-8 years. Afterapplication of lime in 1962, which helped to mineralize soil N that had been built up in thosefirst years, DM yields recovered to approach those of the first year. The average yield for 1962-1984 was 8.2 t/ha. The authors pointed out that fertilizer input of P and K to the pasture couldhave been reduced because they were being built up in the soil and herbage. Pasture receivingdung and urine from grazing livestock produced 37% more DM than small exclusion areas thatdid not. Thus livestock contributions to fertility were significant.
In New Brunswick, a 25 year trial on fertile river-bottom soil was set up to explore how muchfertilizer is needed to maintain maximum yields of timothy hay over a long time period(Bélanger et al., 1989). The study produced three relevant results to this discussion. First, themaximum yield was never the most profitable yield because fertilizer inputs required to producethat maximum yield reduced profit margins. Second, the requirement for applied P increasedwith time, while K and N requirements fluctuated over the years. Third, the 270 kg N/haapplication rate decreased soil pH by 1.3 units.
A study carried out in Switzerland compared four different farming systems in randomized,replicated plots, using an identical 7-year rotation (Fleissbach et al., 2000; Mäder et al., 1996;Mäder et al., 2000; Oberson et al., 1996; Pfiffner & Luka, 2000; Pfiffner & Mäder, 1997;Pfiffner & Niggli, 1997). Soil in all treatments was evaluated for quality, microbial activity, andin particular, arbuscular micorrhizal (AM) activity after 16 years. Treatment details aresummarized in Table 31.
GENUINE PROGRESS INDEX Measuring Sustainable Development54
Despite the fact that the biological systems received about 70% less input of available nitrogen,and about 50% less input of phosphorous and potassium, the average yields were only reducedby 19-24% in the biological system (compared to integrated systems) during the second 7-yearrotation (Mäder et al., 2000).
Table 31: Swiss Experiment Comparing Four Farming Systems with Identical Rotations
Treatments Fertility Pest & Disease ControlControl No inputs No inputsBiological Composted manure: 70% less input of
available N, 50% less input of available P &K than integrated systems
No synthetic pesticides; biologicalcontrol methods only
Integrated Manure and synthetic fertilizerIntegrated – nomanure used
Synthetic fertilizer onlyModern integrated pest management.9 fungicide, 2 insecticide, 6 herbicideapplications per 7-year rotation
Source: Mäder et al., 2000
In biologically managed plots, beneficial soil organisms were much more abundant and diversethan in the integrated treatments. Earthworm biomass and density were 30–80% higher inorganic vs. integrated systems (Fleissbach et al., 2000). Plots fertilized with synthetic fertilizeronly (no compost or manure) had lowest earthworm biomass and density of all treatments. Thetotal mass of soil micro-organisms in the biological systems was 20–40% higher than in theintegrated system with manure, and 60–85% higher than in the integrated system withoutmanure. The activity of earthworms and soil micro-organisms was also higher in biologicallymanaged plots (Fleissbach et al., 2000).
Soil aggregate stability and microbial activity were significantly enhanced in the biological vs.integrated systems. Microbial contribution to the crop’s P supply was higher in the biologicalsystems compared to the integrated treatments (Mäder et al., 2000).
In Pennsylvania, a 10 year comparison of three production systems (Table 32) showed that aconventional maize-soybean rotation stored significantly less soil carbon and nitrogen than asimilar rotation with livestock and forages integrated into it (Drinkwater et al., 1998).
Ten-year data show that yields and economic profitability of the three systems were notsignificantly different. However, significantly more soil organic carbon (SOC) and nitrogen(SON) were stored in the soil of the manure-based system compared with the conventionalsystem even though total inputs of C and N are not significantly different for the two systems.The authors suggest that it is the diversity of the residues added to the soil, and the diversity ofcrops grown in the manure-based system that contribute to this effect. Also, the conventionalsystem experienced more N-loss by leaching (20 kg/ha per year) than the manure-based system(13 kg/ha per year).

GENUINE PROGRESS INDEX Measuring Sustainable Development55
Table 32: Treatments and Results of Three Farming Systems, US Midwest
Treatments Rotation Fertilization Pest & Disease Control
ConventionalMaize/soybean Synthetic fertilizer used as
neededPesticides used as needed
Manure-basedMaize, soy, plus smallgrains, grass/ legumes(fed to livestock)
Livestock manure, nosynthetic fertilizer used
No synthetic pesticidesused
Legume-basedMaize, soy, plus smallgrains, legumes.
Legumes incorporated into thesoil as fertility before maize.No synthetic fertilizer used
No synthetic pesticidesused
Source: Drinkwater et al., 1998
A study done in Ontario at three locations demonstrated the nitrogen fertilization requirements ofland continuously cropped to corn for 10 years (Richards et al., 1983). At two sites, the yieldresponse of corn to various levels of N fertilization was not affected by the number of years cornhad been grown. At the third site (Chinguacousy), where the authors noted a deterioration of soilstructure over time, yield was affected by the number of years in continuous corn. There was anincrease in the amount of fertilizer required to grow the most profitable amount of corn using aconstant cost : price ratio of 5 ($/kg N fertilizer divided by $/kg corn grain). Figure 8 shows theprofitable rate of N fertilization in years 1, 5, and 10.
Figure 8: Profitable Rate of N-Fertilization at Chinguacousy
38
213
178
0
50
100
150
200
250
0 1 2 3 4 5 6 7 8 9 10 11
Years of Continuous Corn
kg N
/ha
Profitable rate of N-fertilization (kg N/ha)
Source: Richards et al., 1983

GENUINE PROGRESS INDEX Measuring Sustainable Development56
If nitrogen fertilizer costs $1/kg of nitrogen, then the farmer would need to spend $140 more perha per year to achieve similar yields in year 5 as in year 1. By year 10, achieving similar resultswould cost $175 more per ha per year. This example only includes the differences in nitrogeninput required over time; it does not include additional inputs of other nutrients, micronutrients,or additional pest control products that might be required as soil productivity becomes degraded.
The full costs and benefits associated with a number of farming practices (rotation, fertilityamendments, pest and disease control practices) on soil quality and productivity have to bedetermined on a site by site basis. Each soil and site will offer different challenges andopportunities. Most studies carried out at research stations potentially underestimate the effectsand costs of soil degradation because research stations were generally established on favourableand fertile sites, rather than sites representative of farming in the area.
Conclusion – Long term studies
The pattern that emerges from the studies presented here is that soil quality and productivitygenerally respond to two critical factors: the application of manures and integration ofgrass/legume forages into the rotation. Synthetic fertilizer may be beneficial to soil quality andproductivity indicators, particularly in the shorter term, if it increases the crop biomass andconsequently the residues returned to the soil. But the use of synthetic fertilizers withoutsufficient organic matter additions from crop residues or manure/compost applications can havea negative effect on crop yield and soil quality in the long term. In particular, reliance onsynthetic fertilizers to maintain crop yields can result in soil acidification, a reduction in soilmicrobial processes (e.g. nitrogen-fixing bacteria), and leaching of positively charged nutrients(Patriquin et al. 1993). In addition, while manure and compost provide a variety of essentialmicronutrients to the crop, a reliance on synthetic fertilizers as a sole plant nutrient source canresult in micronutrient deficiencies. Several studies indicate that these losses and deficienciesmay reduce yields from synthetically fertilized soils in the longer term (more than 60 years) bycomparison with manure treatments.
Nutrients sufficient to maintain economic crop yields can be provided by manure or compost.These inputs have the additional effect of improving soil physical properties, which benefits theproducer by improving the soil’s water holding capacity and reducing yield variations over time.Soil biological activity (soil foodweb health) is also greater where manure is applied andsynthetic pesticides and fertilizer are avoided.
7. Conclusion
There are some documented negative trends in soil quality and productivity on Nova Scotiafarms, such as declines in soil organic carbon, potential soil structure problems, rates of soilerosion more than six times higher than rates of soil regeneration, and inadequate integration oflivestock into cropping areas. However, we have also documented that Nova Scotia farms havegood potential for enhancing soil quality and productivity relative to the average figures for

GENUINE PROGRESS INDEX Measuring Sustainable Development57
Canada, and that some trends (like reduced number of bare soil days and increased use ofconservation tillage) are very positive. On average, farmers have a good proportion of farm landin perennial forages, which is encouraging. We do not know whether potentially soil-buildingcrops are rotated with potentially soil-degrading row crops to offset losses in soil quality. Betterintegration of forage-fed livestock into row-crop producing areas will help to realize the full soilquality benefits of manure applications and rotation with soil-building crops.
It is obvious from the comments of farmers included below, that growers have a vested interestin keeping their soil productive, but the decline of livestock farming in the areas most suited topotentially soil-degrading row crops is a major stumbling block for all soil quality andproductivity indicators. Indeed, a major conclusion and recommendation of this study is thatincreased interspersion of livestock with crop-growing agriculture, thereby supplying localsources of manure, is one of the most cost-effective and efficient means available to the provincefor improving soil quality and long-term productivity.
By estimating the value of the investments required to maintain soil quality, it is apparent thatmeasures taken to avoid soil quality problems will cost less than the losses suffered as a result ofsoil quality problems, or attempts to replace what is lost. Long-term studies show thatcompensating for lost soil quality and productivity by using synthetic fertilizer (without manureapplication or soil-building rotations) may create accumulated problems and expenses that onlybecome apparent after a number of years.
It is very important to track trends in soil quality and productivity over a long time period, as thesoil is the foundation of our productive agricultural wealth. It represents our potential to producefood for generations to come. Unfortunately, average figures on a provincial or national basis donot show the interesting detail, thought, caring, and innovation that actually occur daily at thefarm level, as demonstrated in farmers’ comments below. If the conservation of our naturalwealth, the health and economic viability of the agriculture sector, and the food security of futuregenerations become prominent societal priorities, then Nova Scotians will be more likely tosupport local farming and food production, and farmers, in turn, will more likely have theresources they need to care for the land and adopt stewardship practices that conserve andenhance the quality of the province’s soil wealth.
It seems appropriate to end this report on soil quality and productivity with some comments fromfarmers in Kings County, Nova Scotia, and some examples of actual farming practices in thatregion. The comments below are from two sets of interviews, one in 1994 (Campbell, 1994) andone in 2000 (Scott et al., 2000).
“I can’t say that we have been the best stewards. We lose a lot of soil in the ditch and the pond. I don’tlike to see it.”
-Kings County pork and poultry farmer (Campbell, 1994).
“I feel very personal about all of our land. I want to build it up in quality. Luckily this isn’t too hard sinceit was mostly forage and orchard…”
-Kings County mixed farmer (Campbell, 1994).
GENUINE PROGRESS INDEX Measuring Sustainable Development58
“…Erosion is the difficult thing. The problem is there isn’t much animal agriculture in the Valleyanymore and not much money in hay. We could have a rotation of sod, but in the Valley the climate lendsitself to vegetable production. Really we need [ruminant] animals for hay rotation and manure.”
-Kings County poultry and vegetable producer (Campbell, 1994).
“… We struggle to do the right things…. We have a responsibility to maintain our agricultural and landresources. The burden on farmers is unfair.”
-Kings County vegetable farmer (Campbell, 1994).
“Organic people are bringing out the importance of maintaining the soil and the environment around us.We should have an awareness of these. We have changed practices and are evolving to reflect this newthinking. But there is so much information that it is hard to keep up.” -Kings County vegetable farmer(Campbell, 1994).
“Do you know who is the biggest [soil] eroder? Man. With every house built that land is lost. It can nevergo back into agricultural land, as with every highway.”
-Kings County vegetable farmer (Campbell, 1994).
“There is no question but that land is alive. All in a life cycle…. To have productivity you have to havelife for the breakdown process. We have been lucky… we have 18 [inches of topsoil]. That’s why peopleare practicing minimum till or no till. To preserve this topsoil.” -Kings County poultry farmer(Campbell, 1994).
In 2000, in-depth interviews with eight Kings County producers on many of the issues raised inthis report, revealed a profound knowledge and commitment to careful stewardship of the landthey farm (Scott et al., 2000). The farms were chosen to represent all the major sectors and sizesof farms in the county. A summary of the questions and answers pertaining to soil qualityfollow.
Question: What comments do you have regarding the soil organic matter levels on your farmover time?
One farmer, who uses liquid manure, told us that the liquid manure does not have much fibre, sohe has to supplement it with crop residues and green manures. He observes that Valley farms are“losing the livestock sector” and expresses concern about the need for diversity. He thinks itwould be ideal to turn the soil back into sod for two to three years [between annual crops], andthat crop rotation is “really important”. The trigger that caused him to pay attention to soilorganic matter was that he experienced soil erosion and yield losses when he grew continuousmonocrop potatoes. He mentioned the soil around Canning has been “really depleted” over time.
Table 33: Soil Organic Matter Levels on Surveyed Farms
Type of farm Comments about soil organic matter (SOM) levels/soil qualityApples, no longerfarming
There has been a decrease in SOM levels on this farm since they sold theirlivestock and stopped using manure in 1989. Until then, SOM was stable.
Garlic, organic SOM level of 18% (extremely high) is a result of a conscious soil-buildingprogram.

GENUINE PROGRESS INDEX Measuring Sustainable Development59
Soil Organic Matter Levels on Surveyed Farms (continued)
Type of farm Comments about soil organic matter (SOM) levels/soil qualityPoultry, Fieldvegetables
In general, SOM is increasing due to green manure use, although SOM is morechallenging to build up in sandy soils. “We are developing an understanding ofhow to work it better.”
Apples SOM tends to be low, which is typical of orchards. Soil on this farm is a bit acidicand needs lime.
Mixed specialty,certified organic
Organic matter is incorporated routinely. Plant health, weed, insect, and bird lifeare all used as indicators of soil quality. “It’s been a modest, slow process, withnoticeable improvement.”
Dairy SOM is building up slowly with the use of composted manure and green manures.“It’s a slow process.”
Pork, grain, beef Soil organic matter levels range from 1-2% (low) in some areas, and 3-4% (good)in others. Corn stalks, wheat stubble, and green manures are used to increase SOM.High SOM helps to retain calcium in the soil.
Certified organicmixed beef,vegetables, berries,grain, hay
Very conscious about not depleting SOM, preserving it, and adding to it. From1991 to 1999 SOM and soil quality have definitely improved.
Question: What proportion of cropped land is bare over the winter?
It appears that there is a high degree of consciousness regarding the soil loss potential whenfields are left bare over the winter. Growers have changed crops and taken other steps to reducebare soil over winter (Table 34).
Table 34: Soil Left Bare Over Winter, Surveyed Farms
Farm & TypeProportion of Cropped Land Left Bare Over Winter
A - Apples, no longerfarming
Fields were always left in sod unless they were to be seeded in the spring.
B - Garlic, organic Soil is never left bare.C -Poultry, Fieldvegetables
In the past, up to 50% of the soil was left bare, because one main crop washarvested late, with no time to establish a green manure. Now 20% is left barebecause they no longer grow that crop. On 35 acres, straw was used to cover thesoil over the winter.
D - Apples No soil is left bare.E - Mixed specialty,certified organic
No soil is left bare.
F - Dairy 21% of dykeland is plowed in fall and left bare for spring seeding because it istoo wet to plow in the spring.
G - Pork, grain, beef About 20% of the cropped land is left bare over the winter.H - Certified organicbeef, vegetables,berries, grain, hay
In 1991 about 10% was fall plowed for spring planting. In 1999 about 1% (2acres) was worked in the fall and left bare. Uses winter grains to avoid bare soilover winter.

GENUINE PROGRESS INDEX Measuring Sustainable Development60
Question: Have you taken actions over the years to improve soil quality? Please describethem.
Every farmer answered ‘yes’ to this question without hesitation. Their descriptions of soilimprovement practices are reproduced below.
A: Regular manure applications until 1989 when livestock was sold. Since then, fertilizerand lime have been applied as required by test results.B: This farmer spends 8-10 years improving the land before cropping it. In the first year,manure is added, buckwheat is planted. Then manure is added again and heavy oats are planted.Then there is a sequence of clover, oats and barley, then another year of clover. Green manuresare varied according to nutrient needs. “The purpose of farming is to increase the resource; thecrop is a by-product.”C: Depending on soil needs, specific green manures are now planted. For example, ryegrassis used for its excellent root system, oats for vegetables, and barley for soil improvement. Cropsare rotated and monoculture farming is avoided.D: Lime is applied. The soil is ripped four feet deep to aerate the soil between orchard trees.E: Green manures are used and livestock manure is applied to land. Fish fertilizer was useduntil it became too expensive.F: Composted manure and green manures have been used to improve soil. No syntheticfertilizers or pesticides have been used for 11 years.G: There has been less soil compaction following use of no-till methods. Cash crops arerotated with sod. Rye is planted as a cover crop then killed with Roundup and corn is planteddirectly into the residue. The yields were low initially, but now the crops are 70% or better thanthey were before no-till. No-till saves on tilling costs and decreases soil compaction. TheRoundup costs only about $7 to $8/acre. No-till wheat is being grown on a pilot basis also.
Question: Do you use animal manure to fertilize crops? Liquid/solid? Which crops? Does anymanure used come from elsewhere? Is any of the manure used composted? Comments?
Table 35: Manure Use
Farm type Manure used (crop) Comments
Apples, nolonger farming
Solid manure (hay,apples)
100% of manure comes from off the farm now that livestockare gone. When they had livestock, manure used in orchardwas composted.
Garlic, organic Solid manure (garlic,vegetables, hay)
100% of manure comes from off the farm. It is applied beforegreen manures are grown for two years.
Poultry, Fieldvegetables
Solid composted manure(onions, carrots, peas,wheat)
All own farm manure.
Apples noneMixed specialty,organic
Solid, compostedmanure (all crops)
All own farm manure. Exchange a case of beer for thespreading job.

GENUINE PROGRESS INDEX Measuring Sustainable Development61
Manure Use (continued)
Farm type Manure used (crop) Comments
Dairy Combination of liquid(aerated) and compostedsolid (hayfields)
10% of manure comes from off the farm and it is traded forstraw. Manure applications on fields have increased fertilitytoo much in some cases.
Pork, grain, beef Mostly liquid manure(grains, grassland)
10% of manure comes from off the farm. $125/hour is spentto spread the liquid manure.
Organic beef,vegetables,berries, grain,hay
Solid, compostedmanure (vegetables,pasture, hay)
All own farm manure. Would like to have a concrete pad tohelp with the composting process and reduce nutrient losses.
Every farm except one uses manure, either from its own farm or from another farm. All growerswho have their own solid manure are composting it prior to field application. Two farmersmentioned that it is cheaper to use synthetic fertilizer, but there are more benefits associated withusing manure, including an increase in soil micro-organisms and improvement in humus.
On one farm, manure is applied either in the fall before a green manure is sown, or in thespring/summer to pasture. The farmer has noticed an increase in the quality of the feed eachyear, and livestock health is getting better every year.
Another farmer decided to invest $55,000 in a concrete composting pad and building to protectthe manure being composted. He felt it was well worth the money because the higher quality,composted manure eliminates fertilizer costs. Nutrients are retained (not leached) in the manurebecause of the protected composting area, and in the soil because the compost increases organicmatter.
Although the comments and experience of this small sample of farmers may not fully representfarming in the county, it does show that there are Nova Scotia producers who are highlycommitted to learning about and preserving soil quality, because they see that it is in theirinterest to do so.

GENUINE PROGRESS INDEX Measuring Sustainable Development62
8. References
Acton, D. & Gregorich, L. eds. (1995). The Health of Our Soils -- Toward sustainableagriculture in Canada. Centre for Land and Biological Resources Research Research BranchAgriculture and Agri-Food Canada Publication 1906/E. Ottawa, Ontario.
Advisory Committees on Cereal, Protein, Corn and Forage Crops. (1991). “Atlantic ProvincesField Crop Guide.” Publication No. 100. Atlantic Provinces Agricultural Service CoordinatingCommittee.
Anderson, S.H., Gantzer, C., & J.R. Brown. (1990). “Soil physical properties after 100 years ofcontinuous cultivation.” Journal of Soil and Water Conservation 4(1), 117-121.
Angers, D.A., Kay, B.D., & Groenvelt, P.H. (1987). “Compaction characteristics of a soilcropped to corn and bromegrass.” Soil Sci. Soc. Amer. J. 51,779-783.
Bélanger, G., Richards, J.E., and Walton, R.B. (1989). “Effects of 25 years of N, P and Kfertilization on yield, persistence and nutritive value of a timothy sward.” Can. J. of Plant Sci.69, 501-512.
Brenton, P. and Mellish, D. (1996). The development of an on-farm manure managementprogram. Final report to: Canada/Nova Scotia Agreement on the Agricultural Component of theGreen Plan.
Campbell, M. (1994). Unpublished interviews with farmers in Nova Scotia about their ethicalbeliefs.
Carter, M.R., Angers, D.A., Gregorich, E.G., & Bolinder, M.A. (1997). “Organic carbon andnitrogen stocks and storage profiles in cool, humid soils of eastern Canada.” Can. J. Soil Sci. 77:205-210.
Carter, M.R., Gregorich, E.G., Angers, D.A., Donald, R.G. & Bolinder, M.A. (1998). “OrganicC and N storage, and organic fractions, in adjacent cultivated and forested soils of easternCanada.” Soil Till. Res. 47,253-261.
Clapperton, M.J., Janzen, H.H., & Johnston, A.M. (1997). “Suppression of VAM fungi andmicronutrient uptake by low-level P fertilization in long-term wheat rotations.” AmericanJournal of Alternative Agriculture 12(2), 59-63.
Cook, R.J. (1984). “Root health: Importance and relationship to farming practices.” Pp. 111-127in Organic Farming: Current Technology and Its Role in a Sustainable Agriculture, SpecialPublication No. 46, D.F. Bezdicek and J.F. Power, eds. Madison, Wis.: American Society ofAgronomy, Crop Science Society of America, Soil Science Society of America.

GENUINE PROGRESS INDEX Measuring Sustainable Development63
Cooper, J.M. & Warman, P.R. (1997). “Effects of three fertility amendments on soildehydrogenase activity, organic C and pH.” Canadian J. Soil Sci. 77,281-283.
Cordukes, W.E., MacLean, A.J., & Bishop, R.F. (1955). “The comparative effects of manure andcommercial fertilizer in a long-term soil fertility experiment.” Canadian Journal of AgriculturalScience 35, 229-237.
Costanza, R., d’Arge, R., de Groot, R., Farber, S., Grasso, M., Hannon, B., Limburg, K., Naeem,S., O’Neill, R.V., Paruelo, J., Raskin, R.G., Sutton, P., & van den Belt, M. (1997). “The value ofthe world’s ecosystem services and natural capital.” Nature 387, 253-260.
DeHaan, R. (1994). Innovative management techniques to conserve productive soils inProceedings Nutrient Management on the Farm: A Conference for Maritime Farmers. Kentville,Nova Scotia, February 8-9, 1994, NSDAM and Agriculture Canada.
Dick, R.P. (1992). “A review: long-term effects of agricultural systems on soil biochemical andmicrobial parameters.” Agriculture, Ecosystems and Environment 40, 25-36.
Dinel, H., & Gregorich, E. (1995). “Structural stability status as affected by long-termcontinuous maize and bluegrass sod treatments.” Biol. Agr. & Hort. 12, 237-252.
Donald, Richard. (1993). Final Report: An Inventory of Manure Management Information andManure Management Practices in Nova Scotia. Prepared for Nova Scotia Department ofAgriculture and Marketing, Plant Industry Branch, Truro, Nova Scotia.
Doran, J. & T. Parkin. (1994). “Defining and assessing soil quality.” In: Doran, J., D. Coleman,D. Bezdicek, B. Stewart, (eds) Defining Soil Quality for a Sustainable Environment. SSSASpecial Publication 35. Madison WI: Soil Science Society of America: 3-21.
Drinkwater, L., Wagoner, P., & Sarrantonio, M. (1998). “Legume-based cropping systems havereduced carbon and nitrogen losses.” Nature 396, 262-265.
Eastern Canada Soil and Water Conservation Centre. (1993). “Crop Rotation Systems for PotatoProduction in Atlantic Canada.”
Edwards, L.M. & Burney, J.R. (1987). “Soil erosion losses under freeze/thaw and winter groundcover using a laboratory rainfall simulator.” Can. J. Agric. Eng. 29, 109-115.
Edwards, L., Richter, G., Bernsdorf, B. Schmidt, R.-G, & Burney, J. (1998). “Measurements ofrill erosion by snowmelt on potato fields under rotation in Prince Edward Island.” Can J. Soi Sci.78, 449-448.
Edwards, L., Richter, G., Bernsdorf, B. & Schmidt, R.-G. (1996). “Soil erosion digs to thebottom under two-year and three-year potato rotations.” Available on the Internet athttp://res.agr.ca/charlotte/96-14.htm
GENUINE PROGRESS INDEX Measuring Sustainable Development64
Fox, M. & Coote, D. (1986). A preliminary economic assessment of agricultural landdegradation in Atlantic and Central Canada and Southern British Columbia. RegionalDevelopment Branch and Centre for Land and Biological Resources Research. DevelopmentConsulting House, Contribution 85-70, Agriculture Canada, Ottawa.
Fliessbach, A., P.Mäder, D.Dubois, & L.Gunst. (2000). Results from a 21 year old field trial.FiBL Dossier 1:1-15.
Glover, J., J. Reganold, & P. Andrews. (2000). “Systematic method for rating soil quality ofconventional, organic, and integrated apple orchards in Washington State.” AgricultureEcosystems and Environment 80, 29-45.
Gosselin, B., Asselin, R., Bernard, C., Côté, D., DeKimpe, C., Laverdière, M., MacKenzie, A.,Mehuys, G., Parent, L., Pesant, A. (1986). “La dégradation des sols agricoles. Causes, effets,prévention et correction.” Bulletin Technique 13 (Agdex 570). Conseil des ProductionsVégétales du Quebec.
Government of Canada (1991). The State of Canada’s Environment. Ottawa: Minister of Supplyand Services.
Greenland, D.J., Rimmer, D. & Payne, D. (1975). “Determination of the structural stability classof English and Welsh soils, using a water coherence test.” J. of Soil Sci. 26, 294-303.
Gregorich, E.G., Carter, M.R., Angers, D.A., Monreal, C.M. & Ellert, B.H. (1994). “Towards aminimum data set to assess soil organic matter quality in agricultural soils.” Can. J. Soil Sci. 74,367-385.
Ingham, E. (2000). The Soil Foodweb: It’s Importance in Ecosystem Health. Available on theInternet at http://www.rain.org/~sals/ingham.html.
IPCC (Intergovernmental Panel on Climate Change). (1996). Guidelines for NationalGreenhouse Gas Inventories. Reference Manual. Chapter 4: Agriculture.
Jacques, Whitford & Associates. (1985). Soil Degradation in Nova Scotia – Working Paper.Published under the authority of Agriculture Canada.
Mäder, P., Pfiffner, L., Fließbach, A. von Lützow, M. & Munch, J. (1996). “Soil ecology – theimpact of organic and conventional agriculture on soil biota and its significance for soil fertility,”in Ostergaard, T (ed) Fundamentals of Organic Agriculture, Proceedings of the 11thInternational Federation of Organic Agriculture Movements Conference. Copenhagen,Denmark.
Mäder, P., Edenhofer, S., Boller, T., Wiemken, A., Niggli, U. (2000). “Arbuscular mycorrhizaein a long-term field trial comparing low-input (organic, biological) and high-input (conventional)farming systems in a crop rotation.” Biol. Fertil. Soils 31, 150-156.

GENUINE PROGRESS INDEX Measuring Sustainable Development65
Magdoff, F., & van Es, H. (2000). Building Soils for Better Crops. Second Edition. BeltsvilleMD: Sustainable Agriculture Network.
Mathers, A., & D. Goss. 1979. “Estimating animal waste applications to supply crop nitrogenrequirements,” Soil Science Society of America Journal, 43, 364-366.
McBride, R.A., Joosse, P.J. & Wall, G. (2000). Risk of Soil Compaction in Agriculture andAgri-Food Canada. Environmental Sustainability of Canadian Agriculture: Report of the Agri-Environmental Indicator Project. T. McRae, C.A.S. Smith, & L.J. Gregorich (eds). Agricultureand Agri-Food Canada, Ottawa.
McRae, T., Smith, C.A.S., & Gregorich, L.J. (2000). Environmental Sustainability of CanadianAgriculture: Report of the Agri-Environmental Indicator Project. Agriculture and Agri-FoodCanada, Ottawa, Ont.
Moerman, D. (1994). “Soil compaction: avoiding and fixing a widespread problem,” inProceedings Nutrient Management on the Farm: A Conference for Maritime Farmers. Kentville,Nova Scotia, February 8-9, 1994, NSDAM and Agriculture Canada.
Moncayo, F. (1992). Methodology for the Analysis of the Nitrogen Flows in a Dairy Farm. MScThesis. Dalhousie University, Halifax.
Monreal, C., Zentner, R., & Robertson, J. (1995). “The influence of management on soil loss andyield of wheat in Chernozemic and Luvisolic soils.” Can. J. Soil Sci. 75, 567-574.
NSDAM. (1991). Guidelines for management and use of animal manure in Nova Scotia.Manure Management Task Group. NSDAM publication no. R-91-2000.
Oberson, A., Besson, J., Maire, N. & Sticher, H. (1996). “Microbiological processes in soilorganic phosphorous transformations in conventional and biological cropping systems.”Biological Fertility of Soils 21, 138-148.
Papadopoulos, Y.A., Reekie, E.G., Hunter, K., & Gupta, U.C. (1991). “Changes in continuoustimothy production with time in a long-term dykeland experiment.” Can. J. Plant Sci. 71, 761-769.
Patriquin, D.G., Blaikie, H., Patriquin, M., and Yang, C. (1993). “On-farm measurements of pH,electrical conductivity, and nitrate in soil extracts for monitoring coupling and decoupling ofnutrient cycles.” Biological Agriculture and Horticulture 9, 231-272.
Patriquin, D.G., Hill, N., Baines, D., Bishop, M., & Allen, G. (1986). “Observations on a mixedfarm during the transition to biological husbandry.” Biological Agriculture and Horticulture 4,69-154.
Pfiffner, L. & Luka, H. (2000). “Overwintering of arthropods in soils of arable fields andadjacent semi-natural habitats.” Agriculture, Ecosystems & Environment 78, 215-222.

GENUINE PROGRESS INDEX Measuring Sustainable Development66
Pfiffner, L. & Mäder, P. (1997). “Effects of biodynamic, organic, and conventional productionsystems on earthworm populations.” Biological Agriculture and Horticulture (EntomologicalResearch in Organic Agriculture), 3-10.
Pfiffner, L. & Niggli, U. (1996). “Effects of biodynamic, organic, and conventional farming onGround beetles (Col. Carabidae) and other epigaeic arthropods in winter wheat.” BiologicalAgriculture and Horticulture 12, 353-364.
Power, J.F. (1987). “Legumes: Their potential role in agricultural production”. Amer. J. Alt.Agric. 2(2),69-73. As reported in Committee on the Role of Alternative Farming Methods inModern Agriculture. (1989). Alternative Agriculture. National Academy Press, Wash. D.C.
Reganold, J.P., Glover, J.D., Andrews, P.K. & Hinman, H.R. (2001). “Sustainability of threeapple production systems.” Nature 410, 926-929.
Richards, J.E., Sheppard, S.C., & Bates, T.E. (1983). “Nitrogen fertilization of landcontinuously cropped to corn.” Can. J. Soil Sci. 63, 547-556.
Rose, D.A. (1991). “The effect of long-continued organic manuring on some physical propertiesof soils.” In Wilson, W. (ed) Advances in Soil Organic Matter Research. Cambridge: RoyalSociety of Chemistry, 197-205.
Sadler, J.M. (1979). “Soil erosion and organic matter depletion: effects of current row-cropmanagement in the Atlantic Region of Canada and the implications for soil productivity.” InProceedings of the Soil Erosion Workshop, NSAC. Truro NS, April 17-19.
Salomon, M. (1962). “Soil aggregation - organic matter relationships in redtop-potato rotations.”Soil Sci. Soc. Amer. Proc. 26, 51-54.
Shelton,IJ; Wall,GJ; Cossette,JM; Eilers,R; Grant,B; King,D; Padbury,G; Rees,H; Tajek,J; vanVliet,L (2000): “Risk of Water Erosion.” In: Environmental Sustainability of CanadianAgriculture: Report of the Agri-Environmental Indicator Project. (Eds: McRae, T.; Smith, CAS;Gregorich, LJ) Agriculture and Agri-Food Canada, Ottawa, ON: 59-67.
Scott, J., W. Johnston, & F. Morgan. 2000. Agriculture in Kings County: Real Values and RealProgress. Kings County Soils and Agriculture Committee and GPI Atlantic.
Smillie, J. & Gershuny, G. (1999) (4th ed.). The Soul of the Soil. White River Junction, VT:Chelsea Green Publishing Company.
Statistics Canada. (1997). “Historical Overview of Canadian Agriculture.” Catalogue No. 93-358-XPB. Ottawa: Minister of Industry.
Statistics Canada. (1997). “Agricultural Profile of the Atlantic Provinces.” Catalogue No. 95-175-XPB. Ottawa: Minister of Industry.

GENUINE PROGRESS INDEX Measuring Sustainable Development67
Statistics Canada. (1995). “Human Activity and the Environment 1994.” Catalogue No. 11-509E.Ottawa: Minister of Industry.
Statistics Canada (1987). “Nova Scotia Agriculture Census 1986.” Catalogue No. 96-105.Ottawa: Minister of Supply and Services.
Statistics Canada (1982). “Nova Scotia Agriculture Census 1981.” Catalogue No. 96-904.Ottawa: Minister of Supply and Services.
Tisdale, S.L., Nelson, W.L., & Beaton, J.D. (1985). Soil Fertility and Fertilizers. MacmillanPublishing Company, New York.
Tisdall, J. M. & Oades, J.M. (1982). “Organic matter and water-stable aggregates in soils.” J.Soil Sci. 33, 141-163.
Tyson, K., Roberts, D., Clement, C., & Garwood, E. 1990. “Comparison of crop yields and soilconditions during 30 years under annual tillage or grazed pasture.” Journal of AgriculturalScience, Cambridge 115, 29-40.
vanRoestel, J. (1995). “Development of a manure nutrient database for Nova Scotia livestockand crop farms.” Available on the Internet at http://agri.gov.ns.ca/pt/projsum/95/pr95r01.htm
Walker, Sally, Anne Monette and Ronald Colman. (2001). The Nova Scotia Greenhouse GasAccounts for the Genuine Progress Index. GPI Atlantic, Halifax, Nova Scotia.
Warman, P.R. (2000). “Plant growth and soil fertility comparisons of the long-term vegetableproduction experiment: conventional vs. compost amended soils.” In Proceedings of theInternational Composting Symposium 1999. Truro NS, 843-853.
Warman, P.R., & J.M. Cooper. (1994). Monitoring Soil Organic Matter Following Applicationof Fertility Amendments to Two Soil Series. Final Report to the Canada/Nova Scotia Agreementon Soil Conservation, Soil Conservation Monitoring Program SCM-00007.
Webb, K.T., Thompson, R.L., Beke, G.J., & Nowland, J.L. 1991. Soils of Colchester County,Nova Scotia. Report No. 19 Nova Scotia Soil Survey. Research Branch, Agriculture Canada,Ottawa, Ont. 201 pp.

GENUINE PROGRESS INDEX Measuring Sustainable Development68
9. Glossary
Aggregate stability Soil aggregate stability and bulk density are two important indicators of soilstructure (Glover et al., 2000). Aggregates are the structures, or clumps, formed when soilminerals and organic matter are bound together with the help of organic molecules, plant roots,fungi, and clays (Magdoff & van Es, 2000). The strength of the soil aggregates (granules orcrumbs) will determine the soil’s resistance to compaction. This ‘aggregate stability’ has beenstrongly correlated with soil organic matter content (Glover et al., 2000).
Bulk density is a physical measurement used to describe soils. It is calculated by dividing theoven dry weight of soil by its volume. It is usually expressed in g/cm-3 or kg/m-3. Typical bulkdensities in agricultural soils range from 1.1 to 1.7 g/cm-3 depending on various factors includingtexture, organic matter content, and soil management practices.
The cation exchange complex is the negatively charged surface of soil particles which attractsand retains positively charged ions (cations) such as potassium (K+), calcium (Ca2+) andmagnesium (Mg2+). Clay and organic matter both contribute to the soil’s cation exchangecapacity. Retained cations are released to the soil solution as needed for uptake by plants.
Decomposition Organic matter is decomposed by soil microorganisms. Decomposition is anormal part of the nutrient cycle which transfers nutrients from organic matter to growing plants(a process known as mineralization). However, if the breakdown of organic matter exceeds itsbuild-up over the long run, organic matter levels will decline. The process of organic matterbreakdown speeds up when air is mixed with the soil during cultivation. The tillage associatedwith growing annual crops is generally depleting to soil organic matter. Growing hay crops forseveral years in a row without tillage will help to re-build soil organic matter levels.
Denitrification is the conversion of nitrate-N to nitrogen gas that occurs in oxygen-limitedconditions. Denitrification occurs in the anaerobic portions of soil aggregates. Somedenitrification is normal in all soils, but the reduced aeration and porosity of compact soilsexacerbates this phenomenon. Nitrogen lost due to denitrification enters the atmosphere asnitrogen gas and nitrous oxide, although it is difficult to estimate the proportions of these gases.
Erodibility is the soil’s susceptibility to detachment and transport by erosive agents (ECSWCC1993)
Eutrophication is the accumulation of plant nutrients in surface water. These nutrients promotegrowth of aquatic plants which may not be desirable. Excess plant growth in water can depriveother aquatic life of oxygen, adversely affecting respiration, growth and reproduction. Light mayalso become limiting to plants growing below the algae. The prime culprits in promotingeutrophication are nitrogen (saltwater systems) and phosphorous (freshwater systems).
Forage For the purposes of this report, a perennial forage is defined as a grass and/or legumecrop grown for at least one year on a given piece of land as livestock feed.

GENUINE PROGRESS INDEX Measuring Sustainable Development69
Green manure is a crop that is grown specifically for improving soil quality, rather than harvest.Examples include clovers and other legumes, or a legume mixed with a grass such as ryegrass.
Humus is organic matter that has been processed by soil organisms into a more stable form.Humus is dark in colour, and the original source of this organic material is impossible todistinguish visually.
Nitrous oxide has 310 times the reflective capacity of carbon dioxide, making it the most potentof the greenhouse gases (carbon dioxide, methane and nitrous oxide).
Productivity While production is measured in terms of the yields of crops a particular soil canproduce, productivity is its yield per unit input, in a given unit of time. Inputs in this caseinclude energy, costs, time, labour, area, nutrients, etc. Productivity is often measured based onthe most limiting or expensive input. The input chosen for determinations of productivity shouldalways be made explicit, as it will change according to the endowments and limitations of eachsite and situation. Ecological productivity minimizes both non-renewable inputs and pollutingoutputs, while ensuring optimal production over the long-term.
Soil compaction caused by wheel traffic and tillage is one form of soil degradation. Thisprocess leaves the soil denser, less permeable to air and water, slower to warm up in the spring,more difficult to till, and more resistant to the penetration of plant roots. Reduced efficiency ofnutrient uptake results in impeded plant growth. Compaction is a particular problem in fine-textured soils and causes millions of dollars in lost crop yield each year.
Soil organic matter or soil organic carbon Soil organic matter (SOM) is the dead anddecaying plant and animal material in the soil - such as plant residues, animal manure, deadinsects - which are primarily made up of carbon. Most scientific studies report soil organicmatter as soil organic carbon (SOC); a factor of 1.7 is used to convert SOC to SOM. Organicmatter is critical for maintaining soil productivity because of the beneficial effects it has on soilmoisture, fertility and structure. It is the most important indicator of soil health and productivityin agricultural systems (Glover et al., 2000).
Tillage No-till is a farming practice that replaces tillage functions with herbicide use. Minimumor reduced tillage is a set of techniques that reduce the need for moldboard plowing by usingchisel plows and other strategies to break up hard soil while leaving crop residues on the surface.No-till is not widely practiced in NS because it is not practical on heavier-textured soils.
Triple mix is a combination of red and white clover, and timothy grass often seeded for hay.