soil profiles - angas bremer region water management
TRANSCRIPT

Describing and Interpreting Soil Profiles
David Maschmedt
DWLBC Soil and Land Information
Soil_desc_Nov04.doc

Contents
Page
THE ROLE OF SOIL 3
HOW TO DESCRIBE A SOIL PROFILE 3 Texture 4 Stones and gravel 5 Colour 5 Structure 5 pH 6 Carbonates 6 Water repellence 7 Laboratory analyses 8
HOW TO INTERPRET SOIL DESCRIPTIONS AND ANALYSES 9
SOIL CHEMICAL FERTILITY 10 Nitrogen and organic matter 10 Phosphorus 10 Potassium 11 Trace elements 11 Sulphur 11 Boron 11 Calcium and magnesium 12 Cation exchange capacity and exchangeable cations 12 Soil pH 13
CHEMICAL BARRIERS TO ROOT GROWTH 15 pH 15 Sodicity 15 Salinity 15 Boron 16 Chloride 16 Aluminium 16 Carbonate layers 16
PHYSICAL BARRIERS TO ROOT GROWTH 17 Stones and rock 17 Subsoil clays 17 Cracking clays 17 Cultivation pans 17
WATERLOGGING AND DRAINAGE 18
POTENTIAL ROOTZONE DEPTH 19
SOIL WATER HOLDING CAPACITY 20 Forms of soil water storage 20 Effect of soil properties on water holding capacity 20 Assessing soil water holding capacity 21
SEEDLING EMERGENCE & WORKABILITY 22
WATER EROSION POTENTIAL 23
WIND EROSION POTENTIAL 24
FURTHER READING 25
2

THE ROLE OF SOIL Soil is the outer layer of the earth’s surface in which biological activity occurs. Soil profiles (i.e. vertical sections) develop from rocks or sediments through processes such as weathering, decomposition, mineral alteration, clay translocation, solute leaching, biological activity etc. Most soils comprise a complex mixture of inert mineral particles, clay particles, oxides, carbonates and organic matter. In very simple terms, the large array of materials in soils can be grouped into i) inert grains (eg sand and silt particles), ii) clay particles, and iii) the organic fraction. Variable amounts of gravel and stone (any particle larger than 2 mm) may also occur. Soil is basic to all agriculture. Practically all agricultural products derive from plants grown in the soil. From a plant production point of view, soil can be looked at from several distinct angles. The Ideal Soil:
• Allows roots to penetrate in order to hold the plant up, and allows the plant to exploit water and nutrients.
• Allows water and air to move freely.
• Provides a storage for water so that plants can take up what they need between rainfall or irrigations.
• Provides a storage for nutrients so that plants can take up what they need between fertilizer applications.
• Must not have excessive amounts of substances which restrict plant growth, such as salt and toxic elements like aluminium and boron.
• Has a surface which is easily worked and allows uniform germination and emergence of seeds.
• Must be able to resist erosion by wind and water. Unless all of the factors listed above are satisfactory, sustained productivity is not possible. Soils vary widely in their appearance and their properties, and these differences affect plant growth and soil behaviour in different ways. Methodical description and analysis of soils can highlight their potential for various uses and can usually pinpoint problems. HOW TO DESCRIBE A SOIL PROFILE Soil profiles are best described in an exposed face, but this is usually not practicable. Samples carefully extracted with a soil auger are commonly used for descriptions. Most soils consist of layers. The differences in appearance usually mean differences in properties, so each layer must be described. Where layering is not obvious, take samples every 10 to 20 cm in the upper part of the profile (say top 50 cm) and every 30 to 40 cm in the lower part of the profile. Plant roots are not confined to the top 10 cm, and frequently extend below one metre. Soils should be examined to a metre wherever possible, because the subsoil is just as important as the surface. For each layer in the profile, the following should be described:
• Texture • Stones & gravel • Colour • Structure (strength, friability, dispersion) • pH • Carbonates • Water repellence
3

Texture This is the proportion of sand, silt and clay sized particles, which make up the mineral fraction of the soil. The size ranges of these particles are:
Sand 2.0 - 0.02 mm Silt 0.02 - 0.002 mm Clay Less than 0.002 mm
The proportions of these particle sizes influence the amount of water that can be stored in the soil, the rate of movement of water and air through the soil, the soil's nutrient supply, ease of root growth and soil workability and resistance to erosion. Sand and silt sized particles are generally inert, but the clay sized particles by virtue of their layered crystal structure and electrostatic charge characteristics control the retention and release of water and nutrients. Assessing Soil Texture Soil texture is easily assessed in the field by observing the behaviour of a small handful of moist soil, kneaded into a ball and pressed into a ribbon. The soil is wet slowly whilst kneading to a moisture content such that the ball just fails to stick to the fingers. Kneading should continue for a minute to ensure that fine clay aggregates are completely broken down. The soil ball is pressed out between the thumb and forefinger to form a ribbon. The feel of the soil ball and the length of the ribbon indicate the texture grade. Soil texture categories
Soil ball Ribbon (mm)
Approx. clay content (%)
Texture grade Broad group
Ball will not form - clear suspension when mixed with water
0 0-5 Sand
Ball only just holds together - cloudy suspension when mixed with water
5 5 Loamy sand
Sticky - ball just holds together - leaves clay stain on fingers
5-15 5-10 Clayey sand
Sand
Ball holds together - feels very sandy, but spongy 15-25 10-20 Sandy loam Ball holds together - feels smooth and silky 25 25 Silty loam
Sandy loam
Ball holds together - feels smooth and spongy 25 25 Loam Ball holds together firmly - feels sandy and plastic 25-40 20-30 Sandy clay loam
Loam
Ball holds together firmly - feels smooth, silky and plastic
40-50 30-35 Silty clay loam
Ball holds together firmly - feels smooth and plastic
40-50 30-35 Clay loam
Clay loam
Ball holds together strongly - feels plastic 50-75 35-40 Light clay Ball holds together very strongly - feels like plasticine
>75 40-50 Medium clay
Ball holds together very strongly, difficult to manipulate - feels like stiff plasticine
>75 >50 Heavy clay
Clay
Soil properties related to texture
Property Sands Sandy loams Loams Clay loams Clays Available water V. low to low Low to mod. High to mod. Mod. to high Mod. Rate of water movement Very fast Fast to med. Medium Med. slow Slow Air movement Very high High Medium Med. to low Low Nutrient supply capacity Low Low to mod. Moderate Mod. to high High Leaching of nutrients and herbicides High High to mod. Moderate Mod. to low Low Tendency to hard setting / surface sealing
Low High High to med. Medium Mod. to low
Rate of warming after watering Rapid Rapid Rapid to med Medium Slow Trafficability / workability after rain or irrigation
Soon Intermediate Intermediate Intermediate Long
Susceptibility to compaction Mod. to high High Mod. to high Moderate Mod. to low
4

Stones and Gravel The percentage, size and type of any fragments in the soil bigger than 2 mm should be noted. These affect moisture storage capacity, may interfere with tillage and reduce suitability for some crops. The presence of certain types of coarse material (e.g. ironstone), can point to nutrition problems. Soil Colour Colour is a valuable descriptive characteristic of soil as it helps considerably in communication related to soil. Colours can also provide a useful indication of soil drainage, degree of leaching and organic matter content. For example:
• Dark colours often indicate high fertility • Bright soil colours indicate good aeration and drainage • Pale sub-surface soil (with rusty mottling) and / or dull mottled colours in the subsoil indicate seasonal
waterlogging • Very pale or white colours indicate leaching and low organic matter
Colour is objectively assessed by comparing the colour of a freshly broken surface of moist soil with the standard Munsell Soil Colour Charts. Soil Structure Soil structure refers to the arrangement of soil particles and the strength of the bonding between them, but what is really important is the amount, size and arrangement of pores. Soil structure has an important bearing on the permeability of the soil to water and air, the ability of roots to penetrate and of seedlings to emerge, and on the resistance of the soil to the erosive forces of water and wind. Assessing Soil Structure Structure is easiest assessed by gauging the strength of golf ball sized lumps (aggregates) of soil, and noting the amount of air spaces in the lumps (cracks, channels or pores between smaller aggregates). Well structured soils either consist of small (less than 5 mm) aggregates which separate easily from one another, or the soil mass is soft enough that it can be crushed by hand when dry. Poor structure is usually the result of the collapse of the various bonding agents keeping the soil open and stable. This can happen when the organic matter is depleted or if certain types of clay are present in the soil. Such clays disintegrate when they get wet and the tiny clay particles are carried into the pores in the soil and clog them up. This is called dispersion. Dispersion Test Drop 3-4 pea sized lumps of air dry soil into a jar of rain water and check for any milkiness in the water
after 20 minutes. A milky halo around the aggregates indicates significant clay instability, while fully clouded indicates severe clay instability. Dispersion is commonly the result of excessive exchangeable sodium.
Strength Test A simple but reasonably objective test to measure soil strength requires only a 300 mm length of 2.4
mm brazing rod, flattened at each end. If the rod can be inserted into the soil with an open palm, strength is less than 1 MPa and root growth is unimpeded. If the rod can be inserted using a coin to protect the palm, strength is between 1 and 3 MPa, meaning root growth is likely to be partly restricted. Above 3 MPa, root growth ceases, except in old channels and cracks. Obviously this test is highly moisture dependent, so should be done when root growth is critical (e.g. at emergence, initiation of tillering, and completion of tillering).
5
Surface Soil Structure Poorly structured surface soils are hard and massive when dry, and soupy when wet. Surface soils are usually poorly structured if they have one or more of:
• high proportions of fine sand and silt. • dispersive clay particles. • low organic matter levels
Such soils usually seal over after rain and set hard when dry, causing:
• problems with seedling emergence; • limited opportunities for efficient and non destructive cultivation; • ponding of water on the surface; • increased susceptibility to erosion.
Subsoils Subsoils which have poor structure are easiest to detect when dry. They are too hard to break between the fingers and have either a massive appearance or consist of well defined lumps ("aggregates") which are more than 20 mm across. They are often dispersive. Poor subsoil structure restricts root development by imposing a mechanical barrier to the proliferation of fine roots. Roots are usually confined to the surfaces of the aggregates, reducing their ability to explore the bulk of the soil. Waterlogging is frequently associated with poorly structured subsoils, because water lies on top of the clay, drowning roots coming down from the soil surface. Poor structure also reduces the capacity of the soil to store moisture. Soil pH Soil pH is easily estimated in the field, using commercially available field pH test kits. Place half a teaspoonful of soil on a plate and add enough dye to just saturate the sample. Sprinkle on the barium sulphate powder and let the colour develop. Compare the colour with the test card to estimate pH to 0.5 of a unit. Soil Carbonates Calcium and magnesium carbonates are common and important constituents of most soils where the annual rainfall is less than 500 mm, but nevertheless occur in places in higher rainfall areas where parent rocks are calcareous (limy) eg limestone, dolomite, or where drainage is poor. Soil carbonates take several forms:
• fine whitish particles, commonly called ‘lime’, but correctly ‘fine earth carbonate’ in the soil matrix • hard nodules or rubble • sheet rock
Test for carbonate Carbonates are detected by the application of 1M hydrochloric acid. This can be approximately prepared by adding one part commercial Spirits of Salts to 10 parts rainwater. Add one or two drops of acid to a soil sample and note the strength of the effervescence (caused by carbon dioxide released by the acid-carbonate reaction). Record according to the following categories:
Reaction Strength of effervescence Approx % carbonate
Nil None Less than 1.5 Slight Just visible 0.5 to 1.5 Moderate Easily visible 1.5 to 8 High Strong 1.5 to 8 Very high Thick (bubbles "jump up") More than 8 The amount and type of carbonate affect plant rooting depth, nutrient availability, crop suitability, residual effects of some chemicals and drainage.
6
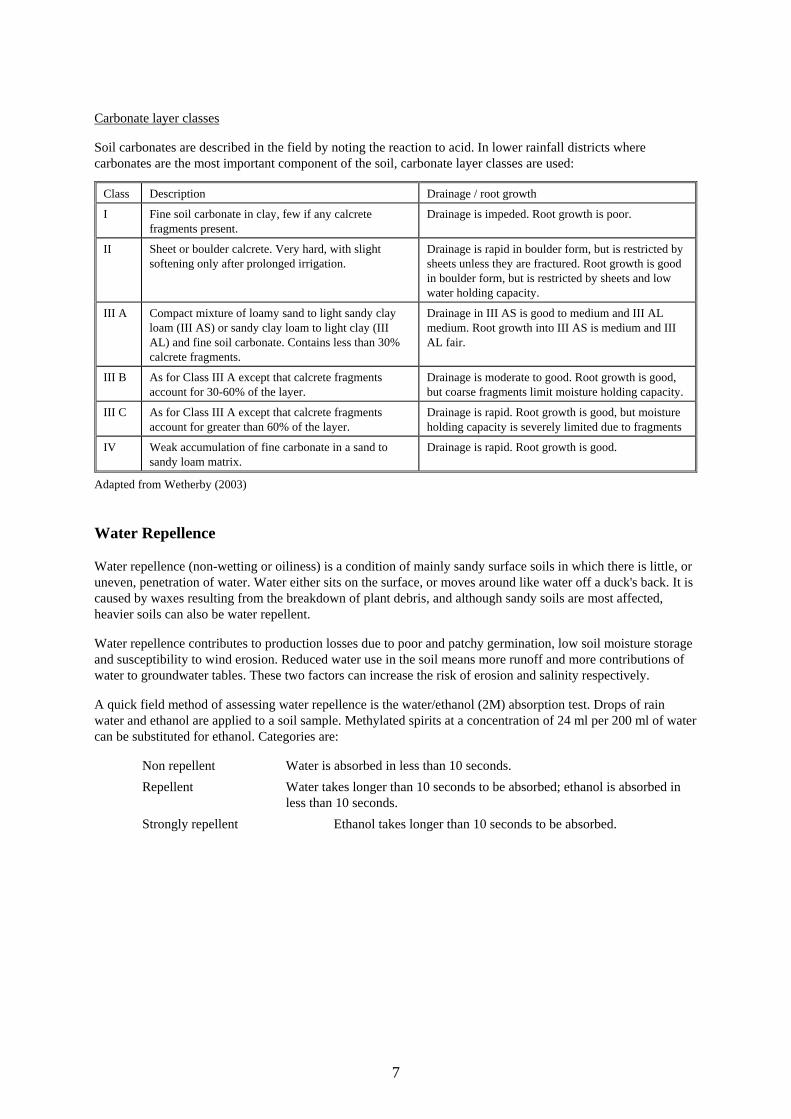
Carbonate layer classes Soil carbonates are described in the field by noting the reaction to acid. In lower rainfall districts where carbonates are the most important component of the soil, carbonate layer classes are used:
Class Description Drainage / root growth
I Fine soil carbonate in clay, few if any calcrete fragments present.
Drainage is impeded. Root growth is poor.
II Sheet or boulder calcrete. Very hard, with slight softening only after prolonged irrigation.
Drainage is rapid in boulder form, but is restricted by sheets unless they are fractured. Root growth is good in boulder form, but is restricted by sheets and low water holding capacity.
III A
Compact mixture of loamy sand to light sandy clay loam (III AS) or sandy clay loam to light clay (III AL) and fine soil carbonate. Contains less than 30% calcrete fragments.
Drainage in III AS is good to medium and III AL medium. Root growth into III AS is medium and III AL fair.
III B As for Class III A except that calcrete fragments account for 30-60% of the layer.
Drainage is moderate to good. Root growth is good, but coarse fragments limit moisture holding capacity.
III C As for Class III A except that calcrete fragments account for greater than 60% of the layer.
Drainage is rapid. Root growth is good, but moisture holding capacity is severely limited due to fragments
IV Weak accumulation of fine carbonate in a sand to sandy loam matrix.
Drainage is rapid. Root growth is good.
Adapted from Wetherby (2003) Water Repellence Water repellence (non-wetting or oiliness) is a condition of mainly sandy surface soils in which there is little, or uneven, penetration of water. Water either sits on the surface, or moves around like water off a duck's back. It is caused by waxes resulting from the breakdown of plant debris, and although sandy soils are most affected, heavier soils can also be water repellent. Water repellence contributes to production losses due to poor and patchy germination, low soil moisture storage and susceptibility to wind erosion. Reduced water use in the soil means more runoff and more contributions of water to groundwater tables. These two factors can increase the risk of erosion and salinity respectively. A quick field method of assessing water repellence is the water/ethanol (2M) absorption test. Drops of rain water and ethanol are applied to a soil sample. Methylated spirits at a concentration of 24 ml per 200 ml of water can be substituted for ethanol. Categories are: Non repellent Water is absorbed in less than 10 seconds.
Repellent Water takes longer than 10 seconds to be absorbed; ethanol is absorbed in less than 10 seconds.
Strongly repellent Ethanol takes longer than 10 seconds to be absorbed.
7

Laboratory Analyses A range of soil analyses is available:
• to diagnose soil chemical status as a guide to fertilizer management
• to monitor trends in the levels of chemical constituents of the soil
• to characterize soils as part of land resource surveys and field experimental work Soil analyses are often expensive and not always conclusive. For economic reasons, only those analyses appropriate for particular situations should be undertaken. Soil analyses which are commonly undertaken are: Available phosphorus and potassium Total nitrogen and nitrate nitrogen pH Organic carbon Carbonate content Electrical conductivity (to estimate soluble salts) Extractable trace elements and boron Chloride and sulphate Cation exchange capacity and exchangeable cations Surface soil analyses are best done on a bulked sample from approximately 30 subsamples collected within the paddock on the same soil type. With increasing interest in subsoil fertility, judicious sampling of deeper layers is recommended. To avoid contamination of samples, this is best done from pit faces or intact soil cores.
8
HOW TO INTERPRET SOIL DESCRIPTIONS AND ANALYSES A soil profile description is of little use without some meaning being attached to all the words and numbers. The properties outlined on the preceding pages all have a bearing on the productivity and performance of soils, through their effects on:
• Soil chemical fertility
• Chemical barriers to root growth
• Physical barriers to root growth
• Potential rootzone depth
• Waterlogging and drainage
• Soil moisture holding capacity
• Seedling emergence
• Workability
• Water erosion potential
• Wind erosion potential Each of these is briefly outlined on the following pages.
9

SOIL CHEMICAL FERTILITY The chemical characteristics of soil play a vital role in plant growth and soil stability through their effects on nutrition, toxicity and soil physical condition.
Soil tests are useful in providing a guide as to the chemical status of soils and to monitor trends. However, in most cases, tissue testing is recommended for making fertilizer recommendations. Nitrogen and Organic Matter
Nitrogen deficiency is probably the most widespread nutrition problem in South Australian agriculture. Most nitrogen occurs in the organic fraction but is only available to plants in mineral form. Mineralization must occur for nitrogen to become available. Mineralization is highly dependent on seasonal and biological conditions. Maintaining adequate levels of available nitrogen in the soil during the early stages of crop growth has long proved a difficult management problem.
Although virtually all South Australian soils are nitrogen deficient, it is the management of the soil rather than its inherent characteristics which determines nitrogen status. However, nitrogen levels are usually linked to organic matter contents, which tend to increase with increasing clay content and rainfall.
As well as influencing nitrogen supply, soil organic matter also holds and supplies other plant nutrients, and plays a key role in stabilizing the soil surface.
The total nitrogen test provides an indication of nitrogen status. Values of less than 0.1% are considered low, with average levels being between 0.1% and 0.2%. This test is not useful for assessing fertilizer requirements. Tissue testing is recommended.
The organic carbon test is a useful indicator of organic matter status and therefore of the overall fertility and structural stability of the surface soil. Desirable levels of organic carbon
Annual rainfall zone Surface texture <325 mm 325-400 mm 400-450 mm >450 mm Sand 0.6% 0.7% 0.8% 1.0% Loamy sand 0.8% 1.0% 1.2% 1.4% Loam 1.0% 1.1% 1.4% 1.6% Clay loam 1.1% 1.3% 1.5% 1.8% Clay 1.3% 1.5% 1.8% 2.0%
Phosphorus
Like nitrogen, phosphorus is almost universally deficient in South Australian soils in their natural state. Added phosphorus becomes attached to clay particles, organic matter and compounds of iron and aluminium. Only part of the total content is available to plants. Soils with a high pH and those with high levels of iron and aluminium have a reduced capacity to supply phosphorus. These soils, together with sandy soils in high rainfall areas, which are prone to leaching, are the most likely to be severely phosphorus deficient.
Indicative phosphorus concentrations are summarized in the following table:
Available P (Colwell bicarbonate extraction). Units are mg/kg (ppm)
Field crops Soil P status Non calc Calcareous
Pastures Potatoes Other vegetables
Vines/apples
Very low <10 <15 <10 <20 <40 Low 10-20 15-25 10-18 20-40 40-80 Marginal 20-30 25-35 18-25 40-55 80-120 Adequate 30-45 35-45 25-45 55-100 120-150 >80 High >45 >45 >45 >100 >150
Allow 5-10 mg/kg less for sandy soils. Phosphorus requirements will be based on yield targets & stocking rates etc, together with soil P levels.
10

Potassium
Except on very sandy soils in the higher rainfall districts, deficiencies of potassium in South Australia's agricultural soils are rare. This is because the rocks and sediments from which most soils are formed contain clay minerals which are naturally high in potassium. Deficiencies are most likely where large amounts of potassium have been removed in farm products, particularly hay. The table lists criteria for potassium levels.
Available K (Colwell bicarbonate extraction). Units are mg/kg (ppm)
Status Crops & pastures Potatoes Other vegetables Vines Low <80 <120 <150 Marginal 80-120 120-250 150-250 Adequate 120-250 >250 >250 >200 High >250
Trace Elements
Trace elements are required, and are usually only present, in small quantities. Deficiency symptoms may only occur sporadically, and may be due to seasonal conditions or induced unavailability caused by additions of other fertilizers.
The situations where the main trace element deficiencies are most likely to occur are:
Copper Acid and calcareous sands. Manganese Highly calcareous soils. Zinc All soils, especially calcareous and sandy types. Molybdenum Sandy, acid or ironstone soils in high rainfall areas. Iron Calcareous soils. Boron Leached sandy soils.
Soil tests for trace elements should only be used to establish the need for tissue analyses. Possible deficiencies in soils are indicated by the following critical levels using the EDTA and DTPA extraction methods:
Critical levels for trace element analyses (approximate guide only)
DTPA EDTA (crops & pastures) EDTA (hort) Element Adequate (mg/kg) Low (mg/kg) Adequate (mg/kg) Adequate (mg/kg)
Copper (Cu) 0.2 0.5 1- 2 4 Zinc (Zn) 0.5 0.7 1.2 – 2 4 Manganese (Mn) 1.0 10 20? 30?
Sulphur
Sulphur occurs in both organic matter and as sulphate in the soil. Sulphur deficiencies are not widespread and are most likely in sandy soils in high rainfall areas, and in soils low in organic matter. Prolonged application of high analysis fertilizers low in incidental sulphur can lead to deficiencies on susceptible soils.
Interpretation of soil tests (KCl40 test):
Status Sulphate-S (mg/kg) Low < 5 Marginal 5 - 10 Adequate > 10
Boron
Boron is better know for its toxic effects, but is nevertheless an essential trace element.
Interpretation of soil tests (hot 0.01M CaCl2 extraction)
<0.5 mg/kg – deficiency indicated for most crops. <1.0 mg/kg – deficiency indicated for high demand crops such as brassicas
11
Calcium
Calcium occurs in limestone, calcrete and soft "lime", which are all forms of calcium carbonate, a common constituent of South Australian soils. It also occurs in gypsum (calcium sulphate), and attached to clay minerals. Calcareous soils, and soils with high clay contents, are unlikely to suffer calcium deficiencies. Acidic soils and sandy soils are those most likely to be affected by calcium deficiencies. Magnesium
Like potassium and calcium, magnesium is present in large amounts attached to the clay minerals of most soils. Leached sandy soils are the most prone to deficiencies. Cation Exchange Capacity and Exchangeable Cations
Clay particles and organic matter have large surface areas with negatively charged sites which can attract and hold positively charged atoms called cations. The main cations are calcium, potassium, magnesium and sodium; these are important in plant nutrition. The greater the number of charged sites (measured by the cation exchange capacity), the greater is the nutrient retention ability of the soil and the better is its capacity to supply the elements to plant roots.
Cation exchange capacities of more than 15 indicate high soil fertility; values of less than 5 indicate very low fertility.
The proportions of the various cations on the exchange complex are also important. Excessive exchangeable sodium, as well as causing structural problems, also affects plant growth due to the low tolerance of many species to high sodium. The calcium to magnesium ratio should be at least 4:1. Too much potassium relative to magnesium and calcium results in "hypomagnesia" causing grass tetany.
As a guide, the desirable ratios of exchangeable cations are:
Exchangeable calcium (Ca) 65-75% Exchangeable magnesium (Mg) 10-15% Exchangeable potassium (K) 3-8% Exchangeable sodium (Na) 0-4%
The standard units for exchangeable cations are cmol(+)/kg, but some laboratories present data as ppm (mg/kg).
The conversion factors are:
Calcium ppm/200 = cmol(+)/kg Magnesium ppm/120 = cmol(+)/kg Potassium ppm/390 = cmol(+)/kg Sodium ppm/230 = cmol(+)/kg
12

Soil pH
The pH of soil is a measure of its acidity or alkalinity and is important in determining the degree and likelihood of acidification, in estimating possible nutrient deficiencies and assessing suitability for certain crops.
Soils which are neither acid nor alkaline (neutral) have a pH of 7.0. Acid soils have lower pH values and alkaline soils have higher values. There are two methods used for measuring pH. In the older method, pH is measured in a soil - water solution (pHH2O). A more reliable and meaningful method uses a soil - calcium chloride solution (pHCaCl2). This method takes account of any dissolved salts in the soil.
The majority of agricultural species prefer approximately neutral pH levels. Soils which are excessively acid or excessively alkaline cause reduced productivity.
Factors Affecting Soil pH
Acidity
Soils are considered acidic if the calcium chloride pH (pHCaCl2) is less than 4.8, and strongly acid if the pHCaCl2 is less than 4.2.
Some soils, particularly those with low clay content in high rainfall areas, are naturally acidic. These are rare in South Australia. Induced acidification, caused by accelerated accumulation of acids under certain land management practices, is a significant problem. Areas most affected are the higher rainfall districts such as the Mount Lofty Ranges, South East, Kangaroo Island and Lower Eyre Peninsula.
Acidification is caused by:
Accumulation of organic matter, which produces organic acids.
Addition of nitrogen to the soil via ammonium fertilizers or fixation of atmospheric nitrogen by leguminous plants. These both result in the production of nitrates, which are soluble and easily leached from the soil. The nitrates drag calcium and magnesium with them during the leaching process, leaving acidic residues behind.
Removal of alkaline farm products such as legume hay.
The susceptibility of a given soil to acidification is determined by its "buffering capacity", or ability to resist pH change. Soils with high clay content, cation exchange capacity and organic matter levels generally have higher buffering capacities.
Alkalinity
Alkalinity is usually an inherent characteristic of soils, although irrigation can increase the alkalinity of saline soils. Soils made alkaline by calcium carbonate alone rarely have pH values (measured in water - pHH2O) above 8.5, and are termed "calcareous". Alkaline soils with pH values higher than 8.5 usually have significant exchangeable sodium (sodic soils), or carbonates and bicarbonates of sodium. Observations over a range of environments in SA indicate that root growth of crop and pasture plants becomes very sparse at pH levels higher than 9.2 (particularly in a clayey soil).
Alkaline soils are largely confined to areas with less than 400 mm annual rainfall.
Consequences of Soil Acidity and Alkalinity
Many of the adverse consequences of excessively high or low soil pH values are related to plant nutrient availability.
As the diagram indicates, the availability of individual elements varies with pH.
13

Plants vary in their ability to extract nutrients from the soil, and for this reason some plants are able to perform better in acid soils, while others prefer a higher pH.
There are also some specific consequences of acidity and alkalinity:
In acid soils:
Nutrients are more readily leached due to a weakening of the cation exchange complex. For example, calcium deficiency may be associated with acid soils.
The rhizobia bacteria, responsible for nitrogen fixation, are less active at low pH. Reduced vigour of leguminous plants is therefore a major consequence of soil acidification.
Aluminium and manganese become so readily available at low pH that toxicities may occur. Stunted growth and leaf necrosis, respectively, can result.
Very sensitive species such as lucerne are affected by extractable aluminium levels of less than 2 ppm, while tolerant species such as oats will withstand values up to 13 ppm.
In alkaline soils:
Root growth is inhibited in strongly alkaline soils, due to the plant's inability to absorb a range of nutrient elements. Zinc in particular is not readily translocated within the root system, so the element must be available at each growing root tip.
Strongly alkaline soils are generally sodic. Sodium toxicity may impede root growth depending on specific tolerances.
14

CHEMICAL BARRIERS TO ROOT GROWTH pH (acidity and alkalinity)
As pH departs from neutral, root growth conditions become increasingly restrictive. It is not the pH per se which impedes root growth, but associated soil conditions. Refer to p. /? for more details on the relationships between pH and plant growth. Increasing limitations are associated with the following pH levels:
pH(CaCl2) Limitation pH (H2O) Limitation >5.4 Nil-low <8.5 Nil-low 4.5 - 5.4 Increasing 8.5 - 9.2 Increasing
Acidity
< 4.5 Severe
Alkalinity
>9.2 Severe
Sodicity
Excessive exchangeable (insoluble) sodium can have toxic effects on root systems. Soils with high proportions of exchangeable sodium relative to other cations are ‘sodic’. Sodicity is measured as the proportion of exchangeable relative to the cation exchange capacity (exchangeable sodium percentage , or ‘ESP’).
Sodicity classes
ESP Sodicity category Interpretation < 6 Non sodic No toxic effects 6 - 15 Sodic Very sensitive species affected 15 - 25 Highly sodic Sensitive species affected (eg many horticultural crops) > 25 Strongly sodic Most plants affected
Salinity
Productivity decreases as salt levels increase. Depending on the salt tolerance of the individual species, death eventually occurs. Salinity affects root growth through direct toxic affects, and also by increasing the osmotic pressure in the soil solution to a point where plant roots can no longer absorb water.
Salinity is estimated by determining the electrical conductivity (in decisiemens per metre, dS/m) of a soil/water mixture. The most common method (and the cheapest) uses a 1:5 soil:water suspension (EC1:5). A more accurate result is achieved using the ‘saturation extract’ method (ECe). When the results are more than 0.15 dS/m (sands), 0.2 dS/m (loams) or 0.3 dS/m (clays), the saturation extract method should be used.
ECe is sometimes estimated from EC1:5 using a soil texture conversion factor. As a very rough guide, the following conversions can be used:
Texture EC1:5 to ECe conversion factor Sand to clayey sand 14 Sandy loam to clay loam 9 Clay 6.5
Salinity tolerance of a range of crops
Soil ECe (dS/m) likely to cause yield reductions of: Crop 0% 10% 25% 50%
Barley Wheat Field beans Orange Grape Almond Tomato Potato Lucerne Perennial rye grass Tall wheat grass Strawberry clover
8.0 6.0 1.0 1.7 1.5 1.5 2.5 1.7 2.0 5.6 7.5 1.5
10 7.4 1.5 2.3 2.5 2.0 3.5 2.5 3.4 6.9 9.9 2.3
13 9.5 2.3 3.3 4.1 2.8 5.0 3.8 5.4 8.9 13 3.6
18 13 3.6 4.8 6.7 4.1 7.6 5.9 8.8 12 19 5.7
15

Boron
Boron is associated with certain types of clay, carbonate layers and rock formations. Levels above 15 mg/kg are considered toxic for field crops and pastures, and if these levels occur within the potential root zone, damage to the root system can be expected. The only solution is the use of tolerant varieties. Horticultural crops are generally much more sensitive to boron toxicity. Grape vines for example are affected at concentrations greater than 3 mg/kg. Chloride
Chloride, together with sodium, is the principal component of most soluble salts in soil, so chloride concentrations generally parallel EC readings. Critical levels for chloride (measured in 1:5 soil:water) are:
Texture group Cl (mg/kg) Sand to sandy loam >120 Loam to clay loam >180 Clay >300
Aluminium
Aluminium is present in most soils, but only becomes available at very low pH. It is commonly associated with soils developed on highly weathered rocks. The table indicates tolerance levels of a range of species.
Plant sensitivity Species Extractable* aluminium level above which yield declines
Very sensitive Lucerne & canola < 2 mg/kg Sensitive Barley, sensitive wheat & phalaris 2 - 4 mg/kg Tolerant Sub. clover, cocksfoot, perennial rye, tolerant wheat & phalaris 4 - 8 mg/kg Very tolerant Lupins, oats & triticale > 8 mg/kg
* 1:5 soil:0.01M CaCl2 extraction Manganese, like aluminium, may reach toxic levels in acid soils. Carbonate layers
Some carbonate layers, especially Classes III A and I, are commonly associated with poor root growth. The reason is unclear, but may be related to the extremely high pH and associated low nutrient availability which characterises these layers. Refer to the table on p. 7.
16

PHYSICAL BARRIERS TO ROOT GROWTH Any material with strength exceeding 3 MPa presents a physical barrier to root growth. Roots may not be excluded altogether, because cracks and fissures in rocks, gaps between clay aggregates, bio-pores etc allow root growth to extend to greater depths. However, densities are reduced, and efficiency of water and nutrient extraction diminishes correspondingly. The main physical barriers to root growth are: Stones and rock Hard basement rock or more or less continuous sheets of stone or rock such as calcrete in the soil profile, are generally permanent barriers to root growth. In some situations, ripping of cap rock (e.g. calcrete) can increase effective soil depth, but only if the material beneath is amenable to root growth. Subsoil clays Poor subsoil structure restricts root development by providing a mechanical barrier to the proliferation of fine roots. Roots are usually confined to the surfaces of the aggregates, reducing their ability to explore the bulk of the soil. Hard, massive clays with blocks or prisms that are more than 20 mm across indicate likely structural problems. Soils which disperse are also likely to restrict root growth. Dispersive subsoils often have high exchangeable sodium percentages and are very dense. Unless they are quite moist, they are too hard for roots to penetrate. This is especially a problem when there is a quick finish to a wet season, when the clays, which have been waterlogged during the winter, become hard before the rapidly growing roots have penetrated. Subsoils which are loose, friable and massive, or with a granular type of structure do not impose any limitation on root growth. Cracking clays Young root systems can be damaged by these soils if they dry out after emergence. The soil cracks away from the roots, either breaking them, or destroying soil-root contact. Cultivation pans Continued cultivation at constant depth can cause a compaction pan to develop near the surface. These thin layers can affect the normal growth of young roots emerging from the seed, causing them to bend at 90 degrees.
17

WATERLOGGING AND DRAINAGE The degree to which a soil becomes waterlogged depends on how much water enters the soil, and how quickly it leaves, either by deep percolation, lateral seepage or evapotranspiration. Consequences of Waterlogging Waterlogging causes oxygen starvation in the rootzone, which retards root development and may lead to death directly, or to poor springtime growth and low productivity due to a stunted root system. Waterlogging also causes denitrification and can affect the availability of other nutrients. Toxins secreted by anaerobic bacteria, which flourish in waterlogged soils, can also damage plants. Waterlogged soils are prone to compaction damage by livestock trampling and vehicles, and on sloping ground are susceptible to erosion due to their poor capacity to absorb water. Assessing Drainage Conditions Observation of the soil after heavy rain and during the late winter to late spring period, provides the best guide to soil drainage conditions. Surface waterlogging Water ponds on the surface for periods of hours to weeks following heavy or prolonged rainfall. Main causes are:
• Sealed or crusted surface soil • Cultivation pan (compacted layer) • Restrictive subsoil shallower than 20 cm • Very shallow water table
Subsurface waterlogging This is often not evident at the surface, and therefore often goes un-noticed. Main causes are:
• Restrictive subsoil layer (usually a clayey layer, but can be a cemented pan or basement rock) • Clayey texture throughout the profile • Shallow water table
The most commonly waterlogged soils in South Australia are those with low permeability subsoil clay layers. Hard and/or dispersive clays with blocky, prismatic or massive structure are the most likely to be impermeable. Water accumulates in the coarser material above the clay, forming a perched water table. These soils are recognizable when dry by dull yellow and grey mottled colours in the clay and by a dense, bleached layer immediately above it. Less severe waterlogging can occur in other texture contrast soils which do not exhibit these colours. Most clay soils are also prone to waterlogging.
18

POTENTIAL ROOT ZONE DEPTH In an unrestrictive soil, the depth to which roots penetrate is governed by the growth characteristics of the particular species, and by the depth of wetting. However, in many South Australian soils, a physical and / or chemical barrier prevents roots from reaching these theoretical depths, or if they do, densities are sub-optimal. Estimations of potential rootzone depth can be made by assessing chemical barriers (as described on pages 15-16) and physical barriers according to the following table.
Potential root penetration in a range of soil materials
Soil material Annual crops Lucerne Grape vine Topsoil Full depth Full depth Full depth Sandy subsoil Full depth Full depth Full depth Stony soil (>10% coarse fraction) Full depth Full depth Full depth B horizon clay with moderate to strong polyhedral, angular or subangular blocky pedality
100 cm 150 cm 50 cm
B horizon clay with moderate to strong columnar, prismatic or lenticular pedality (usually dispersive)
50 cm 100 cm 20cm
B horizon sandy loam to clay loam with any pedality other than columnar, prismatic, lenticular or platy
Full depth Full depth Full depth
B horizon sandy loam to clay loam with columnar, prismatic, lenticular or platy pedality
100 cm
150 cm 70 cm
Carbonate Class I Class II (fractured) Class IIIA Class IIIB Class IIIC
30 cm 50 cm 40-60 cm Full depth Full depth
50 cm 100 cm 60-100 cm Full depth Full depth
20 cm 50 cm 30-50 cm 30 + cm 50 + cm
Weathered rock 50 cm 100 cm 70 cm
19

SOIL WATER HOLDING CAPACITY One of the main functions of soil is to store moisture and supply it to plants between rainfall or irrigations. Evaporation from the soil surface, transpiration by plants and deep percolation combine to reduce soil moisture status between water applications. If the water content becomes too low, plants become stressed. The plant available moisture storage of a soil provides a buffer which determines a plant's capacity to withstand dry spells.
Forms of Soil Water Storage
Water is held in soil in various ways and not all of it is available to plants.
Chemical water is an integral part of the molecular structure of soil minerals and hygroscopic water is held tightly by electrostatic forces to the surfaces of clay crystals and other minerals. Both of these forms of soil water are unavailable to plants.
The rest of the water in the soil is held in pores, the spaces between the soil particles. The amount of moisture that a soil can store and the amount it can supply to plants depends on the number and size of its pore spaces.
Gravitational water is held in large soil pores and rapidly drains out under the action of gravity within a day or so after rain. Plants can make little use of gravitational water.
Capillary water is held in pores which are small enough to hold water against gravity, but not so tightly that roots cannot absorb it. This water occurs as a film around soil particles and in the pores between them, and is the main source of plant moisture. As this water is withdrawn, the larger pores drain first. The finer the pores, the more resistant they are to removal of water. As water is withdrawn, the film becomes thinner, and more plant energy is needed to absorb it. This capillary water can move in all directions in response to suction, and can move upwards through soil for up to two metres, the particles and pores of the soil acting like a wick.
When soil is saturated, all the pores are full of water, but after a day, all gravitational water drains out, leaving the soil at field capacity. Plants then draw water out of the capillary pores, readily at first, and then with greater difficulty, until no more can be withdrawn, and the only water left is in the micro-pores. The soil is then at wilting point and without water additions, plants die.
The amount of water available to plants is therefore determined by the capillary porosity, and is calculated by the difference in moisture content between field capacity and wilting point. This is the total available water storage of the soil. The portion of the total available moisture store which can be extracted by plants without becoming stressed is termed readily available water. Irrigators must have knowledge of the readily available moisture capacity so that water can be applied before plants have to expend excessive energy to extract it. Effect of Soil Properties on Water Holding Capacity
The amount of soil water available to plants is governed by the depth of soil that roots can explore (the rootzone), and the nature of the soil material. Because the total and available moisture storage capacities are linked to porosity, the particle sizes (texture) and the arrangement of particles (structure) are the critical factors. Organic matter and carbonate levels, and stone content also affect moisture storage.
Guide to water holding capacities of soil texture categories (units are mm water per m soil)
Texture category Field capacity (-8 kPa)
Wilting point (-1500 kPa)
Total available H2O (-8 to -1500 kPa)
Readily available H2O (-8 to -60 kPa)
Coarse sand 70-150 40-60 30-90 20-55 Fine sand 100-175 45-70 55-105 40-60 Loamy sand 125-200 50-80 75-120 45-70 Clayey sand 170-210 75 95-135 55-65 Sandy loam 205-285 90-130 115-155 50-80 Light sandy clay loam 215-305 105-150 110-155 60-90 Loam 240-340 115-165 125-175 80-100 Sandy clay loam 235-350 120-180 115-170 70-90 Clay loam 265-380 150-220 115-160 60-90 Clay 300-370 220-270 90-145 50-70 Clay (poorly structured) 260-300 180-230 30-90 20-50 Self-mulching clay 370-450 265-310 110-180 70-100
20

Variations within a texture class are due to organic matter, structure and clay mineralogy differences Clays store large amounts of water, but because they have high wilting points, they need significant rain to be able to supply water to plants. On the other hand, sands have limited storage capacity, but because most of it is available, they can make use of light showers. Assessing Soil Water Holding Capacity Firstly the depth of the root zone must be established, either by observing the depth to which roots from the previous crop have extended, or by noting the depth to a restrictive layer. Refer to the preceding sections on chemical and physical barriers to root growth to assist in predicting potential root zone depth. Most of the roots of annual field crops occur in the top 1.2 m of soil if there are no restrictive layers, although some perennial species may extend roots to 6 m or more if soil conditions are ideal and moisture is present. Secondly, calculate the water holding capacity of each soil layer in the root zone. For example, 0.25 m of clay loam with a capacity of 160 mm water per m of soil, can store 40 mm of water. The water holding capacity of a soil is calculated by summing the capacity of each layer in the rootzone. Rootzone water holding capacities of more than 100 mm are adequate. Soils with less than 20 mm of storage are unsuitable for agriculture, but may be irrigated with systems that allow frequent light applications.
21

SEEDLING EMERGENCE AND WORKABILITY
Seedling emergence
High and uniform emergence rates of seedlings depend on a well structured, disease free surface soil, with adequate nutrition and satisfactory seed-soil contact.
Poor surface structure is a significant cause of patchy emergence. Poorly structured surface soils are hard and massive, resulting from one or more of the following:
High proportions of fine sand and silt; Sodium rich clay (even if the clay content is as low as 10%); Organic matter content of less than 1% (2% minimum is ideal).
These soils tend to seal over if they dry out following seeding, and the surface seal may be too great a barrier for the emerging seedling.
Water repellence is also a cause of uneven emergence, due to low germination rates. Workability
Soil workability refers to the ease with which soil can be cultivated. Workability is affected by four main soil and landscape features:
• The structure of the surface soil • The bogginess or stickiness of the soil when moist • The amount of surface stone and rock outcrop • The slope of the land
Surface soil structure
Hard, massive surface soils cannot be worked dry as they come up cloddy and shatter, which further damages them. However, with extended rain, they tend to become soupy and should not be cultivated in such a condition either. These soils have a narrow moisture range for effective and safe working, which is difficult to manage.
Loose or friable soils with granular structure are more readily worked, but can nevertheless de degraded by excessive cultivation.
Bogginess
Soils prone to waterlogging also present a problem for cultivation. Once wet, compaction by machinery becomes significant, and soil structure can be severely damaged by implements.
Rocks and stones
The effects of rocks and stones are obvious, and in extreme cases, land is non arable. The effects of stones on implement wear can be significant, with some types of stone being more of a problem than others. Quartz and ironstone are the most damaging, because they are the hardest, while limestone and shale are less of a problem.
Slope
Slippage of machinery is a potential problem on sloping ground and in extreme cases, safety is an issue. Slopes steeper than 20% (1 in 5) cannot safely be worked on the contour, and slopes steeper than 30% (3 in 10) are generally too unsafe for any farm machinery.
Erosion potential is the other major factor in considering the cultivation of sloping ground. This is dealt with in the next section.
22
WATER EROSION POTENTIAL
Erosion of soil by water reduces its productive potential by removing nutrients, organic matter and water storage capacity, as well as silting up dams, fences and roads downstream and polluting water supplies.
Two processes are involved in water erosion. The first involves the detachment of soil particles by raindrop impact. The second involves the "entrainment" of soil particles into running water. For erosion to occur, individual soil particles must be fine enough to move, and there must be water running across the surface to pick up the particles.
Factors affecting water erosion potential
Topography The slope of the land, the length of the slope and the presence of adjacent rising ground all have obvious effects on the potential for erosion.
Soil type Some soils are more prone to erosion than others, all other things being equal. The inherent potential of a soil to erode is its "erodibility". Highly erodible soils have:
- poorly structured surfaces which have little resistance to raindrop impact and are easily broken into tiny particles. Fine sands as well as massive sandy loams and loams fall into this category. The finer the particles, the more easily are they picked up by running water. Over-cultivated soils are therefore particularly susceptible.
- impermeable layers at shallow depth, which allow water to build up, thereby increasing the chance of runoff, and entrainment of soil.
dispersive clays, which disintegrate into extremely fine (and therefore highly susceptible) particles on contact with water.
Soils which are well drained because they are deep and sandy, or well structured, are usually able to resist erosion because water rarely runs off, unless it comes from off-site.
Soils which have granular structure are able to resist entrainment by overland flow because the particles are too big and heavy. Unfortunately, in channelled or watercourse flow, these soils are extremely susceptible to erosion, because the coherence between the particles is low, and there is enough energy in the water to move the granules.
Rainfall The intensity, duration and time of year of rainfall are the key factors. Some districts are more prone to erosive rains at critical times (e.g. late summer) than others.
Assessing erosion potential
Erosion potential is calculated using various combinations of slope and soil erodibility to classify land into soil management classes. For example:
Soil type Erodibility Maximum slope for regular cropping Well structured clay Low 12% (12 in 100) Loam over friable clay Moderate 10% (1 in 10) Sand over poorly structured clay (deeper than 50 cm) High 8% (8 in 100) (shallower than 50 cm) Very high 6% (6 in 100)
23
WIND EROSION POTENTIAL
Land is susceptible to wind erosion when vegetative protection is low and soil particles are light enough to be moved by the wind. Wind erosion removes the most valuable part of the soil, and causes major off-site damage and expense due to fence and road burial by drift.
Factors Affecting Wind Erosion Potential
Topography
Soil in all topographic situations can be prone to wind erosion. Land which is exposed or in a situation where winds are turbulent or of a greater velocity than elsewhere is particularly susceptible.
Sandhills, being high points in a landscape of usually low relief are especially vulnerable. Jumbled (irregular) and crescent shaped sandhills, being younger and less stable than linear sandhills are more susceptible.
Land susceptible to turbulence or high velocity winds due to localized topographic features is difficult to identify without local knowledge. Slopes facing the prevailing wind are usually vulnerable due to their exposure.
Soil
A soil's erodibility, or susceptibility to erosion by wind, is determined mainly by the mass of the soil particles. Finer grained soils therefore have the highest erodibilities. Usually however, the individual particles in soils with more than 10-20% clay content are aggregated into larger particles, and are more resistant to erosion. Similarly, coarse sands and grits are resistant due to their particle mass. It is the low clay content fine to medium sands which have the highest erodibilities because of their low particle masses and low potential for aggregation.
The stability of aggregated particles is crucial, so farming practices which destroy aggregation, such as excessive cultivation, fast working speeds and over-grazing increase susceptibility to erosion. A calcareous soil is less aggregated and has lower strength than a similarly textured non calcareous soil, and has a higher erodibility.
Water repellent soils generally have high erodibilities due to the difficulty of establishing plant cover on them. Very infertile soils also have elevated erodibilities due to their low productive potential.
Surface stones reduce wind velocity and trap moving particles, and so assist in lowering the erosion potential of the soil.
Rainfall
The lower the annual rainfall, the higher is the potential for wind erosion because there is less chance of maintaining adequate levels of protective vegetative cover on the surface, either as crop stubbles or pasture residues. The most serious wind erosion occurs during droughts, common in South Australia's marginal agricultural areas.
Wind
Wind velocity, direction, duration and seasonal occurrences contribute to its capacity to cause erosion, or its "erosivity". Strong winds during the sensitive early autumn to early winter period have the potential to cause the most damage.
24

FURTHER READING Hunt, N. and Gilkes, B. (1992). Farm monitoring handbook. University of Western Australia: Nedlands. Maschmedt, D.J. (2001) Assessing Agricultural Land [CD ROM]. Primary Industries and Resources SA. Maschmedt, D.J. (2004). Knowing your soil. In: Grape Production Series No.2. Soil, Irrigation and Nutrition.
P.R.Nicholas (ed). Winetitles: Adelaide. Moore, G. (Ed.). (1998). Soil guide: a handbook for understanding and managing agricultural soils. Bull. 4343.
Agriculture Western Australia: Perth. Wetherby, K.G. (2003). Soil Description Book. K.G. & C.V. Wetherby. Soil Survey Specialists. Cleve SA 5640.
25