soil-plant-atmosphere-research(spar) facility: a … 1/reading...
TRANSCRIPT

BIOTRONICS 30, 27-50, 2001
SOIL-PLANT-ATMOSPHERE-RESEARCH (SPAR) FACILITY:A TOOL FOR PLANT RESEARCH AND MODELING
K. RAJA REDDy*l, H. F. HODGESl , J. J. READ2, J. M. McKINION2,
J. T. BAKER3, L. TARPLEy4 and V. R. R EDDy3
IDepartment of Plant and Soil Sciences, Box 9555, MississiPPi State University
MississiPPi State, MississiPPi, USA2USDA-ARS, Genetics and Precision Agriculture Research Unit, P.o. Box 5367,
Mississippi State, MS 39762, USA3USDA-ARS, Remote Sensing and Modeling Laboratory, Bldg. 007, Room 008,
BARC-West, Maryland 20507, USA
4Texas A &M Research and Extension Center 1509 Aggie Dr., Beaumont, TX 77713, USA
(Received April 23, 2001 ; accepted July 20, 2001)
REDDY K. RAJA, HODGES H. F., READ J.]', McKINION J. M., BAKER J. T., TARPLEY L.and REDDY V. R. Soil-Plant-Atmosphere-Research (SPAR) Facility: a tool forplant research and modeling. BIOTRONICS 30, 27-50, 2001. Integration of aprocess-based crop simulation model with user-friendly expert systems hasaided farm managers by facilitating the selection of optimal solutions towidely varying problems. As such systems are enhanced to furtherunderstand plant responses to environment, there is increased need fordiagnostics and management-decision aids either in support of optimizingresources for efficient farm management in precision agriculture technologies,or global climate change research, or the use of plants for remediation ofextreme environmental conditions. In regards to precision agriculture, mostengineering and computing technologies are presently in reality orcommercially available for variable-rate/site-specific management; whereas,the application of crop simulation models has been hampered by a lack ofunderstanding of responses of several key physiological and developmentalprocesses to environmental variation and the failure of many to conceptualizethe opportunities to apply such technology to real-world agricultural andenvironmental problems. There are certainly a variety of approaches andfacilities for investigating plant response to the environment. We havedemonstrated the utility and value of a Soil-Plant-Atmosphere-Research(SPAR) facility, which comprises ten outdoor, naturally-lit chambers, ingenerating data useful for increased understanding of cotton growth andphysiological responses to environment and for developing process-levelphysiological models. Operating a SPAR facility to acquire model data isoften being more expedient and economical than field-plot experiments,because SPAR allows the scientist to minimize many of the covarying andconfounding factors that occur in field experiments. As a result, basic plant
*Corresponding address: Department of Plant and Soil Sciences, Box 9555, MississippiState University, MS 39762, USA
27

28 K. RAJA REDDY et al.
processes investigated can be more directly related to the environmentalvariable(s) being studied. Also, the SPAR facilities are optimized for themeasurement of plant and canopy-level physiological, growth anddevelopmental processes under precisely controlled, but naturally lit,environmental conditions. This paper presents operational data and researchresults from a SPAR facility at Mississippi State University, Mississippi State,constructed in 1977 and still in use today. We describe herein how dataobtained in the past and as well as data in future studies have features thatare unique and instructive for both basic and applied plant biologists.
Key words: cotton; sunlit chambers; Soil-Plant-Atmosphere-Research(SPAR) ;simulation modeling ; environmental factors; carbon dioxide; temperature;photosynthesis; growth; phenology
INTRODUCTION
A feature common to production agriculture is that every season is uniquewith respect to the timing of rainfall, temperature regimes and other weathervariables. When a unique set of prevailing weather variables are combined withthe various cultural practices, soils, and crop cultivars encountered during agrowing season, farm managers may be faced with more variables than thehuman mind can easily manage. Consequently, resource managers needinformation organized within a theoretical (or predictive) framework to assistdecision-making processes. With increased availability of computers andknowledge of crop responses to weather variables, decision-makers havebenefitted from mechanistic crop simulation models designed as decision aids incrop production (17, 24). Because a number of cultural practices (e.g., rate anddate of planting) affect the physical environment of a crop, simulation modelscan be used to predict changes in crop growth and productivity due to differentcultural practices as well as to different weather conditions.
Our underlying hypothesis in prior experimental and modeling work is thatgrowth and development of plants in field environments result from interactionsbetween the genetic potential of individual plants to grow and variousenvironmental limitations imposed on this growth potential. Here, the potentialgrowth and developmental rates for a particular species or genotype are definedas the maximum rates achievable at given temperature under non-limitingnutrient and water conditions. This definition of growth potential has allowedthe successful development of the cotton simulation model, GOSSYM (6, 13). Acontrolled-environment research facility realistically mimicking field-likeenvironmental conditions is an essential tool for the acquisition of process-ratedata because it allows manipulation of a single environmental factor while otherfactors are maintained in non-limiting conditions. Data obtained in this mannerare far less ambiguous than those obtained in field experiments, allowinginterpretation of specific crop responses across the range of the manipulatedenvironmental variable. The actual rates may be delayed or reduced byenvironmental and nutritional (including carbon) stresses, and then compared
BIOTRONICS

SPAR FACILITY FOR PLANT RESEARCH AND MODELING 29
relative to the growth potential (e.g., rates of development or growth)established for a particular species/genotype. With this knowledge of processrates and stress responses, simulation models have been constructed to predictcrop responses to various physical conditions and changes in cultural practices(13, 24, 43). Typically, differences unique to a newly released cultivar can besimulated with minor calibration adjustments to potential rates established for apreviously studied cultivar (7).
There are several approaches and facilities available for investigating cropand ecosystem responses to environmental conditions. AlIen et al. (4), reviewedthe appropriateness of each of these facilities and the limitations of particularapproaches, with emphasis on the physical comparisons of the facilities and thecharacteristics required to address plant or ecosystem to responses toenvironmental conditions. Additional development of facilities has occurredsince then (8, 57).
Early work with controlled-environment growth chambers led some plantbiologists to erroneous conclusions. As a result of low light intensities and poorlight quality, plants grown in artificially lighted chambers did not satisfactorilyrepresent plants grown in natural sunlit conditions. Also, small pots mayrestrict root growth and subsequently alter the root to shoot partitioning,introducing unintended experimental artifacts (5) even for plants well suppliedwith water and nutrients (55). Therefore, many biologists ceased using suchchambers or information obtained from such studies for developing simulationmodels. Phene et al. (26) recognized the importance of unambiguouslydetermining the role of specific environmental factors on plant growth anddevelopment, and were first to design naturally-lit plant growth chambers withrealistic soil volume known as Soil-Plant-Atmosphere-Research (SPAR) units,which solved many of the problems of earlier chamber designs. A set of tennaturally-lit SPAR chambers, with computer control of environmental variables,was constructed at Mississippi State University in 1977 and has since been usedfor determining plant responses to a variety of environmental factors (48, andreferences therein). We have changed some design details to improve efficiencyand reliability, but the basic design has remained essentially the same. Thesesunlit, controlled-environment chambers are uniquely useful for studying canopyand ecosystem or small-plot responses to several combinations of variables incontrolled field-like environments (43, 48, and the references therein). Theprimary advantages of a SPAR facility for studying physiological processes inintact plants are repeatability (37, 38) and the ability to measure and control ofenvironmental variables (2, IS, 32, 33, 34, 35). Similarly, the SPAR-like facilitieshave been used for plant physiological studies at the University of Florida,Gainesville, Florida (3, 14, and the references therein), the Battle Pacific NorthwestLaboratory, United States Environmental Protection Agency facility, Corvallis,Oregon (57) and more recently at the Natural Resource Institute, United StatesDepartment of Agriculture, Beltsville, Maryland, USA.
Despite years of agronomic and crop science research, there exists stillknowledge gaps, and a lack of quantitative information on crop responses to
VOL. 30 (2001)

30 K. RAJA REDDY et al.
physical environment. The purpose of this paper is to explicitly describe thecontrol capabilities of SPAR and the different types of experiments that can beconducted with such equipment. Because our aim is to encourage the morewidespread understanding of crop growth, development and yields in response tocultural practices and weather. To accomplish this, the crop productionmanager needs information on status of the crop and the factor(s) limitinggrowth at any given point in time. We present evidence and examples of howresults can be used to develop process-level crop simulators that will providesuch information. Here, we focus on our studies with cotton in the SPARfacility at Mississippi State University for developing a crop simulation model,and also discuss some relevant capabilities of SPAR facilities that are in use atother locations.
PHYSICAL AND ENVIRONMENTAL FEATURES OF THE SPAR FACILITY
The SPAR units are located outdoors on a 20 X 30 m concrete pad. Each unithas the capability for controlling air temperatures, and atmospheric composition(especially CO2 concentration) at predetermined set points for studies of plantgrowth in natural solar radiation regimes (33, 35). The bottom third of eachSPAR unit consists of a steel bin to contain rooting medium. The upper twothirds is an airtight Plexiglas chamber of 2.5 m high and 2.0 XI. 5 m in crosssection to accommodate the aerial plant parts (Fig. O. Variable-density shadecloths are positioned around the edges of a plant canopy inside each unit, andare adjusted manually to match plant heights, in order to simulate the presenceof neighboring plants and eliminate the need for border plants.
A door in the bottom of the aerial portion of each chamber is hinged foraccess to the soil surface and the aboveground portions of the plants. Ducts onthe northern face connect to the cooling system. Conditioned air is introducedat the top of the Plexiglas chamber, flows down through the plant canopy, andis returned to ducts just above the soil surface. A steel soil lysimeter containsthe rooting medium, and measures 1.0 m deep X 2.0 m long X 0.5 m wide. Thenorthern face of the lysimeter has many large holes closed with rubber stoppersto facilitate measuring soil environmental conditions. The southern face isconstructed of reinforced glass to allow collection of data on root growthdynamics. Figure 1 is a picture of a SPAR unit showing the attributesmentioned. Construction details, operating parameters, data acquisition, andcontrol capabilities of the SPAR/SPAR-like facilities are described in detail forthe interested reader in Phene et al. (26), Parson et al. (27), McKinion (18),McKinion and Baker (21), McKinion and Bell (22), McKinion (19), McKinion(20), lones et al. (15) Pickering et al. (28), Tingly et al. (57). With commonequipment such as the secondary cooling system, the data acquisition andcontrol system, the cost of a SPAR unit is approximately US$40, 000, andincludes the carbon dioxide gas analyzers, cooling system, data acquisition andcontrol system, and associated gas pumps, instrumentation, sensors, and wiringwhich is comparable to most commercial plant growth chambers.
BIOTRONICS

SPAR FACILITY FOR PLANT RESEARCH AND MODELING
/
PleXiglaschamber
s:===="lI
31
Soil~~-
bin
Cooling coil
Fan
Heating-coolingandair-handlingunit
Fig. 1. Diagram showing a Soil-Plant-Atmosphere-Research (SPAR)unit at Mississippi State, Mississippi. The canopy volume including the airhandling unit is 11.1 m3• Conditioned air enters aboveground Plexiglascompartment about halfway between the bottom and the top of the unit andreturns just above the soil level. The above-ground compartment ismounted on a steel frame, and a lysimeter. The air-handling unitaccommodates a pressure pump to direct air from each chamber to thelaboratory room for carbon dioxide analysis, two 11 kilowatt heaters oneither side of the unit, a fan for air circulation, and a dew point sensor justinside the return airline.
The SPAR units provide a natural solar radiation environment (94%transmissive to photosynthetically active radiation) and have capabilities forcontrolling both the aerial and soil environment across a wide range ofenvironmental set points. Controlled factors in each chamber includeatmospheric carbon dioxide concentration ([C02]), dry-bulb air temperature, anddew point temperature. The environmental control system can be programmedto provide continuously changing values over a diurnal cycle to yield either asmooth sinusoidal or a square wave function. Similarly, a monitoring systemprovides accurate measurement of the environmental conditions throughout anexperiment. Many season-long experiments have been conducted on cotton inwhich excellent environmental control was maintained for several months (48,and references cited therein). Set points also can be programmed to change forshort-term periods so that plant responses to short-term environmentalconditions can be investigated during critical stages of crop development. Inaddition, [C02] can be maintained from subambient to superambient levels in theSPAR system in a manner not possible with other types of field exposure
VGL. 30 (2001)

32 K. RAJA REDDY et al.
systems. This capacity allows investigation of specific processes related toreduced carbon sources and sinks and their interactions that lead to widelyvarying patterns of growth, development, and fruiting in cotton. Because theSPAR units provide continuous measurement of canopy photosynthesis andtranspiration throughout the experimental period, these biophysical processes canbe determined under precisely controlled conditions. From these results, rateequations can be developed for building new mechanistic models of growth anddevelopment and/or improving the existing crop models.
Plant cultureIrrigation and nutrient media can be manipulated precisely to deliver the
required amounts into each SPAR unit or pot by adjusting the provision ofHoagland's nutrient solution through a computer-controlled drip-irrigationsystem. Further, an adjoining nursery facility is available to grow plants inlarge pots and then move plants into the units following a predetermined periodof growth to address short-term experimental objectives at specific growthstages.
Measurement and control of environmental variablesTemperature is monitored and adjusted automatically every 10 s throughout
the day and night. Control of the dry-bulb air temperature is maintained usinga dedicated computer that opens and closes a set of solenoid valves to a chilledwater radiator and switches a heating system on and off. Heat is provided bytwo 11 kilowatt heating elements mounted on either side of the air circulationunit. Air temperature is monitored using an aspirated, shielded thermocoupleand maintained within ±O. 5°C of the treatment set points over a daytime rangeof 18°C to 40°C and a nighttime range of 12°C to 32°C. The dew pointtemperatures are measured, but not controlled, with a gold mirror hygrometer(lModel Dew-IO, General Eastern Instruments, Woburn, Massachusetts, USA)installed in-line the return airline. The dew point temperatures are collected at10-s intervals and summarized over 900-s periods (33).
Canopy temperature of plants. is monitored every 10 s using infraredthermometers (lModel 400AT, Everest Interscience Inc., Tucson, Arizona, USA)and the values averaged over 900-s intervals throughout the experimental period.In one of the ten units, photosynthetic photon flux density (PPFD) is monitoredevery 10 s using a pyranameter (lModel, LI-200SA, LI-COR Inc, Lincoln,Nebraska, USA) placed above the canopy. Similarly, canopy light interception ismonHored using a dedicated line quantum sensor (lModel, LI-IOOO, LI-COR Inc,Lincoln, Nebraska, USA) placed just above the soil-level. Also, at an adjacentweather station, global radiation, PPFD is measured at 10 s intervals and thosedata are averaged separately over 900-s intervals. The [C02] in each SPARunit is monitored and adjusted every 10 s throughout the day and is maintainedwithin 10 ILL L-1 of treatment set points during the day light hours byadjustment of controls consisting of a set of pressure regulator, calibratedrotometer, needle valve and solenoid valves. A mass-balance approach based on
BIOTRONICS

SPAR FACILITY FOR PLANT RESEARCH AND MODELING 33
the output from a dedicated CO2 analyzer for each unit (lModel, LI 6200, LI-CORInc, Lincoln, Nebraska, USA) is used to open and close the solenoid valves asneeded. To maintain CO2 in each chamber, pure CO2 is injected through asystem that includes a pressure regulator, solenoid and needle valves, and a
Ambient minus 2°C
uo" 35~::J
"§ 30ID
E25ID I-~--------I- 20
50 .---,----,--,-------,--,--,---r----.-----,----,--,------,---,
45
40
15
64210 L..-----l_--.L_-..L-_----l-_...L-_.L-----ll-.----L_---'--_--l-_-'--_-'-------J
o 8 10 12 14 16 18 20 22 24
Time of dayFig. 2. A typical diurnal period of temperature control for three SPAR
units programmed to control at current ambient temperature, ambient minus2°C, and ambient plus 7°C.
9876
I I I I I I I I I I I I I I
-
r- -
cO2 = 720 IJL L-1
r- -
r- -
r- -
I- CO2
= 360 IJL L-1-
I- -
I- CO2
= 180 IJL L-1-
, , I I I I I I I I
900
800
700
600
500
400
300
200
100
o5
.....'.....J
.....J::J..
c:o
~.....c:~c:8N
oU
10 11 12 13 14 15 16 17 18 19 20
Time of day
Fig. 3. A typical day of CO2 control for three SPAR units programmedto control at subambient (180.uL L-1), ambient (360,i.tL L-1), and elevated(720.uL L-1) levels.
1Mention of this and other proprietary products is for convenience of the readers only,and does not constitute endorserment or preferential treatment of these products byMississippi State University, USDA-ARS or Texas A&M University.
VOL. 30 (2001)
34 K. RAJA REDDY et al.
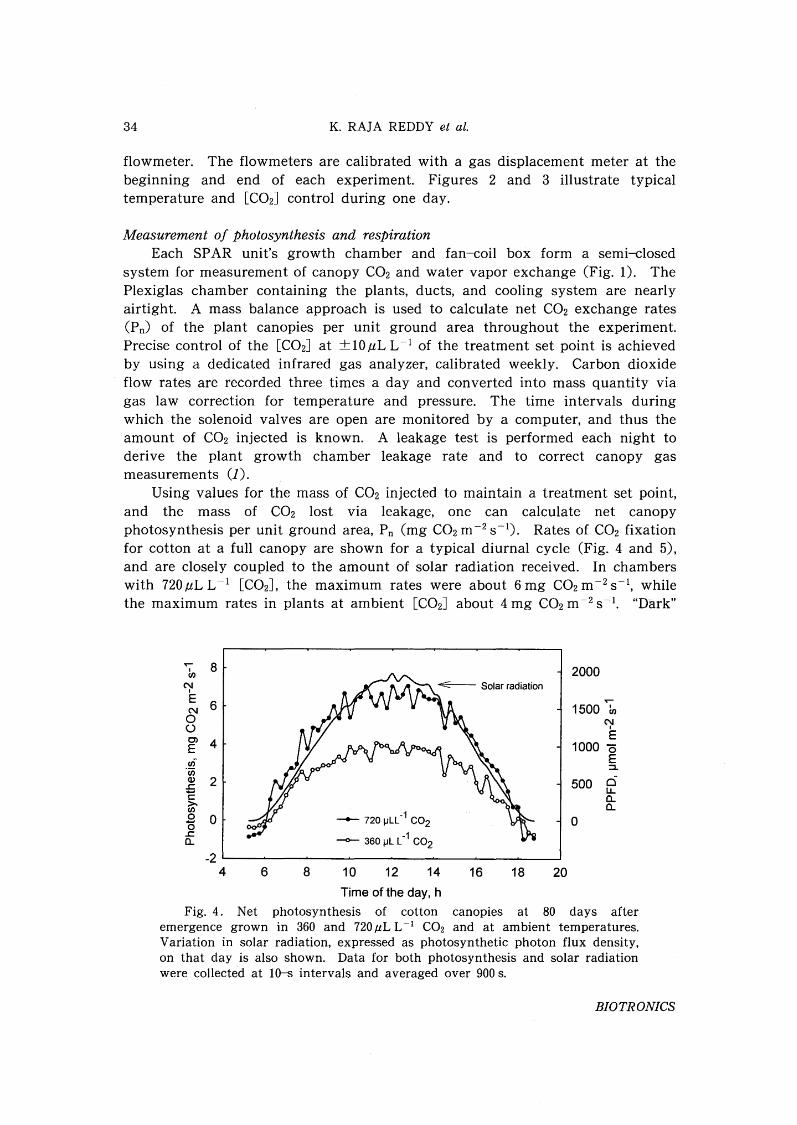
flowmeter. The flowmeters are calibrated with a gas displacement meter at thebeginning and end of each experiment. Figures 2 and 3 illustrate typicaltemperature and [C02] control during one day.
Measurement of Photosynthesis and respirationEach SPAR unit's growth chamber and fan-coil box form a semi-closed
system for measurement of canopy CO2 and water vapor exchange (Fig. O. ThePlexiglas chamber containing the plants, ducts, and cooling system are nearlyairtight. A mass balance approach is used to calculate net CO2 exchange rates(Pn) of the plant canopies per unit ground area throughout the experiment.Precise control of the [C02] at ± 10,uL L --1 of the treatment set point is achievedby using a dedicated infrared gas analyzer, calibrated weekly. Carbon dioxideflow rates are recorded three times a day and converted into mass quantity viagas law correction for temperature and pressure. The time intervals duringwhich the solenoid valves are open are monitored by a computer, and thus theamount of CO2 injected is known. A leakage test is performed each night toderive the plant growth chamber leakage rate and to correct canopy gasmeasurements (1).
Using values for the mass of CO2 injected to maintain a treatment set point,and the mass of CO2 lost via leakage, one can calculate net canopyphotosynthesis per unit ground area, Pn (mg CO2m -2 S-1). Rates of CO2 fixationfor cotton at a full canopy are shown for a typical diurnal cycle (Fig. 4 and 5),and are closely coupled to the amount of solar radiation received. In chamberswith 720,uL L ~1 [C02], the maximum rates were about 6 mg CO2m -2 S-1, whilethe maximum rates in plants at ambient [C02] about 4 mg CO2m-2S~1. "Dark"
..- 8 2000ImC\l
I
E 6 ..-C\l 1500 Im0 C\l0 I
Cl 4E
E 1000 "0m E"w :::J..
Q) 2 500 cl..r::.'E u.
a..>. a..m.9 0 - 720 IJLL-1 CO2 00..r::.
~ 360 jJL L-1
CO2a..
-24 6 8 10 12 14 16 18 20
Time of the day, h
Fig. 4. Net photosynthesis of cotton canopies at 80 days afteremergence grown in 360 and 720.uL L-1 CO2 and at ambient temperatures.Variation in solar radiation, expressed as photosynthetic photon flux density,on that day is also shown. Data for both photosynthesis and solar radiationwere collected at 10-s intervals and averaged over 900 s.
BIOTRONICS

SPAR FACILITY FOR PLANT RESEARCH AND MODELING 35
8.----r----r----r----.,-------,
25002000
• 720 j.JL L-1 C02
o 360 j.JL L-1 C02
o
500O......>.o<..----L-------L ...L..... --L.. ----I
o
T"""ICl)
C'\II
E 6C'\Io()
C>
E_ 4Cl)
'enID
L:....~ 2Cl)
o...oL:.a..
1000 1500
PPFD, IJmol m-2 S-1
Fig. 5. Net photosynthesis of cotton canopies 80 days after emergencegrown in 360 and 720,uL L-1 CO2 environments and at 1995 temperatures asa function of solar radiation, Data were collected at lO-s intervals andaveraged across 900 s.
respiration rates (mg CO2 m- 2 s -1) are calculated in a similar manner bymaintaining daytime temperatures one hour into the nighttime period.Consequently, gross canopy C exchange rate, Pg, is calculated and used to correctP n data for daytime "dark" respiration rates. We have routinely used these datato quantify the photon flux density vs. P n or Pg of cotton canopies, and havefound a close relationship (r2=0.97) between seasonal P n and biomass (11). V.R. Reddy et al. (54) reported a close relationship between CO2 fixed by soybeangrown at four [C02] (350,ilL L-1 to 900,ilL L-1) and the estimated cost of biomasssynthesis.
Measurement of transpirationCanopy transpiration rates expressed on a ground area basis (g H20 m- 2 S-l)
throughout the growing season is measured as the rate at which condensate isremoved by the cooling coils at 900-s intervals (23) by measuring the mass ofwater in collecting devices connected to a calibrated pressure tranducer. Thesoil surface is sealed from gaseous exchange with the aerial environment usingplastic sheeting. Data on diurnal trends in radiation and transpiration forflowering cotton plants grown at two [C02] 's for a typical clear day arepresented in Fig. 6. From measurements of photosynthesis and transpiration,water-use efficiency (g CO2 fixed per unit of water transpired) of crop canopiescan be estimated as functions of various environmental conditions.
VDL. 30 (2001)

36 K. RAJA REDDYet al.
Measurement of crop growth and developmentCrop phenology or development can be precisely measured in predetermined
environments with the SPAR system. For cotton, these processes are: 1)emergence to first square (cotton floral buds); 2) squaring to flowering(anthesis) ; 3) flowering to open boIls (dehiscence of the many-carpellate fruits) ;4) open boIls to crop maturity or termination; 5) duration of the growth of aleaf or an internode; 6) leaf area development, 7) stem and root elongation rates;and 8) abscission rates of leaves, squares, and boIls. When these measurementsare obtained with manipulation of [C02J from subambient to superambientlevels, one can precisely estimate the C source and sink relations and identifycauses for fruit-shed or delays in plant development. As the ratio of supply todemand for C or other nutrients decreases due to C or other nutrient deficienciesgrowth becomes limited by the respective nutritional deficiency. Therefore, thecauses for fruit shedding in flowering plants can be more easily investigatedusing the SPAR system than through any other known means.
QUANTIFYING GROWTH, DEVELOPMENT AND PHYSIOLOGICAL PROCESSES
During· the past several years, SPAR experiments were conducted to answermany questions regarding cotton growth and developmental rates, and rates ofspecific processes, in response to several environmental factors. Theseexperiments, summarized in Table I, serve to illustrate the potential of the SPARfacility for systematically providing mechanistic explanations of the response ofdiverse plant processes to environment. A criticism of these experiments is thelimited number of replicates available when examining interactions of treatmentvariables due to a limited number of experimental units (l0 at the MississippiState facility). The median variance of eight diverse measurements of plantgrowth and development within a single SPAR unit often exceeds by fivefold thevariance among the units treated alike. We attribute this low variabilitybetween similarly treated SPAR units to the precise, computerized control of theenvironmental variables possible in the SPAR chambers.
The SPAR facility has supplied many of the model parameters and processlevel rate equations used by the mechanistic cotton-crop simulation model,GOSSYM (6, 13). Model validation studies can also be conducted to examinethe reliability of SPAR data. For example, K. R. Reddy et al. (39) used SPARdata in order to provide inputs to the model from a subroutine that describes theeffects of a commonly used plant growth regulator in cotton, mepiquat chloride.With the aid of the subroutine, GOSSYM/COMAX was used to predict severalgrowth parameters for making comparisons to actual values in 50 field croppingsystems. The linear regressions of model predictions vs. the observed valueswith a zero intercept yielded slopes near 1. 0, and r2 values ranged from 0.95 to0.99.
Examples of gas exchange measurementsCanopy daytime photosynthesis in cotton during the fruiting period
BIOTRONICS

SPAR FACILITY FOR PLANT RESEARCH AND MODELING
Table 1. Treatment structures for experiments conducted on cotton innaturally sunlit environment chambers (SPAR units) during 1988 to 1998.
37
Year CultivarTemperatures, °C
Day/NightComments and references
15/7, 20/10, 25/15, 30/20, 350, 70035/25
20/12, 25/17, 30/22, 35/27, 350 70040/32 '
Expt. 1 -1988 DPL 50
Expt. 2 -1989 DPL 50
Expt. 3 -1989 DPL 50
Expt. 4 -1989 DPL-50
Expt. 5 -1990 Pima-S-6
Expt. 6 -1990 Pima-S-6
Expt. 7 -1990 Pima-S-6
Expt. 8 -1991 Pima-S-6
Expt. 9 -1991 DES 119
Expt. 10-1992 DPL 5415
Expt. 11-1992 DPL 5415
Expt. 12-1993 DES 119
Expt. 13-1993 DES 119
Expt. 14-1993 DES 119
25/15, 30/20, 35/25
30/22
Several high airtemperatures
25/1~ 30/2~ 35/27
Four hightemperatures
30/22
30/22
26/1& 31/2~ 36/18
26/1& 31/2~ 36/18
30/22
30/22
Several PIX®2 levels
350
600
350, 700
700
350, 450,700
350
350, 450,700
350, 450,700
350, 700
350, 450,700
Out-ofdoors
Flowering to end-season, and threePREp®1 treatments
70 days from emergence, well-wateredand fertilized (12, 49, 50, 51, 52).
Short-term, few weeks during flowering,well-watered and fertilized (38).
4-weeks during the fruiting period,Flower abscission study (49, 50, 51).
64 days after emergence, well-wateredand fertilized (37, 38).
Flowering to maturity, well-wateredand fertilized (37, 38, 39).
Flowering to end of season, fruitretention study (30, 36).
95 days after emergence, 3 droughtstress levels (42).
Four N levels (45, 53).
60 days after emergence, well-wateredand fertilized (31).
Flowering to maturity, well-wateredand fertilized (39, 41).
49 days after emergence, 5 N levels (44).
80 days after emergence, 3 droughtstress levels (45).
Short-term, 30 days from squaring, 5PIX®2 treatments (29, 40).
Acala Maxxa 20/12, 25/17, 30/22, 35/27, 360 720Expt. 15-1994 HS-26, DPL 51 40/32 '
46 days after emergence, well-wateredand fertilized (47).
Expt. 16-1994 DPL 51
Temperatures: Long-term
Mississippi 360 720July mean minus -2, and. 'July mean plus 2, 5 and 7"C
4-weeks, flowering period,watered and fertilized (44).
well-
Expt. 17-1995 DPL 51
Temperatures: 1995 ambient,
1995~mbient -2"C, and 1995 360 720ambientplus 2, 5 and 7°C.
Full-season, well-watered and wellfertilized (44).
Expt. 18-1996 NuCot33
Expt. 19-1996 NuCot33
Expt. 20-1997 Nucot33
Expt. 21-1997 NuCot33
Expt. 22-1998 NuCot33
30/22
26/26
30/22
Several short-termtemperatures
30/22
360, 720
360
360, 720
Several[C02]
360, 720
84 days, 5 K levels (48).
Manual de-leafing and de-fruitingstudy, well-watered and well-fertilized.
Several water-deficient studies (48).
Short-term, few days to treatments weeks,well-watered and well-fertilized (48).
Water and C02 interactive study (56).
IPREp® is Ethephon, (2-ChloroethyI) phosphonic acid2pIX® is Mepiquat Chloride, N, N-dimethylpiperdinium chloride
VOL. 30 (2001)

38 K. RAJA REDDY et al.
expressed as a function of photosynthetically active solar radiation and [C02]
are presented in Fig. 5. The canopy was closed, intercepting about 95% of theincoming solar radiation. Plants were grown in optimum temperature, water,and nutrient conditions, but in varying CO2 environments. Unlike data obtainedin indoor, light-limited plant growth chambers, cotton canopy/leaf photosynthetic rates did not appear to light-saturate even at high radiation levels inpresent-day [C02] environments (30, 58). Doubling [C02] in the atmosphereincreased both the initial slope of the diurnal light response curve and theestimated maximum light-saturated rate. Using the SPAR system, we havecalculated the initial slopes and the maximum rates of canopy light responsecurves as functions of various temperature, atmospheric [C02], water, andnutrient regimes by manipulating these environmental conditions. From thesephysiological response functions, and knowledge of canopy light interception, itis possible to develop a functional model of canopy carbon exchange rate for afaield-grown crops.
From light response curves of the type depicted in Fig. 5, the daily netphotosynthetic rates at a specific radiation level can be estimated and the valuesplotted throughout the growing season to compare environmental conditions(e.g., Fig. 7). Under ambient temperature of 30°C and atmospheric [C02] of 360,uL L-I CO2, the maximum photosynthetic rate at 1200,umol mol-I S-I PPFD wasreached about 30 days after flowering, and then gradually decreased as theseason progressed. In cotton, fruit-set (boIl number) increases rapidly afterfirst flower stage until the size of the fruit load (a major sink for C) reaches themaximum the plant can support. Actually, the maximum number of fruits a
1.0 2500..--
I720 pL L-1 CO2Cl) •
C'\I 0.8 360 tJL L-1 CO2
_e..2000I 0 e 0 ..--
E aae~ en0 00 C'\IC'\I
0.6 ~ Solar radiation 1500 EJ:C) °00 Q)
E ~"0Ec- 0.4 ~ 1000 :::L
0 ~ 0"fJ ~.... ~IJ..
'0. Cl..Cl) 0,2 500 Cl..c~I-
0.0 00 2 4 6 8 10 12 14 16 18 20 22 24
Time, h
Fig. 6. Transpiration of cotton canopies 80 days after emergence grownin ambient (360,uL L-1) or twice ambient CO2 concentrations and at 1995ambient temperatures. Solar radiation, expressed as photosynthetic photonflux density (PPFD), and air temperature on that day are also shown. Datafor transpiration were collected at 900-s intervals while data for solarradiation and air temperatures were collected at 10-s intervals and averagedover same 900 s periods.
BIOTRONICS

SPAR FACILITY FOR PLANT RESEARCH AND MODELING 39
cotton plant can support varies daily, depending on the amount of photosynthateproduction, respiration rate, and limitations due to nutrients and water. Incotton, as in most other indeterminate plants, some or all young fruit within acertain maturity class may abscise on certain stressful days, but when conditionsimprove later an even larger number of fruits might be added and subsequentlysupported to maturity.
It is interesting to find a decrease in canopy photosynthesis in cotton duringthe important fruit-growth period (Fig. 7). Among possible reasons for thisdecline is a decrease in solar radiation as the season progresses in themidsouthern USA; however, this can be excluded in the present SPAR studybecause the data were normalized to a PPFD of 1200 ,umol-2 m- 2 S-I. Therefore,one must conclude that radiation-use efficiency decreased in these plants as theseason progressed following flowering. Regressing photosynthetic rates as afunction of days after emergence (DAE) from DAE 80 to maturity yielded aslope of -0.032mg C02 m- 2 s- 1 d- 1 for 360,umol CO2 mol- 1 air and -0.015mgC02 m- 2 s- 1 d- 1 for 720,umol C02 mol- 1 air (Fig. 7). The ratio of these diurnalslope values indicates Pn was enhanced about 46% by doubled [C02], ascompared to plants grown in ambient [C02]. This reflects a 47% greater rate ofcanopy photosynthesis in plants grown at twice-ambient [C02] on 80 days afteremergence compared to plants grown in ambient [C02]. The net effect was anapproximate doubling (99% increase) of cumulative seasonal net photosynthesisestimated using the regression parameters from each day's net photosynthesis
8...----.---,-----,...----.---,-----,...----.---,-----,,.....---.---,-----,,.....---.------,
Open BallFlower
'r""
'f/) 7N
'E 6N
8 5C)
E 4en'00~ 3-c~ 2o(5.c. 1a..
O'-------'--...L---'UL..-----'-_...L-----''-------'-_....lIL..----''-------'-_...L-----''--------'---1
20 30 40 50 60 70 80 90 100 110 120 130 140 150 160
Days after Emergence
Fig. 7. Net photosynthesis of cotton canopies grown at 1995 ambienttemperatures, and 360 or 720,uL L-I CO2• Photosynthesis was measured at 10-s intervals and averaged over 900-s intervals. The 900-s photosyntheticvalues were regressed against radiation for the same 900-s intervals, anddaily values at 1200,umolm-2 s- 1 PPFD are shown. Initiations of floweringand ball opening in 50% of the plants are indicated by small vertical barsfrom left to right, respectively.
VOL, 30 (2001)

40 K. RAJA REDDY et al.
values, due to doubling CO2 levels, from 7.25 kg CO2 assimilated in ambient airto 14.49 kg C02 assimilated in elevated [C02]. Higher photosynthesis in elevatedCO2 environments may be due to both the direct effects of higher [C02] in theatmosphere and thus a CO2 steeper gradient between atmosphere and thechloroplasts and the indirect effects of carbon on sustaining more vegetativegrowth longer into the fruiting period thus causing a younger canopy of leavesin the high-C02-grown crop.
Crop developmental ratesExamples of classical growth analysis to determine changes in a
developmental rate of a cotton crop are presented in Figs. 8 to 11 for plantsgrown under favorable water and nutrient conditions. It is practicallyimpossible to obtain such data in field situations, because many physiologicaland environmental factors vary or interact in complex ways to affect cottondevelopment. Even with suitable control of cultural practices, severalexperiments are needed from different geographic locations in order to generatevalid crop development data. Using SPAR chambers, it is possible to describethe number of days between seedling emergence and first square, and calculatethe daily rate of development (reciprocal of days) for this developmental processto occur (Fig. 8). Similarly, the rate of square (flower-bud) and bolldevelopment can be described (Fig. 9), as well as plastochrons for mainstemleaves and fruiting branches, as a function of temperature (Fig. 10). Theseprocesses are important for understanding growth and development in cotton,and in managing the crop, because it is tropical in origin, and very sensitiveambient temperatures.
In a field environment, variability in temperature within and between days
0.06
0.05 ..-I"t:l
0.04,g[~(ij
0.03 "E<I>Ea.
0.02 0Q)><I>
0.01 Cl
0.003530
Developmental rate
Days to first flower-bud
2520
80 ,...------,--------.-------.-------,
70
20
10 '--- --' ----J. ----'- ----'
15
~5i 60e>~ 50<I>
CD 40~co~ 30coCl
Temperature, °C
Fig. 8. Influence of temperature on the development of first flower budin a cotton and/or rate of development. The rate of development wascalculated as the multiplicative inverse of duration; Le., one over days at agiven temperature (see 43 for details).
BIOTRONICS

SPAR FACILITY FOR PLANT RESEARCH AND MODELING 41
Square to flower
4035
Flower to open boil
30
g 8 0 C~O---=;"'t--__
0.07
0.06.....
I"0
0.05oi......ca....ro 0.04......c::Q)
E 0.030-0ID 0.02>Q)
00.01
0.0015 20 25
Temperature, DC
Fig. 9 . Influence of temperature on the rate of crop development: firstflower-bud to open flower and flower to open a boll in cotton grown eitherat ambient (350,uL L~l) or twice ambient CO2 levels. The rate ofdevelopment was calculated as the multiplicative inverse of duration; i.e.,one over days at a given temperature (43, 46).
0.7
0.6 Mainstem.....I"0
oi 0...... 0.5~
ro...... 0.4c::Q)
Eg- 0.3ID Fruiting branches>Q)
0.2 0 ~ 0"0- ~O<j 0ca
Q)...J 0.1
40353025200.0 '-------'------'---------'-------'---------'
15
Temperature, DC
Fig. 10. Influence of temperature on the rate of mainstem leafdevelopment and fruiting branches in cotton. The rate of development wascalculated as the multiplicative inverse of duration; i.e., one over days at agiven temperature (46).
VOL. 30 (2001)

K. RAJA REDDY et al.42
70
"0
-0 60::J
.J:Jt.!..ID~0 50ii=
~l;::
.940ID
0cID~IDE 30w
2015 20 25
o Upland, cv. DPL 51
• Upland, cv. DES 119; DPL 5415
o Pima, cv. S-6
30 35
Temperature, °C
Fig. 11. Effect of ambient air temperature and cotton cultivars on daysfrom emergence to first square for plants grown either at ambient (350,uLL-1) or twice ambient CO2 levels.
makes develop functions for plant phenology nearly impossible, but suchfunctions can be developed in the SPAR units and applied effectively to predictgrowth and development in the natural world where variable conditions areparamount. Although one can estimate phenological development by usingeither hourly or daily developmental rates and either hourly or dailytemperatures, the data can be more useful if one calculates the reciprocal of thenumber of days required to reach an event from the average temperature foreach day. These daily reciprocal values can be added together until they total1. 0 or greater. At that time, the phenological event should be observed. Dailyaverage temperature can be estimated by summing the maximum and minimumtemperatures and dividing by two. When cotton plants were grown incontinuously varying temperatures such as occurs in nature, we observed plantshave responses similar to those of plants grown at the same average, but atconstant day/night temperature conditions typical of SPAR units (33, 44).
We have incorporated a number of process-level rate equations andalgorithms into the cotton simulation model, GOSSYM/COMAX (13, 43) andtested the predictive ability of these algorithms using independent data sets thatmeasured plant height, mainstem node numbers, and yield collected across the U.S. Cotton Belt. The data sets comprise both irrigated and rain-fed conditions,with three or more cultivars, and with several different soils. The performancestatistics for GOSSYM/COMAX model prove the applicability of the algorithmsgenerated using the SPAR facility (Table 2).
One can use similar procedures to develop computer-assisted tools forestimating the time for other developmental events to occur, such as the additionof a new mainstem node that supports a leaf and sympodial branch of a fully
BIOTRONICS

SPAR FACILITY FOR PLANT RESEARCH AND MODELING
Table 2. Performance statistics of the simulation model GOSSYM/COMAX for plant height, mainstem nodes, and yields determined fromindeperdent data sets between 1987 to 1992 across the U. S. cotton belt.
43
Variable Number of management units Number of observations Slope R2
Plant height, cm 50 235 0.9420 0.96
Mainstem nodes, no. 50 235 0.9986 0.94
Yield, kg ha- 1 38 38 0.9523 0.94
expanded leaf. Such an exercise can be readily performed, but using recordsfor dates of planting and emergence and daily temperatures. This calculationallows one to document an almost reasonably quantitative estimate of cropstatus that is almost independent of location or calendar dates. Water andnutrient deficits seem to have little effect on developmental processes in cottonunless the deficiencies are extreme. However, such deficiencies dramaticallyaffect leaf and stem growth processes and thus alter canopy development.
We have found both species and cultivars have different temperatureresponse functions (Table O. For example, the minimum number of daysrequired for two Upland cotton cultivars, DES 119 or DPL 5415, to produce thefirst square was observed at 28°C (Fig. 11). Another Upland cultivar, DPL 50,required 5 to 8 more days to produce the first square at all temperatures. APima cotton cultivar, S--6, had a response for this developmental event nearlyequal to that of an Upland cultivar, DES 119, up to 27 to 28°C, but in highertemperatures, Pima development was delayed by about 8 days at 30°C, and 15days at 35°C compared to DES 119. Pima cultivar, S-6, failed to produce squaresif the temperature was above 35°C. This knowledge helps to identify the level ofheat tolerance in different species and varieties, and illustrates that certainvarietal traits can be selected to fit a niche environment.
Examples of responses to specific deprivationsThe relationship between midday leaf water potential and both canopy net
photosynthesis and stem growth in cotton clearly illustrates the effects of asingle, well-defined environmental variable on different plant processes (Fig. 12).Results demonstrate that stem elongation is more sensitive to water deficits thanphotosynthesis. The relationships between these two plant processes differunder different environmentally-induced stresses, but they are consistent andpredictable. The relationship must be appropriately modeled to be usable forproducers to manage cultural practice for optimum benefits and for thosedeveloping cultivars with adaptations to stressful environments. For instance,the relationship between different plant processes may shift under nutrientstress conditions. In well-fertilized plants, both photosynthesis and leafexpansion proceed at their potential rates; however, in N-deficient environmentsleaf expansion is reduced more than photosynthesis (Fig. 13).
VGL. 30 (2001)

44 K. RAJA REDDY et al.
1.2 1.2
E 0 Photosynthesis E::J 1.0 1.0 ::JE • Stem elongation rate E'x 'xco coE 0.8 0.8 E-0 0 -0~ ~0
C 0.6 0.60
en0 '(j):;:;co Q)
g> 0.4 0.4.s::.
• .....c0 0 >.
CD CIJ0
E 0.2 0.2 ClQ) .s::...... Cl..en
0.0 0.0-3.5 -3.0 -2.5 -2.0 -1.5 -1.0
Midday leaf water potential, MPa
Fig. 12. Net photosynthesis and stem elongation during the lineargrowth phase (expressed as fraction of the maximum) as a function ofmidday leaf water potential for plants grown at a range of water deficittreatments. Photosynthesis was measured at 10-s intervals and averagedover 900-s intervals. The 900-s photosynthetic values were regressed againstsolar radiation for the same 900-s intervals, and daily values forphotosynthesis at 1600 ,umol m -2 S-1 are presented.
2.5
••
•
Leaf expansion
2.0
••
1.5
-1700 IJL L CO2
-1350 IJL L CO2o
•o 00
o ~·...-:/o ~ Q• o~ 0 0 •
.0 ~ • 0~ 0 0
~o
.A. 0
.AD
• o.............. 0 0
/ "0/
Photosynthesis
o
•1.2
1.0E::JE'x 0.8a:lEQ)
0.6.s::......-0c0 0.415a:l...u..
0.2
0.01.0
Leaf nitrogen, g m-2 leaf
Fig. 13. Single-leaf photosynthesis and leaf area expansion in cottongrown in 350 and 700,uL L -1 air, and at 30/22°C (day/night) as a function ofleaf nitrogen. Photosynthesis and leaf area expansion are expressed as afraction of maximum nitrogen levels. The uppermost fully expanded leaveswere used for these measurements, as well as leaf nitrogen measurements.
BIOTRON/CS

SPAR FACILITY FOR PLANT RESEARCH AND MODELING 45
Examples of high temperature injury in cotton fruitThe effect of high temperature on cotton flower and boIl retention has been
previously documented (9, 10, 16, 25), but no one has attempted to quantify theimpact of well-defined high-temperature conditions. The cause of boIlabscission in field environments is often confounded with other factors, such as
Boils produced
Boils retained
32 33 34 35
o
v 350 C02 IJL L-1
o 700 C02 IJL L-1
350
300
250~
E0 200c::
.!!l 150(51Il
100
50
025 26 27 28 29 30 31
Temperature, QC
Fig. 14. Influence of temperature on fruit production and fruit retentionfor plants grown in ambient and elevated [C02]. Temperature treatmentswere imposed at initial flowering and the data were collected during 4weeks of treatment (42).
100
80c0
:;::::;c2 60~
CQ)
~ 40Time at 40°C d-1
Q)a..
---0- 2 hours
20 ~ 4 hours.-;r- 6 hours
---0- 12 hoursOl...-__L-__L-__L-__L-__L-__L-__.L.------J
o 3 6 9 12 15 18 21
Cumulative boils, no. planr1
Fig. 15. Effects of hours per day at 40°C on fruit retention. Plantswere maintained at air temperature of 27°C, except for a few days whentemperature was increased to at 40°C (see 34 for details).
VOL. 30 (2001)

46 K. RA]A REDDY et al.
insect damage, boIl load, or water and nutrient stresses. Figures 14 and 15illustrate the effect of high-temperature injury on cotton fruit retention, asfactors other than temperature were eliminated as uncontrolled variables. Themechanisms causing reproductive failure at high temperature are still not fullyunderstood, but the consequences are clear and quantifiable. When plants weregrown at 40°C, we observed injury to the developing ovules up to 12 days beforepollination. Pollen was also damaged when plants were at 40°C duringdevelopment. Because, selection for heat-tolerant genotypes is an objective inboth traditional breeding and biotechnology research programs, temperatureresponses are certainly an area of research that needs further and more extensivestudy in many crops.
SUMMARY AND CONCLUSIONS
We have shown how controlled-environment facilities can be used toincrease our knowledge of plant responses to individual environmental factorsand how the information may be linked to a simulation model to predict cropresponses in diverse and varying environments; The impact of cultural practicescan be predicted with such information to further enhance management of thecrop. Operating a SPAR facility to acquire such data will often be moreeconomical than the use of field-plot experiments, because it allows the scientistto avoid many of the covarying and confounding factors that occur in fieldexperiments. Thus, the basic processes can be related more directly to theenvironmental variables being studied.
As we progress in developing systems for understanding plant response toenvironment, whether in support of global climatic change research, theapplication of plants in the remediation of environmental conditions, or theincreased application of precision agriculture technologies, the need fordiagnostics and management decision aids will become more urgent.Mechanistic plant models and automated, user-friendly expert systems canfacilitate selection of the optimum solutions to problems with many variables.Essentially all of the engineering and computing technologies needed to allowthe use of variable and site-specific technologies, such as precision agriculture,are now available. However, our understanding of the plant ecophysiologicalresponses to the environment as it relates to specific growth and developmentalevents require further development. Although comprehensive knowledge fordeveloping a model for all aspects of plant growth and development may not beavailable, the ability to simulate some of the more significant and/or meaningfulportions of the crop/ecosystem provides clarity and purpose to the research.For a model to correctly predict plant responses to environment, the crop andgenotype-specific response functions must be realistically assembled. Theserelationships should include, but not be limited to, the phenological responses ofspecific genotypes to temperature and their responses to environmental stresses.We would, for example, expect to find quantifiable differences among genotypesin fruit-shed sensitivity to above-optimum temperature and to deficiencies of
BIOTRONICS

SPAR FACILITY FOR PLANT RESEARCH AND MODELING 47
water and/or nutrients. One might also find differences in sensitivity of fruitshed to plant-C deficiency caused by an imbalance between photosynthesis,fruiting rate, and vegetative growth. These environment-genotype interactionscan be measured and incorporated into a meaningful model. We have been ableto demonstrate a model, GOSSYM/COMAX, that is based on appropriateconcepts and processes, and has predictive capability in new environments. Thesimulation model can be used either alone or with other emerging newertechnologies to display/disseminate useful plant growth and developmentinformation.
There are currently a variety of approaches and facilities to investigate plantresponses to the environment. Among these, the SPAR facilities are optimizedfor the measurement of plant and canopy-level physiological responses toprecisely controlled, but naturally lit, environmental conditions. The data thathave been and will be obtained are unique and particularly instructive forapplied and basic plant biologists.
ACKNOWLEDGMENTS
We wish to thank Gary Burrell, Kim Gourley, Wendell Ladner and SamTurner for their valuable technical support. Part of the research was funded bythe US DOE National Institute for Global Environment Change through theSouth Central Regional Center at Tulane University (DOE cooperative agreementno. DE-FC03-90ER 61010) and the National Aeronautical and Space Administration-funded Remote Sensing Technology Center at Mississippi StateUniversity (NASA grant no. NCCI3-9900l).
REFERENCES
1. Acock B, Acock M. C. (1989) Calculating air leakage rates in controlled--environmentchambers containing plants. Agron.]. 81, 619-623.
2. Acock B, Reddy V. R, Hodges H. F., Baker D. N., McKinion J. M. (1985) Photosyntheticresponse of soybean canopies to full-season carbon dioxide enrichment. Agron.]. 77,942-947.
3. AlIen L. H. Jr., Boote K. J. (2000) Crop ecosystem responses to climatic change:soybean. Pages 133-160 in K. R Reddy and H. F. Hodges (eds) Climate Change andGlobal Crop Productivity. CABI Publishing, CAB International, Wallingford, axon, UK.
4. AlIen L. H. Jr., Drake B. G., Rogers H. H., Shinn J. H. (1992) Field techniques forexposure of plants and ecosystems to elevated CO2 and other trace gases. Crit. Rev. Pl.Sci. 11, 85-119.
5. Arp W. J. (1991) Effects of source-sink relations on photosynthetic acclimation toelevated CO2• Plant Cell Environ. 14, 869-875.
6. Baker D. N., Lambert J. R, McKinion J. M. (1983) GOSSYM: a simulator of cotton cropgrowth and yield. South Carolina Agric. Expt. Stn. Tech. Bull. no. 1089. South Carolina,SC. USA
7. Boone M. Y. L., Porter D. O. and McKinion J. M. (1993) Calibration of GOSSYM:Theory and practice. Computers Elec. Agric. 93, 193-204.
8. Corey K. A., Wheeler R. M. (1992) Gas exchange in NASA's biomass productionchamber: A prototype closed human life support system. BioSci. 42, 503-509.
VGL. 30 (2001)

48 K. RAJA REDDY et al.
9. Ehlig C. F., LeMert RD. (1973) Effects of fruit load, temperature and relativehumidity on boIl retention of cotton. Crop Sci. 13, 168-171.
10. Hesketh J. D., Baker D. N., Duncan W. G. (1972) Simulation of growth and yield incotton: n. Environmental control of morphogenesis. Crop Sci. 12, 436-439.
11. Hodges H. F., Reddy V. R, Reddy K. R (1991) Mepiquat chloride and temperatureeffects on photosynthesis and respiration of fruiting cotton. Crop Sci. 31, 1302-1308.
12. Hodges H. F., Reddy K. R, McKinion J. M., Reddy V. R (1993) Temperature effects oncotton. MississiPPi Agric. For. Expt. Stn. Bull. No. 990. Mississippi State, Mississippi.Pages 15.
13. Hodges H. F., Whisler F. D., Bridges S. M., Reddy K. R, McKinion J. M. (1998)Simulation in crop management- GOSSYM/COMAX. Pages 235-282 in R M. Peart andR B. Curry (eds) Agricultural Systems Modeling and Simulation. Marcel Dekker, Inc.,New York, USA.
14. Horie T., Baker J. T., Nakagawa H., Matsui T., Kim H. Y. (2000) Crop ecosystemresponses to climatic change: rice. Pages 81-106 in K. R Reddy and H. F. Hodges (eds)Climate Change and Global Crop Productivity. CABI Publishing, CAB International,Wallingford, Oxon, UK.
15. Jones P, Jones J. W., AlIen L. H. jr., Mishoe J. W. (1984) Dynamic computer control ofclosed environment plant growth chambers: Design and verification. Trans. Am. Soc.Agric. Engi. 27, 879-888.
16. Kittock D. L., Turcotte E. L. and Hofman W. C. (1998) Estimation of heat toleranceimprovement in recent American pima cotton cultivars. ]. Agron. Carp Sci. 161, 305309.
17. Ladewig H., Thomas J. K. (1992) A follow-up evaluation of the GOSSYM/COMAXCotton Program. Texas Agric. Expt. Ser. pp. 1-47.
18. McKinion J. M. (1980) Dynamic simulation: a positive feedback mechanism forexperimental research in the biological sciences. Agric. Sys. 5, 239-250.
19. McKinion J. M. (1984) Microcomputers, data acquisition, and the IEEE-488 bus. 1984Winter Meeting Am. Soc. Agric. Engi. Paper 84- 5528.
20. McKinion J. M. (1986) SPARNET: a data acquisition/analysis computer network.Computers Electron. Agric. 1, 163-172.
21. McKinion J. M., Baker D. N. (1982) Modeling, experimentation, verification andvalidation: closing the feedback loop. Trans. Am. Soc. Agric. Engi. 25, 647-653.
22. McKinion J. M., Bell C. J. (1983) Design and operation of the SPAR cooling system.1983 Summer Meeting Am. Soc. Agric. Engi. Paper 83-3033.
23. McKinion J. M., Hodges H. F. (1985) Automated system for measurement ofevapotranspiration from closed environmental growth chambers. Trans. Am. Soc.Agric. Engi. 28, 1825-1828.
24. McKinion J. M., Baker D. N., Whisler F. D., Lambert J. R (1989) Application of theGOSSYM/COMAX system to cotton crop management. Agric. Sys. 31, 55-65.
25. Meyer V. G. (1969) Some effects of genes, cytoplasm and environment on malesterility in cotton (Gossypium). Crop Sci. 9, 237-242.
26. Phene C. J., Baker D. N., Lambert J. R, Parsons J. E., McKinion J. M. (1978) SPAR-a soil-plant-atmospheric-research system. Trans .rim. Soc. Agric. Engi. 21, 924-930.
27. Parsons J. E., Dunlap J. L., McKinion J. M., Phene C. J., Baker D. N. (1980) Micro'processor-based data acquisition and control software for plant growth chambers(SPAR system). Trans. Am. Soc. Agric. Engi. 23, 589-595.
28. Pickering N. B.. AlIen L. H. Jr., Albrecht S. L., Jones P., Jones J. W., Baker J. T. (1994)Environmental plant growth chambers: control and measurement using CR-10Tdataloggers. Pages 29-35 in D. G. Watson, P. S. Zazueta and P. S. Harrison (eds)Computers in Agriculture. Proceedings of the 5th International Conference, Am. Soc.Agric. Engi. St. Joseph, MI, USA.
29. Reddy A. R, Reddy K. R, Hodges H. F. (1996) Mepiquat chloride-induced changes in
BIOTRONICS

SPAR FACILITY FOR PLANT RESEARCH AND MODELING 49
photosynthesis and growth of cotton. Plant Growth Regul. 20, 179-183.30. Reddy A. R., Reddy K. R., Hodges H. F. (1997) Dynamics of canopy photosynthesis in
Pima cotton as influenced by growth temperatures. Indian J Expt. Bioi. 35, 1002-1006.31. Reddy A. R., Reddy K. R., Hodges H. F. (1998) Interactive effects of elevated carbon
dioxide and growth temperature on photosynthesis in cotton leaves. Plant Growth Reg.22, 1-8.
32. Reddy K. R., Hodges H. F., McKinion J. M. (1992a) Cotton crop responses to globalclimate change. World Resour. Rev. 4, 348-365.
33. Reddy K. R., Reddy V. R., Hodges H. F. (1992b) Effects of temperature on early seasoncotton growth and development. Agron.]. 84, 229-237.
34. Reddy K. R., Hodges H. F., Reddy V. R. (1992c) Temperature effects on cotton fruitretention. Agron.]. 84, 26-30.
35. Reddy K. R., Hodges H. F., McKinion J. M., Wall G. W. (1992d) Temperature effects onPima cotton growth and development. Agron.]. 84, 237-243.
36. Reddy K. R., Hodges H. F., McKinion J. M. (1993) A temperature model for cottonphenology. Biotronics 2, 47-59.
37. Reddy K. R., Hodges H. F., McKinion J. M. (1995a) Carbon dioxide and temperatureeffects on Pima cotton growth. Agric. Ecosys. Environ. 54, 7-29.
38. Reddy K. R., Hodges H. F., McKinion J. M. (1995b) Carbon dioxide and temperatureeffects on Pima cotton development. Agron.]. 87, 820-826.
39. Reddy K. K, Hodges H. F., McKinion J. M. (1995c) Cotton crop responses to a changingenvironment. Pages 3-30 in C. Rosenzweig et al. (eds), Climate Change and Agriculture:Analysis of Potential International Impacts. Am. Soc. Agron. Special Publ. No. 59.Madison, WI, USA.
40. Reddy K. R., Boone M. L., Reddy A. R., Hodges H. F., Turner S. M., McKinion J. M. (1995d) Developing and validating a model for a plant growth regulator. Agron.]. 87, 1100-1105.
41. Reddy K. R., Hodges H. F., McKinion J. M. (1996a) Food and agriculture in the 21stcentury: A cotton example. World Resour. Rev. 8, 80-97.
42. Reddy K. R., Hodges H. F., McCarty W. H., McKinion J. M. (1996b) Weather and cottongrowth: Present and future. Mississippi Agric. For. Expt. St. Bull. No: 1061, MississippiState University, Mississippi State, pp. 23.
43. Reddy K. R., Hodges H. F., McKinion J. M. (1997a) Crop modeling and applications: Acotton example. Pages 225-290 in D. L. Sparks (eds) Advances in Agronomy. AcademicPress, San Diego, CA, USA.
44. Reddy K. R., Hodges H. F., McKinion J. M. (1997b) A comparison of scenarios for theeffect of global climate change on cotton growth and yield. Aust. J Pi. Physiol. 24, 707-713.
45. Reddy K. R., Hodges H. F., McKinion J. M. (1997c) Water and nutrient deficits, cropyields and climate change. World Resour. Rev. 10, 23-43.
46. Reddy K. R., Hodges H. F., McKinion J. M. (1997d) Modeling temperature effects oncotton internode and leaf growth. Crop Sci. 37, 503-509.
47. Reddy K. R., Robana R. R., Hodges H. F., Liu X. J., McKinion J. M. (l998) Influence ofatmospheric CO2 and temperature on cotton growth and leaf characteristics. Environ.Expt. Bot. 39, 117-129.
48. Reddy K. R., Hodges H. F., Kimball B. A. (2000) Crop ecosystem responses to climaticchange: cotton. Pages 161-187 in K. R. Reddy and H. F. Hodges (eds) Climate Changeand Global Crop Productivity. CABI Publishing, CAB International, Wallingford, axon,UK.
49. Reddy V. R., Reddy K. R., Acock M. C., Trent A. (1994a) Carbon dioxide enrichmentand temperature effects on root growth in cotton. Biotronics 23, 47-57.
50. Reddy V. R., Reddy K. R., Acock B. (1994b) Carbon dioxide and temperature effects oncotton leaf initiation and development. Biotronics 23, 59-74.
VOL. 30 (2001)

50 K. RAJA REDDY et al.
51. Reddy V. R, Reddy K. R, Acock B. (1995a) Carbon dioxide and temperatureinteractions on stem extension, node initiation and fruiting in cotton. Agric. Ecosys.Environ. 55, 17-28.
52. Reddy V. R, Reddy K. R, Hodges H. F. (1995b) Carbon dioxide enrichment andtemperature effects on canopy cotton photosynthesis, transpiration, and water useefficiency. Field Crops Res. 41, 13-23.
53. Reddy V. R, Reddy K. R, Wang Z. (1997) Cotton responses to nitrogen, carbondioxide, and temperature interactions. Soil Sci. Plant Nutr. 43, 1125-1130.
54. Reddy V. R, Acock B., Acock M. C. (1989) Seasonal carbon and nitrogen accumulationin relation to net carbon dioxide exchange in a carbon dioxide-enriched soybeancanopy. Agron.]. 81, 78-83.
55. Sage, R F. (1994) Acc1imation of photosynthesis to increasing atmospheric C02: Thegas exchange perspective. Photosynthesis Res. 39, 351~368.
56. Tarpley L., Reddy K. R, Sassenrath-Cole G. F. (2000) Reflectance indices withprecision and accuracy in predicting cotton leaf nitrogen concentration. Crop Sci. 40,1814-1819.
57. Tingey D. T., McVeety B. D., Waschmann R, Johnson M. G., Phillips D. L., Rygiewicz P.T., Olszyk D. M. (1996) A versatile sun-lit controlled-environment facility for studyingplant and soil processes. ]. Environ. Qual. 25, 614-625.
58. Wells R, Meredith Jr. W. R, Williford J. R (1986) Canopy photosynthesis and itsrelationship to plant productivity in near-isogenic cotton lines differing in leafmorphology. Plant Physiol. 82, 635-640.
BIOTRONICS