soil-pile interaction in fb-multipier developed by: florida bridge software institute dr. mike...
TRANSCRIPT

Soil-Pile Interaction in FB-MultiPier
Developed by: Florida Bridge Software Institute
Dr. Mike McVay, Dr. Marc Hoit, Dr. Mark Williams
Dr. J. Brian Anderson, P.E.
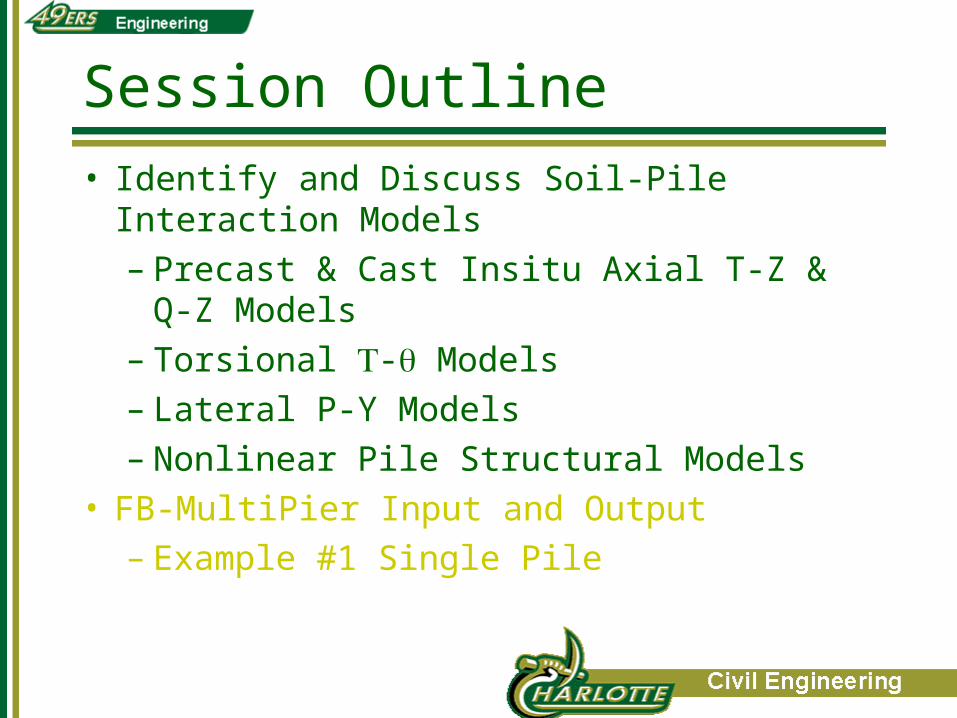
Session Outline
• Identify and Discuss Soil-Pile Interaction Models– Precast & Cast Insitu Axial T-Z & Q-Z Models– Torsional - Models– Lateral P-Y Models– Nonlinear Pile Structural Models
• FB-MultiPier Input and Output– Example #1 Single Pile

Session Outline
• Identify and Discuss Soil-Pile Interaction Models– Precast & Cast Insitu Axial T-Z & Q-Z Models– Torsional - Models– Lateral P-Y Models– Nonlinear Pile Structural Models
• FB-MultiPier Input and Output– Example #1 Single Pile
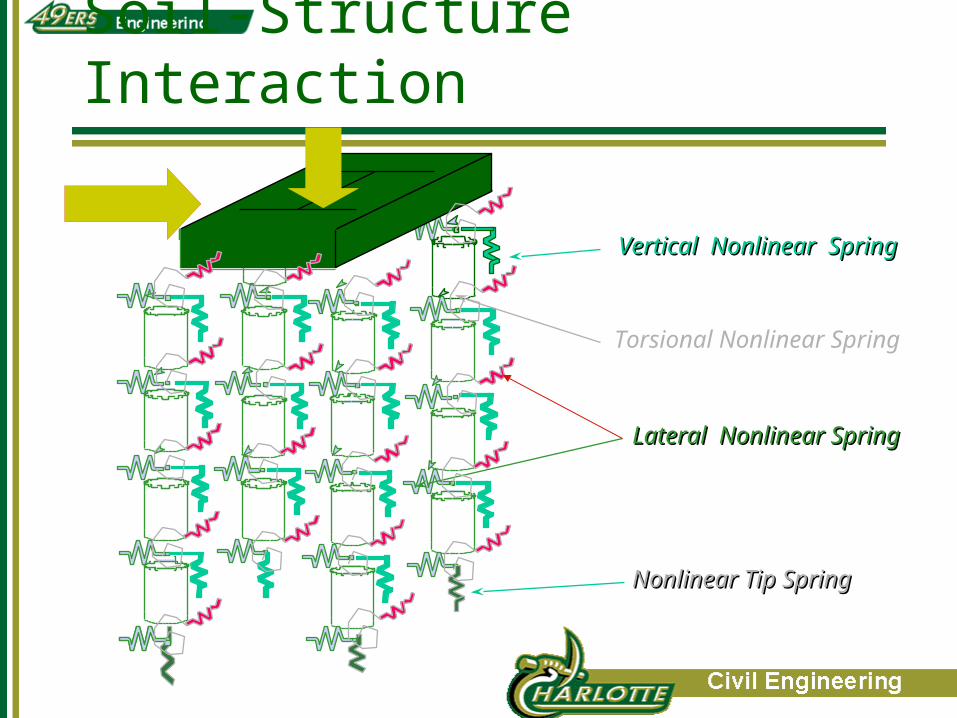
Soil-Structure Interaction
Vertical Nonlinear SpringVertical Nonlinear Spring
Lateral Nonlinear SpringLateral Nonlinear Spring
Torsional Nonlinear Spring
Nonlinear Tip SpringNonlinear Tip Spring

Driven Piles - Axial Side Model
z
r
z
r
r + r / r r
z
r
r
+ / r r
r
roo
(Randolph &
Wroth)

Driven Piles - Axial Side Model
zZ
r
rd
zd
r
zG
Also:
Substitute: Grd
zd
Rearrange: drG
dz
Previous r
roo
Substitute: drGr
rdz o 0
rm
r0
Also:
2
fi 1
GG
Substitute:
m
0
r
r2
fi
0
1
dr
Gr
rz o

Driven Piles - Axial Side Model
f
0 0
0m
0m
0
m
i
00 ,lnz
r
rr
rr
r
r
G
r
T-Z (Along Pile)
0
200
400
600
800
1000
1200
0 0.5 1 1.5
z - Displacement (inches)
Tau
0 (
psf) f = 1000psf
Gi = 3 ksi

Driven Piles - Axial Tip Model
2
fi0 P
P1Gr4
-1Pz
Where:
P = Mobilized Base LoadPf = Failure Tip Loadro = effective pile radius = Poisson ratio of SoilGi = Shear Modulus of SoilT-Z (At Tip)
0
50
100
150
200
250
300
0 1 2 3 4 5
z - Displacement (inches)
Tip
Loa
d (k
ips) Pf = 250 kips
Gi = 10 ksi = 0.3r0 = 12 inches
(Kraft, Wroth, etc.)

Driven Piles - Axial Properties
• Ultimate Skin Friction (stress), Tauf , along side of pile (input in layers).
• Ultimate Tip Resistance (Force), Pf , at pile tip .
• Compressibility of individual soil layers, I.e. Shear Modulus, Gi , and Poisson’s ratio, .
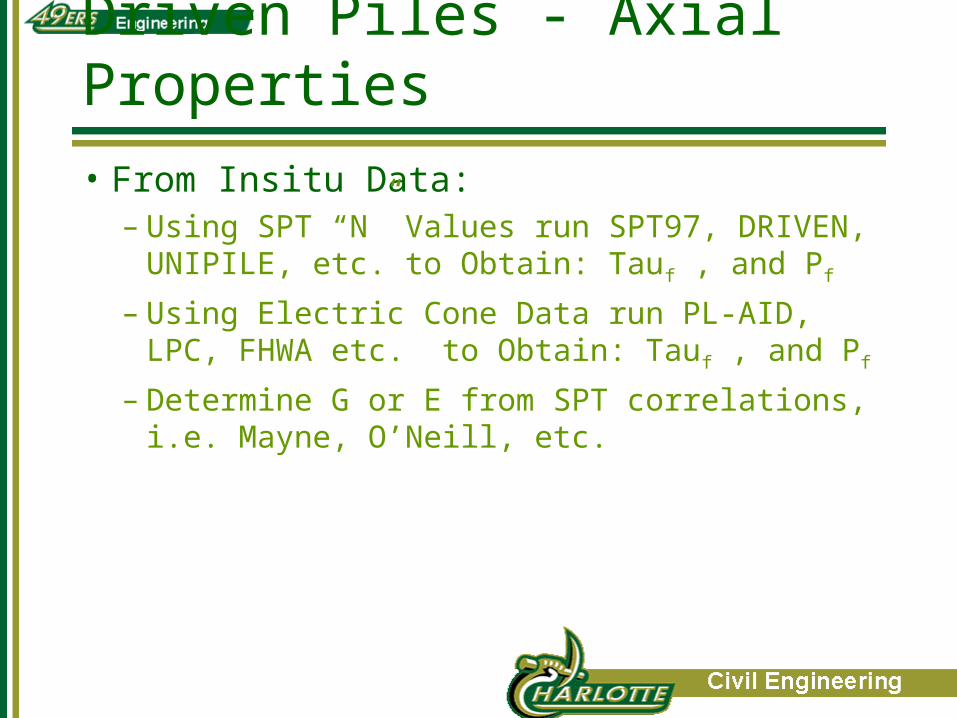
Driven Piles - Axial Properties
• From Insitu Data:– Using SPT “N” Values run SPT97, DRIVEN,
UNIPILE, etc. to Obtain: Tauf , and Pf
– Using Electric Cone Data run PL-AID, LPC, FHWA etc. to Obtain: Tauf , and Pf
– Determine G or E from SPT correlations, i.e. Mayne, O’Neill, etc.
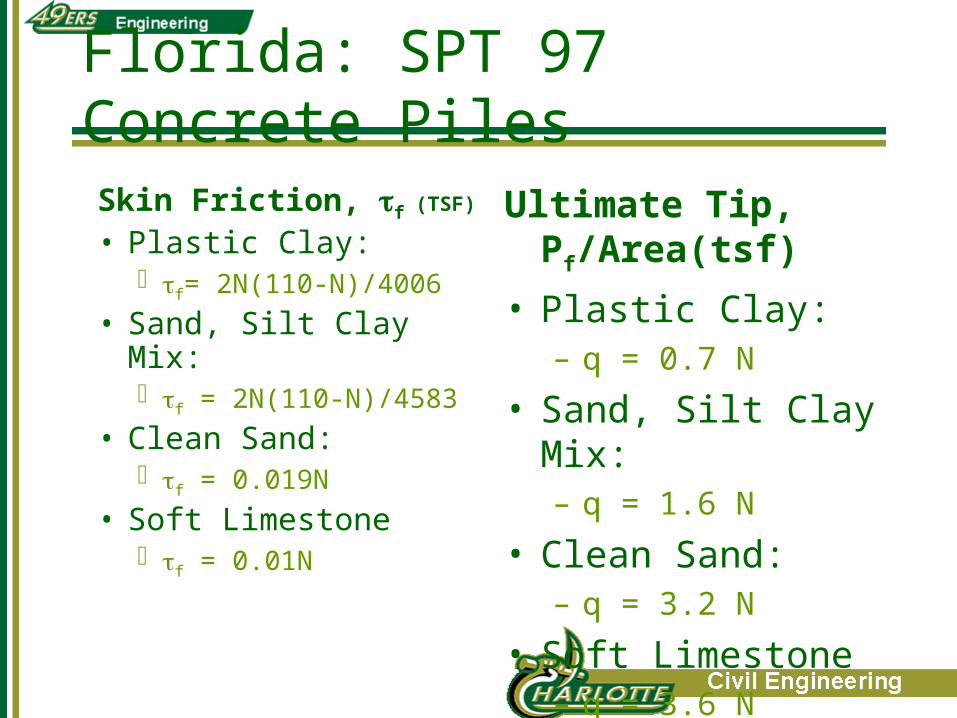
Florida: SPT 97 Concrete Piles
Skin Friction, f (TSF)
• Plastic Clay: f= 2N(110-N)/4006
• Sand, Silt Clay Mix: f = 2N(110-N)/4583
• Clean Sand: f = 0.019N
• Soft Limestone f = 0.01N
Ultimate Tip, Pf/Area(tsf)
• Plastic Clay:– q = 0.7 N
• Sand, Silt Clay Mix:– q = 1.6 N
• Clean Sand:– q = 3.2 N
• Soft Limestone– q = 3.6 N

Cast Insitu Axial Side and Tip Models
• For soil (sands and clays) – Follow FHWA Drilled Shaft Manual For Sands
and Clays to Obtain Tauf and Pf ( and cu)
– Shape of T-Z cuve is given by FHWA’s Trend Lines.
• User has Option of inputting custom T-z / Q-z curves

Cast Insitu - Sand (FHWA):
Qs = D L v’
DL
L/2v’ = L/2
L/2) 0.5 1.2>
Qt = 0.6 NSPT D 2 / 4 NSPT < 75
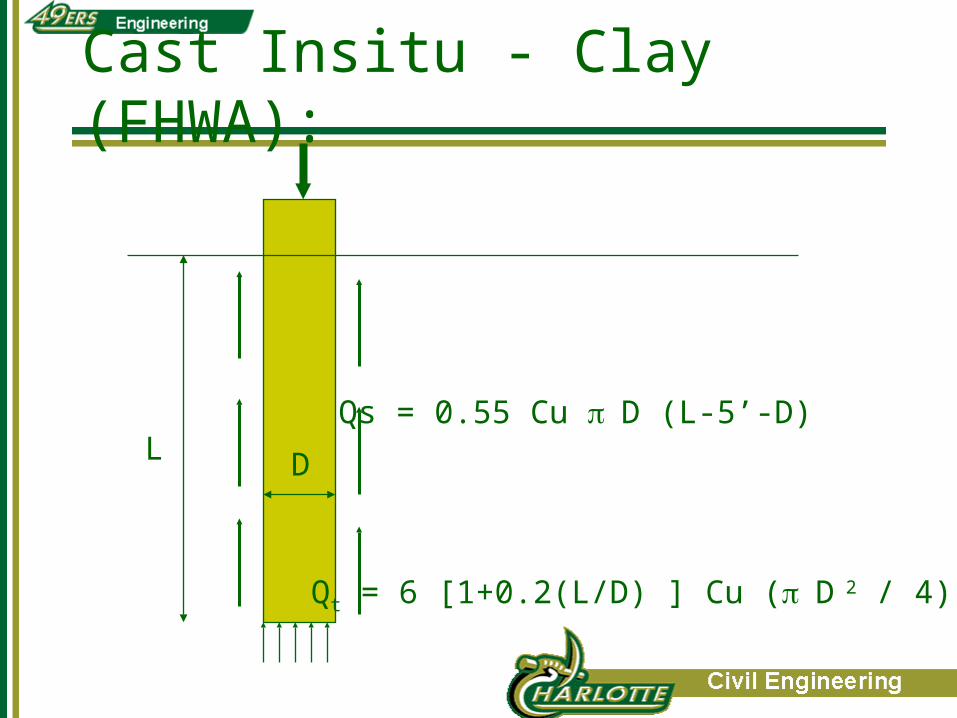
Cast Insitu - Clay (FHWA):
DLQs = 0.55 Cu D (L-5’-D)
Qt = 6 [1+0.2(L/D) ] Cu (D 2 / 4)

Cast Insitu trend line for Sand
0.0
0.2
0.4
0.6
0.8
1.0
1.2
1.4
1.6
0 2 4 6 8 10
Settlement / Diameter (%)
Mo
bili
zed
Str
ess
/ Ult
imat
e S
tres
s
End Bearing
Side Friction

Cast Insitu trend line for Clay
0.0
0.2
0.4
0.6
0.8
1.0
1.2
1.4
1.6
0 2 4 6 8 10
Settlement / Diameter (%)
Mo
bili
zed
Str
ess
/ Ult
imat
e S
tres
s
End Bearing
Side Friction

Session Outline
• Identify and Discuss Soil-Pile Interaction Models– Precast & Cast Insitu Axial T-Z & Q-Z Models– Torsional - Models– Lateral P-Y Models– Nonlinear Pile Structural Models
• FB-MultiPier Input and Output– Example #1 Single Pile

Torsional Model (Pile/Shaft)
• Hyperbolic Model– G and Tauf
• Custom T-
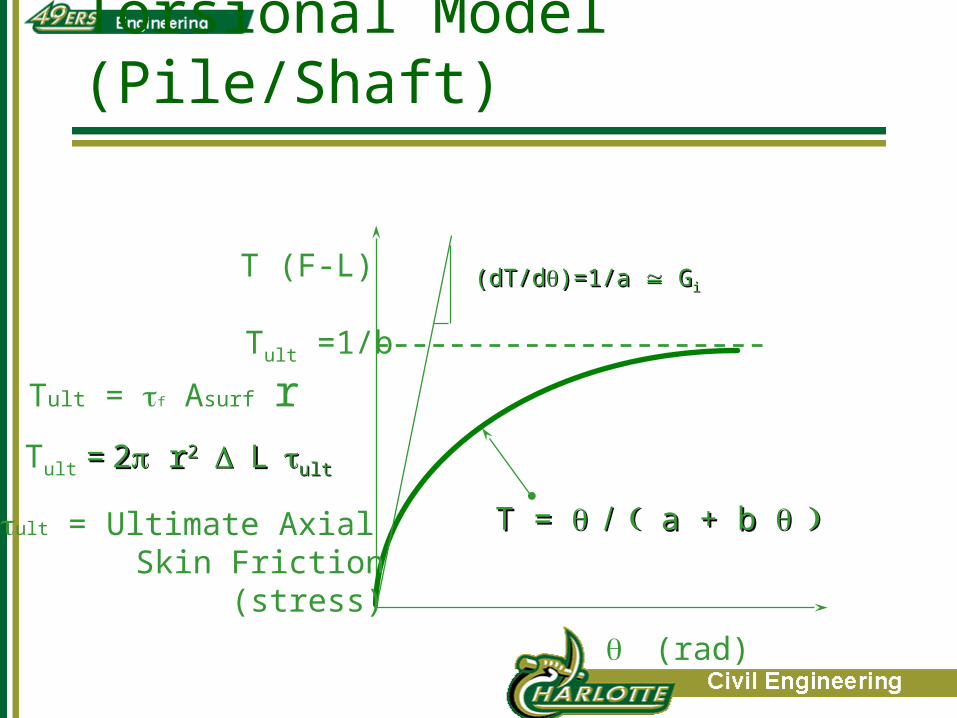
Torsional Model (Pile/Shaft)
(rad)
T (F-L)
Tult =1/b
(dT/d(dT/d)=1/a )=1/a G Gii
Tult = = 22 r r22LLultult
T = T = a + b a + b
Tult = f Asurf r
ult = Ultimate Axial Skin Friction (stress)

Session Outline
• Identify and Discuss Soil-Pile Interaction Models– Precast & Cast Insitu Axial T-Z & Q-Z Models– Torsional - Models– Lateral P-Y Models– Nonlinear Pile Structural Models
• FB-MultiPier Input and Output– Example #1 Single Pile

Lateral Soil-Structure Interaction
Passive State
Active State
Y

Near Field: Lateral (Piles/Shafts)
r
y
X
P r dF
Lr
0
2
P r dF
Lr
0
2
r
Y=5”
r
r
Y=0
P = 0 P
Y
Pu
P rStiffClay
Sand &Soft Clay
PPPP

P-y Curves - Reese’s Sand
k
m
b/60 3b/80
x = 0
x = x1
x = x2
x = x3
x = x4
u
pk
yk
ym
yupm
pu
m
y
P
ks x
Pu is a function of, , and b
Y is a function of b (pile diameter)
0.0
0.5
1.0
PPU
yy50
1.0 8.0
p
p0.5
y
yu 50
1 / 3
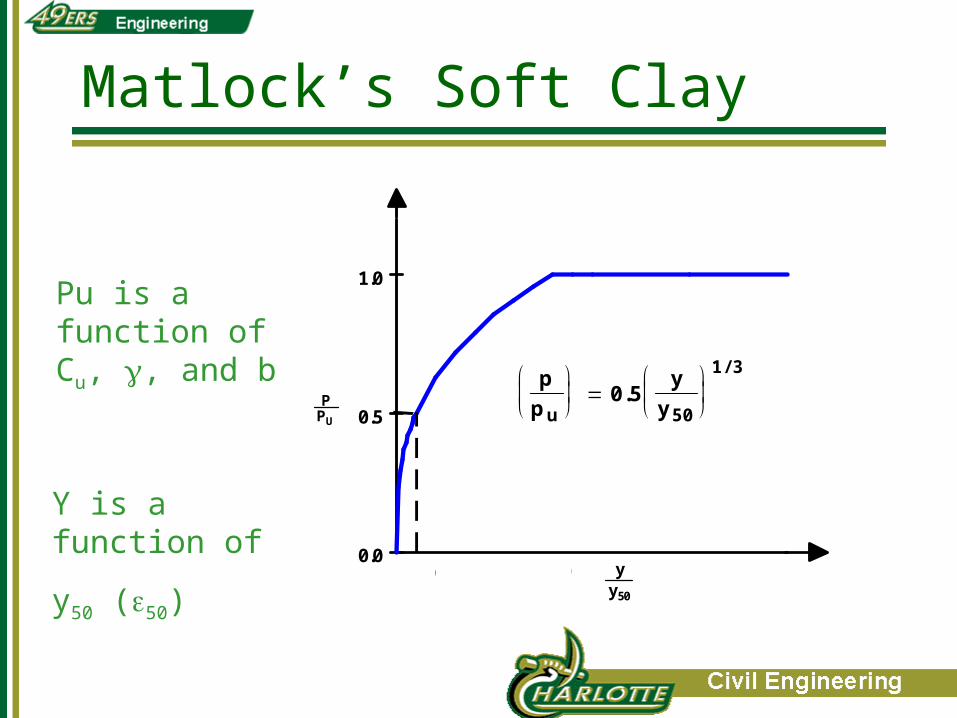
Matlock’s Soft Clay
Pu is a function ofCu, , and b
Y is a function of
y50 (50)

Reese’s Stiff Clay Below Water
Deflection, y (in.)
Soi
l Res
ista
nce
, p (
lb/in
.)
18Asy506Asy50y50Asy50
Esi = ksx
0.5Pc
0
P Pcy
y0 5
50
0 5. ( ) .
P poffset cy A y
A ys
s 0 055 50
50
1 25. ( ) .
STATIC
Essp
yc 0 0625
50
.
Pc is a function ofC, , ks and b
Y is a function of
y50 (50)

O’Neill’s Integrated Clay
0.0
0.5
1.0
RATIO OF DEFLECTION,
RA
TIO
OF
SO
IL R
ESI
STA
NC
E, P
/ P U
201
PP
YYU C
0 5 0 387. ( ) .
Y
YC
P P FOR X XU Cr
PP S S
XXU Cr
F F ( )1
6
Pu is a function ofc, and b
Fs is a function of 100
Yc is a function of b and 50

Soil Properties for Standard Curves
• Sand:– Angle of internal friction, – Total unit weight, – Modulus of Subgrade Reaction, k
• Clay or Rock:– Undrained Strength, Cu– Total Unit Weight, – Strain at 50% of Failure Stress, 50
– Optional: k, and 100

Soil InformationHelp Menu EPRI (Kulhawy & Mayne)

P-y Curves from Insitu Tests
• Cone Pressuremeter
• Marchetti Dilatometer
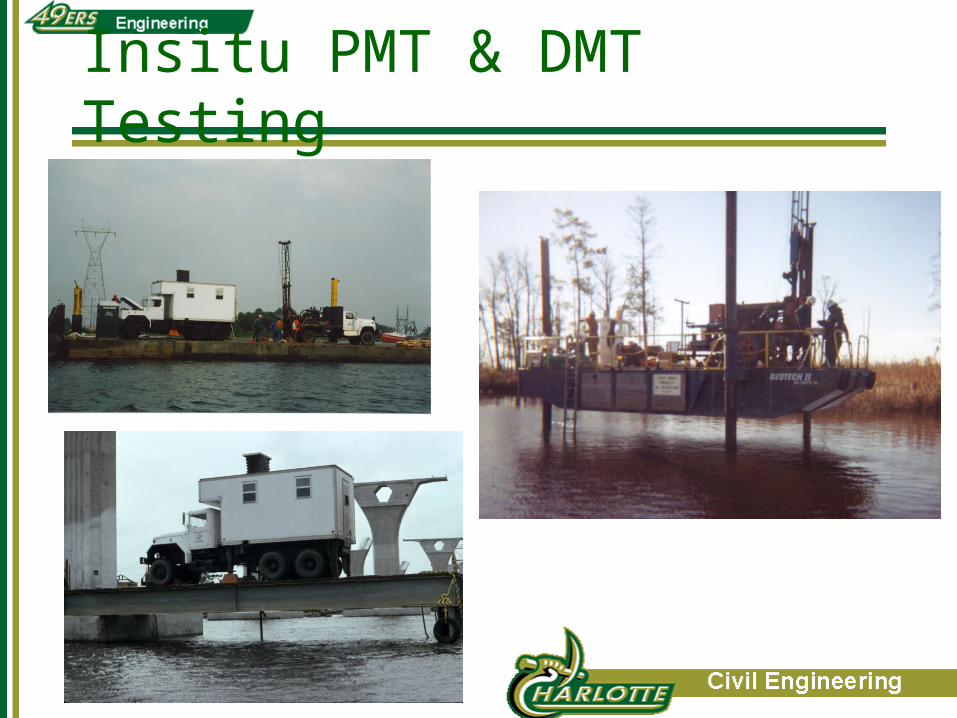
Insitu PMT & DMT Testing
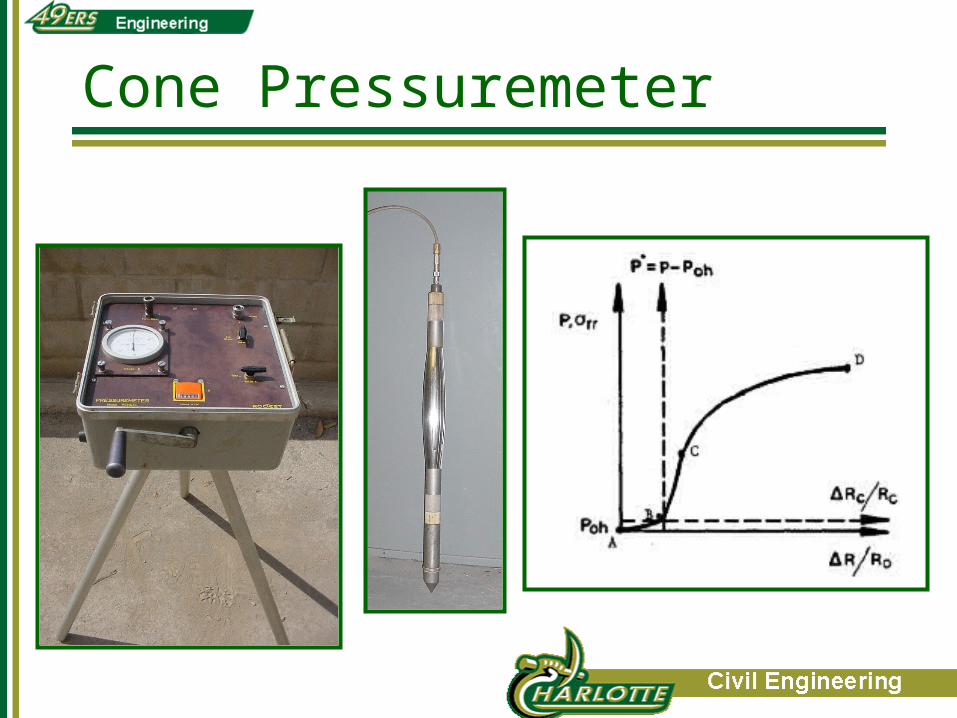
Cone Pressuremeter

Cone Pressuremeter
(Robertson, Briaud, etc.)

Marchetti Dilatometer

Pressuremeter P-y Curves Auburn, Alabama
0
200
400
600
800
1000
1200
1400
1600
1800
2000
0 5 10 15 20 25 30 35 40
y (mm)
P (
kN/m
m)
1 m2 m3 m4 m6 m8 m10 m
PMT P-y Curves - Auburn

Dilatometer P-y Curves Auburn, Alabama
0
500
1000
1500
2000
2500
0 50 100 150 200 250 300 350
y (mm)
P(k
N/m
)
0.6 m2.1 m3 m4.2 m6.3 m7.2 m
DMT P-y Curves - Auburn

Actual and Predicted Lateral Top of Shaft DeflectionsAuburn, Alabama
0
100
200
300
400
500
600
700
800
900
1000
0.0 10.0 20.0 30.0 40.0 50.0 60.0
Lateral Deflection (mm)
La
tera
l L
oad
(kN
)
PMTDMTCPTShaft 1Shaft 2Shaft 3Shaft 6
Auburn Predictions
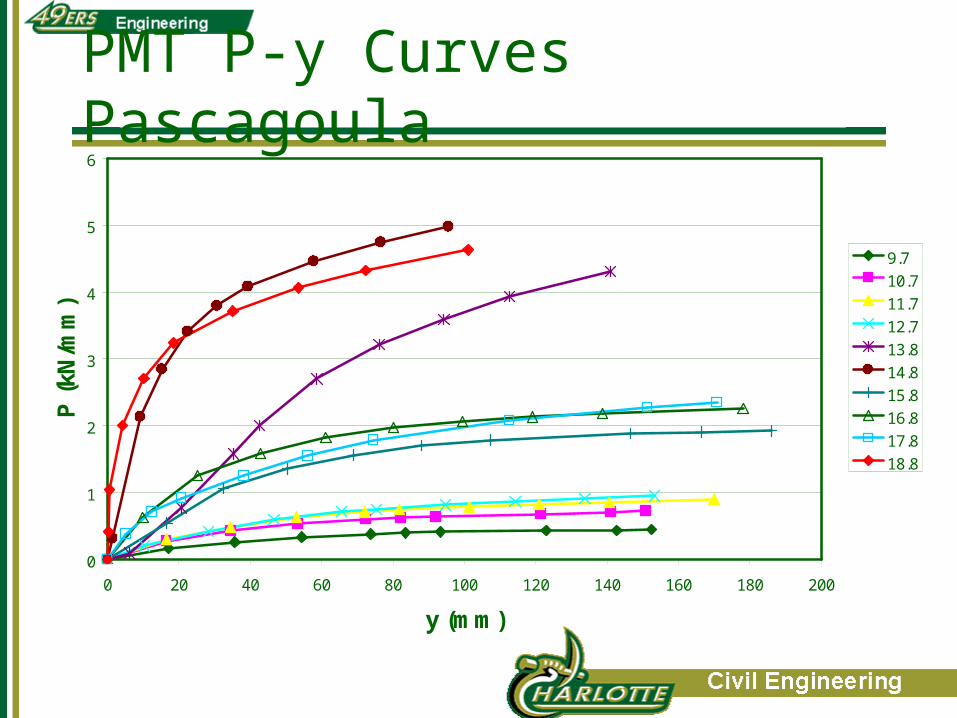
P-y Curves for PMT1Pascagoula, Mississippi
0
1
2
3
4
5
6
0 20 40 60 80 100 120 140 160 180 200
y (mm)
P (
kN/m
m)
9.7
10.7
11.7
12.7
13.8
14.8
15.8
16.8
17.8
18.8
PMT P-y Curves Pascagoula
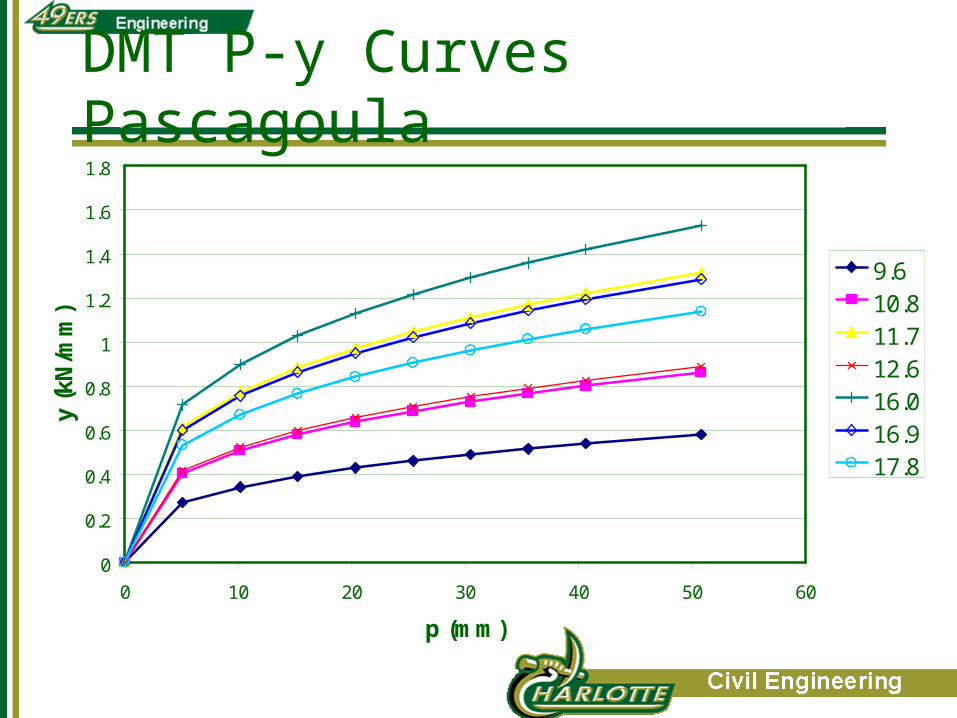
P-Y Curves from DMT 1Pascagoula, Mississippi
0
0.2
0.4
0.6
0.8
1
1.2
1.4
1.6
1.8
0 10 20 30 40 50 60
p (mm)
y (k
N/m
m)
9.610.811.712.616.016.917.8
DMT P-y Curves Pascagoula

Pascagoula Predictions
0
500
1000
1500
2000
2500
3000
3500
4000
4500
0 10 20 30 40 50
Deflection (mm)
Lo
ad (
kN) DMT
PMT
Actual
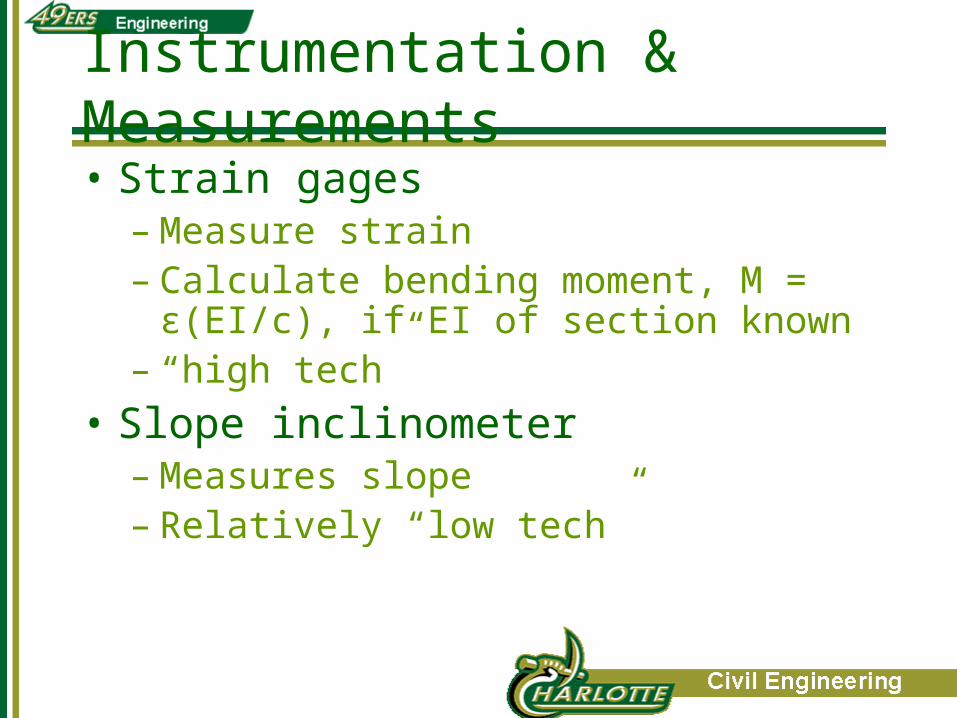
Instrumentation & Measurements
• Strain gages– Measure strain– Calculate bending moment, M = ε(EI/c), if EI
of section known– “high tech”
• Slope inclinometer– Measures slope– Relatively “low tech”

Theoretical Pile Behavior
PM
Pile
Y(z)
Deflection
Y’(z)
Slope
M(z)
Moment
M’(z)
Shear
P(z)
Soil Reaction

Strain Gages Bending Moment

Bending Moment versus Depth
0
1
2
3
4
5
6
0 200 400 600 800 1000 1200
Bending Moment (kN*m)
Dep
th (
m) 36
62
93
121
153
182
211
258
LateralLoad in Kilonewtons

Bending Moment vs. Depth
PM
Pile
Y(z)
Deflection
Y’(z)
Slope
M(z)
Moment
M’(z)
Shear
P(z)
Soil Reaction

Two Integrals to Deflection
PM
Pile
Y(z)
Deflection
Y’(z)
Slope
M(z)
Moment
M’(z)
Shear
P(z)
Soil Reaction
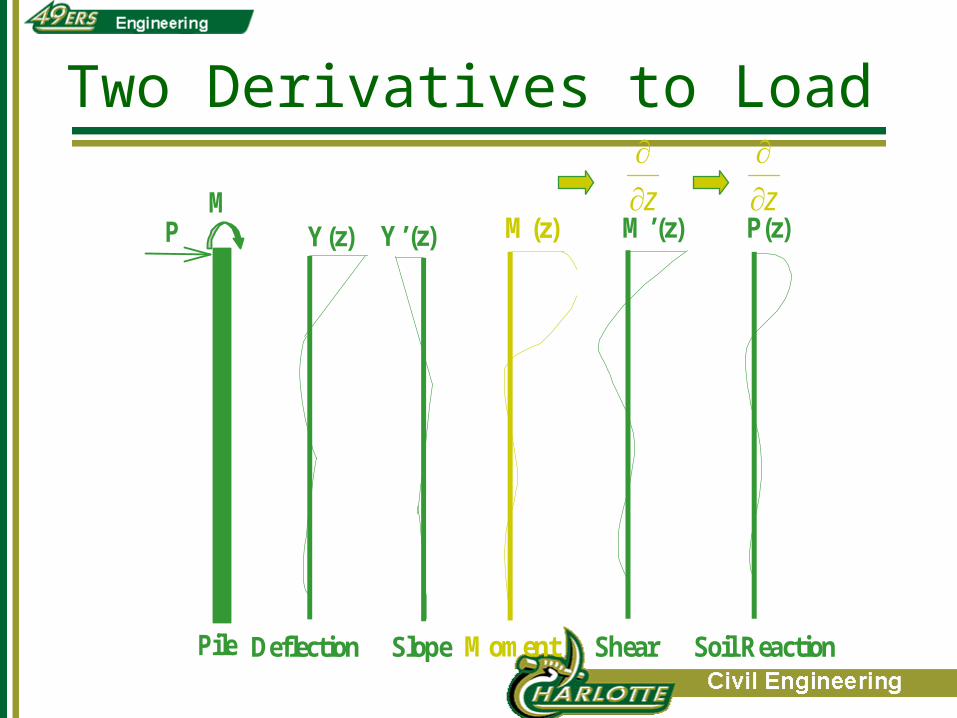
Two Derivatives to Load
PM
Pile
Y(z)
Deflection
Y’(z)
Slope
M(z)
Moment
M’(z)
Shear
P(z)
Soil Reaction
z
z
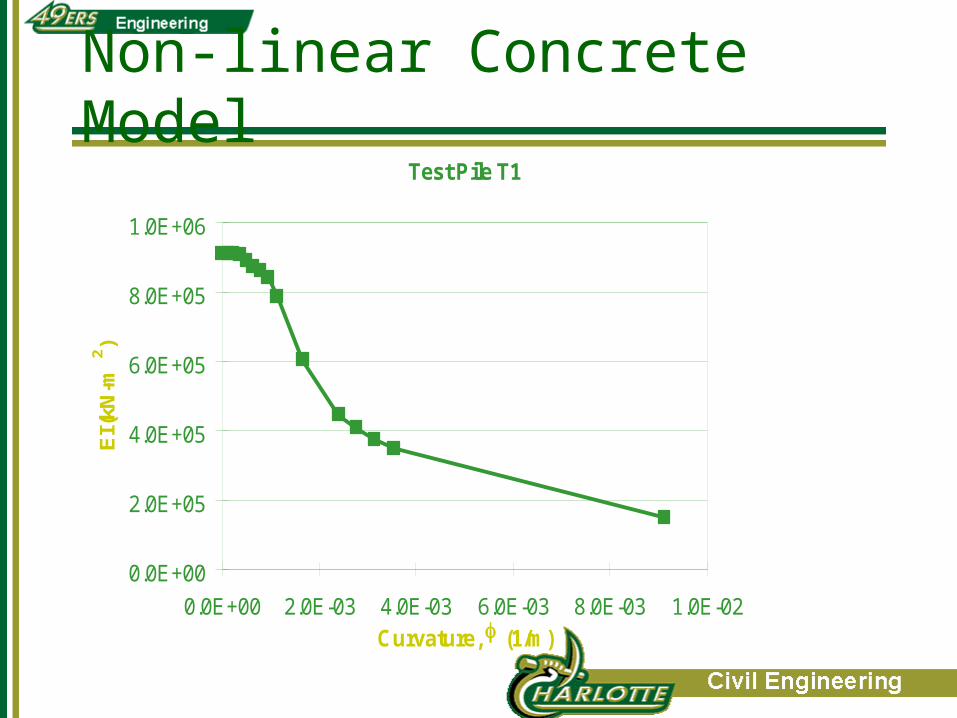
Non-linear Concrete ModelTest Pile T1
0.0E+00
2.0E+05
4.0E+05
6.0E+05
8.0E+05
1.0E+06
0.0E+00 2.0E-03 4.0E-03 6.0E-03 8.0E-03 1.0E-02Curvature, (1/m)
EI (
kN-m
2 )

P-y Curves from Strain Gages
0
20
40
60
80
100
120
140
0 5 10 15 20 25 30 35
Displacement, y (mm)
p (k
N/m
)
1.0
2.0
3.0
4.1
D. to G.S.(m)
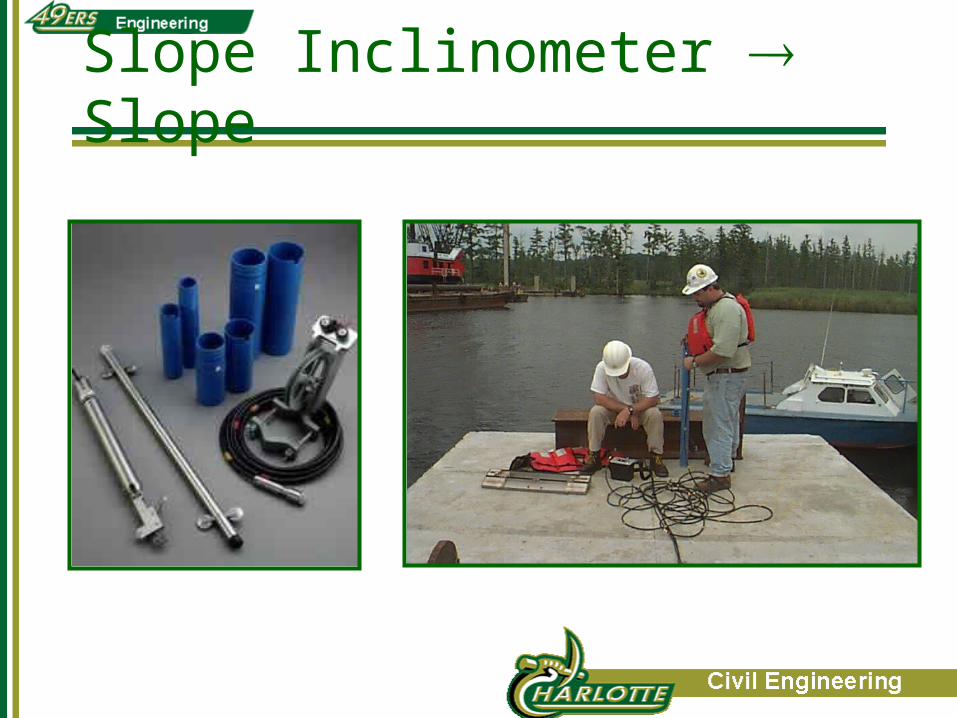
Slope Inclinometer Slope

Deflection versus Depth
-2
0
2
4
6
8
10
-0.01 0.00 0.01 0.02 0.03 0.04 0.05 0.06 0.07
Horizontal Displacement (m)
De
pth
(m
)
36
62
90
122
153
183
208
243
Lateral Load in Kilonewtons
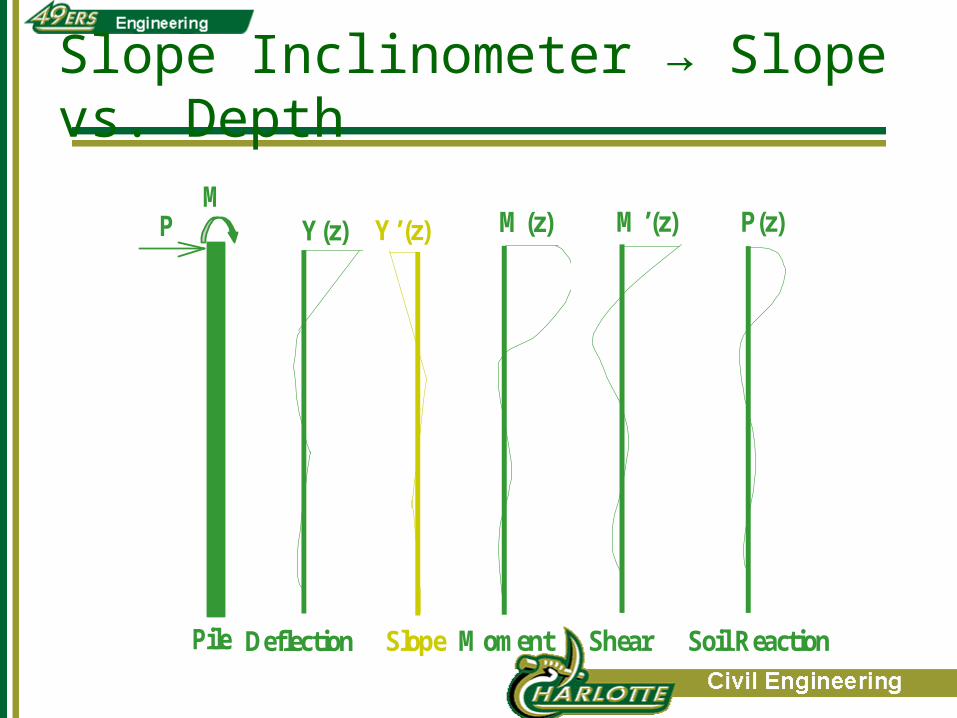
Slope Inclinometer → Slope vs. Depth
PM
Pile
Y(z)
Deflection
Y’(z)
Slope
M(z)
Moment
M’(z)
Shear
P(z)
Soil Reaction
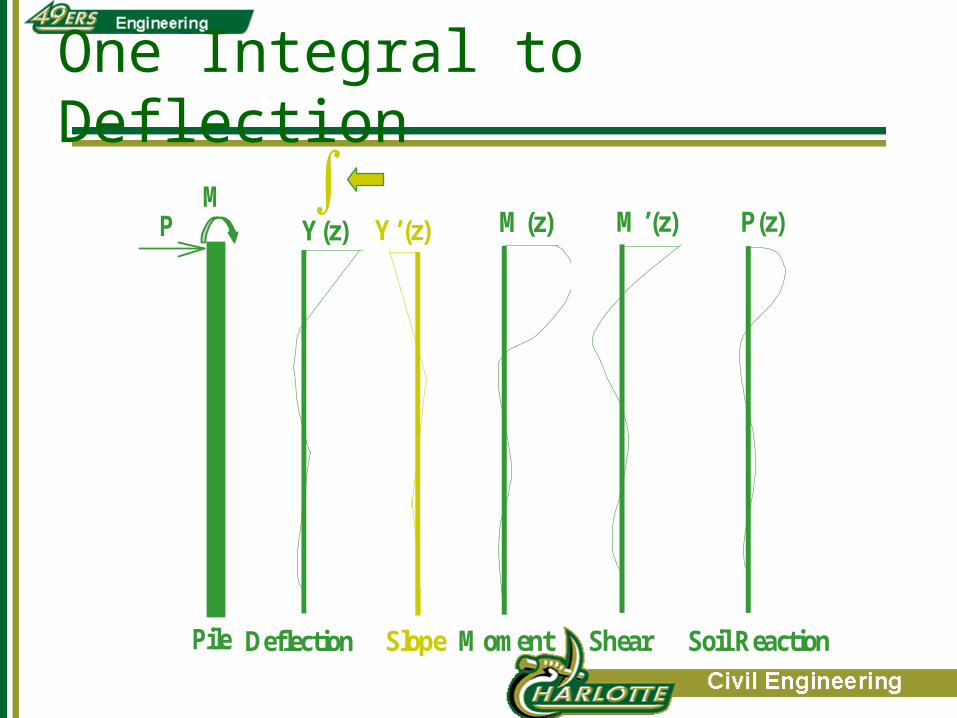
One Integral to Deflection
PM
Pile
Y(z)
Deflection
Y’(z)
Slope
M(z)
Moment
M’(z)
Shear
P(z)
Soil Reaction

Three Derivatives to Load
PM
Pile
Y(z)
Deflection
Y’(z)
Slope
M(z)
Moment
M’(z)
Shear
P(z)
Soil Reaction
z
z
z

P-y Curves from Slope Inclinometer
0
20
40
60
80
100
120
140
0 5 10 15 20 25 30 35
Displacement, y (mm)
p (k
N/m
)
1.0
2.0
3.0
4.0
D. to GS(m)
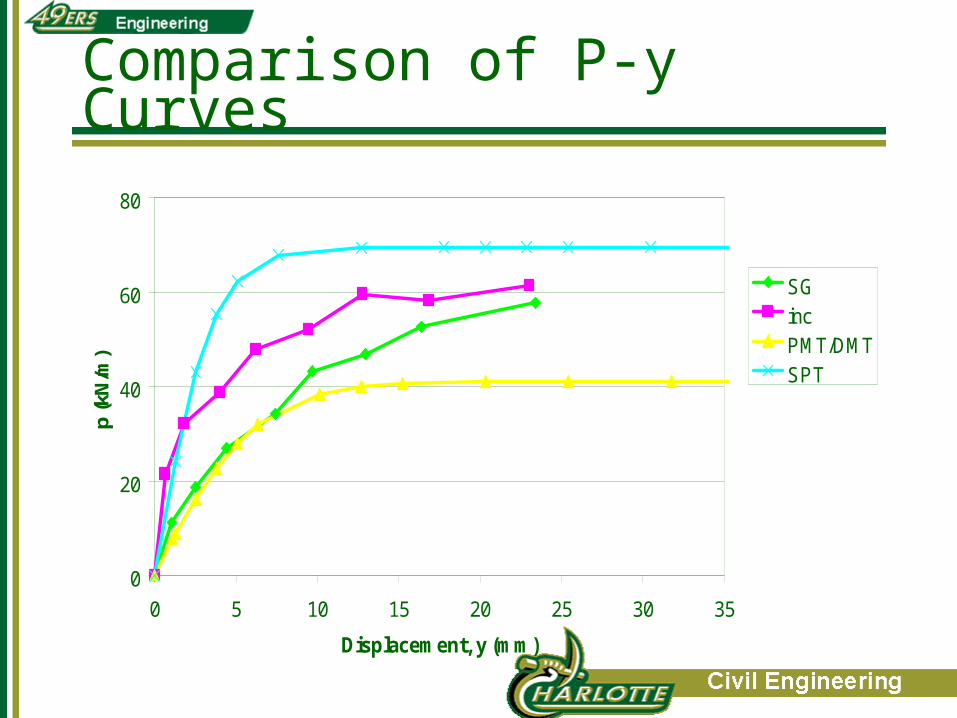
0
20
40
60
80
0 5 10 15 20 25 30 35
Displacement, y (mm)
p (k
N/m
)
SGincPMT/DMTSPT
Comparison of P-y Curves
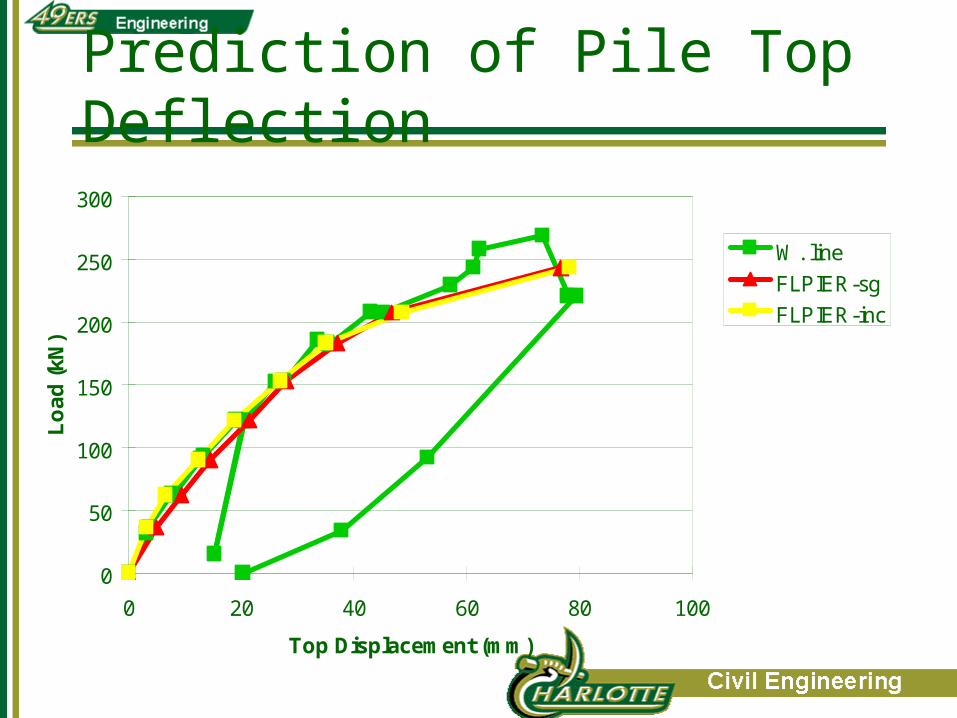
Prediction of Pile Top Deflection
0
50
100
150
200
250
300
0 20 40 60 80 100
Top Displacement (mm)
Lo
ad
(kN
)
W. line
FLPIER-sg
FLPIER-inc

P-y Curves Available in FB-Pier
• Standard– Sand
• O’Neill
• Reese, Cox, & Koop
– Clay• O’Neill
• Matlock Soft Clay Below Water Table
• Reese Stiff Clay Below Water Table
• Reese & Welch Stiff Clay Above Water Table
P-y Curves Available in FB-Pier
• User Defined– Pressuremeter– Dilatometer– Instrumentation
• Strain Gages
• Slope Inclinometer

Session Outline
• Identify and Discuss Soil-Pile Interaction Models– Precast & Cast Insitu Axial T-Z & Q-Z Models– Torsional - Models– Lateral P-Y Models– Nonlinear Pile Structural Models
• FB-MultiPier Input and Output– Example #1 Single Pile

Pile Discrete Element Modelh h2
h2
X
Z
X
Y
(Top View)
(Side View)
M M
M M
1 3
2 4
U n iv e r s a l J o in t
Rigid center-blocks
Rigid end Block
Spring
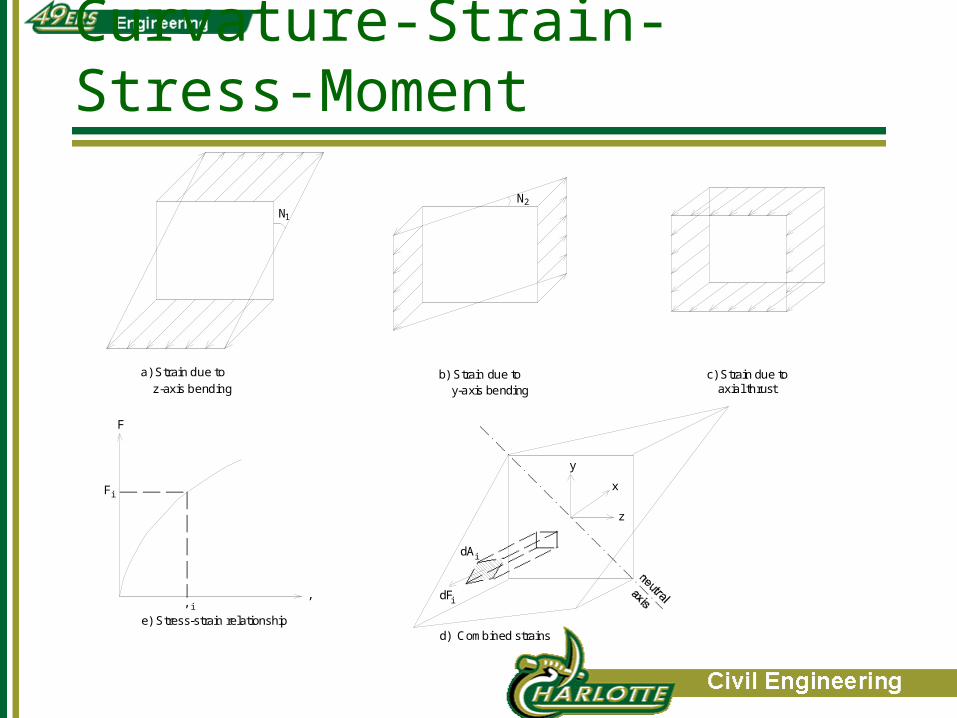
Curvature-Strain-Stress-Moment
a) Strain due to
z-axis bendingb) Strain due to
y-axis bendingc) Strain due to
axial thrust
NN
F
,
F
,i
i
1
2
x
y
z
dF
dA
i
i
e) Stress-strain relationshipd) Combined strains
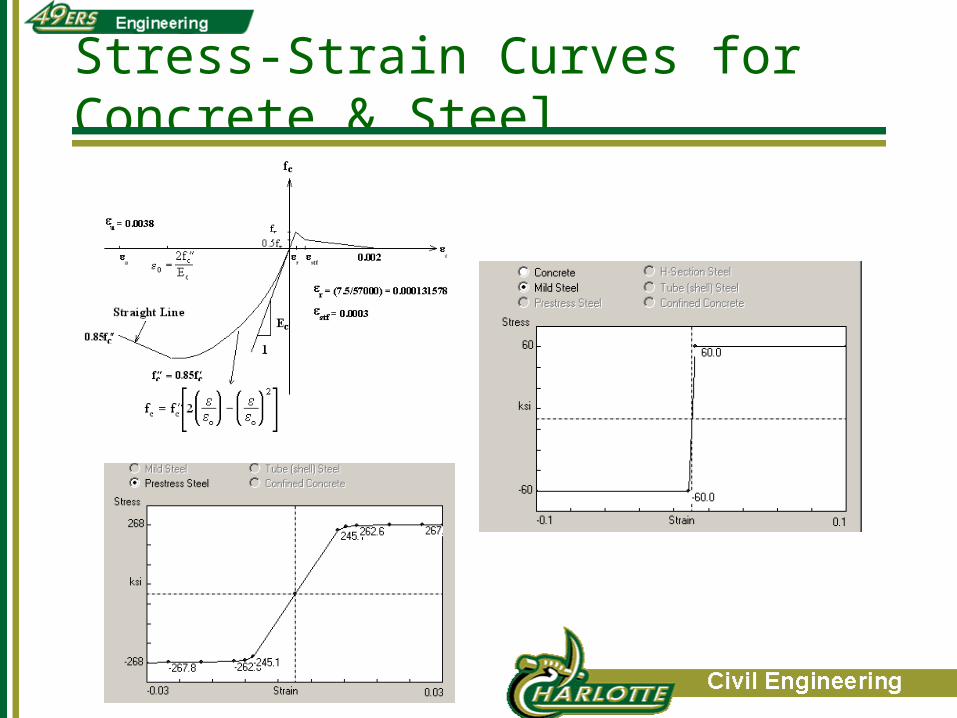
Stress-Strain Curves for Concrete & Steel

Strains -> Stress -> Moments
x
y
z
dF
dA
i
i
d) Combined strains
dFi=i*dAi
n_PointsIntegratio
x ydF*M

Stiffness of Cross-Section: Flexure, Axial
M
x
y
z
dF
dA
i
i
d) Combined strains
n_PointsIntegratio
x ydF*M

Failure Ratio Calculation
My
Mx
P
Mx
o
Myo
Pactua
l
Failure Ratio = Surface
Length
Actual Length

Pile Material Properties

References:• Robertson, P. K., Campanella, R. G., Brown, P. T., Grof, I., and Hughes, J. M., "Design of
Axially and Laterally Loaded Piles Using In Situ Tests: A Case History,“ Canadian Geotechnical Journal, Vol. 22, No. 4, pp.518-527, 1985.
• Robertson, P. K., Davies, M. P., and Campanella, R. G., "Design of Laterally Loaded Driven Piles Using the Flat Dilatometer," Geotechnical Testing Journal, GTJODJ, Vol. 12, No. 1, pp. 30-38, March 1989.
• Reese, L. C., Cox, W. R. and Koop, F. D (1974). "Analysis of Laterally Loaded Piles in Sand," Paper No. OTC 2080, Proceedings, Fifth Annual Offshore Technology Conference, Houston, Texas, (GESA Report No. D-75-9).
• Hoit, M.I, McVay, M., Hays, C., Andrade, P. (1996). “Nonlinear Pile Foundation Analysis Using Florida Pier." Journal of Bridge Engineering. ASCE. Vol. 1, No. 4, pp.135-142.
• Randolph, M. and Wroth, C., 1978, “Analysis of Deformation of Vertically Loaded Piles, ASCE Journal of Geotechnical Engineering, Vol. 104, No. 12, pp. 1465-1488.
• Matlock, H., and Reese, L., 1960, “Generalized Solutions for Laterally Loaded Piles,” ASCE, Journal of Soil Mechanics and Foundations Division, Vol. 86, No. SM5, pp. 63-91.
Session Outline
• Identify and Discuss Soil-Pile Interaction Models– Precast & Cast Insitu Axial T-Z & Q-Z Models– Torsional - Models– Lateral P-Y Models– Nonlinear Pile Structural Models
• FB-MultiPier Input and Output– Example #1 Single Pile