soil nitrogen mineralization influenced by crop rotation and nitrogen fertilization
TRANSCRIPT
Soil Nitrogen Mineralization Influenced by Crop Rotation and Nitrogen FertilizationLynne Carpenter-Boggs,* Joseph L. Pikul Jr., Merle F. Vigil, and Walter E. Riedell
ABSTRACTAn estimate of soil mineralizable N is needed to determine crop
needs for N fertilizer. The objective of this research was to estimatesoil net N mineralization in soils maintained in continuous corn (Zeamays L.) (CC), corn-soybean [Glycine max (L.) Merr.] (CS), andcorn-soybean-wheat (Triticum aestivum L.)/alfaIfa (Medicago salivaL.)-alfalfa (CSWA) rotations that have been managed since 1990with zero N (ON), low N (LN), and high N (HN) fertilization. Soilsamples were taken from 0- to 20-cm depth in plots planted to cornin 1998. In order to produce more realistic time-series data of net Nmineralization, soils were incubated in filtration units in a variable-temperature incubator (VTI) that mimicked field soil temperaturesunder a growing corn canopy. Rotation and N fertilization significantlyaffected net N mineralization in soil samples. Cumulative net N miner-alized in a 189-d field temperature incubation averaged 133 ± 6 kgha ' in CC, 142 ± 5 kg ha'1 in CS, and 189 ± 5 kg ha"1 in CSWA.Across rotations, average net N mineralized was 166 ± 9 kg ha"1 inON plots, 147 ± 10 kg ha'1 in LN plots, and 152 ± 10 kg ha~' inHN plots. Inclusion of a legume, particularly alfalfa, in the rotationincreased net N mineralized. Generally, more net N was mineralizedfrom plots receiving no fertilizer N than from soil with a history ofN fertilization. Variable-temperature incubation produced realistictime-series data with low sample variability.
GVEN FAVORABLE GROWTH CONDITIONS, N availabilityis one of the most variable and critical factors
in determining crop yield. Net N mineralization fromorganic sources in soil is estimated using knowledge oflocal soils and climate in order to predict realistic yieldgoals, N fertilization requirements, and inherent soilfertility. Fertilizer N recommendations generally arebased upon the crop yield goal, NO3 available in thesoil at planting, and N credits for any legume grown ormanure applied the previous year. All N sources areconsidered additive, and fertilizer recommendationshave not addressed possible interactions between or-ganic-derived N and commercial N fertilization. Com-mercial fertilization can increase crop growth, decreasecrop residue C/N ratio by increasing stover N concentra-tion (Liang and Mackenzie, 1994), reduce N fixation bylegumes (Streeter, 1988), and increase (Entry et al.,1996; Conti et al., 1997) or decrease (Biederbeck et al.,1984; Ladd et al., 1994; Smolander et al., 1994) soilmicrobial populations and activities. Because commer-cial N fertilization can affect N fixation, mineralizationof residue or soil organic N, and other biological pro-cesses, commercial fertilization could affect the level of
Lynne Carpenter-Boggs, USDA-ARS, North Central Soil Conserva-tion Research Lab., Morris, MN 56267; Joseph L. Pikul Jr., and WalterE. Riedell, USDA-ARS, Northern Grams Insect Research Lab.,Brookings, SD 57006; Merle Vigil, USDA-ARS, Central Plains Re-sources Management Research Lab., Akron, CO 80720-0400. Re-ceived 3 Jan. 2000. *Corresponding author ([email protected]).
Published in Soil Sci. Soc. Am. J. 64:2038-2045 (2000).
N made available to crops that follow legumes in ro-tation.
While fertilization guides use total organic matter andprevious crop as indicators of N mineralization for thecoming season, a variety of direct and indirect lab meth-ods may be used for more precise predictions (Fox andPiekielek, 1978; Hong et al., 1990). Laboratory testsallow compositing and homogenizing soil samples todecrease the standard deviation and required replica-tion. Aerobic incubation for 120 to 252 d is commonlyused to estimate the size and decay rates of mineraliz-able N pools (Stanford and Smith, 1972; Cabrera andKissel, 1988). Temperature and matric potential of incu-bated soils affect the rate and cumulative N mineralized.Within ordinary field soil matric potentials from -1.85to -0.01 MPa, temperature has a greater influence onN mineralization than does matric potential (Zak et al.,1999). Most N mineralization laboratory experimentsare incubated at 35°C, considered the ideal temperaturefor maximum N mineralization. Nitrogen mineralizedin laboratory incubations at 35°C represents potentialN mineralization and first-order rate constants, not fieldN mineralization as affected by field soil conditions.
In situ N mineralization can be determined using in-field undisturbed soil cores, usually in conjunction withion exchange resins (DiStefano and Gholz, 1986). Insitu cores are exposed to field temperature and some-times field moisture, whereas lab tests generally involveincubation under ideal temperature and moisture condi-tions. In addition, intact cores are not subject to physicaldisturbance, which can expose protected organic materi-als and increase the estimate of labile N. However, fieldmethods are subject to large standard deviations be-cause they use individual soil cores rather than compos-ite samples. This large variability between replicatesnecessitates use of large numbers of replicates for eachtreatment or plot. In situ measurement of N mineraliza-tion at two sites in eastern Colorado required five toseven soil core replicates per plot to obtain a smallenough variance to detect a 3.0 kg N ha^1 difference atan a level of 0.20 (Kolberg et al., 1997). Comparison ofseveral replicated field treatments with adequate repli-cation of periodically replaced in situ cores quickly be-comes a daunting task.
The primary objective of this study was to determinethe effects of three rotations at three N fertilizationlevels on net N mineralization in an eastern South Da-kota soil. A second objective was to evaluate a labora-tory method for measurement of net N mineralizationthat more accurately reflected the effects of field tem-peratures rather than constant optimal incubation tem-perature.
Abbreviations: ON, zero N fertilizer; CC, continuous corn; CS, corn-soybean; CSWA, corn-soybean-wheat/alfalfa-alfalfa; HN, high N fer-tilizer; LN, low N fertilizer; VTI, variable-temperature incubator.
2038
CARPENTER-BOGGS ET AL.: MANAGEMENT EFFECTS ON SOIL NITROGEN MINERALIZATION 2039
MATERIALS AND METHODSStudy Site
Study plots are located on the Eastern South Dakota Soiland Water Research Farm at Brookings, SD. Rotation and Napplication rates have been consistent since spring 1990. Thesoil is Barnes clay loam (fine-loamy, mixed, superactive, frigidCalcic Hapludoll) with nearly level topography. Average siteconditions are described in Table 1. The experimental designincludes three replicate blocks of three crop rotations: CC,CS, and CSWA. All crops in each rotation are grown eachyear. Each 91 by 30 m rotation plot was split into three random-ized 30 by 30 m subplots to test fertilization effects at ON, LN,and HN fertilization. Nitrogen application for corn in ON, LN,and HN treatments was based on yield goals of 0, 5.3, and 8.5Mg ha"1, respectively. For these yield goals, total available Nrequired for ON, LN, and HN was 0,114, and 181 kg N ha'1,respectively. Preplan! soil NO3 in the top 120 cm was sub-tracted from N requirement to determine fertilizer needs.Starter fertilizer was applied to all plots in corn, soybean, andwheat phases of rotations. Starter fertilizer contained 18 kgha~' P, 12 kg ha'1 K, and 0, 8, or 16 kg ha"1 N in ON, LN,and HN plots, respectively. After subtracting preplan! soilNO3 and starter fertilizer from total N needs, the remainingN requirement in corn was applied as sidedressed urea. Soy-bean and wheat received only starter fertilizer as describedabove; alfalfa received no fertilizer.
In CSWA, alfalfa was companion seeded along with wheatin the spring, but attained minimal growth until wheat washarvested. Alfalfa was not harvested during the wheat year, butwas harvested as hay normally three times in the fourth yearof CSWA rotation. After the final cutting alfalfa was allowed3 to 4 wk regrowth, then killed with glyphosate [Af-(phos-phonomethyl)glycine; Roundup, Monsanto, St. Louis, MO]~6 wk before fall chisel tillage. Corn and soybean grains wereharvested and removed from plots and corn stover was choppedand remained on plots.
Through spring 1996, primary tillage was by moldboardplow (0-20 cm) in the fall, weather permitting, or in springotherwise. After spring 1996 moldboard plowing was discon-tinued; since that time plots were chisel plowed (0-15 cm) inthe fall, then prepared each spring using a tandem disk andfield cultivator (0-5 cm). All corn and soybean plots wererow-cultivated twice each year. Seeding date, rate, and varietywere the same for all plots in a given year.
Crop MeasurementsSamples to determine biomass and N uptake were harvested
by hand when the crop was mature, just prior to field grainharvest. Soybean biomass samples were taken just before leafdrop. All plant material was cut from four rows 1 m long.Bundles were dried 3 d at 50°C with circulating air and thenweighed. Total aboveground biomass was separated into grainand stover components. Grain and stover were thoroughlyground to pass a 0.5-mm sieve and analyzed for C and Ncontent using a Carlo-Erba elemental analyzer (CE Instru-ments, Milan, Italy). Weighted residue C/N ratio was deter-mined by C/N ratio and proportion of total biomass producedby each crop in rotation.
Nitrogen Mineralization and OtherLaboratory Methods
On 28 Apr. 1998, 2 d prior to corn seeding, fourteen 3.4-cm-diam. cores were taken in the top 20 cm of each plotthat would be seeded to corn. Previous crop was corn in CC,
Table 1. Average climate in 1990 through 1998 and soil conditionsin 1998 at soil depth of 0 to 20 cm at study site near Brook-ings, SD.
Parameter Valuet
Annual precipitation, mmAnnual mean temperature, °CAnnual growing degree days (base 10°C)Soil textureBulk density, g cm"3
Moisture at sampling, g kg 'Electrical conductivity, S nr'tpH§Soil C/N ratioOrganic C, mg kg-'flTotal N, mg kg-'flSoluble C, mg kg~'#P, mg kg-'ttK, mg kg-'M
6205.8
1320Clay loam
1.14 (0.15)176 (18)0.03 (0.006)6.6 (0.5)
10.9 (0.2)18 300 (1700)1 680 (160)
27(8)19(5)
160 (10)
t Values are means (n = 27) with standard deviation in parentheses.t D.A. Whitney, 1998.§ 1:1 soil/0.01 mol L ' CaCI, (Watson and Brown, 1998).11 Leco CN-2000 (Leco, Nelson and Sommers, 1996).# Accu-Test Chemical Oxygen Demand digest (Bioscience, Inc., Bethle-
hem, PA).tt Olsen P test (Frank et al., 1998).tt Warncke and Brown, 1998.
soybean in CS, and alfalfa in CSWA. Entire composite samplesconsisting of 14 soil cores were weighed and a sample driedat 105°C to determine initial bulk density and moisture. Soilswere passed through a 4-mm sieve and material larger than4 mm was removed.
Net N mineralization, or the difference between organic Ndecomposition and inorganic N immobilization, was trackedthroughout the growing season using a modification of theprocedure of Stanford and Smith (1972). In order to minimizereplicate variability while increasing relevance of laboratorydata to field conditions, net N mineralization was measuredin the laboratory during incubation at field soil-mimickingtemperatures. Disposable 150-mL Falcon filtration units(Corning Costar, Corning, NY) were prepared within 1 d ofsampling. Units had 0.22-p,m-pore cellulose acetate filters andglass fiber prefilters. Two filtration units per plot were filledwith the field-moist equivalent of 30 g dry weight soil mixedwith 30 g washed silica sand. Additional 75-mm glass fiberprefilters (Millipore Corporation, Bedford, MA) were placedabove soil-sand mixture to inhibit soil dispersion during addi-tion of leaching solution. Units were leached on Days 0,14,28,42,63, 85,106,126,146,167, and 189 with 100 mL of 0.025mol L"1 CaCl2. Units were evacuated at -80 kPa until 90 to95 mL of solution was retrieved. Solution was filtered throughWhatman no. 42 filters and frozen for later analysis of NO3and NH4. Twenty milliliters of nutrient solution containing0.005 mol L'1 MgSO4 and 0.005 mol L'1 KH2PO4, brought topH 7.2 with KOH, was then added to filtration units andvacuum applied at —80 kPa for 30 min. Moisture content ofthe soil-sand mixture averaged 220 g kg"1 prior to leachingwith CaCl2 solution and 260 g kg"1 just after 30 min vacuum.Between leachings, units were sealed with Parafilm (AmericanNational Can Co., Greenwich, CT) and incubated in a VTIthat mimicked the temperature in topsoil under a crop canopy(Fig. la). A corn plot was planted near the laboratory on thedate of field planting. A thermistor placed 10 cm deep in thesoil between rows in this corn plot was connected to the VTItemperature controls inside the laboratory.
Two additional sets of filtration units were prepared withsoil from all plots under CS LN management. One set waskept in an incubator at 17°C and one set at 35°C for comparisonof temperature effects on net N mineralization. Other than
2040 SOIL SCI. SOC. AM. J., VOL. 64, NOVEMBER-DECEMBER 2000
30
25O
g 15oa.£ 10-1 — soil in VTI
—17C incubator"-.-•field soil 15-cm depth
30
25
•20
15
10
5
50 100 150 200
30
• hourly temperature 17C incubator- Q- daily average temperature VTI—•— hourly temperature VTI
60 61
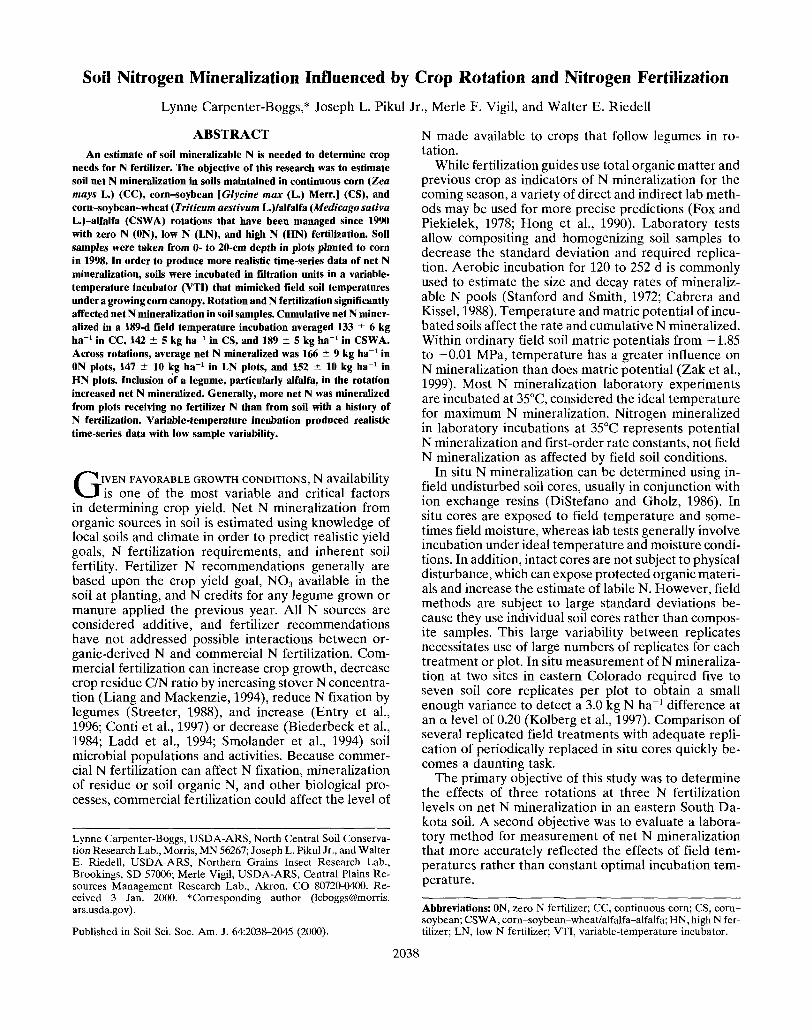
Day of IncubationFig. 1. (a) Daily mean temperature during incubation period in field
soil at 15-cm depth under growing corn canopy compared withsoil in filtration units in 1TC incubator and variable temperatureincubator (VTI) mimicking field soil temperatures, (b) Detail ofhourly temperature in VTI and 17°C incubators during incubation,Days 60 and 61.
temperature, the treatment and leaching of these units wasidentical to that of filtration units in the VTI.
Nitrate and NH4 in leachates were analyzed on a LachatInstruments (Milwaukee, WI) autoanalyzer (Zellweger Ana-lytics, 1992). Results were converted to kilograms N per hect-are plow layer using field bulk density measurements in thetop 20 cm of each plot. Nitrate and NH4 were summed ateach leaching to express initial inorganic N (Day 0) or net Nmineralized. Initial inorganic N plus cumulative net N mineral-ized represent total available N.
Statistical AnalysisReplicate measurements on composite soil samples were
averaged for statistical analysis of treatment effects. Analysisof main effects and interactions was completed using GeneralLinear Models (GLM) in SYSTAT 9.0 (SPSS Inc., Chicago,IL). Because of the split-plot design, hypotheses of rotationeffects were tested using whole plot effects (rotation x block)as error term. Significant differences were determined usingGLM factor effects and least significant differences at P s0.05. Results are reported as mean and standard deviation ofthe mean unless otherwise noted.
RESULTS AND DISCUSSIONField Temperature-Mimicking Incubation
Temperature of soils in the VTI chamber closely mim-icked temperature in the soil outdoors at 15-cm depthunder a growing corn canopy (Fig. la). During the 189-dincubation period, soil temperatures at 15-cm depth in
A01
O
a)a
200
100 150 200
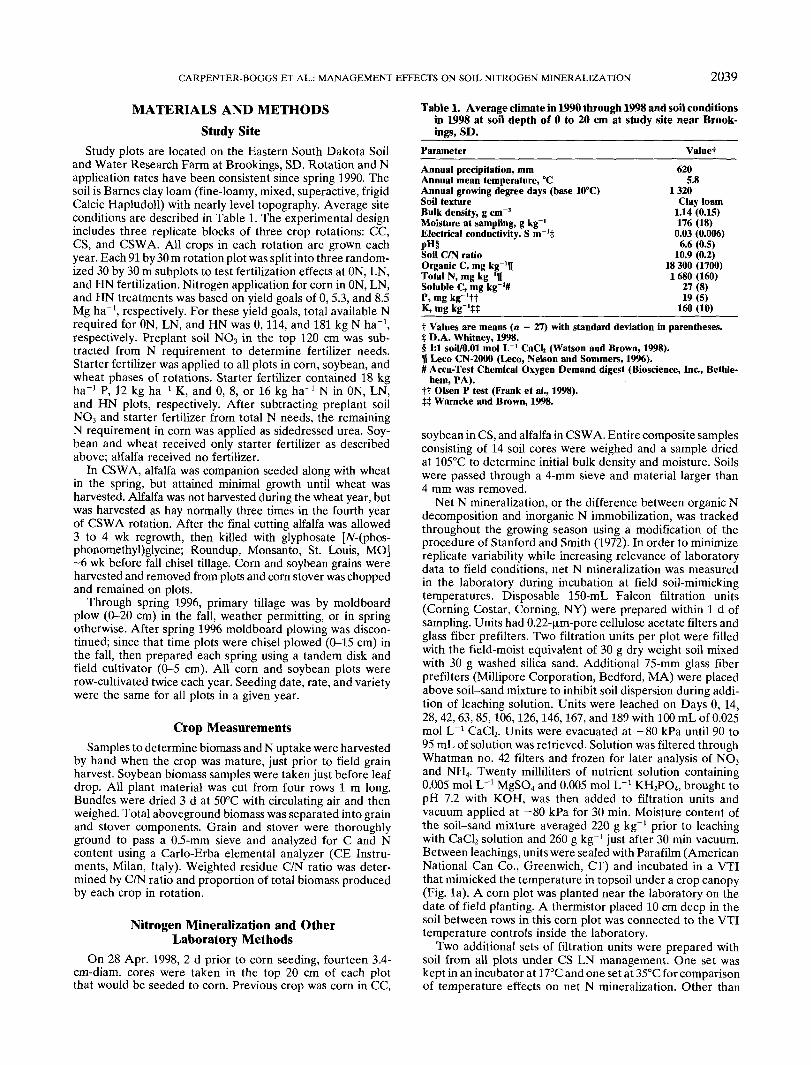
Day of IncubationFig. 2. (a) Accumulation of degree Celsius days >0°C and (b) mineral-
ized N in soil taken from 0 to 20 cm in corn-soybean rotation withhistory of low N fertilization of 114 kg N ha '. Subsamples wereincubated at constant temperature of 35 or 17°C, or in the variabletemperature incubator (VTI) mimicking field soil temperature at15-cm depth under growing corn canopy. Bars on final data pointsof mineralized N indicate ± one standard error of the mean. Errorbars not visible on VTI and 17°C because error bars are smallerthan data points.
the field averaged 18.5°C and both the 17°C incubatorand VTI averaged 17.4°C. Although the thermistor wasplaced in the field soil at a 10-cm depth, lag time inchanging temperatures of incubator air and soil causedthe VTI soil temperature cycles to more closely approxi-mate temperatures at a 15-cm depth in the field. Dailymean temperatures (Fig. la) mask the higher tempera-tures in the VTI during afternoon and evening hours(Fig. Ib), which probably stimulated greater mineraliza-tion during these periods. Cumulative degree days inthe 17°C incubator and VTI diverged during incubationDays 60 to 140 (Fig. 2a), when field soil and variable-temperature incubator temperatures exceeded 17°C(Fig. la). Net mineralization of N was also greater inthe VTI than in the 17°C incubator during this period(Fig. 2b). Although temperatures were subsequentlygreater in the 17°C incubator than the VTI on Days 146to 189 (Fig. la) and cumulative degree days were equalby Days 189 (Fig. 2a), cumulative N mineralization in17°C incubator did not match that in the VTI (Fig. 2b).The rate constant (k) for N mineralization conforms toa Qio of ~2 (Stanford et al., 1973), so that a temporaryincrease in temperature can cause a greater than proper-
CARPENTER-BOGGS ET AL.: MANAGEMENT EFFECTS ON SOIL NITROGEN MINERALIZATION 2041
40
35
T 30
'(0
°>25•O
j|20
Ic 15-
- *- CCON- •- CCLN- -A- CCHN-•—CSON-•—CSLN-*—CSHN-•— CSWAON..-•—CSWA LN--A—CSWA HN- O Average
temperature
35
30
25
20
c°
eIo>a.
I
15
1050 100 150 200
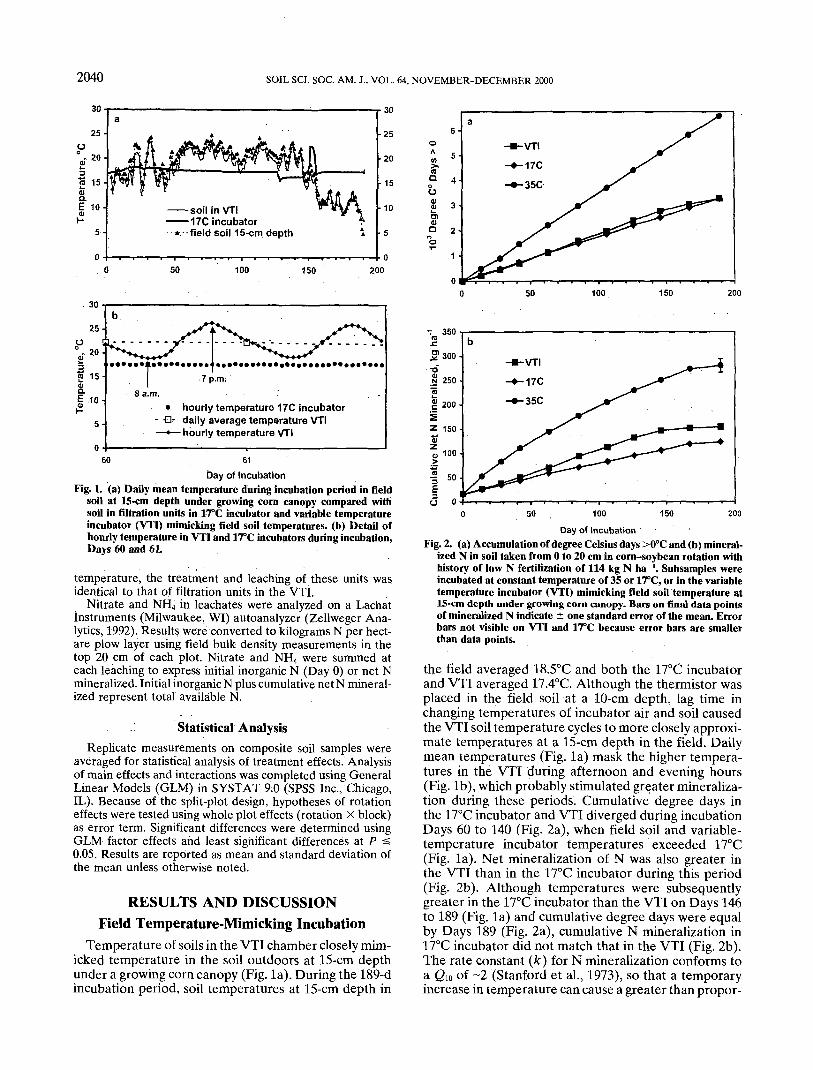
Day of IncubationFig. 3. Nitrogen leached from filtration units after each of 11 incubation periods and average daily temperature during each incubation period.
Net mineralized N data are the mean of duplicate soil samples from each of three field replicates of continuous corn (CC), corn-soybean(CS), and com-soybean-wheat/alfalfa-alfalfa (CSWA) rotations managed at zero N (ON), low N (LN), or high N (HN) fertilization incubatedat field soil temperature.
tional increase in the rate of N mineralization. Dailytemperature fluctuations above and below the dailymean temperature in the VTI can thereby stimulatemore mineralization than a constant-temperature incu-bator at the same daily average temperature.
The temporal pattern of net N mineralization pro-duced by leaching units in the VTI reflects net mineral-ization dynamics as affected by temperature fluctuationsand initial soil disturbance (Fig. 3). Unlike most labora-tory incubations at a constant temperature of 35 to 40°C,soils in the VTI did not produce a large flush of mineral-ized N in the first few weeks. Temperature in the VTIaveraged 17°C during the first three incubation periods(total 6 wk). Although stimulation of microbial activitydue to sample disturbance is inevitable, a moderate ini-tial incubation temperature and lack of grinding, drying,and rewetting of soil samples minimized the initial flushof activity and N release.
Initial and Net Mineralized NitrogenInitial inorganic N was significantly affected by rota-
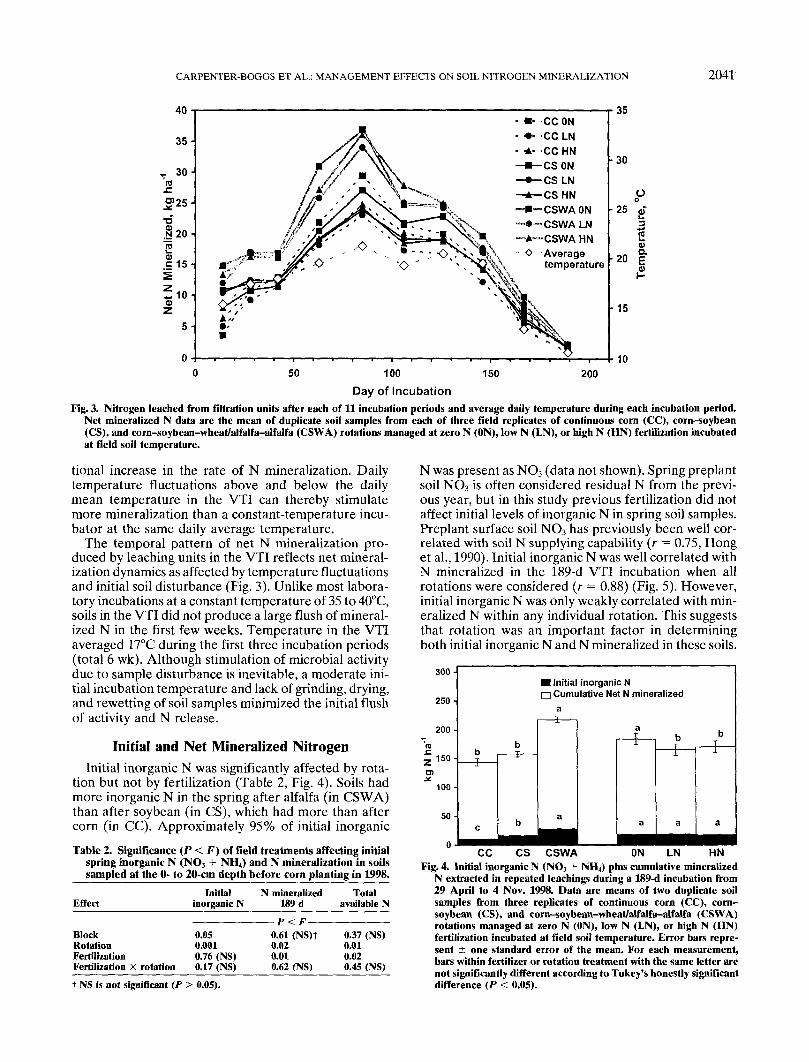
tion but not by fertilization (Table 2, Fig. 4). Soils hadmore inorganic N in the spring after alfalfa (in CSWA)than after soybean (in CS), which had more than aftercorn (in CC). Approximately 95% of initial inorganic
Table 2. Significance (P < F) of field treatments affecting initialspring inorganic IS (NO, + NH4) and N mineralization in soilssampled at the 0- to 20-cm depth before corn planting in 1998.
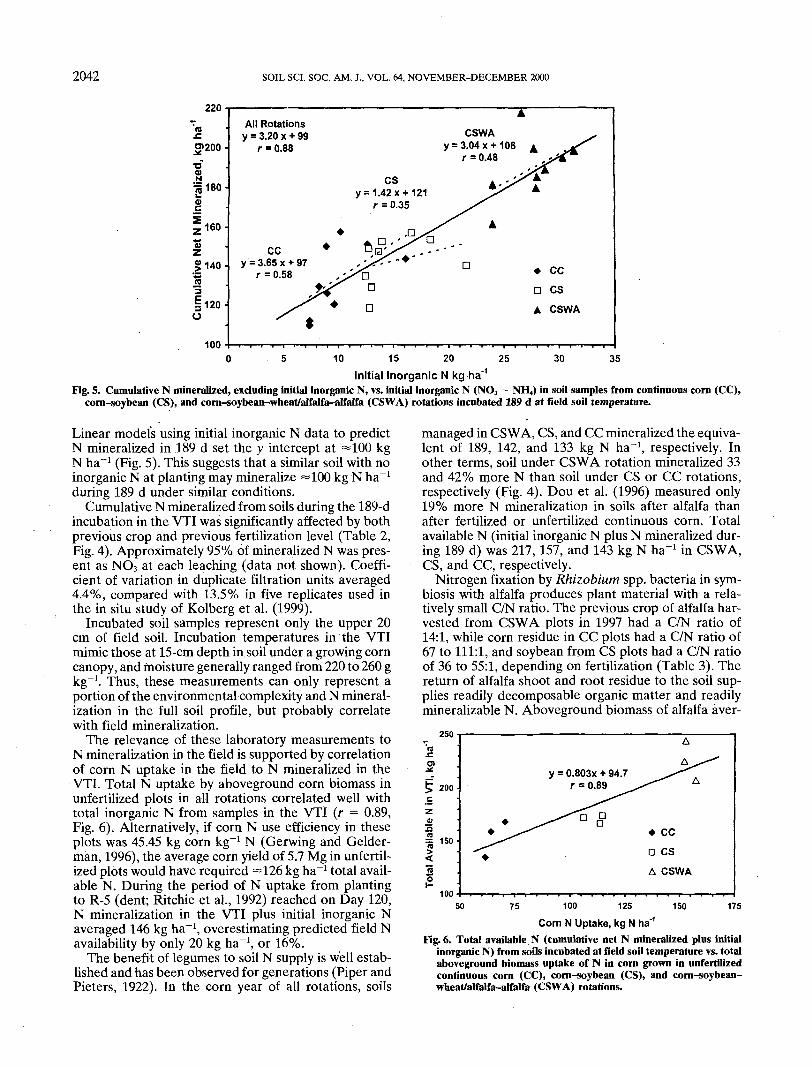
N was present as NO3 (data not shown). Spring preplantsoil NO3 is often considered residual N from the previ-ous year, but in this study previous fertilization did notaffect initial levels of inorganic N in spring soil samples.Preplant surface soil NO3 has previously been well cor-related with soil N supplying capability (r = 0.75, Honget al., 1990). Initial inorganic N was well correlated withN mineralized in the 189-d VTI incubation when allrotations were considered (r = 0.88) (Fig. 5). However,initial inorganic N was only weakly correlated with min-eralized N within any individual rotation. This suggeststhat rotation was an important factor in determiningboth initial inorganic N and N mineralized in these soils.
300-
250-
200-
150-
100 •
50 •
• Initial inorganic NQ Cumulative Net N mineralized
aT
. bb— i —
c
— I —
b
—— j_ ——
a
•••
bi
a•̂̂ ^H
J
•*•
a^̂ ••M
T
a^̂ MMM
CC CS CSWA ON LN HN
Effect
BlockRotationFertilizationFertilization X rotation
Initialinorganic N
0.050.0010.76 (NS)0.17 (NS)
N mineralized189 d
F> ^ 17
0.61 (NS)t0.020.010.62 (NS)
Totalavailable N
0.37 (NS)0.010.020.45 (NS)
f NS is not significant (P > 0.05).
Fig. 4. Initial inorganic N (NO3 + NH4) plus cumulative mineralizedN extracted in repeated learnings during a 189-d incubation from29 April to 4 Nov. 1998. Data are means of two duplicate soilsamples from three replicates of continuous corn (CC), corn-soybean (CS), and corn-soybean-wheat/alfalfa-alfalfa (CSWA)rotations managed at zero N (ON), low N (LN), or high N (HN)fertilization incubated at field soil temperature. Error bars repre-sent ± one standard error of the mean. For each measurement,bars within fertilizer or rotation treatment with the same letter arenot significantly different according to Tukey's honestly significantdifference (P < 0.05).
2042 SOIL SCI. SOC. AM. J., VOL. 64, NOVEMBER-DECEMBER 2000
220
»200
0)c
160
I3
§120O
100
All Rotationsy = 3.20 x + 99
r = 0.88CSWA
y = 3.04 x +106r = 0.48
CS: 1.42 x + 121r = 0.35
CCy = 3.65x + 97
r = 0.58
10 15 20 25 30 35Initial Inorganic N kg ha
Fig. 5. Cumulative N mineralized, excluding initial inorganic N, vs. initial inorganic N (NO3 + NH4) in soil samples from continuous com (CC),corn-soybean (CS), and corn-soybean-wheat/alfalfa-alfalfa (CSWA) rotations incubated 189 d at field soil temperature.
Linear models using initial inorganic N data to predictN mineralized in 189 d set the y intercept at =100 kgN ha"1 (Fig. 5). This suggests that a similar soil with noinorganic N at planting may mineralize =100 kg N ha"1
during 189 d under similar conditions.Cumulative N mineralized from soils during the 189-d
incubation in the VTI was significantly affected by bothprevious crop and previous fertilization level (Table 2,Fig. 4). Approximately 95% of mineralized N was pres-ent as NO3 at each leaching (data not shown). Coeffi-cient of variation in duplicate filtration units averaged4.4%, compared with 13.5% in five replicates used inthe in situ study of Kolberg et al. (1999).
Incubated soil samples represent only the upper 20cm of field soil. Incubation temperatures in the VTImimic those at 15-cm depth in soil under a growing corncanopy, and moisture generally ranged from 220 to 260 gkg"1. Thus, these measurements can only represent aportion of the environmental complexity and N mineral-ization in the full soil profile, but probably correlatewith field mineralization.
The relevance of these laboratory measurements toN mineralization in the field is supported by correlationof corn N uptake in the field to N mineralized in theVTI. Total N uptake by aboveground corn biomass inunfertilized plots in all rotations correlated well withtotal inorganic N from samples in the VTI (r = 0.89,Fig. 6). Alternatively, if corn N use efficiency in theseplots was 45.45 kg corn kg"1 N (Gerwing and Gelder-man, 1996), the average corn yield of 5.7 Mg in unfertil-ized plots would have required —126 kg ha"1 total avail-able N. During the period of N uptake from plantingto R-5 (dent; Ritchie et al., 1992) reached on Day 120,N mineralization in the VTI plus initial inorganic Naveraged 146 kg ha"1, overestimating predicted field Navailability by only 20 kg ha"1, or 16%.
The benefit of legumes to soil N supply is well estab-lished and has been observed for generations (Piper andPieters, 1922). In the corn year of all rotations, soils
managed in CSWA, CS, and CC mineralized the equiva-lent of 189, 142, and 133 kg N ha"1, respectively. Inother terms, soil under CSWA rotation mineralized 33and 42% more N than soil under CS or CC rotations,respectively (Fig. 4). Dou et al. (1996) measured only19% more N mineralization in soils after alfalfa thanafter fertilized or unfertilized continuous corn. Totalavailable N (initial inorganic N plus N mineralized dur-ing 189 d) was 217, 157, and 143 kg N ha"1 in CSWA,CS, and CC, respectively.
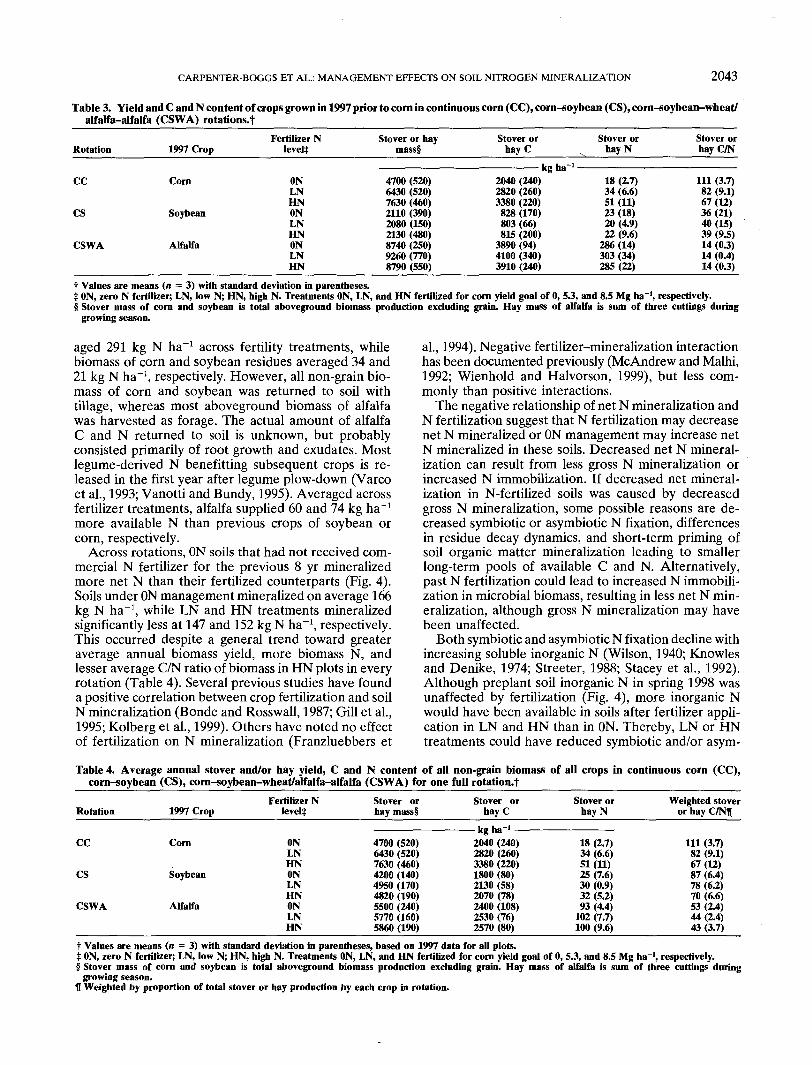
Nitrogen fixation by Rhizobium spp. bacteria in sym-biosis with alfalfa produces plant material with a rela-tively small C/N ratio. The previous crop of alfalfa har-vested from CSWA plots in 1997 had a C/N ratio of14:1, while corn residue in CC plots had a C/N ratio of67 to 111:1, and soybean from CS plots had a C/N ratioof 36 to 55:1, depending on fertilization (Table 3). Thereturn of alfalfa shoot and root residue to the soil sup-plies readily decomposable organic matter and readilymineralizable N. Aboveground biomass of alfalfa aver-
250(0
O)
200
arn
100
y = 0.803x + 94.7r = 0.89
50 75 100 125 150 175
Corn N Uptake, kg N ha'1
Fig. 6. Total available N (cumulative net N mineralized plus initialinorganic N) from soils incubated at field soil temperature vs. totalaboveground biomass uptake of N in corn grown in unfertilizedcontinuous corn (CC), corn-soybean (CS), and corn-soybean-wheat/alfalfa-alfalfa (CSWA) rotations.
CARPENTER-BOGGS ET AL.: MANAGEMENT EFFECTS ON SOIL NITROGEN MINERALIZATION 2043
Table 3. Yield and C and N content of crops grown in 1997 prior to corn in continuous corn (CC), corn-soybean (CS), com-soybean-wheat/alfalfa-alfalfa (CSWA) rotations.t
Rotation
CC
CS
CSWA
1997 Crop
Corn
Soybean
Alfalfa
Fertilizer Nlevel}
ONLNHNONLNHNONLNHN
Stover or haymass!
4700 (520)6430 (520)7630 (460)2110 (390)2080 (150)2130 (480)8740 (250)9260 (770)8790 (550)
Stover orhay C
2040(240)2820 (260)3380 (220)828 (170)803 (66)815 (200)
3890 (94)4100 (340)3910 (240)
Stover orhayN
18 (2.7)34 (6.6)51 (11)23 (18)20 (4.9)22 (9.6)
286(14)303 (34)285 (22)
Stover orhay C/N
111 (3.7)82 (9.1)67(12)36 (21)40(15)39 (9.5)14 (0.3)14 (0.4)14 (0.3)
t Values are means (n = 3) with standard deviation in parentheses.j ON, zero N fertilizer; LN, low N; HN, high N. Treatments ON, LN, and HN fertilized for corn yield goal of 0, 5.3, and 8.5 Mg ha ', respectively.§ Stover mass of corn and soybean is total aboveground biomass production excluding grain. Hay mass of alfalfa is sum of three cuttings during
growing season.
aged 291 kg N ha"1 across fertility treatments, whilebiomass of corn and soybean residues averaged 34 and21 kg N ha"1, respectively. However, all non-grain bio-mass of corn and soybean was returned to soil withtillage, whereas most aboveground biomass of alfalfawas harvested as forage. The actual amount of alfalfaC and N returned to soil is unknown, but probablyconsisted primarily of root growth and exudates. Mostlegume-derived N benefitting subsequent crops is re-leased in the first year after legume plow-down (Varcoet al., 1993; Vanotti and Bundy, 1995). Averaged acrossfertilizer treatments, alfalfa supplied 60 and 74 kg ha"1
more available N than previous crops of soybean orcorn, respectively.
Across rotations, ON soils that had not received com-mercial N fertilizer for the previous 8 yr mineralizedmore net N than their fertilized counterparts (Fig. 4).Soils under ON management mineralized on average 166kg N ha"1, while LN and HN treatments mineralizedsignificantly less at 147 and 152 kg N ha"1, respectively.This occurred despite a general trend toward greateraverage annual biomass yield, more biomass N, andlesser average C/N ratio of biomass in HN plots in everyrotation (Table 4). Several previous studies have founda positive correlation between crop fertilization and soilN mineralization (Bonde and Rosswall, 1987; Gill et al.,1995; Kolberg et al., 1999). Others have noted no effectof fertilization on N mineralization (Franzluebbers et
al., 1994). Negative fertilizer-mineralization interactionhas been documented previously (McAndrew and Malhi,1992; Wienhold and Halvorson, 1999), but less com-monly than positive interactions.
The negative relationship of net N mineralization andN fertilization suggest that N fertilization may decreasenet N mineralized or ON management may increase netN mineralized in these soils. Decreased net N mineral-ization can result from less gross N mineralization orincreased N immobilization. If decreased net mineral-ization in N-fertilized soils was caused by decreasedgross N mineralization, some possible reasons are de-creased symbiotic or asymbiotic N fixation, differencesin residue decay dynamics, and short-term priming ofsoil organic matter mineralization leading to smallerlong-term pools of available C and N. Alternatively,past N fertilization could lead to increased N immobili-zation in microbial biomass, resulting in less net N min-eralization, although gross N mineralization may havebeen unaffected.
Both symbiotic and asymbiotic N fixation decline withincreasing soluble inorganic N (Wilson, 1940; Knowlesand Denike, 1974; Streeter, 1988; Stacey et al., 1992).Although preplant soil inorganic N in spring 1998 wasunaffected by fertilization (Fig. 4), more inorganic Nwould have been available in soils after fertilizer appli-cation in LN and HN than in ON. Thereby, LN or HNtreatments could have reduced symbiotic and/or asym-
Table 4. Average annual stover and/or hay yield, C and N content of all non-grain biomass of all crops in continuous corn (CC),corn-soybean (CS), corn-soybean-\vheat/alfalfa-alfalfa (CSWA) for one full rotation.!
Rotation
CC
CS
CSWA
1997 Crop
Com
Soybean
Alfalfa
Fertilizer Nlevel}
ONLNHNONLNHNONLNHN
Stover orhay mass§
4700 (520)6430 (520)7630 (460)4200 (140)4950 (170)4820 (190)5500 (240)5770 (160)5860 (190)
Stover orhayC
——— kg ha~' ————2040 (240)2820 (260)3380 (220)1800 (80)2130 (58)2070 (78)2400 (108)2530 (76)2570 (80)
Stover orhayN
18 (2.7)34 (6.6)51 (11)25 (7.6)30 (0.9)32 (5.2)93 (4.4)
102 (7.7)100 (9.6)
Weighted stoveror hay C/Nfl
111 (3.7)82 (9.1)67(12)87 (6.4)78 (6.2)70 (6.6)53 (2.4)44 (2.4)43 (3.7)
t Values are means (n = 3) with standard deviation in parentheses, based on 1997 data for all plots.t ON, zero N fertilizer; LN, low N; HN, high N. Treatments ON, LN, and HN fertilized for com yield goal of 0, 5.3, and 8.5 Mg ha ', respectively.§ Stover mass of corn and soybean is total aboveground biomass production excluding grain. Hay mass of alfalfa is sum of three cuttings during
growing season.11 Weighted by proportion of total stover or hay production by each crop in rotation.
2044 SOIL SCI. SOC. AM. J., VOL. 64, NOVEMBER-DECEMBER 2000
biotic N fixation and the supply of mineralizable N.However, in this study alfalfa received no fertilizer Nin the fourth year of CSWA, although a small amountof N was applied at the time of wheat and alfalfa in-terseeding. Increased symbiotic N fixation in legumesin ON plots could supply more mineralizable N, but onlyin legume rotations. Since the phenomenon appeared inCC, symbiotic N fixation is probably not the source ofgreater mineralizable N in all cases. In addition, totalbiomass, biomass N, and C/N ratio of alfalfa and soy-bean did not differ appreciably at different N fertiliza-tion levels (Table 3). Nonsymbiotic N-fixation is likelyto be greater in low N treatments, but is generally con-sidered a minor contributor to labile N pools in temper-ate agricultural soils (Lamb et al., 1987), too minor toexplain the differences observed in this study. However,measurement of nonsymbiotic N fixation is rare in ara-ble soils not fertilized with N.
Fertilization may have decreased the long-term sup-ply of labile N through the priming effect. While thepriming effect is still a subject of debate, recent workhas documented changes in microbial activity after Nadditions. Application of N fertilizer (NH4NO3) cancause a temporary increase in microbial ammonificationactivity and specific respiration (Lovell and Hatch,1998). Azam et al. (1995) induced increased mineraliza-tion of vetch (Vicia spp.) residues with addition of eitherNH4 or NO3. Woods et al. (1987) observed enhancedmineralization of soil N after addition of NH4SO4. Anannual temporary rise in mineralization due to fertiliza-tion could increase the immediate supply of inorganicN but reduce the remaining supply of mineralizablematerials in LN and HN plots.
Differences in residue decay dynamics could also pro-duce increased mineralizable organic N in ON treat-ments compared with LN or HN. On average, residuesin ON plots have a greater C/N ratio than residues inLN or HN plots (Table 4). This is primarily due todifferences in corn residue C/N in CS and wheat residueC/N in CSWA (data not shown). Materials with C/Nratio larger than 40:1 decay slowly, and the decay rateis inversely related to C/N ratio (Vigil and Kissel, 1991).Slower residue decay in unfertilized plots could increaseC and N pools with time. Some of the additional C andN would be mineralizable in the long term.
Mineralized N that is subsequently immobilized andincorporated in microbial biomass at the time of leach-ing will not be extracted or measured by periodic leach-ing methods. Although N immobilization was not mea-sured during this incubation, the soil samples used in thisincubation were found to have a negative relationshipbetween past N fertilization and 10-d mineralizable C,dehydrogenase enzyme activity, and microbial biomass(by substrate-induced respiration) (data not presented).These findings suggest that N immobilization and grossN mineralization may have been even greater in unfertil-ized soils. However, avoidance of residues at samplingand the removal of high C/N residues from soil samplescould have skewed the observed mineralization. If fieldresidues, which have greatest C/N in ON treatments, had
been included in the soil samples more immobilizationmight have occurred, especially in ON soils.
CONCLUSIONSVariable-temperature incubation can be used to mimic
soil temperature dynamics under a growing crop. Whenused with composite but minimally disturbed soil sam-ples, VTI can provide both low sample variance and asmall initial flush of mineralization while mimickingfield soil temperature and its effects on mineralization.
After 8 yr, N mineralization was greater in CSWAthan CS and CC. Rotation with legumes increased theN mineralizable from soil to support crop production.Alfalfa plow-down after 1.5 yr growth supplied 189 kgN ha"1,47 and 56 kg N ha"1 more N than previous cropsof soybean or corn, respectively. Across rotations, net Nmineralization was negatively affected by N fertilization.The average difference in net N mineralization in ONplots compared with LN and HN plots was 16 kg Nha"1. This suggests a small negative impact of N fertiliza-tion on labile N pools in the soil studied. While inorganicN is known to decrease both symbiotic and asymbioticN fixation, crop data do not suggest greater symbiotic Nfixation in ON treatment. Yield and biomass N of cropswere generally less in ON treatments. Asymbiotic N fixa-tion is generally considered negligible. Fertilizer N mayalter the soil supply of labile N by reducing crop residueresidence time in soil. Fertilizer addition may increasemicrobial activity temporarily, either directly after fertil-ization causing a priming of soil organic matter mineral-ization, or indirectly when large quantities of lower C/N ratio residues are incorporated into well-fertilizedsoils, leaving less mineralizable material for future use.
ACKNOWLEDGMENTSWe heartily thank Terry Lemme, David Harris, and Gra-
ham Leif for laboratory analyses. The USDA is an equalopportunity provider and employer.
CARPENTER-BOGGS ET AL.: MANAGEMENT EFFECTS ON SOIL NITROGEN MINERALIZATION 2045
and cotton yield in Alabama's "Old Rotation." Biol. Pert. Soils23:353-358.
Fox, R.H., and W.P. Piekielek. 1978. Field testing of several nitrogenavailability indexes. Soil Sci. Soc. Am. J. 42:747-750.
Frank, K., D. Beegle, and J. Denning. 1998. Phosphorus, p. 21-29. InRecommended chemical soil test procedures for the north centralregion. NCR-13 Publication 221. Missouri Agric. Exp. Stn. SB 1001.Univ. of Missouri, Columbia.
Franzluebbers, A.J., P.M. Rons, and D.A. Zuberer. 1994. Long-termchanges in soil carbon and nitrogen pools in wheat managementsystems. Soil Sci. Soc. Am. J. 58:1639-1645.
Gerwing, J., and R. Gelderman. 1996. Fertilizer recommendationsguide. Publ. EC 750. South Dakota State Univ., Brookings, SD.
Gill, K., S.C. Jarvis, and D.J. Hatch. 1995. Mineralization of nitrogenin long-term pasture soils: Effects of management. Plant Soil172:153-162.
Hong, S.D., R.H. Fox, and W.P. Piekielek. 1990. Field evaluation ofseveral chemical indexes of soil nitrogen availability. Plant Soil123:83-88.
Knowles, R., and D. Denike. 1974. Effect of ammonium, nitrate, andnitrate-nitrogen on anaerobic nitrogenase activity in soil. Soil Biol.Biochem. 6:353-358.
Kolberg, R.L., B. Rouppet, D.G. Westfall, and G.A. Peterson. 1997.Evaluation of an in situ net soil nitrogen mineralization methodin dryland agroecosystems. Soil Sci. Soc. Am. J. 61:504-508.
Kolberg, R.L., D.G. Westfall, and G.A. Peterson. 1999. Influence ofcropping intensity and nitrogen fertilizer rates on in situ nitrogenmineralization. Soil Sci. Soc. Am. J. 63:129-134.
Ladd, J.N., M. Amato, L. Zhou, and J.E. Schultz. 1994. Differentialeffects of rotation, plant residue and nitrogen fertilizer on microbialbiomass and organic matter in an Australian alfisol. Soil Biol.Biochem. 26:821-831.
Lamb, J.A., J.W. Doran, and G.A. Peterson. 1987. Nonsymbioticdinitrogen fixation in no-till and conventional wheat-fallow sys-tems. Soil Sci. Soc. Am. J. 51:356-361.
Liang, B.C., and A.F. Mackenzie. 1994. Corn yield, nitrogen uptakeand nitrogen use efficiency as influenced by nitrogen fertilization.Can. J. Soil Sci. 74:235-240.
Lovell, R.D., and D.J. Hatch. 1998. Stimulation of microbial activityfollowing spring applications of nitrogen. Biol. Fertil. Soils26:28-30.
McAndrew, D.W., and S.S. Malhi. 1992. Long-term N fertilization ofa solonetzic soil: Effects on chemical and biological properties. SoilBiol. Biochem. 24:619-623.
Nelson, D.W., and L.E. Sommers. 1996. Total carbon, organic carbon,and organic matter, p. 961 -1010. In D.L. Sparks et al. (ed.) Methodsof soil analysis. Part 3. SSSA Book Ser. 5. SSSA, Madison, Wl.
Piper, C.V., and A.J. Pieters. 1922. Green manuring. USDA Farmers'Bull. 1250. U.S. Gov. Print. Office, Washington, DC.
Ritchie, S.W., J.J. Hanway, and G.O. Benson. 1992. How a corn plantdevelops. Special Rep. 48. Iowa State Univ. Coop. Ext. Serv., Ames.
Smolander, A., A. Kurka, V. Kitunen, and E. Malkonen. 1994. Micro-bial biomass C and N, and respiratory activity in soil of repeatedlylimed and N- and P-fertilized Norway spruce stands. Soil Biol.Biochem. 26:957-962.
Stacey, G., R.H. Burris, and H.J. Evans. 1992. Biological nitrogenfixation. Chapman and Hall, New York.
Stanford, G., M.H. Frere, and D.H. Schwaninger. 1973. Temperaturecoefficient of soil nitrogen mineralization. Soil Sci. 115:321-323.
Stanford, G., and SJ. Smith. 1972. Nitrogen mineralization potentialof soils. Soil Sci. Soc. Am. Proc. 36:465-472.
Streeter, J. 1988. Inhibition of legume nodule formation and N2 fixa-tion by nitrate. Crit. Rev. Plant Sci. 7:1-23.
Vanotti, M.B., and L.G. Bundy. 1995. Soybean effects on soil nitrogenavailability in crop rotations. Agron. J. 87:676-680.
Varco, J.J., W.W. Frye, M.S. Smith, and C.T. MacKown. 1993. Tillageeffects on legume decomposition and transformation of legumeand fertilizer nitrogen-15. Soil Sci. Soc. Am. J. 57:750-756.
Vigil, M.F., and D.E. Kissel. 1991. Equations for estimating theamount of nitrogen mineralized from crop residues. Soil Sci. Soc.Am. J. 55:757-761.
Warncke, D., and J.R. Brown. 1998. Potassium and other basic cations,p. 31-33. In Recommended chemical soil test procedures for thenorth central region. NCR-13 Publication 221. Missouri Agric. Exp.Stn. SB 1001. Univ. of Missouri, Columbia.
Watson, M.E., and J.R. Brown. 1998. pH and lime requirement, p.13-16. In Recommended chemical soil test procedures for the northcentral region. NCR-13 Publication 221. Missouri Agric. Exp. Stn.SB 1001. Univ. of Missouri, Columbia.
Whitney, D.A. 1998. Soil salinity, p. 59-60. In Recommended chemicalsoil test procedures for the north central region. NCR-13 Publica-tion 221. Missouri Agric, Exp. Stn. SB 1001. Univ. of Missouri, Co-lumbia.
Wienhold, B.J., and A.D. Halvorson. 1999. Nitrogen mineralizationresponses to cropping, tillage, and nitrogen rate in the northernGreat Plains. Soil Sci. Soc. Am. J. 63:192-196.
Wilson, P.W. 1940. The biochemistry of symbiotic nitrogen fixation.Univ. Wisconsin Press, Madison.
Woods, L.E., C.V. Cole, L.K. Porter, and D.C. Coleman. 1987. Trans-formations of added and indigenous nitrogen in gnotobiotic soil:A comment on the priming effect. Soil Biol. Biochem. 19:673-678.
Zak, D.R., W.E. Holmes, N.W. MacDonald, and K.S. Pregitzer. 1999.Soil temperature, matric potential, and the kinetics of microbialrespiration and nitrogen mineralization. Soil Sci. Soc. Am. J.63:575-584.
Zellweger Analytics. 1992. Nitrate in 2M KC1 soil extracts,QuickChem Method 12-107-04-1-B. (12 Nov. 1992) Zellweger Ana-lytics, Inc., Lachat Instruments Div., Milwaukee, WL