soil movement in west virginia watersheds
DESCRIPTION
Soil Movement in West Virginia Watersheds. A GIS Assessment. Greg Hamons Dr. Michael Strager Dr. Jingxin Wang. A little about me…. Native West Virginian Pocahontas County B.S. in Forest Resource Management Seeking M.S. Forestry Very interested in Forestry and GIS Analysis!. Issue. - PowerPoint PPT PresentationTRANSCRIPT

Soil Movement in West VirginiaWatersheds
A GIS
Assessment
Greg HamonsDr. Michael StragerDr. Jingxin Wang

A little about me….
Native West Virginian – Pocahontas County
B.S. in Forest Resource Management Seeking M.S. Forestry Very interested in Forestry and GIS Analysis!

Issue
Sedimentation– Soil movement can cause lots of damage
especially when its moving into water resources.– Pollution of streams, Raise flood levels, Raise
stream temperatures, Degrade site/stream quality and Productivity, and reduce navigational abilities.
Sediment created from Silvicultural Operations is the issue at hand.

Project Description
Problems:– Soil Movement, specifically sedimentation, is very
detrimental to streams and forested sites. Pollution to Water Resources Site Degradation-Both Environmentally and Aesthetically Habitat and Productivity Loss-Both Onsite and Downstream
– Assess Best Management Practices (BMP) Functionality GOAL: FIND SIGNIFICANT SOIL MOVEMENT
CONTRIBUTORS and IDENTIFY DIFFERENCES BETWEEN WATERSHEDS

Project: Study Area
Two Watersheds located in Tucker County, WV Both Similar in
Geologic and
Physical Makeup.
Slopes
Elevations
Land-cover
etc…


Project Description
Study designed to evaluate soil movement and it’s relation to logging.
Two Watersheds (Control and Treatment) Silt-fence Installed around all Streams Material Removed Once a Year Extensive Mapping Procedures Classification/Regression Trees to Model
and/or Predict Sedimentation


Silt-fence Installation


Data Collection and Recording

Total Oven-Dry Material
Oven Dry and Burn Pour off and discard
Place in water
(Mostly Mineral)
Manually separate predominantly mineral from
predominantly organic
Mineral associated with predominantly organic fraction
Apply average percent to predominantly organic fraction weight
Burn sub-samples, calculate average percent mineral (Mostly Organic)
Mineral associated with predominantly mineral fraction
Total Sediment

Methods
Use GIS to identify Landscape elements in each watershed that contribute to soil movement. (i.e. Disturbance, Moisture, Slope, Soil Types, etc…)
Calculations: Derived From Digital Elevation Map– Slope, Aspect, Flow Direction, Flow Accumulation, Moisture
Index, Distance Grids (from road, from stream, etc.), Soils,
Land-cover, etc… Many Variables! Analysis Performed Using Various Extensions of the
ESRI ArcMap 9.1 GIS program. As well as the newly developed 3-Meter DEM and Aerial Photography from the WV GIS Tech-center.
Statistical Method-Classification Trees– R Statistical Package

Spatial Analysis Toolbar
Slope Grid
Raster Calculator
Moisture Index
HydrologyTools
Flow Direction
Flow Accumulation
Stream Networks
Digital Elevation Map (DEM) 3-MeterResolution
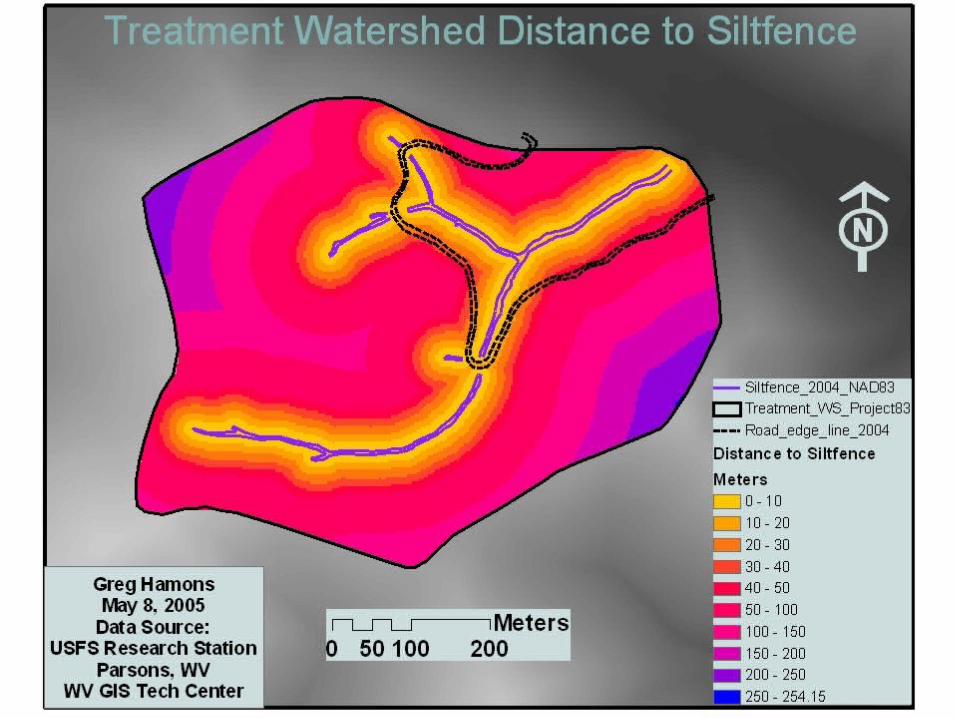
DistanceGrids
Aspect Grid
Curvature
Inputs --- Tools ---
Output Grids ---

Sediment a function of…
Sediment Reaching Silt-fence=
F (Slope, Distance From Silt-fence, Distance From Disturbance, Distance From Slope Breaks, Moisture, Aspect, Accumulation, Soil Type, Vegetation, Land-use, )
Very Dynamic Subject


Ecological Land Units (ELU)Moisture Index
This index assumes that the relative moisture in a particular area (in this case a grid cell) primarily depends on two factors;
– How much water is flowing into the area and how fast the water can flow out of the area.
Ln [(catchment area + 1) / (slope + 1)]
The created index is a relative one so the numbers don’t represent any type of units.
– Higher Positive Numbers are Wetter– Lower Negative Numbers are Drier
Strager (2006)


Analyses Performed
Also:
– Classification Tree Modeling Technique– Statistical Analyses (S-plus and R Statistics Systems)
Future Analyses– Stream Loading-Sediment– Refining of Classification Tree Modeling
Key to possibly modeling the soil movement or sedimentation

Results
According to the Statistical Modeling: R– Slope is the most important variable
21.58º Followed by: Moisture- +3.62 (Range -4.3 – 7.6) Aspect- 141º
– Combined Grids Using Raster Calculator
Model Refinement to Include more Variables Coming Soon!


Conclusions
3-Meter DEM much higher accuracy! 1:4800 scale aerial photography gives great visual
representation!– Leads to more thorough analysis.– Detailed 3-D Representation.
Hydrology Tools Very Influential Upon Completion of Analyses:
– Identify Contributors to Soil Movement Order there level of Importance
– Assess current Best Management Practices (BMP)– Model/Predict Soil Loss

Thank You
Any Questions?

References
(Grayson et al. 1992; Mitasova 1996; Moore, I. D. et al. 1988; Boer et al. 1996, O’Loughlin 1986, Parker 1982)
Strager 2006