soil hydrology in lodgepole pine ecosystems in southeastern wyoming
TRANSCRIPT

Soil Hydrology in Lodgepole Pine Ecosystems in Southeastern WyomingRAY C. NYBERG AND TIMOTHY J. FAHEY*
ABSTRACTThe rates and pathways of water movement through the soil were
examined in several lodgepole pine (Pinus contorta ssp. latifolia)forests in southeastern Wyoming to improve our understanding ofthe dynamics of solute flux in forest ecosystems. We employed in-ternal drainage and tracer pulse methods to determine hydraulicconductivity, and we examined snow melt infiltration and drainagewater chemistry on contrasting soils supporting lodgepole pine for-ests. Saturated hydraulic conductivity (Ka) values were lognormallydistributed for 27 plots at each of two sites examined. The medianvalue was significantly higher at a site on a gravelly, loamy-sand(median K0 = 1.20 cm/h) than on a bouldery, sandy-loam (K,, = 0.49).At these sites the high range in both K,, values and in the transittime for a Cl pulse were suggestive of highly variable water flowpathways through the soil. Early in the spring snowmelt period much
R.C. Nyberg, Dep. of Botany, Univ. of Wyoming, Laramie, WY82071; and T.J. Fahey, Dep. of Natural Resources, Fernow Hall,Cornell Univ., Ithaca, NY 14853. Research supported by the Na-tipnal Science Foundation (DEB 81-13546, BSR 83-16924). Con-tribution from the Dep. of Botany, Univ. of Wyoming, and Dep.of Natural Resources, Cornell Univ. Received 26 May 1987. "Cor-responding author.
Published in Soil Sci. Soc. Am. J. 52:844-849 (1988).
of the infiltrating water circumvented the soil matrix, probably flow-ing around entrapped air pockets and through macropores. Althoughlarge systematic differences in chemistry were not observed betweensoil solutions collected with tension and tensionless lysimeters, sat-urated flow (collected as drips from the ceiling of soil tunnels) con-tained about three times lower cation concentrations than the lysi-meter solutions. To obtain more accurate estimates of nutrientleaching from the tree rooting zone better quantification of the chem-istry of percolating soil water is needed.
Additional Index Words: Hydraulic conductivity, Infiltration,Leaching, Macropores, Spatial variation.
A BETTER UNDERSTANDING of the rates and path-ways of water movement through soils is essen-
tial for modelling soil chemical reactions (Luxmooreet al., 1978) and estimating subsurface leaching in for-est ecosystems (Fahey and Yavitt, in press). Many for-est soils exhibit complex hydrologic behavior, includ-ing preferential flow pathways (DeVries and Chow,1978) or a dual-pore system (Shaffer et al., 1979). Also,some very high flow rates have been observed in wet
NYBERG & FAHEY: SOIL HYDROLOGY IN LODGEPOLE PINE ECOSYSTEMS IN SOUTHEASTERN WYOMING 845
soils (DeVries and Chow, 1978; Mosley, 1982). Trans-port via root channels and the high stoniness in manyforest soils favor rapid drainage of water when imped-ing horizons are absent, and the interaction betweenthis rapidly percolating water and the soil matrix maybe limited.
The objective of the present study was to determinethe rates and pathways of water movement throughcontrasting soils in lodgepole pine ecosystems. Theseforests dominate the montane landscape at elevationsof about 2700 to 3100 m in the central Rocky Moun-tains, and the montane and subalpine watersheds sup-ply water for agricultural, municipal and industrial usesin the valleys below. Lodgepole pine invades burnedover sites on nearly all combinations of soil and to-pography in this region and despite the relatively uni-form vegetation and climate, marked variation in for-est hydrology has been observed (Knight et al., 1985).The hydrology of lodgepole pine ecosystems is dom-inated by the winter snowpack which begins to ac-cumulate in October and melts in a 3- to 5-wk periodin May or June. Little root zone leaching occurs insummer as soil moisture is depleted by tree uptake(Knight et al., 1985).
We examined soil hydrology in three intensive re-search sites in southeastern Wyoming, each domi-nated by lodgepole pine (Table 1). Soils included agravelly, loamy-sand derived from a coarse, graniticregolith (Lithic Cryochrept at Albany site); a bouldery,clay-loam on a quartzite-rich glacial moraine (TypicCryoboralf at French Creek site); and a bouldery,sandy-loam on mixed glacial till (Typic Cryoboralf atNash Fork site). We also report observations fromthree other lodgepole pine ecosystems used in our ear-lier studies (Rock Creek, Dry Park, and Fox Park).More detailed descriptions of these and the intensivesites may be found elsewhere (Knight et al., 1985;Fahey and Yavitt, in press).
We expected high spatial variation in hydraulic con-ductivity (K) and soil water movement both withinand among sites in these lodgepole pine ecosystems.As commonly observed in field soils, a lognormal dis-tribution of lvalues was anticipated (Jury et al., 1982).Also, we expected occasionally to encounter zones ofpreferential flow with extremely high saturated hy-draulic conductivity (K0). Maximum rates of internalredistribution of soil water were expected to exceedthe snowmelt rate, except in high clay soils whereoverland flow has been observed (Knight et al., 1985).
MATERIALS AND METHODSHydraulic Conductivity
We measured in situ hydraulic conductivity using an in-ternal drainage approach (Hillel, 1982). Libardi et al. (1980)described a method which does not require the tensiometerdata that are so difficult to obtain in bouldery glacial soils.Assuming an exponential relationship between K and vol-umetric water content (0)
K(@) = Kt, exp [1]
Table 1. Soil physical properties for three lodgepole pine eco-systems, southeastern Wyoming.
Soil Total Stones GravelSite depth porosityt (> 10 mm) (2-10 mm) Silt Clay 6{ct
Albany
Nash Fork
French Creek
cm
0-3030-600-30
30-600-30
30-60
%
507
47365445
— %
00
20181916
i by mass —
557331461949
% <2 mmfraction18 126 8
33 1524 1540 2429 20
cm
9
12
t Assuming particle density = 2.65.j Volumetric water content at field capacity (0-80 cm).
regression of 0,, — 0 vs. In t as represented in a reformu-lation of the Richard's equation for large time (t)
00 - 0 = (1//3) In t + (1/0) In (K^/oz). [2]In this equation a is obtained from the relationship of av-erage water content (0*) to depth z, and 0 at depth z
0* = a0 + b [3]
and assuming negligible pressure head (minimal pondingdepth), then K,, and 0 can be calculated from the time courseof soil drainage from 0,, (0 after prolonged ponding) by
as measured for each redistribution plot.We employed this internal drainage method on 32 plots
at the Nash Fork site and 34 plots at the Albany site. Neu-tron probe access holes were power augered to a depth of1.0 to 1.8 m using a 6-cm bit. Aluminum irrigation pipe (5-cm diam.) was inserted in each hole, and soil from the holeswas used to back fill firmly around the pipes.
Because the manufacturer's calibration of the neutronmoisture meter (Campbell Scientific Inc., Logan, UT) maynot be suitable for actual field determinations (Carneiro andDeJong, 1985), we calibrated the neutron probe in the lab-oratory. Soils from two of the research sites (Nash Fork,Albany) were packed to about field bulk density in 55-galloncylindrical steel barrels (0.7-m diam. by 1.1-m height)equipped with Al access tubes. Water was added in mea-sured increments to dry soil and allowed to equilibrate withinthe barrels before neutron probe readings were taken. Cal-ibration curves for the two soils were not significantly dif-ferent, but they differed from the manufacturer's calibration,possibly because of organic matter in these profiles.
Internal drainage measurements were carried out in Oc-tober and November, 1983 when trees were dormant (e.g.,Smith et al., 1984) to avoid problems with concurrent rootwater uptake (Hillel, 1982). Small plots (1.2 m diam.) aroundeach neutron probe access tube were ponded with streamwater until 0 was nearly constant throughout the soil profile;typically this required 50 to 100 cm of added water. Aftersteady state was reached, the plots were covered with plasticsheets to prevent evaporation, and neutron probe readingswere taken at 20-cm depth increments one to three timeseach day for the next several days.
We also estimated the rate of soil water movement fromthe velocity of a pulse of chloride through wet soil. Distilledwater (about 30 cm) was added to 1.5-m by 1.5-m plots inthe Nash Fork, Albany, and French Creek sites. A 4-cm pulseof 100 mg/L NaCl solution was followed by addition of 8to 10 cm/d of distilled water for 4 to 5 d. We collected soilsolutions 8 to 10 times in each plot using one porous-cuptension lysimeter and one zero-tension funnel lysimeterplaced at about 60-cm depth in each plot. Chloride was ana-lyzed colorimetrically (Zall et al., 1956) on a Scientific In-struments, Inc. (Scientific Instruments, Inc., West PalmBeach, FL) continuous-flow analyzer (CFA). We used thetime interval between application of the pulse and appear-ance of the chloride peak at the lysimeter to calculate waterflux in wet soils.

846 SOIL SCI. SOC. AM. J., VOL. 52, 1988
Snow melt Infiltration and DrainageWe measured concurrent changes in water content of the
snowpack and the soil during the early phases of snowmeltto document the effectiveness of the upper mineral soil inretaining snowmelt. Ten 2-m by 2-m plots were establishedat the Albany and Fox Park sites. Four neutron probe accessholes were augered and lined with pipes to permit accessfrom above the snowpack. At 3-d intervals during the 1983snowmelt period, we measured soil water content by neu-tron probe and snowpack water content with calibratedMontrose snow tubes.
Having observed dry pockets of soil during the snowmeltperiod, we systematically sampled for these nonwetted soilsin three sites during late snowmelt, 1983. The remainingsnowpack was excavated and soils carefully examined afterexposing wedges to a depth of about 20 cm with a shovelon 150 random 1-m by 1-m plots at each site. The area andapproximate volume of nonwetted soil was estimated vis-ually, and ten samples each of wet and dry soil were col-lected for laboratory analysis. The distinction between water-saturated wet soil and dry soil was very obvious in mostinstances. Water content of wet and dry soil samples wasmeasured gravimetrically. A wettability index was obtainedfrom the contact angle of water droplets on soil surfaces,measured microscopically (Hillel, 1982).
Drainage Water ChemistryWe used zero-tension lysimeters to collect soil solutions
at three sites (Albany, Nash Fork, Fox Park) during thesnowmelt interval in 1983, for comparison with tension lys-imeter samples which are reported in detail by Fahey andYavitt (in press). Sand-filled funnel lysimeters (Turner andJohnson, 1985) and zero-tension lysimeters (Jordan, 1968)collected saturated flow at 2- to 4-d intervals throughout thesnowmelt drainage period. No differences were observed be-tween these two lysimeter types so henceforth both are de-noted tensionless.
Saturated flow also was collected as drips from the ceilingsof soil tunnels. Lysimeters and drip spots were accessibleduring snowmelt from sheltered soil trenches.
Each sample was filtered through prerinsed glass fiber fil-ters (0.5 nm effective pore size) before being analyzed formajor dissolved constituents. In this paper we report valuesfor Ca2 + , K(, Na1 and SOir, only. The cations were mea-sured by atomic absorption spectrophotometry and SO;h by
0.40
a methylthymol blue method on the CFA (Anonymous,1971).
RESULTS AND DISCUSSIONHydraulic Conductivity and Soil Water Flux
In general, a consistent exponential decrease in soilwater content was observed during drainage from theplots in both sites (Fig. 1); however, at the Nash Forksite a brief lag (2 to 6 h) in drainage was noted inseveral of the plots, probably indicating that perfectsteady-state drainage was not achieved (R. J. Wagenet,1987, personal communication). Values of the corre-lation coefficient for equation 2 (i.e., ©„ — 0 vs. In f)and Eq. [3] (0* vs. 0) were used to indicate the validityof the approximate solutions (Jones and Wagenet,1984). Although all the correlations were highly sig-nificant (p < 0.01), four plots at Nash Fork and sevenat Albany were eliminated from further considerationbecause less than half of the variance in @0 — 0 wasexplained by the linear relationship with In t. Thus,the calculation of K0 by the 0 method may not beappropriate (Jones and Wagenet, 1984).
Saturated hydraulic conductivity (K^ values cal-culated from soil water retention data for 0- to 80-cmdepth by the 0 method of Libardi et al. (1980) werelognormal for two sites examined (Fig. 2), with mostvalues clustered at the low end of the range. Mean andmedian values were about three times higher in a grav-elly, loamy-sand at Albany than in a bouldery, sandy-loam at Nash Fork (Table 2), and these values werewithin the range of literature observations for thesesoil texture classes (Hillel, 1982). The large range inK0 values observed in these two sites is typical of fieldsoils and suggests the existence of highly variable waterflow pathways within these soils. This suggestion wasfurther supported by observations of the movementof a chloride pulse (see below). In both sites the pulsemoved from the surface to occasional drip spots onthe ceiling of soil tunnels at 60-cm depth in 1 to 2 h,
Hydraulic conductivity (cm hour-1)10 15 20 0 2.5 7.5 10
Nash Fork: Plot 5 (80 cm)
100 200 300
Time (hours)Fig. 1. Changes in soil water content (80-cm depth) following pro-
longed ponding for representative plots in two lodgepole pine for-est sites.
- 3 - 2 - 1 0 1 2 3 - 3 - 2 - 1 0 1 2m Hydraulic conductivity (cm hour1)
Fig. 2. Cumulative probability distribution of hydraulic conductivity(closed circles) and In hydraulic conductivity (open circles) for twolodgepole pine sites estimated by the ® method of Libardi et al.(1980).

NYBERG & FAHEY: SOIL HYDROLOGY IN LODGEPOLE PINE ECOSYSTEMS IN SOUTHEASTERN WYOMING 847
Table 2. Hydraulic characteristics of soils from lodgepole pine eco-sy stems, t_______________________________
Chloride pulse Internal drainage method
20 r
Site Parameter
———— cm/h ————Albany
Nash Fork
French Creek
MaximumMinimumMeanMedianMaximumMinimumMeanMedianMaximumMinimumMeanMedian
161.16.02.830.31.30.820.030.60.3
20.100.074.161.209.000.031.330.49
385.063.9
179.7166.0
185.28.4
56.539.2
t Saturated hydraulic conductivity (K0) and exponential constant (/?) forthe relationship of K and 9, estimated by an internal drainage method(Libardi et al., 1980) and K0 calculated from the velocity of a chloridepulse through wet soil.
clearly evidence of macropore flow and illustrating theoperation of a dual-pore drainage system in these for-est soils (Shaffer et al., 1979). All but the very lowestKa values observed in these soils were generally higherthan the maximum rates of snowmelt in lodgepolepine ecosystems (Knight et al., 1985), and overlandflow was never observed in either site during thesnowmelt period.
The chloride-pulse method was used to estimate soilwater flux in three lodgepole pine ecosystems, the NashFork and Albany sites discussed earlier and the FrenchCreek site with a bouldery, clay-loam soil (Fig. 3). Me-dian transit times were nearly five times longer forNash Fork than for the coarse Albany soil, whereasfor the fine soil at French Creek median transit timewas over twice as long as for Nash Fork. Low fluxrates and K0 values were anticipated for the fine FrenchCreek soil where overland flow of snowmelt occurseach spring.
Assuming a unit hydraulic gradient and correctingfor actual 0 values, we calculated K0 from the transittime data. For both the Nash Fork and Albany sites,these K,, values were comparable to those calculatedby the internal drainage method (Table 2). The me-dian value for the French Creek site (0.3 cm/h) is com-parable to the maximum snowmelt rates observed inthis forest during the late stages of spring snowmelt(Knight et al., 1985) when small amounts of overlandflow occur.
Retention of SnowmeltBecause dry summers and early snow accumulation
usually result in dry soils (<—0.8 MPa) prior to snow-melt in these lodgepole pine ecosystems (Fahey andKnight, 1986), substantial air entrapment was antici-pated during snowmelt infiltration the following spring.We measured the retention of snowmelt in the uppersoil horizons of the lodgepole pine site at Fox Park in1984 using the neutron probe method. Early in thesnowmelt period significantly larger amounts of waterhad melted from the snowpack than appeared in theupper 80 cm of the soil profile. The maximum differ-ence was about 11 cm on 29 Apr. 1984, when snow-
10 -
D ALBANY
"|
• FRENCH CREEK
-
.1,.o 50 10°
BREAKTHROUGH TIME (HOURS)Fig. 3. Histograms of transit time for movement of a pulse of Cl~
to about the 60-cm depth in two lodgepole pine sites.
melt totalled 13.5 cm but the change in 0 was only2.3 cm. This result suggests that much of the meltingsnow was not retained in the soil matrix but ratherwas moving rapidly through macropores or circum-venting entrapped air pockets. This profile retainsabout 8 cm at field capacity, and no significant over-land flow or sublimation of snow occurs (Knight etal., 1985). However, our visual observations did sug-gest that some of the channelling could have resultedfrom nonuniform melting from the base of the snow-pack where an ice-covered layer had developed.
To corroborate these observations we excavated theremaining snowpack at 150 or 200 random locationsin three lodgepole pine sites (Albany, Fox Park, NashFork). The frequency and dimensions of dry soil pock-ets on 0.5-m by 0.5-m plots are summarized in Table3. Even following the melt of over 30 cm of snow,about 15% of the soil at the Nash Fork and Fox Parksites had not wetted. These dry soil pockets were non-wettable based upon the criterion of water dropletcontact angles (Hillel, 1982) which were much higherthan for the soil samples that had been wetted duringsnowmelt. Thus, these soils apparently containedchemical compounds conferring hydrophobic behav-ior which, in conjunction with macropore flow and airentrapment, help explain the restricted water reten-tion observed during snowmelt.
Other evidence of snowmelt retention characteris-tics was obtained inadvertently with porous-cup lys-imeters used to sample soil solutions during the springflush period (Fahey and Yavitt, in press). At the FoxPark, Nash Fork and Dry Park sites, 20% to 30% ofthe total of 60 lysimeters (at 40-cm depth) failed tocollect solutions each spring until the local perchedTable 3. Frequency and size distribution of dry soil pockets near
the end of the snowmelt period in three lodgepole pine forestsites in southeastern Wyoming.
Site
AlbanyNash ForkFox Park
No.samples
150150200
Totalfrequency
1.314.016.5
Frequency by size class, cm2
<10
03.31.5
10-30
02.72.0
30-500
1.34.07.0
>500
04.06.0
848 SOIL SCI. SOC. AM. J., VOL. 52, 1988
*+ 40-
(/>
80-
120-
160
Nash Fork: Plot 6020h 28h 38h 80h164h300h
1 1 \ T \'> s <N>.* -•*
100 90 80 70Relative water content (% of maximum)
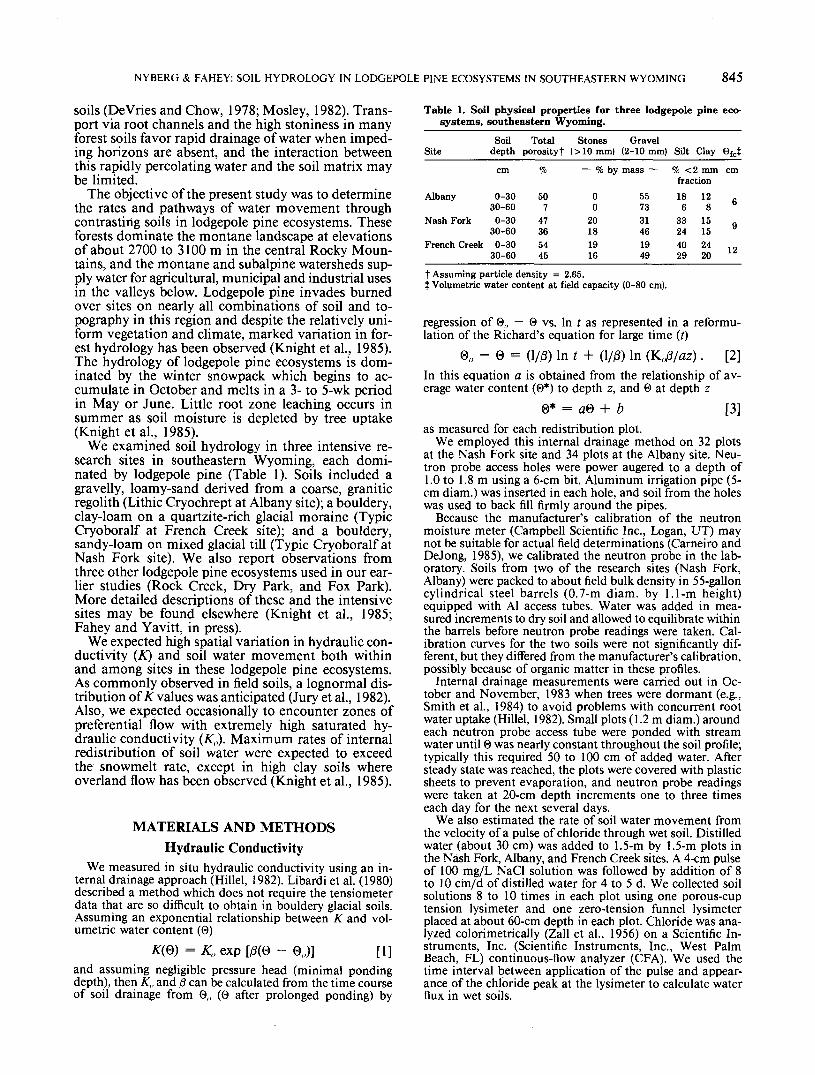
Fig. 4. Drainage of a saturated profile following snowmelt on a rep-resentative plot in the Nash Fork site in spring, 1984.
water table rose to the corresponding depth in the soil(based upon soil trenches). Apparently snowmelt waterwas channelled around these lysimeters probably viamacropores. Similar results were obtained with ten-sionless lysimeters.
Snowmelt DrainageThe gentle topography which characterizes many
areas of lodgepole pine ecosystems in southeasternWyoming leads to restricted rates of transmission ofsnowmelt and to the rise of a seasonal, local perchedwater table in many areas. The rate of fall of the watertable, as gauged with soil trenches, ranged from 3 to13 cm/d among three sites exhibiting this phenome-non.
At the Nash Fork site no water table was observed,and following snowmelt in 1984, internal drainage wasmeasured in the same manner as for the ponding ex-periments. A large range and lognormal distributionwere observed for these values as well, but the mag-nitude of the values could be affected by tree root up-take at this time (Fahey, 1979a). In 7 of the 33 plotsmeasured, slow drainage of a supersaturated soil pro-file was observed (Fig. 4), and the rate of fall of thisdrainage front averaged about 0.4 cm/h.
At the French Creek site (fine soil), drainage ofsnowmelt water was gradual (0.12 cm/h) and spatiallyuniform. All six neutron probe holes gave similar re-sults. At this site and at another site with fine soil(loamy-clay at Rock Creek; Fahey and Yavitt, in press)overland flow was observed during snowmelt, and bothof these sites exhibited saturated conditions despitethe moderate slope (10 to 20%) of the terrain. In thelandscape around the Rock Creek site overland flowis a major pathway of hydrologic transport duringsnowmelt (Fahey, 1979b), whereas it is a minor com-ponent at French Creek (Knight et al., 1985). Thus,for gentle and moderate slopes in this ecosystem,overland flow apparently becomes important when soilclay content exceeds that at French Creek (20-24%clay).
Significant differences in chemistry usually were notobserved between soil solutions collected by tension(porous cup) and tensionless lysimeters in two sites.For example Ca2+ concentrations at Albany wereslightly (p > 0.05) higher for tensionless (0.21 mg/L)than tension lysimeter samples (0.16 mg/L), whereas
the reverse was true at Nash Fork (0.26 vs. 0.29 mg/L). Differences for Na+ and SO2.- were even smaller,whereas K+ concentrations were significantly (p <0.05) higher for tensionless lysimeters at Albany butnearly identical for both types at Nash Fork.
In contrast, concentrations of all these solutes weremuch lower (p < 0.01) in saturated flow collected asdrips from the ceilings of soil tunnels. For example,Ca2+ and K+ averaged three times higher in lysimetersamples than in drip samples. We speculate that somerapidly flowing water, collected as drips from soil tun-nels, interacts little with the soil matrix and that so-lutions collected with lysimeters represent largely themore slow-moving, interstitial water. That drips wereobserved intermittently only in 8 of the 24 tunnels inthe Nash Fork and Albany stands suggests that suchrapid flow may not be the dominant pathway of soilwater movement. As indicated by their similarity tothe tension lysimeter solutions, apparently the ten-sionless lysimeters did not collect significant amountsof this rapidly-flowing water.
CONCLUSIONSSoil hydrology in these lodgepole pine ecosystems
is characterized by high spatial variation both withinand between sites. Within-site variation, which ap-proximated a lognormal distribution, provides evi-dence for an array of flow pathways with differentproperties, probably owing to the complex three di-mensional structure of these stony soils. Some snow-melt appears to be channelled along preferential flowpathways and much of the soil may remain unwettedduring early stages of the snowmelt period. Soil claycontent appears critical in defining between-site dif-ferences in soil hydrology; below about 20% clay, hy-draulic conductivity usually exceeds the snowmelt rate,whereas at higher clay contents (over 28% clay) drain-age is constrained and overland flow becomes prom-inent. The rise of a local perched water table duringlate snowmelt plays an important role on sites withgentle topography and/or fine soils. These hydrologicphenomena certainly affect soil chemical reactions andsolute transport from the soils. Relatively immobilesoil water may interact only sparingly with the mobilephase, and because tension lysimeters may collect pri-marily from the immobile phase (Shaffer et al., 1979),estimates of solute flux based on these solution sam-ples and a simple cascade-type hydrology model (Run-ning, 1984) may be inaccurate. More accurate esti-mates of root-zone leaching will require sampling ofsoil solutions with a combination tension and ten-sionless lysimeters of different designs and additionalevaluation of the proportions of percolating soil waterwith solute concentrations represented by the solu-tions obtained with the different types of collector.
DE DATTA ET AL.: NITROGEN USE EFFICIENCY AND NITROGEN-15 BALANCES IN BROADCAST-SEEDED RICE 849