soil fertility in organic systems: a guide for …...1 soil fertility in organic systems a guide for...
TRANSCRIPT
A PA C I F I C N O R T H W E S T E X T E N S I O N P U B L I C A T I O N • P N W 6 4 6
Soil Fertility in Organic Systems:A Guide for Gardeners and
Small Acreage Farmers
Washington State University • Oregon State University • University of Idaho

i
Soil Fertility in Organic Systems:A Guide for Gardeners and Small Acreage Farmers
Table of Contents
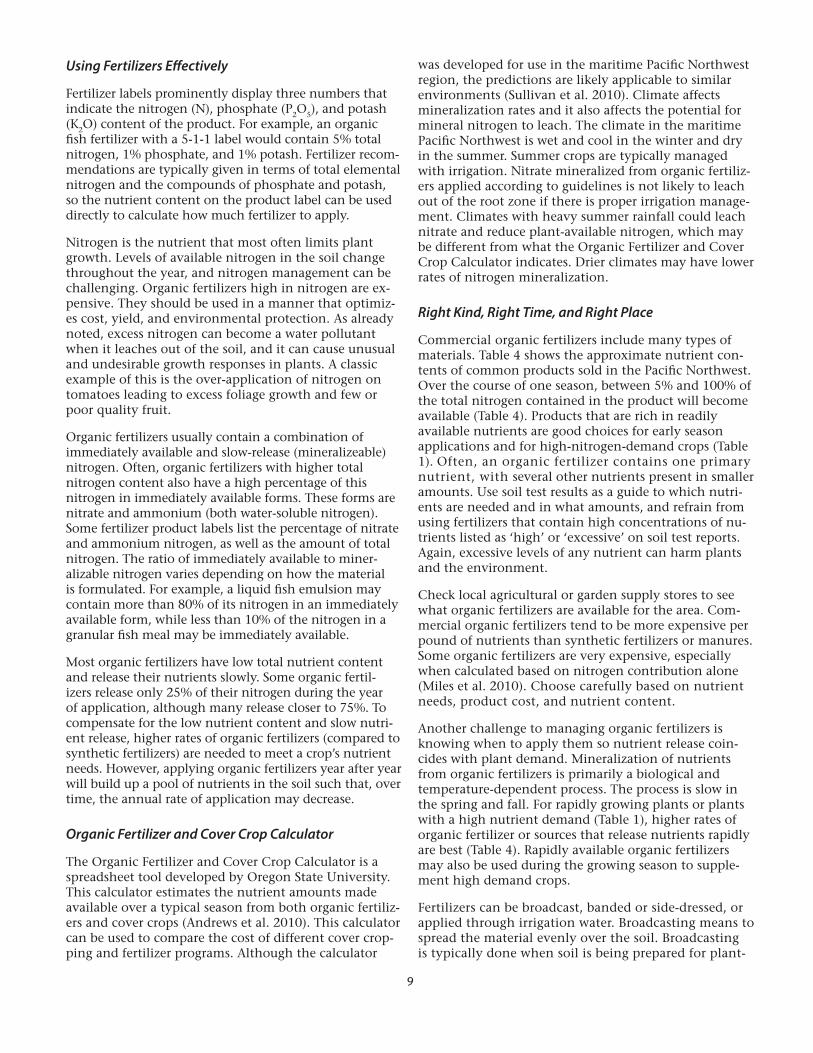
Introduction ......................................................................................................................................................................................................................................................1Soil Fundamentals...........................................................................................................................................................................................................................................1
Soil Tilth .....................................................................................................................................................................................................................................................1Sources of Soil Fertility ........................................................................................................................................................................................................................1Soil pH ........................................................................................................................................................................................................................................................2
Soil Testing and Fertilizer Recommendations .......................................................................................................................................................................................3Soil Testing ...............................................................................................................................................................................................................................................3Fertilizer Recommendations..............................................................................................................................................................................................................3Soil Nutrients in the Environment ...................................................................................................................................................................................................4
Organic Soil Amendments as Nutrient Sources and Soil Builders .................................................................................................................................................4Cover Crops ..............................................................................................................................................................................................................................................4Mulches .....................................................................................................................................................................................................................................................6Compost....................................................................................................................................................................................................................................................6Manure ......................................................................................................................................................................................................................................................7
Organic Fertilizers ...........................................................................................................................................................................................................................................8The Need for Fertilizers ........................................................................................................................................................................................................................8Using Fertilizers Effectively ................................................................................................................................................................................................................9Organic Fertilizer and Cover Crop Calculator ..............................................................................................................................................................................9Right Kind, Right Time, and Right Place ........................................................................................................................................................................................9Determining How Much Organic Fertilizer to Use.................................................................................................................................................................. 11
Summary ......................................................................................................................................................................................................................................................... 15Acknowledgements .................................................................................................................................................................................................................................... 15Further Reading ............................................................................................................................................................................................................................................ 15References ....................................................................................................................................................................................................................................................... 15

1
Soil Fertility in Organic SystemsA Guide for Gardeners and Small Acreage Farmers
Introduction
Plant growth is affected by numerous factors, including climate, pest pressure, and nutrient availability. As plants grow, they rely on their roots to provide structural sup-port, water, and nutrients. The right nutrients are essen-tial for growing healthy, productive plants. Well–man-aged, fertile soils can supply plants with all the nutrients they need. Managing soil fertility requires attention to the source, timing, rate, and placement of nutrient ap-plications. Certified organic growers use only nutrients that are derived naturally because the use of most syn-thetic fertilizers is not allowed. For more information on certified organic production, contact your local organic certifier (see Further Reading).
Many types of fertilizers and soil amendments are available for organic plant production. This publication discusses fertilizer formulations, nutrients and nutrient availability, and application practices for common or-ganic products. While the primary focus of this publica-tion is on building and maintaining fertile soil, protect-ing soil and water resources will also be discussed.
Soil Fundamentals
Soil Tilth
Healthy soils promote seedling emergence and root pen-etration, and they possess good structure or tilth. Some soil properties, such as soil texture (i.e., the proportions of sand, silt, and clay) are difficult to change, while other properties, such as organic matter content and pH, are changed more easily through soil management. Refer to the Home Gardener’s Guide to Soils and Fertilizers, WSU Extension Publication 1971E, for a more in-depth discussion of soil texture, structure, drainage, and pH (Cogger 2005).
Organic matter builds and stabilizes soil structure and can reduce the potential for soil erosion. Organic matter also improves porosity, allowing water to move through the soil. It also holds water that can be used by plants. Organic matter that has been applied in previous years is also a long-term, slow-release source of nitrogen (N), phosphorus (P), sulfur (S), and other important nutrients. Soil microorganisms continually break down organic matter, deriving energy for their own growth, while also increasing the soil nutrient
supply. Older, decayed organic matter, or humus, also affects a soil’s nutrient-holding capacity. Like clay, humus provides particle surfaces that hold nutrients, such as calcium (Ca), magnesium (Mg), and potas-sium (K), in reserve.
Soil organic matter can be increased by adding manure or compost and/or by growing cover crops. A hoe, gar-den fork, shovel, walk-behind tiller, or tractor-mounted tiller are all useful tools for effectively mixing organic matter into the soil (Figure 1). Also, if organic materials are added to the surface of the soil as mulch, earthworms and other soil microorganisms will convert the mulch to useful organic matter.
Sources of Soil Fertility
Nutrients are the primary building blocks for plant growth, and each nutrient fulfills one or more functions in a plant’s growth and development. When a nutrient is missing, plants will display symptoms of stress or defi-ciency. Plants are primarily made up of carbon (C), oxy-gen (O), and hydrogen (H). Since plants acquire these el-ements from carbon dioxide (CO2) and water (H20), they are not considered soil nutrients. Soil nutrients that are in the largest amounts in plants, nitrogen (N), potassium (K), phosphorus (P), calcium (Ca), magnesium (Mg), and sulfur (S), are called macronutrients. Plant micronutri-ents are nutrients found in smaller amounts in plants, but are still essential. These micronutrients include chlorine (Cl), iron (Fe), boron (B), manganese (Mn), zinc (Zn), copper (Cu), molybdenum (Mo), and nickel (Ni).
Figure 1. Incorporating organic matter in a garden bed. Photo by Amy Zarrett.

2
Plants take up nutrients in the form of ions. Ions are atoms or groups of atoms that have either a positive or negative electric charge and are soluble, that is, can dissolve in water. When plant roots absorb water, they absorb nutrients as well. Nutrients in other forms are not directly available to plants but represent reserve sources that may become available to them in the future. Figure 2 illustrates the process by which soil nutrients move from one nutrient source (or pool) to another. A description of the different pools of soil nutrients helps in understand-ing the process by which nutrients are made available to plants from natural sources, as well as how adding organic fertilizers can increase the availability of nutrients.
Soil parent material is defined as rock that is broken down to create soil. Rocks are a collection of minerals that con-tain plant nutrients. Soil fertility levels vary, depending on the type and quality of minerals contained in their parent materials. The mineral nutrients in these parent materials are made available over decades, centuries, or longer through the process of weathering. Mineralize-able nutrients are the type of nutrients released from organic matter. Organic matter provides a slow-release of these nutrients and can have a significant impact on soil fertility within one growing season. Nitrogen, sulfur, phosphorus, and other nutrients are tightly bound to the carbon structures within plant residues, organic soil amendments, and soil organic matter. Organic matter must first be digested by soil organisms before the nutri-ents can become available to the plant.
Adsorbed nutrients are nutrients that are temporarily held on the particle surfaces of clay or humus in the soil. Available nutrients are those nutrients that are dissolved
in soil water. As plants take up available nutrients, the particle surfaces of clay and humus release adsorbed nutrients into the soil water, thereby replacing the nu-trients that have been previously taken up by the plants. Many important nutrients exist in their available forms as positively charged ions, or cations. The soil’s cation exchange capacity (CEC) is the quantity of positively charged ions that the soil can hold. Clay and humus particles have an extensive surface area and together account for a particular soil’s ability to take up and hold onto (adsorb) available nutrients. Sandy soils that contain low levels of clay and organic matter will have low nutrient-holding capacity (low CEC). Organic mat-ter additions can build up the amount of humus in the soil, and this will increase the soil’s nutrient-exchange capacity.
Soil pH
Soils are naturally acidic in high rainfall areas (much of Washington and Oregon west of the Cascades) and range from neutral to alkaline in drier areas (most of Idaho, Washington, and Oregon east of the Cascades). Synthetic fertilizers tend to increase soil acidity over time, and some soils in drier areas have become acidic as a result of using these fertilizers. In soils with a pH level below 6.0, many nutrients are less available to plants. Cation-exchange capacity is also reduced in acidic soils. Applying lime can increase soil pH and reduce prob-lems associated with soil acidity, such as poor phospho-rus availability. The best way to determine if soil needs the addition of lime is to conduct a soil test for both pH and buffer pH. In the absence of a soil test in western
Figure 2. Soil nutrients are supplied by minerals and organic matter. These nutrients are held temporarily on the surface of clay and humus particles and are then taken up by plant roots from the soil solution.

3
Washington and Oregon, add approximately 50 lb of dolomitic limestone per 1000 ft2 per year (approxi-mately 1 ton/acre). Lime is slow to react and, therefore, slow to raise soil pH. Apply lime in the fall, so it has enough time to react before spring crops are planted.
Blueberries, azaleas, and rhododendrons are “acid-lov-ing” plants and require a soil pH ranging from 4.5–5.5 to avoid iron deficiency. In most soils, pH can be lowered over a year or two by amending the soil with elemental sulfur. It is best to apply sulfur to the soil before planting, but sulfur can be added to the root zone of established plants as well. Always get a soil pH test before proceeding with applications of sulfur. Test again after several months to monitor changes in pH. Clay-rich soils will require heavier sulfur applications (apply 40–50 lb per 1000 ft2) than sandier soils (ap-ply 10–20 lb per 1000 ft2). Some soils formed in drier climates contain large amounts of calcium carbonate (CaCO3). It is nearly impossible to lower the pH of these soils to a level that is ideal for acid-loving plants by using elemental sulfur. Refer to Acidifying Soil for Blueberries and Ornamental Plants in the Yard and Gar-den, WSU Extension Publication EC1560E, for more infor-mation on this topic, as well as information on how to estimate clay content and application rates (Hart 2003).
Soil Testing and Fertilizer Recommendations
Soil Testing
Soil test results can reveal nutrient deficiencies or excesses and quantify nutrient-holding capacity, organic matter content, and soil pH. Soil-testing laboratories can also recommend the amount of fertilizer that should be added to the soil based on test results and soil fertility needs.
Test soil every one to three years to monitor soil condi-tions and to allow for adjustments to soil management programs. Yearly soil sampling will provide the most accurate feedback on how management programs are changing soil conditions, especially when addressing nutrient deficiencies or pH imbalances. If an initial soil test indicates there are no soil nutrient deficiencies, biennial or triennial testing will be sufficient for moni-toring soil fertility. However, more frequent testing may increase plant productivity. Refer to Soil Testing: A Guide for Farms with Diverse Vegetable Crops, WSU Extension Publication 050E, for more information on conducting soil tests (Collins 2012) and the Soil Test Interpreta-tion Guide, WSU Extension Publication 1478, for more information on interpreting soil test results (Horneck et al. 2011). Many private laboratories in the Pacific Northwest test soils (Washington State Pest Manage-ment Resource Service 2012). If you have not worked with a soil-testing laboratory before, contact them to make sure they test agricultural or garden soil and can provide fertilizer recommendations for the crop(s) you intend to grow.
Fertilizer Recommendations
Developing an organic fertilizer recommendation involves combining soil test results with knowledge of the crop to be grown. The Pacific Northwest Vegetable Production Guides (Oregon State University 2012) provide a complete list of vegetable crops, along with nutrient recommendations. Rosen and Eliason (2005) have also compiled N, P, and K recommendations for many com-mon vegetables. Soil-testing laboratories can offer rec-ommendations for soil amendment types and quantities. Use production guides to complement laboratory recom-mendations, or pair soil test results with production guides to create a personalized soil amendment plan. Additional crop production publications are available from Washington, Oregon, and Idaho Extension. While farmers can fertilize each crop individually, this is often
What about nutrient ratios?
Soil laboratories run soil analyses that estimate the availability of nutrients to plants. Laboratory fertilizer recommendations are based on decades of field stud-ies that match a certain laboratory result with actual plant uptake of nutrients. If a soil analysis indicates there is an insufficient amount of a nutrient in the soil, then the laboratory will recommend adding fertilizer that will raise the soil concentration of this nutrient. Basing soil recommendations on nutrient availability in the soil is known as the sufficiency level of avail-able nutrients (SLAN) concept (Kopittke and Menzies 2007).
Another approach for developing nutrient recom-mendations involves using the ratios of certain nutrients to each other and to the cation-exchange capacity of the soil (see Sources of Fertility for more on cation-exchange capacity). This approach uses the nutrient balancing or the basic cation saturation ratio (BCSR) method. The nutrients Ca, Mg, K, and Na are called basic cations because they play a role in buffer-ing soil pH. Basic cations are important in soil fertility. In wet environments, these nutrients can leach out of the soil and will need to be replaced using soil amendments. As these nutrients leach out, soil acidity can also become a problem.
Proponents of the nutrient-balancing method assert that there is an “ideal” percentage for each of the basic cations. For example, Ca = 65–85%, Mg = 6–12%, and K = 2–5%. However, there is little evidence that this concept of ideal percentages is valid in practice. Research results indicate that plants can thrive in soils with a wide range of nutrient ratios, as long as suf-ficient levels of nutrients are present.

4
impractical for gardeners who may grow different crops in a single planting bed. Gardeners in this situation can use the information in Table 1, which is grouped by crop based on its nitrogen requirement. For companion planting, fertilize at the rate designated for the crop with the highest nutrient demand. This rate will provide suf-ficient nutrients for both crops.
Soil Nutrients in the Environment
Soil and water are intimately connected in the envi-ronment. Water transports nutrients and agricultural chemicals in solution, as well as sediments, all of which can degrade the water quality of lakes, streams, rivers, and estuaries. Nitrogen and phosphorus are essential elements for plant growth and yield, but when they are present in water at high levels, they become an envi-ronmental hazard, especially in terms of drinking water, aquatic organisms, and aquatic recreation. Water bod-ies that have excess levels of these nutrients experience increased growth of aquatic plants, as well as an increase in other photosynthetic organisms (especially algae and cyanobacteria). Fish and other aquatic organisms suffer because decomposing plants reduce the oxygen availability in water, a process known as eutrophication (Figure 3).
Soil protects our water resources so when water in-filtrates the soil, some of the chemical and sediment
load is deposited or adsorbed into it, thus reducing the amount of these materials. Soil microorganisms and plant roots also help reduce nutrient and chemical loads. However, poorly managed soils can contribute to an excessive nutrient load in rivers and streams. Addi-tionally, soils on sloping terrain are subject to erosion, allowing soil and nutrients to move into nearby streams, lakes, and rivers. Soils in wetter environments can lose nutrients, especially nitrogen, through leaching (loss of water-soluble plant nutrients from the soil due to rain and/or irrigation). Groundwater contamination reduces drinking water and irrigation water quality, and because ground water and surface water are often linked, leach-ing can also increase eutrophication of surface water.
Selecting the right fertilizers requires attention to soil nutrient excesses, as well as nutrient deficiencies. For example, repeatedly using manures or other high phos-phorus organic fertilizers may lead to excessive levels of soil phosphorus. A soil test will indicate whether there is excess phosphorus in the soil. If so, fertility planning should include the reduction or elimination of high phosphorus fertilizers.
Nitrogen can also be lost from the soil system in the form of ammonia or nitrous oxide gas. Not only could these losses be financially unproductive, but nitrous oxide is also a greenhouse gas and contributes to global warming. Ammonia losses occur when ammonia-rich fertilizers, such as fresh cow manure, are left on the soil surface. Turning (incorporating) these materials back into the soil immediately will reduce ammonia loss. Nitrous oxide losses occur when abundant nitrogen is available and soils become waterlogged.
Organic Soil Amendments as Nutrient Sources and Soil Builders
Cover Crops
Cover crops can improve soil quality and/or compete with weeds. When incorporated into the soil as a green manure, cover crops may increase soil organic matter content and soil tilth. In wet climates, such as west-ern Washington or Oregon, winter cover crops reduce nutrient loss by taking up excess nutrients from the
Figure 3. Eutrophication of water bodies can lead to cyanobacteria and algae blooms. Photo by Gene Williams, Snohomish County Surface Water Management.
Table 1. Nitrogen requirement for vegetable crops (lb/1000 ft2)a based on seasonal nitrogen uptake (adapted from Gaskell et al. 2007).
Low: 3 lb/1000 ft2 Med: 4 lb/1000 ft2 High: 5 lb/1000 ft2
Baby greensBeanCucumberRadishSpinachSquash
CarrotCorn, sweetGarlicLettuceMelonOnionPepperTomato
BroccoliCabbageCauliflowerCeleryPotato
aMultiply values by 44 to aproximate the conversion of lb/1000 ft2 to lb/acre.

5
soil before winter rains wash (leach) them away. The amount of N captured depends on the amount of crop growth that occurs before fall rains arrive. Cover crops that grow 10–14 inches high by November can reduce nitrate leaching significantly. Cover crops also protect the soil surface from the impact of falling rain, as well as soil erosion. Legumes, such as vetch or clover, will increase soil nitrogen content (Figure 4 and Figure 5). Legumes form a symbiotic relationship with bacteria in the soil. The bacteria live in nodules on the legume roots and ‘fix’ nitrogen from the atmosphere, meaning they convert inert atmospheric N to plant-available N (Fig-ure 6). The plant provides carbohydrates to the bacteria, and the bacteria provide nitrogen to the plant. This exchange results in nitrogen-rich plant tissue. Deciding which cover crop or crop combination to grow depends on whether the primary goal is to build soil organic matter, supply or capture nitrogen, or suppress weeds (Figure 7). Additionally, some cover crops are best suited for summer and others for winter production. Planning ahead is essential in order to fit cover crops into your crop production plan (Figure 8).
Adding fresh organic matter from cover crops stimu-lates biological activity in the soil and improves
Figure 4. Mowed vetch cover crop left on top of the soil surface for a no-till planting. Photo by Doug Collins.
Figure 5. Common vetch. Photo by Craig Cogger.
Figure 6. Legume nodule (circles) on common vetch. Photo by Doug Collins.
Figure 7. Rye and vetch winter cover crops 45 days after planting. Photo by Doug Collins.
Figure 8. Rye and clover winter cover crop sprouted in a garden bed 7 days after planting. Photo by Doug Collins.

6
soil structure. However if grain cover crops are mature when incorporated, they can immobilize, or “tie-up,” soil nitrogen for up to 6 months. Grain cover crops do not normally release much plant-available nitrogen when decomposing.
In contrast, chopping, tilling, or mixing in a healthy stand of vetch or clover in the spring can supply as much as 2 lb of plant-available N per 1000 ft2, about half of the nitrogen needed for a crop with a medium nitrogen requirement (Sullivan and Andrews 2012). Legume residues decompose relatively quickly in the soil, depending on soil temperature and moisture. The nitrogen contribution from a legume cover crop can be counted on for only one year. However, much of the carbon and nitrogen in the plant tissue will become part of the soil’s organic matter and will improve soil quality and provide a bank of nitrogen in the follow-ing years.
Another cover crop issue to consider is that nitrogen from legume cover crops is usually less expensive than nitrogen from organic fertilizers. For example, plant-
available nitrogen from processed chicken manure, seed meals, and feather meals ranges from $5.00 to $9.00 per pound. On the other hand, legume cover crops can provide plant-available nitrogen for $1.00 to $3.00 per pound, even when seeding and other management costs have been taken into account (Sullivan and Andrews 2012; Andrews and Sullivan 2010). To reap the benefits of planting cover crops every year, make their planting part of any annual vegetable crop rotation plan.
Home Gardener’s Guide to Soils and Fertilizers, WSU Extension Publication EB1971E, provides details on choos-ing and managing cover crops for home gardens. This in-formation could also be very useful to small-scale growers (Cogger 2005). For more information on individual cover crops, refer to the Sustainable Agriculture Network’s hand-book, Managing Cover Crops Profitably (Clark 2007).
Mulches
Winter mulches can provide some of the same benefits as cover crops. Mulches are organic materials that are spread on top of the soil and left on the soil sur-face, rather than being incorporated into the soil. Like winter cover crops, mulches can protect soil from the impact of falling rain and soil erosion and can help to reduce weed pressure. Straw and leaves used as mulch will not likely provide any nitrogen in the short term, but compost spread over the soil surface is more likely to increase soil fertility.
Compost
Compost is an excellent source of organic matter. Composting also closes the recycling loop by turning waste materials into a soil amendment. Compost can be made at home or purchased commercially (Figure 9 and Figure 10). Backyard Composting, WSU Extension Publi-cation EB1784E, provides more detailed information on converting grass clippings, manure, fruit and vegetable wastes, and garden trimmings into stable soil amend-ments (Cogger and Sullivan 2009). Worm composting is Figure 9. Yard-waste compost bin for producing compost on a garden
scale. Photo by Doug Collins.
Figure 10. Compost being produced in a bin system (left) and windrow (right) on farms. Photos by Mark Musick, Tilth Producers of Washington, and Carol Miles.

7
a special type of composting and is effective for recycling food wastes (Angima et al. 2011).
Most of the nutrients in compost are associated with the organic matter and are considered mineralizable (see Sources of Soil Fertility). Organic matter, whether in compost or soil, originates from living plants, animals, and other organisms. Organic matter consists mostly of C but also includes many other nutrients, such as N, P, K, Ca, Mg, Fe, S, and others. The ratio of C to N (C:N) is one factor in determining how quickly N will become available (mineralized) for plant uptake. Compost with a low C:N (for example 10:1) will provide mineral N quickly. More C-rich compost, with a C:N of approxi-mately 20:1 or higher, can actually decrease mineral N availability in the weeks following application. This temporary reduction in mineral N is called immobiliza-tion. It occurs as soil microorganisms decompose the compost and use its C, N, and other minerals for their own growth and population expansion. When there are no longer enough nutrients in the compost or soil to sustain microbial populations, the organisms die and decompose, and the nutrients they contained become available for plant growth.
In addition to C:N, the total N content is also important in planning amendment applications and estimating the amount of nitrogen that will become available over a single season. Most commercial composts have a total ni-trogen content of 1.5% by dry weight and a C:N of 20:1. Over a typical season, approximately 10% of the total nitrogen applied will become available to plants (Andrews et al. 2010). One cubic yard of compost covers about 600 square feet of area to a depth of 1/2 inch. Assuming 1.5% total nitrogen, a C:N of 20:1, and a density of 1000 lb per cubic yard, this amount of compost would provide about 2.5 pounds of N per 1000 ft2 over the first season. Com-post will also increase soil organic matter, release other nutrients, and provide a source of slow-release nitrogen for subsequent years (Hargreaves et al. 2008).
Adding compost once or twice a year helps build a productive and healthy soil. Spring or summer is the best time to apply nitrogen-rich (low C:N) compost
because there is less chance of nutrient loss through leaching or runoff. Gardeners in arid regions can ap-ply compost in the fall, as long as the runoff potential is low. A compost application can also be made in the late summer or fall in humid areas, if an overwinter-ing vegetable or cover crop is planted.
Fall is a good time to apply higher C:N compost because it allows time for the compost to fully de-compose. Nitrogen immobilization over the winter may help reduce N leaching without hindering crop growth. Till or dig compost directly into the soil or apply it as mulch on a planting bed or around the plants themselves. New planting beds can benefit from one to three inches of compost incorporation to im-prove the soil’s physical properties. Smaller amounts are needed to maintain organic matter and soil fertility (i.e., ¼–½ inch). Even if compost is applied annually, small amounts of more readily available fertilizers may be necessary for some early-planted crops (see Fertilizer Recommendations).
Manure
Animal manures vary in nutrient content and nu-trient availability (Table 2). The actual nutrient content of a particular manure could differ substan-tially from the amounts listed in Table 2. The only way to know the nutrient content of manure is to have it tested. Storage time, handling, and exposure to rain will impact the nutrient content and the nutrient mineralization rate. Rain will leach nutrients out of the manure, so storing manure under a roof or plastic cover will retain more nutrients. The type and quan-tity of animal bedding will affect nutrient availability. For example, wood shavings break down more slowly than straw, so nutrients from manure with wood shavings will take longer to mineralize.
It does not take much nutrient-rich manure to meet a crop’s fertility needs. For example, a five-gallon bucket of poultry manure can contain enough ni-trogen to fertilize 100 to 150 square feet of soil and enough phosphorus to fertilize an even larger area,
Table 2. Typical nutrient content of fresh animal manures.a
Type of Manure N P2O5 K2O Moisture Weightlb/cubic yardb,c % lb/cubic yardb
Chicken with litter 23 29 30 30 900
Dairy manure, separated solids 4 1 2 80 1400
Horse 6 4 11 70 1400
Sheep 13 6 25 75 1400
Rabbit 11 7 10 75 1400
Beef 8 6 12 75 1400aData derived from Gale et al. (2006) and Cogger (2004).bThese values are on an as-is basis, meaning wet material with moisture content typical for manure stored under cover. Note that nutrient and moisture values can vary widely, depending on handling, bedding, and age of the manure.cDivide these values by 40 to estimate the nutrients in a 5-gallon bucket of fresh manure.

8
depending on soil test results. Applying excess nutri-ents increases the risk of over fertilizing, which can harm crops and increase nutrient loss through runoff and leaching.
Some manures, such as separated dairy solids and horse manure mixed with bedding materials, con-tain low amounts of available nutrients. You can apply these manures at similar rates to composts (see Compost). It is often advisable to apply low nutrient manures at least 3–4 months before planting (i.e., in the fall) to avoid nitrogen immobilization. Avoid fall applications of any type of manure in areas prone to runoff into surface water. Manures with low nutrient content often have a high C:N (>25:1) ratio and should be considered mainly as a source of organic matter. Experimenting with the amounts of manure applied and observing crop performance allows for fine-tuning application rates. It is better to start conservatively by using a small amount of manure initially and adding more fertilizer later, if the crops appear to be nutrient deficient.
Using manure safely. Fresh manure can contain pathogens (disease-causing organisms) that may affect humans. These pathogens are seldom taken up into plant tissue, but they can adhere to soil located on plant roots, or on the leaves or fruit of low-growing crops. The risk of pathogen contamination is low for vegetables that are thoroughly cooked, as cooking de-stroys pathogens. Raw food, however, carries the risk of pathogens, and the risk is greatest for root crops (car-rots, radishes, etc.) or leaf crops (lettuce, spinach, etc.), where the edible part of the vegetable touches or is very close to the surrounding soil. Table 3 provides examples of high risk and low risk crops.
Table 3. Examples of crops that have high pathogen risk because they are often eaten raw, and crops that have low pathogen risk because they are typically cooked prior to consumption.
High risk Low risk
LettuceSpinachCabbage
CarrotStrawberryCucumber
Winter squashEggplant
AsparagusPotato
Sweet CornCollards
Bacterial pathogens in manure die off naturally after field application, during composting, or during extended storage. However, complete die off may take months. Do not apply fresh manure to high risk crops less than nine months before harvest (United States Food and Drug Administration 2013). In practical terms, this means not using fresh manure on high risk crops (uncooked) during the current production year. For low risk crops (cooked), apply manure two weeks before planting and incorporate it into the soil immediately after application.
If manure has been composted at high temperatures, it can be applied within 45 days of harvest. Some commer-cial organic fertilizers contain heat-dried manure prod-ucts. Heat drying kills pathogens, and these products can be applied and incorporated without waiting periods. If manure is applied in the fall, some of the nutrients may leach and run off during the winter rainy season. To minimize nutrient loss, grow a winter cover crop, which can capture nutrients from fall-applied manure and reduce runoff. Store manure as far away as practical from areas where vegetables are grown and handled. This reduces the potential for crop contamination by runoff, wind drift, flies, or rodents.
Another way to handle manure is to mix it into a com-post pile and then use the finished compost. The high temperatures achieved by well-managed, aerobic com-posting kills many pathogens. Refer to Backyard Com-posting, WSU Extension Publication EB1784, (Cogger and Sullivan 2009) for more information on composting. However, it is difficult to maintain the high tempera-tures required to kill pathogens quickly within a back-yard compost pile, so do not assume that all the patho-gens have been killed. Follow the guidelines provided for applying manure to crops based on whether the crop will be cooked or left raw.
Commercial composted manure. Composted poultry and steer manures are commercially available as bagged products. Nutrient levels and availability in composted steer manure are so low that this manure is considered a source of organic matter only. It is not likely to con-tribute many nutrients in the short term. Recommended application rates found on the labels of these products are effective guidelines for their use.
Organic Fertilizers
The Need for Fertilizers
Growing and harvesting crops removes nutrients from the soil. In wet climates, nutrients, such as nitrogen, calcium, potassium, and magnesium, leach out of the soil. Over time, these and other nutrients are likely to need replenish-ing. Fertilizers replace nutrients that have been removed from the soil, thereby promoting crop growth and quality.
Organic fertilizers come from either biological (plant and animal) or mineral sources. See the Home Gardener’s Guide to Soils and Fertilizers, WSU Extension Publication EB1971E, for a comparison between organic and syn-thetic fertilizers (Cogger 2005). Using organic fertilizers recycles materials that might otherwise be discarded as wastes. Most organic fertilizers contain a variety of nutrients, but the amounts are not necessarily bal-anced according to plant needs or soil availability, so knowing both the nutrient content of the organic fertilizer and the plant requirements are necessary for optimum management.
9
Using Fertilizers Effectively
Fertilizer labels prominently display three numbers that indicate the nitrogen (N), phosphate (P2O5), and potash (K2O) content of the product. For example, an organic fish fertilizer with a 5-1-1 label would contain 5% total nitrogen, 1% phosphate, and 1% potash. Fertilizer recom-mendations are typically given in terms of total elemental nitrogen and the compounds of phosphate and potash, so the nutrient content on the product label can be used directly to calculate how much fertilizer to apply.
Nitrogen is the nutrient that most often limits plant growth. Levels of available nitrogen in the soil change throughout the year, and nitrogen management can be challenging. Organic fertilizers high in nitrogen are ex-pensive. They should be used in a manner that optimiz-es cost, yield, and environmental protection. As already noted, excess nitrogen can become a water pollutant when it leaches out of the soil, and it can cause unusual and undesirable growth responses in plants. A classic example of this is the over-application of nitrogen on tomatoes leading to excess foliage growth and few or poor quality fruit.
Organic fertilizers usually contain a combination of immediately available and slow-release (mineralizeable) nitrogen. Often, organic fertilizers with higher total nitrogen content also have a high percentage of this nitrogen in immediately available forms. These forms are nitrate and ammonium (both water-soluble nitrogen). Some fertilizer product labels list the percentage of nitrate and ammonium nitrogen, as well as the amount of total nitrogen. The ratio of immediately available to miner-alizable nitrogen varies depending on how the material is formulated. For example, a liquid fish emulsion may contain more than 80% of its nitrogen in an immediately available form, while less than 10% of the nitrogen in a granular fish meal may be immediately available.
Most organic fertilizers have low total nutrient content and release their nutrients slowly. Some organic fertil-izers release only 25% of their nitrogen during the year of application, although many release closer to 75%. To compensate for the low nutrient content and slow nutri-ent release, higher rates of organic fertilizers (compared to synthetic fertilizers) are needed to meet a crop’s nutrient needs. However, applying organic fertilizers year after year will build up a pool of nutrients in the soil such that, over time, the annual rate of application may decrease.
Organic Fertilizer and Cover Crop Calculator
The Organic Fertilizer and Cover Crop Calculator is a spreadsheet tool developed by Oregon State University. This calculator estimates the nutrient amounts made available over a typical season from both organic fertiliz-ers and cover crops (Andrews et al. 2010). This calculator can be used to compare the cost of different cover crop-ping and fertilizer programs. Although the calculator
was developed for use in the maritime Pacific Northwest region, the predictions are likely applicable to similar environments (Sullivan et al. 2010). Climate affects mineralization rates and it also affects the potential for mineral nitrogen to leach. The climate in the maritime Pacific Northwest is wet and cool in the winter and dry in the summer. Summer crops are typically managed with irrigation. Nitrate mineralized from organic fertiliz-ers applied according to guidelines is not likely to leach out of the root zone if there is proper irrigation manage-ment. Climates with heavy summer rainfall could leach nitrate and reduce plant-available nitrogen, which may be different from what the Organic Fertilizer and Cover Crop Calculator indicates. Drier climates may have lower rates of nitrogen mineralization.
Right Kind, Right Time, and Right Place
Commercial organic fertilizers include many types of materials. Table 4 shows the approximate nutrient con-tents of common products sold in the Pacific Northwest. Over the course of one season, between 5% and 100% of the total nitrogen contained in the product will become available (Table 4). Products that are rich in readily available nutrients are good choices for early season applications and for high-nitrogen-demand crops (Table 1). Often, an organic fertilizer contains one primary nutrient, with several other nutrients present in smaller amounts. Use soil test results as a guide to which nutri-ents are needed and in what amounts, and refrain from using fertilizers that contain high concentrations of nu-trients listed as ‘high’ or ‘excessive’ on soil test reports. Again, excessive levels of any nutrient can harm plants and the environment.
Check local agricultural or garden supply stores to see what organic fertilizers are available for the area. Com-mercial organic fertilizers tend to be more expensive per pound of nutrients than synthetic fertilizers or manures. Some organic fertilizers are very expensive, especially when calculated based on nitrogen contribution alone (Miles et al. 2010). Choose carefully based on nutrient needs, product cost, and nutrient content.
Another challenge to managing organic fertilizers is knowing when to apply them so nutrient release coin-cides with plant demand. Mineralization of nutrients from organic fertilizers is primarily a biological and temperature-dependent process. The process is slow in the spring and fall. For rapidly growing plants or plants with a high nutrient demand (Table 1), higher rates of organic fertilizer or sources that release nutrients rapidly are best (Table 4). Rapidly available organic fertilizers may also be used during the growing season to supple-ment high demand crops.
Fertilizers can be broadcast, banded or side-dressed, or applied through irrigation water. Broadcasting means to spread the material evenly over the soil. Broadcasting is typically done when soil is being prepared for plant-

10
ing and the fertilizer can be incorporated with tillage (Figure 11). Compost and manure are most commonly applied by broadcasting (Figure 12). Banding refers to placing the fertilizer in a narrow furrow adjacent to the plant row at the time of planting. Side-dressing refers to the banding process when it is performed during the growing season (Figure 13). Both banding and side-dressing place a concentrated fertilizer close to actively growing plant roots. Both these processes are efficient methods of nutrient application, which can reduce nu-trient requirements and opportunities for nutrient loss.
Side-dressing requires precision placement of fertilizer relative to plants, to avoid damage to roots and crowns of actively growing plants. Farm implements used to side-dress conventional fertilizers are suitable for placing most pellet or granulated organic fertilizers in a band. Gardeners can band fertilizer by simply opening a fur-row by hand in the appropriate location and distributing the calculated amount of fertilizer into the furrow.
Fertigation (applying soluble fertilizer through irriga-tion water) uses water as the nutrient carrier (Figure 14).
Figure 11. Spreading organic fertilizer on a bed. Photo by Carol Miles. Figure 12. Spreading compost in a farm field. Photo by Carol Miles.
Table 4. Percent of nitrogen, phosphate, and potash content typical of commonly used organic fertilizers.
Material % Total nitrogen% of nitrogen available
in one seasona % Total P2O5 % Total K2O
Nitrogen Sources
Alfalfa Meal 2 25 0.5 2
Bat Guano 10 75 3 1
Feather Mealb 12–13 75 0 0
Blood Mealb 12–15 75 1 1
Cottonseed 6–7 75 2 1
Fish Emulsionb 3–5 100 1 1
Fish Mealb 10 75 4 0
Phosphate Sources
Bone Meal 1–4 30 12–2425–30
(only 2-3% available)
0
Rock
Phosphatec 0 0 0
Potasium Sources
Greensand 0 0 0 3–7
Kelp Meal 1 5 0.1 2–5aAndrews et al. 2010.bThese materials contain a substantial amount of quickly available nutrients that plants can use early in the season.cVery low availability. Useful only in acidic soils (pH 6.0 or below).

11
Fertigation delivers nutrients mainly to the plant roots, though direct absorption of small amounts of nutri-ents can occur through the foliage. Fertigation can be an efficient application method since nutrients can be metered out over the growing season and rates adjusted according to plant growth. One obvious requirement for fertigation is a soluble source of organic nutrients.
Determining How Much Fertilizer to Use
Estimating how much organic fertilizer to use can be a challenge. Crop needs should guide fertilizer applica-tions, so different application rates are often required for different crops or crop groups (Table 1). Soil test data should also be used to guide decisions about soil nutrients other than nitrogen. Address acidic soils and calcium deficiencies through liming (see Soil pH). Select the right fertilizers for other deficiencies (for example, bone meal for phosphorus deficiency).
Figure 13. Side-dressing granular organic fertilizer. Photo by Doug Collins.
Figure 14. Organic fertilizer pre-mixed in buckets and injected into drip irrigation lines. Photo by Jonathan Roozen.
Step-by-step guide to determining an organic nitrogen fertilizer rate.a
Steps Information sourceGeneral crop nitrogen recommendation University nutrient management guides
êCover crop nitrogen contribution OSU Organic Fertilizer and Cover Crop Calculator
êAdditional soil organic matter nitrogen contributionb Estimate from previous soil-building practices
êSite and crop-specific nitrogen recommendation Growers calculation (See Scenarios 1a and 1b)
êFertilizer nitrogen analysis, N availability Fertilizer label, OSU Organic Fertilizer and Cover Crop Calculator
êFertilizer nitrogen application rates Grower’s calculation (See Scenarios 2 and 3)
êAdjust nitrogen rates based on monitoring Observations of crop performancec
aBasic soil tests are not helpful for determining a nitrogen fertilizer rate. For pH adjustment and P, K, and other nutrients, soil tests are critical.bGeneral crop fertilizer recommendations provide some credit for N mineralized from organic matter. Historical use of cover crops and organic amendments can provide significantly more N than fertilizer recommendations account for.cFarmers should also perform fall soil nitrate testing as part of a nutrient-monitoring program (Collins 2012).

12
Because plants require more nitrogen than any other nu-trient, nitrogen management often drives fertility plans and expenditures. (See sidebar for a step-by-step guide to formulating a nitrogen recommendation.) Examples of crops that have a high demand for nitrogen (5 lb/1000 ft2 or > 200 lb/acre) include broccoli, cabbage, cauliflow-er, and potato (Table 1). Depending on past soil-building practices, organic matter could supply a large portion of this nitrogen. For example, a recent study of organic potato farms in the Pacific Northwest found that more than 2 lb/1000 ft2 of nitrogen were made available by organic matter during a growing season (Sullivan and Andrews 2012). This source of nutrients comes from soil organic matter that has accumulated over years of cover cropping and adding manure and compost. The remain-ing nitrogen needs to be supplied through cover crops, manure, compost, or organic fertilizers in the current growing season.
Most soil-testing laboratories and university publications provide nutrient recommendations in pounds of actual nutrient per acre (lb/A) or pounds per 1000 ft2, depend-ing on whether the soil sample is from a farm or home
garden. Nutrient recommendations are in lb/A because different fertilizer materials have different nutrient contents, which will affect the fertilizer rate required to meet a particular nutrient recommendation.
Calculating Nutrient Need. It is a challenge to convert nutrient recommendations into fertilizer rates. The following information provides the steps required to make these calculations for various crop scenarios.
Scenario 1a involves determining a nitrogen recom-mendation in pounds N per 1000 ft2 for a heavy-nitro-gen-feeding crop, such as broccoli (Table 1). The soil has been amended over previous years with compost and manure. A vetch cover crop grown the previous year has been incorporated back into the soil, along with dairy compost. The soil organic matter, vetch cover crop, and recent compost amendment will all supply nitrogen through mineralization, so these contributions are estimated and subtracted from the plant’s nitrogen requirement to arrive at a nitrogen rec-ommendation. Scenario 1b shows the same calculation on a lb/acre basis.
Scenario 1a. Calculating the amount of nitrogen (N) fertilizer needed (lb/1000 ft2)a for broccoli when taking into account soil reserves and plant-based contributions.
aScenario 1b shows the same calculation on a lb/acre basis.bOrganically managed soils will typically yield between 1 to 4.5 lb N/1000 ft2. Assumes that this soil is in the low end of this range due to moderate application of organic materials in recent years.cLegume cover crops, such as vetch, with 3.5% N content can provide 1.7 lb of plant-available nitrogen per 100 lb of dry cover crop biomass in the first season after incorporation. This amount of biomass over an area of 1000 ft2 would be a dense stand of vetch with good ground cover.dAssumes a 350 lb/1000 ft2 application of dairy manure compost with 1.5% N (about 1/3 cubic yards and less than 1/8-inch cover-age).
Nitrogenneeded
= [Cropdemand
(lb N/1000 ft2)− ]N from soil
organic matter(lb N/1000 ft2)
+N from covercrop (lb N /
1000 ft2)+
N fromamendment
(lb N/1000 ft2)
Nitrogenneeded
= [− ]+ +
Nitrogenneeded
= [− ]Nitrogenneeded
=
5.2
5.2
1.5 b 1.7 c 0.5 d
3.7 lb N/1000 ft2
1.5 lb N/1000 ft2

13
Scenario 1b. Calculating the amount of nitrogen (N) fertilizer needed (lb/A) for a vegetable crop when taking into account soil reserves and plant-based contributions.
aOrganically managed soils will typically yield between 50 to 200 lb N/A. We assume our soils are at the low end of this range due to moderate application of organic materials in recent years.bLegume cover crops, such as vetch, with 3.5% N content can provide 35 lb of plant-available nitrogen per ton of dry cover crop biomass in the first season after incorporation. Two tons/acre would be a dense stand of vetch with good ground cover.cAssumes a 15,000 lb/A application of dairy manure compost with 1.5% N (about 15 cubic yards and less than 1/8-inch coverage).
Fertilizer Nneeded
= [Cropdemand(lb N/A)
− ]N from soilorganic matter
(lb N/A)+
N from covercrop
(lb N/A)+
N fromamendment
(lb N/A)
Fertilizer Nneeded
= [− ]+ +
Fertilizer Nneeded
= [− ]Fertilizer N
needed=
225
225
70 a 70 b 20 c
160
65 lb N/A
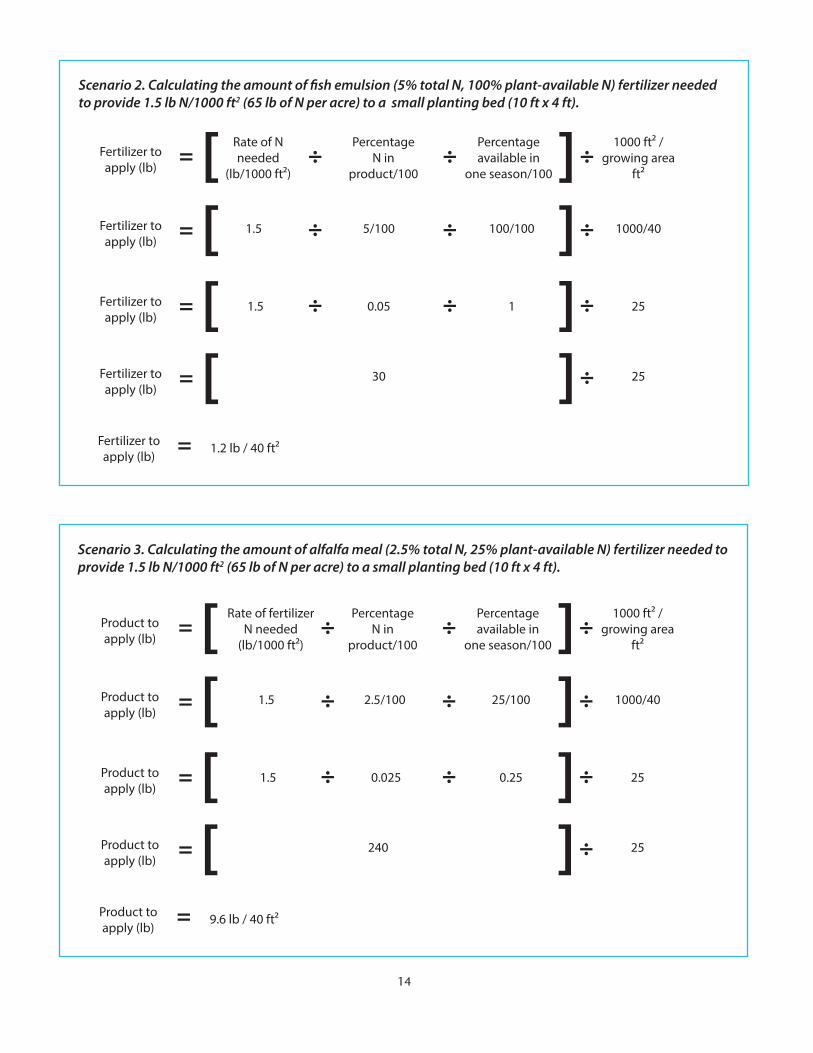
Calculating Fertilizer Rates. After determining the nutri-ent need, calculate the fertilizer application rate. First, determine the total area to fertilize by multiplying the length of the area by its width. If the area is not rectangu-lar, estimate the area as closely as possible. Next, deter-mine how much fertilizer product to apply. For organic fertilizers, consider both the percentage of total N in the product and the fraction that will be available in one season (Table 4) (Andrews et al. 2010). Organic fertilizers, such as fish emulsions, have large proportions of avail-able nutrients and provide most of their nitrogen in one season (Table 4). For these products, base application rates on the assumption that all of the nutrients will be avail-able the first year. Scenario 2 is for fish emulsion (5% N) applied to a 10 ft long x 4 ft wide planting bed at a rate of 1.5 lb N/1000 ft2 (65 lb of N per acre).
Many organic fertilizers have low nutrient availability in the year they are applied. Apply these fertilizers based on only the amount of nutrients that will be available in the current year. For example, alfalfa meal is 2.5% ni-trogen on average, but only 25% of it, or 0.5% nitrogen, will be available in the year of application. Keep in mind that some of the remaining nitrogen will accumulate in the soil as organic matter and will provide nitrogen in following years. Scenario 3 is for alfalfa meal applied to the same 10 ft long x 4 ft wide planting bed at a rate of
1.5 lb/1000 ft2 (65 lb of N per acre) (the same amount that was used in Scenario 3).
Phosphorus and other nutrients. Manures and some other organic amendments contain large amounts of phosphorus. Applying these amendments to meet a crop’s nitrogen requirements provides more phosphorus than the crop needs. Excess phosphorus often accumu-lates in soils with a history of organic fertilization. This accumulation occurs because organically managed farms and gardens often rely on phosphorus-rich manures for nutrients. Excess soil phosphorus can pose a threat when there is a risk of runoff or soil erosion into lakes and streams or into storm drains leading to lakes and streams.
Organic fertility approaches can be combined to meet specific fertility needs. If a soil test indicates the presence of high soil phosphorus, for example, then a fertility plan should be modified to reduce or eliminate high phosphorus fertilizers. Modifications could include the use of legume cover crops and/or nitrogen-rich fertil-izers, such as blood meal. Soils under organic manage-ment that have accumulated high levels of phosphorus often have high levels of organic matter as well. These soils likely need lower amounts of all nutrients than soils without a history of organic management.
14
Scenario 3. Calculating the amount of alfalfa meal (2.5% total N, 25% plant-available N) fertilizer needed to provide 1.5 lb N/1000 ft2 (65 lb of N per acre) to a small planting bed (10 ft x 4 ft).
Product toapply (lb)
= [ Rate of fertilizerN needed
(lb/1000 ft2)÷ ]Percentage
N inproduct/100
÷Percentageavailable in
one season/100÷
1000 ft2 /growing area
ft2
Product toapply (lb)
=
Product toapply (lb)
=
Product toapply (lb)
= 9.6 lb / 40 ft2
Product toapply (lb)
=
[ 1.5 ÷ ]÷ ÷
[ ÷ ]÷ ÷
[ ]÷
2.5/100 25/100 1000/40
1.5 0.025 0.25 25
240 25
Scenario 2. Calculating the amount of fish emulsion (5% total N, 100% plant-available N) fertilizer needed to provide 1.5 lb N/1000 ft2 (65 lb of N per acre) to a small planting bed (10 ft x 4 ft).
Fertilizer toapply (lb)
= [ Rate of Nneeded
(lb/1000 ft2)÷ ]Percentage
N inproduct/100
÷Percentageavailable in
one season/100÷
1000 ft2 /growing area
ft2
Fertilizer toapply (lb)
=
Fertilizer toapply (lb)
=
Fertilizer toapply (lb)
= 1.2 lb / 40 ft2
Fertilizer toapply (lb)
=
[ 1.5 ÷ ]÷ ÷
[ ÷ ]÷ ÷
[ ]÷
5/100 100/100 1000/40
1.5 0.05 1 25
30 25

15
Summary
Managing soil fertility for crop production can be chal-lenging. Soil management requires knowledge of crop nutrient requirements, soil nutrient residual levels, and the types and characteristics of organic fertilizers that will be used. Nutrient applications play a critical role in plant production and also affect the environment. Nutri-ent sources include organic amendments, cover crops, and fertilizers. Depending on the nutrient source, a por-tion of the nutrients will be made available to plants in the first growing season, and a portion will become part of the soil organic matter. Thus, the soil organic matter functions as a reserve of slow-release nutrients that can provide some nutrients throughout the course of a grow-ing season, as well as in years to come.
Fertilizer requirements are often calculated based on the crop’s response to nitrogen fertilizer. To determine how much organic fertilizer to apply, first find the crop’s general fertilizer requirement, then estimate the nitrogen contribution from soil organic matter, cover crops, and recent amendments and subtract these values from the crop’s fertilizer requirement. Organic fertilizers will all supply some nitrogen in the season they are applied, but the amount of nitrogen mineralized in one season can range from 5% to 100%. To make the most efficient fertil-izer application, it is important to account for the season-al mineralization rate of different organic fertilizers.
Acknowledgements
Nick Andrews, OSU North Willamette Research and Extension Center, Amber Moore, UI Twin Falls Research and Extension Center, and three anonymous reviewers provided technical review. Illustration by Andrew Mack.
Further Reading
Extension Publications websites provide a list of publica-tions helpful to gardeners and farmers: Idaho http://www.cals.uidaho.edu/edComm/catalog.asp Oregon http://extension.oregonstate.edu/catalog/ Washington https://pubs.wsu.edu/
Organic Certifiers in the Pacific Northwest Idaho State Department of Agriculture Phone: 208-332-8675, E-mail: [email protected] Website: http://www.agri.idaho.gov/Categories/PlantsInsects/Organic/indexOrganicHome.php
Oregon Department of Agriculture Phone: 503-986-4620 Website: www.oregon.gov/ODA/CID
Oregon Tilth Certified Organic Phone: 503-378-0690, E-mail: [email protected] Website: www.tilth.org
Stellar Certification Services, Inc. Phone: 541-929-7148, E-mail: [email protected] Website: http://demeter-usa.org/?page_id=5
Washington State Department of Agriculture Phone: 360-902-1805, E-mail: [email protected] Website: http://agr.wa.gov/FoodAnimal?Organic/default.htm
References
Andrews, N., D. Sullivan, J. Julian, and K. Pool. 2010. OSU Organic Fertilizer and Cover Crop Calculator. Oregon State University Extension. http://smallfarms.oregonstate.edu/calculator.
Andrews, N., and D.M. Sullivan. 2010. Estimating Plant-Available Nitrogen Contribution from Cover Crops webinar. eOrganic and eXtension. http://www.extension.org/pages/26919/estimating-plant-available-nitrogen-contribution-from-cover-crops-webinar.
Angima, S., M. Noack, and S. Noack. 2011. Composting with Worms. Oregon State University Extension. http://ir.library.oregonstate.edu/xmlui/bitstream/handle/1957/23949/em9034.pdf.
Clark, A., ed. 2007. Managing Cover Crops Profitably, 3rd edition. Beltsville: Sustainable Agriculture Network. http://www.sare.org/publications/covercrops/covercrops.pdf.
Cogger, C.G., and D.M. Sullivan. 2009. Backyard Composting. Washington State University Extension Publication EB1784. http://cru.cahe.wsu.edu/CEPublications/eb1784e/eb1784e.pdf.
Cogger, C.G. 2005. Home Gardener’s Guide to Soils and Fertilizers. Washington State University Extension Publication EB1971E. http://cru.cahe.wsu.edu/CEPublications/eb1971e/eb1971e.pdf.
Cogger, C.G. 2004. Manure on Your Farm: Asset or Liability? LPES Small Farms Series. Ames: Midwest Plan Service.
Collins, D.P. 2012. Soil Testing: A Guide for Farms with Diverse Vegetable Crops. Washington State University Extension Publication EM050E. http://cru.cahe.wsu.edu/CEPublications/EM050E/EM050E.pdf.
Gale, E.S., D.M. Sullivan, C.G. Cogger, A.I. Bary, D.D. Hemphill, and E.A. Myhre. 2006. Estimating Plant Available Nitrogen Release from Manures, Composts, and Specialty Products. Journal of Environmental Quality 35: 2321–2332.
Gaskell, M., R. Smith, J. Mitchell, S.T. Koike, C. Fouche, T. Hartz, W. Horwath, and L. Jackson. 2007. Soil Fertility Management for Organic Crops. University of

16
California Division of Agriculture and Natural Resources Publication 7249. http://anrcatalog.ucdavis.edu/pdf/7249.pdf.
Hargreaves, J.C., M.S. Adl, and P.R. Warman. 2008. A Review of the Use of Composted Municipal Solid Waste in Agriculture. Agriculture, Ecosystems, and Environment 123: 1–14.
Hart, J., D. Horneck, R. Stevens, N. Bell, and C. Cogger. 2003. Acidifying Soil for Blueberries and Ornamental Plants in the Yard and Garden. Oregon State University Extension Publication EC1560-E. http://extension.oregonstate.edu/catalog/pdf/ec/ec1560-e.pdf.
Horneck, D.A., D.M. Sullivan, J.S. Owen, and J.M. Hart. 2011. Soil Test Interpretation Guide. Oregon State University Extension EC 1478. http://ir.library.oregonstate.edu/xmlui/bitstream/handle/1957/22023/ec1478.pdf.
Kopittke, P.M., and N.W. Menzies. 2007. A Review of the Use of the Basic Cation Saturation Ratio and the “Ideal” Soil. Soil Science Society of America Journal 71: 259–265.
Miles, C., J. Roozen, E. Maynard, and T. Coolong. 2010. Fertigation in Organic Vegetable Production Systems. eOrganic and eXtension. http://www.extension.org/pages/29712/fertigation-in-organic-vegetable-production-systems.
Oregon State University. Vegetable Production Guides. http://horticulture.oregonstate.edu/content/vegetable-production-guides.
Rosen, C.J., and R. Eliason. 2005. Nutrient Management for Commercial Fruit and Vegetable Crops in Minnesota. University of Minnesota Extension Service BU-05886. http://www.extension.umn.edu/distribution/cropsystems/components/5886_full.pdf.
Sullivan, D.M., N. Andrews, J.M. Luna, and J.P.G. McQueen. 2010. Estimating N Contribution from Organic Fertilizers and Cover Crop Residues using Online Calculators, pp. 83–86. In 2010 19th World Congress of Soil Science, Soil Solutions for a Changing World, August 2010, Brisbane, Australia. http://www.iuss.org/19th%20WCSS/Symposium/pdf/D3.2.pdf.
Sullivan, D.M., and N.D. Andrews. 2012. Estimating Plant-Available Nitrogen Release from Winter Cover Crops. Oregon State University Extension PNW636. http://ir.library.oregonstate.edu/xmlui/bitstream/handle/1957/34720/pnw636.pdf.
United States Department of Agriculture. 2000. 7 CFR Part 205, National Organic Program; Final Rule. Federal Register 65: 80548–80596.
United States Department of Health and Human Services. Food and Drug Administration. 2013. 21 CFR Part 112.56; Proposed Rule. Federal Register 78: 3637.
WSU Clark County Extension, Garden Mastery Tips, January/February 2008. http://clark.wsu.edu/volunteer/mg/gm_tips/Tools.html.
Washington State Pest Management Resource Service. Analytical Laboratories and Consultants Serving Agriculture in the Pacific Northwest. Washington State University Extension. http://www.puyallup.wsu.edu/analyticallabs/.

By Doug Collins, Small Farms Extension Specialist, Center for Sustaining Agriculture and Natural Resources, Puyallup, WA; Carol Miles, Vegetable Extension Specialist, Washington State University Department of Horticulture, Mount Vernon, WA; Craig Cogger, Soil Scientist and Extension Specialist, Washington State University Department of Crop and Soil Sciences, Puyallup; and Rich Koenig, Soil Scientist and Director of Extension, Washington State University, Pullman.
Pacific Northwest Extension publications are produced cooperatively by the three Pacific Northwest land-grant universities: Washington State University, Oregon State University, and the University of Idaho. Similar crops, climate, and topography create a natural geographic unit that crosses state lines. Since 1949, the PNW program has published more than 600 titles, preventing duplication of effort, broaden-ing the availability of faculty specialists, and substantially reducing costs for the participating states.
Pacific Northwest Extension publications contain material written and produced for public distribution. You may reprint written material, provided you do not use it to endorse a commercial product. Please reference by title and credit Pacific Northwest Extension publications.
Copyright 2013 Washington State University.
Order information:Washington State University Extensionhttp://pubs.wsu.eduFax 509-335-3006Toll-free phone [email protected]
Oregon State University Extension Servicehttp://extension.oregonstate.edu/catalog Fax 541-737-0817Toll-free phone [email protected]
University of Idaho Extensionhttp://www.cals.uidaho.edu/edComm/cata-log.aspFax 208-885-4648Phone [email protected]
Published and distributed in furtherance of the Acts of Congress of May 8 and June 30, 1914, by Washington State University Extension, Oregon State University Extension Service, University of Idaho Cooperative Extension System, and the U.S. Department of Agriculture cooperating. WSU Extension programs, activities, materials, and policies comply with federal and state laws and regulations on nondis-crimination regarding race, sex, religion, age, color, creed, and national or ethnic origin; physical, mental, or sensory disability; marital status or sexual orientation; and status as a Vietnam-era or disabled veteran. Washington State University Extension, The Oregon State University Extension Service, and University of Idaho Extension are Equal Opportunity Employers. Evidence of noncompliance may be reported through your local Extension office. Trade names have been used to simplify information; no endorsement is intended. Published June 2013.
PNW646